Effects of Submaximal Performances on Critical Speed and Power: Uses of an Arbitrary-Unit Method with Different Protocols


Physiology at Faculty of Medicine, University Paris XIII, 93000 Bobigny, France
Sports 2019, 7(6), 136; https://doi.org/10.3390/sports7060136
Submission received: 25 April 2019
/
Revised: 21 May 2019
/
Accepted: 30 May 2019
/
Published: 31 May 2019
Abstract
:The effects of submaximal performances on critical speed (SCrit) and critical power (PCrit) were studied in 3 protocols: a constant-speed protocol (protocol 1), a constant-time protocol (protocol 2) and a constant-distance protocol (protocol 3). The effects of submaximal performances on SCrit and PCrit were studied with the results of two theoretical maximal exercises multiplied by coefficients lower or equal to 1 (from 0.8 to 1 for protocol 1; from 0.95 to 1 for protocols 2 and 3): coefficient C1 for the shortest exercises and C2 for the longest exercises. Arbitrary units were used for exhaustion times (tlim), speeds (or power-output in cycling) and distances (or work in cycling). The submaximal-performance effects on SCrit and PCrit were computed from two ranges of tlim (1–4 and 1–7). These effects have been compared for a low-endurance athlete (exponent = 0.8 in the power-law model of Kennelly) and a high-endurance athlete (exponent = 0.95). Unexpectedly, the effects of submaximal performances on SCrit and PCrit are lower in protocol 1. For the 3 protocols, the effects of submaximal performances on SCrit, and PCrit, are low in many cases and are lower when the range of tlim is longer. The results of the present theoretical study confirm the possibility of the computation of SCrit and PCrit from several submaximal exercises performed in the same session.
1. Introduction
1.1. Empirical Model of Running and Cycling Performances
Several empirical and descriptive models of performance have been proposed: the power-law model by Kennelly [1], asymptotic hyperbolic models by Hill and Scherrer [2,3], and, more recently, the logarithmic model of Péronnet and Thibault [4] and the 3-parameter asymptotic models by Hopkins [5] and Morton [6]. These empirical models are often used to estimate (i) the improvement in performance (ii) the future performances and running speeds over given distances (iii) the endurance capability, i.e., “the ability to sustain a high fractional utilization of maximal oxygen uptake for a prolonged period of time” [4].
In 1954, Scherrer et al. proposed a linear relationship [3] between the exhaustion time (tlim) of a local exercise (flexions or extensions of the elbow or the knee) performed at different constant power outputs (P) and the total amount of work performed at exhaustion (Wlim) for tlim ranging between 3 and 30 min:
Wlim = a + btlim = Ptlim
Consequently, the relationship between P and tlim is hyperbolic:
where b is a critical power (PCrit).
a = Ptlim − btlim = (P − b) tlim
tlim = a/(P − b) = a/(P − PCrit)
In 1966, Ettema applied the critical-power concept to world records in running, swimming, cycling, and skating exercises [7] and proposed a linear relationship between the distances (Dlim) and world records (tlim) from 1500 to 10000 m:
Dlim = a + btlim
It was assumed that the energy cost of running was almost independent of speed (1 kcal.kg−1.km−1) under 22 km.h−1 [8]. Consequently, Dlim and parameter “a” were equivalent to amounts of energy. Therefore, parameter “a” has been interpreted as equivalent to an energy store. Thereafter, parameter “a” was considered as an estimation of maximal Anaerobic Distance Capacity (ADC expressed in metres) for running exercises [7,9]. Slope b was considered as a critical velocity (SCrit).
Dlim = ADC + SCrit tlim
In 1981, the linear Wlim-tlim relationship was adapted to exercises on a stationary cycle ergometer and it was demonstrated that slope b of the Wlim-tlim relationship was correlated with the ventilatory threshold [10]. Therefore, slope b was proposed as an index of general endurance (PCrit). Thereafter, Whipp et al. [11] proposed another linear model with SCrit (or PCrit) and a:
where S is running speed.
S = SCrit 1/t + a (1/tlim) Running
P = PCrit 1/t + a (1/tlim) Cycling
Actually, the hyperbolic model is often used as it is the simplest model that corresponds to a linear relationship between exhaustion time (tlim) and distance (Dlim) in running and swimming or total work (Wlim) in cycling. For many exercise physiologists, SCrit and PCrit are considered as fatigue thresholds [12]. Moreover, the values of SCrit and PCrit become endurance indices when they are normalized to Maximal Aerobic Speed (SCrit /MAS) or Maximal Aerobic Power (PCrit /MAP). Parameter “a” is also called ADC (Anaerobic Distance Capacity) or ARC (Anaerobic Running Capacity) in running [7,9] and AWC (Anaerobic Work Capacity) in cycling [13,14].
However, the relationship between tlim and Dlim is not perfectly linear as suggested by the power-law model by Kennelly:
where exponent g can be considered as an endurance index and parameter k is equal to the maximal speed corresponding to the unit of tlim [15].
Dlim = k tlimg
S = Dlim/tlim = (k tlimg)/tlim = k tlimg−1
1.2. Variability of the Performances of Exhausting Exercises.
Three protocols are used for the estimation of the performances of exhausting exercises:
(1) to run as long as possible at a constant speed or to cycle as long as possible at a constant power output. This constant-speed protocol is often called Time-to-Exhaustion;
(2) to run as much distance (or to produce as much work on a cycle-ergometer) as they can within a given time period (constant-time protocol);
(3) to run a set distance (or to produce a set work on a cycle-ergometer) as fast as possible (constant-distance protocol).
The first protocol (Time-to-Exhaustion) is used for the estimation of SCrit on a treadmill or the estimation of PCrit on a cycle ergometer. The second protocol was used for prediction of one-hour running performance [16]. The third protocol was used in the studies on the modelling of running performances that were based on the world records [17,18,19,20] or performances in the Olympic games [21] or individual performance of elite endurance runners [15]. The reliability of performances in protocol 1 (constant speed) is low, whereas the reliability of the other protocols is higher [22,23,24,25,26,27]. For example in swimming, the Coefficient of Variation of constant-speed protocol (CV = 6.46 ± 6.24%) was significantly less reliable (p < 0.001) than those of constant-time protocol (CV = 0.63 ± 0.54%) and constant-distance protocol (CV = 0.56 ± 0.60%) [27].
In a recent study [28] critical speeds measured on a treadmill with a constant-speed protocol were compared with a Single-Visit Field Test of Critical Speed. The constant-speed runs to exhaustion on treadmill were performed with 3 running speeds during 3 separate sessions. Two single-visit field tests on separate days consisted to the measurement of maximal performances over 3600, 2400, and 1200 m (constant-distance protocol) with 30-min or 60-min recovery. Unexpectedly, there was no difference in SCrit measured with the treadmill and 30-min- and 60-min recovery field tests although the reliability of protocol 1 is lower than that of protocol 3. Thereafter, a Single-Visit Field Test of Critical Speed was tested in trained and untrained runners [29]: the reliability of SCrit was better in the trained runners.
1.3. Purpose of the Present Study
In few studies, the values of SCrit and PCrit are computed from the best maximal performances of several exhausting exercises of the same subjects [15] or world records [17,18,19,20] or performances in the Olympic games [21]. In most studies, it is not obvious that the data used in the computation of SCrit and PCrit are maximal. For example, the performance variability is important in protocol 1 that is mainly used in laboratories. Moreover, several exhausting exercises are often performed in the same session with protocols 1, 2 and 3, which could increase the performance variability because of fatigue. As suggested in a review [30], the purpose of the present study was to confirm the interest of SCrit and PCrit computed from exercises whose performances are submaximal.
In the Single-Visit Field Test of Critical Speed, there were trained and untrained runners whose reliability of SCrit was different [29]. Therefore, the effects of submaximal performance on SCrit and PCrit in the present study have been compared between a low-endurance athlete and a high-endurance athlete, i.e., athletes with low and high endurance indices (for example, exponent g or SCrit/MAS or PCrit/MAP). The values of exponent g were about 0.95 in the best elite endurance runners [15,31] as Gebrselassie whose ratio SCrit/MAS was equal to 0.945 (MAS corresponded to the maximal running speed during 7 min). In the low-endurance runners whose ratios SCrit/MAS were equal to 0.764 ± 0.078, exponent g was about 0.80 [31].
As SCrit and PCrit can be computed from two exhausting exercises, the effects of submaximal performances on these indices have been estimated by multiplying both theoretical maximal data by two coefficients: C1 for the shortest performances and C2 for the longest performances.
The effects of submaximal performances on SCrit and PCrit were estimated with arbitrary units for tlim, Dlim and S (or P) in the present study. Indeed, there are many different cases:
- the range of tlim can be different for each athlete in protocols 1 and 3;
- the range of speeds and distances (or power-output and work in cycling) can be different for each athlete in protocol 2;
- the same endurance indices can correspond to different maximal aerobic speed (MAS) or maximal aerobic power (MAP in cycling).
The effects of submaximal performances on endurance indices have been tested for values of tlim equal to 1 and 4 (arbitrary units), which corresponds to the usual range of tlim (3–12m in [28,29]) in many study. In some studies, the range of tlim is 2–15 min [12,32,33], Therefore, the effects of submaximal performances have also been tested for values of tlim equal to 1–7 (arbitrary unit).
2. Methods
2.1. Arbitrary Units
The values of tlim1, Dlim1 and S1 in arbitrary units in protocols 1, 2 and 3 are equal to 1:
tlim1 = 1 and S1 = 1 and Dlim1 = 1
2.1.1. Arbitrary Units in Protocols 1 and 2
The values of tlim2 and tlim3 in arbitrary units in protocols 1 and 2 are equal to 4 and 7, respectively.
tlim2 = 4 and tlim3 = 7
The distances and running speeds corresponding to tlim2 and tlim3 was computed from the power-law model b Kennelly with arbitrary units of tlim:
Dlim1 = k tlim1g = k (1g) = 1 then k = 1 and Dlim = tlimg and S = tlimg−1
For the high-endurance athlete, exponent g of the power-law model is equal to 0.95. Therefore, the values of Dlim2, Dlim3, S2 and S3 in arbitrary units are equal to:
Dlim2 = tlim2g = 40.95 = 3.7321 and Dlim3 = tlim3g = 70.95 = 6.3510
S2 = tlim2g−1 = 4−0.05 = 0.9330 and S3 = tlim3g−1 = 7−0.05 = 0.9073
For the low-endurance athlete, exponent g of the power-law model is equal to 0.80. Therefore, the values of Dlim2, Dlim3, S2 and S3 in arbitrary units are equal to:
Dlim2 = 40.80 = 3.0314 and Dlim3 = 70.80 = 4.7433
S2 = 4−0.2 = 0.7579 and S3 = 7−0.2 = 0.6776
2.1.2. Arbitrary Units in Protocol 3
The values of constant-distances (Dlim) in the present study were equal to the averages of the distances of low and high-endurance athletes, in protocols 1 and 2, i.e., 1 (Dlim1), 3.3819 (Dlim2) and 5.5471 (Dlim3). The values of tlim2 and tlim3 corresponding to these distances were:
Dlim = tlimg
(tlimg)1/g = tlim = Dlim1/g
tlim1 = Dlim11/g = 11/g = 1 and tlim2 = Dlim21/g = 3.38191/g
and tlim3 = Dlim31/g = 5.54711/g
and tlim3 = Dlim31/g = 5.54711/g
For the low-endurance athlete:
tlim2 = 3.38191/0.8 = 4.5862 and tlim3 = 5.54711/0.80 = 8.5130
For the high-endurance athlete:
tlim2 = 3.38191/0.95 = 3.6059 and tlim3 = 5.54711/0.95 = 6. 0705
2.2. Coefficients C1 and C2
The ranges of coefficients C1 and C2 used in protocol 2 and 3 were from 0.95 to 1. Indeed, in protocols 2 and 3, the submaximal performances are the results of submaximal speeds (or submaximal power outputs in cycling). If the ratio C1/C2 is lower than 0.9330, the speed corresponding to tlim2 would be higher than the speed at tlim1 in the high-endurance athlete. In protocol 1 (constant-speed protocol), the speed (or power) does not depend on C1 or C2 and the variability of performances are higher [27]. Therefore, the ranges of C1 and C2 were larger (from 0.8 to 1).
2.3. Computation of the Effects of Submaximal Performances on SCrit and PCrit
2.3.1. Computation in the Constant-Speed (or Constant Power Output) Protocol (Protocol 1)
The submaximal performances are the result of the submaximal values of tlim. The submaximal values of tlim (tlim1 sub and tlim2 sub) are:
tlim1 sub = C1 tlim1 and tlim2 sub = C2 tlim2
Therefore, the submaximal values of Dlim (Dlim1 sub and Dlim2 sub) are equal to:
Dlim1 sub = S1 tlim1 sub = S1C1 tlim1 = C1 Dlim1
Dlim2 sub = S2 tlim2 sub = S2C2 tlim2 = C2 tlim2
For running:
SCrit = (Dlim2 − Dlim1)/(tlim2 − tlim1)
SCrit sub = (C2 Dlim2 − C1 Dlim1)/(C2 tlim2 − C1 tlim1)
SCrit sub/SCrit = [(C2 Dlim2 − C1 Dlim1)/(C2 tlim2 − C1 tlim1)]/[(Dlim2 − Dlim1)/(tlim2 − tlim1)]
For cycling:
PCrit sub/PCrit = [(C2 Wlim2 − C1 Wlim1)/(C2 tlim2 − C1 tlim1)]/[(Wlim2 − Wlim1)/(tlim2 − tlim1)]
2.3.2. Computation in the constant-time protocol (protocol 2)
The submaximal performances are the result of submaximal speeds.
S1sub = C1S1 and S2sub = C2S2
Dlim1 sub = C1S1 tlim1 = C1Dlim1 and Dlim2 sub = C2S2 tlim2 = C2Dlim2
For cycling, the submaximal performances correspond to lower powers.
P1sub = C1P1 and P2sub = P2S2
Wlim1 sub = C1P1 tlim1 = C1 Wlim1 and Wlim2 sub = C2P2 tlim2 = C2 Wlim2
For running:
SCrit = (Dlim2 − Dlim1)/(tlim2 − tlim1)
SCrit sub = (Dlim2 sub − Dlim1sub)/(tlim2 − tlim1) = (C2 Dlim2 − C1 Dlim1)/(tlim2 − tlim1)
SCrit sub/SCrit = [(C2 Dlim2 − C1 Dlim1)/(tlim2 − tlim1)]/[(Dlim2 − Dlim1)/(tlim2 − tlim1)]
SCrit sub/SCrit = (C2 Dlim2 − C1 Dlim1) /(Dlim2 − Dlim1)
For cycling:
PCrit sub/PCrit = (C2 Wlim2 − C1 Wlim1)/(Wlim2 − Wlim1)
2.3.3. Computation in the constant-distance protocol
The submaximal performances are the result of submaximal speeds.
S1sub = C1S1 and S2sub = C2S2
For cycling, the submaximal performances correspond to lower powers.
P1sub = C1P1 and P2sub = C2P2
Hence: tlim1sub = Dlim1/S1sub = Dlim1/C1S1 = tlim1/C1
and tlim2sub = Dlim2/S2sub = Dlim2/C2S2 = tlim2/C2
For running:
SCrit = (Dlim2 − Dlim1)/(tlim2 − tlim1)
SCrit sub = (Dlim2 − Dlim1)/(tlim2sub − tlim1sub) = (Dlim2 − Dlim1)/(tlim2/C2 − tlim1/C1)
SCrit sub /SCrit = [(Dlim2 − Dlim1)/(tlim2/C2 − tlim1/C1)]/[(Dlim2 − Dlim1)/(tlim2 − tlim1)]
SCrit sub /SCrit = (tlim2 − tlim1)/(tlim2/C2 − tlim1/C1)
For cycling:
PCrit sub /PCrit = (tlim2 − tlim1)/(tlim2/C2 − tlim1/C1)
3. Results
The interest of the use of arbitrary units is demonstrated in Table 1 and Table 2 for protocol 1. Athletes A, B, C, D, E and F who have the same ratio tlim1/tlim2 (4) and the same ratio S2/S1 (0.7579) have the same effects (SCritsub/SCrit) corresponding to the same coefficients C1 and C2 (Table 1). Moreover, the use of the same arbitrary units can also been applied to cycling exercises (Table 2): the effects (PCritsub/PCrit) of submaximal performances are the same when ratio tlim1/tlim2 and ratio P2/P1 are similar as in running exercises.
The effects of submaximal performances on endurance indices are presented in Figure 1 (constant-speed protocol), Figure 2 (constant-time protocol) and Figure 3 (constant-distance protocol).
3.1. Results for Protocol 1 (Constant Speed or Power Output Protocol)
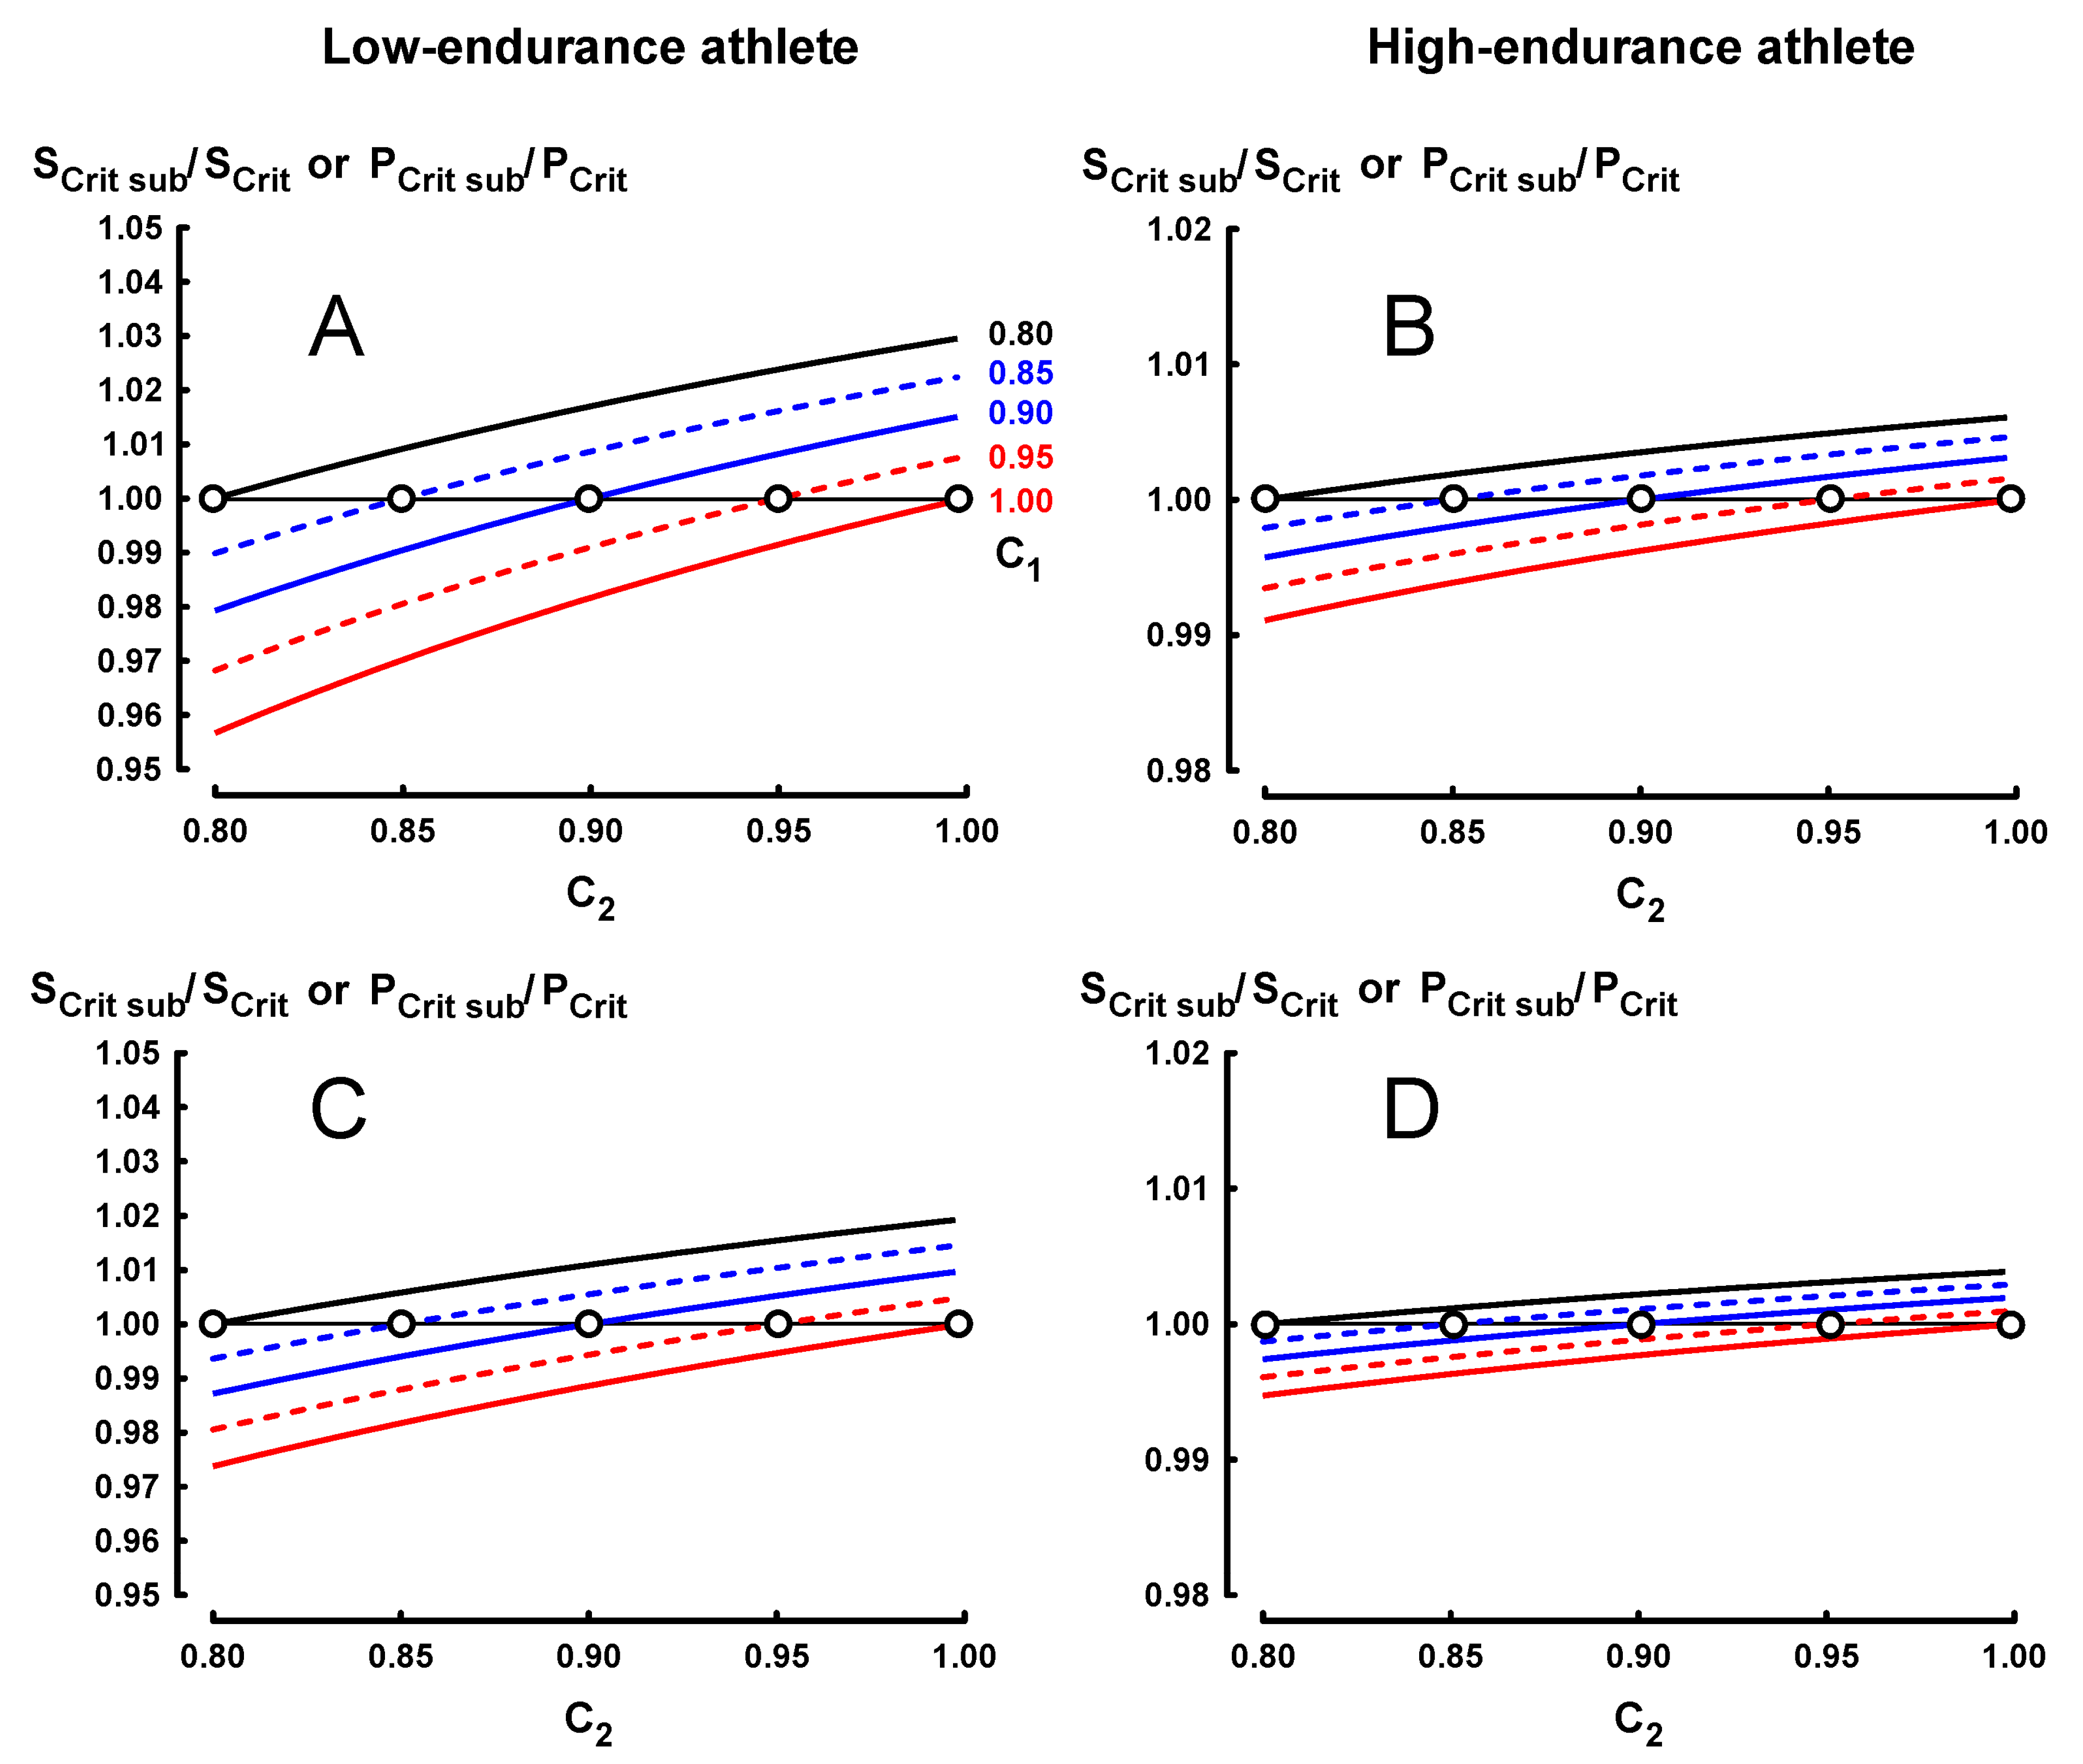
For protocol 1, five curves of ratio SCrit sub/SCrit corresponding to five values of C1 (0.80, 0.85, 0.90, 0.95 and 1.00) were computed from equation 1 with an increment of C2 equal to 0.001.
The effects of submaximal performances on ratio SCrit sub/SCrit (or ratio PCrit sub/PCrit) are lower in the high-endurance athlete (Figure 1B,D) than in the low-endurance athlete (Figure 1A,C).
In Figure 1B,D, the effects of submaximal performances on ratio SCrit sub/SCrit are lower when the range of tlim is longer (1–7 instead of 1–4).
In Figure 1A, the lowest and the highest ratios SCrit sub/SCrit are equal to 0.9567 and 1.0295, respectively.
When C1 is equal to C2 (empty circles), i.e., when the levels of submaximal performances are the same for both exhausting exercises, there is no effect of submaximal performances on ratio SCrit sub/SCrit (or ratio PCrit sub/PCrit) according to Equation (1):
SCrit sub/SCrit = [(C2 Dlim2 − C2 Dlim1)/(C2 tlim2 − C2 tlim1)]/[(Dlim2 − Dlim1)/(tlim2 − tlim1)] = 1
3.2. Results for Protocol 2 (Constant-Time Protocol)
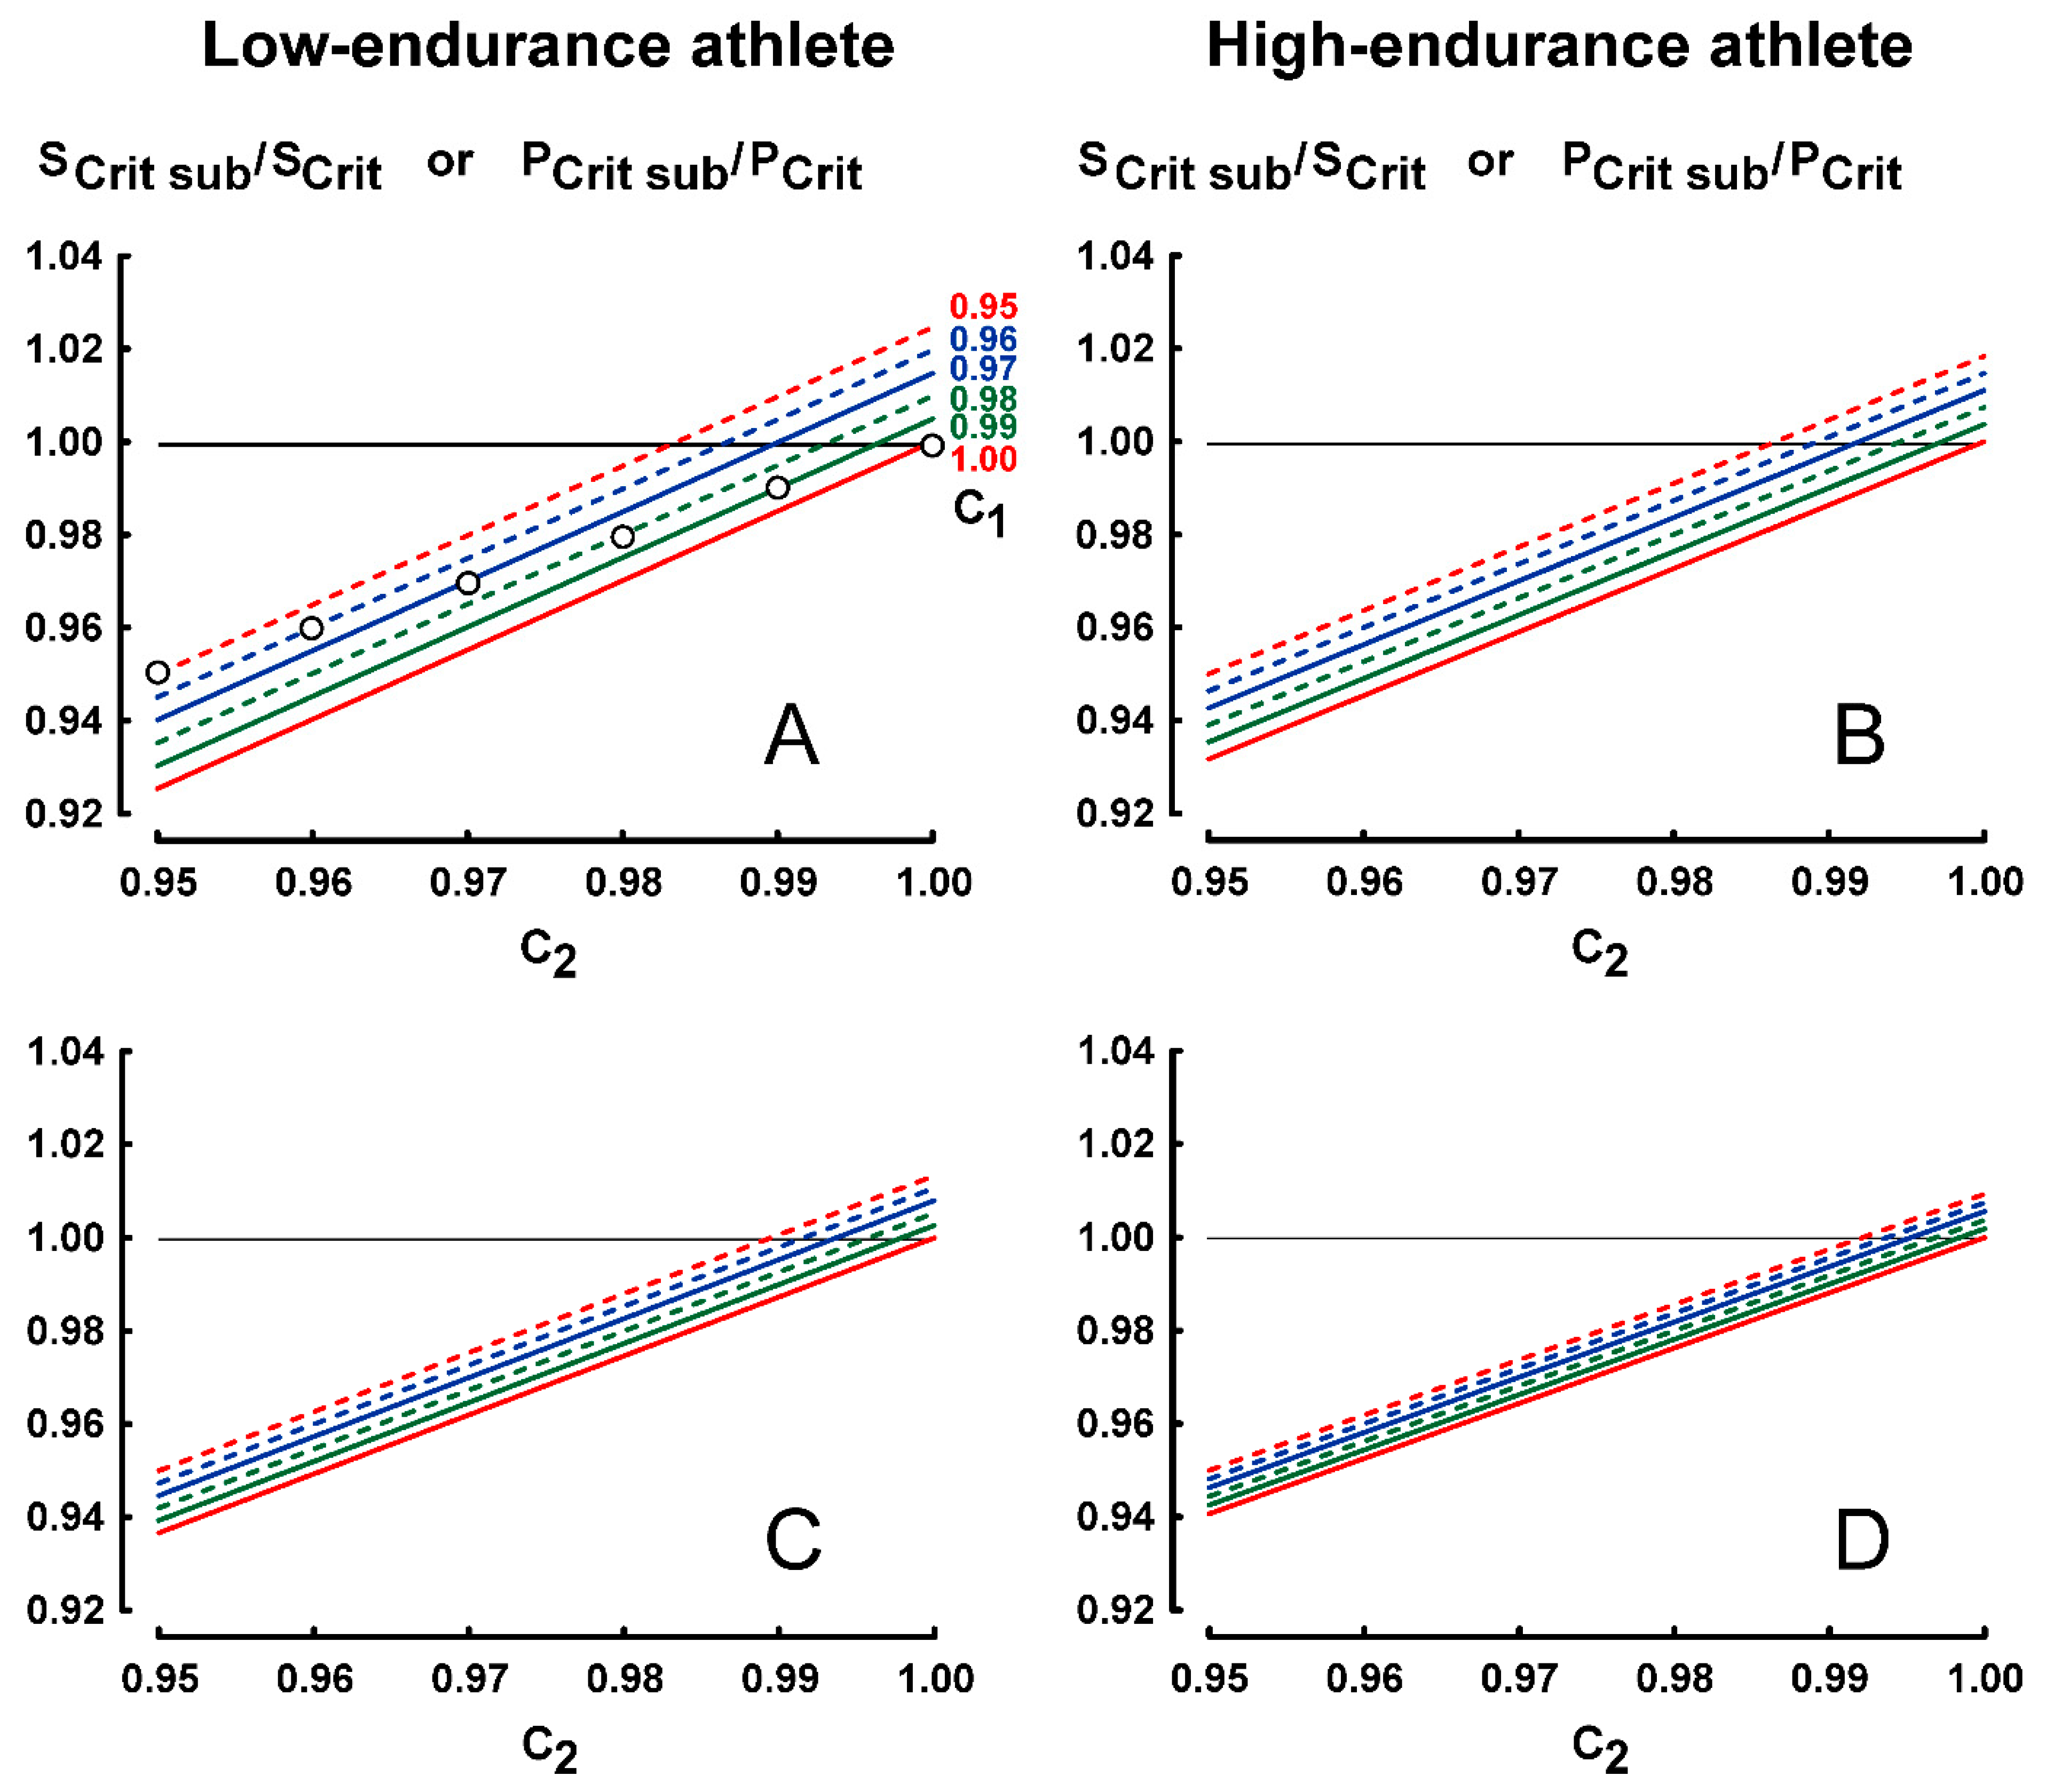
The values of coefficients C1 and C2 were limited from 0.95 to 1. Six curves of ratio SCrit sub/SCrit corresponding to six values of C1 (0.95, 0.96, 0.97, 0.98, 0.99 and 1.00) were computed from Equation (2) with an increment of C2 equal to 0.001.
As for protocol 1, the effects of submaximal performances on ratio SCrit sub/SCrit (or ratio PCrit sub/PCrit) are lower in the high-endurance athlete (Figure 2B,D) than in the low-endurance athlete (Figure 2A,C).
In Figure 2C,D, the effects of submaximal performances on ratio SCrit sub/SCrit are lower when the range of tlim is longer (1–7 instead of 1–4).
In Figure 2A, the lowest and the highest ratios SCrit sub/SCrit are equal to 0.9254 and 1.0246, respectively.
When C1 is equal to C2 (empty circles in Figure 2A), i.e., when the levels of submaximal performances are the same for both exhausting exercises, the ratios SCrit sub/SCrit (or PCrit sub/PCrit) are equal to C2 (or C1) according to Equation (2):
SCrit sub/SCrit = (C2 Dlim2 − C2 Dlim1)/(Dlim2 − Dlim1) = C2 (or C1)
3.3. Results for Protocol 3 (Constant-Distance Protocol)
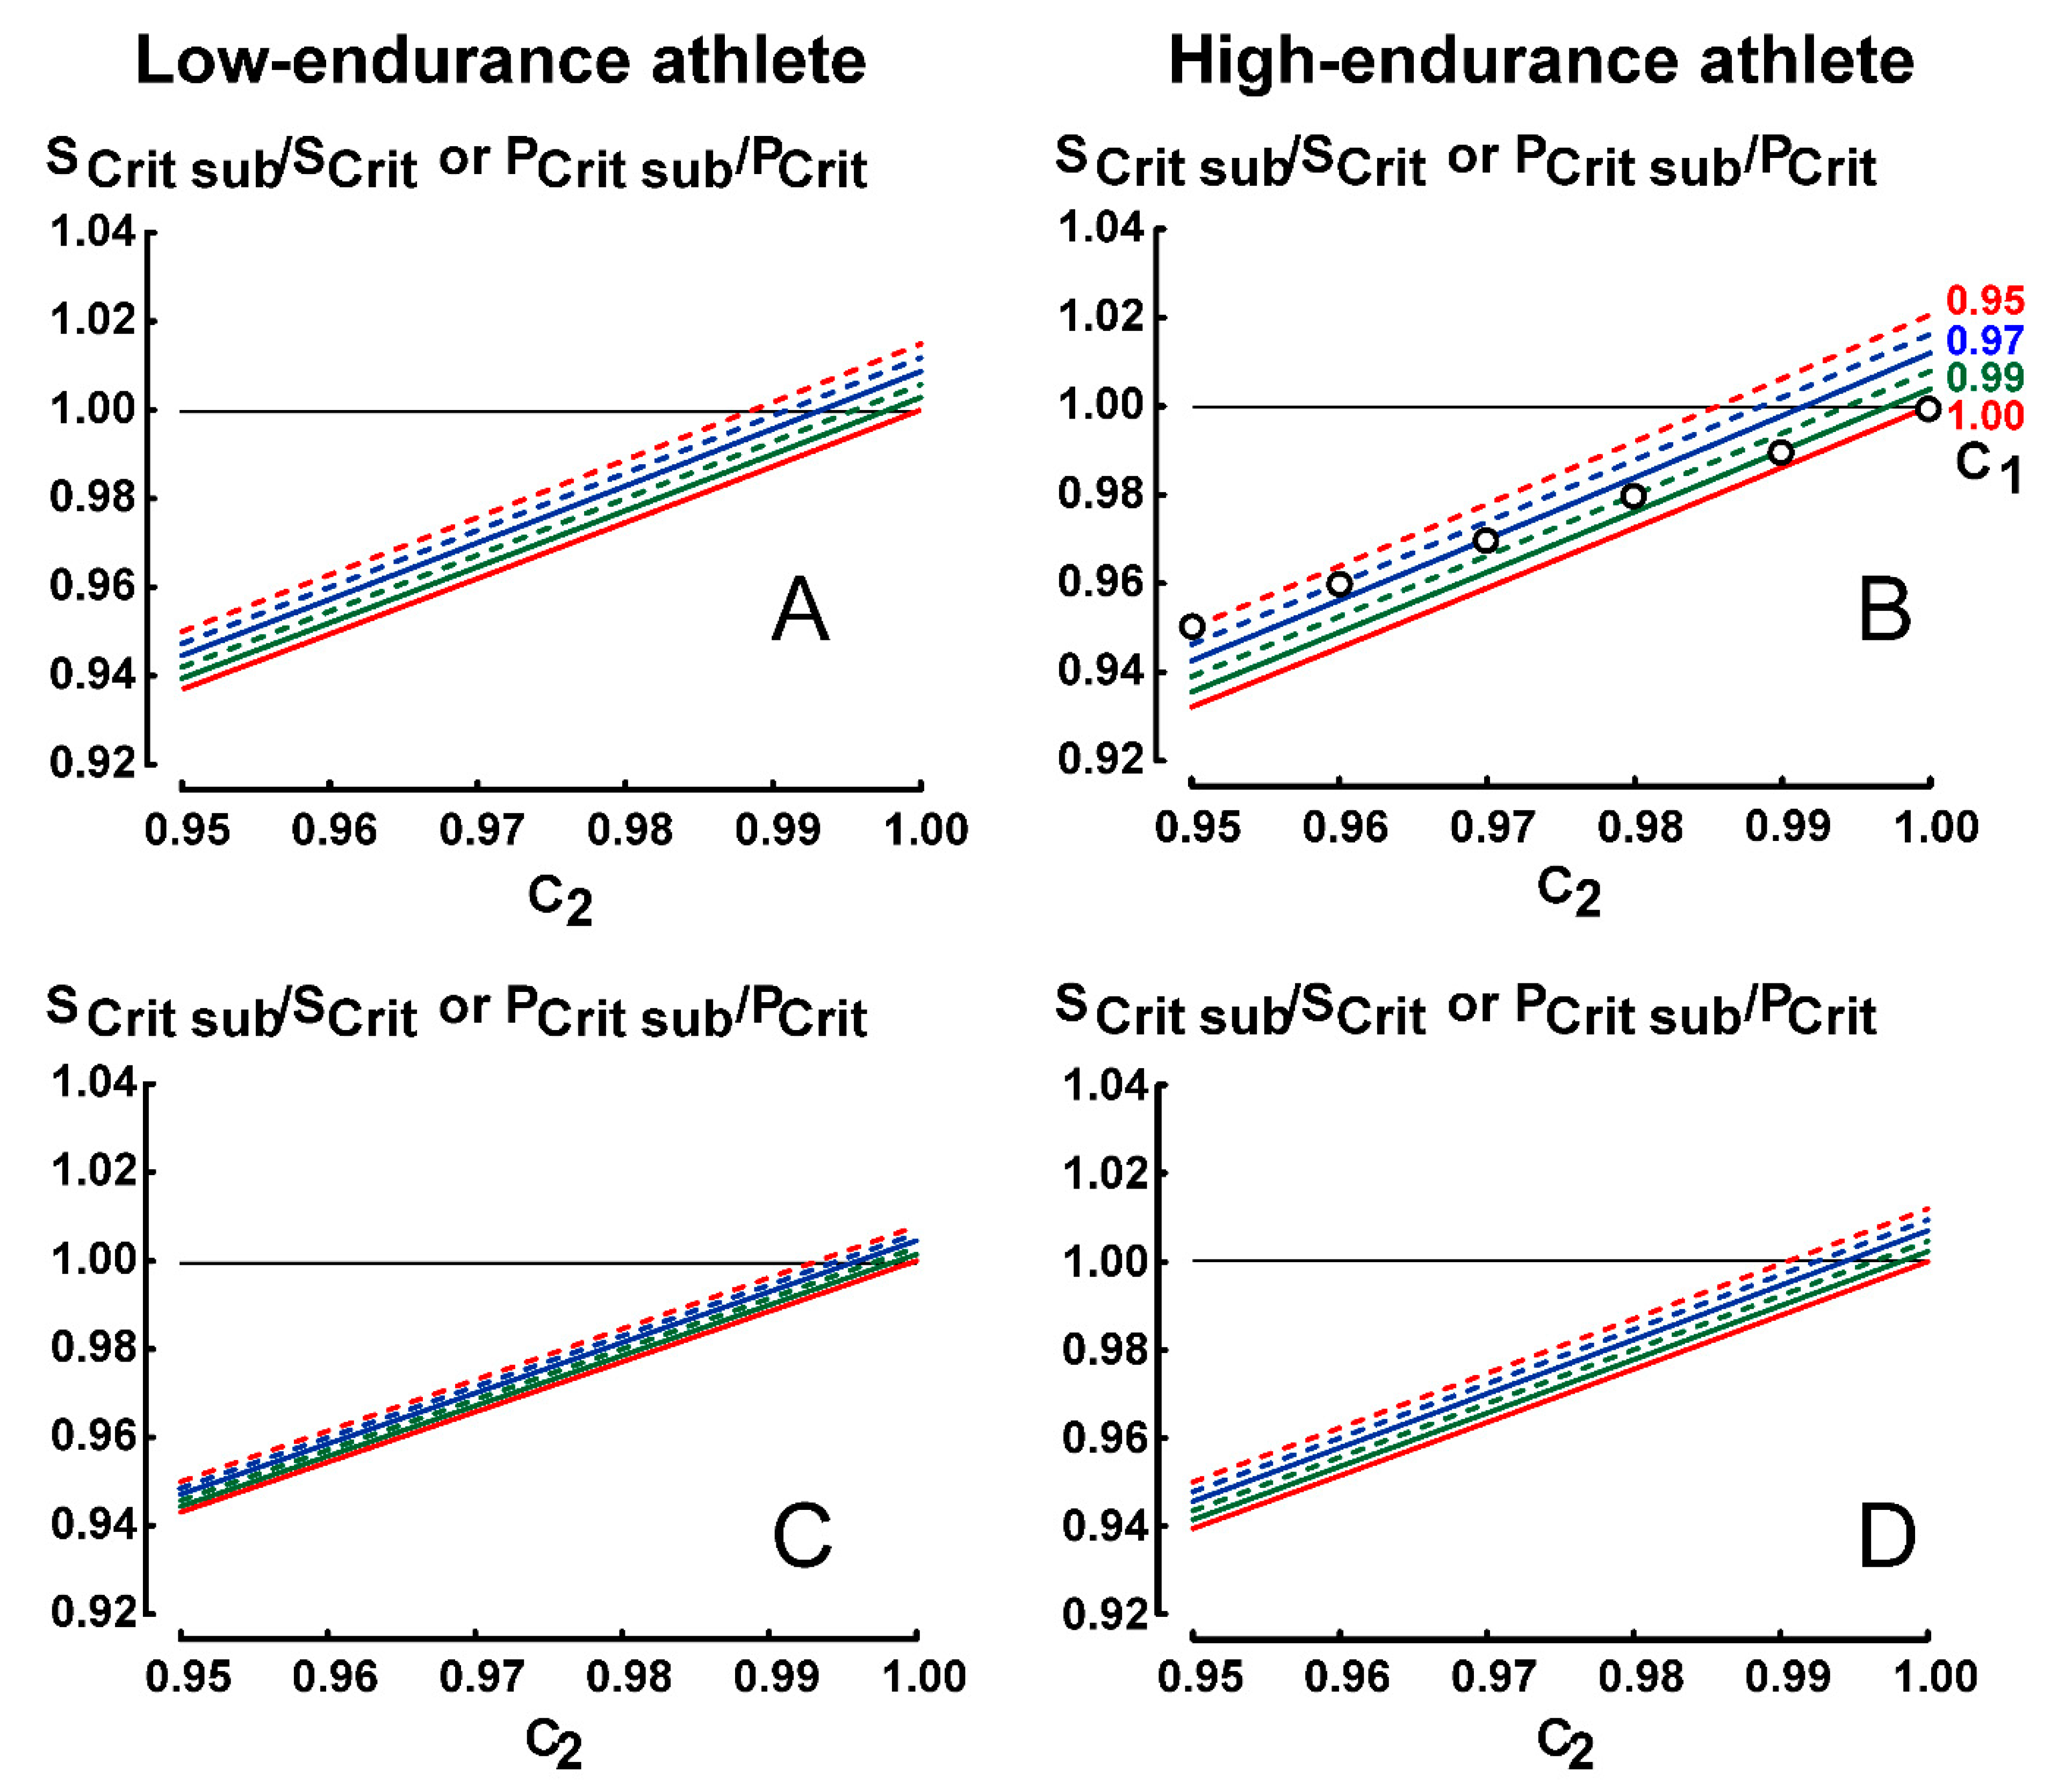
Six curves of ratio SCrit sub/SCrit corresponding to six values of C1 (0.95, 0.96, 0.97, 0.98, 0.99 and 1.00) were computed from equation 3 with an increment of C2 equal to 0.001.
In contrast with protocols 1 and 2, the effects of submaximal performance on ratio SCrit sub/SCrit (or PCrit sub/PCrit) are more important in the high-endurance athlete. However, in the high-endurance athlete, the ranges of tlim1–tlim2 (1-3.6059) and tlim1–tlim3 (1–6.0705) is shorter than the ranges of tlim1–tlim2 (1–4.5862) and tlim1-tlim3 (1–8.5130) in the low-endurance athlete.
In Figure 3B, the lowest and the highest ratios SCrit sub/SCrit are equal to 0.9321 and 1.0206, respectively.
When C1 is equal to C2 (empty circles in Figure 3B), i.e., when the levels of submaximal performances are the same for both exhausting exercises, the ratios SCrit sub/SCrit (or PCrit sub/PCrit) are equal to C2 (or C1) according to Equation (3):
SCrit sub /SCrit = (tlim2 − tlim1)/(tlim2/C2 − tlim1/C2) = C2 (tlim2 − tlim1)/(tlim2 − tlim1) = C2 (or C1)
4. Discussion
The effects of submaximal performances on SCrit 1/t and PCrit 1/t in the model proposed by Whipp et al. [11] are not presented in the present study. Indeed, SCrit 1/t (or PCrit 1/t) is equal to SCrit (or PCrit) when both indices are computed only from two exhausting exercises with constant-distance [15] or constant-power [34] protocols in running and cycling. Similarly, in the present study, the effects of submaximal performances were the same for SCrit 1/t and SCrit (or PCrit 1/t and PCrit) when they were computed from two submaximal exercises whatever the protocol. Consequently, the Figures about the effects of submaximal performances on SCrit 1/t or PCrit 1/t are not added in the present study.
Previous experimental studies [22,23,24,25,26,27] showed that performance reliability with constant-speed protocol is significantly lower than those with the other protocols (constant-time or constant-distance protocols). However, for SCrit or PCrit in the present theoretical study, the effects of 20%-submaximal performances in protocol 1 are lower than the effects of 5%-submaximal performances in protocols 2 and 3. For example, the lowest ratio SCrit sub/SCrit in protocol 1 is equal to 0.9567 (Figure 1A) whereas the lowest ratio in protocol 2 is equal to 0.9254 (Figure 2A).
Ratio SCri tsub/SCrit (or ratio PCrit sub/PCrit) is equal to 1 when the maximal and submaximal Dlim-tlim relationships are parallel i.e., when the distances of both submaximal performances to the maximal Dlim-tlim line are similar:
- -
- C1 is equal to C2 for protocol 1(empty circles in Figure 1);
- -
- Dlim1 (1 − C1) is equal to Dlim2 (1 − C2) for protocol 2;
- -
- tlim1 (1 − 1/C1) is equal to tlim2 (1 − 1/C2) for protocol 3.
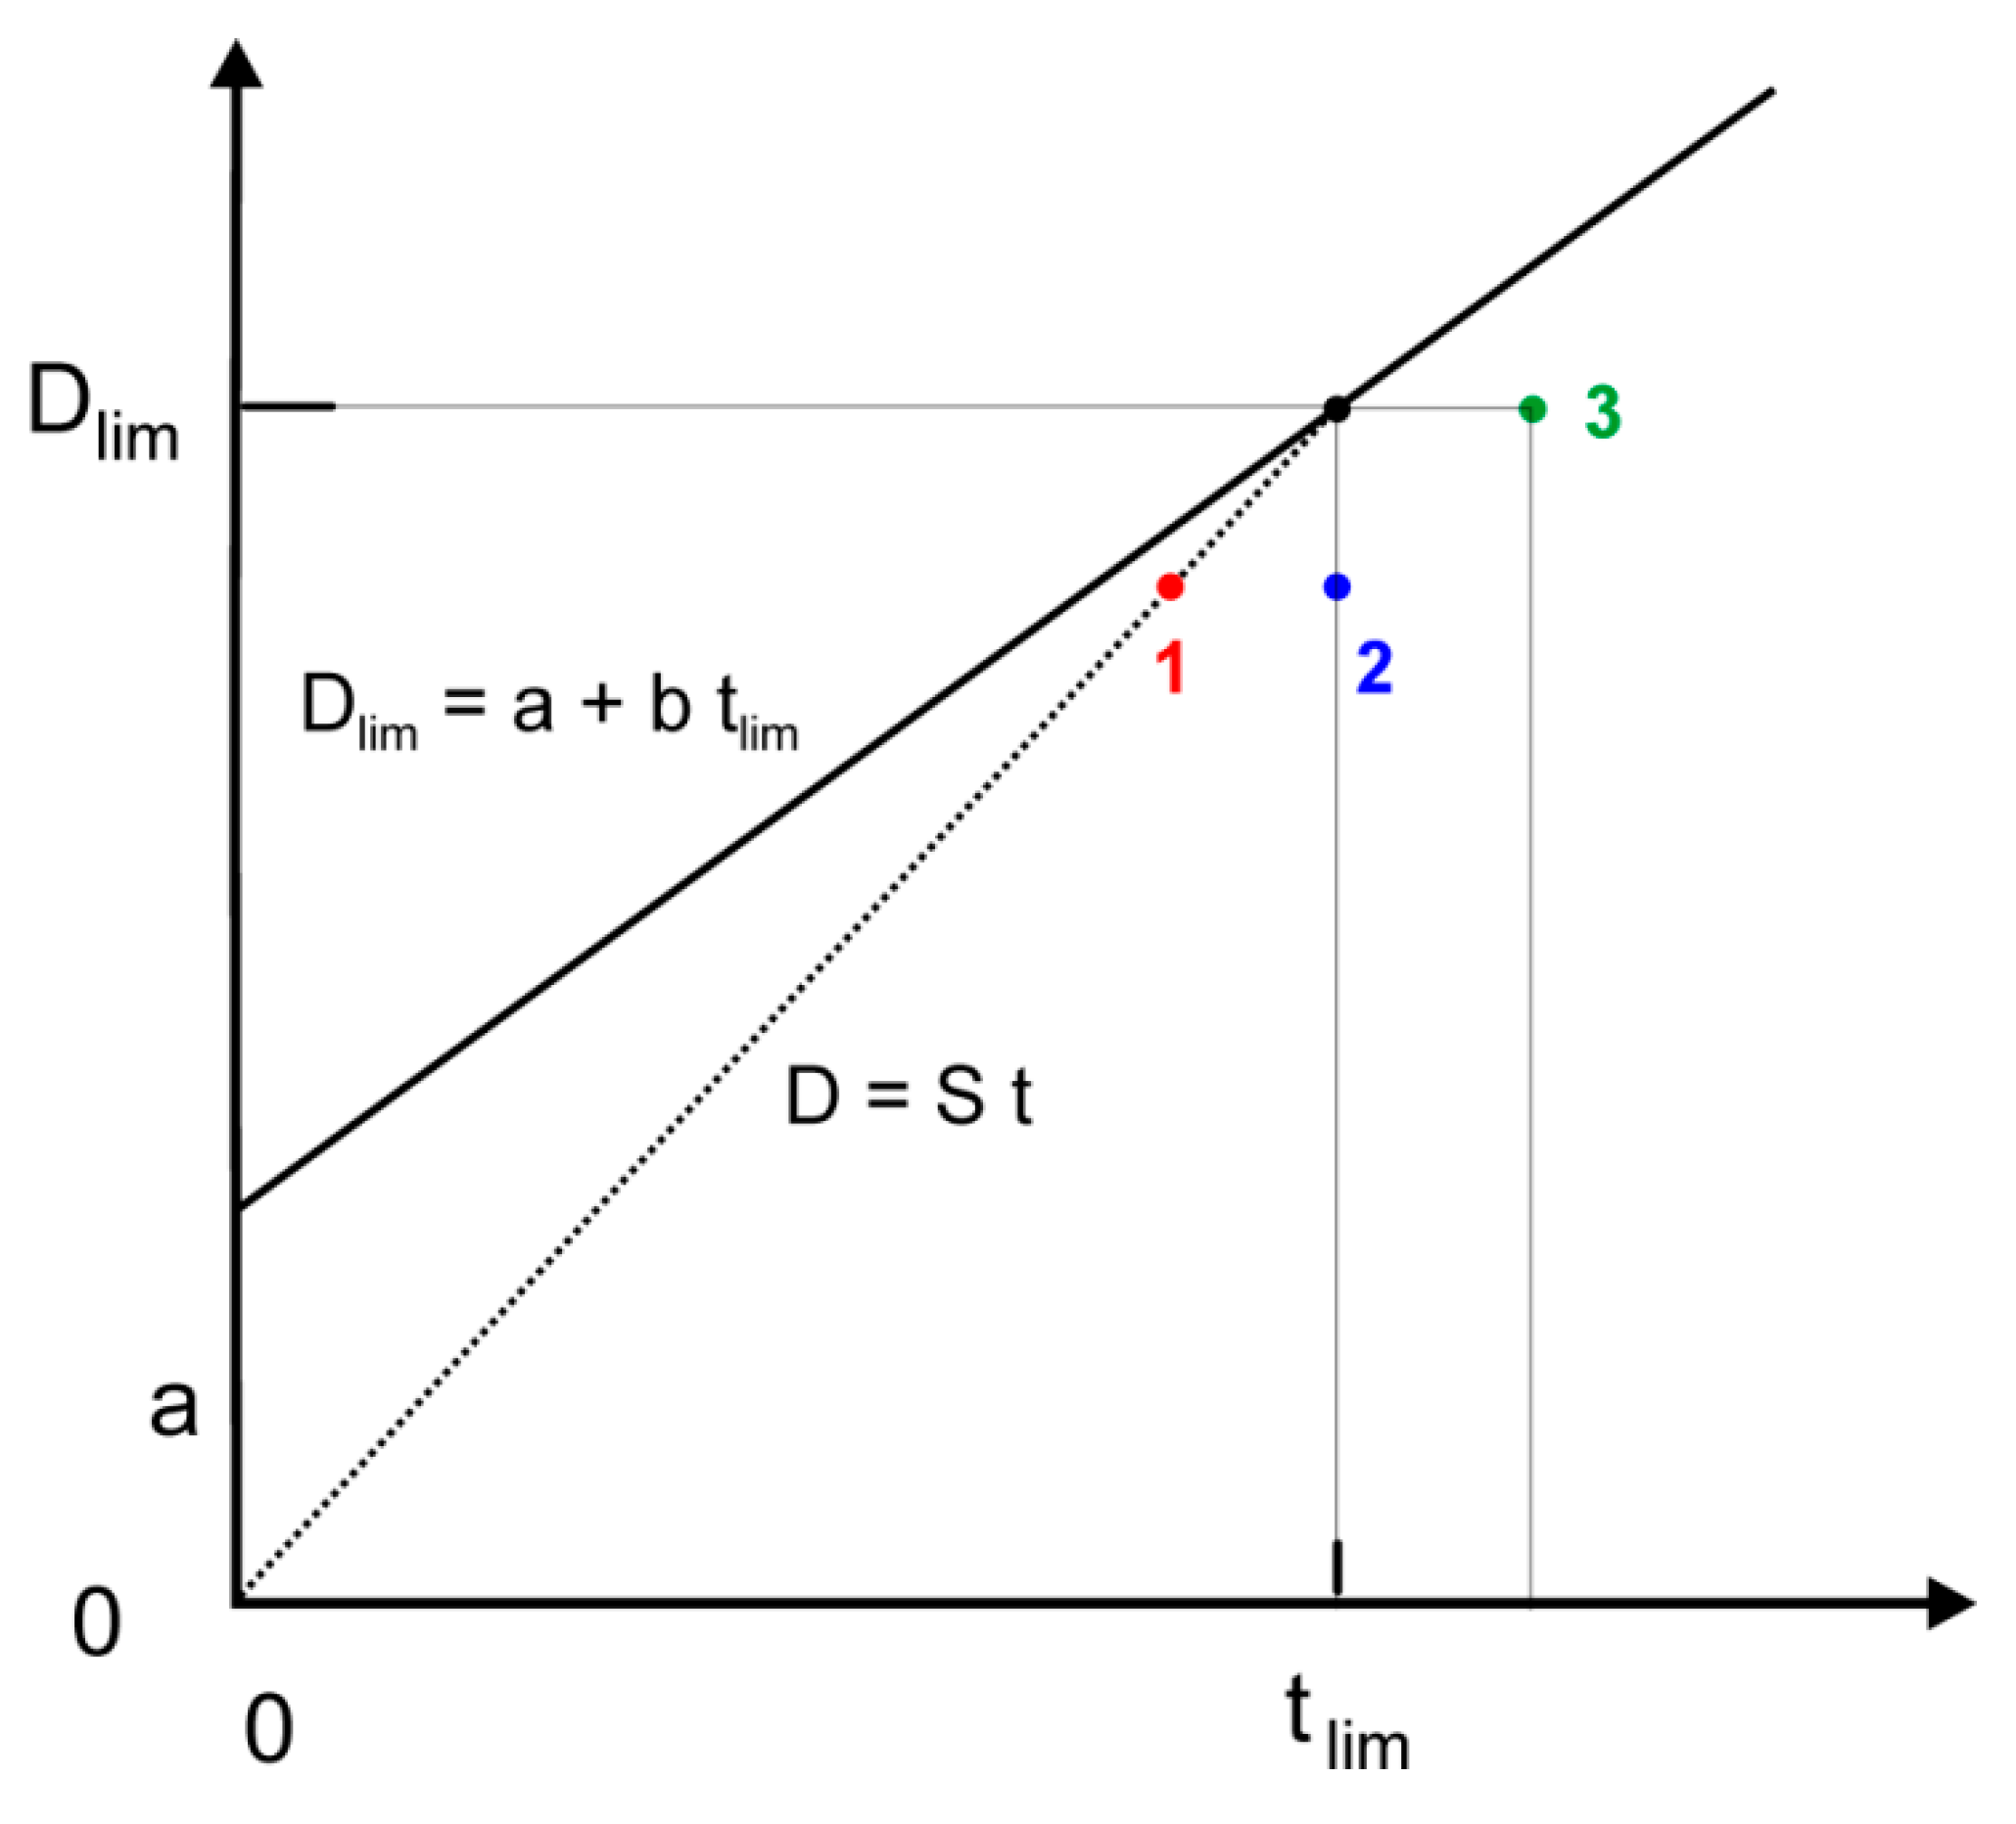
In protocol 1, the submaximal performances correspond to similar decreases in Dlim and tlim whereas, in protocol 2 and 3, they only correspond to a decrease in Dlim or tlim (Figure 4). These simultaneous decreases in Dlim and tlim limit the distance between the submaximal performance and the maximal Dlim-tlim line, which explain the lower effects of submaximal performances on ratio SCrit sub/SCrit.
In protocols 2 and 3, when C1 is equal to C2 (empty circles in Figure 2A, Figure 3B) ratios SCrit sub /SCrit are equal to C1 and are not very low (SCrit sub/SCrit ≥ 0.95). When C2 is lower than C1, ratios SCrit sub /SCrit are lower and sometimes not negligible in protocols 2 and 3 (for example, in Figure 2A, SCrit sub/SCrit = 0.9254 for C2 = 0.95 and C1 = 1). However, although the range of C1-C2 is much larger (0.8–1.0), ratios SCrit sub/SCrit are not very low (≥ 0.9567) in protocol 1, even when C2 is lower than C1 (Figure 1A).
The effects of submaximal performances on ratio SCrit sub/SCrit (or ratio PCrit sub/PCrit) may be low (SCrit sub /SCrit ≥ 0.95) for both low-endurance and high-endurance athletes in the three protocols. These possible low effects of submaximal performances on ratio SCrit sub/SCrit could explain that it is possible to compute SCrit from the values of tlim of 3 trials performed with protocol 3 in a same session with only 30 min of recovery between the trials as in a Single-Visit Field Test [28,29]. This low sensitivity of SCrit or PCrit to submaximal performances was previously suggested in a study on the comparison of critical speeds of continuous and intermittent running exercise on a track [35] and also in a review [30].
The effects of submaximal performances on ratio SCrit sub/SCrit are lower in the high-endurance athlete for constant-speed and constant-time protocols (Figure 1 and Figure 2). That said, the effects of submaximal performances on ratio SCrit sub/SCrit in constant-distance protocol (protocol 3) are higher in the high-endurance athlete (Figure 3). However, the effects of submaximal performances on ratio SCrit sub/SCrit (or ratio PCrit sub/PCrit) are lower when the range of tlim is longer (for example, 1–7 instead of 1–4) as illustrated in Figure 1, Figure 2 and Figure 3. Therefore, in protocol 3, the shorter ranges of tlim1-tlim2 and tlim1-tlim3 in the high-endurance athlete explain these computed higher effects of submaximal performances on ratio SCrit sub/SCrit. In contrast, the coefficient of variation of the Single-Visit Field Test that corresponds to this constant-distance protocol was lower in trained runners whose SCrit were faster than untrained runners [29]. It was likely that the reliability of SCrit in the trained runners was higher because of control of the maximal running speed corresponding to a given distance and better recovery.
In the Single-Visit Field Test [28], the running performances were submaximal because the values of D’ (equivalent of ADC) were significantly lower in the 30-min (106.4-m) and 60-min-recovery (102.4-m) than in the 3-session treadmill test (249.7 m). However, SCrit in the Single-Visit Field Test was not different of SCrit in the 3-session treadmill test. These results were consistent with those of a previous experimental study on the effects of a 6-min exhausting exercise on SCrit in cycling [36]. In the present theoretical study, the submaximal performances have also effects on parameter “a” (ADC). For example, in protocol 1, parameter “a” decreases when C1 and C2 are equal and lower than 1 (empty circles in Figure 1) but increases when C1 is equal to 1 and C2 is lower than 1. These effects of submaximal performances on parameter “a” are not computed in the present study because this parameter is not an endurance index and its meaning is questionable [11].
The present method can also be used for the submaximal-performance effects on the exponent g of the power-law model by Kennelly [1] and the endurance index (EI) of the logarithmic model by Péronnet and Thibault [4] as they are 2-parameter models:
Dlim = k tlimg and S = k tlimg−1 power-law model
100 S/MAS = 100 − EI log(tlim/tMAS) logarithmic model
5. Conclusions
The results of the present theoretical study confirm the interest of SCrit and PCrit computed from exercises whose performances are submaximal and performed in the same session. Indeed, for the 3 protocols, the theoretical effects of submaximal performances on ratio SCrit sub/SCrit (or ratio PCrit sub/PCrit) are low in many cases. The effects of submaximal performances are lower when the ratio tlim2 /tlim1 is larger. In protocol 3, it is likely that, in practice, the reliability of SCrit is better in trained runners due to the control of the maximal running speed corresponding to a given distance.
Funding
This research received no external funding.
Conflicts of Interest
The author declares no conflict of interest.
References
- Kennelly, A.E. An approximate law of fatigue in the speeds of racing animals. Proc. Am. Acad. Arts Sci 1906, 42, 275–331. [Google Scholar] [CrossRef]
- Hill, A.V. The physiological basis of athletic records. Nature 1925, 116, 544–548. [Google Scholar] [CrossRef]
- Scherrer, J.; Samson, M.; Paléologue, A. Etude du travail musculaire et de la fatigue. Données ergométriques obtenues chez l’homme. J. Physiol. 1954, 46, 887–916. [Google Scholar]
- Péronnet, F.; Thibault, G. Mathematical analysis of running performance and world running records. J. Appl. Physiol. 1989, 67, 453–465. [Google Scholar] [CrossRef] [PubMed] [Green Version]
- Hopkins, W.G.; Edmond, I.M.; Hamilton, B.H.; Mac Farlane, D.J.; Ross, B.H. Relation between power and endurance for treadmill running of short duration. Ergonomics 1989, 32, 1565–1571. [Google Scholar] [CrossRef] [PubMed]
- Morton, R.H. A 3-parameter critical power model. Ergonomics 1996, 39, 611–619. [Google Scholar] [CrossRef] [PubMed]
- Ettema, J.H. Limits of human performance and energy-production. Int. J. Angew. Physiol. Einschl. Arb. Physiol. 1966, 22, 45–54. [Google Scholar] [CrossRef]
- Margaria, R.; Cerretelli, P.; Aghemo, P.; Sassi, G. Energy cost of running. J. Appl. Physiol. 1963, 18, 367–370. [Google Scholar] [CrossRef]
- Berthoin, S.; Baquet, G.; Dupont, G.; Blondel, N.; Mucci, P. Critical Velocity and Anaerobic Distance Capacity in Prepubertal Children. Rev. Can. Physiol. Appl. 2003, 28, 561–575. [Google Scholar] [CrossRef]
- Moritani, T.; Ata, A.N.; Devries, H.A.; Muro, M. Critical power as a measure of physical work capacity and anaerobic threshold. Ergonomics 1981, 24, 339–350. [Google Scholar] [CrossRef]
- Whipp, B.J.; Huntsman, D.J.; Storer, T.; Lamarra, N.; Wasserman, K. A constant which determines the duration of tolerance to high-intensity work (Abstract). Fed. Proc. 1982, 41, 1591. [Google Scholar]
- Craig, J.C.; Vanhatalo, A.; Burnley, M.; Jones, A.M.; Poole, D.C. Critical Power: Possibly the Most Important Fatigue Threshold in Exercise Physiology. In Muscle and Exercise Physiology, 1st ed.; Zoladz, J., Ed.; Elsevier Publisher: New York, NY, USA, 2019; Chapter 8; pp. 159–181. [Google Scholar]
- Vandewalle, H.; Kapitaniak, B.; Grun, S.; Raveneau, S.; Monod, H. Comparison between a 30-s all-out test and a time-work test on acycle ergometer. Eur. J. Appl. Physiol. Occup. Physiol. 1989, 58, 375–381. [Google Scholar] [CrossRef] [PubMed]
- Green, S.; Dawson, B.T.; Goodman, C.; Carey, M.F. Y-intercept of the maximal work-duration relationship and anaerobic capacity in cyclists. Eur. J. Appl. Physiol. Occup. Physiol. 1994, 69, 550–556. [Google Scholar] [CrossRef] [PubMed]
- Vandewalle, H. Modelling of Running Performances: Comparisons of Power-Law, Hyperbolic, Logarithmic and Exponential Models in Elite Endurance Runners. Biomed. Res. Int. 2018. [Google Scholar] [CrossRef] [PubMed]
- Gamelin, F.X.; Coquart, J.; Ferrari, N.; Vodougnon, H.; Matran, R.; Léger, L.; Bosquet, L. Prediction of one hour running performance using constant duration tests. J. Strength Cond. Res. 2006, 20, 735–739. [Google Scholar] [PubMed]
- Katz, J.S.; Katz, L. Power laws and athletic performance. J. Sport. Sci. 1999, 17, 467–476. [Google Scholar] [CrossRef]
- Savaglio, S.; Carbone, V. Human performances: Scaling in athletic world records. Nature 2000, 404, 244. [Google Scholar] [CrossRef]
- Carbone, V.; Savaglio, S. Scaling laws and forecasting in athletic world records. J. Sport. Sci. 2001, 19, 477–484. [Google Scholar]
- García-Manso, J.M.; Martín-González, J.M. Laws of potency or scale: Its application to the sportive phenomenon. Fit. Perform. J. 2008, 7, 195–202. [Google Scholar] [CrossRef]
- Dekerle, J.; Nesi, X.; Carter, H. The distance-Time relationship over a century of running Olympic performances: A limit on the critical speed concept. J. Sport. Sci. 2006, 24, 1213–1221. [Google Scholar] [CrossRef]
- Billat, V.; Renoux, J.C.; Pinoteau, J.; Petit, B.; Koralsztein, J.P. Reproducibility of running time to exhaustion at VO2max in subelite runners. Med. Sci. Sport. Exerc. 1994, 26, 254–257. [Google Scholar] [CrossRef]
- Jeukendrup, A.; Saris, W.H.; Brouns, F.; Kester, A.D. A new validated endurance performance test. Med. Sci. Sport. Exerc. 1996, 28, 266–270. [Google Scholar] [CrossRef] [Green Version]
- Hinckson, E.A.; Hopkins, W.G. Reliability of time to exhaustion analysed with critical-power and log-log modeling. Med. Sci. Sport. Exerc. 2005, 37, 696–701. [Google Scholar] [CrossRef]
- Laursen, P.B.; Francis, G.T.; Abbiss, C.R.; Newton, M.J.; Nosaka, K. Reliability of time-to-exhaustion versus time-trial running tests in runners. Med. Sci. Sport. Exerc. 2007, 39, 1374–1379. [Google Scholar] [CrossRef] [PubMed]
- Galbraith, A.; Hopker, J.G.; Jobson, S.A.; Passfield, L. A Novel Field Test to Determine Critical Speed. J. Sport. Med. Doping Stud. 2011, 1, 1–4. [Google Scholar]
- Alberty, M.; Sidney, M.; Huot-Marchand, F.; Dekerle, J.; Bosquet, L.; Gorce, P.; Lensel, G. Reproducibility of performance in three types of training test in swimming. Int. J. Sport. Med. 2006, 27, 623–628. [Google Scholar] [CrossRef]
- Galbraith, A.; Hopker, J.; Lelliott, S.; Diddams, L.; Passfield, L. A single-visit field test of critical speed. Int. J. Sport. Physiol. Perform. 2014, 9, 931–935. [Google Scholar] [CrossRef] [PubMed]
- Nimmerichter, A.; Steindl, M.; Williams, C.A. Reliability of the Single-Visit Field Test of Critical Speed in Trained and Untrained Adolescents. Sports 2015, 3, 358–368. [Google Scholar] [CrossRef] [Green Version]
- Vandewalle, H.; Vautier, J.F.; Kachouri, M.; Lechevalier, J.M.; Monod, H. Work-exhaustion time relationships and the critical power concept. A critical review. J. Sport. Med. Phys. Fit. 1997, 37, 89102. [Google Scholar]
- Zinoubi, B.; Vandewalle, H.; Driss, T. Modeling of running performances in humans: Comparison of power laws and critical speed. J. Strength Cond. Res. 2017, 31, 1859–1867. [Google Scholar] [CrossRef]
- Poole, D.C.; Ward, S.A.; Gardner, G.W.; Whipp, B.J. Metabolic and respiratory profile of the upper limit for prolonged exercise in man. Ergonomics 1988, 31, 1265–1279. [Google Scholar] [CrossRef]
- Hill, D.W. The critical power concept. A review. Sport. Med. 1993, 16, 237–254. [Google Scholar] [CrossRef] [PubMed]
- Mattioni Maturana, F.; Fontana, F.Y.; Pogliaghi, S.; Passfield, L.; Muriasa, J.M. Critical power: How different protocols and models affect its determination. J. Sci. Med. Sport. 2018, 21, 742–747. [Google Scholar] [CrossRef]
- Kachouri, M.; Vandewalle, H.; Billat, V.; Huet, M.; Thomaidis, M.; Jousselin, E.; Monod, H. Critical velocity of continuous and intermittent running exercise. An example of the limits of the critical power concept. Eur. J. Appl. Physiol. Occup. Physiol. 1996, 73, 484–487. [Google Scholar] [PubMed]
- Ferguson, C.; Rossiter, H.B.; Whipp, B.J.; Cathcart, A.J.; Murgatroyd, S.R.; Ward, S.A. Effect of recovery duration from prior exhaustive exercise on the parameters of the power-duration relationship. J. Appl. Physiol. 2010, 108, 866–874. [Google Scholar] [CrossRef] [PubMed] [Green Version]
Figure 1.
effects of submaximal performances in protocol 1 (constant speed or constant power) on ratios SCritsub/SCrit or PCritsub/PCrit for the different values of C1 and C2. Figures A and B correspond to the range tlim1-tlim2 (1–4) whereas Figures C and D correspond to the range tlim1-tlim3 (1–7). The specifications of the lines are presented in Figure 1A. Empty circles correspond to C1 equal to C2.
Figure 2.
effects of submaximal performances in protocol 2 (constant time-protocol) on ratios SCrit sub/SCrit for the different values of C1 and C2. Figures A and B correspond to the range tlim1-tlim2 (1–4) whereas Figures C and D correspond to the range tlim1-tlim3 (1–7). The specification of the lines is presented in Figure A. Empty circles in Figure A correspond to C1 equal to C2.
Figure 3.
Effects of submaximal performances in protocol 3 (constant distance-protocol) for the different values of C1 (specification of the lines in Figure B are the same as in Figure 2) and C2. Figures A and B correspond to the range tlim1-tlim2 whereas Figures C and D correspond to the range tlim1-tlim3. Empty circles in Figure B correspond to C1 equal to C2.
Figure 4.
Comparison of the effects of submaximal performances in the 3 protocols. Black dot: maximal performance. Red dot: submaximal performance in protocol 1. Blue dot: submaximal performance in protocol 2. Green dot: submaximal performance in protocol 3. The dotted line corresponds to the relationship between distance (D) and time (t) at a given running speed (S).

Table 1.
Athletes A, B and C have the same values of tlim1 and tlim2 but different running speeds (S1 and S2). Athletes D, E and F have the same values of running speed as athletes A, B and C, respectively. The values of tlim1 and tlim2 are higher in athletes D, E and F but ratio tlim2/tlim1 is the same and equal to 4.
| C1 = 0.9 and C2 = 1 | C1 = 1 and C2 = 0.9 | ||||||||
|---|---|---|---|---|---|---|---|---|---|
| S1 | S2 | tlim 1 | tlim 2 | SCrit | SCritsub | SCritsub/SCrit | SCritsub | SCritsub/SCrit | |
| m.s−1 | m.s−1 | s | S | m.s−1 | m.s−1 | m.s-1 | |||
| A | 4 | 3.0316 | 180 | 720 | 2.709 | 2.750 | 1.015 | 2.659 | 0.982 |
| B | 5 | 3.7895 | 180 | 720 | 3.386 | 3.438 | 1.015 | 3.324 | 0.982 |
| C | 6 | 4.5474 | 180 | 720 | 4.063 | 4.126 | 1.015 | 3.989 | 0.982 |
| D | 4 | 3.0316 | 240 | 960 | 2.709 | 2.750 | 1.015 | 2.659 | 0.982 |
| E | 5 | 3.7895 | 240 | 960 | 3.386 | 3.438 | 1.015 | 3.324 | 0.982 |
| F | 6 | 4.5474 | 240 | 960 | 4.063 | 4.126 | 1.015 | 3.989 | 0.982 |
Table 2.
Athletes A, B and C have the same values of tlim1 and tlim2 but different power-outputs (P1 and P2). Athletes D, E and F have the same values of power-outputs as athletes A, B and C, respectively. The values of tlim1 and tlim2 are higher in athletes D, E and F but ratio tlim2/tlim1 is the same and equal to 4.
| C1 = 0.9 and C2 = 1 | C1 = 1 and C2 = 0.9 | ||||||||
|---|---|---|---|---|---|---|---|---|---|
| P1 | P2 | tlim 1 | tlim 2 | PCrit | PCritsub | PCritsub/PCrit | PCritsub | PCritsub/PCrit | |
| W | W | S | S | W | W | W | |||
| A | 240 | 182 | 180 | 720 | 163 | 165 | 1.015 | 160 | 0.982 |
| B | 320 | 243 | 180 | 720 | 217 | 220 | 1.015 | 213 | 0.982 |
| C | 400 | 303 | 180 | 720 | 271 | 275 | 1.015 | 266 | 0.982 |
| D | 240 | 182 | 240 | 960 | 163 | 165 | 1.015 | 160 | 0.982 |
| E | 320 | 243 | 240 | 960 | 217 | 220 | 1.015 | 213 | 0.982 |
| F | 400 | 303 | 240 | 960 | 271 | 275 | 1.015 | 266 | 0.982 |
© 2019 by the author. Licensee MDPI, Basel, Switzerland. This article is an open access article distributed under the terms and conditions of the Creative Commons Attribution (CC BY) license (http://creativecommons.org/licenses/by/4.0/).
Share and Cite
MDPI and ACS Style
Vandewalle, H. Effects of Submaximal Performances on Critical Speed and Power: Uses of an Arbitrary-Unit Method with Different Protocols. Sports 2019, 7, 136. https://doi.org/10.3390/sports7060136
AMA Style
Vandewalle H. Effects of Submaximal Performances on Critical Speed and Power: Uses of an Arbitrary-Unit Method with Different Protocols. Sports. 2019; 7(6):136. https://doi.org/10.3390/sports7060136
Chicago/Turabian StyleVandewalle, Henry. 2019. "Effects of Submaximal Performances on Critical Speed and Power: Uses of an Arbitrary-Unit Method with Different Protocols" Sports 7, no. 6: 136. https://doi.org/10.3390/sports7060136
Note that from the first issue of 2016, this journal uses article numbers instead of page numbers. See further details here.