Is Physical Performance a Differentiating Element between More or Less Successful Football Teams?

 ,
,  and
and
Abstract
:1. Introduction
2. Materials and Methods
2.1. Experimental Approach to the Problem
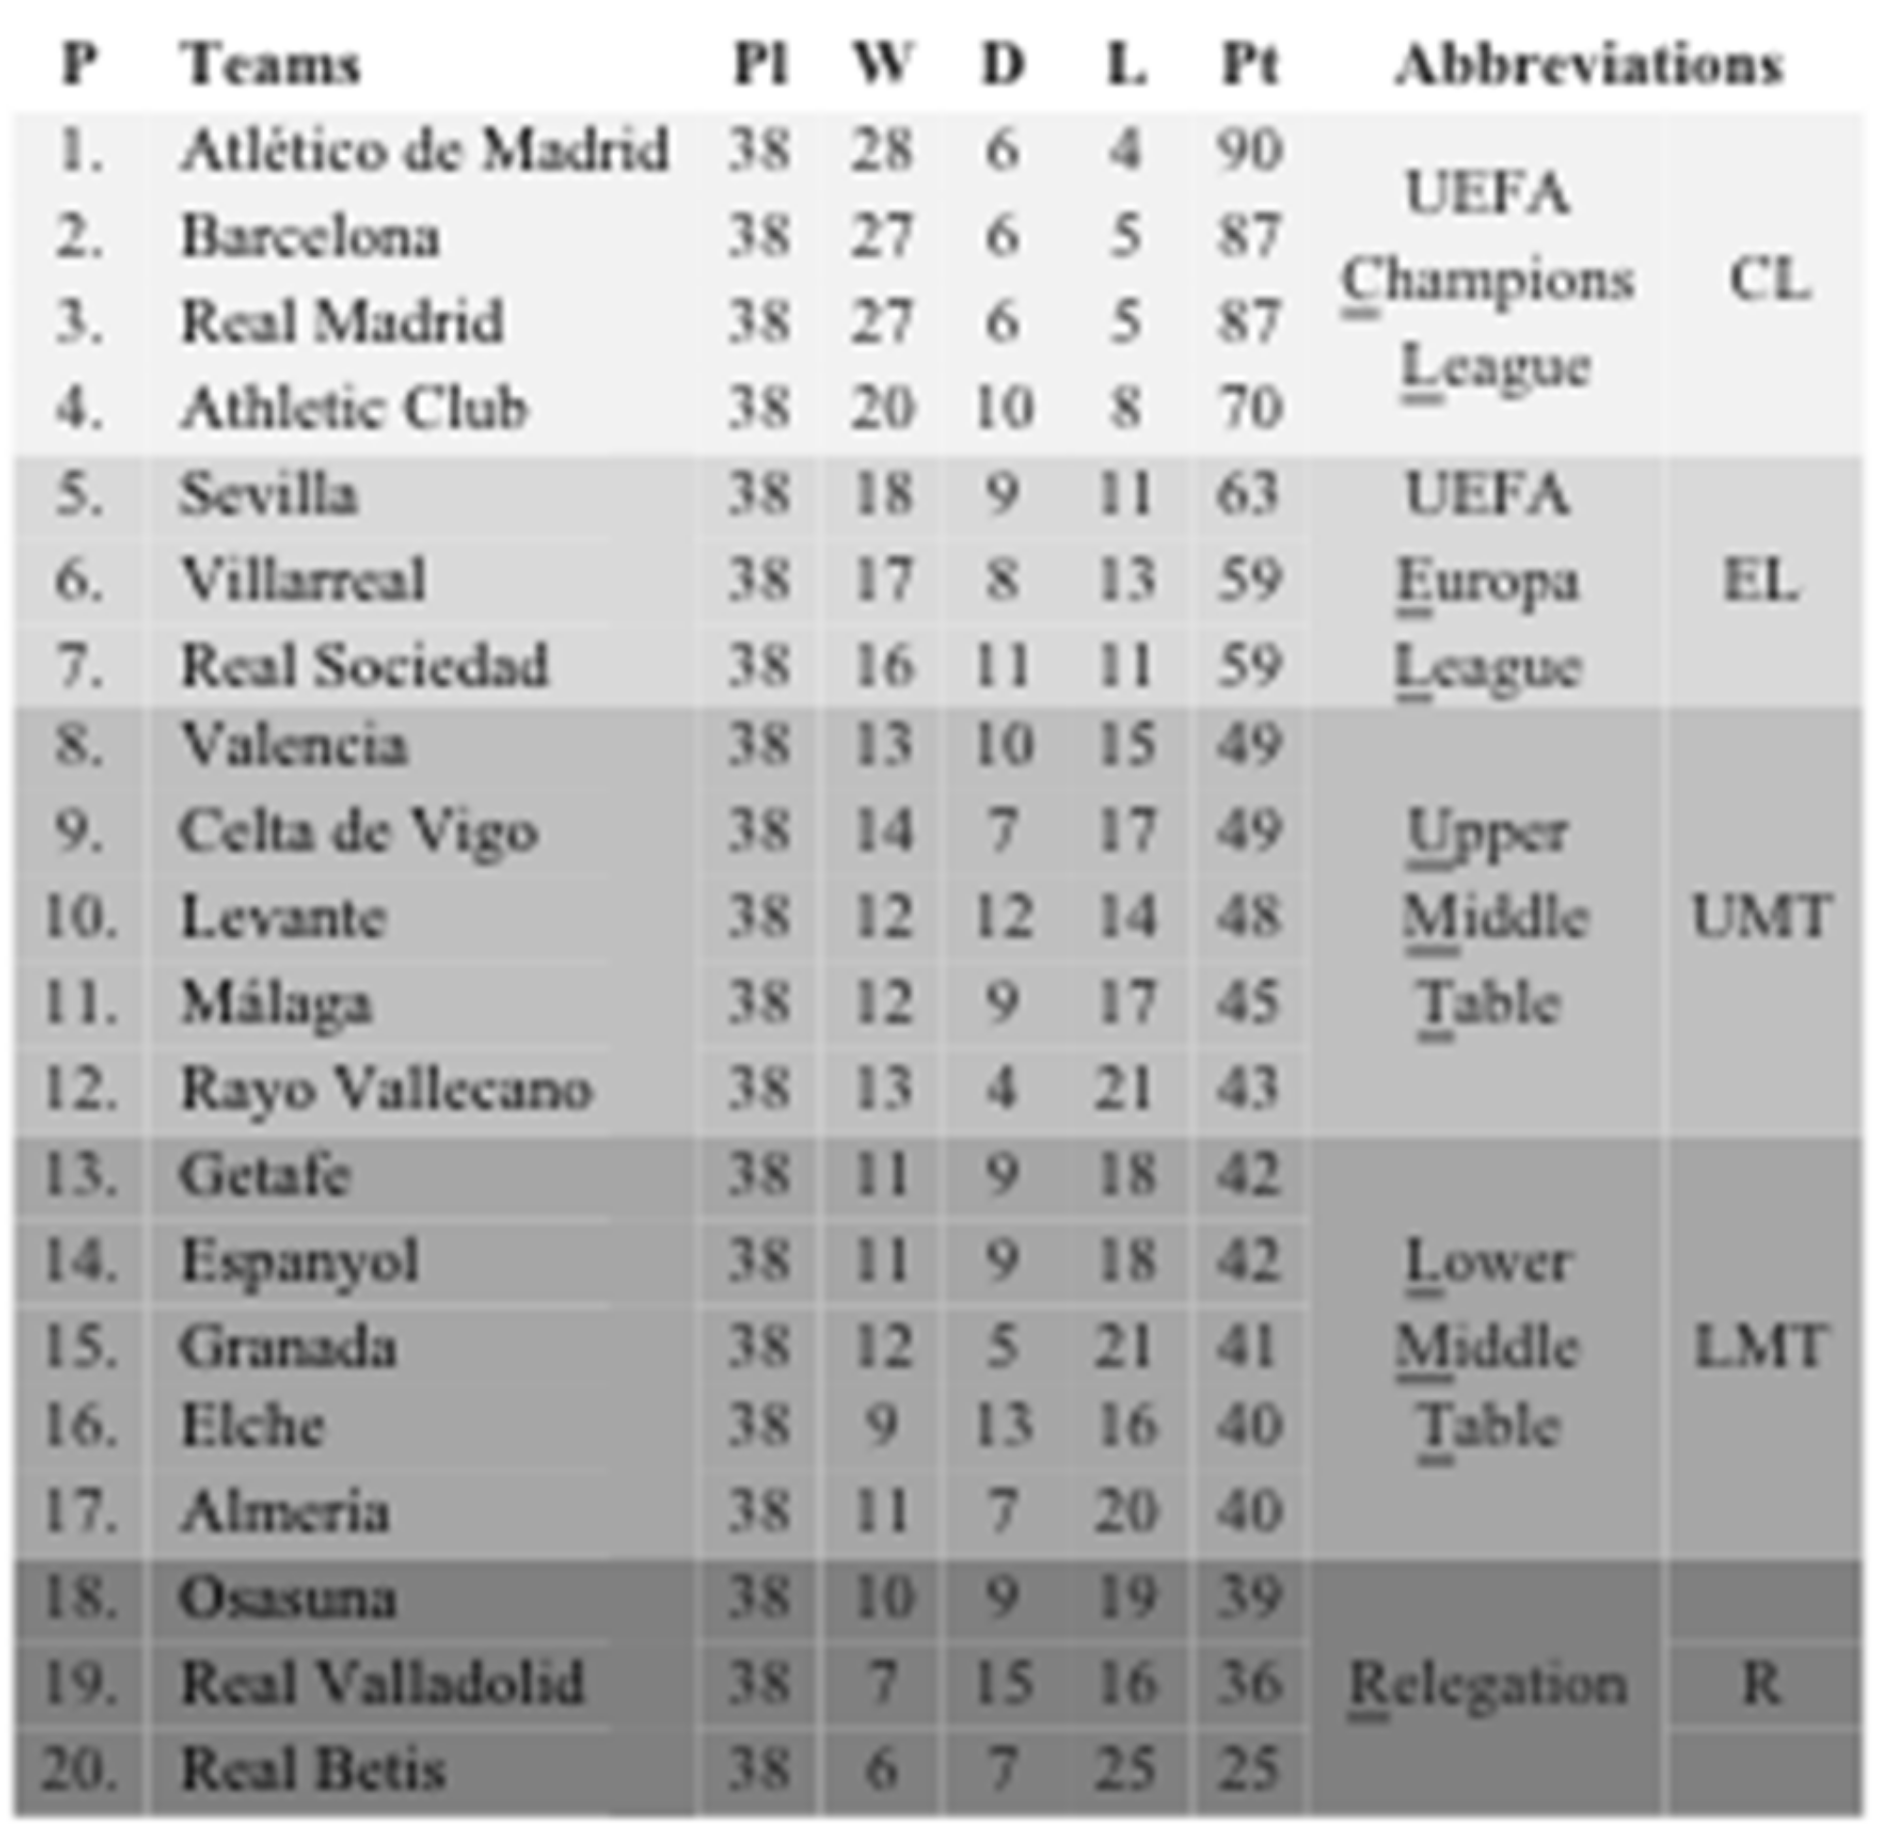
2.2. Sample
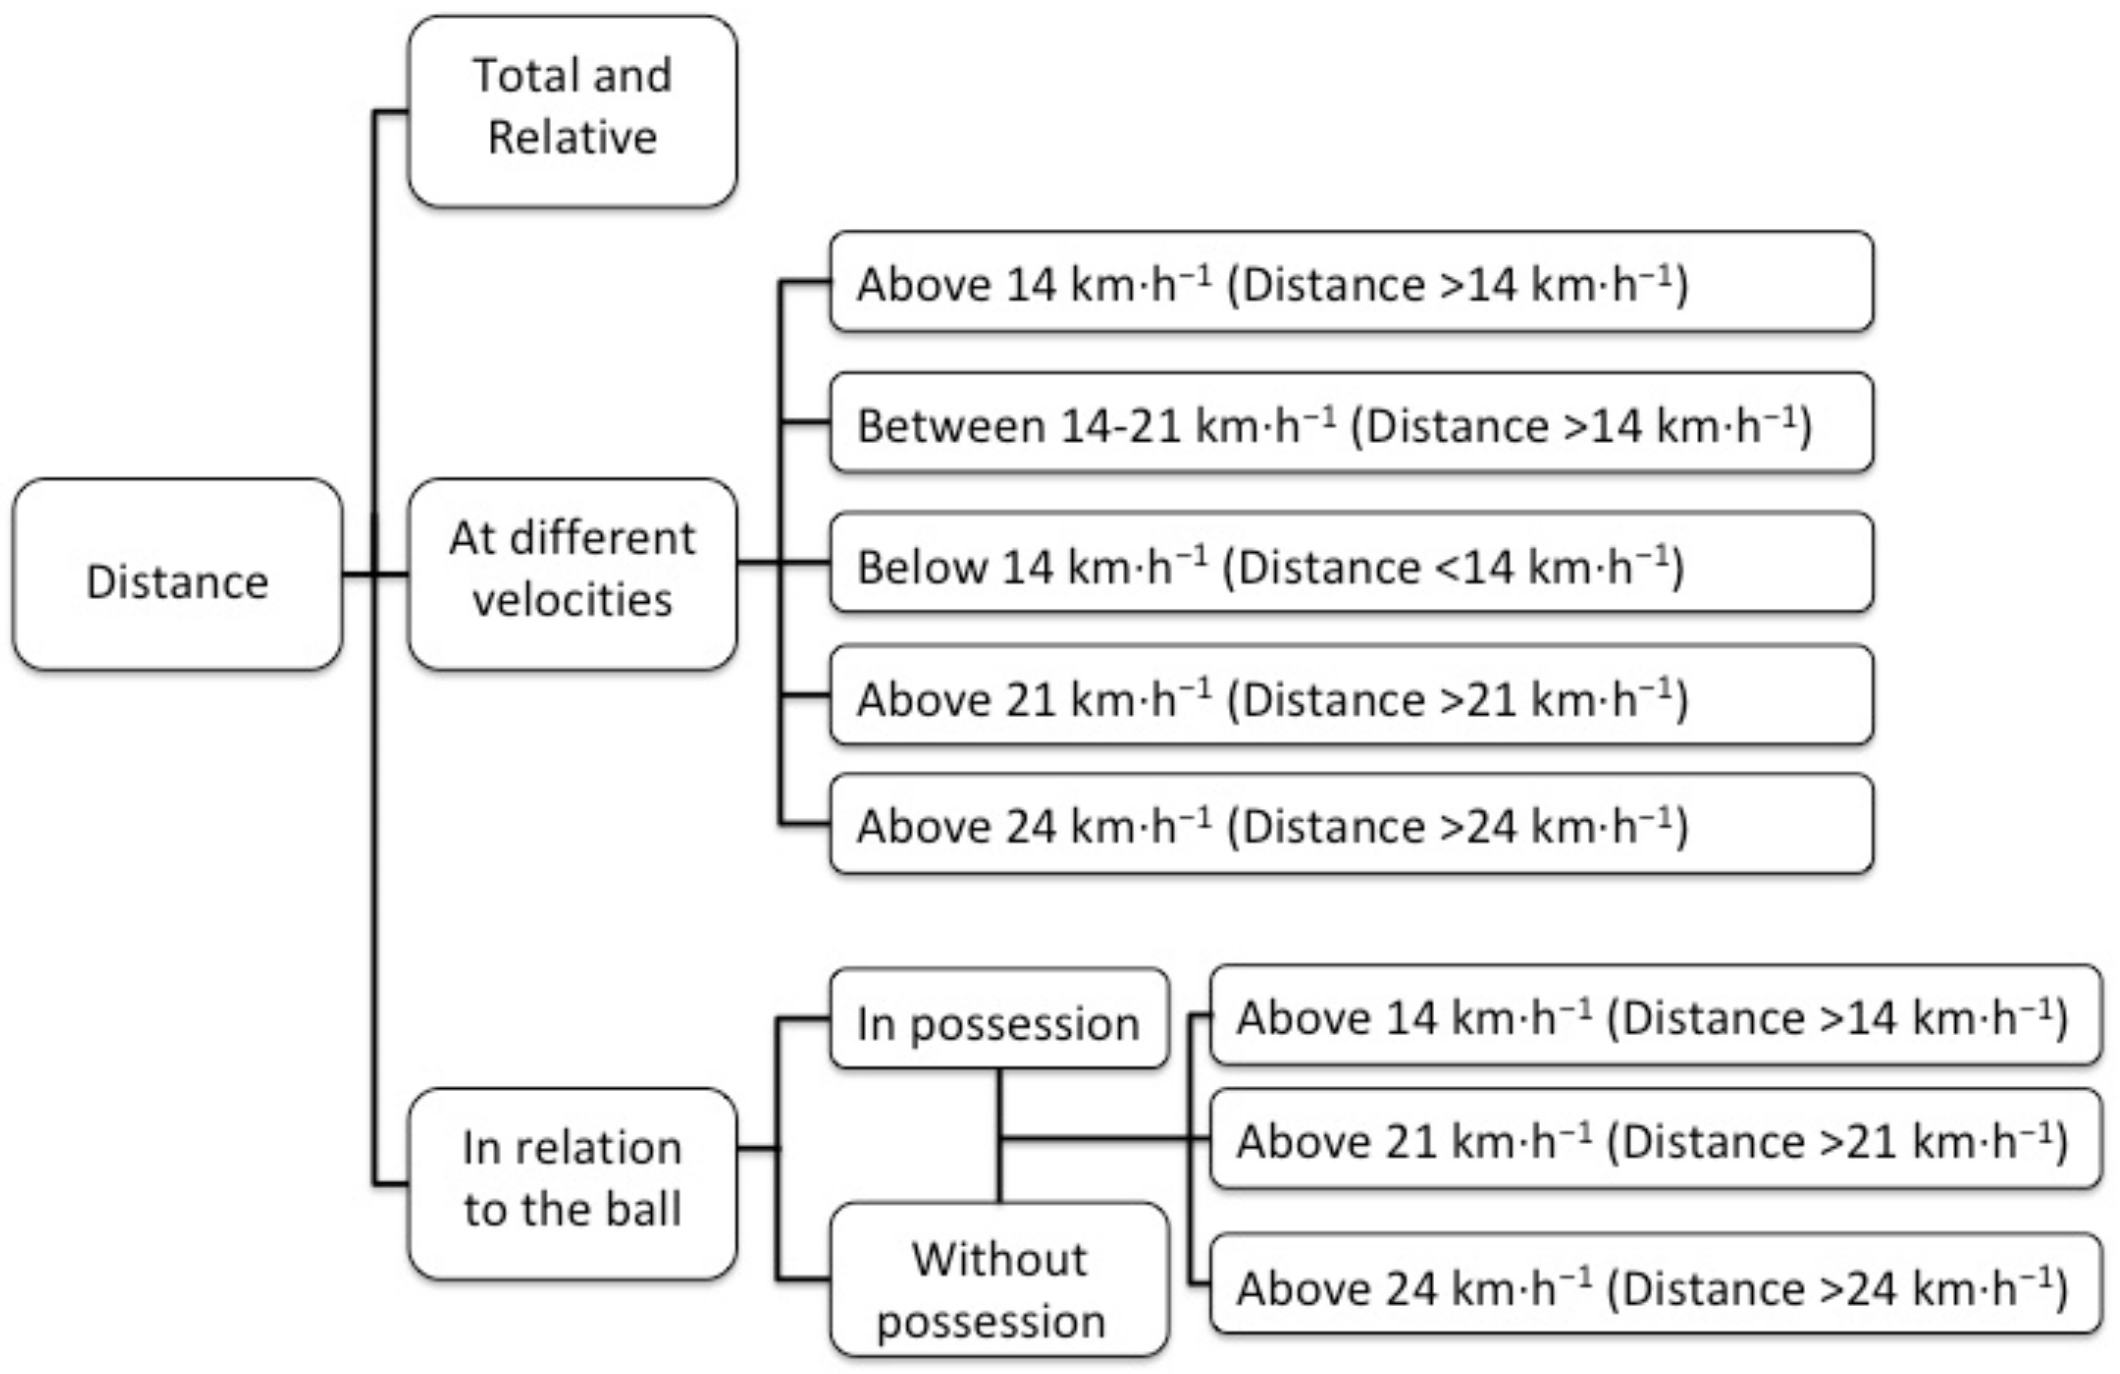
2.3. Procedures
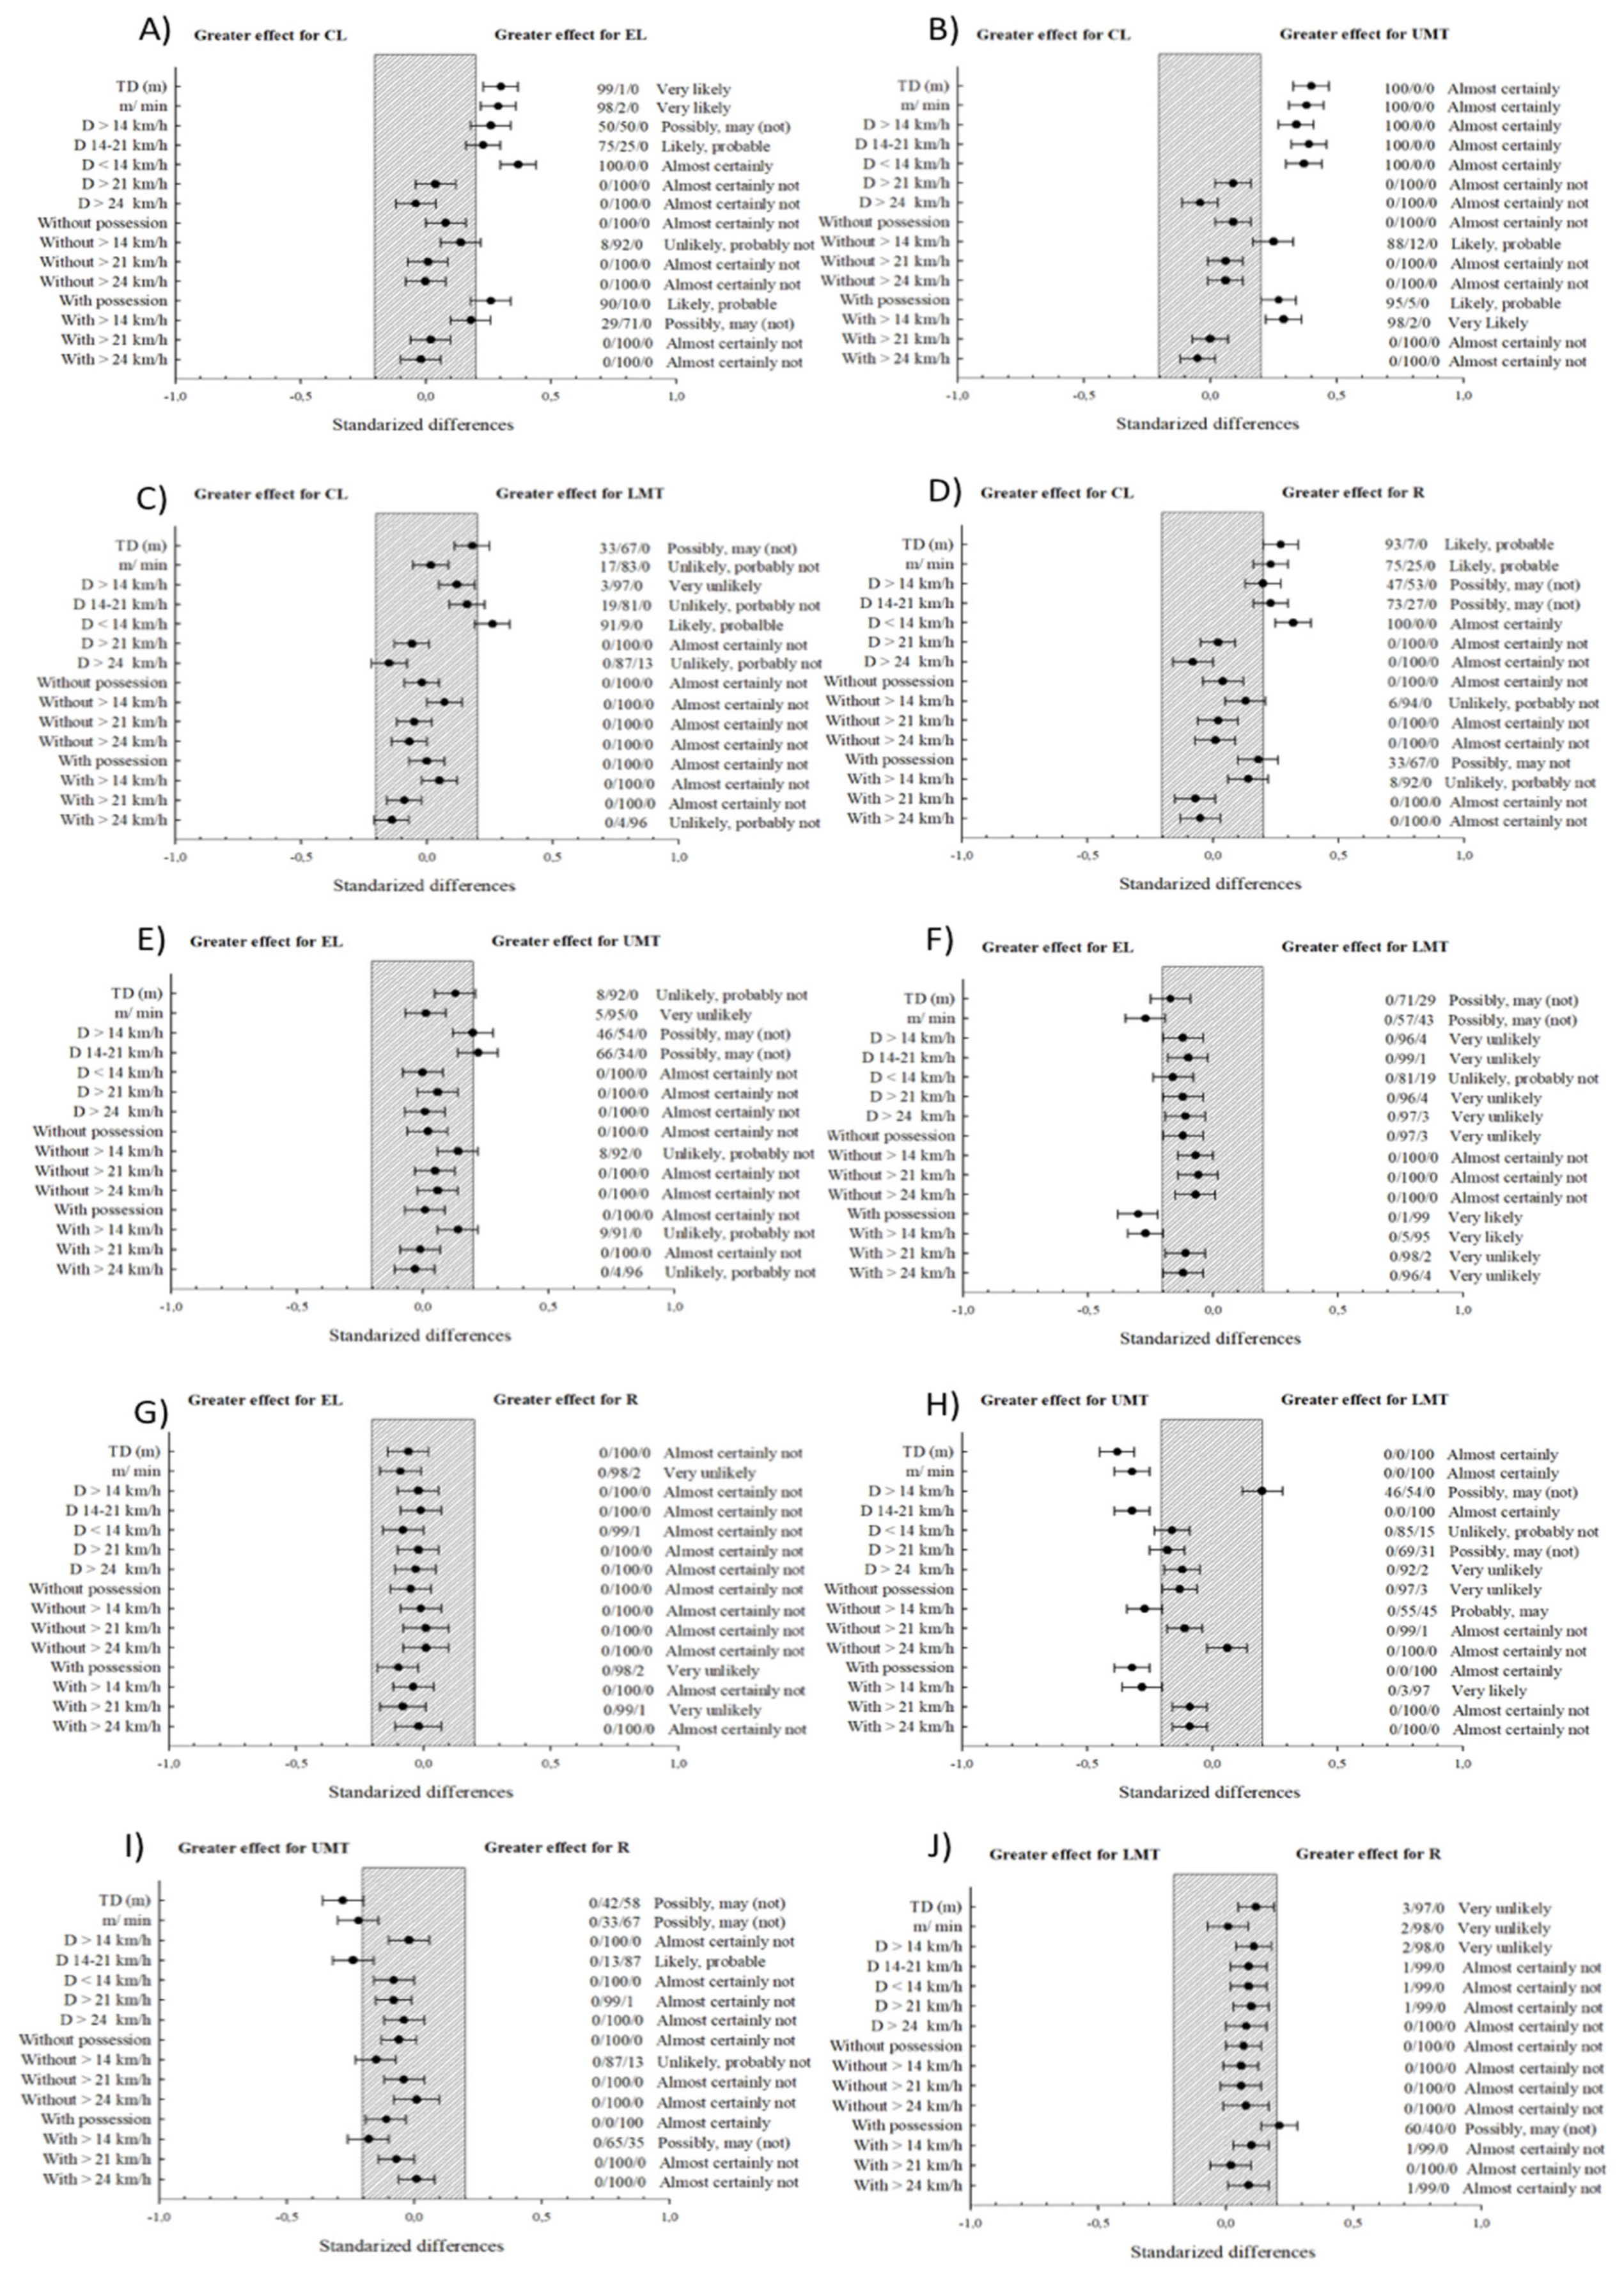
2.4. Statistical Analysis
3. Results
4. Discussion
- Having a knowledge of the physical demands of the game allows coaches to prepare specific training that allows the players to cope with this demand. The present data helps them to obtain some guidelines on the performance of professional teams.
- Technical staff should ensure that their players can achieve the values necessary to achieve optimal performance in their league.
- Increasing the physical demands of the players, alongside their technical and tactical abilities, is a potentially suitable route to increasing team performance. Thus, training in a holistic manner where players improve their fitness with the ball through modified games, could be a recommended modality to achieve success in soccer.
Author Contributions
Funding
Conflicts of Interest
References
- Bradley, P.S.; Archer, D.T.; Hogg, B.; Schuth, G.; Bush, M.; Carling, C.; Barnes, C. Tier-specific evolution of match performance characteristics in the English Premier League: It’s getting tougher at the top. J. Sports Sci. 2015, 34, 980–987. [Google Scholar] [CrossRef] [PubMed]
- Bradley, P.S.; Ade, J.D. Are Current Physical Match Performance Metrics in Elite Soccer Fit for Purpose or Is the Adoption of an Integrated Approach Needed? Int. J. Sports Physiol. Perform. 2018, 13, 656–664. [Google Scholar] [CrossRef] [PubMed]
- Carling, C. Interpreting Physical Performance in Professional Soccer Match-Play: Should we be More Pragmatic in Our Approach? Sports Med. 2013, 43, 655–663. [Google Scholar] [CrossRef]
- Carling, C.; Bradley, P.; McCall, A.; Dupont, G. Match-to-match variability in high-speed running activity in a professional soccer team. J. Sports Sci. 2016, 34, 2215–2223. [Google Scholar] [CrossRef] [PubMed]
- Lovell, R.; Abt, G. Individualization of Time–Motion Analysis: A Case-Cohort Example. Int. J. Sports Physiol. Perform. 2013, 8, 456–458. [Google Scholar] [CrossRef] [PubMed]
- Mackenzie, R.; Cushion, C. Performance analysis in football: A critical review and implications for future research. J. Sports Sci. 2013, 31, 639–676. [Google Scholar] [CrossRef] [PubMed]
- Higham, D.G.; Hopkins, W.G.; Pyne, D.B.; Anson, J.M. Performance indicators related to points scoring and winning in international rugby sevens. J. Sports Sci. Med. 2014, 13, 358–364. [Google Scholar] [PubMed]
- O’Donoghue, P. Research Methods for Sports Performance Analysis; Routledge: London, UK, 2010. [Google Scholar] [CrossRef]
- Rivilla-García, J.; Calvo, L.C.; Jiménez-Rubio, S.; Paredes-Hernández, V.; Muñoz, A.; Van den Tillaar, R.; Navandar, A. Characteristics of very high intensity runs of soccer players in relation to their playing position and playing half in the 2013–2014 Spanish La Liga season. J. Hum. Kinet. 2019, in press. [Google Scholar] [CrossRef]
- Bradley, P.S.; Carling, C.; Archer, D.; Roberts, J.; Dodds, A.; Di Mascio, M.; Paul, D.; Diaz, A.G.; Peart, D.; Krustrup, P. The effect of playing formation on high-intensity running and technical profiles in English Premier League soccer matches. J. Sports Sci. 2011, 29, 821–830. [Google Scholar] [CrossRef] [PubMed]
- Cohen, J. Statistical Power Analysis for the Behavioral Sciences; Earlbaum Associates: Hillsdale, MI, USA, 1988. [Google Scholar] [CrossRef]
- Di Salvo, V.; Gregson, W.; Atkinson, G.; Tordoff, P.; Drust, B. Analysis of high intensity activity in premier league soccer. Int. J. Sports Med. 2009, 30, 205–212. [Google Scholar] [CrossRef] [PubMed]
- Rampinini, E.; Impellizzeri, F.M.; Castagna, C.; Coutts, A.J.; Wisloff, U. Technical performance during soccer matches of the Italian Serie A league: Effect of fatigue and competitive level. J. Sci. Med. Sport 2009, 12, 227–233. [Google Scholar] [CrossRef] [PubMed]
- Torreño, N.; Munguia-lzquierdo, D.; Coutts, A.; Saez de Villarreal, E.; Asian-Clemente, J.; Suarez-Arrones, L. Relationship Between External and Internal Loads of Professional Soccer Players During Full Matches in Official Games Using Global Positioning Systems and Heart-Rate Technology. Int. J. Sports Physiol. Perform. 2016, 11, 940–946. [Google Scholar] [CrossRef] [PubMed]
- Rampinini, E.; Coutts, A.J.; Castagna, C.; Sassi, R.; Impellizzeri, F.M. Variation in top level soccer match performance. Int. J. Sports Med. 2007, 28, 1018–1024. [Google Scholar] [CrossRef] [PubMed]
- Ballesta Castells, C.; García Romero, J.; Fernández García, J.C.; Alvero Cruz, J.R. Current methods of Soccer Match Analysis. Rev. Int. Med. Cienc. Act. Física Deporte 2015, 15, 785–803. [Google Scholar]
- Hopkins, W.G.; Marshall, S.W.; Batterham, A.M.; Hanin, J. Progressive statistics for studies in sports medicine and exercise science. Med. Sci. Sports Exerc. 2009, 41, 3–13. [Google Scholar] [CrossRef] [PubMed]
- Faude, O.; Koch, T.; Meyer, T. Straight sprinting is the most frequent action in goal situations in professional football. J. Sports Sci. 2012, 30, 625–631. [Google Scholar] [CrossRef] [PubMed]


| Classifications of the Teams | |||||
|---|---|---|---|---|---|
| Variable | CL | EL | UMT | LMT | R |
| Total distance | 10,137 ± 1407 U, MH, R | 10,509 ± 983 | 10,643 ± 980 | 10,323 ± 100 MH | 10,442 ± 971 |
| Relative distance | 108 ± 16 U, MH, R | 112 ± 11 | 113 ± 11 | 110 ± 11 MH | 111 ± 11 |
| Distance >14 km·h−1 | 2411 ± 745 MH | 2505 ± 637 | 2643 ± 669 | 2415 ± 622 MH | 2478 ± 622 |
| Distance 14–21 km·h−1 | 1928 ± 624 U, MH | 2026 ± 540 | 2154 ± 577 | 1970 ± 529 MH | 2013 ± 543 MH |
| Distance <14 km·h−1 | 7726 ± 898 * | 8005 ± 565 | 8000 ± 551 | 7908 ± 561 | 7958 ± 569 |
| Distance >21 km·h−1 | 483 ± 229 | 478 ± 205 | 489 ± 207 | 445 ± 187 | 464 ± 193 |
| Distance >24 km·h−1 | 238 ± 146 | 232 ± 137 | 232 ± 133 | 211 ± 123 | 223 ± 125 |
| Distance in possession | 3674 ± 890 | 3704 ± 792 | 3732 ± 837 | 3620 ± 813 | 3663 ± 776 |
| Out Possession >14 km·h−1 | 1080 ± 509 MH | 1109 ± 493 | 1172 ± 475 | 1078 ± 491 MH | 1101 ± 478 |
| Out Possession >21 km·h−1 | 225 ± 153 | 221 ± 150 | 231 ± 147 | 206 ± 137 | 220 ± 142 |
| Out Possession >24 km·h−1 | 111 ± 98 | 108 ± 91 | 111 ± 88 | 98 ± 81 | 107 ± 85 |
| Distance without possession | 3919 ± 963 U, MH | 4134 ± 861 | 4132 ± 839 | 3870 ± 843 U, MH | 4048 ± 856 |
| In Possession >14 km·h−1 | 1174 ± 537 U, MH | 1224 ± 498 | 1297 ± 508 | 1162 ± 513 U, MH | 1207 ± 503 |
| In Possession >21 km·h−1 | 250 ± 170 | 247 ± 159 | 249 ± 153 | 229 ± 148 | 235 ± 146 |
| In Possession >24 km·h−1 | 123 ± 105 | 121 ± 101 | 119 ± 93 | 110 ± 90 C | 113 ± 89 |
| Comparison between Groups | ||||||||||||||||||||
|---|---|---|---|---|---|---|---|---|---|---|---|---|---|---|---|---|---|---|---|---|
| CL vs. EL | CL vs. UMT | CL vs. LMT | CL vs. R | EL vs. UMT | EL vs. LMT | EL vs. R | UMT vs. LMT | UMT vs. R | LMT vs. R | |||||||||||
| Variable | ES | p | ES | p | ES | p | ES | p | ES | p | ES | p | ES | p | ES | p | ES | p | ES | p |
| Total Distance | 0.3 | 0.00 | 0.4 | 0.00 | 0.0 | 0.00 | 0.3 | 0.00 | 0.1 | 0.00 | −0.2 | 0.00 | −0.1 | 0.25 | −0.4 | 0.00 | −0.3 | 0.00 | 0.1 | 0.01 |
| Relative distance | 0.3 | 0.00 | 0.4 | 0.00 | 0.2 | 0.00 | 0.2 | 0.00 | 0.1 | 0.00 | −0.3 | 0.00 | −0.1 | 0.07 | −0.3 | 0.00 | −0.2 | 0.00 | 0.1 | 0.02 |
| In Possession | 0.3 | 0.00 | 0.3 | 0.00 | 0.0 | 0.93 | 0.2 | 0.00 | 0.0 | 0.88 | −0.3 | 0.00 | −0.1 | 0.06 | −0.3 | 0.00 | −0.1 | 0.02 | 0.2 | 0.00 |
| Without Possession | 0.1 | 0.08 | 0.1 | 0.02 | 0.0 | 0.59 | 0.0 | 0.39 | 0.0 | 0.73 | −0.1 | 0.01 | −0.1 | 0.34 | −0.1 | 0.00 | −0.1 | 0.16 | 0.0 | 0.12 |
| Distance >14 km·h−1 | 0.2 | 0.00 | 0.3 | 0.00 | 0.1 | 0.00 | 0.2 | 0.00 | 0.2 | 0.00 | −0.1 | 0.09 | 0.0 | 0.75 | 0.2 | 0.00 | 0.0 | 0.75 | 0.1 | 0.01 |
| Distance 14–21 km·h−1 | 0.2 | 0.00 | 0.4 | 0.00 | 0.2 | 0.00 | 0.2 | 0.00 | 0.2 | 0.00 | −0.1 | 0.03 | 0.0 | 0.82 | −0.3 | 0.00 | −0.2 | 0.00 | 0.1 | 0.04 |
| Distance <14 km km·h−1 | 0.4 | 0.00 | 0.4 | 0.00 | 0.3 | 0.00 | 0.3 | 0.00 | 0.0 | 0.92 | −0.2 | 0.00 | −0.1 | 0.13 | −0.2 | 0.00 | −0.1 | 0.10 | 0.1 | 0.05 |
| Distance >21 km·h−1 | 0.0 | 0.40 | 0.1 | 0.03 | 0.1 | 0.15 | 0.0 | 0.63 | 0.1 | 0.21 | −0.1 | 0.01 | 0.0 | 0.66 | −0.2 | 0.00 | −0.1 | 0.06 | 0.1 | 0.02 |
| Distance >24 km·h−1 | 0.0 | 0.37 | 0.0 | 0.37 | −0.2 | 0.00 | −0.1 | 0.10 | 0.0 | 0.90 | −0.1 | 0.01 | 0.0 | 0.50 | −0.1 | 0.00 | 0.0 | 0.38 | 0.1 | 0.09 |
| Out Possession >14 km·h−1 | 0.1 | 0.00 | 0.3 | 0.00 | 0.1 | 0.08 | 0.1 | 0.00 | 0.1 | 0.00 | −0.1 | 0.11 | 0.0 | 0.84 | −0.3 | 0.00 | −0.2 | 0.01 | 0.1 | 0.17 |
| Out Possession >21 km·h−1 | 0.0 | 0.84 | 0.1 | 0.18 | −0.1 | 0.25 | 0.0 | 0.74 | 0.1 | 0.31 | −0.1 | 0.21 | 0.0 | 0.90 | −0.1 | 0.00 | 0.0 | 0.37 | 0.1 | 0.16 |
| Out Possession >24 km·h−1 | 0.0 | 0.99 | 0.1 | 0.16 | −0.1 | 0.10 | 0.0 | 0.83 | 0.1 | 0.22 | −0.1 | 0.15 | 0.0 | 0.85 | 0.1 | 0.24 | 0.0 | 0.85 | 0.1 | 0.11 |
| In Possession >14 km·h−1 | 0.2 | 0.00 | 0.3 | 0.00 | 0.1 | 0.21 | 0.1 | 0.00 | 0.1 | 0.02 | −0.3 | 0.00 | 0.0 | 0.38 | −0.3 | 0.00 | −0.2 | 0.00 | 0.1 | 0.03 |
| In Possession >21 km·h−1 | 0.0 | 0.74 | 0.0 | 0.91 | −0.1 | 0.03 | −0.1 | 0.16 | −0.1 | 0.80 | −0.1 | 0.02 | −0.1 | 0.10 | −0.1 | 0.01 | −0.1 | 0.12 | 0.0 | 0.66 |
| In Possession >24 km·h−1 | 0.0 | 0.64 | 0.1 | 0.20 | −0.1 | 0.00 | −0.1 | 0.35 | 0.0 | 0.48 | −0.1 | 0.01 | 0.0 | 0.66 | −0.1 | 0.04 | 0.0 | 0.82 | 0.1 | 0.04 |
© 2019 by the authors. Licensee MDPI, Basel, Switzerland. This article is an open access article distributed under the terms and conditions of the Creative Commons Attribution (CC BY) license (http://creativecommons.org/licenses/by/4.0/).
Share and Cite
Asian Clemente, J.A.; Requena, B.; Jukic, I.; Nayler, J.; Hernández, A.S.; Carling, C. Is Physical Performance a Differentiating Element between More or Less Successful Football Teams? Sports 2019, 7, 216. https://doi.org/10.3390/sports7100216
Asian Clemente JA, Requena B, Jukic I, Nayler J, Hernández AS, Carling C. Is Physical Performance a Differentiating Element between More or Less Successful Football Teams? Sports. 2019; 7(10):216. https://doi.org/10.3390/sports7100216
Chicago/Turabian StyleAsian Clemente, Jose Antonio, Bernardo Requena, Igor Jukic, Jack Nayler, Alfredo Santalla Hernández, and Christopher Carling. 2019. "Is Physical Performance a Differentiating Element between More or Less Successful Football Teams?" Sports 7, no. 10: 216. https://doi.org/10.3390/sports7100216
APA StyleAsian Clemente, J. A., Requena, B., Jukic, I., Nayler, J., Hernández, A. S., & Carling, C. (2019). Is Physical Performance a Differentiating Element between More or Less Successful Football Teams? Sports, 7(10), 216. https://doi.org/10.3390/sports7100216