Article

The Genome-Wide DNA Methylation Profile of Peripheral Blood Is Not Systematically Changed by Short-Time Storage at Room Temperature

by
Nicklas Heine Staunstrup
1,2,3,4,*,
Anna Starnawska
1,3,4,
Mette Nyegaard
1,3,
Anders Lade Nielsen
1,3,
Anders Dupont Børglum
1,3,4 and
Ole Mors
2,3,5
1
Department of Biomedicine, Aarhus University, 8000 Aarhus C, Denmark
2
Translational Neuropsychiatric Unit, Aarhus University Hospital, 8240 Risskov, Denmark
3
The Lundbeck Foundation Initiative for Integrative Psychiatric Research, iPSYCH, Denmark
4
Center for Integrative Sequencing, iSEQ, Aarhus University, 8000 Aarhus C, Denmark
5
Psychosis Research Unit, Aarhus University Hospital, 8240 Risskov, Denmark
*
Author to whom correspondence should be addressed.
Epigenomes 2017, 1(3), 23; https://doi.org/10.3390/epigenomes1030023
Submission received: 3 November 2017 / Revised: 26 November 2017 / Accepted: 5 December 2017 / Published: 15 December 2017

Abstract

:
Background: Epigenetic epidemiology has proven an important research discipline in the delineation of diseases of complex etiology. The approach, in such studies, is often to use bio-banked clinical material, however, many such samples were collected for purposes other than epigenetic studies and, thus, potentially not processed and stored appropriately. The Danish National Birth Cohort (DNBC) includes more than 100,000 peripheral and umbilical cord blood samples shipped from maternity wards by ordinary mail in EDTA tubes. While this and other similar cohorts hold great promises for DNA methylation studies the potential systematic changes prompted by storage at ambient temperatures have never been assessed on a genome-wide level. Methods and Results: In this study, matched EDTA whole blood samples were stored up to three days at room temperature prior to DNA extraction and methylated DNA immunoprecipitation coupled with deep sequencing (MeDIP-seq). We established that the quality of the MeDIP-seq libraries was high and comparable across samples; and that the methylation profiles did not change systematically during the short-time storage at room temperature. Conclusion: The global DNA methylation profile is stable in whole blood samples stored for up to three days at room temperature in EDTA tubes making genome-wide methylation studies on such material feasible.

1. Introduction

DNA methylation plays a pivotal role in gene regulation and genome stability and has been implicated in numerous conditions when altered at critical genomic loci [1,2,3]. DNA methylation predominately occurs at cytosine-guanine dinucleotides (CpG) and profiling hereof in clinical peripheral blood (PB) samples has helped uncover disease-associated changes also for conditions manifested in tissue other than PB, i.e., cancer, heart disease, and mental disorders [1,4,5,6]. However, careful analysis is required when processing DNA methylation data, as the methylation status at CpGs is sensitive to environmental exposures such as pharmaceuticals and smoking, but also changes as a function of age [7,8,9,10]. Often larger DNA methylation studies are performed retrospectively on bio-banked material where the initial purpose of collection has been other than epigenetic studies. In such cases, samples may not have been processed immediately after collection. Nevertheless, others and we have previously shown that prolonged storage of dried blood spots at room temperature had little influence on the methylation profile [11,12,13,14,15,16].
The Danish National Birth Cohort (DNBC) comprises, amongst others, hundred thousand maternal PB samples collected at maternity wards around the country and shipped to the State Serum Institute by ordinary mail. Hence, the PB has been at ambient temperatures for up to three days before processing. Inadequate handling and storage of blood samples can have detrimental effects on quality and quantity of extracted DNA [17,18]. Also, the integrity of RNA and protein can be affected by storage temperature [19,20,21]. Given that the dynamic nature of epigenetic regulation allows for an acute response to extracellular stimuli such as exercise, stress and nutrition factors [22,23,24], it is plausible that specific epigenetic changes can occur in blood cells ex vivo.
In line with this, we here have interrogated the DNA methylome at a genome-wide scale in PB either processed immediately after retrieval or following storage at room temperature (RT) for up to three days.

2. Results

2.1. High Quality Sequencing Data Generated from Time Points up to Three Days

Blood samples collected from five volunteers were equally divided into four tubes and stored at room temperature (RT) for zero, one, two or three days (Figure 1).
Assessment of the extracted DNA showed that yield and quality were comparable at all time points (Figure S1, Table S1). Based on the degree of methylated DNA enrichment by methylated DNA immunoprecipitation (MeDIP), individuals 1, 3, 4 and 5 were selected for sequencing. Sample individual 5 day 3 (Ind5_T3), however, failed the library post-amplification QC and was removed from the sample-set. All sequenced samples generated high quality reads with most Phred scores >30 along the 100 bp read. Clean reads were aligned to the human genome (hg38) using the Burrows-Wheeler aligner (BWA) algorithm and filtered using quality-associated attributes. The filtering resulted in a final dataset of 40–60 million reads per library. Pre-analytical checks included a search for copy number variations (CNVs) (Figure S2), as a potential CNV could lead to false positive read density differences. Taking non-CpG containing reads into account for this analysis no CNVs larger than 1 Mb were detected in any of the samples. Compared to the input all samples displayed the expected enrichment of base coverage in library size normalized 180 bp windows (Figure S3). This enrichment is expected since CpG densities are non-uniformly distributed along the genome, producing coverage peaks in the enriched library. Calculation of CpG enrichment—the ratio between observed/expected CpG content in the MeDIP library and the reference genome—supported the notion of CpG enriched libraries (scores above 1) (Table S2). Furthermore, the global distribution of reads visualized as the sum of reads in the lowest covered percentile of the genome to the highest followed similar trajectories in all samples indicating that the samples could be compared without normalization (Figure S4). Taken together, the analyses indicate that no major technical differences exist between the 15 obtained MeDIP-seq datasets.
A pair-wise correlation using all mapped reads in 500 bp windows displayed Spearman’s correlation coefficients between 0.78 and 0.94 among the enriched libraries (Figure 2). Moreover, a clear distinction to the input was observed. On a global level, inter-individual correlation within blood samples is anticipated to be high (>0.8; Pearson’s correlation coefficients) even without correction for variables such as sex, age and cell composition [11,25,26,27,28,29]. Yet, if no variable affects the methylation profile, the matched samples from each individual are expected to cluster. An unsupervised hierarchical clustering did not suggest a general origin or storage dependent subdivision although the three samples from individual 5 clustered together (Figure 2).
In line with this, a principle component analysis showed that the first and second component explained only 14% and 8% of the common variation, respectively (Figure 3A). This seems to fit with the notion that variance explained by individual is minor to the variance explained by tissue [30].
Also, here no overall stratification based on origin or storage time was apparent, whereas the second component could capture sex specific variation. Notably, the higher similarity between T3 and T0, than between T3 and T1 is arguing against a progressive change in methylation over time. A different approach to sliding windows of fixed size is to allow for data defined generation of contigs of variable size based on read enrichment. Based on all samples the contigs defined stratified the samples by individual as displayed by the second and third principal component (PC) (Figure 3B). The first PC explained 39% of the variance and stratified the samples based on sex.

2.2. No Storage-Dependent Change in Canonical Methylation Patterns

The read count calculated in 500 bp genomic windows showed that all samples performed well, with a slightly larger spread in Ind1_T1 and Ind1_T2 (Figure S5). One conserved methylation pattern is a general absence of methylation in CpG islands (CGIs). Visualizing the mean read count in 500 bp genomic windows overlapping intergenic or intragenic CGIs (±2 kb) revealed the canonical pattern of an increase in methylation in the shore region proximate to the CGI and the steep decrease in methylation across the CGI (Figure S6A,B) as expected. Displaying the variance at CGI regions in a Box-Whisker plot did not indicate large methylation changes attributed to storage (Figure S7). Likewise, repetitive elements like the Alu and L1 family of Short and Long Interspersed Nuclear Elements (SINEs and LINEs), respectively, are heavily methylated in order to prevent transcription and mobility [31]. Relative read count in 500 bp genomic windows across chromosome 1 Alu elements revealed the expected pattern of hypermethylation compared to flanking regions (Figure S8A). Also, pyrosequencing of five CpGs of the AluYB8 subtype did not suggest a time dependent loss of methylation (Figure S8B–F). The coefficient of variance (COV) based on all technical triplicates from all individuals at each time point did not differ notably with time also arguing against a storage-time depending increase in variation. We also analysed the global methylation level across L1 repeats interrogating three CpGs (Figure S9). As for AluYB8, the COV for L1 varied only marginally. The difference in mean methylation comparing T0 and T3 was a decrease of 1.6%, 6.5%, and 2.2% at CpG1, CpG2, and CpG3, respectively, of which none were significant (t-test, p > 0.15).

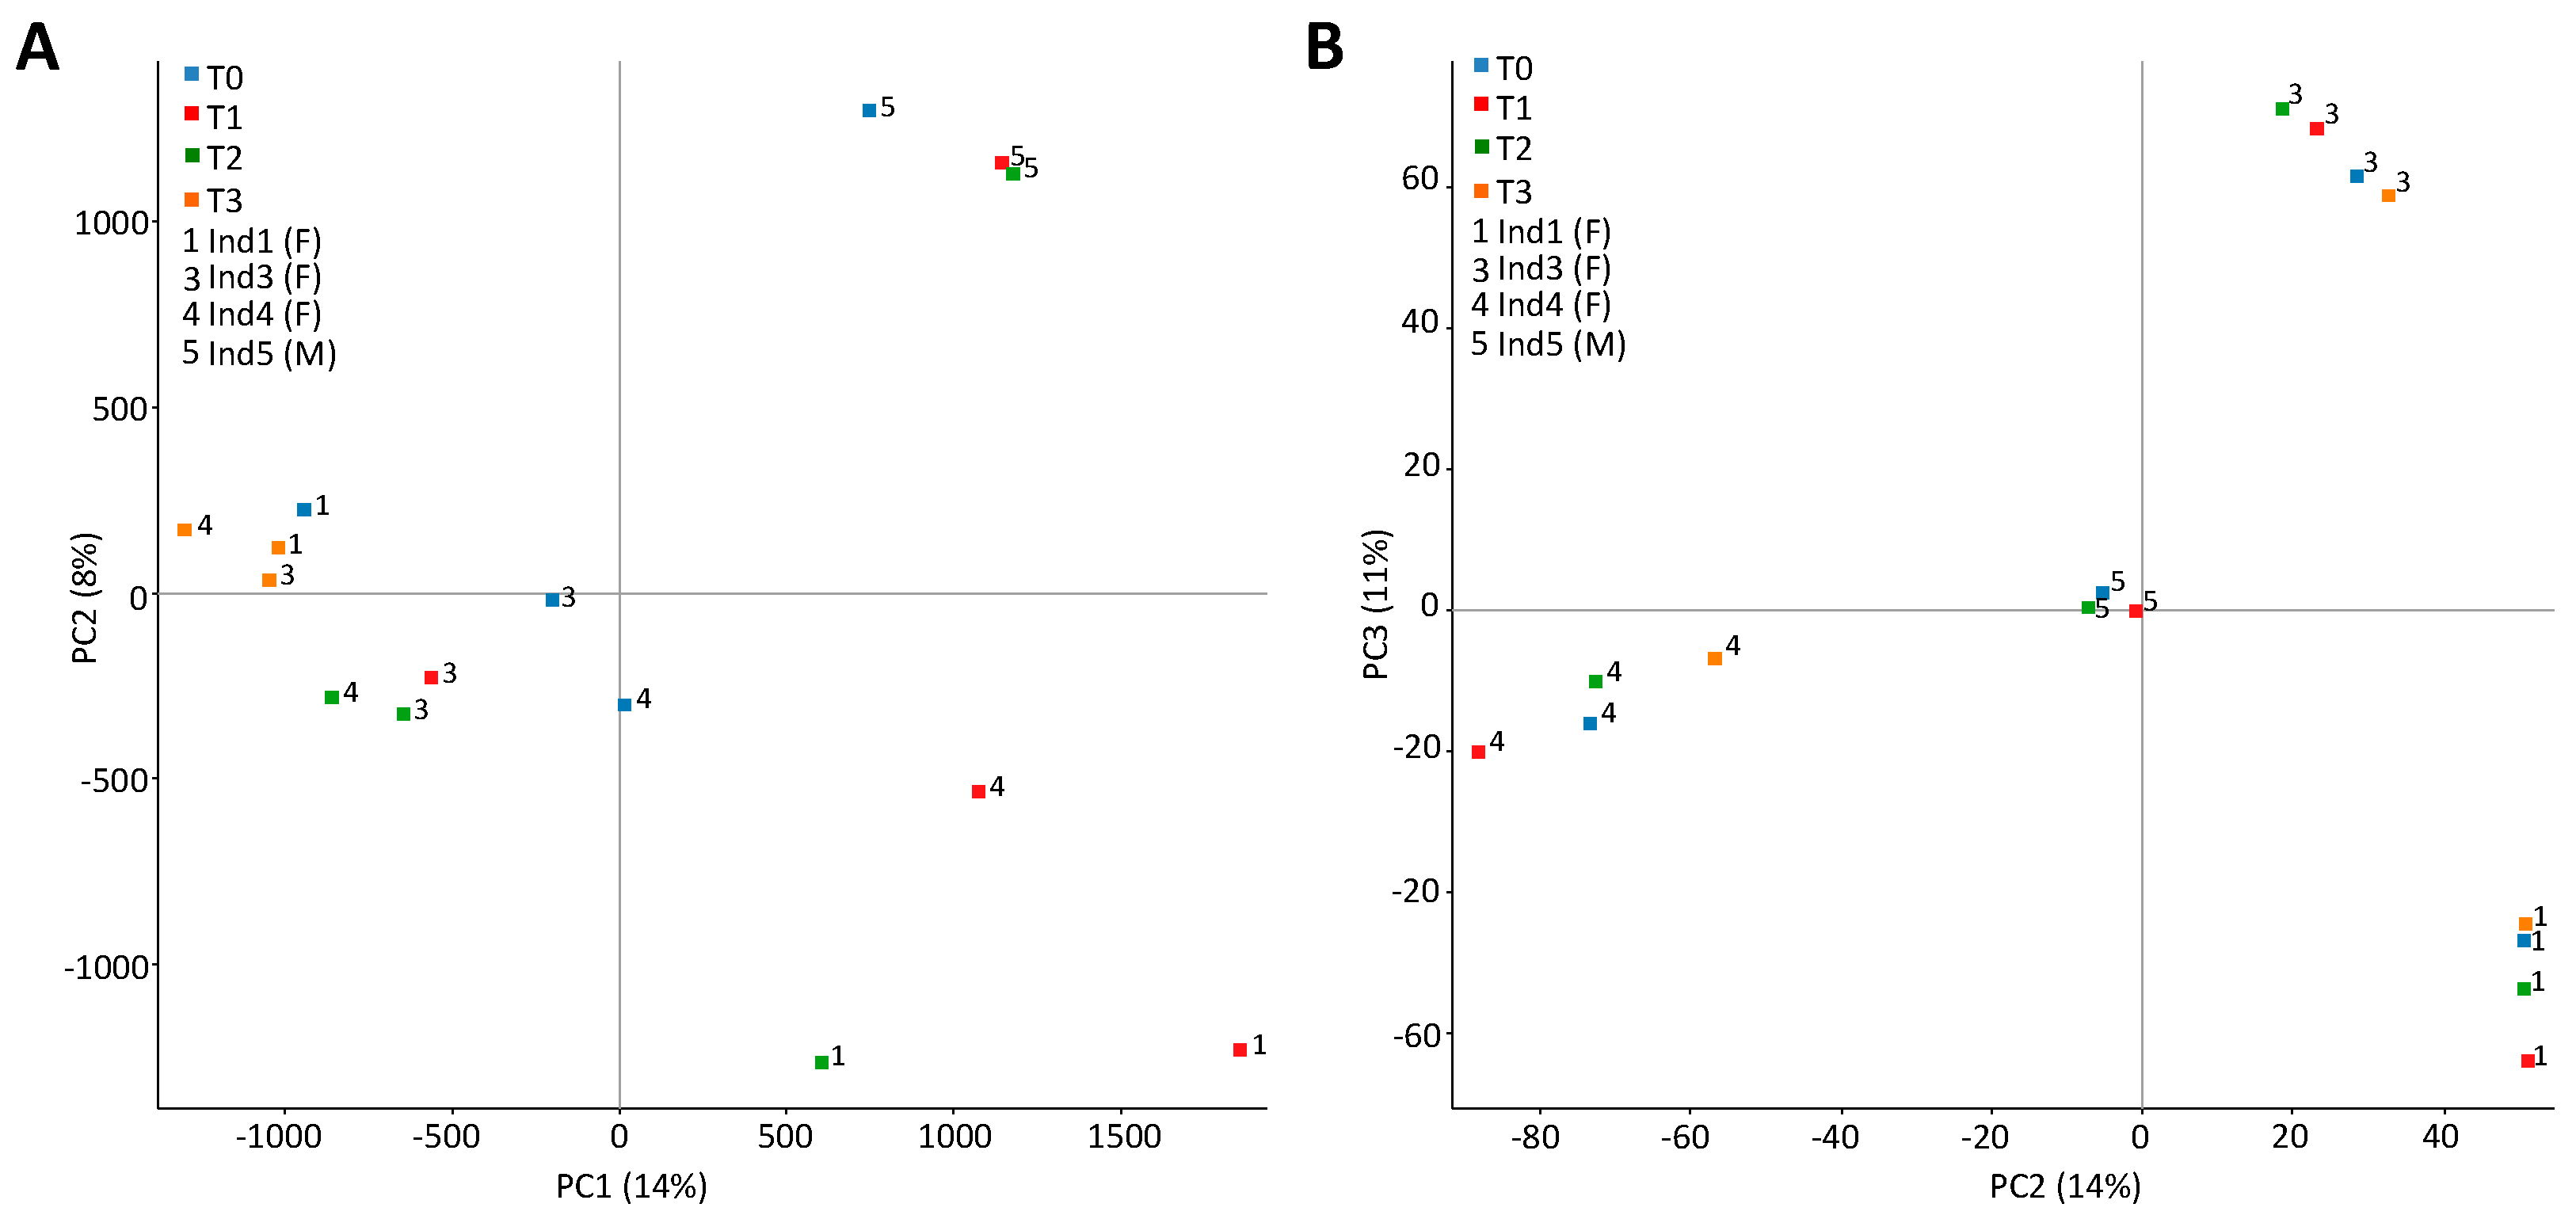
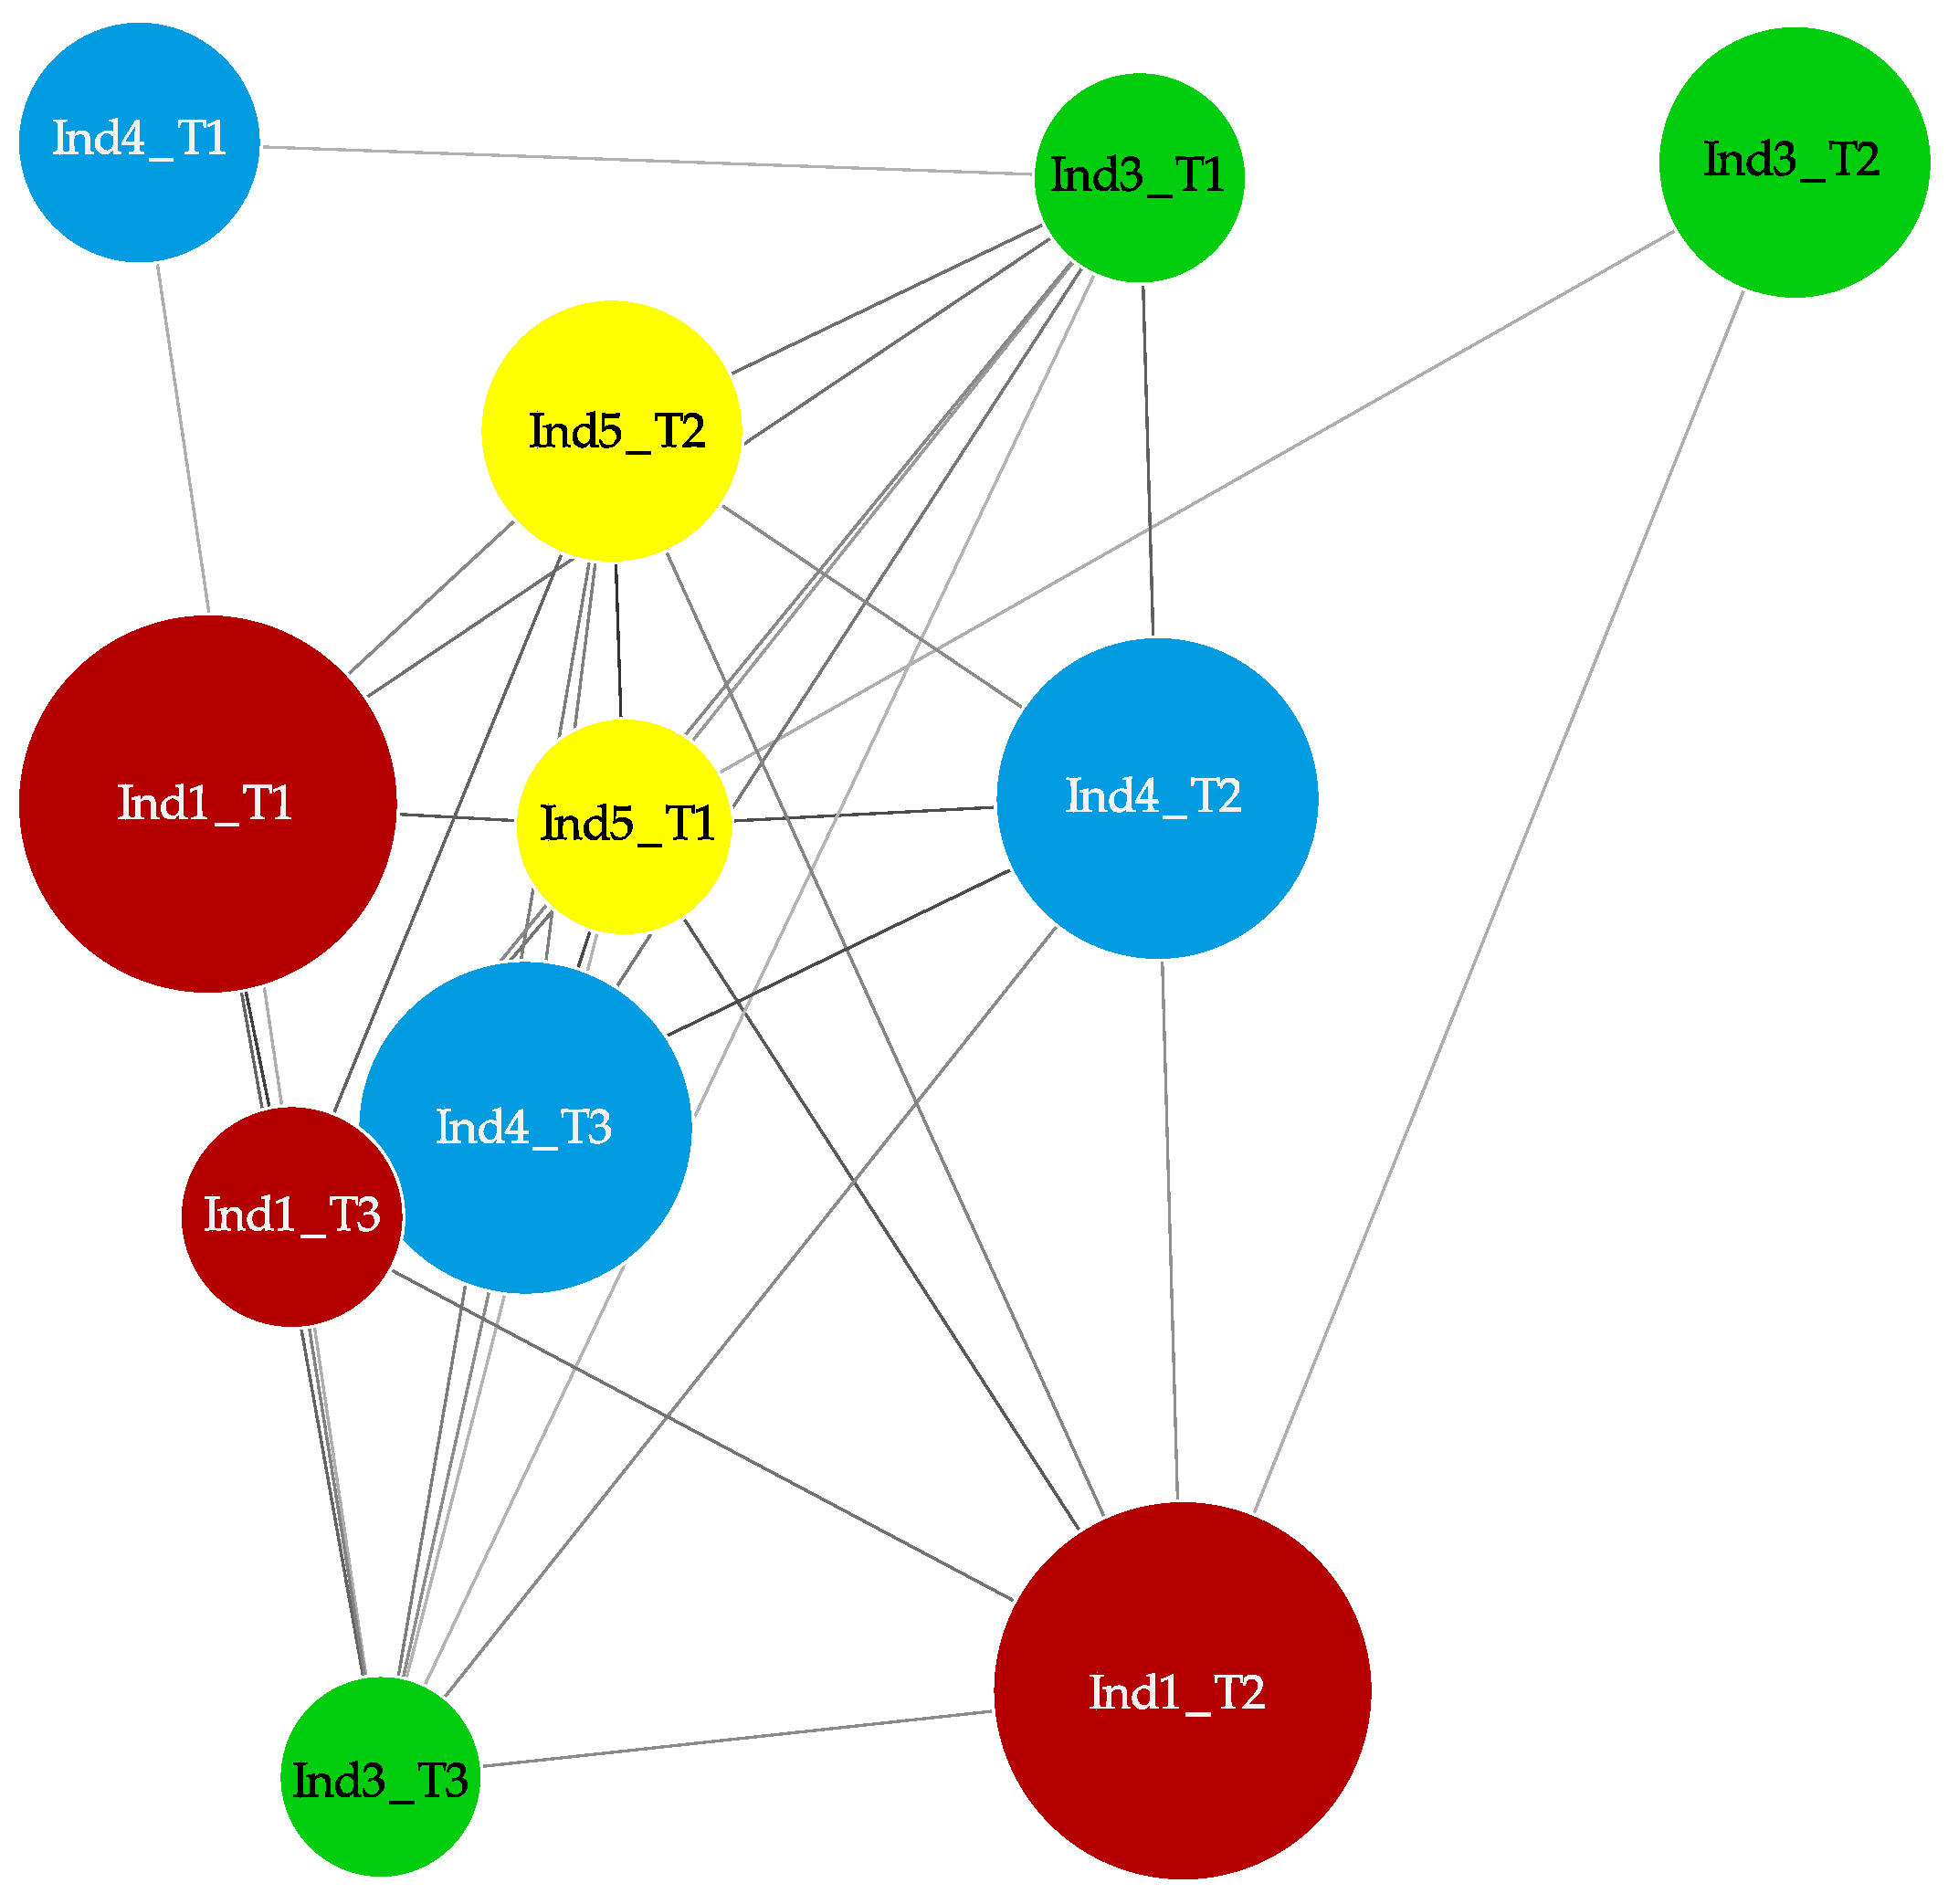
2.3. Stochastic Variation between Time-Points and No Differently Methylated Regions between Groups

With the intent to evaluate if loci-specific changes in methylation patterns are associated with storage at ambient temperature, we looked for differently methylated regions (DMRs) between the grouped individuals as well as between pairwise matched individuals at all time-points (Figure S10). Even with a liberal false discovery rate (FDR)-corrected (Benjamini-Hochberg) threshold of <0.2 no DMRs were present comparing groups. In the pairwise comparison the number of DMRs using the same statistical approach but with a FDR-corrected threshold of <0.05 ranged from 32 to 10118 (Table S3). Plotting the pairwise DMRs in a 2D map, where proximity is based on the proportion of co-occurrence, indicated very low overlap and no apparent clustering based on the individual or storage-time (Figure 4).
In order to look for trends across the pairwise DMRs, normalized read counts of each DMR was displayed in a line graph as a function of time (Figure S11). The actual read count difference in DMRs overlapping inter-individually (bottom panel) or temporally (right panel) was small (left y-axis) compared to the mean (right y-axis). Furthermore, many DMRs had non-linear trajectories indicating that these are likely artifacts or stochastic effects. Calculating the CpG density of the MeDIP libraries and DMRs, showed that the DMRs were enriched in CpG rich regions (Figure 5).
Annotating the collective intra-individual DMRs (Ind_3, Ind_4, Ind_5) to genomic features and comparing it to a random set of 500 bp segments of the MeDIP libraries, showed that there was an enrichment in satellite repeats (p < 0.01, Fishers exact test), which was driven by a CpG rich (CpG density of 0.08) 15 kb region on chromosome 16 (16q11.2) (Figure S12). No enrichment was found in promoter regions or gene bodies.
As a stress response may be evoked in ex vivo blood cells, we looked specifically for DNA methylation changes in a stress and toxicity related gene set (Figure S13). With a threshold of FDR <0.2 a single DMR was found at T1, one at T2, and six at T3. The actual difference in read count, however, was subtle and the trajectories across time inconsistent.

3. Discussion

With an increasing epidemiological interest in the link between environmental exposures, epigenetic changes and health outcomes, the number of studies investigating DNA methylation in clinical samples is increasing. Immediate extraction of DNA from clinical samples is, however, not always feasible due to a lack of human or technical resources at the site of collection. Moreover, sample degradation and ex vivo mediated effects due to improper storage may influence subsequent quantitative molecular analyses [32]. Previous studies examining whole blood stored for twelve months at RT in a DNA-protecting solution [17] or placenta tissue stored for two days at RT [33] identified no major DNA methylation changes. Moreover, the feasibility of genome-wide DNA methylation studies using DNA from post-mortem brains [34], as well as archived dried blood spots has also been described before [15,35,36]. To our knowledge this is the first report of a genome-wide interrogation of the DNA methylome in matched whole blood samples stored at RT.
All analyzed methylation-enriched samples displayed the expected read density patterns at, e.g., CGIs, L1, and Alu elements. Inter-individual variation in blood methylation was observed to be relatively small, and a group-wise comparison did not return epigenome-wide significant DMRs even at a very relaxed FDR threshold. These results seem to fit and confirm previous findings on room temperature stored EDTA-stabilized blood [17]. Furthermore, analysis of samples where reads were clumped into data generated contigs, showed that the largest variation was explained by sex followed by individual of origin. This finding also argues against systematic introduction of methylation changes as a consequence of short-term storage at room temperature.
Methylation levels of the repeat elements SINE and LINE are often used as a surrogate measure for whole-genome methylation levels. We addressed AluYB8 and L1 methylation by both MeDIP and pyrosequencing. Both analyses identified no significant systematic changes in methylation levels over time. Again, this is in accordance with previous studies examining potential DNA methylation changes in placenta tissue and whole blood in response to storage-time [17,21,33].
Intra-individual pairwise comparisons can bypass the confounding effects of genetic variation and blood cell composition. However, there was little overlap between the intra-individually identified DMRs (FDR < 0.05) and the actual difference in read count was limited, being in the range of ±0.4 compared to a mean above 10 on a log 2 scale. However, in general the DMRs were enriched for a high CpG density and in particular for a juxtacentromeric 15 kb satellite repeat containing region on chromosome 16. A previous inter-individual comparison based on MeDIP-seq in monocytes found differences to be highly enriched in repetitive elements and especially in satellite repeat sequences [37], suggesting that these sites are more prone to epigenetic drift. However, our data does not indicate that any broad-scale changes occur at repetitive elements within three days storage at room temperature.
Acute cellular stress has been shown to alter DNA methylation patterns at genes involved in stress response [38]. Gene-specific examinations of promoter regions and gene-bodies of 22 genes involved in stress and toxicity pathways including DNA damage, hypoxia signaling and growth arrest, did not reveal any change in the DNA methylation pattern over time. Furthermore, the changes in read count at T3 are small compared to the mean (<0.2 vs. 10.5 log 2) and likely arise as a consequence of lower sample size and variance.
In conclusion, we find that storage of whole blood at RT for up to three days has no influence on MeDIP-seq quality. Moreover, DNA methylation patterns appear intact with, if any, only minor stochastic changes at CpG rich regions. Thus, making DNA methylation epidemiological studies based on bio-banked blood samples not processed immediately after collection valid.

4. Materials and Methods

4.1. Blood Samples

Peripheral blood was collected and divided into four EthyleneDiamineTetraacetic Acid (EDTA) tubes (BD Vacutainer, BD-Plymouth, UK) from five adult individuals. From one tube per individual DNA was extracted immediately after collection and stored at −20 °C. Sequential DNA extraction was performed and stored at −20 °C on tubes kept one day, two days and three days at room temperature. Genomic DNA was extracted using Maxwell (Promega, Fitchburg, WI, USA). Concentration and quality of the extracted genomic DNA (gDNA) was measured using the Nanodrop 1000 instrument (Thermo Scientific, Waltham, MA, USA).

4.2. MeDIP-seq

Extracted gDNA was sonicated in a Pico Bioruptor (Diagenode, Seraing, Belgium) at 10 ng/μL for 13 cycles of ‘30 s on–30 s off’ to a mean fragment size of 180 bp. Fragment length distribution was assessed by microelectrophoresis using the Qiaxcel instrument and a high-resolution gel cartridge (Qiagen, Hilden, Germany). Sonicated gDNA (555 ng) was further used for end-repair and adaptor ligation employing the NEBNext Ultra DNA Library Prep Kit for Illumina (New England Biolabs, Ipswich, MA, USA). The reaction mix was purified using Ampure XP beads (Beckman-Coulter, Brea, CA, USA) after which methylated DNA immunoprecipitation (MeDIP) was set up on the SX-8G-IP-Star Compact robot (Diagenode) according to manufacturer’s instructions applying the Auto MeDIP kit (Diagenode) and including unmethylated and methylated spike-in controls. Effectively 460 ng of adaptor-ligated DNA was used in the MeDIP procedure. Antibody incubation was performed at 4 °C for 15 h. Immunoprecipitated samples were magnetically purified on the robot using the Auto iPure v2 kit (Diagenode) according to manufacturer’s instructions. Recovery and enrichment was evaluated by qPCR using primer sets specific for the spike-in controls. Minimum criteria were set to 10% recovery and 25-fold enrichment. Based on the recovery rate samples were PCR-amplified at 9–11 cycles using multiplex oligos (New England Biolabs, MA, USA). Samples were size-selected with Ampure XP beads on the SX-8G-IP-Star Compact robot (Diagenode) using a total of 80 μL beads per sample and eluted in 25 μL DNase-free H2O. Purity and fragment length distribution was evaluated on the Qiaxcel instrument. Post-amplification enrichment was verified by qPCR using primer pairs targeting the endogenous hypermethylated promoter region of testis specific histone 2B (TSH2B) (Diagenode, cat.nr. C17011041) or the hypomethylated Transcription Start Site (TSS) of glyceraldehyde 3-phosphate dehydrogenase (GAPDH) (Diagenode, cat.nr. C17011047).

4.3. Sequencing and Bioinformatics

Samples were PE91 sequenced on two lanes on a HiSeq4000 instrument (Illumina, San Diego, CA, USA). The raw reads were cleaned using Soapnuke 1.5.0 (BGI, Shenzhen, China) applying the following filters: remove reads with adaptors, remove reads with >10% unknown reads, remove reads with >50% low quality bases (Q score < 5). Clean reads only qualify if Q20% > 85%. In the end, this generated around 53–85 million clean reads per sample.
Using the Galaxy platform [39], clean reads were groomed and aligned to the human genome (build hg38) using BWA [40]. SAM files were converted to BAM files and filtered to include only de-duplicated uniquely mapped reads with Q score > 20. BAM files were imported into R (version 3.3.2) excluding sex chromosomes using the package MEDIPS [41] (arguments; scanBamFlag: isPaired = T, isProperPair = T, hasUnmappedMate = F, isUnmappedQuery = F, isFirstMateRead = T, isSecondMateRead = F). The R packages MEDIPS, QSEA, Genomic Ranges, and Repitools were applied for pre-analytic QC and DMR identification [41,42,43]. PC analysis was done applying the prcomp function. Annotation of DMRs (hg19 lift-over) and a compiled random set to genetic features was done using EpiExplorer [44].
In SeqMonk (v0.32.1 Barbraham Institute) segments were generated by quantitation of read counts in data defined contigs of variable length displaying enrichment or in 500 bp windows (250 bp overlap) covering DMRs. Filters include subdivision based on defined features (e.g., genes and CGIs).

4.4. Pyrosequencing

Extracted gDNA from all four individuals was bisulfite-treated using the EpiTect Bisulfite Kit (Qiagen) following the manufacturer’s protocol. Bisulfite-treated DNA (100 ng) was processed for PCR and pyrosequencing on a PyroMark Q24 Advanced according to manufacturer’s protocol and data analyzed on the appertaining software (Qiagen) [45]. The analysis of AluYB8 followed a previously described procedure [46], whereas the PyroMark Q24 kit (Qiagen) was employed in the analysis of L1 following manufacturer’s instructions.

4.5. Ethics Statement

All procedures were performed in accordance with relevant regulation and approved by the Danish health research ethical committee (license no.: iPSYCH, 1-10-72-287-1).

4.6. Availability of Data and Materials

The RT-blood MeDIP-seq dataset is available upon request.

Supplementary Materials

The following are available online at www.mdpi.com/2075-4655/1/3/23/s1. Supplementary Figure S1: Capillary gel electrophoresis electropherograms. Whole blood extracted and sonicated DNA (mean length of ~180 bp) was assessed for fragment length distribution and purity. (A,B) Ind1, Ind2, Ind3, Ind4, and Ind5 (T0, T1, T2); Supplementary Figure S2: No CNV present at ≥1 Mb genomic windows in any of the samples analysed; Supplementary Figure S3: Clustered read coverage in enriched samples. Log frequency of base coverage normalized to 180 bp reads per 10 million in samples and input (Ind3_T3); Supplementary Figure S4: Global accumulated distribution of reads. Trend plot depicting the accumulated number of reads per 500 bp segment (log transformed) as a function of all segments ranging from the lowest to the highest covered percentile; Supplementary Figure S5: Comparable spread in read count among samples. Box-Whisker plot of filtered sequencing reads in 500 bp sliding genomic bins displaying the read count median, 25th and 75th percentile and 2x interquartile range of each sample; Supplementary Figure S6: Canonical methylation patterns at CGIs. Read count in 500 bp sliding genomic windows across (A) inter-genic and (B) intra-genic CGIs ± 2 kb flanking regions; Supplementary Figure S7: No increase in read count variance around CGIs. Box-Whisker plot displaying the read count median, 25th and 75th percentile and 2x interquartile range of filtered sequencing reads in 500 bp genomic windows of each sample overlapping (A) downstream (+2 kb) intergenic shores (B) intergenic CGIs (C) upstream (−2 kb) intergenic shores (D) downstream (+2 kb) intragenic shores (E) intragenic CGIs (F) upstream (−2 kb) intragenic shores; Supplementary Figure S8: No change in the global methylation status or variation of Alu elements. (A) Read count (log 2) of filtered and mapped sequencing reads overlapping (±2 kb) Alu repeats (Chr. 1). (BF) Methylation and coefficient of variance at five AluYB8 CpGs analysed by pyrosequencing at time-points T0, T1, T2, and T3; Supplementary Figure S9: L1 methylation levels and variance over time. Methylation and coefficient of variance at three L1 CpGs analysed by pyrosequencing at time-points T0, T1, T2, and T3; Supplementary Figure S10: Analytical design. (A) Samples were grouped according to storage time. Number of DMRs at FDR < 0.2 were calculated for the entire set with T0 defined as baseline or between T0 and T3. (B) Intra-individual comparison with T0 defined as baseline; Supplementary Figure S11: Mutual intra-individual or inter-individual DMRs. Line-graph of 250 bp segments overlapping pair-wise intra-individual DMRs. T0 is set as baseline. Normalized read counts in individual segments are shown as well as mean with 95% confidence interval for all segments at time-points T0, T1, T2, and T3. Trajectories of segments overlapping all pair-wise comparisons in an individual or time-point are depicted on the far right and the bottom, respectively; Supplementary Figure S12: Overrepresentation of DMRs in satellite repeats. Annotation of all DMRs from Ind_3 and Ind_4 overlapping repetitive genomic features with minimum 50% of bases compared to a concatenated random set. Supplementary Figure S13: No time-dependent methylation changes in genes related to cellular stress and toxicity. (A) Group-wise DMRs at promoter regions (2 kb upstream of TSS) or gene-body of cellular stress and toxicity related genes. Arrows indicate direction of significant change (FDR < 0.2). (B) Line-graph showing normalized read counts over promoter regions or gene-body at time-points T0, T1, T2, and T3 for the seven significantly altered loci. Green lines, unchanged; Pink line, promoter region of BNIP3 (difference at T1); blue line, gene-body region of CCDN1 (difference at T2); red lines, gene-body region of BNIP3, BRCA1, DNAJC15, MLH1, TP53, and XPC (difference at T3); Supplementary Table S1: Concentration and quality of all 16 PB extracted DNA samples; Supplementary Table S2: CpG enrichment score after MeDIP measured as the observed/expected ratio of CpGs in the MeDIP library and the reference genome; Supplementary Table S3: Number of DMRs and the mean CpG density in these for each pair-wise comparison.

Acknowledgments

We would like to thank Marit Nielsen and Tina Fuglsang Daugaard for expert technical assistance at Translational Neuropsychiatric Unit, Aarhus University Hospital and Department of Biomedicine, University of Aarhus, respectively. This work was funded by the Toyota Foundation and the Lundbeck Foundation Initiative for Integrative Psychiatric Research, iPSYCH (LuF Grant number: R155-2014-1724).

Author Contributions

Conceived and designed the experiments: N.H.S., A.B., and O.M. Performed the experiments: N.H.S. Analysed the data: N.H.S., A.L.N., M.N., and A.S. Drafted the manuscript: NHS. All authors read and approved the final manuscript.

Conflicts of Interest

The authors declare no conflict of interest.

References

  1. Baccarelli, A.; Wright, R.; Bollati, V.; Litonjua, A.; Zanobetti, A.; Tarantini, L.; Sparrow, D.; Vokonas, P.; Schwartz, J. Ischemic heart disease and stroke in relation to blood DNA methylation. Epidemiology 2010, 21, 819–828. [Google Scholar] [CrossRef] [PubMed]
  2. Lange, N.E.; Sordillo, J.; Tarantini, L.; Bollati, V.; Sparrow, D.; Vokonas, P.; Zanobetti, A.; Schwartz, J.; Baccarelli, A.; Litonjua, A.A.; et al. Alu and LINE-1 methylation and lung function in the normative ageing study. BMJ Open 2012, 2, e001231. [Google Scholar] [CrossRef] [PubMed] [Green Version]
  3. Moosavi, A.; Ardekani, A. Role of Epigenetics in Biology and Human Diseases. Iran. Biomed. J. 2016, 20, 246–258. [Google Scholar] [PubMed]
  4. Tang, Q.; Cheng, J.; Cao, X.; Surowy, H.; Burwinkel, B. Blood-based DNA methylation as biomarker for breast cancer: A systematic review. Clin. Epigenetics 2016, 8, 115. [Google Scholar] [CrossRef] [PubMed]
  5. Deneberg, S.; Grovdal, M.; Karimi, M.; Jansson, M.; Nahi, H.; Corbacioglu, A.; Gaidzik, V.; Dohner, K.; Paul, C.; Ekstrom, T.J.; et al. Gene-specific and global methylation patterns predict outcome in patients with acute myeloid leukemia. Leukemia 2010, 24, 932–941. [Google Scholar] [CrossRef] [PubMed]
  6. Darby, M.M.; Sabunciyan, S. Repetitive elements and epigenetic marks in behavior and psychiatric disease. Adv. Genet. 2014, 86, 185–252. [Google Scholar] [PubMed]
  7. Joubert, B.R.; Felix, J.F.; Yousefi, P.; Bakulski, K.M.; Just, A.C.; Breton, C.; Reese, S.E.; Markunas, C.A.; Richmond, R.C.; Xu, C.J.; et al. DNA Methylation in Newborns and Maternal Smoking in Pregnancy: Genome-wide Consortium Meta-analysis. Am. J. Hum. Genet. 2016, 98, 680–696. [Google Scholar] [CrossRef] [PubMed]
  8. Horvath, S. DNA methylation age of human tissues and cell types. Genome Biol. 2013, 14, R115. [Google Scholar] [CrossRef] [PubMed]
  9. Petkovich, D.A.; Podolskiy, D.I.; Lobanov, A.V.; Lee, S.G.; Miller, R.A.; Gladyshev, V.N. Using DNA Methylation Profiling to Evaluate Biological Age and Longevity Interventions. Cell Metab. 2017, 25, 954–960. [Google Scholar] [CrossRef] [PubMed]
  10. Csoka, A.B.; Szyf, M. Epigenetic side-effects of common pharmaceuticals: A potential new field in medicine and pharmacology. Med. Hypotheses 2009, 73, 770–780. [Google Scholar] [CrossRef] [PubMed]
  11. Staunstrup, N.H.; Starnawska, A.; Nyegaard, M.; Christiansen, L.; Nielsen, A.L.; Borglum, A.; Mors, O. Genome-wide DNA methylation profiling with MeDIP-seq using archived dried blood spots. Clin. Epigenetics 2016, 8, 81. [Google Scholar] [CrossRef] [PubMed] [Green Version]
  12. Aberg, K.A.; Xie, L.Y.; Nerella, S.; Copeland, W.E.; Costello, E.J.; van den Oord, E.J. High quality methylome-wide investigations through next-generation sequencing of DNA from a single archived dry blood spot. Epigenetics 2013, 8, 542–547. [Google Scholar] [CrossRef] [PubMed]
  13. Beyan, H.; Down, T.A.; Ramagopalan, S.V.; Uvebrant, K.; Nilsson, A.; Holland, M.L.; Gemma, C.; Giovannoni, G.; Boehm, B.O.; Ebers, G.C.; et al. Guthrie card methylomics identifies temporally stable epialleles that are present at birth in humans. Genome Res. 2012, 22, 2138–2145. [Google Scholar] [CrossRef] [PubMed]
  14. Cruickshank, M.N.; Oshlack, A.; Theda, C.; Davis, P.G.; Martino, D.; Sheehan, P.; Dai, Y.; Saffery, R.; Doyle, L.W.; Craig, J.M. Analysis of epigenetic changes in survivors of preterm birth reveals the effect of gestational age and evidence for a long term legacy. Genome Med. 2013, 5, 96. [Google Scholar] [CrossRef] [PubMed]
  15. Hollegaard, M.V.; Grauholm, J.; Norgaard-Pedersen, B.; Hougaard, D.M. DNA methylome profiling using neonatal dried blood spot samples: A proof-of-principle study. Mol. Genet. Metab. 2013, 108, 225–231. [Google Scholar] [CrossRef] [PubMed]
  16. Joo, J.E.; Wong, E.M.; Baglietto, L.; Jung, C.H.; Tsimiklis, H.; Park, D.J.; Wong, N.C.; English, D.R.; Hopper, J.L.; Severi, G.; et al. The use of DNA from archival dried blood spots with the Infinium HumanMethylation450 array. BMC Biotechnol. 2013, 13, 23. [Google Scholar] [CrossRef] [PubMed]
  17. Bulla, A.; De Witt, B.; Ammerlaan, W.; Betsou, F.; Lescuyer, P. Blood DNA Yield but Not Integrity or Methylation Is Impacted After Long-Term Storage. Biopreserv. Biobank. 2016, 14, 29–38. [Google Scholar] [CrossRef] [PubMed]
  18. Malentacchi, F.; Ciniselli, C.M.; Pazzagli, M.; Verderio, P.; Barraud, L.; Hartmann, C.C.; Pizzamiglio, S.; Weisbuch, S.; Wyrich, R.; Gelmini, S. Influence of pre-analytical procedures on genomic DNA integrity in blood samples: The SPIDIA experience. Clin. Chim. Acta 2015, 440, 205–210. [Google Scholar] [CrossRef] [PubMed]
  19. Buesa, C.; Maes, T.; Subirada, F.; Barrachina, M.; Ferrer, I. DNA chip technology in brain banks: Confronting a degrading world. J. Neuropathol. Exp. Neurol. 2004, 63, 1003–1014. [Google Scholar] [CrossRef] [PubMed]
  20. Ferrer, I.; Santpere, G.; Arzberger, T.; Bell, J.; Blanco, R.; Boluda, S.; Budka, H.; Carmona, M.; Giaccone, G.; Krebs, B.; et al. Brain protein preservation largely depends on the postmortem storage temperature: Implications for study of proteins in human neurologic diseases and management of brain banks: A BrainNet Europe Study. J. Neuropathol. Exp. Neurol. 2007, 66, 35–46. [Google Scholar] [CrossRef] [PubMed]
  21. Avila, L.; Yuen, R.K.; Diego-Alvarez, D.; Penaherrera, M.S.; Jiang, R.; Robinson, W.P. Evaluating DNA methylation and gene expression variability in the human term placenta. Placenta 2010, 31, 1070–1077. [Google Scholar] [CrossRef] [PubMed]
  22. Barres, R.; Osler, M.E.; Yan, J.; Rune, A.; Fritz, T.; Caidahl, K.; Krook, A.; Zierath, J.R. Non-CpG methylation of the PGC-1α promoter through DNMT3B controls mitochondrial density. Cell Metab. 2009, 10, 189–198. [Google Scholar] [CrossRef] [PubMed]
  23. Barres, R.; Yan, J.; Egan, B.; Treebak, J.T.; Rasmussen, M.; Fritz, T.; Caidahl, K.; Krook, A.; O'Gorman, D.J.; Zierath, J.R. Acute exercise remodels promoter methylation in human skeletal muscle. Cell Metab. 2012, 15, 405–411. [Google Scholar] [CrossRef] [PubMed]
  24. McCullumsmith, R.E.; Meador-Woodruff, J.H. Novel approaches to the study of postmortem brain in psychiatric illness: Old limitations and new challenges. Biol. Psychiatry 2011, 69, 127–133. [Google Scholar] [CrossRef] [PubMed]
  25. Bjornsson, H.T.; Sigurdsson, M.I.; Fallin, M.D.; Irizarry, R.A.; Aspelund, T.; Cui, H.; Yu, W.; Rongione, M.A.; Ekstrom, T.J.; Harris, T.B.; et al. Intra-individual change over time in DNA methylation with familial clustering. JAMA 2008, 299, 2877–2883. [Google Scholar] [CrossRef] [PubMed]
  26. Liu, J.; Morgan, M.; Hutchison, K.; Calhoun, V.D. A study of the influence of sex on genome wide methylation. PLoS ONE 2010, 5, e10028. [Google Scholar] [CrossRef] [PubMed]
  27. Jaffe, A.E.; Irizarry, R.A. Accounting for cellular heterogeneity is critical in epigenome-wide association studies. Genome Biol. 2014, 15, R31. [Google Scholar] [CrossRef] [PubMed] [Green Version]
  28. Jiang, R.; Jones, M.J.; Chen, E.; Neumann, S.M.; Fraser, H.B.; Miller, G.E.; Kobor, M.S. Discordance of DNA methylation variance between two accessible human tissues. Sci. Rep. 2015, 5, 8257. [Google Scholar] [CrossRef] [PubMed]
  29. Byun, H.M.; Siegmund, K.D.; Pan, F.; Weisenberger, D.J.; Kanel, G.; Laird, P.W.; Yang, A.S. Epigenetic profiling of somatic tissues from human autopsy specimens identifies tissue- and individual-specific DNA methylation patterns. Hum. Mol. Genet. 2009, 18, 4808–4817. [Google Scholar] [CrossRef] [PubMed]
  30. Lokk, K.; Modhukur, V.; Rajashekar, B.; Martens, K.; Magi, R.; Kolde, R.; Koltsina, M.; Nilsson, T.K.; Vilo, J.; Salumets, A.; et al. DNA methylome profiling of human tissues identifies global and tissue-specific methylation patterns. Genome Biol. 2014, 15, r54. [Google Scholar] [CrossRef] [PubMed]
  31. Solyom, S.; Kazazian, H.H., Jr. Mobile elements in the human genome: Implications for disease. Genome Med. 2012, 4, 12. [Google Scholar] [CrossRef] [PubMed]
  32. Ferrer, I.; Martinez, A.; Boluda, S.; Parchi, P.; Barrachina, M. Brain banks: Benefits, limitations and cautions concerning the use of post-mortem brain tissue for molecular studies. Cell Tissue Bank. 2008, 9, 181–194. [Google Scholar] [CrossRef] [PubMed]
  33. Vilahur, N.; Baccarelli, A.A.; Bustamante, M.; Agramunt, S.; Byun, H.M.; Fernandez, M.F.; Sunyer, J.; Estivill, X. Storage conditions and stability of global DNA methylation in placental tissue. Epigenomics 2013, 5, 341–348. [Google Scholar] [CrossRef] [PubMed]
  34. Wockner, L.F.; Noble, E.P.; Lawford, B.R.; Young, R.M.; Morris, C.P.; Whitehall, V.L.; Voisey, J. Genome-wide DNA methylation analysis of human brain tissue from schizophrenia patients. Transl. Psychiatry 2014, 4, e339. [Google Scholar] [CrossRef] [PubMed] [Green Version]
  35. Sen, A.; Heredia, N.; Senut, M.C.; Hess, M.; Land, S.; Qu, W.; Hollacher, K.; Dereski, M.O.; Ruden, D.M. Early life lead exposure causes gender-specific changes in the DNA methylation profile of DNA extracted from dried blood spots. Epigenomics 2015, 7, 379–393. [Google Scholar] [CrossRef] [PubMed]
  36. Dugue, P.A.; English, D.R.; MacInnis, R.J.; Jung, C.H.; Bassett, J.K.; FitzGerald, L.M.; Wong, E.M.; Joo, J.E.; Hopper, J.L.; Southey, M.C.; et al. Reliability of DNA methylation measures from dried blood spots and mononuclear cells using the HumanMethylation450k BeadArray. Sci. Rep. 2016, 6, 30317. [Google Scholar] [CrossRef] [PubMed]
  37. Shen, H.; Qiu, C.; Li, J.; Tian, Q.; Deng, H.W. Characterization of the DNA methylome and its interindividual variation in human peripheral blood monocytes. Epigenomics 2013, 5, 255–269. [Google Scholar] [CrossRef] [PubMed]
  38. Antwih, D.A.; Gabbara, K.M.; Lancaster, W.D.; Ruden, D.M.; Zielske, S.P. Radiation-induced epigenetic DNA methylation modification of radiation-response pathways. Epigenetics 2013, 8, 839–848. [Google Scholar] [CrossRef] [PubMed]
  39. Afgan, E.; Baker, D.; van den Beek, M.; Blankenberg, D.; Bouvier, D.; Cech, M.; Chilton, J.; Clements, D.; Coraor, N.; Eberhard, C.; et al. The Galaxy platform for accessible, reproducible and collaborative biomedical analyses: 2016 update. Nucleic Acids Res. 2016, 44, W3–W10. [Google Scholar] [CrossRef] [PubMed]
  40. Li, H.; Durbin, R. Fast and accurate short read alignment with Burrows-Wheeler transform. Bioinformatics 2009, 25, 1754–1760. [Google Scholar] [CrossRef] [PubMed]
  41. Lienhard, M.; Grimm, C.; Morkel, M.; Herwig, R.; Chavez, L. MEDIPS: Genome-wide differential coverage analysis of sequencing data derived from DNA enrichment experiments. Bioinformatics 2014, 30, 284–286. [Google Scholar] [CrossRef] [PubMed]
  42. Statham, A.L.; Strbenac, D.; Coolen, M.W.; Stirzaker, C.; Clark, S.J.; Robinson, M.D. Repitools: An R package for the analysis of enrichment-based epigenomic data. Bioinformatics 2010, 26, 1662–1663. [Google Scholar] [CrossRef] [PubMed]
  43. Lienhard, M.; Grasse, S.; Rolff, J.; Frese, S.; Schirmer, U.; Becker, M.; Borno, S.; Timmermann, B.; Chavez, L.; Sultmann, H.; et al. QSEA-modelling of genome-wide DNA methylation from sequencing enrichment experiments. Nucleic Acids Res. 2017, 45, e44. [Google Scholar] [CrossRef] [PubMed]
  44. Halachev, K.; Bast, H.; Albrecht, F.; Lengauer, T.; Bock, C. EpiExplorer: Live exploration and global analysis of large epigenomic datasets. Genome Biol. 2012, 13, R96. [Google Scholar] [CrossRef] [PubMed]
  45. Fa, S.; Larsen, T.V.; Bilde, K.; Daugaard, T.F.; Ernst, E.H.; Olesen, R.H.; Mamsen, L.S.; Ernst, E.; Larsen, A.; Nielsen, A.L. Assessment of global DNA methylation in the first trimester fetal tissues exposed to maternal cigarette smoking. Clin. Epigenetics 2016, 8, 128. [Google Scholar] [CrossRef] [PubMed]
  46. Choi, S.H.; Worswick, S.; Byun, H.M.; Shear, T.; Soussa, J.C.; Wolff, E.M.; Douer, D.; Garcia-Manero, G.; Liang, G.; Yang, A.S. Changes in DNA methylation of tandem DNA repeats are different from interspersed repeats in cancer. Int. J. Cancer 2009, 125, 723–729. [Google Scholar] [CrossRef] [PubMed]
Figure 1. Study design. Peripheral blood was collected from five individuals in parallel, after which genomic DNA was either immediately extracted (T0) or following a storage period at room temperature of one (T1), two (T2) or three days(T3). RT; room temperature.
Epigenomes 01 00023 g001
Figure 2. Correlation heatmap. Clustering of the analyzed samples based on the pair-wise Spearman´s correlation coefficient. Color gradient; continues correlation scale ranging from no (dark red) to perfect correlation (dark blue).
Epigenomes 01 00023 g002
Figure 3. Principal component analysis (PCA) plot. (A) PCA plot of first and second principal component based on all reads in sliding windows of fixed size. (B) PCA plot of second and third principal component based on all reads in data defined contigs.
Epigenomes 01 00023 g003
Figure 4. Overlap between pair-wise differently methylated regions (DMRs). Unsupervised clustering of pair-wise DMRs based on overlap. Sphere size is proportional to number of DMRs and proximity an indicator of overlap.
Epigenomes 01 00023 g004
Figure 5. DMRs enriched for high cytosine-guanine dinucleotides (CpG) density and satellite repeats. Box-Whisker plot depicting CpG density in the pair-wise DMRs compared to the methylated DNA immunoprecipitation (MeDIP) libraries.
Epigenomes 01 00023 g005

