Production and Tribological Characterization of Tailored Laser-Induced Surface 3D Microtextures


1
V-Research GmbH, Stadtstrasse 33, 6850 Dornbirn, Austria
2
Research Center for Microtechnology, Vorarlberg University of Applied Sciences, Hochschulstrasse 1, 6850 Dornbirn, Austria
*
Authors to whom correspondence should be addressed.
Lubricants 2019, 7(8), 67; https://doi.org/10.3390/lubricants7080067
Submission received: 28 June 2019
/
Revised: 31 July 2019
/
Accepted: 1 August 2019
/
Published: 6 August 2019
(This article belongs to the Special Issue Laser-Induced Periodic Surface Nano- and Microstructures for Tribological Applications)
Abstract
:The aim of the present study was firstly to determine the manufacturing feasibility of a specific surface 3D-microtexturing on steel through an ultra-short pulsed laser, and secondly to investigate the tribological properties under 2 different lubrication conditions: oil-lubricated and antifriction coated. The selected 3D-microtexture consisted of 2 different levels of quadratic micropillars having side dimensions of approximately 45 µm, heights of about 35 µm and periods of 80 µm. It was shown that the production of specific 3D-microtextures on steel substrates using an ultra-short pulsed laser was feasible, and that the reproducibility of the texture dimensions over the entire textured region was extremely good. Frictional investigations have shown that, in comparison to the benchmark (untextured samples), the 3D-microtextured samples do not induce any significant improvements in the coefficient of friction (COF) under oil-lubricated conditions, but that under antifriction coated conditions, significant improvements in the friction coefficients may be achieved. Wear-based tribological tests have shown that the antifriction coating on benchmark samples was completely depleted, which greatly influenced their friction and wear behavior, since steel-steel contact occurred during testing. For the 3D-microtexture, the antifriction coating was also partially depleted; however, it accumulated itself in the microtexture which acted as a potential lubricant reservoir.
1. Introduction
Achieving greater productivity at lower costs represents a significant challenge for the modern manufacturing industry. In this endeavor, new advanced materials and surface technologies are needed in order to enhance the efficiency of mechanical systems and reduce their energy consumption, which may be achieved through a reduction of the friction and wear of tribological contacts. This reduction of the tribological properties may be obtained through several different approaches, such as modification of the component’s geometry, application of hard protective coatings, optimizing surface roughness and/or topography [1,2,3,4,5] or by the introduction of specific surface textures, which play a major role in lubrication, level of friction and the wear rates of tribological systems. Surface microtexturing has established itself over the last few years as a very promising approach to reduce friction in different materials in various lubricated applications [6,7,8,9,10,11,12,13,14,15,16,17,18].
Over recent years, a diverse array of manufacturing processes has been developed for the production of surface microtextures, such as mechanical micromachining, chemical etching or laser ablation, to name a few. All these industrial surface microtexturing processes show advantages or disadvantages. The latter process (laser ablation) was selected and used to produce the desired specific 3D microtexture to be investigated in the present study. The investigations consisted of producing, characterizing and tribologically testing the specific 3D microtexture.
Contour shaping, surface patterning and surface functionalization by femtosecond laser ablation (FLA) are becoming fundamental technologies in fields like tribology, microfluidic transport, fuel cells and medicine. Self-ordered hierarchical micro- and nano- structures can be generated on the majority of metals, semiconductors and dielectrics. Laser-induced periodic surface structures (LIPSSs) are significantly involved in the formation of such self-ordered microstructures and pinholes. LIPSSs have been attracting research interest for decades, but their formation is still not fully understood. The latest on the LIPSS formation mechanism and its potential deployment in tribological applications is outlined in [19]. However, the main interests of the authors are focused on a usable technology for contour shaping and surface patterning for specific tribological applications. In order to obtain the desired surface structure or surface quality, the understanding and handling of any feedback mechanisms occurring during the production of LIPSS, self-ordered microstructures or contour shaping is essential. The present authors recently focused themselves on the fabrication of membranes (based on AlGaN/GaN hetero-structure layers grown on 4H–SiC) for sensor fabrication. Feedback effects, which occur between small surface distortions and the slot waveguide function of LIPSS in SiC, were found to promote the formation of micropores in the membranes. To cope with this unwanted and challenging effect, the present authors developed a polarization steering procedure which interrupted the feedback loop and terminated the growth cycle of pinholes [20,21]. In the present study on steel samples, a similar pinhole formation phenomenon at locations where LIPSSs were interrupted by distortions was also observed. Such distortions can be triggered by the scanning laser beam itself, side wall irregularities at the laser generated cube structures, inhomogeneities inside the metal grain, laser generated debris particles or self-ordered bumps. In the current experiments, it is demonstrated that, among all the laser parameters contributing to the formation of such distortions, the most effective parameter is the orientation of the laser polarization with respect to the scan direction, which may suppress or promote the formation of self-ordered bumps and pinholes.
Tribological tests under lubricated conditions and also with an antifriction coating using the aforementioned 3D microtexture along with untextured (benchmark) samples were undertaken to evaluate the effectiveness of reducing the overall friction by decreasing the nominal contact areas through surface microtexturing.
2. Materials and Methods
2.1. Samples Geometry and Dimensions
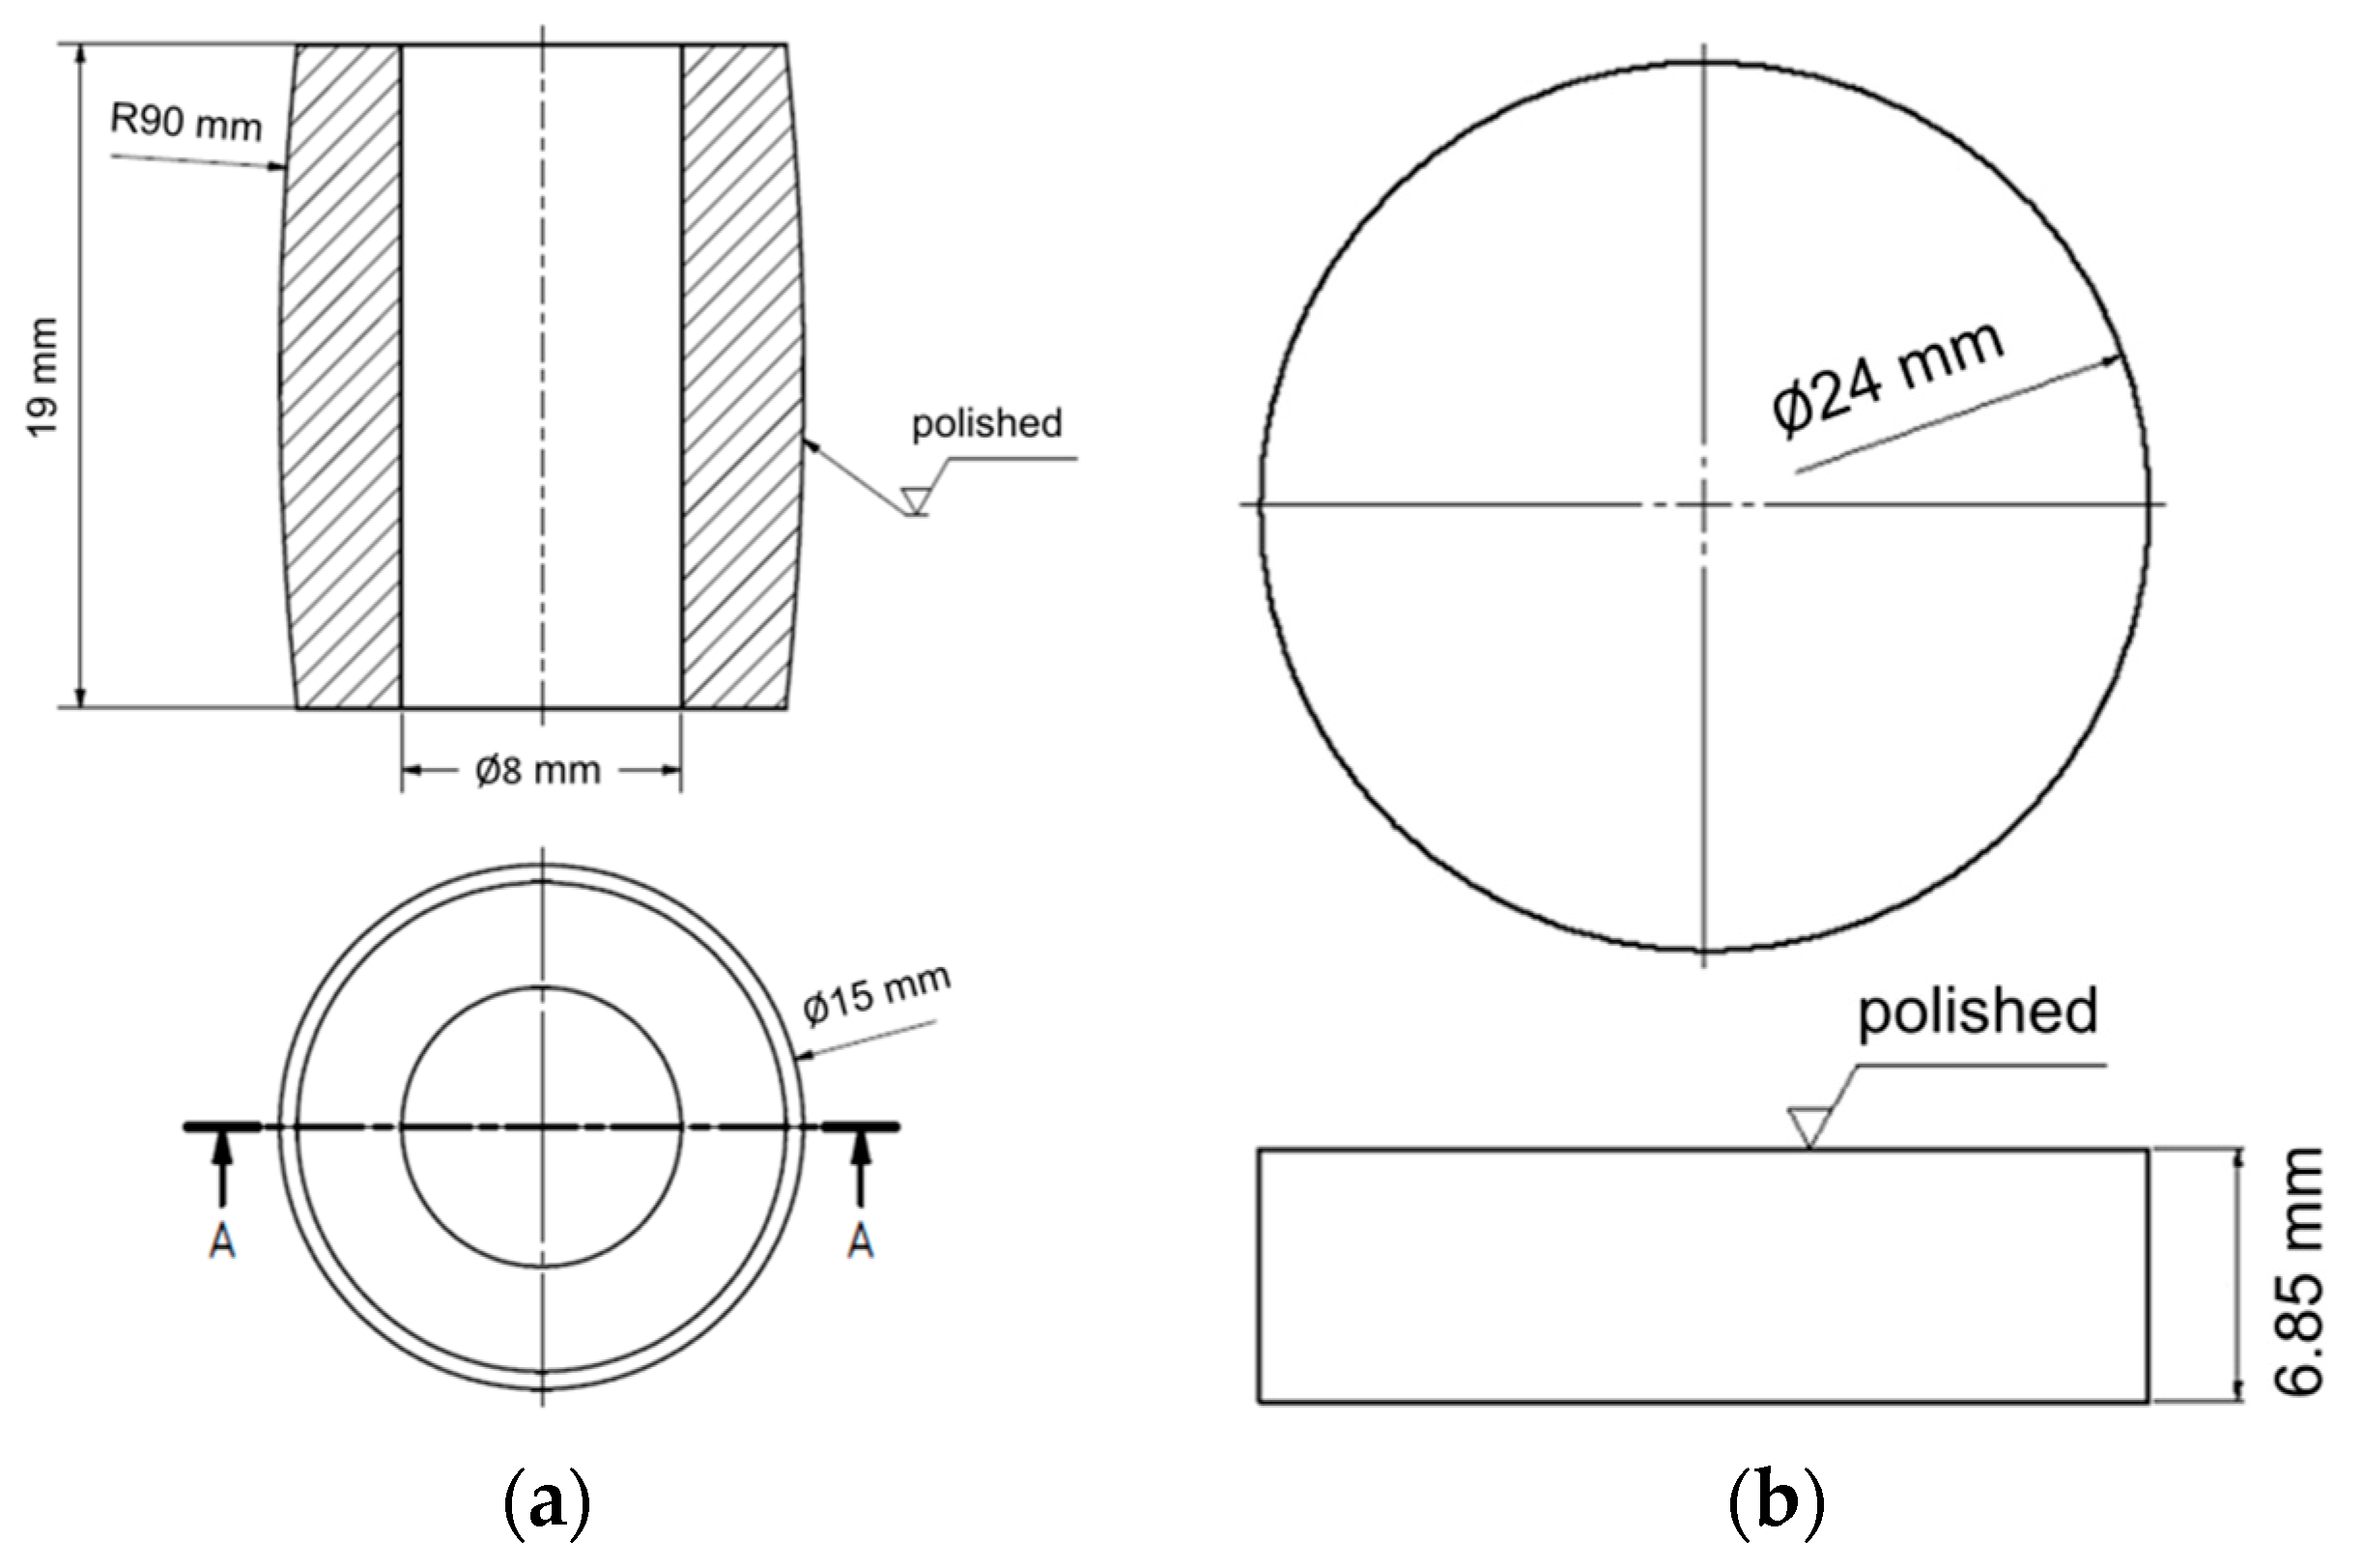
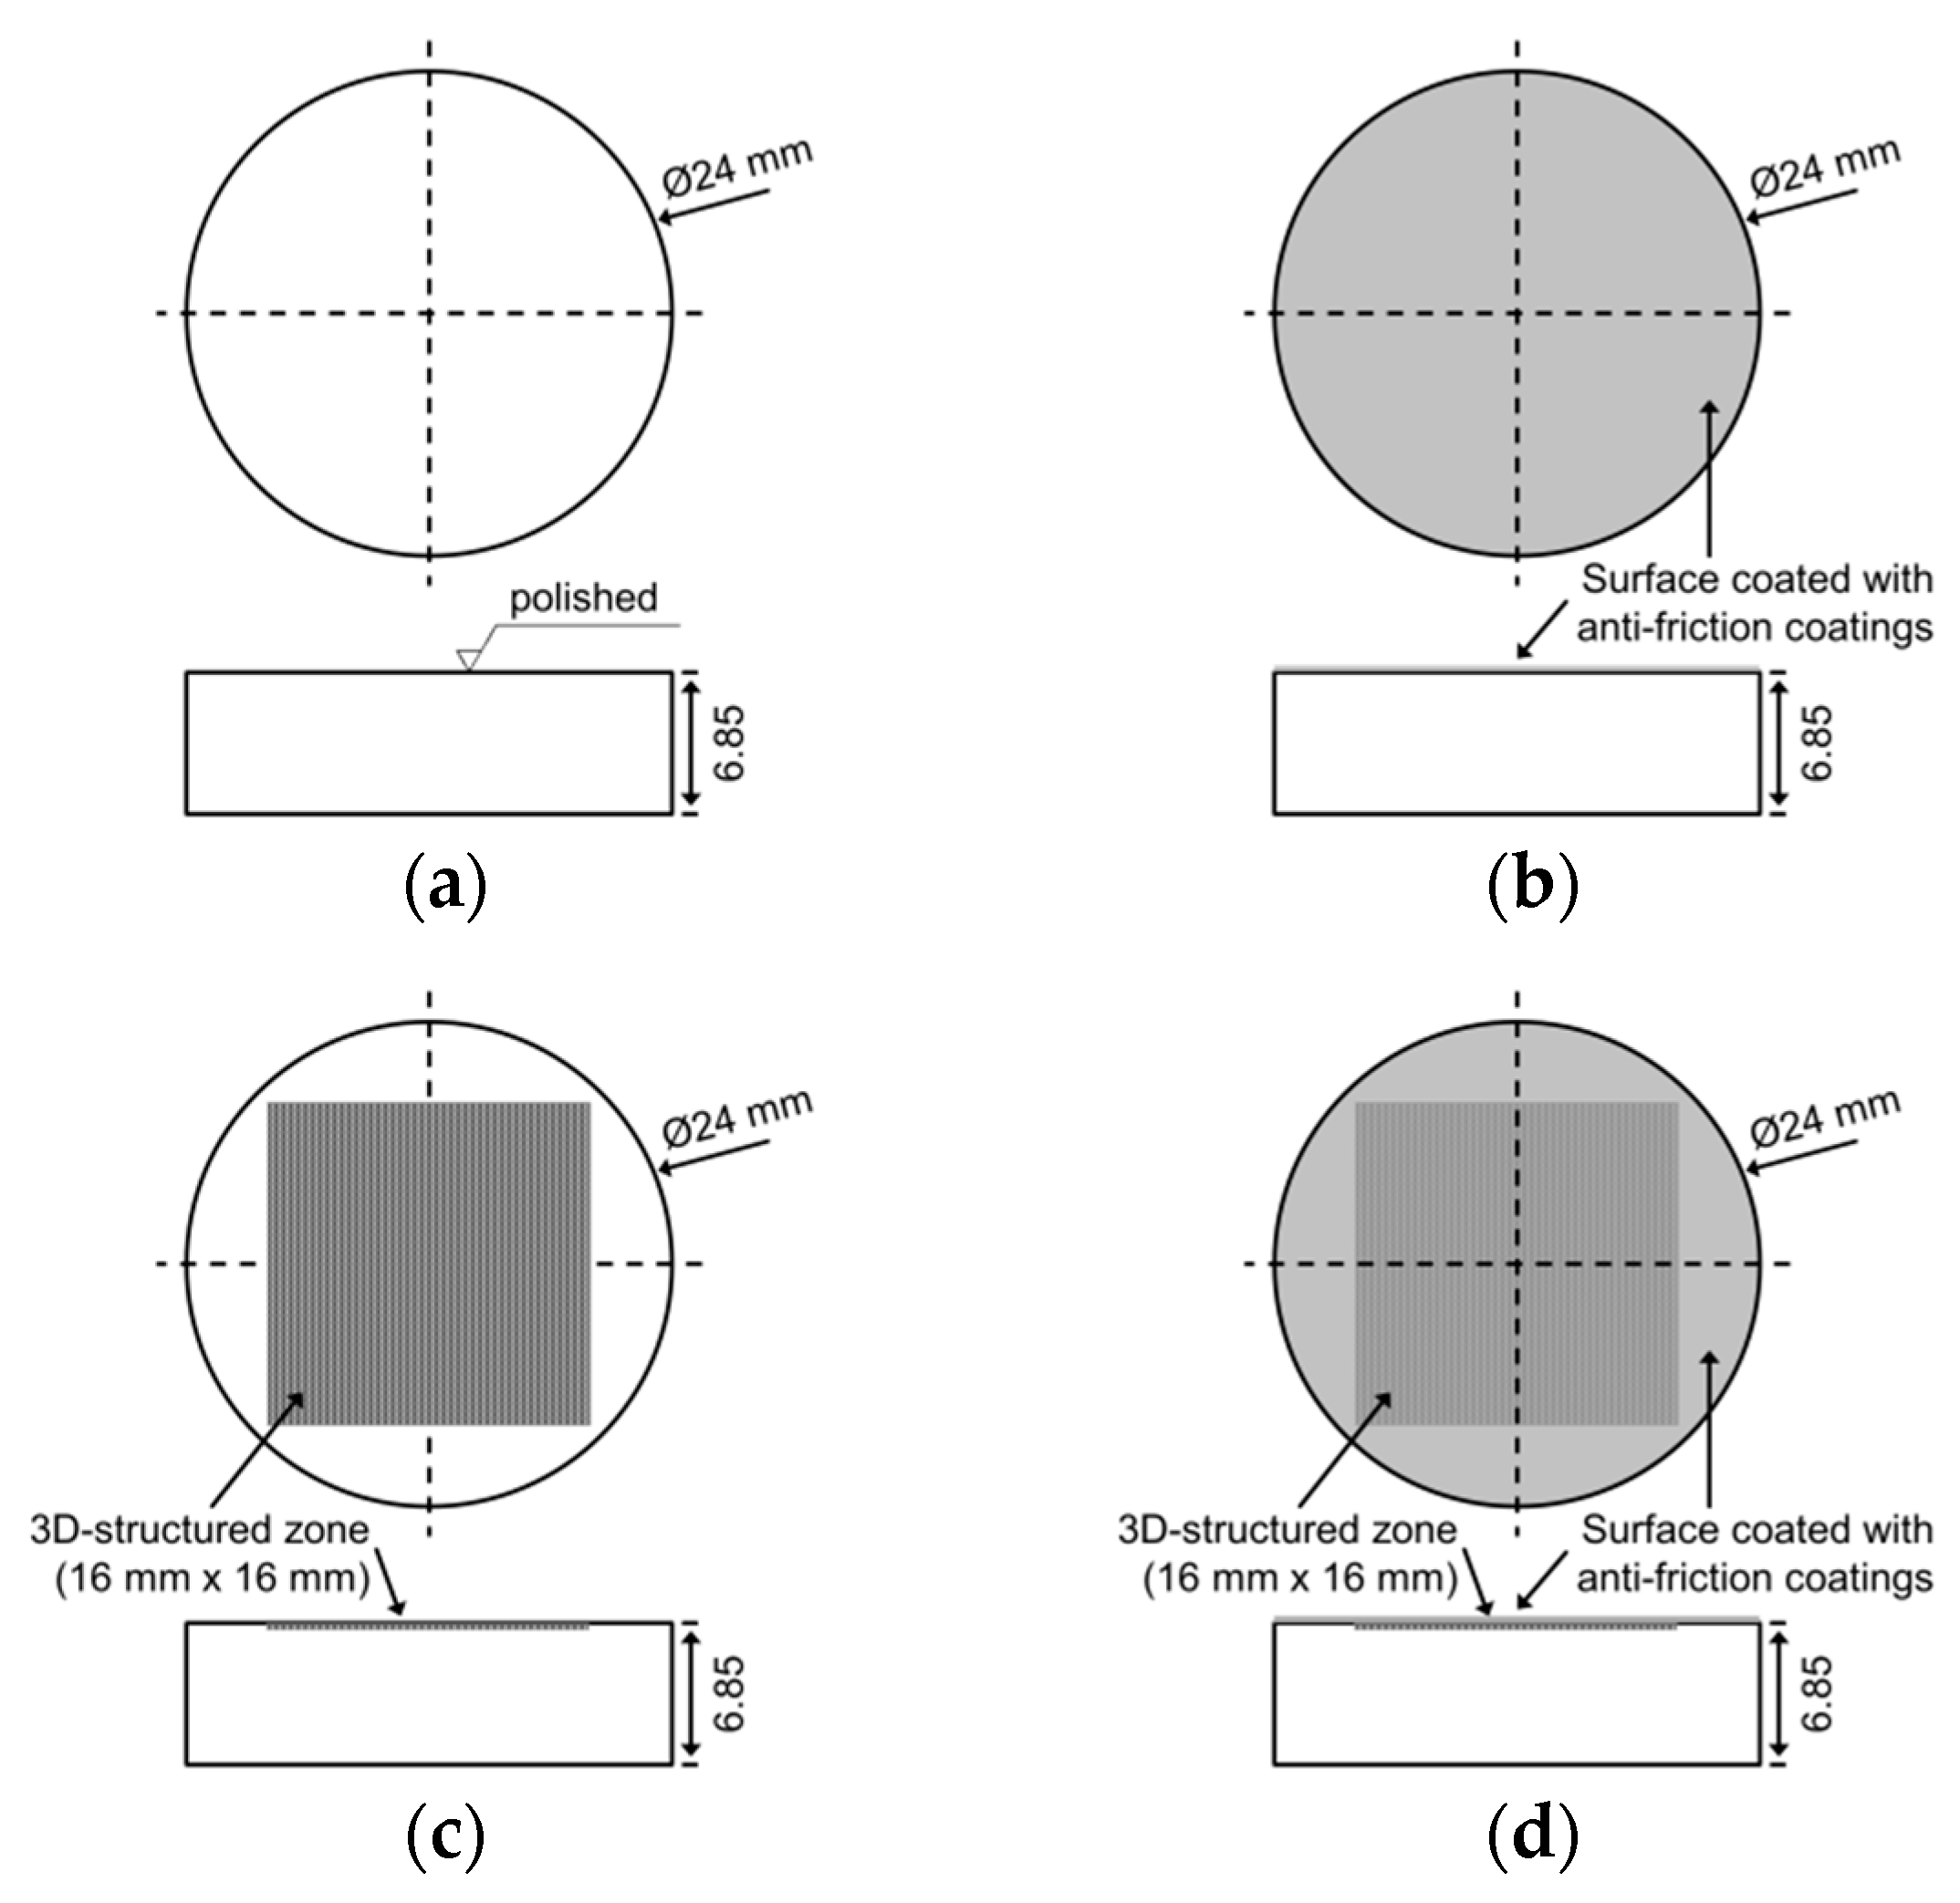
For the present tribological investigations, the upper specimen consisted of a convex cylinder made of hardened 31CrMoV9 (around 700HV), while the lower specimen consisted of a disc made of hardened 42CrMo4 (around 650HV; hardness values were measured with a hardness tester from EMCO-TEST Prüfmaschinen GmbH, Kuchl, Austria) whose dimensions are shown schematically in Figure 1. For all tribological tests performed, cylinders were used as received, but disc specimens were further treated in order to evaluate the effect of a 3D surface texturing. Furthermore, the influence of an antifriction coating was also studied for the present manuscript. The four different disc specimen surface states investigated in the present work are shown schematically in Figure 2. The as-received convex cylinders had surface roughness values of Ra = 0.12 ± 0.01 µm and Rz = 1.68 ± 0.38 µm, and the benchmark disc samples had surface roughness values of Ra = 0.06 ± 0.01 µm and Rz = 0.65 ± 0.19 µm.
The antifriction coating used was applied on one side of the previously cleaned discs (blank or surface microtextured) through the coating manufacturer (Carl Bechem GmbH, Hagen, Germany). The thickness of the antifriction coating ranged between 15 and 20 µm. The choice of this coating was based on the fact that it should be especially designed for a reduction of the friction coefficient (AF320E). Some details on the antifriction coating used in the present study are listed in Table 1.
Disc specimens were 3D surface microtextured using a femtosecond laser; the procedure used will be explained in detail later. It is worth noting that only a small central quadratic region (16 mm × 16 mm) of one side of the disc specimens was actually microtextured as shown in Figure 2c. This 3D microtexture was chosen based on previously performed tribological investigations, in which the influence of a reduction of the effective nominal contact area through the production of microridges on elastomer pads was analyzed and reported [22]. The very promising results obtained from the aforementioned studies led the authors to produce, characterize and evaluate a further optimized surface microtexture in the present study, which consisted of a combination of 2 microridged textures perpendicular to each other, as schematically shown by the red arrows in Figure 3. Again, based on the results of previous studies [7,22], the desired dimensions of the plateaus of the 3D microtexture should range between 40 and 50 µm for the sides, between 30 and 40 µm for the height, and about 80 µm for the period in both horizontal and vertical directions. With these desired dimensions for the uppermost plateaus (which define the contact area), a calculated ratio of approximately 20% for the nominal contact area of the 3D-textures samples in comparison to the untextured (benchmark) specimens may be obtained (benchmark: nominal contact area of 100%, without taking into account its surface roughness).
All specimen surfaces were characterized using a non-contact laser optical surface roughness measuring apparatus (VK-X250/260, Keyence International NV/SA, Mechelen, Belgium). The surface roughness values of the convex cylinders and benchmark disc specimens (without and with coating) were evaluated. Furthermore, the characteristics of the 3D microtexture (without and with coating), such as side dimensions, heights and periods of the different plateaus, to name a few, were measured and reported as average values.
2.2. Production of 3D-Microtexture through Laser Ablation
For the production of the desired cube-shaped 3D microtexture, a laser work station (microSTRUCTvario, 3D-MICROMAC, Chemnitz, Germany) in combination with a femtosecond laser (SPIRIT, Spectra Physics, Rankweil, Austria) were used. The laser delivered 350 fs pulses at 200 kHz with an average output power of 4 W at a wavelength of 1040 nm and 1.6 W at 520 nm. The laser beam was linearly polarized and the polarization direction could be flipped by 90° during the ablation process. To focus the laser beam, a telecentric scanner optic (Linos F-Theta Ronar, QIOPTIQ Photonics GmbH & Co. KG, Feldkirchen, Germany) with a focal length of 100 mm providing a focus spot radius of 6 µm for the 520 nm wavelength was used. For all test samples, a scan speed of 1000 mm/sec and a hatch distance of 5 µm were used.
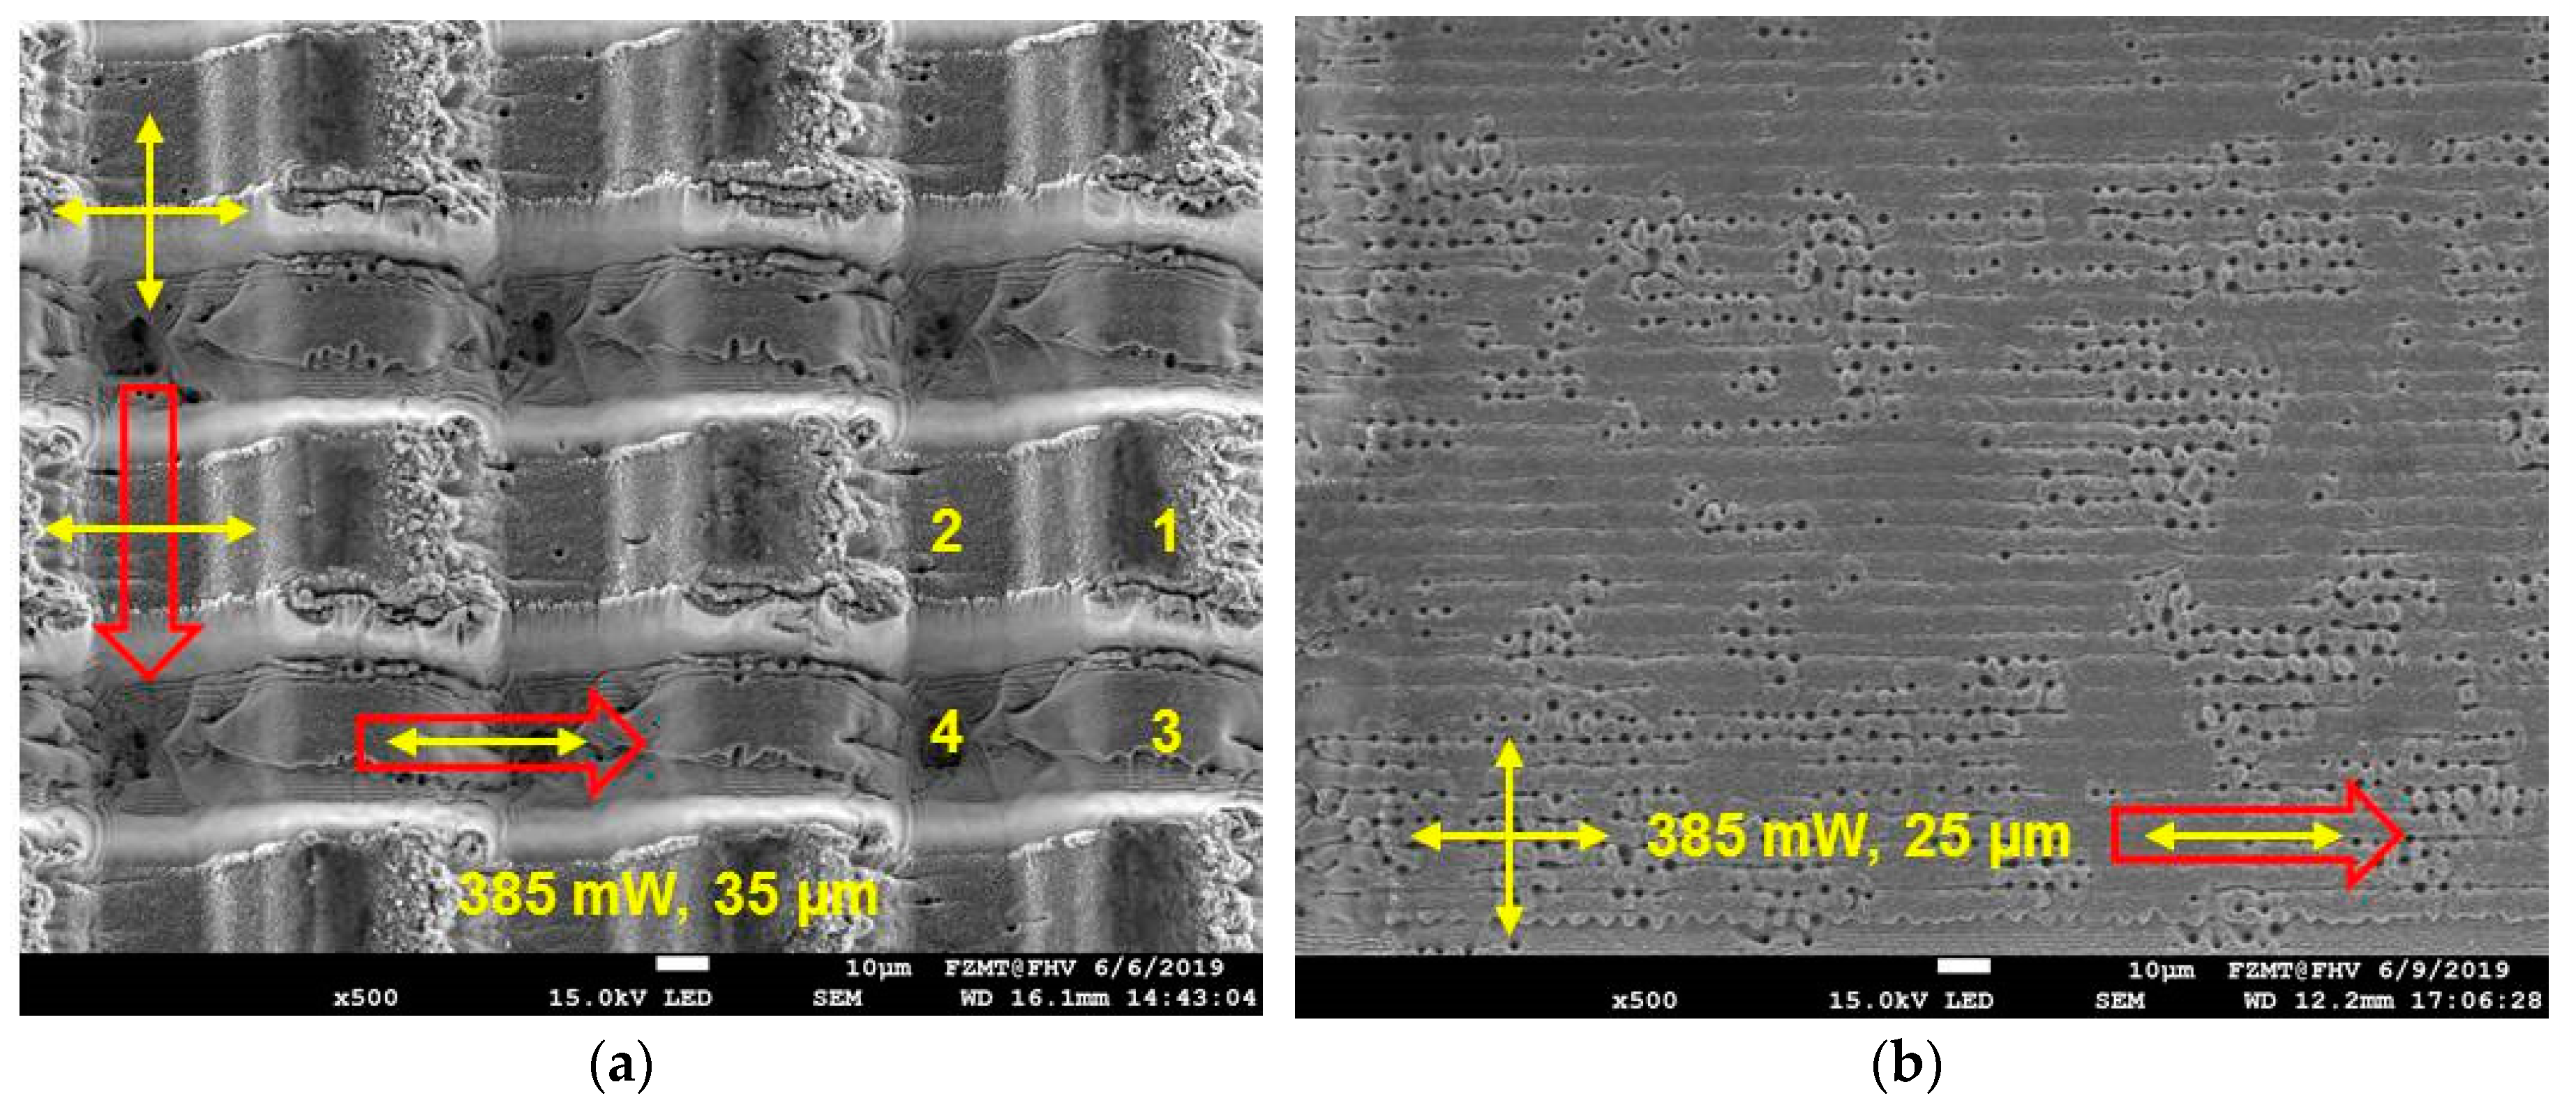
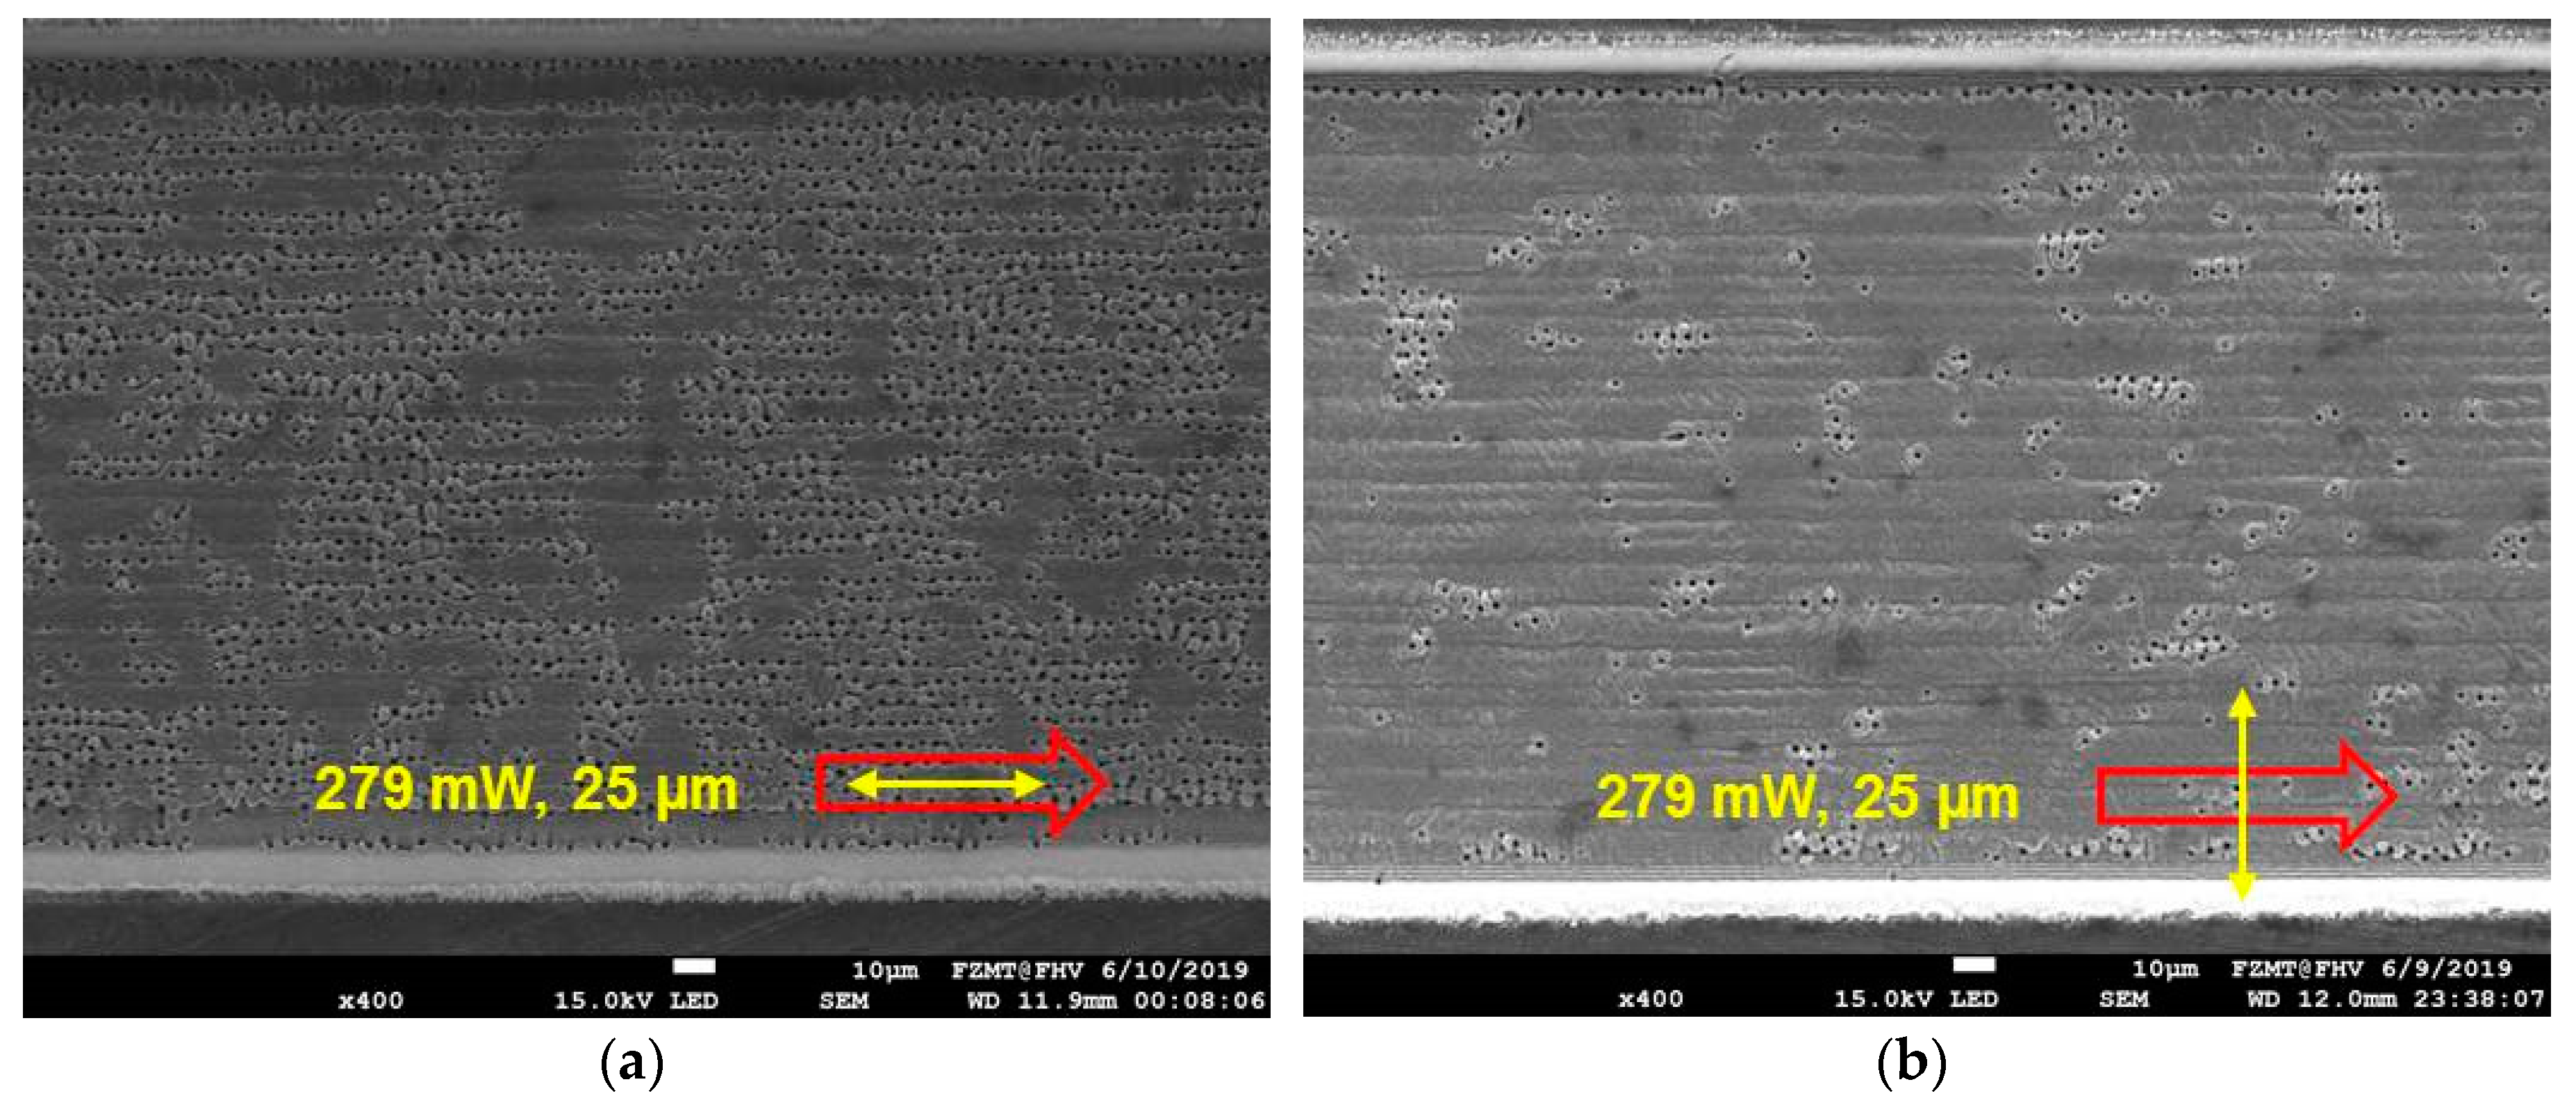
The disc specimens for the tribological tests were produced in two steps using an average laser power of 385 mW. Firstly, a pattern along the x direction consisting of stripes with a width of 40 µm was scanned using the aforementioned hatch distance of 5 µm. After 15 consecutive scans, the polarization was flipped by 90° (symbolized by the yellow cross in Figure 4a), and this procedure was repeated 11 times. The laser polarization of the final scan cycle was in the x direction and parallel to the scan direction (the red arrow in Figure 4a represents the scan direction and the yellow arrow represents the polarization of the final scan cycle). The bottom of level 3 of the first trench, as shown in Figure 4a, was formed by this first ablation cycle, and the depth with respect to level 1 was approximately 35 µm. Secondly, the same procedure was performed with scans along the y direction. The polarization was flipped similarly as in the first step, and consequently, the final scan ended up with a polarization along the x direction (perpendicular to the scan in the y direction). This second step formed the 35 µm deep bottom level of Section 2 (shown in Figure 4a) and a deeper bottom level (level 4) at the intersection with level 3. Surprisingly, the surface quality of Section 2 was not equal to Section 3. The fact that the laser beam is astigmatic could be one of the reasons for such an outcome. To rule out the laser beam astigmatism in our experiments, it was decided to do only scans along the x direction but to keep the polarization flip procedure after 15 consecutive scans. By using this procedure, the trench width was increased from 40 to 200 µm and the interfering effects from the generated side walls of a too narrow trench were therefore limited. In addition, the number of repetitions was reduced from 11 to 7 and, as a consequence, the depth of the obtained trench was reduced from 35 to 25 µm respectively, as shown in Figure 4b. One can clearly see traces from the 5 µm hatch pattern (small lines) along which pinholes with diameters of approximately 2 to 3 µm were formed. Because the polarization of the final scan cycle was along the x direction, the generated LIPSSs are orientated in the y direction [23,24]. As a consequence, the hatch lines intersect the LIPSS, or at least modulate the depth of the LIPSS, which leads to the growth of sub-micrometer pinholes of approximately 2 to 4 µm in diameter. Such a growth mechanism in SiC was previously simulated and investigated, and showed that LIPSSs correlate well with the slot waveguide characteristics in high refractive index material [20]. It is believed that such a model may also be applied to metals because, according to theoretical and experimental research, deep grooves in LIPSSs behave as plasmonic slot waveguides [25]. Moreover, previously published models predict a field distribution for deep slots which can generate nanometer-sized pinholes or cross periodic structures respectively [25,26]. The model previously developed by the present authors describes the growth of such nanometer pinholes towards micrometer sizes at the locations of interruptions or distortions of LIPSSs [20]. In earlier work on SiC, a certain threshold for pinhole growth was identified and the laser power was consequently reduced from 385 to 238 mW, while all other conditions were kept constant [20]. There was a significant reduction in the pinhole formation rate but at the cost of a reduction of the trench depth from 25 to 18 µm, as shown in Figure 5a.
An increase of the number of scans in order to reach a depth of 25 µm would have required an unwanted longer production time; therefore, it was decided to test the approach for which the final scan cycle was a combination of a scan in the x direction with a polarization in the y direction. By using such a procedure, it is expected that the generated LIPSS would be nearly parallel to the hatch lines, the number of intersections among hatch and LIPSS would be lower and the formation and growth rate of the pinholes may be reduced.
Furthermore, the laser power was increased from 238 to 279 mW, while the number of scans per constant polarization cycle was reduced from 15 to 10; in return, the number of cycles increased from 7 to 14. The obtained results verified our hypothesis and expectations: the obtained surface quality was close to that of the previous test performed with a laser power of 238 mW along with the fact that a trench depth of 25 µm could be again obtained as previously, as shown in Figure 5b. As more than one parameter for this test was simultaneously changed, two supplementary tests were conducted in order to confirm that our concept of polarization flipping after a certain number of scans, combined with a final scan cycle having a laser polarization perpendicular to the scan direction, significantly contributes to a smooth surface quality after laser ablation. Using the same parameters and procedure as previously, but skipping the polarization flipping, it is possible to compare the results obtained from a laser polarization and a scan both parallel to the x direction to the results obtained from a laser polarization along the y direction and perpendicular to a scan in the x direction, as shown in Figure 6a,b. The obtained results obviously support the hypothesis that in metals (as in SiC), pinhole growth is linked to the number of interruptions of the LIPSS. After these experiments, it came to the authors’ attention that the simple rule of orientating the laser polarization perpendicular to the scan direction is the most effective measure to suppress pinhole growth, from negligible nanometer size pores up to micrometer dimensions. However, additional polarization flipping still has its benefits, i.e., contributing to pinhole suppression, because practically, it is impossible to obtain undisturbed gratings like LIPSS patterns on a larger ablation area; eventually, some pinholes will grow over time. LIPSS formation and subsequent pinhole growth are favored either by long durations at low scan speeds or a high number of scans at higher scan speeds. If the polarization is flipped within such a time or scan interval, the existing LIPSSs are reorganized along a new direction, the already generated pinholes are then removed (providing that their size is still not too big) and the growth cycle has to start again. Therefore, it was decided to use a growth cycle reset after every 10 consecutive scans and, as depicted in Figure 7b where the final cycle was performed with a laser polarization perpendicular to the scan direction, it may be observed that a further reduction in pinhole density with respect to the results shown in Figure 6b (same laser parameter but at constant polarization direction perpendicular to the scan direction) may be obtained.
However, the aforementioned simple rule of orientating the laser polarization perpendicular to the scan direction has one main disadvantage which becomes more important as a trench gets deeper after several scans. Due to Brewster angle effects and a resulting higher ablation rate in the direction of the laser polarization, small scratches in the trench wall grow faster and end up in a distinct score pattern [21]. After several consecutive scans, the pattern in the trench wall initiates a corresponding structure formation on the LIPSS-covered trench bottom, as shown in Figure 7a. Small pores are arranged in strings which are parallel to the polarization and perpendicular to the scan direction. The LIPSS are intersected perpendicular to their orientation, and after a number of several consecutive scans, the pores grow together to form bigger identities [21]. Any interruption of the LIPSS (for example a small bump) can trigger the formation and growth of pinholes, as depicted in Figure 7a. The front and end sides of the surface bump represent an interruption of the LIPSS (encircled areas in Figure 7a), and the growth cycle of pinholes predominately starts at this location. LIPSS striking tangentially the surface bump are not interrupted and a lower degree of pinhole formation was observed. The observations mentioned above (formation and growth of pinholes due to LIPSS intersections) are also interrupted by polarization flipping and have to start again from scratch, thus contributing to smoother surface quality and reduced pinhole formation. It is worth noting that for a better visualization of the aforementioned observations shown in Figure 7a, a laser with a wavelength of 1040 nm was used in order to obtain larger LIPSSs. Moreover, larger and deeper LIPSSs may provide further advantages when they are tribologically tested under oil-lubricated conditions. In the current work, 3D textures without any LIPSSs were used as the top contact area. It is believed that a further improvement of the current 3D microtexture may be achieved through a two-step procedure: firstly, the laser ablation of the trenches along both the x and y directions should be performed using a laser with a wavelength of 520 nm (which showed a lower tendency for pinhole formation in comparison to the laser with a wavelength of 1040 nm), and further applying polarization flipping under the condition that the final scan cycle should be made with a perpendicular polarization with respect to the scan direction; secondly, after producing the 3D microtexture, the whole surface area should be exposed to the laser with a wavelength of 1040 nm in order to cover the microtexture with a LIPPS-based nanotexture, such as that shown in Figure 7a. It is believed that the current tribological results under oil-lubricated conditions could be improved by such a hierarchical micro/nanotextured surface in future tribological investigations. Furthermore, it is believed that the adhesive strength and the wear resistance of the antifriction coating could be improved through this novel manufacturing procedure.
2.3. Evaluation of Dynamic Friction Coefficients
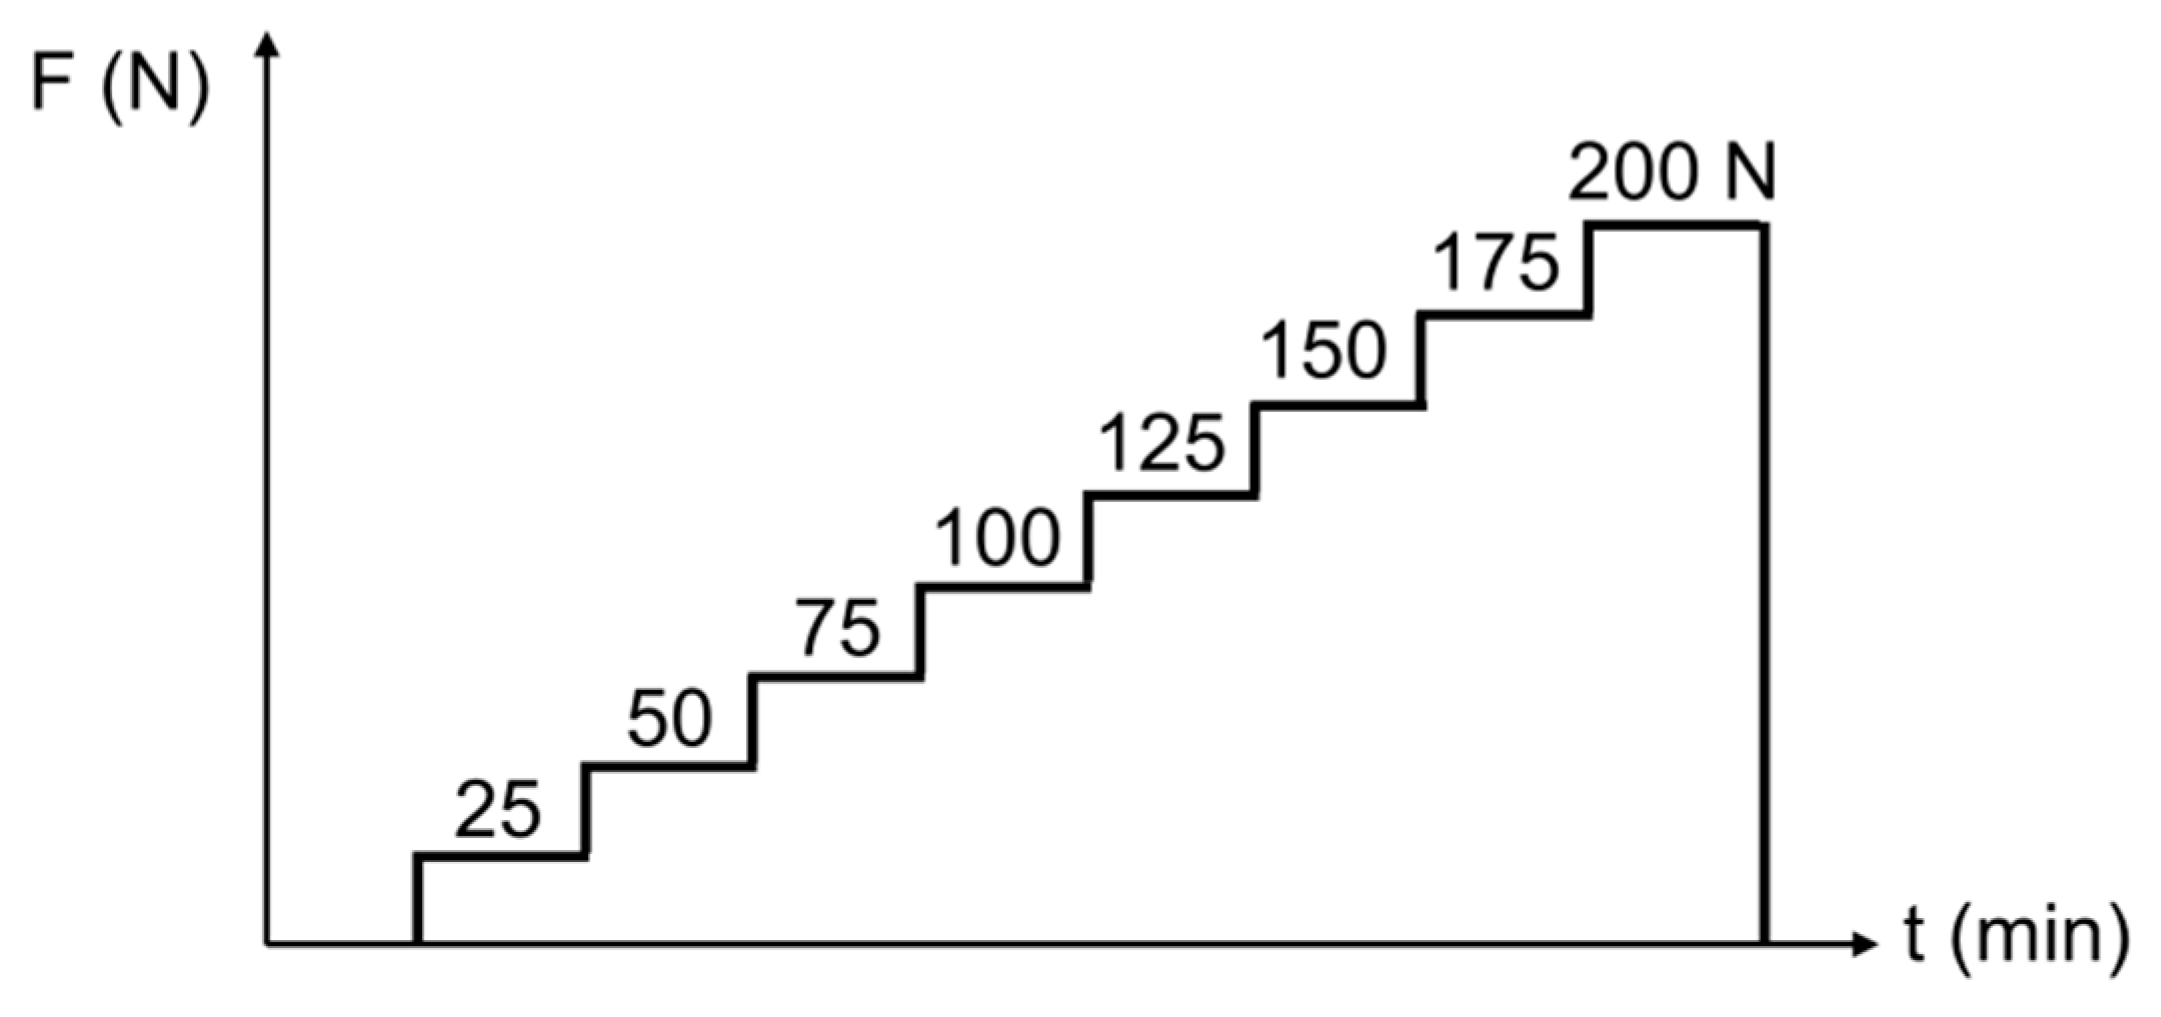
Stepwise load-varying tribological tests were performed using a SRV-tribometer (SRV®4, Optimol Instruments Prüftechnik GmbH, Munich, Germany). In these tests, friction coefficients were measured for short-time (5 min) oscillating tests at several different normal load values ranging from 25 to 200 N with steps of 25 N (as shown in Figure 8) under different lubrication conditions for as-received cylinders against different discs surface states: benchmark blank, antifriction coated benchmark, 3D microtextured or 3D microtextured/antifriction coated, as shown by the test matrix listed in Table 2. Furthermore, a supplementary test with a coated microtextured specimen, with the 3D microtexture oriented at an angle of 45° (instead of 90°) to the direction of motion of the cylinder, was also performed in order to investigate any possible influences of the microtexture orientation on its tribological behavior. Table 3 lists some of the important test parameters used for the determination of dynamic friction coefficients. For the determination of dynamic friction coefficients, the tribometer was programmed to perform high-frequency friction signal acquisition (FSA) at the beginning and end of each load level for duration of 0.2 s at a sampling rate of 1 kHz. This FSA signal analysis enables a highly precise time-resolved analysis of the friction force and coefficients of friction, which are otherwise not possible using the normal signal acquisition parameters of the SRV-tribometer. The obtained FSA raw signals were then postprocessed in order to calculate averages of dynamic coefficients of friction. This postanalysis consisted of eliminating 10% of the raw signal at the beginning and at the end of a half-cycle, i.e., keeping only 80% of the raw signals for each half-cycle and averaging these values over approximately 10 half-cycles, as shown by the light green zones in Figure 9. From Figure 9, it may also be observed that the first peak present at the onset of movement (in either direction) is due to the adhesive part of the friction, also known as static friction or stiction.
2.4. Evaluation of Wear Resistance and Long-Term Friction Behaviour
The wear resistance of the coated specimens (benchmark, 3D microtextured and 3D microtextured at 45°) also represents a major interest prior to their deployment in real industrial applications. The reason that only the coated specimens were selected for the investigations of wear resistance was based on the fact that:
1. oil-lubricated conditions may possess certain drawbacks for some specific highly technical industrial applications; thus, antifriction coated specimens were selected, since they are widely used in industrial applications.
2. it was considered useless to investigate the wear of uncoated specimens under unlubricated conditions, since these conditions are usually never used in the industry.
The wear resistance of the previously specified antifriction coated samples was determined through long duration tribological tests (120 min). Except for the total test duration (120 min at 1 load level instead of 10 load steps of 5 min each), all other test parameters were kept identical to those used for the determination of friction coefficients, as listed in Table 3. Due to the restricted number of available samples, these long-term tests were performed at a normal load value of 125 N only, i.e., at a load value high enough to produce a measurable wear on the investigated samples.
The overall wear of the tested samples (cylinders and discs) was determined using the aforementioned laser optical surface analysis apparatus (Keyence VK-X250/260). For both cylinders and discs, a direct measurement of the wear scar volume was performed using a height threshold-based volume measurement. It is worth noting here that for both antifriction coated 3D microtextured disc samples (90° and 45°), the measured wear volume values also account for the small proportion due to the valleys of the 3D-texture present at the bottom of the wear scar, and thus, the measured and presented values are slightly higher than the real wear volume values.
3. Results and Discussions
3.1. Characterization of Benchmark, Coated, 3D Microtextured and 3D Microtextured/Coated Samples
For the blank uncoated benchmark samples (cylinders and discs), the only characterization performed was the measurements of their surface roughness, which were already mentioned in Section 2.1 and are additionally listed in Table 4. For the untextured antifriction coated specimens (coated benchmark), the application of the aforementioned antifriction coating to their surfaces increased their surface roughness significantly, as shown in Table 4.
A detailed measurement and analysis of the microtextured disc specimens was performed in order to ascertain the accordance of the dimensions of the produced microtextures with their initial desired dimensions. Figure 10 shows a detailed typical topographical analysis of two selected 3D microtextured disc samples; their measured specific dimensions are listed in Table 5. These dimensions correspond quite exactly to the initial desired dimensions presented in Section 2.1, thus showing that the production of 3D-microtextures using an ultra-short pulsed laser may be performed with a good level of accuracy. The ratio of the nominal microtextured area of the top plateau in comparison to the benchmark (benchmark = 100%) was calculated using the measured side dimensions and periods listed in Table 5, resulting in a value of 20.9%, which corresponds quite adequately to the desired ratio (20%) calculated from the desired microtexture dimensions presented in Section 2.1. These results show clearly that the production of 3D microtextures on steel may be achieved with a very high level of precision.
As mentioned earlier, some of the 3D microtextured samples were then coated with an antifriction coating (properties shortly listed in Table 1). Typical topographies of such 3D microtextured and antifriction coated samples are shown in Figure 11. The first obvious observation that could be made from a comparison between Figure 11 and Figure 10 is that the produced surface microtextures are no longer quadratic, and are not as sharply defined as previously: actually, the microtextures are in some way rounded by the presence of the antifriction coating. Furthermore, it may be easily observed that the valleys were partially filled with the antifriction coating, resulting in a reduction in the total height difference between the different plateaus of the 3D-texture. From the typical topographies presented in Figure 10 and Figure 11, it may be easily concluded that the coating process used in the present study to apply the antifriction coating strongly modified the surface topography of the microtextured samples. The height of each plateau of the microtextured and coated samples was measured using the same procedure as for the microtextured samples. However, the lateral dimensions (bx, by) and the periods (Px, Py) of the different plateaus were not determined due to their undefined rounded profiles, which are difficult to measure. The average height differences from 3 different measurements between each plateau are listed in Table 6, and show that the height differences between the plateaus had decreased due to a partial filling of the microtexture valleys by the antifriction coating, as mentioned previously.
3.2. Evaluation of Dynamic Friction Coefficients
The results obtained from the load-varying tests performed on all sample configurations under study are presented in Figure 12, in which each point represents the calculated average of the friction coefficient (calculated from the sliding section of the obtained curve as shown in Figure 9) for the specified applied normal force. For the benchmark sample under oil-lubricated conditions (Figure 12a, black curve), it may be observed that the sliding coefficient of friction is very stable throughout the load range under study (which is shown by the relatively small error bars), and that its value remains at around 0.10. For the coated benchmark sample (Figure 12a, red curve) under dry conditions, the coefficient of friction becomes very unstable (large error bars) and is higher than the value of the benchmark under oil-lubricated conditions. Furthermore, its value stays at around 0.22 up to a load of 100 N and then increases abruptly to a higher value of approximately 0.30 for higher loads. This increase of the friction coefficient has been visually correlated to the coating failure during the test.
For the 3D microtextured samples (Figure 12b), both the sample under oil-lubricated conditions (black curve) and that with an antifriction coating (red curve) show relatively stable coefficients of friction (small error bars) throughout the load range under study. For the 3D microtexture under oil-lubricated conditions, the coefficient of friction remains around 0.14 and for the 3D microtexture with an antifriction coating, friction coefficient stays around 0.20. By comparing the results of Figure 12a,b, it may be observed that under oil-lubricated conditions (black curves), the 3D microtextured samples exhibit slightly higher coefficients of friction then the benchmark (COFbenchmark ~0.10; COFmicrotexture ~0.14), and that the friction stability is similar for both samples, showing that the use of 3D microtextures does not bring any significant benefits under oil-lubricated conditions. However, with the use of an antifriction coating (red curves of Figure 12a,b), one may observe that the stability of the coefficients of friction is drastically increased (comparison of error bars), and that the coefficients of friction are significantly smaller for the 3D microtextured samples than for the benchmark samples, showing that the use of 3D microtextures along with an antifriction coating under unlubricated conditions represents an interesting alternative to oil-lubricated, untextured surfaces (benchmark).
It is believed that for the benchmark samples, a depletion of the antifriction coating occurs during the tribological tests, and that the coating is actually pushed out of the contact zone, thus exposing the underlying blank steel of the disc specimen to the cylinder, resulting in high and unstable coefficients of friction, especially for high load values. For the tests with the 3D microtextured and coated samples, a depletion of the antifriction coating also occurs, but only on the first microtexture level; the underlying levels of the 3D microtexture itself serve as lubricant reservoirs in which particles of the depleted antifriction coating from the top microtexture level are stored and continuously smeared back on the top level of the microtexture, thus enabling a kind of continuous lubrication regime which results in low and stable friction coefficients for all load values under study.
The results from tests performed on 3D microtextured samples with an antifriction coating but with the microtexture aligned at an angle of 45° from the sliding direction (instead of 90° for the previously presented results) are presented in Figure 12c (results of Figure 12b are incorporated in Figure 12c in order to compare easily the effect of the microtexture angle). From Figure 12c, it may be easily observed that the modification of the microtexture angle (from 90° to 45°) with respect to the sliding direction tends to decrease the coefficient of friction towards the value of the microtextured samples at an angle of 90° tested under oil-lubricated conditions for low load values only (<125 N), and for higher loads, the coefficient of friction of the 45°-oriented microtexture increases back to approximately the same values as for the 90°-aligned microtextured sample with an antifriction coating. However, these observations should be taken with caution, since error bars of the results obtained may indicate that this behavior is not as obvious as observed, and that these observations may be solely due to the intrinsic scattering nature of the measured coefficients of friction. More detailed investigations are necessary in order to assess the veracity of the previous observations. Nevertheless, by considering the obtained error bars, one may conclude without any doubt that the use of a 45°-oriented 3D microtexture (instead of a 90°-aligned 3D microtexture) with an antifriction coating tends to slightly lower the coefficients of friction, but that the coefficients of friction never fall below the values obtained for the 3D microtextured samples tested under oil-lubricated conditions.
3.3. Evaluation of Wear Resistance and Long-Term Friction Behaviour
As mentioned in Section 2.4, the determination of the wear resistance was performed only for the 3 samples having an antifriction-coating: coated benchmark, 3D microtextured (90°) coated and 3D microtextured (45°) coated samples. The wear resistance was determined as the wear rate (mm3/h), which was calculated from wear volume values, measured using laser optical microscopy after the tribological tests, divided by the test duration. It is worth noting that since disc specimens possess an extremely high number of micropillars (and microvalleys) on their surfaces, it is almost impossible to precisely quantify their wear volume after the wear-based tribological tests, because wear measurements were performed using a normal height threshold technique using a defined level, which also encompasses intact microvalleys that did not experience any wear during the tribological tests. Therefore, reported wear values for the disc specimens should not be interpreted as absolute, but as relative, values, which still enable a valuable comparison to be made between the investigated tribological pairings.
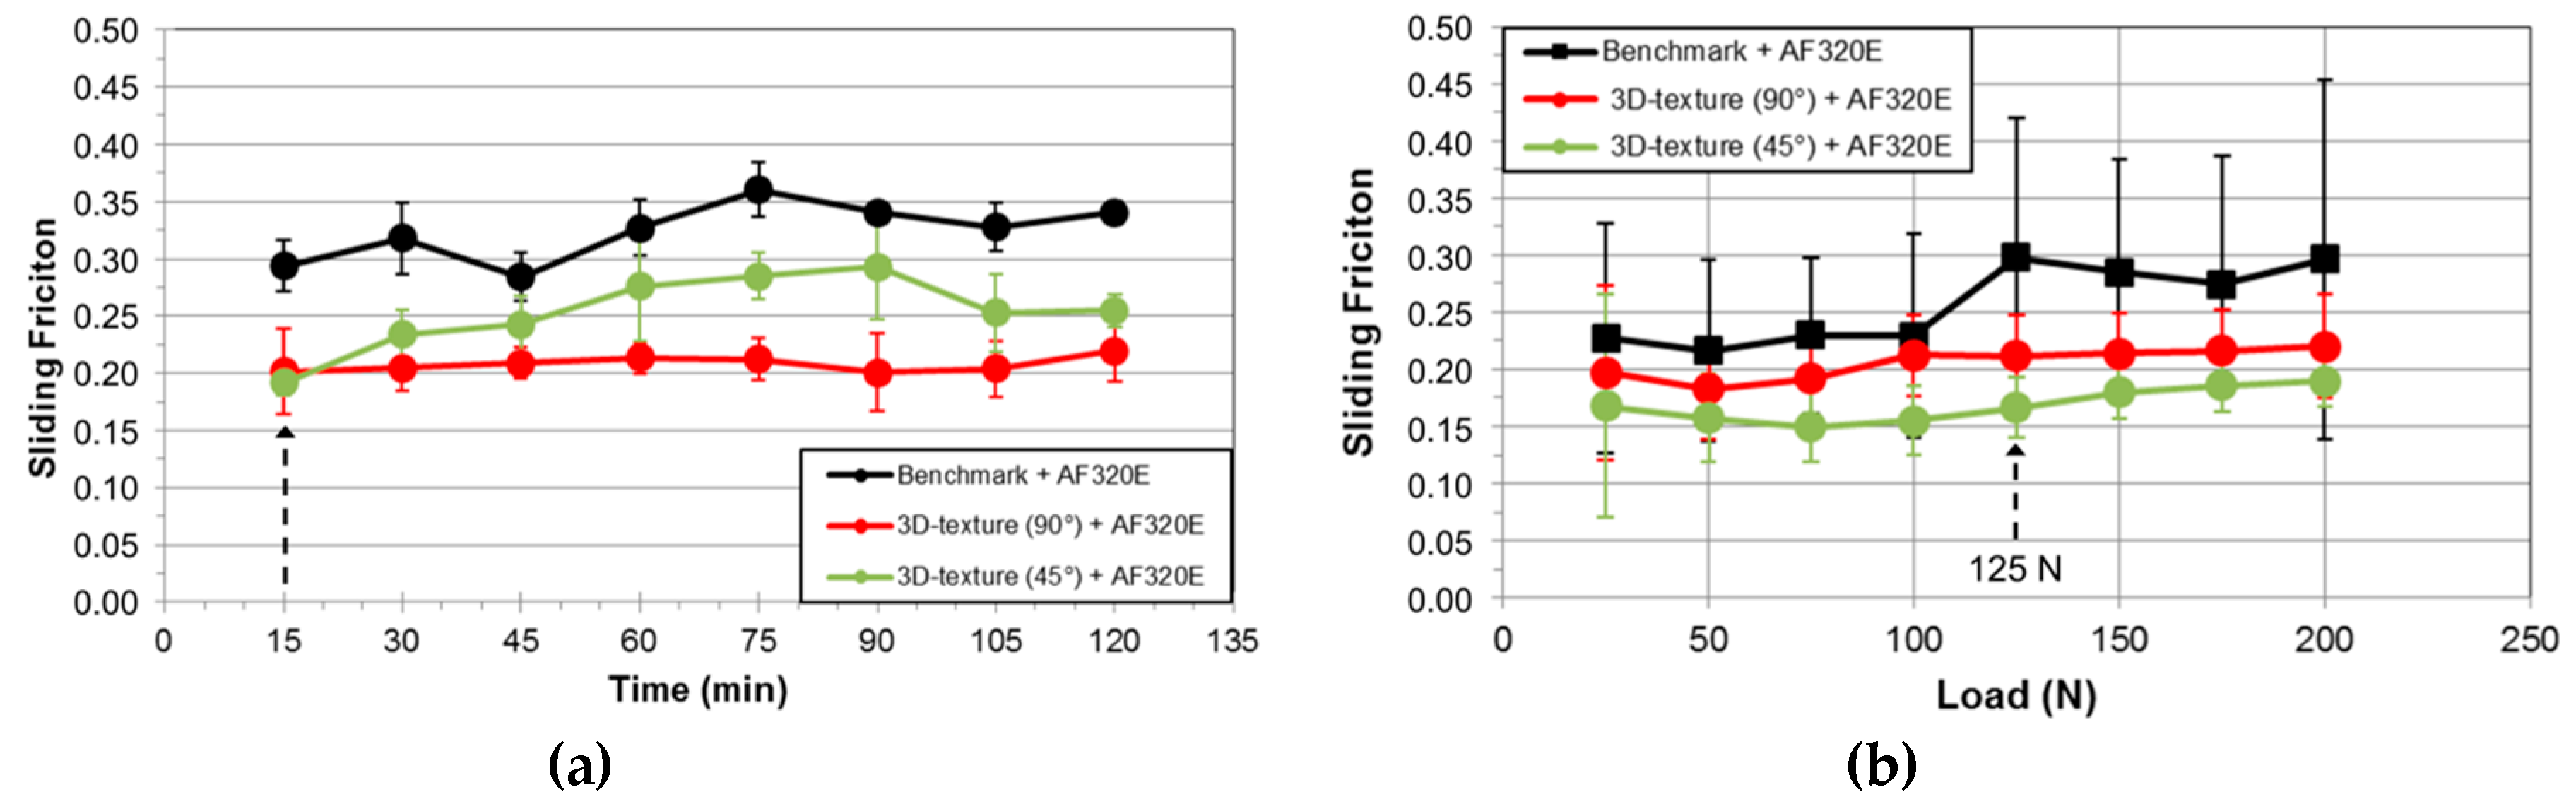
But first of all, before presenting the measured wear rates of the 3 aforementioned sample variations, coefficients of friction during these wear resistance tests were also monitored and are presented in Figure 13a for a direct comparison to the friction coefficients measured during the load-varying tests (short-term tests; Figure 12). For this comparison, one should bear in mind that the wear tests were performed at a normal load of 125 N; therefore, on the corresponding diagrams of Figure 12, the friction coefficient value at a load of 125 N should be used as a comparison point. Furthermore, the first values of the coefficients of friction measured and presented in Figure 13a are after a test duration of 15 min, which is about 3 times longer than the short-term load-varying tests. In order to facilitate the direct comparison of the coefficients of friction related to both tribological tests, the results of Figure 12a,c were partially combined and are presented in Figure 13b, and the corresponding coefficients of friction are listed in Table 7.
From Figure 13 and Table 7, it is obvious that the friction coefficients obtained either from wear resistance tests (@ 15 min) or from load-varying tests (@ 125 N) are quite similar, which gives a certain degree of validation for the friction coefficients obtained from both different tribological tests. The small discrepancy observed for the 3D microtexture with a 45°-angle may be due to the fact that the time-range of the compared values is different (15 min for wear tests, 5 min for load-varying tests).
It is worth noting that the error bars shown in Figure 13b are larger than those in Figure 13a due to different procedures used for friction measurements. The friction values shown in Figure 13b (short-term tribological tests with varying loads) were measured and averaged for a time duration of 0.2 s at the beginning and end of each load level (tbegin = 0 s; tend = 5 min.); therefore, for each load level, and due to the short time period at a new constant load value, the friction values were partially measured when the system was still in the running-in phase (in which the friction may still be relatively unstable and may relatively differ from test to test), thus resulting in larger error bars when averaging values measured from 3 short-term tribological tests. On the other hand, the friction values shown in Figure 13a (long-term tribological tests at a constant load) were measured and averaged for a time duration of 0.2 s every 15 min (t1 = 15 min.; t2 = 30 min., etc.); therefore, for the first friction measurement at t1 = 15 min., the running-in phase of the system was already finished and the system was already in a friction regime where the friction was relatively stable and relatively reproducible between different tests, resulting in smaller error bars when averaging 3 long-term tribological tests.
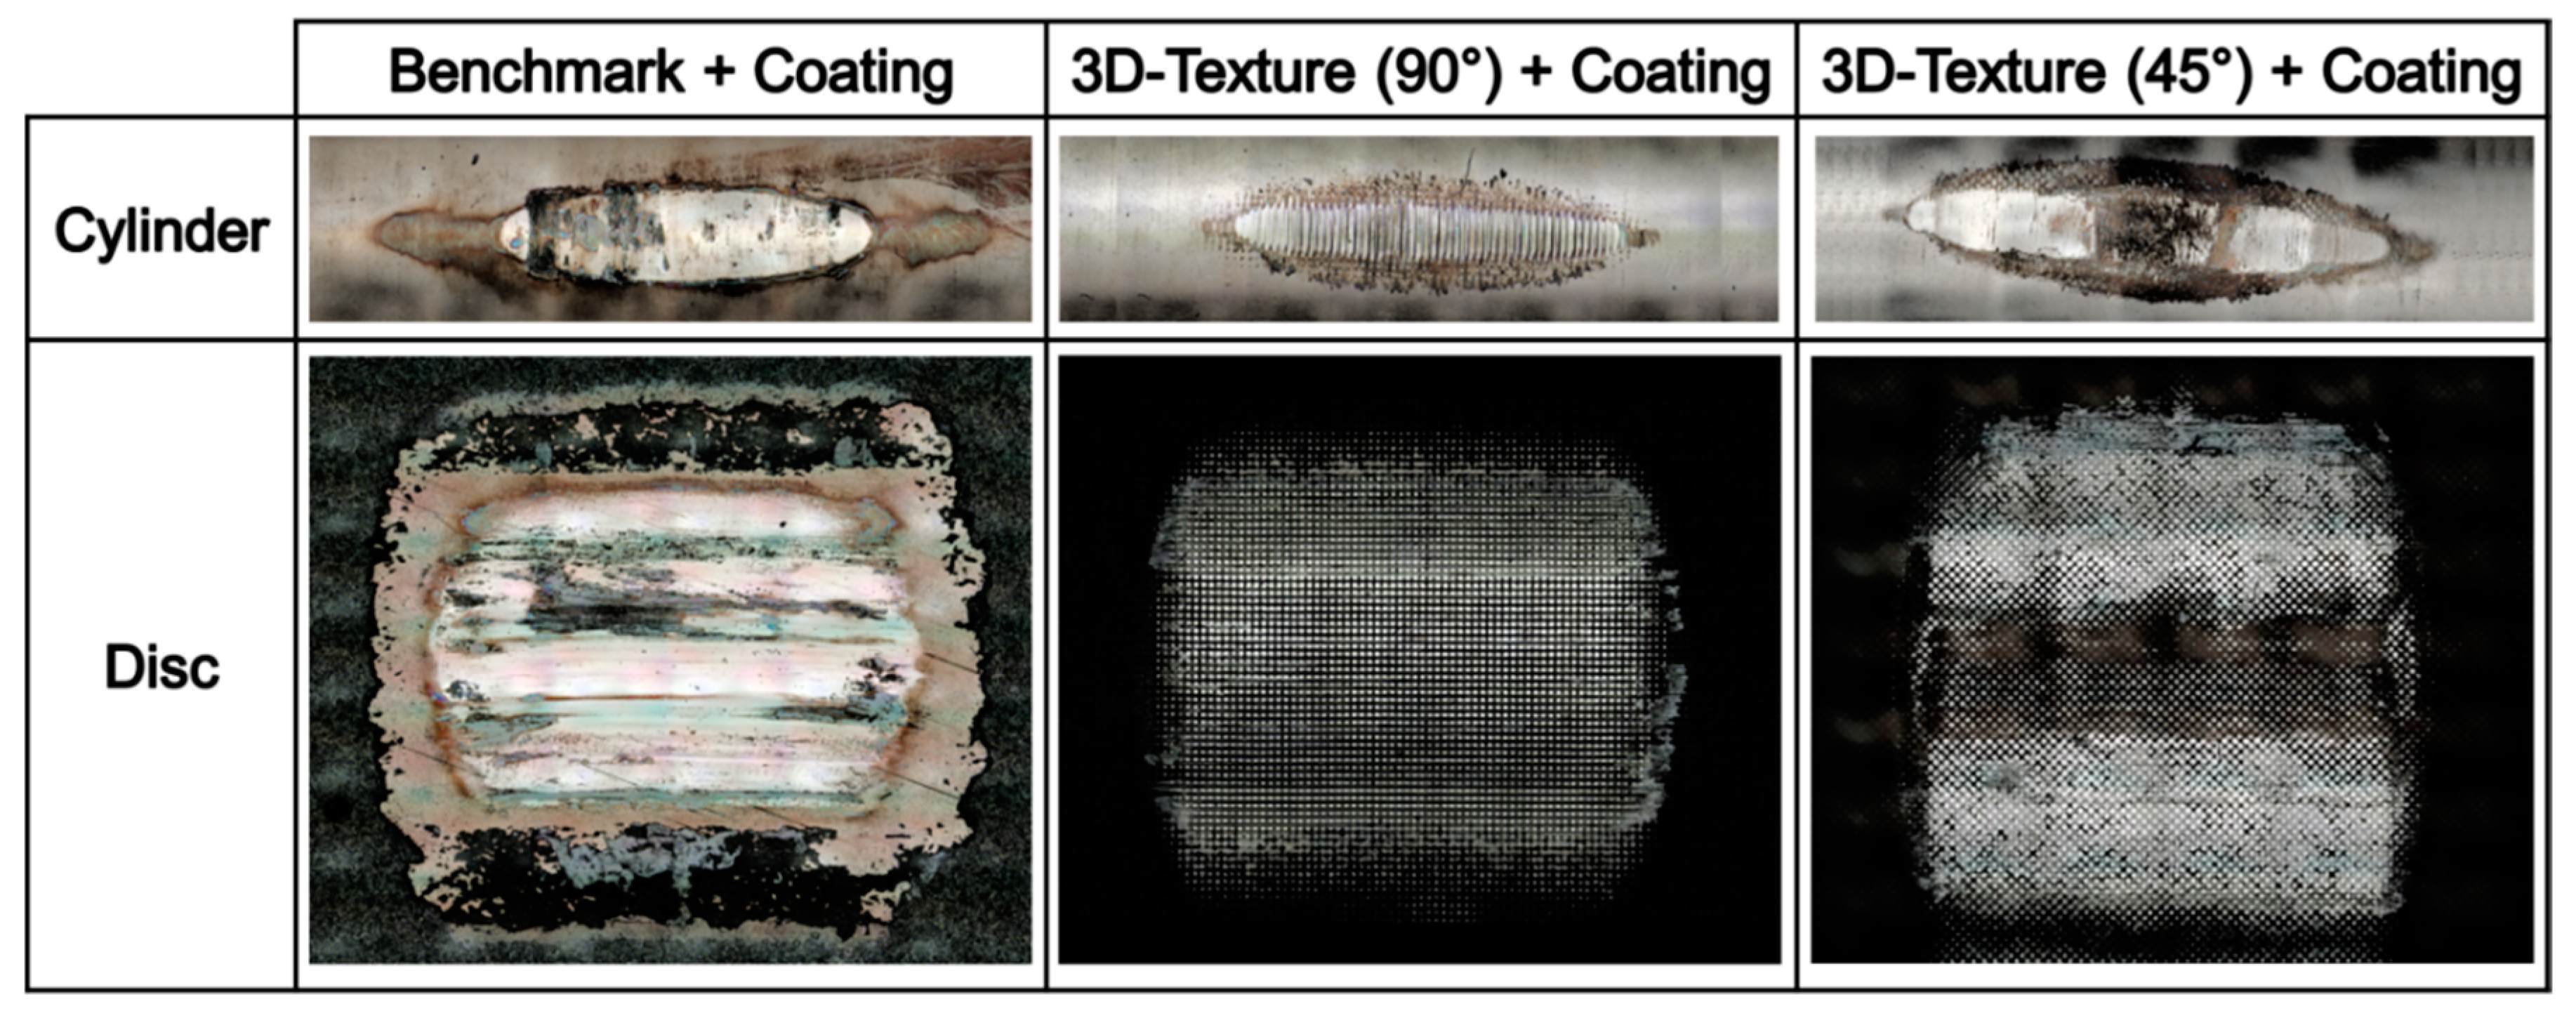
Typical top view pictures of wear scars after the performed wear resistance tests obtained using laser microscopy are shown in Figure 14. At first sight, one may observe that the scars of the benchmark samples are somewhat larger than those of the 3D-textured samples, with the smallest scars for the 3D-textured samples with a 90°-angle.
For the coated benchmark samples, it is obvious that the antifriction coating was completely depleted in the center of the wear scars on the disc specimen, and thus, that the cylinder came into contact with the base material of the disc specimen, which greatly influenced the friction and wear behavior of the coated benchmark samples. At the periphery of the wear scars on the cylinder, small areas may be observed in which material transfer of the antifriction coating from the disc specimens occurred.
For the 3D-textured samples, the cylinder surface shows linear grooves produced by the lower 3D-texture for the samples aligned with an angle of 90°, but no linear grooves were visually observed for the 3D-textured sample aligned at an angle of 45°, which is simply due to the orientation angle of the 3D-texture with respect to the motion direction of the tribometer during the wear tests, as shown in Figure 15. Actually, linear grooves were also produced on the cylinders for the 3D-texture with an angle of 45°, but the extremely small distance between each groove renders their visual observation difficult: grooves produced on the cylinders when the angle was 90° had a width equal to the plateau side dimensions (~ 37 µm as reported in Table 5), while grooves produced on the cylinders when the angle was 45° had a width equal to the plateau diagonals (~52 µm = √2 × 37 µm).
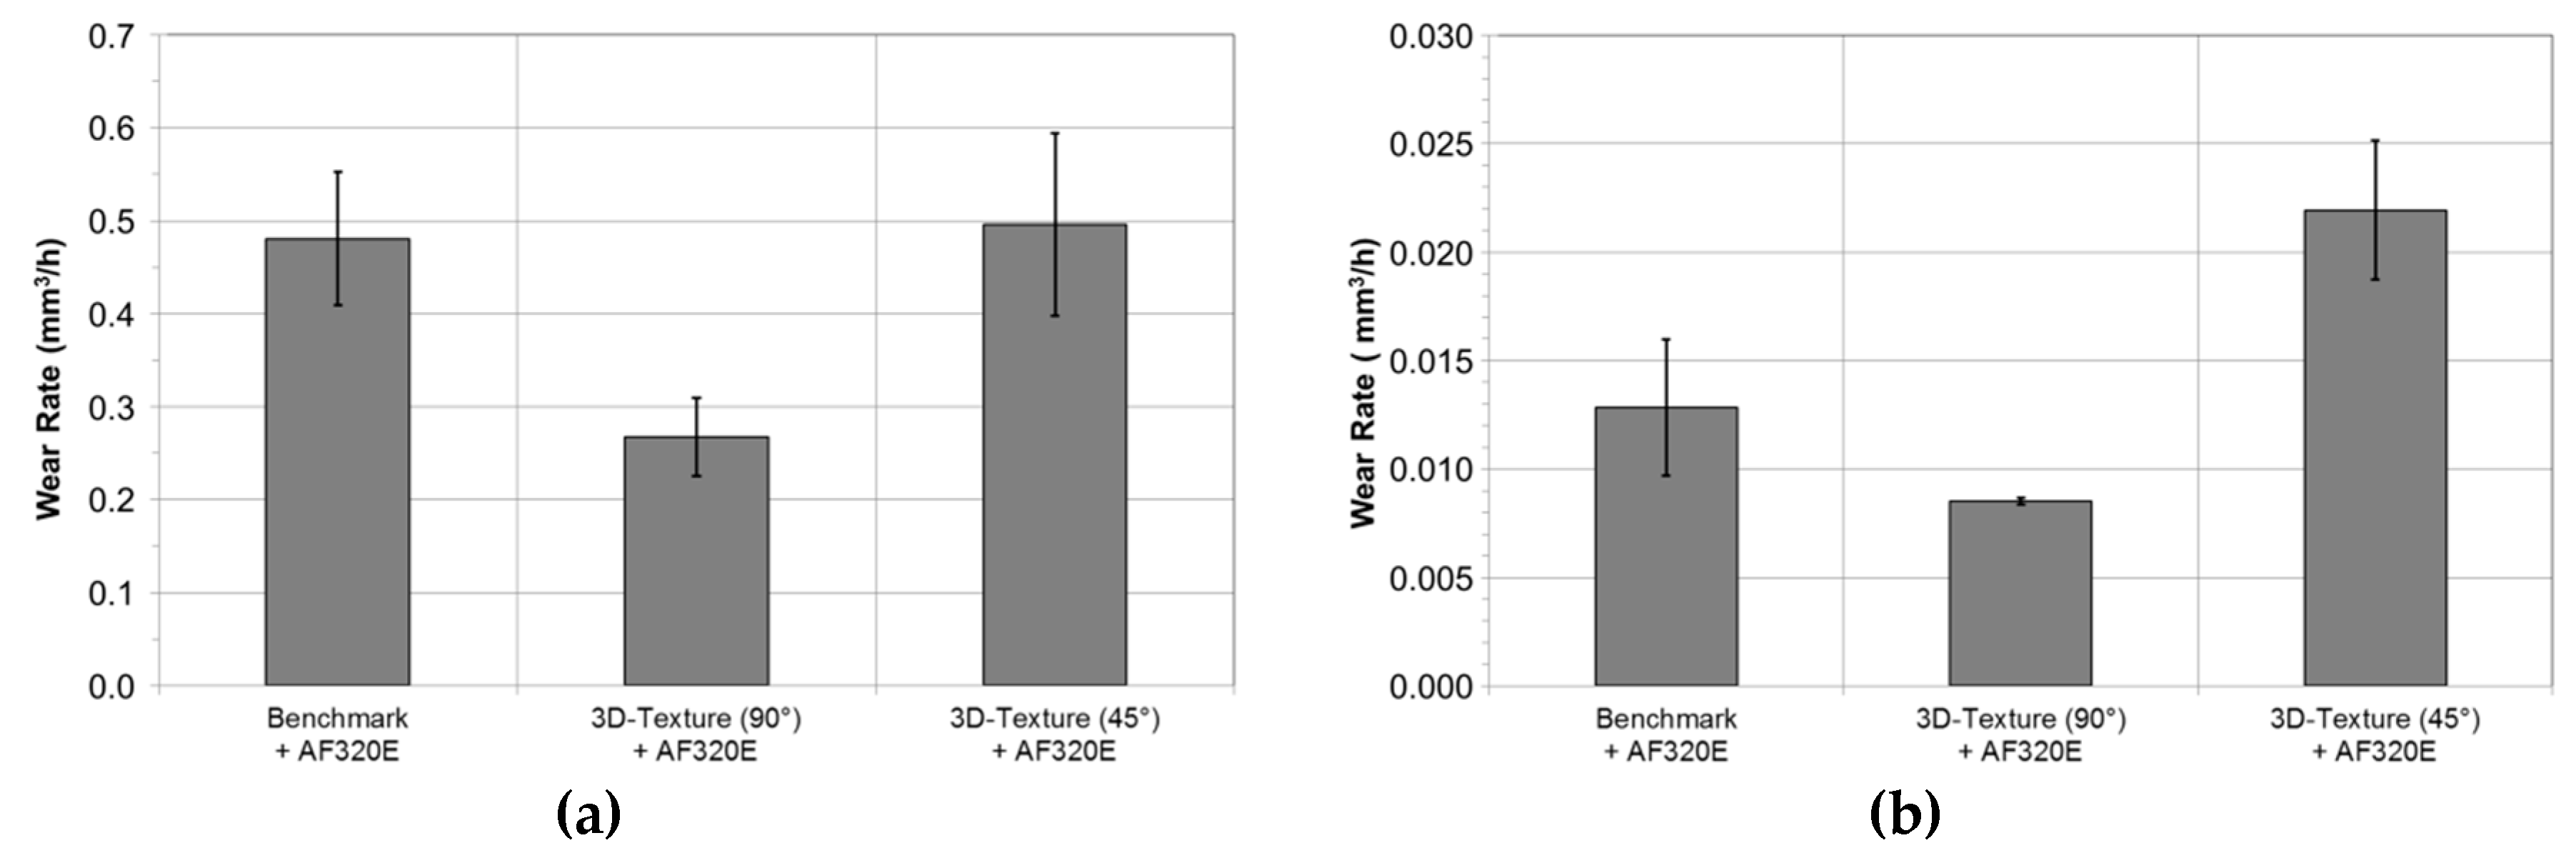
The averages of wear rates (mm3/h) of discs and cylinders measured using laser optical microscopy are shown in Figure 16a and 16b for all 3 sample variations respectively. From both diagrams shown in Figure 16, it may be seen that the use of a 3D microtexture with an orientation of 90° to the direction of motion in combination with an antifriction coating may reduce the overall wear rate of the tribological system (upper and lower specimens) from an average of 0.5 mm3/h to approximately 0.25 mm3/h for the discs and from an average of 0.0125 mm3/h to approximately 0.0075 mm3/h for the cylinders. By orienting the 3D microtexture at an angle of 45° relative to the direction of motion, the wear rate of the discs stays at a value similar to the benchmark, while the wear rate of the cylinders increased slightly above 0.02 mm3/h.
The increase in wear rates for the 3D-textured and coated samples with an angle of 45° in comparison with the similar samples with an angle of 90° may be explained by the fact that the contact width of the plateaus having a 45°-angle is significantly higher (~52 µm) than for a 90°-angle (~37 µm), as shown schematically in Figure 15, and therefore, the amount of worn material through ploughing is higher for both disc and cylinder specimens. Furthermore, the lower wear resistance of the microtexture with a 45°-angle (in comparison to the samples with a 90°-angle) is also believed to be due to the difference in real contact pressures between these two textures. For a defined unit surface area, the number of micropillars encompassed by this area is always about 20–25% lower for the samples with a 45°-angle than for the samples having a 90°-angle; thus, the real contact pressures experienced by the 45°-angle samples is 20–25% higher than the contact pressures encountered by the samples having a 90°-angle (p = FN/A, where p = contact pressure in N/mm2, FN = load in N and A = contact surface in mm2). Table 8 gives a short overview of the formulas used for the calculation of the ratio of the contact pressures for both microtextures having different orientation angles to the direction of motion during long-term tribological tests.
For the textured samples with a 45°-angle, the fact that the wear rate of the disc specimens is similar to the coated benchmark samples (Figure 16a) while the wear rate of the cylinders is significantly higher than the coated benchmark samples (Figure 16b) needs to be analyzed separately in more detail; this will be the focus of a future study and publication.
4. Conclusions
The present study has shown that the production of specific 3D-microtextures on steel substrates using an ultra-short pulsed laser was feasible and the reproducibility of the texture dimensions over the entire textured regions was extremely good.
LIPSSs are the initial features produced during the formation of self-ordered hierarchical micro- and nano-textures. By nature, self-ordered structures are not predictable in any minute aspect of their shape. It was demonstrated that knowledge of optical and structural feedback mechanisms can become a tool to steer the metamorphosis from LIPSS towards desired surface structures for specific applications, or to suppress their formation (for example pinholes) when a smooth ablation area is required. A very simple approach for controlling pinhole formation was found: to suppress pinhole formation, the rule is to orientate the laser polarization perpendicular to the scan direction; to promote their formation, the rule is to orientate the laser polarization parallel to the scan direction. Additional polarization flipping by 90° after some consecutive laser ablation scans leads to further improvements in terms of surface texture quality (smoothness). Pinholes are the intermediate state towards the formation of self-ordered microbumps. Applying these simple ablation rules provides a tool to generate tailored self-ordered, hierarchical micro- and nano-textures for implementation in tribological applications.
Unfortunately, the application of an antifriction coating onto the 3D-textures did, however, greatly modify their topography: 3D-textures became more rounded and the height differences between each plateau were drastically reduced.
Tribological investigations under oil-lubricated conditions have shown that the 3D-microtexture does not show any significant COF improvements when compared to the benchmark over the entire load range studied: COF for the oil-lubricated benchmark was between 0.10 and 0.12 and for the oil-lubricated 3D-textured samples, between 0.13 and 0.15.
However, tribological investigations with an antifriction coating showed that the 3D-microtexture does show significant COF improvements when compared to the unlubricated coated benchmark over the entire load range studied: COF for the coated benchmark was between 0.25 and 0.30, and for the coated 3D-textured samples, between 0.20 and 0.22. However, the friction measured for the coated 3D-texture was still slightly higher than for the oil-lubricated benchmark; therefore, from the point of view of comparing only the friction coefficients, the 3D-texture under study may not be easily seen as an interesting alternative to oil-lubricated blank steel.
Wear-based tribological tests (125 N; 2 h) have shown that the antifriction coating on the benchmark samples was completely depleted, which greatly influenced their friction and wear behavior. Wear-based tribological tests with 3D-textured samples have shown that linear grooves were produced on the cylinder surface by the 3D-texture, but only for the samples aligned with an angle of 90° to the direction of motion. This phenomenon is due to the geometrical aspects caused by the orientation of the 3D-texture with respect to the direction of motion during the wear tests.
A comparison of wear rate results showed that 3D microtextures with an orientation of 90° in combination with an antifriction coating may drastically reduce wear of both the upper and lower samples. For 3D microtextures with a 45°-angle, disc wear remained similar to the benchmark, while cylinder wear slightly increased. The latter behavior for the 45°-angled 3D-texture was explained through a different nominal contact area and resulting real contact pressures.
Author Contributions
Conceptualization, J.V., J.Z., S.K.; methodology, J.V., J.Z., S.K.; formal analysis, J.V., J.Z., S.K., F.A., I.V.; investigation, J.V. and J.Z.; writing-original draft preparation, J.V. and J.Z.; writing-review and editing, J.V., J.Z., S.K., F.A., I.V.; project administration, J.V. and J.Z.
Funding
The work presented herein was funded by the Austrian COMET Programme (Project XTribology, no. 849109) and carried out at the “Excellence Centre of Tribology” (AC2T research GmbH) in cooperation with V-Research GmbH.
Acknowledgments
Carl Bechem GmbH (Hagen, Germany) is gratefully acknowledged for the suggestion and the free of charge application of an appropriate antifriction coating onto the disc specimens for the present tribological investigations. The authors would also like to thank Stephan Kasemann for tireless support in proofreading the manuscript, Heinz Duelli for valuable technical advises to obtain proper REM pictures, Thomas Auer for test sample preparation, Giovanni Piredda for many inspiring scientific discussions and Johannes Edlinger (head of Research Centre for Microtechnology) to cultivate a scope for interdisciplinary research. Open Access Funding by V-Research GmbH.
Conflicts of Interest
The authors declare no conflict of interest.
References
- Holmberg, K.; Kivikytö-Reponen, P.; Härkisaari, P.; Valtonen, K.; Erdemir, A. Global Energy Consumption due to Friction and Wear in the Mining Industry. Tribol. Int. 2017, 115, 116–139. [Google Scholar] [CrossRef]
- Sedlacek, M.; Podgornik, B.; Ramalho, A.; Cesnik, D. Influence of Geometry and the Sequence of Surface Texturing Process on Tribological Properties. Tribol. Int. 2017, 115, 268–273. [Google Scholar] [CrossRef]
- Sergejev, F.; Peetsalu, P.; Sivitski, A.; Saarna, M.; Adoberg, E. Surface Fatigue and Wear of PVD Coated Punches during Fine Blanking Operation. Eng. Fail. Anal. 2011, 18, 1689–1697. [Google Scholar] [CrossRef]
- Podgornik, B.; Hogmark, S.; Sandberg, O. Proper Coating Selection for Improved Galling Performance of Forming Tool Steel. Wear 2006, 261, 15–21. [Google Scholar] [CrossRef]
- Leskovsek, V.; Podgornik, B. Vacuum Heat Treatment, Deep Cryogenic Treatment and Simultaneous Pulse Plasma Nitriding and Tempering of P/M S390MC Steel. Mater. Sci. Eng. A 2012, 531, 119–129. [Google Scholar] [CrossRef]
- Voevodin, A.A.; Zabinski, J.S. Laser Surface Texturing for Adaptive Solid Lubrication. Wear 2006, 261, 11–12, 1285–1292. [Google Scholar] [CrossRef]
- Voyer, J.; Klien, S.; Ausserer, F.; Velkavrh, I.; Ristow, A.; Diem, A. Friction Reduction Through Sub-Micro Laser Surface Modifications. Tribologie und Schmierungstechnik 2015, 62, 13–18. [Google Scholar]
- Gachot, C.; Rosenkranz, A.; Hsu, S.M.; Costa, H.L. A Critical Assessment of Surface Texturing for Friction and Wear Improvement. Wear 2017, 372–373, 21–41. [Google Scholar] [CrossRef]
- Podgornik, B.; Sedlacek, M. Performance, Characterization and Design of Textured Surfaces. J. Tribol. 2012, 134, 1–7. [Google Scholar] [CrossRef]
- Vilhena, L.M.; Podgornik, B.; Vizintin, J.; Mozina, J. Influence of Texturing Parameters and Contact Conditions on Tribological Behaviour of Laser Textured Surfaces. Meccanica 2011, 46, 567–575. [Google Scholar] [CrossRef]
- Voyer, J.; Ausserer, F.; Klien, S.; Ristow, A.; Velkavrh, I.; Diem, A.; Zehetner, J.; Stroj, S.; Heidegger, S.; Bertschler, C.; et al. Sub-Micro Laser Modifications of Tribological Surfaces. Mater. Perform. Charact. 2017, 6, 42–67. [Google Scholar] [CrossRef]
- Vladescu, S.C.; Olver, A.V.; Pegg, I.G.; Reddyhoff, T. The Effects of Surface Texture in Reciprocating Contacts—An Experimental Study. Tribol. Int. 2015, 82A, 28–42. [Google Scholar] [CrossRef]
- Andersson, P.; Koskinen, J.; Varjus, S.; Gerbig, Y.; Haefke, H.; Georgiou, S.; Zhmud, B.; Buss, W. Microlubrication Effect by Laser-Textured Steel Surfaces. Wear 2007, 262, 369–379. [Google Scholar] [CrossRef]
- Cho, M.H.; Park, S. Micro CNC Surface Texturing on Polyoxymethylene (POM) and its Tribological Performance in Lubricated Sliding. Tribol. Int. 2011, 44, 859–867. [Google Scholar] [CrossRef]
- Biboulet, N.; Bouassida, H.; Lubrecht, A.A. Cross Hatched Texture Influence on the Load Carrying Capacity of Oil Control Rings. Tribol. Int. 2015, 82A, 12–19. [Google Scholar] [CrossRef]
- Huang, W.; Jiang, L.; Zhou, C.; Wang, X. The Lubricant Retaining Effect of Micro-Dimples on the Sliding Surface of PDMS. Tribol. Int. 2012, 52, 87–93. [Google Scholar] [CrossRef]
- Suh, M.S.; Chae, Y.H.; Kim, S.S.; Hinoki, T.; Kohyama, A. Effect of Geometrical Parameters in Micro-Grooved Crosshatch Pattern under Lubricated Sliding Friction. Tribol. Int. 2010, 43, 1508–1517. [Google Scholar] [CrossRef]
- Wakuda, M.; Yamauchi, Y.; Kanzaki, S.; Yasuda, Y. Effect of Surface Texturing on Friction Reduction Between Ceramic and Steel Materials under Lubricated Sliding Contact. Wear 2003, 254, 356–363. [Google Scholar] [CrossRef]
- Bonse, J.; Höhm, S.; Kirner, S.V.; Rosenfeld, A.; Krüger, J. Laser-Induced Periodic Surface Structures—A Scientific Evergreen. IEEE J. Sel. Top. Quantum Electron. 2017, 23, 9000615. [Google Scholar] [CrossRef]
- Zehetner, J.; Kraus, S.; Lucki, M.; Vanko, G.; Dzuba, J.; Lalinsky, T. Manufacturing of Membranes by Laser Ablation in SiC, Sapphire, Glass and Ceramic for GaN/Ferroelectric Thin Film MEMS and Pressure Sensors. Microsyst. Technol. 2016, 22, 1883–1892. [Google Scholar] [CrossRef]
- Zehetner, J.; Vanko, G.; Dzuba, J.; Lalinsky, T. Femtosecond Laser Processing of Membranes for Sensor Devices on Different Bulk Materials. Appl. Phys. 2017, 15, 561–568. [Google Scholar] [CrossRef]
- Voyer, J.; Ausserer, F.; Klien, S.; Velkavrh, I.; Diem, A. Reduction of the Adhesive Friction of Elastomers through Laser Texturing of Injection Molds. Lubricants 2017, 5, 45. [Google Scholar] [CrossRef]
- Bonse, J.; Krüger, J.; Höhm, S.; Rosenfeld, A. Femtosecond Laser Induced Periodic Surface Structures. J. Laser Appl. 2012, 24. [Google Scholar] [CrossRef]
- Varlamova, O.; Reif, J.; Varlamov, S.; Bestehorn, M. The Laser Polarization as Control Parameter in the Formation of Laser-Induced Periodic Surface Structures: Comparison of Numerical and Experimental Results. Appl. Surf. Sci. 2011, 257, 5465–5469. [Google Scholar] [CrossRef]
- Yao, J.W.; Zhang, C.Y.; Liu, H.Y.; Dai, Q.F.; Wu, L.J.; Lan, S.; Gopal, A.V.; Trofimov, V.A.; Lysak, T.M. High Spatial Frequency Periodic Structures on Metal Surface by Femtosecond Laser Pulses. Opt. Express 2012, 20, 905–911. [Google Scholar] [CrossRef] [PubMed]
- Ji, X.; Jiang, L.; Li, X.; Han, W.; Liu, Y.; Wang, A.; Lu, Y. Femtosecond Laser-Induced Cross-Periodic Structures on a Crystalline Silicon Surface under Low Pulse Number Irradiation. Appl. Surf. Sci. 2015, 326, 216–221. [Google Scholar] [CrossRef]
Figure 1.
Geometries of the samples used in the present study: (a) cylinder (upper specimen) and (b) disc (lower specimen) (Note: drawings are not to scale).
Figure 1.
Geometries of the samples used in the present study: (a) cylinder (upper specimen) and (b) disc (lower specimen) (Note: drawings are not to scale).
Figure 2.
Different processed disc surfaces investigated in the present study: (a) benchmark disc, (b) benchmark disc with an antifriction-coating, (c) 3D microtextured disc and (d) 3D microtextured disc with an antifriction coating.
Figure 2.
Different processed disc surfaces investigated in the present study: (a) benchmark disc, (b) benchmark disc with an antifriction-coating, (c) 3D microtextured disc and (d) 3D microtextured disc with an antifriction coating.
Figure 3.
Example of the desired 3D surface microtexture to be produced using an ultra-short pulsed laser on one side of disc specimens.
Figure 3.
Example of the desired 3D surface microtexture to be produced using an ultra-short pulsed laser on one side of disc specimens.
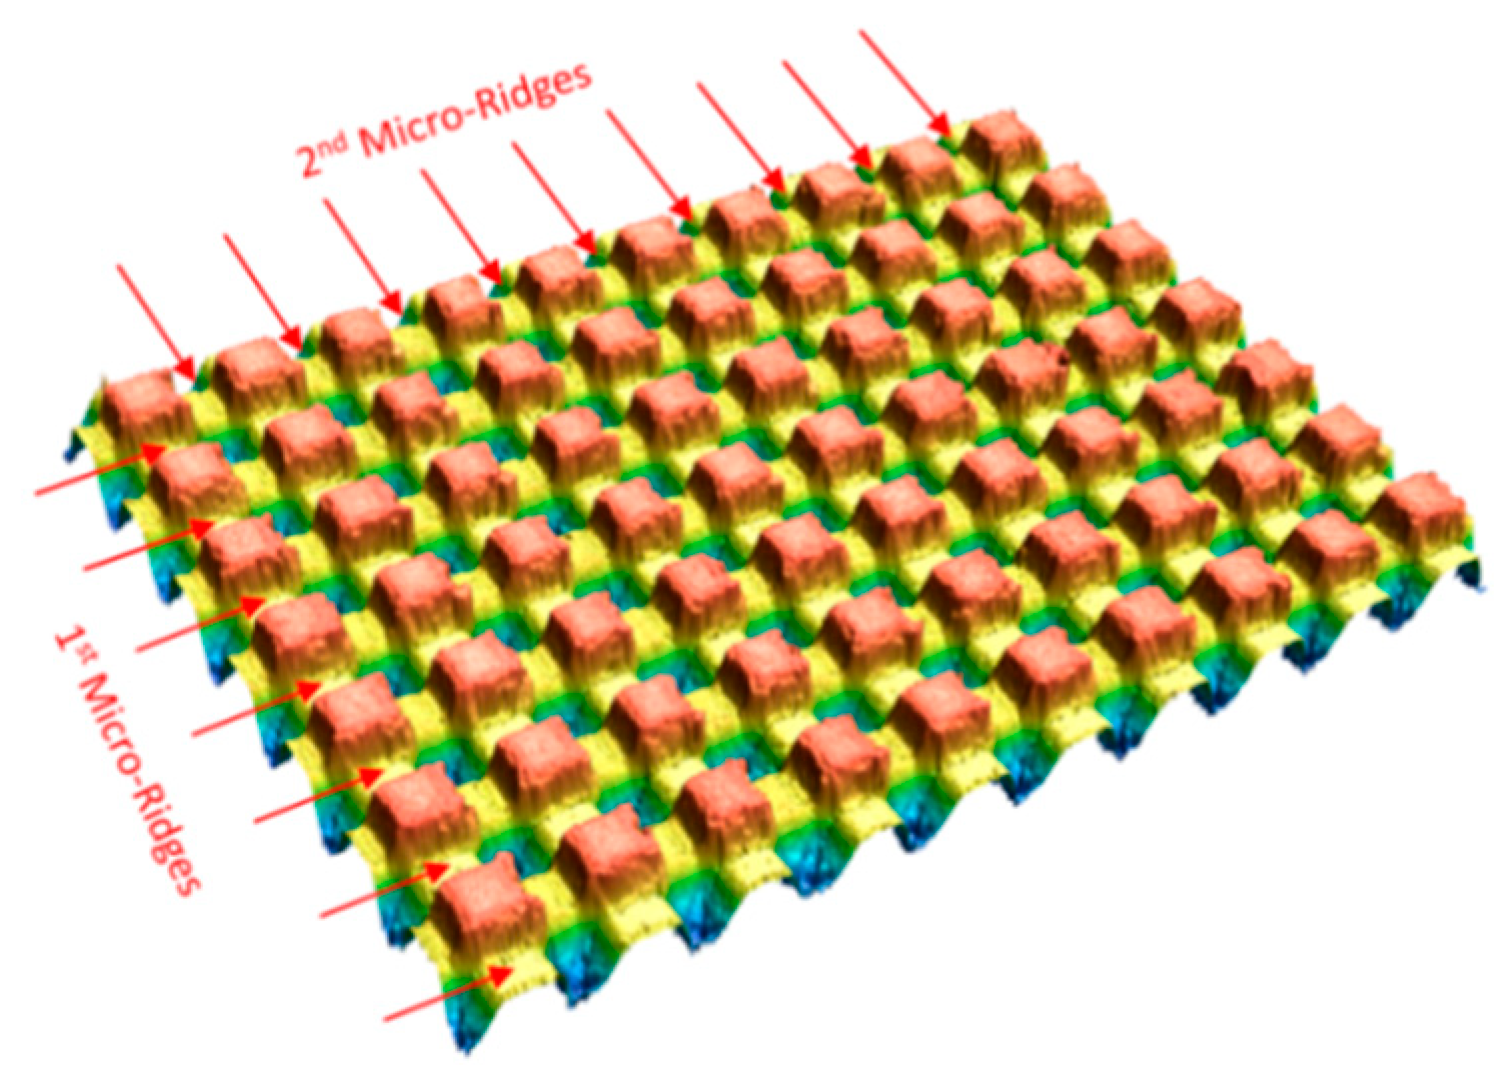
Figure 4.
Micrographs: (a) 3D microtextured disc; (b) test trench (hatch intersect the LIPSS).
Figure 5.
Surface quality after laser ablation: (a) reduced laser power and polarization of final scan cycle parallel to scan direction; (b) increased laser power and number of scans, but polarization of the last scan cycle perpendicular to the scan direction.
Figure 5.
Surface quality after laser ablation: (a) reduced laser power and polarization of final scan cycle parallel to scan direction; (b) increased laser power and number of scans, but polarization of the last scan cycle perpendicular to the scan direction.
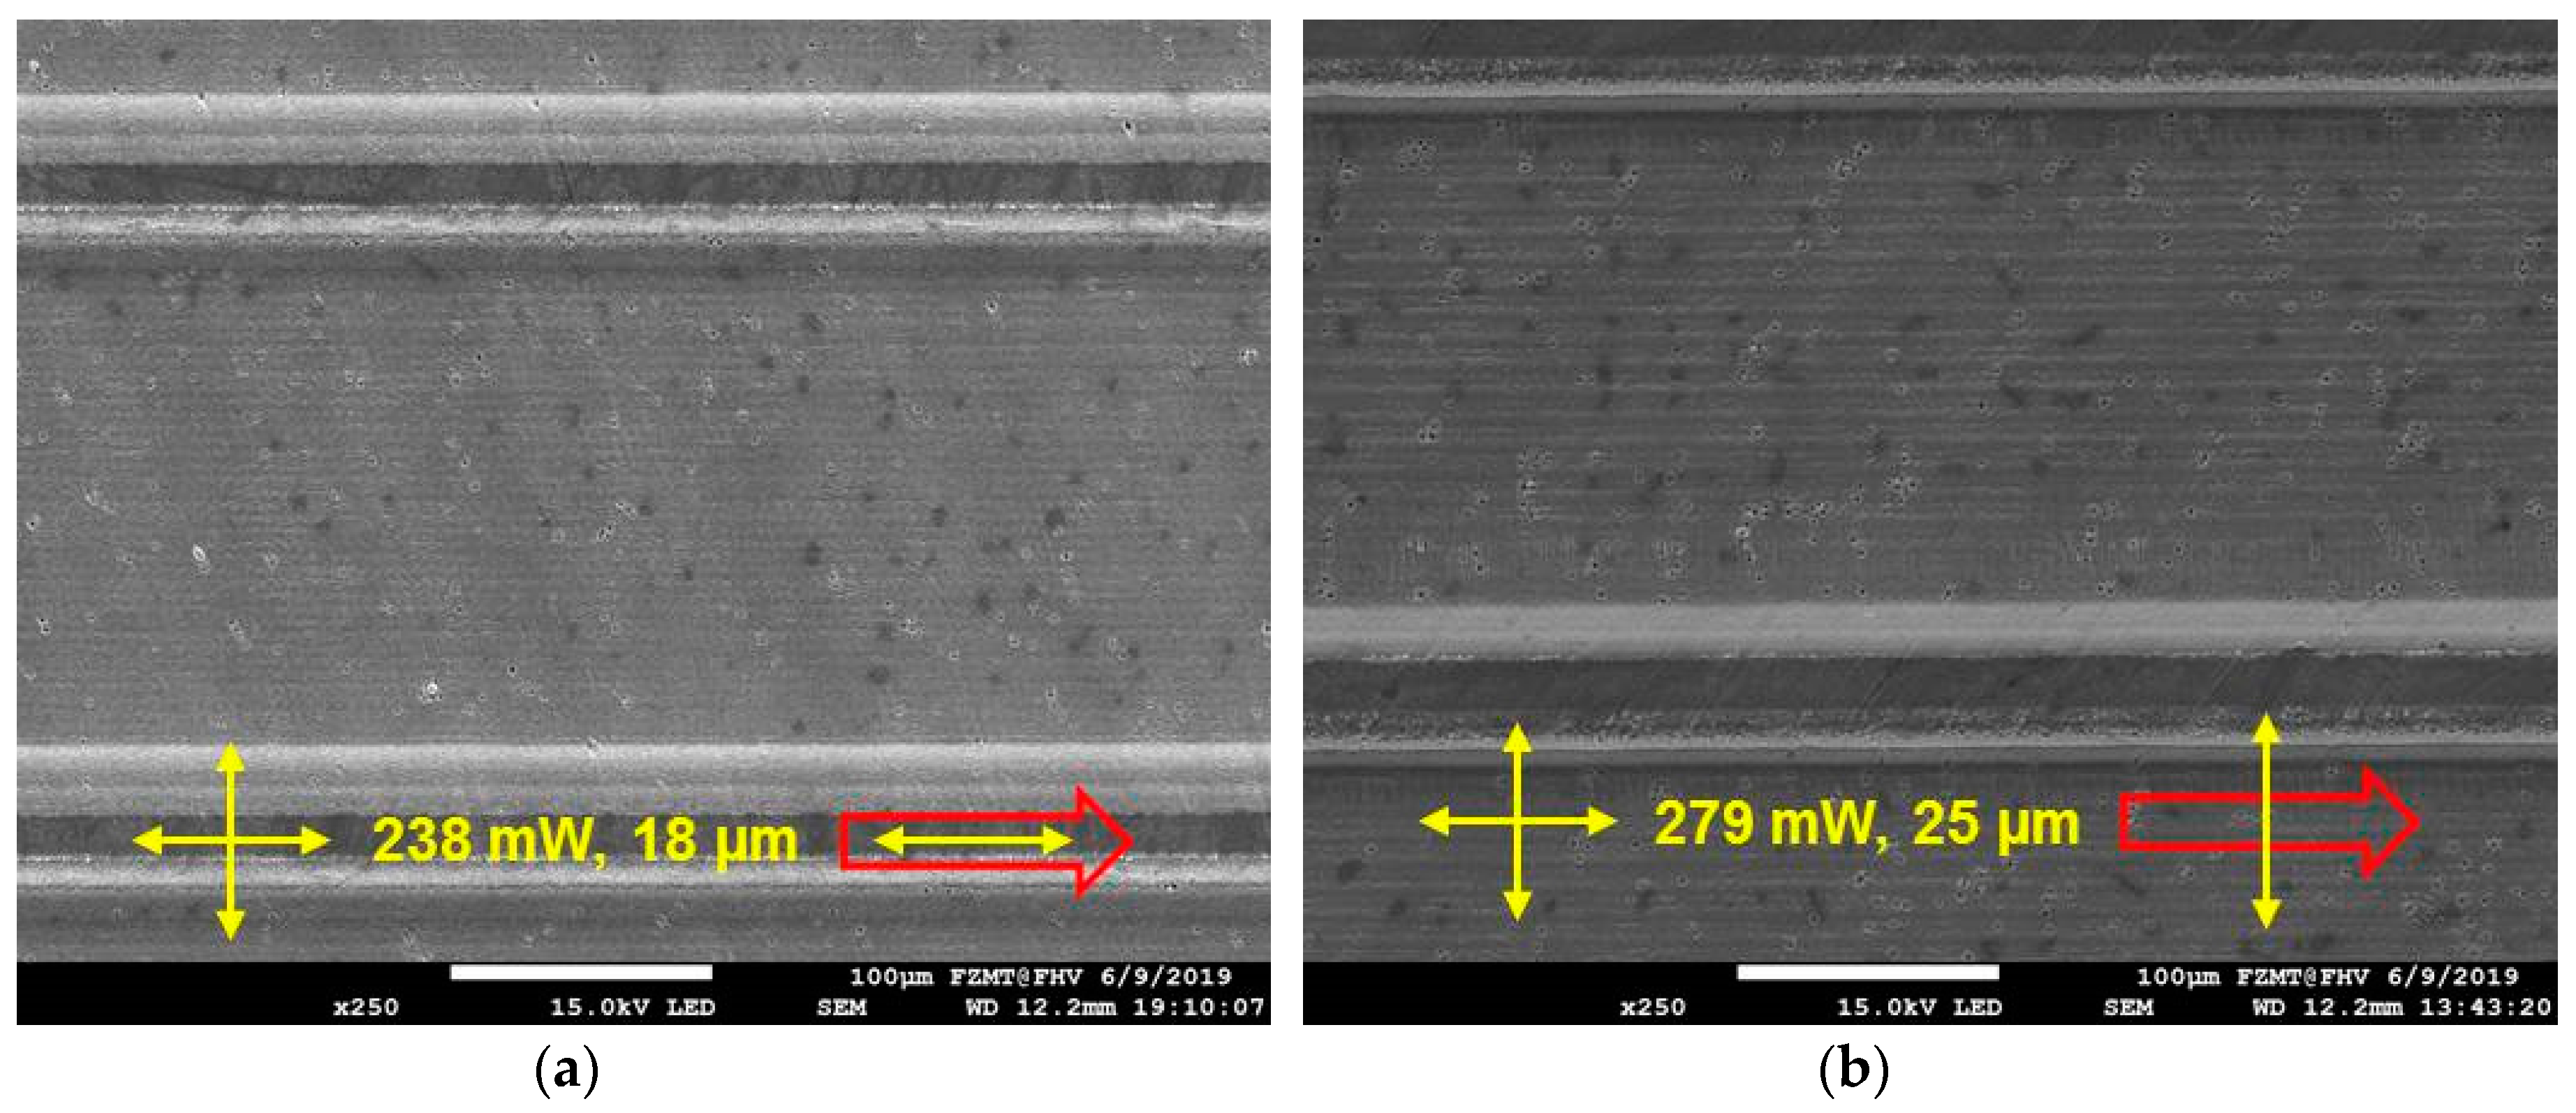
Figure 6.
Surface quality after laser ablation without any polarization flipping: (a) polarization permanently parallel to scan direction; (b) polarization permanently perpendicular to scan direction.
Figure 6.
Surface quality after laser ablation without any polarization flipping: (a) polarization permanently parallel to scan direction; (b) polarization permanently perpendicular to scan direction.
Figure 7.
Micrographs: (a) LIPSS intersections perpendicular to their orientation where small pinhole formation starts; (b) same laser procedure as in Figure 5b but with enlarged scale (polarization of the last scan cycle was perpendicular to the scan direction).
Figure 7.
Micrographs: (a) LIPSS intersections perpendicular to their orientation where small pinhole formation starts; (b) same laser procedure as in Figure 5b but with enlarged scale (polarization of the last scan cycle was perpendicular to the scan direction).
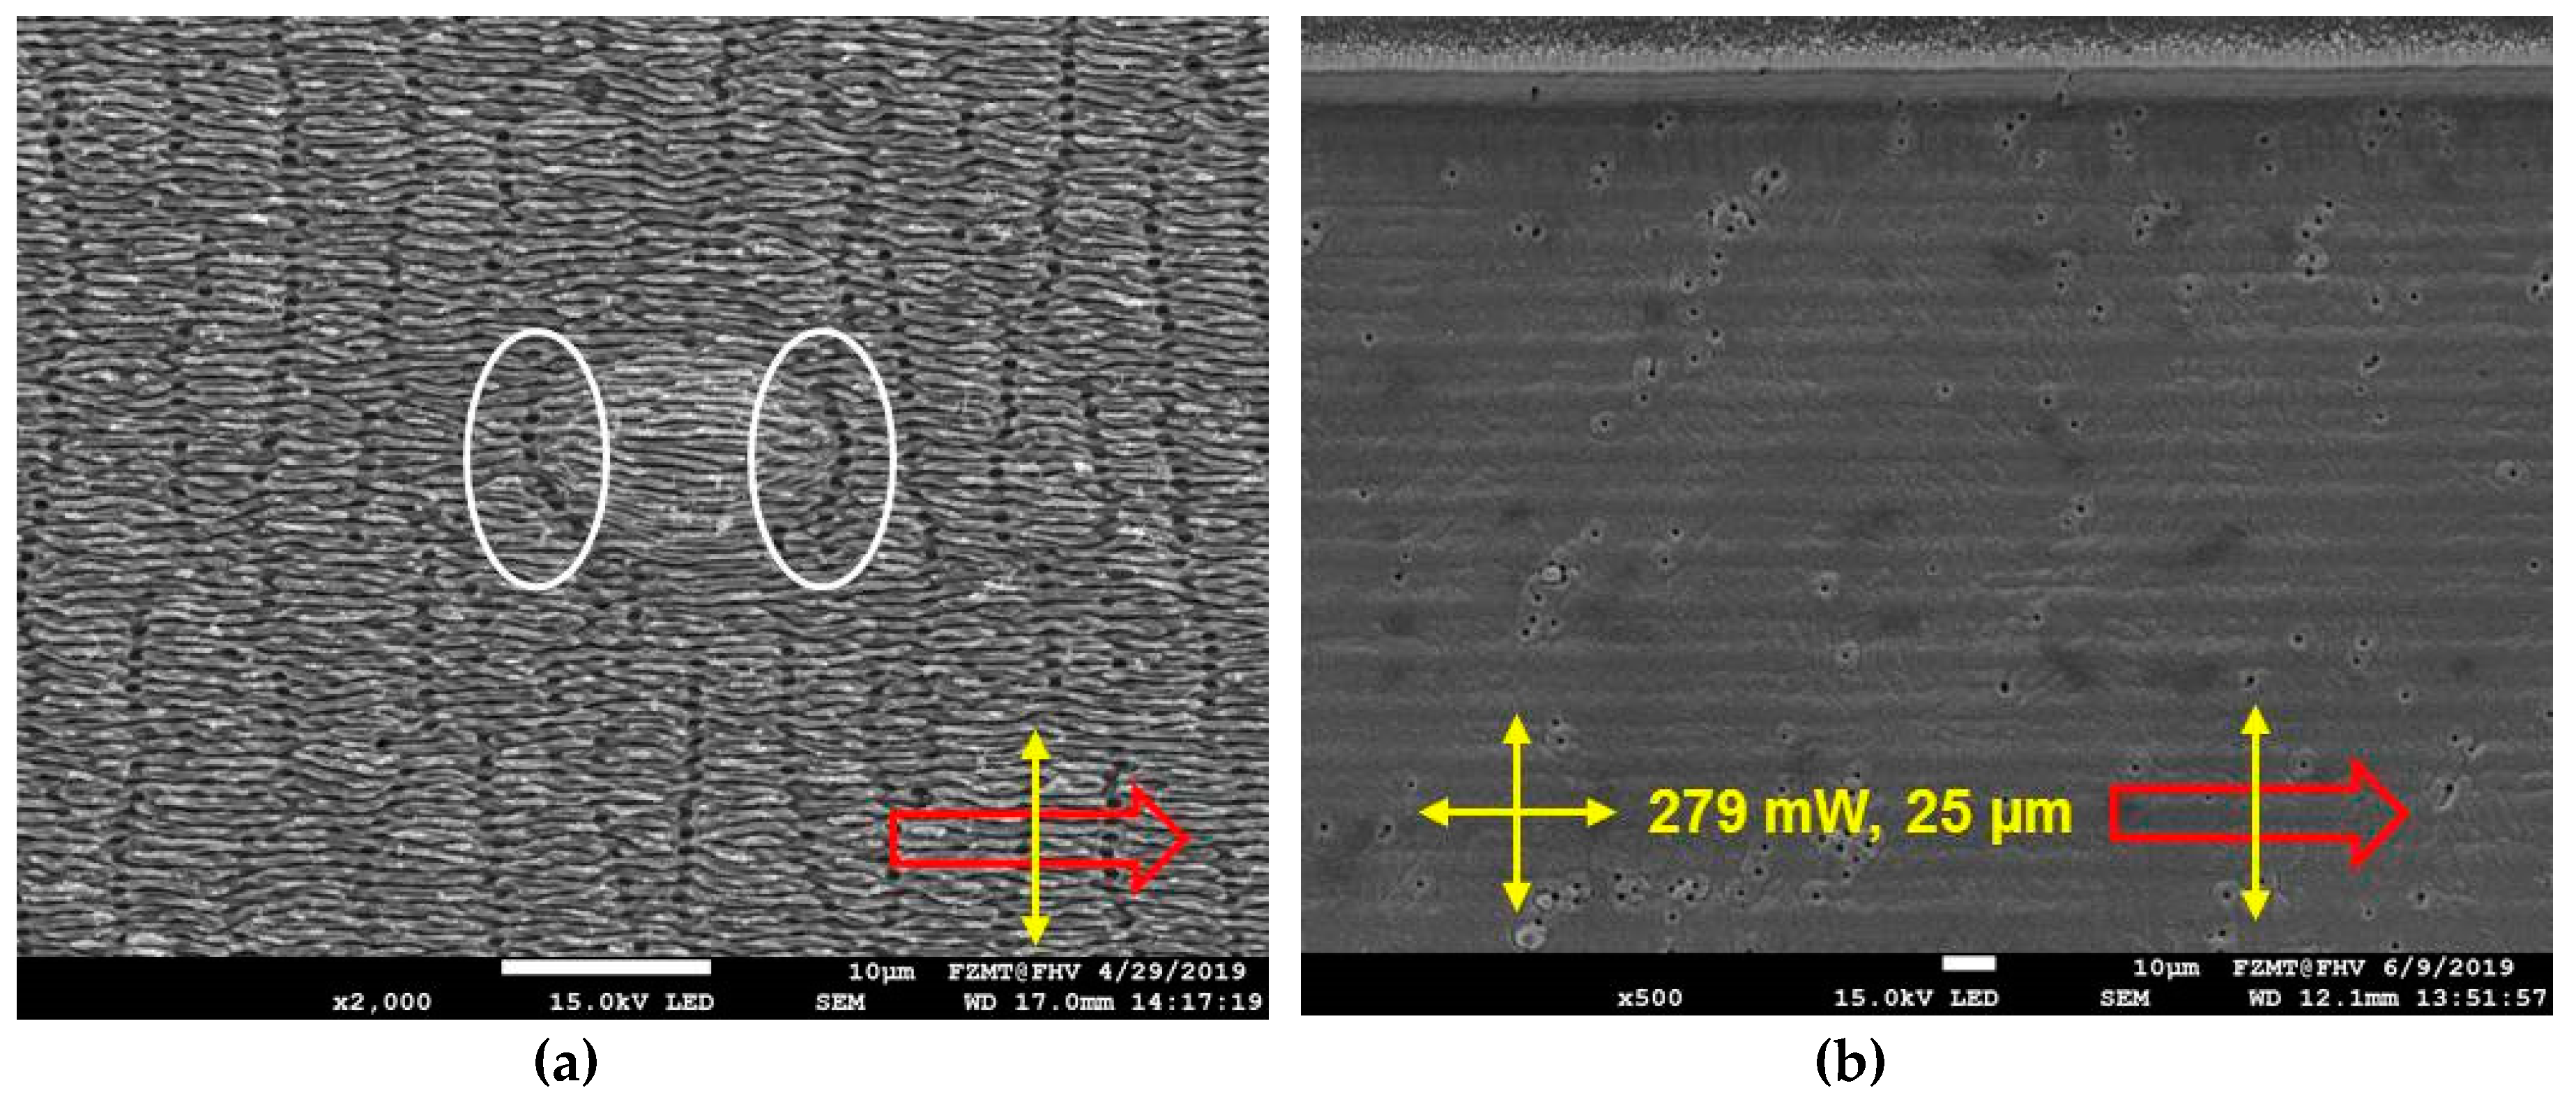
Figure 8.
Schematic representation of the load-varying tribological tests used for the determination of the dynamic friction coefficients.
Figure 8.
Schematic representation of the load-varying tribological tests used for the determination of the dynamic friction coefficients.
Figure 9.
Example of raw signals obtained using FSA (high frequency signal acquisition) used for the calculation of both static and dynamic coefficients of friction (example shown: (a) benchmark (untextured samples) with oil at FN = 175 N and (b) 3D microtexturing with oil at FN = 175 N).
Figure 9.
Example of raw signals obtained using FSA (high frequency signal acquisition) used for the calculation of both static and dynamic coefficients of friction (example shown: (a) benchmark (untextured samples) with oil at FN = 175 N and (b) 3D microtexturing with oil at FN = 175 N).
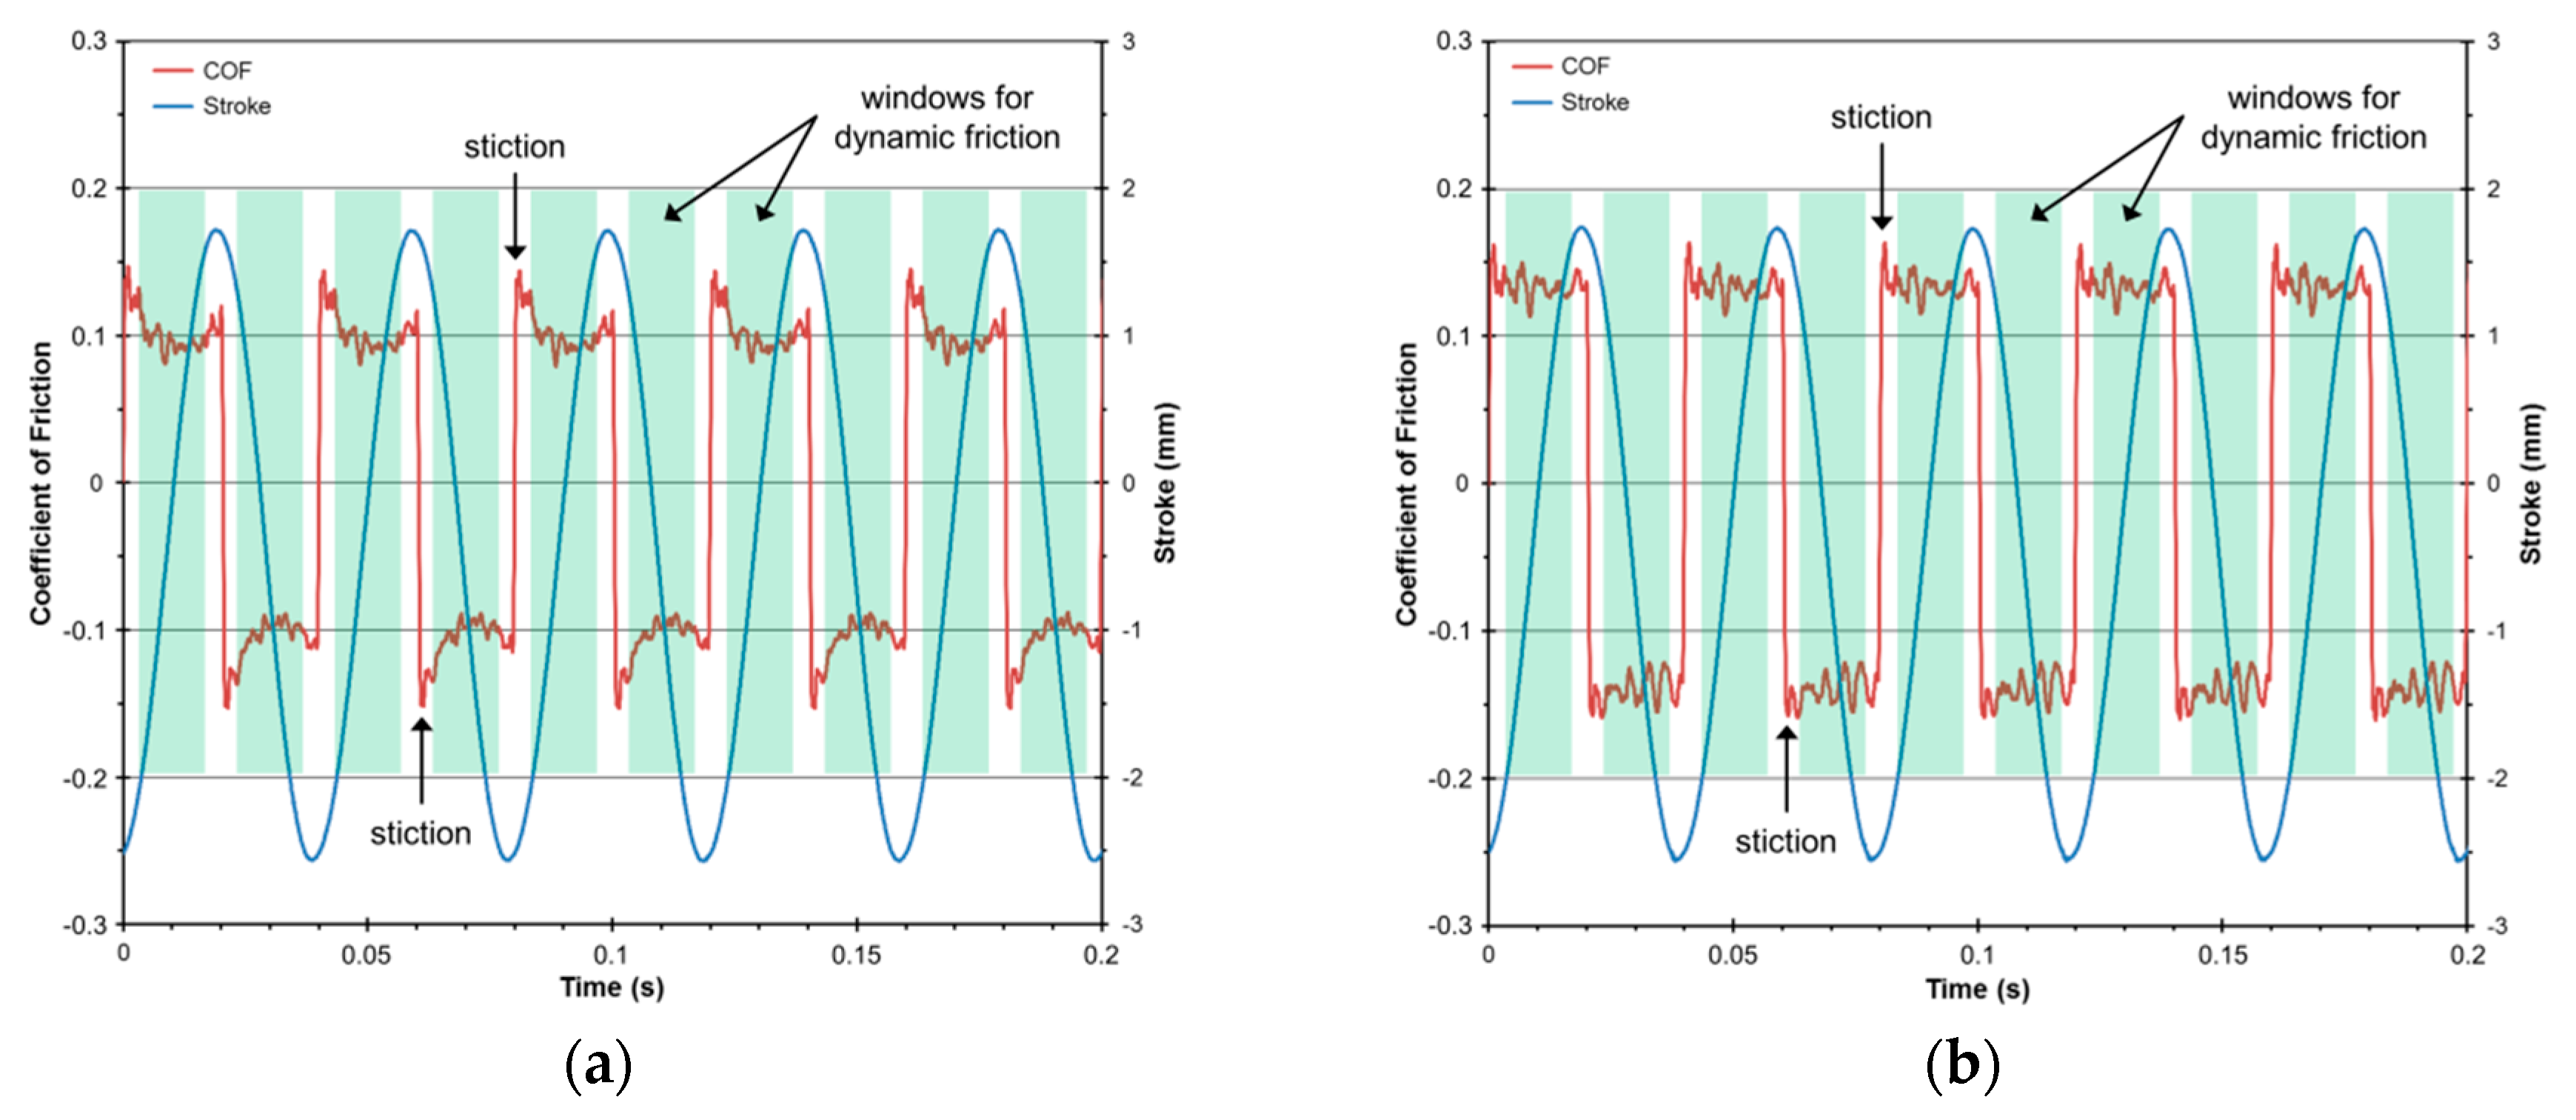
Figure 10.
Typical topographies of two selected 3D surface microtextures produced on disc specimens: (a) first sample; (b) second sample.
Figure 10.
Typical topographies of two selected 3D surface microtextures produced on disc specimens: (a) first sample; (b) second sample.
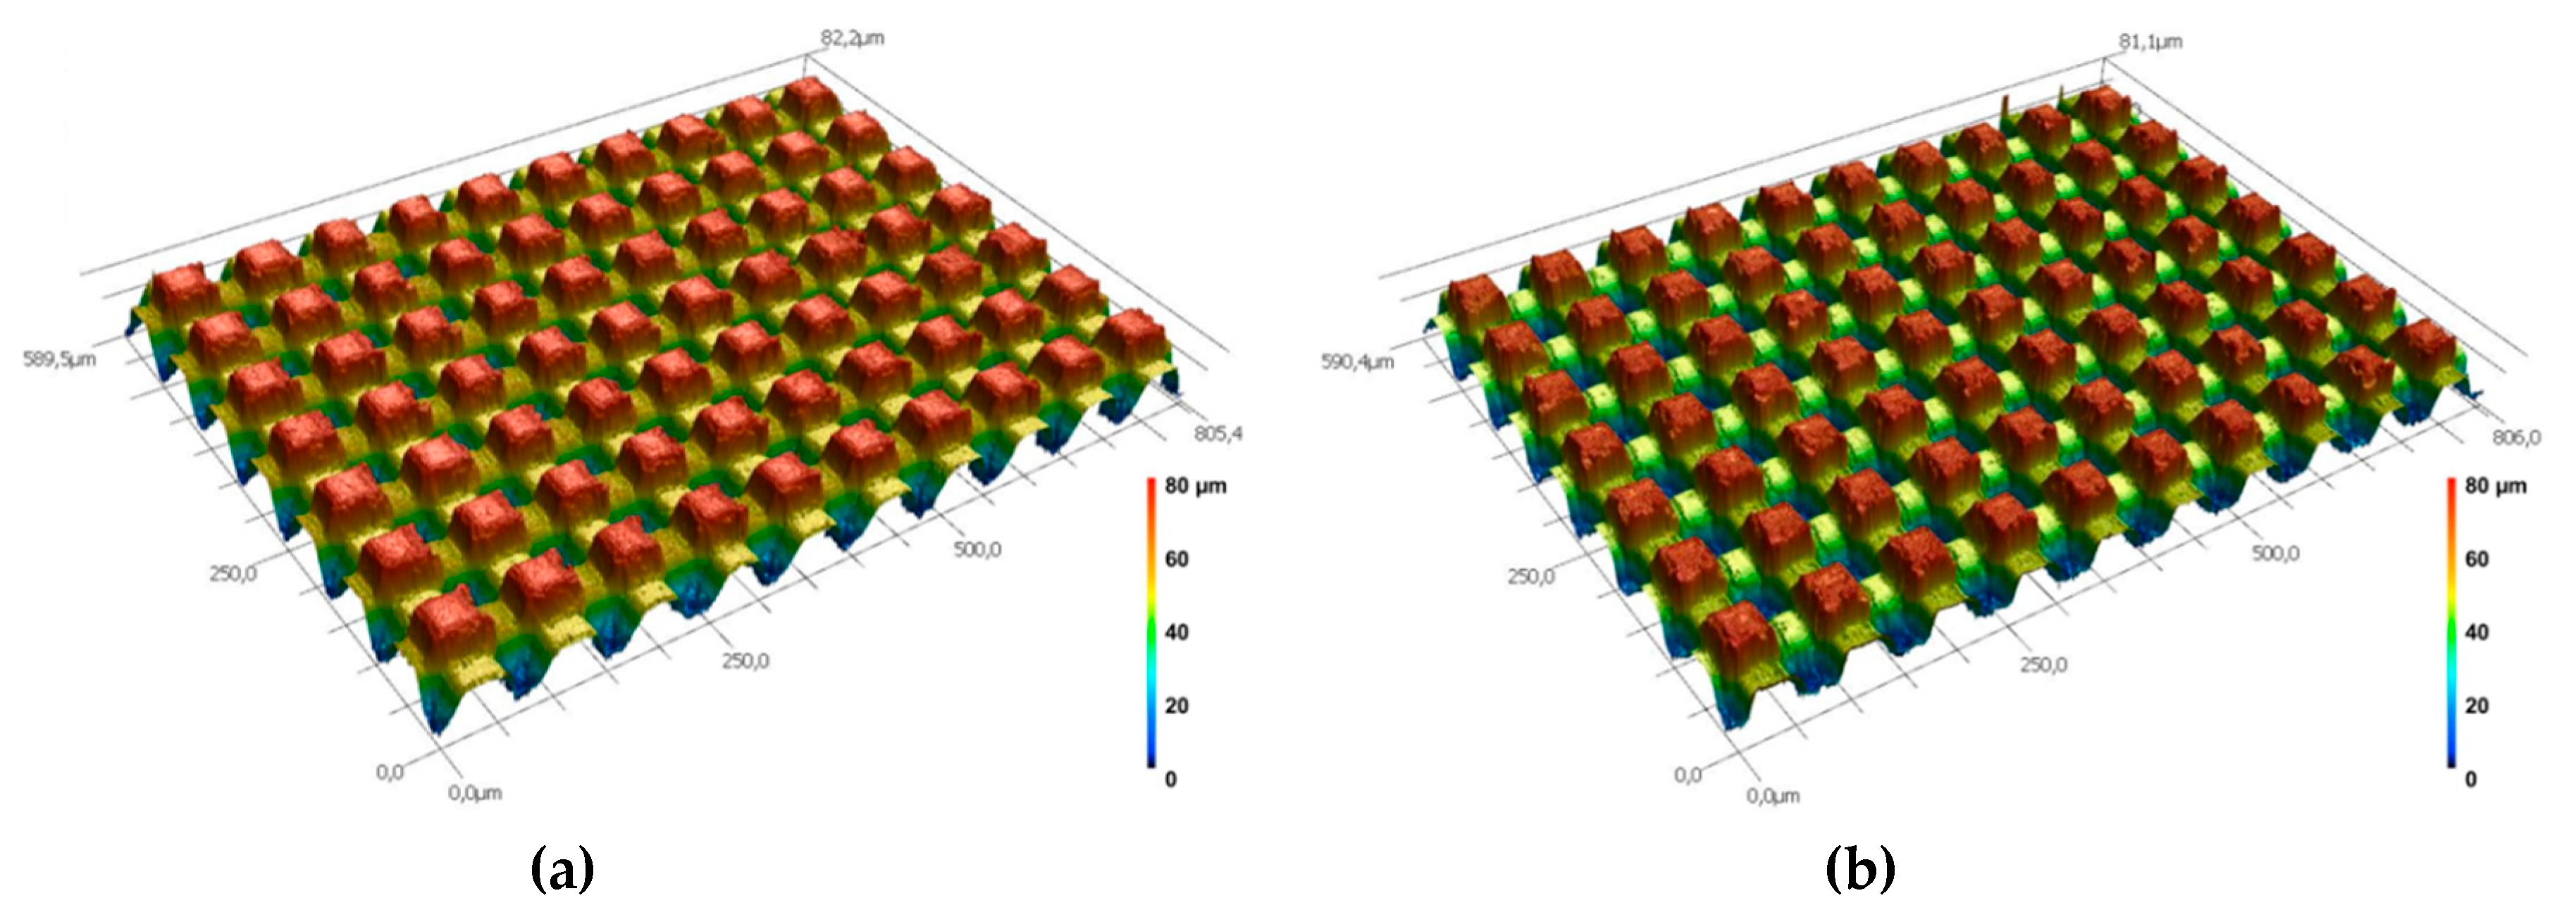
Figure 11.
Typical topographies of two selected 3D microtextured and antifriction coated disc specimens: (a) first sample; (b) second sample.
Figure 11.
Typical topographies of two selected 3D microtextured and antifriction coated disc specimens: (a) first sample; (b) second sample.
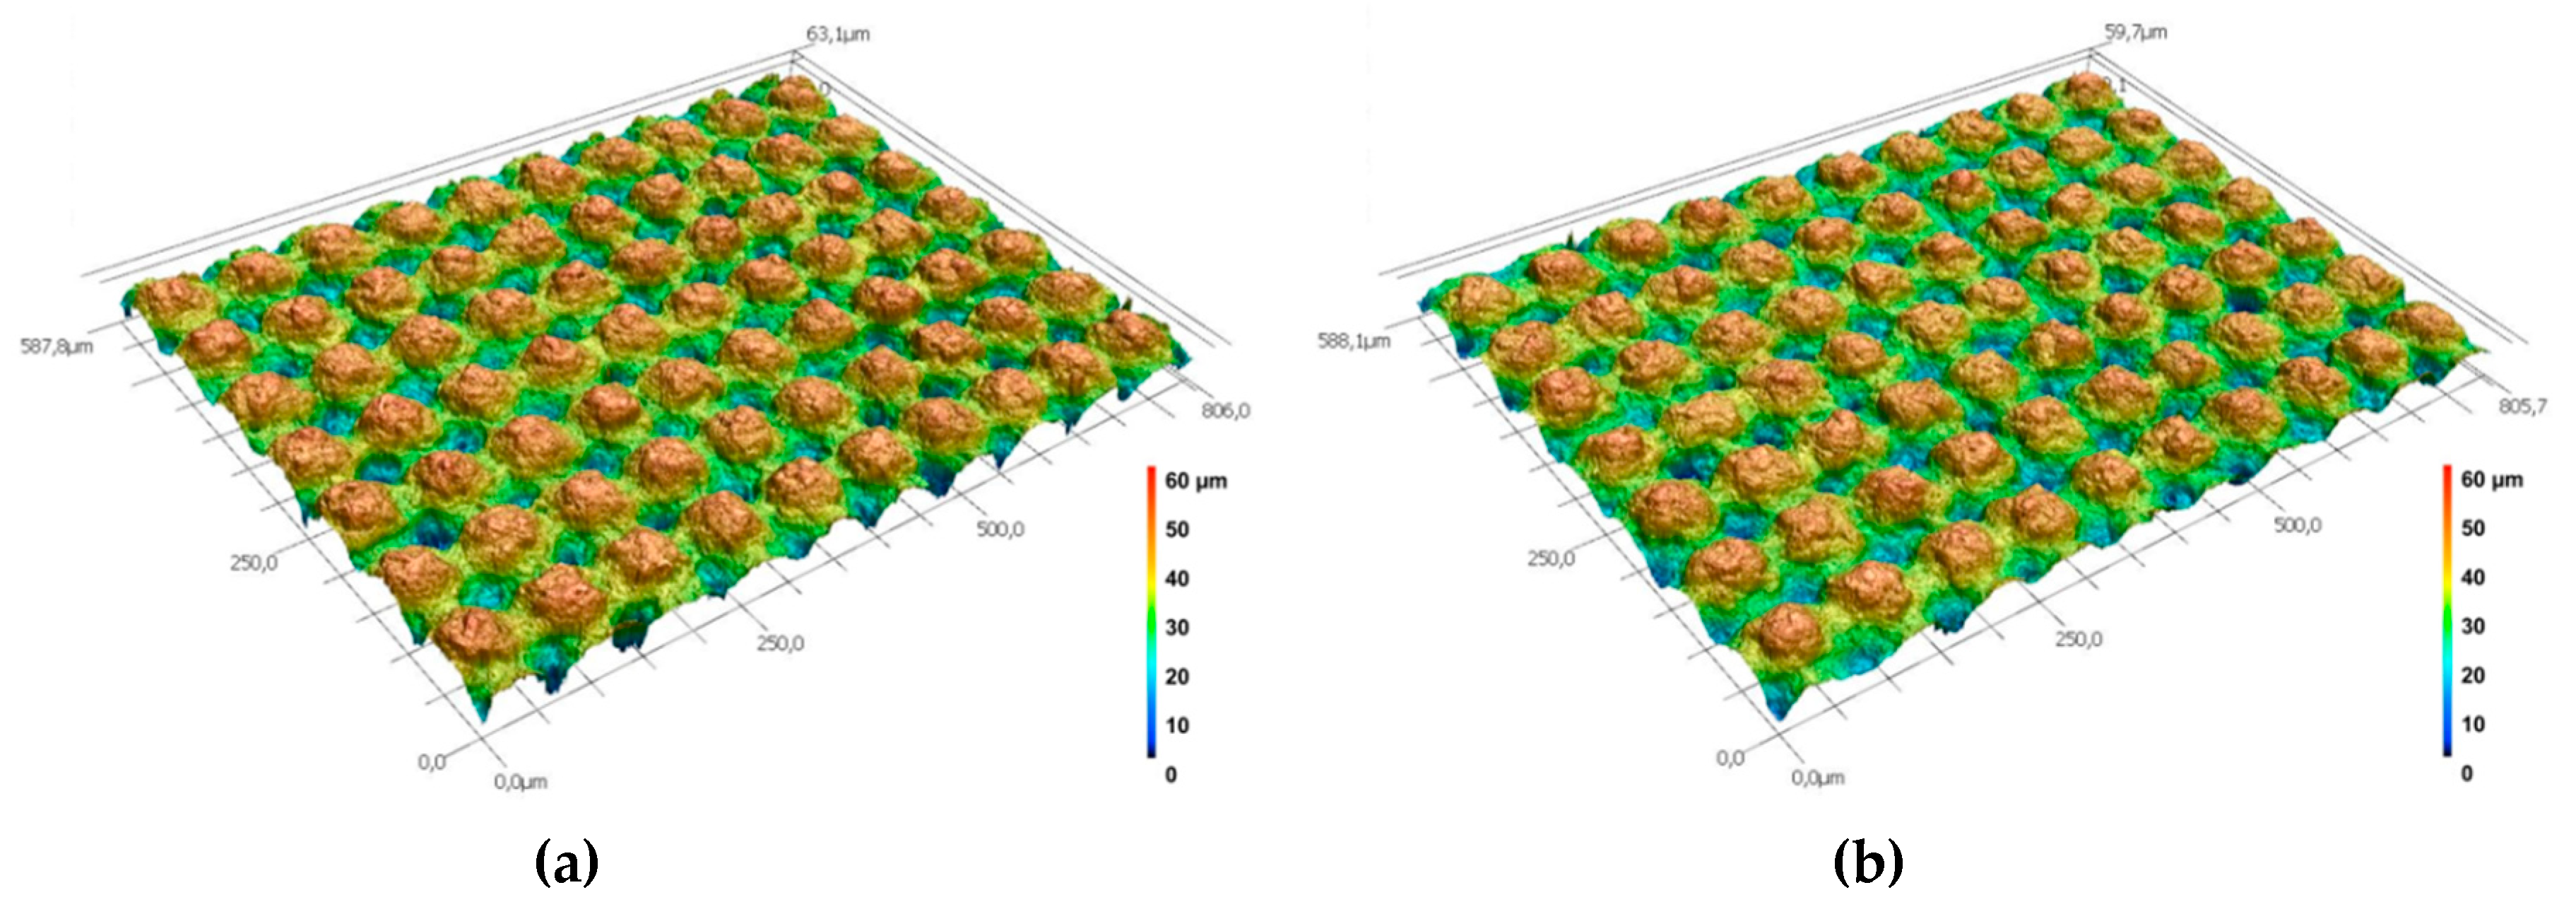
Figure 12.
Sliding coefficients of friction as a function of applied load: (a) benchmark with oil or antifriction coating AF320E, (b) 3D microtexture (90°) with oil or antifriction coating AF320E, and (c) comparison of all 3D microtexture results (note: different scales for y-axis).
Figure 12.
Sliding coefficients of friction as a function of applied load: (a) benchmark with oil or antifriction coating AF320E, (b) 3D microtexture (90°) with oil or antifriction coating AF320E, and (c) comparison of all 3D microtexture results (note: different scales for y-axis).
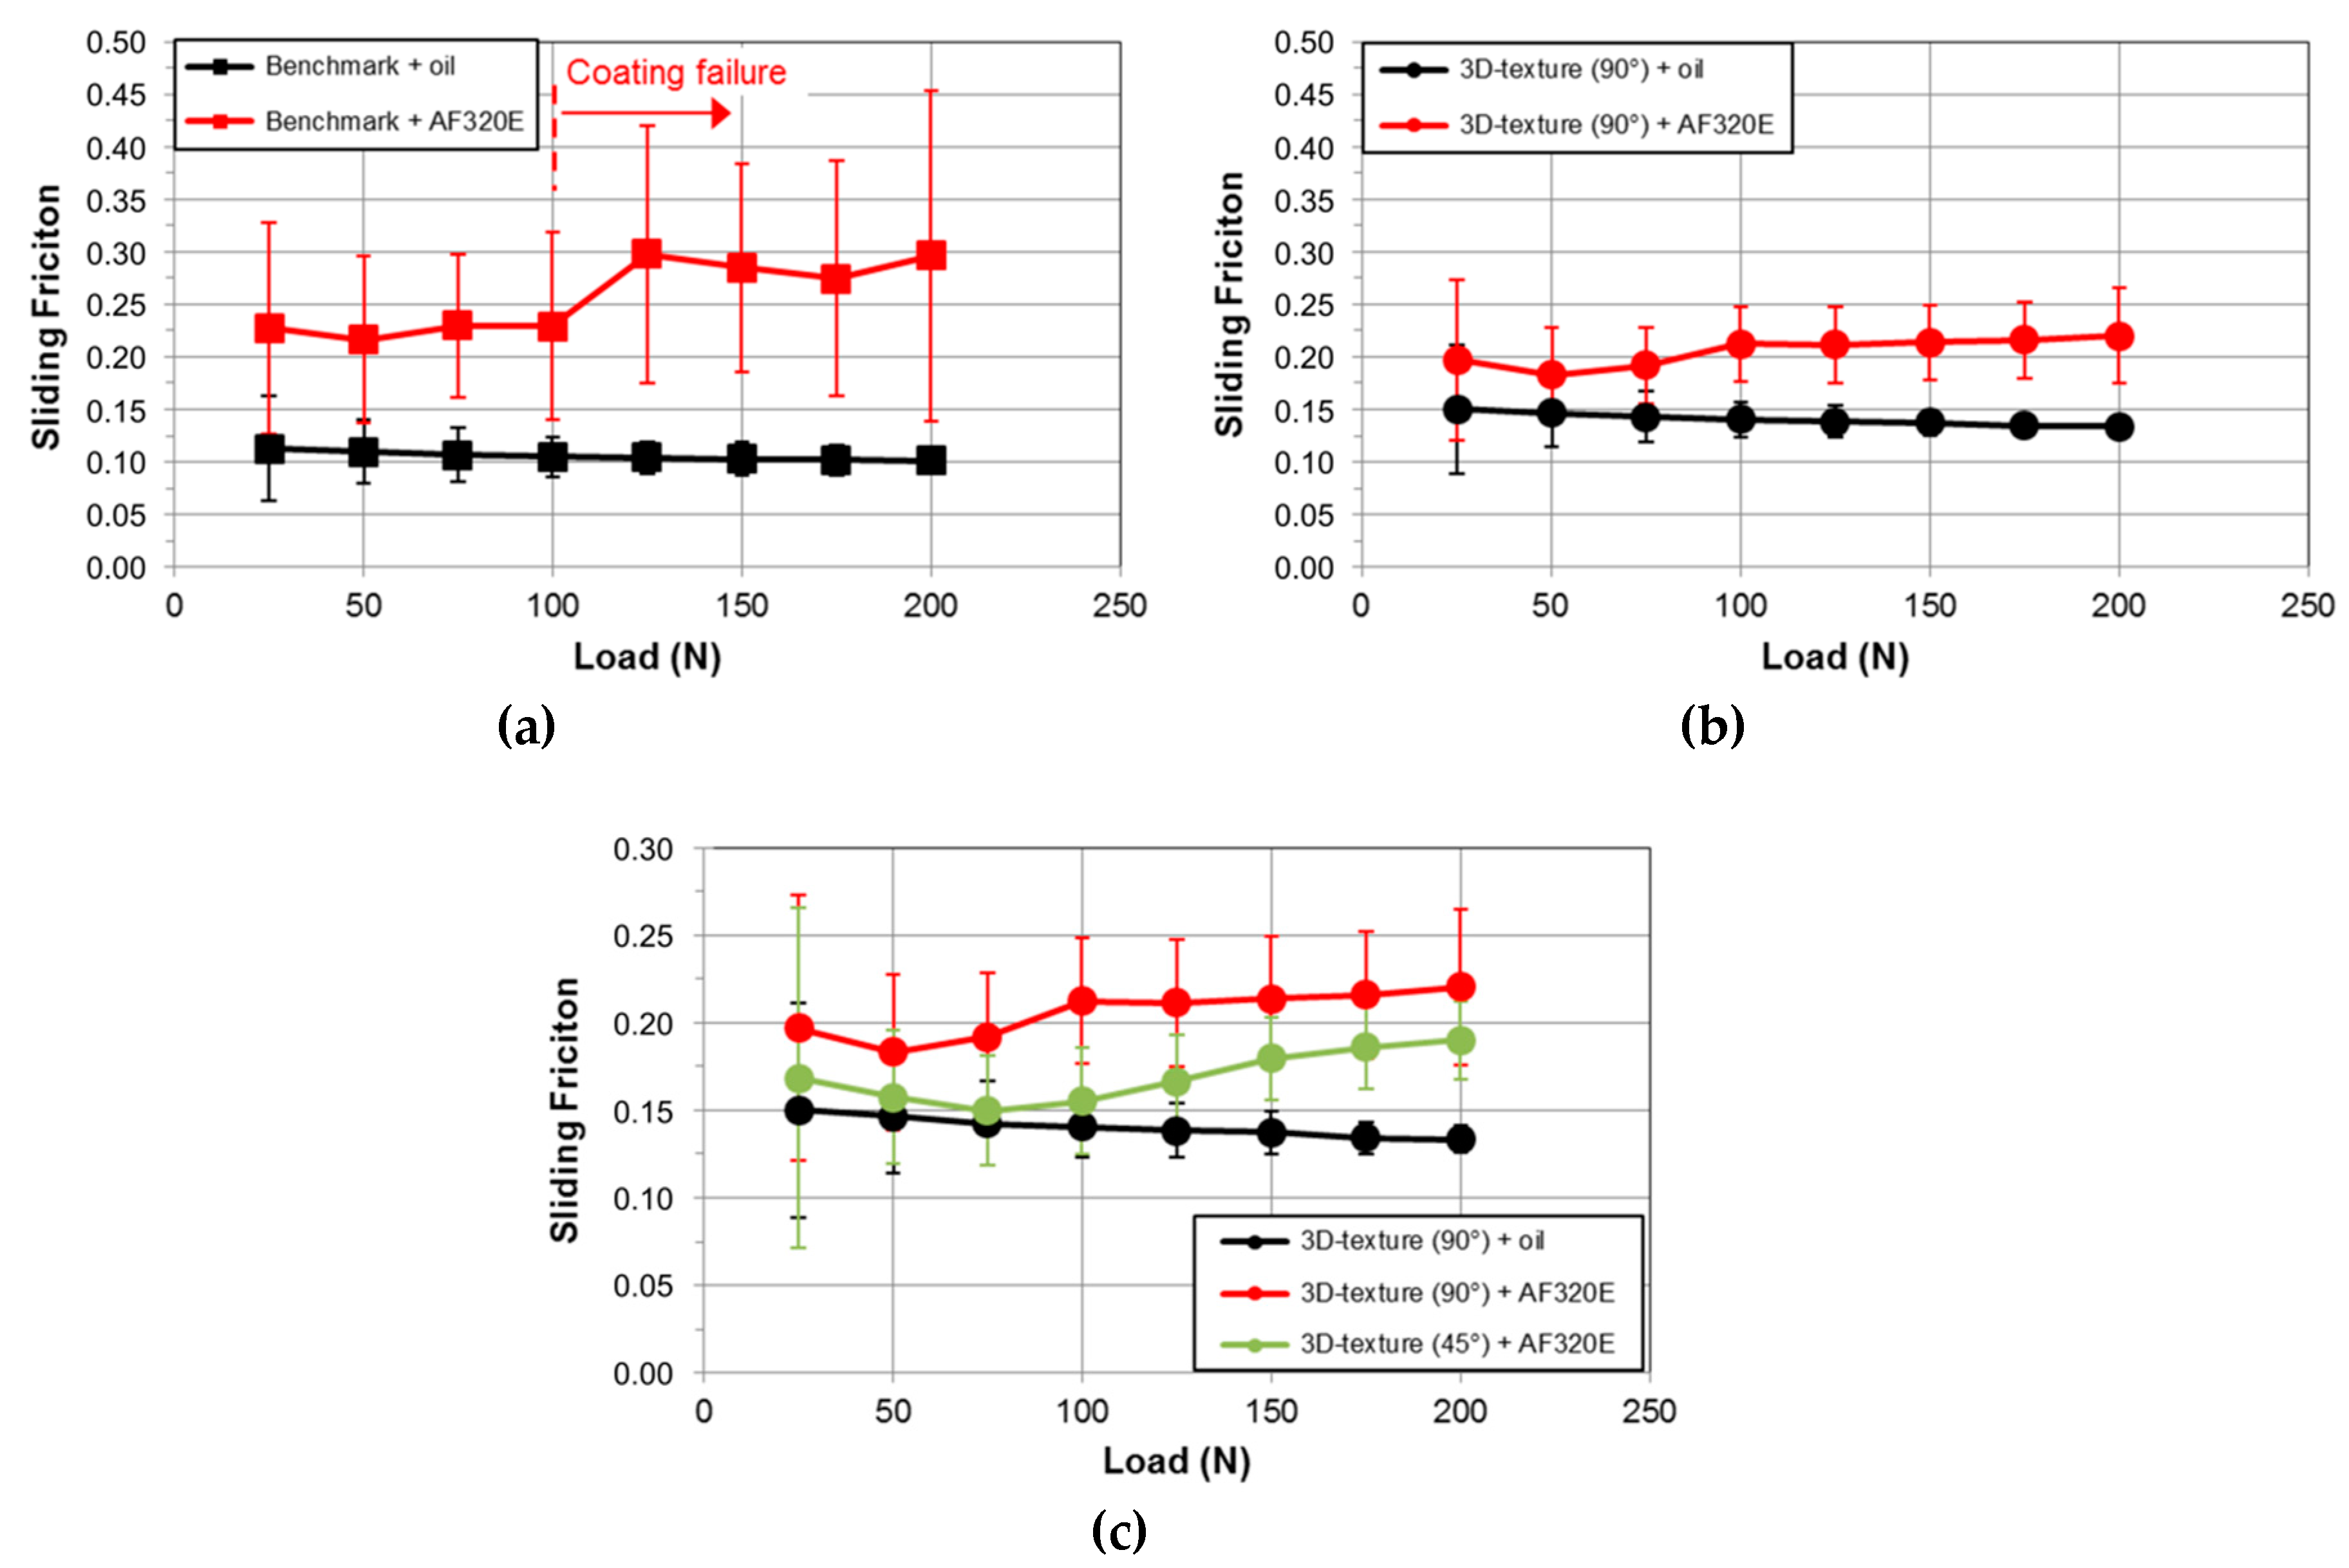
Figure 13.
Average coefficients of friction measured: (a) during wear resistance tests (long-term tribological tests: 125 N, 2 h) and (b) during load-varying tests (short-term tribological tests: 25–200 N, 5 min. per load level) (Figure 13 = partial combination of Figure 12a,c).
Figure 14.
Typical wear scars on cylinder and disc specimens after wear resistance tests obtained using laser microscopy.
Figure 14.
Typical wear scars on cylinder and disc specimens after wear resistance tests obtained using laser microscopy.
Figure 15.
Explanation of (a) presence of visible linear grooves (width of grooves = sides of plateaus ~37 µm) on cylinders for the 3D-texture with an angle of 90° to the direction of motion and (b) near absence of visible linear grooves (width of grooves = diagonals of plateaus = ~52 µm) on cylinders for the 3D-texture with an angle of 45° to the direction of motion.
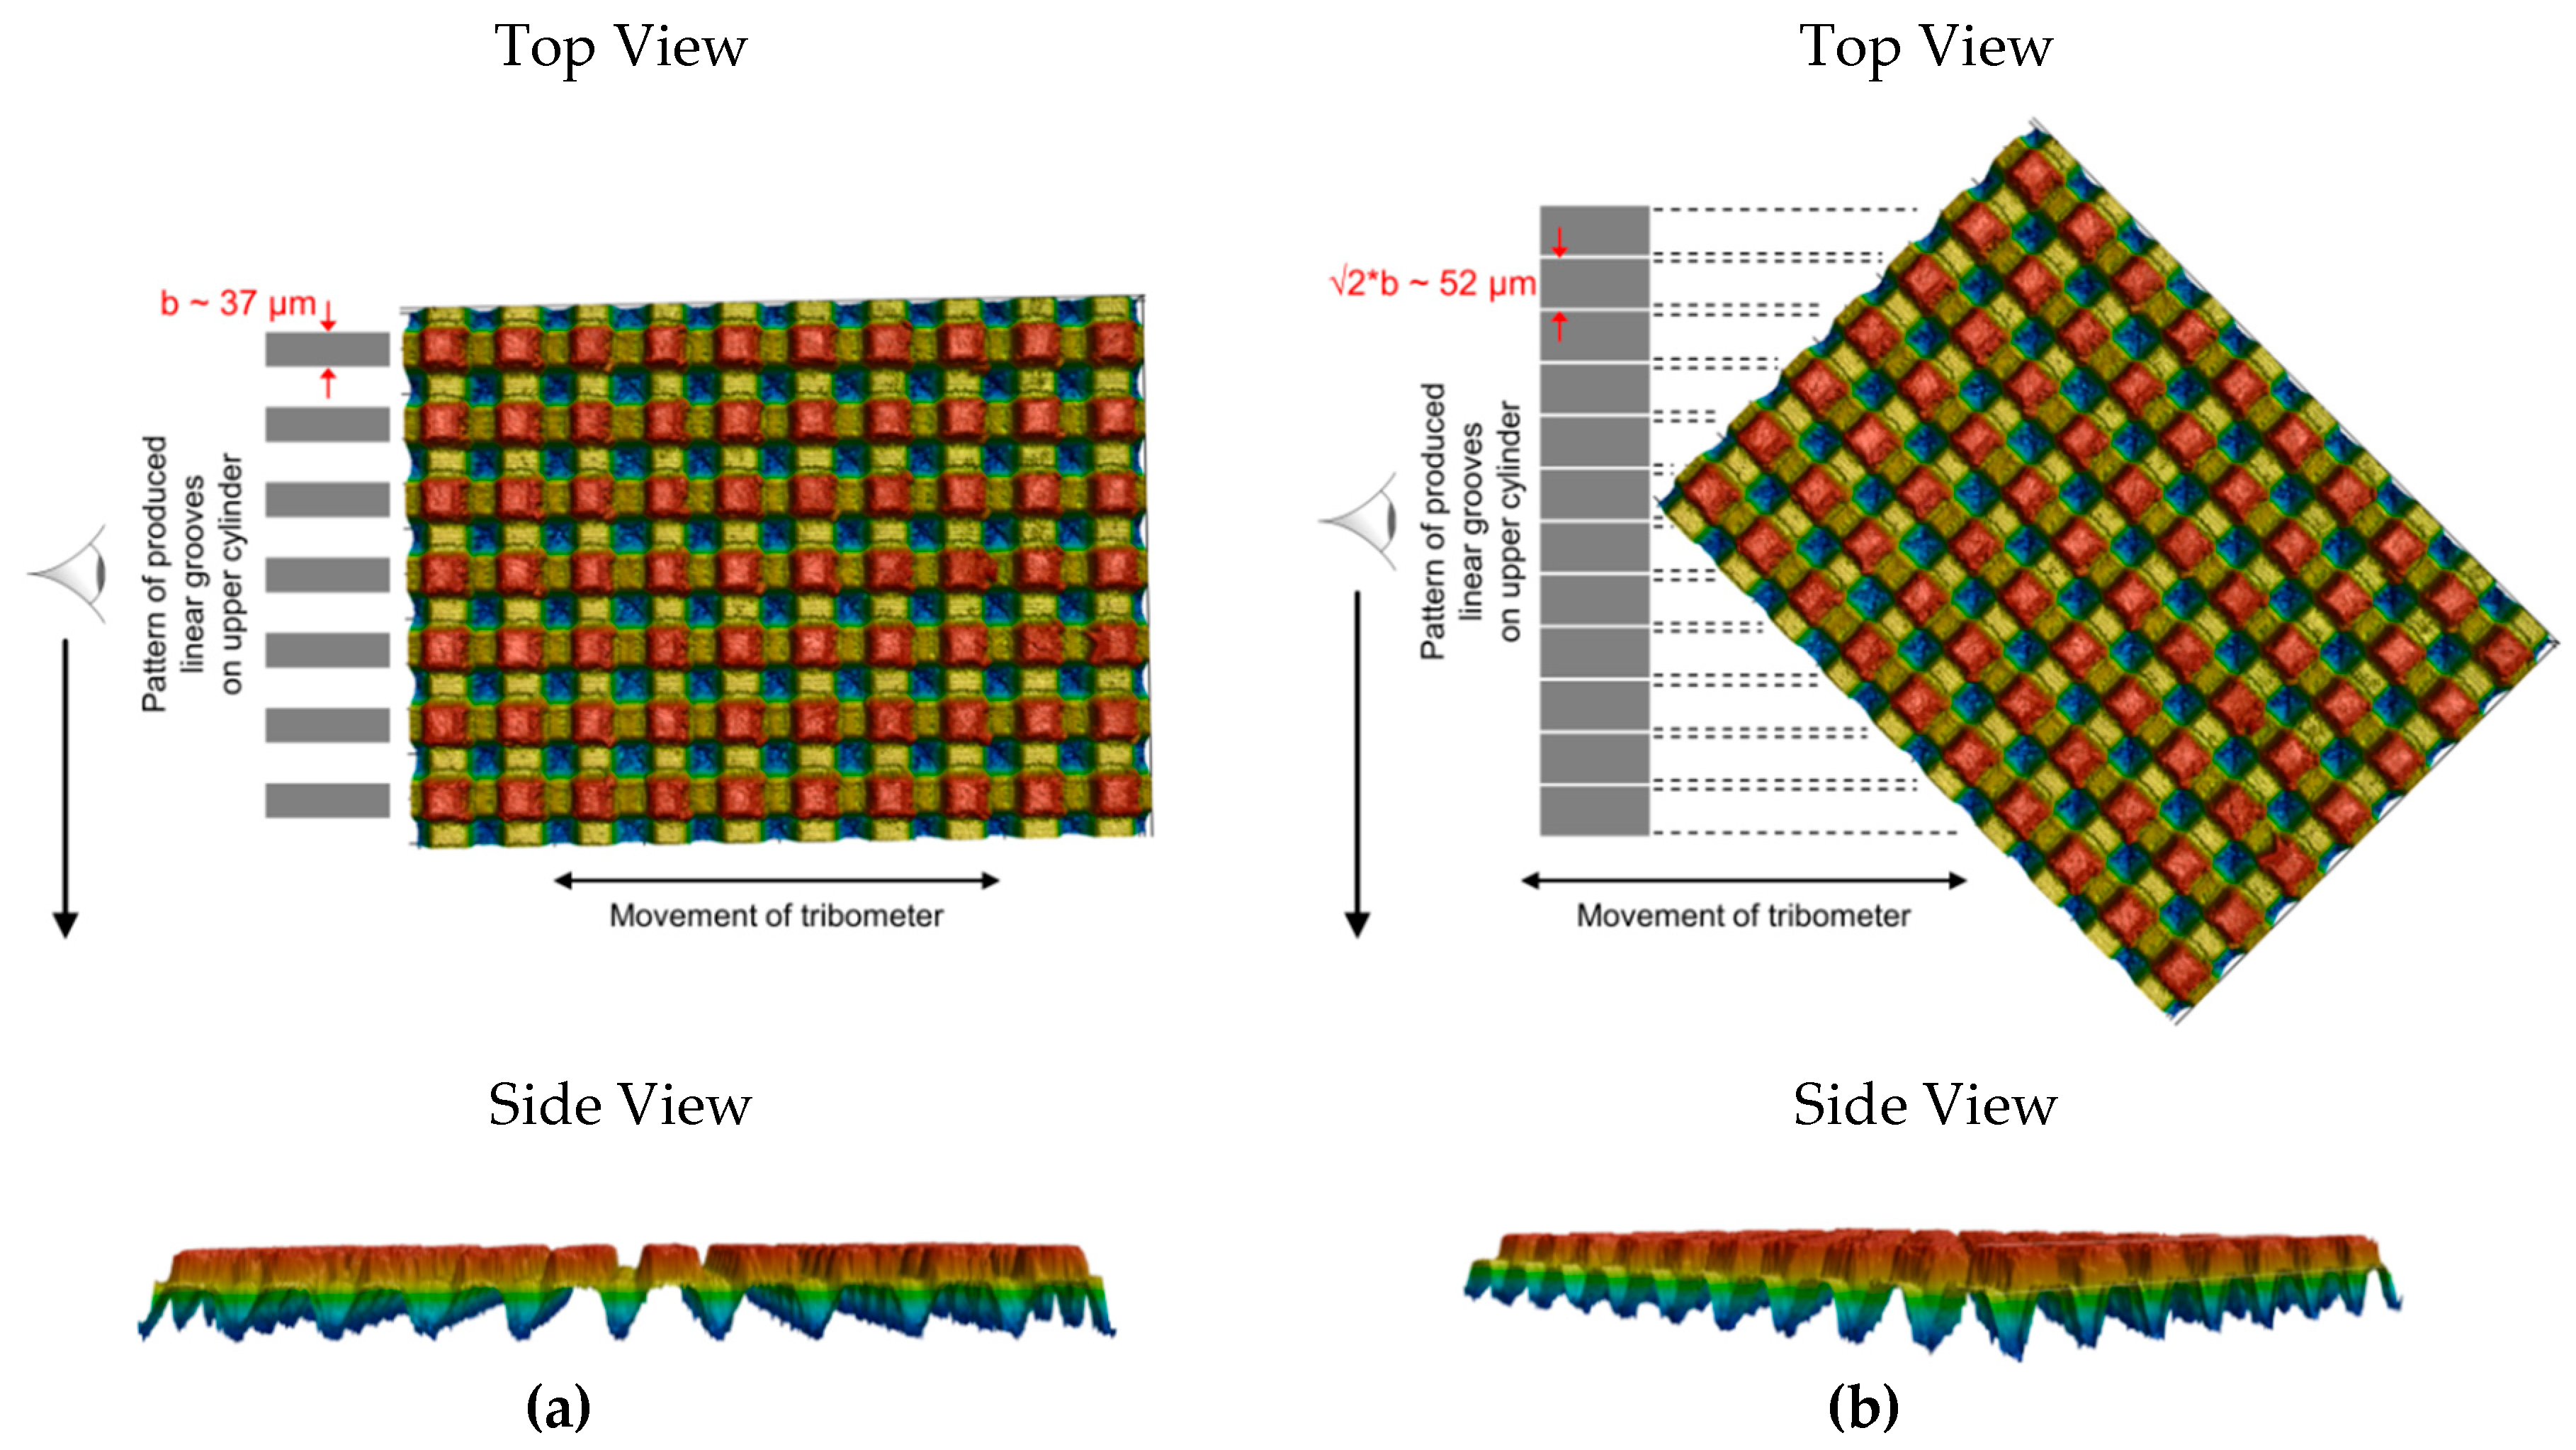
Figure 16.
Average wear rate (mm3/h) calculated from laser microscopy measurements after long-term tribological tests (2 h) of: (a) discs and (b) cylinders.
Figure 16.
Average wear rate (mm3/h) calculated from laser microscopy measurements after long-term tribological tests (2 h) of: (a) discs and (b) cylinders.

Table 1.
Excerpt of important properties of the antifriction coating investigated in the present study.
Table 1.
Excerpt of important properties of the antifriction coating investigated in the present study.
| Coating | Density (g/cm3 @ 20 °C) | Solid Lubricant | Solid Lubricant Amount | Binder | Solvent |
|---|---|---|---|---|---|
| AF320E | 0.97 | PTFE | 33% | organic | organic |
Table 2.
Test matrix of all tribological investigations performed in the present study.
| Test-ID | Texture Angle | Cylinder (Upper Specimen) | Disc (Lower Specimen) | Lubricant | ||
|---|---|---|---|---|---|---|
| Material | Surface | Material | Coating | |||
| Blank Benchmark | - | 31CrMoV9 | as-received | 42CrMo4 | - | Oil* |
| Coated Benchmark | - | 31CrMoV9 | as-received | 42CrMo4 | AF320E | - |
| Microtexture (90°) | 90° | 31CrMoV9 | as-received | 42CrMo4 | - | Oil* |
| Coated Microtexture (90°) | 90° | 31CrMoV9 | as-received | 42CrMo4 | AF320E | - |
| Coated Microtexture (45°) | 45° | 31CrMoV9 | as-received | 42CrMo4 | AF320E | - |
* Commercially available high-quality multi-grade hydraulic oil (ISO VG37).
Table 3.
Main parameters used for the tribological investigations.
| Normal Load (N) | Duration for Each Load (min) | Total Duration (min) | Stroke (mm) | Frequency (Hz) | Temperature (°C) |
|---|---|---|---|---|---|
| 25, 50, 75, 100, 125, 150, 175, 200 | 5 | 40 | 4 | 25 | 22 |
Table 4.
Surface roughness values of untextured uncoated (blank benchmark) and untextured antifriction coated (coated benchmark) disc specimens.
Table 4.
Surface roughness values of untextured uncoated (blank benchmark) and untextured antifriction coated (coated benchmark) disc specimens.
| Sample Denomination | Texture | Coating | Ra (µm) | Rz (µm) |
|---|---|---|---|---|
| Blank Benchmark | None | None | 0.06 ± 0.01 | 0.65 ± 0.19 |
| Coated Benchmark | None | AF320E | 0.94 ± 0.10 | 5.74 ± 0.78 |
Table 5.
Typical dimensions of produced 3D microtextures on disc specimens.
| Plateau 1 | Plateau 2 | ||||
|---|---|---|---|---|---|
| Sides (bx, by) (µm) | Height (Vs. Underlying Plateau 2) (µm) | Period (Px, Py) (µm) | Sides (bx, by) (µm) | Height (Vs. Underlying Plateau 3) (µm) | Period (Px, Py) (µm) |
| 37.2 ± 2.1 | 27.9 ± 0.6 | 82.3 ± 1.8 | 36.4 ± 1.5 | 41.2 ± 3.5 | 82.8 ± 0.8 |
Table 6.
Typical dimensions of produced 3D microtextured and antifriction coated disc specimens.
| Plateau 1 Height (Vs. Underlying Plateau 2) (µm) | Plateau 2 Height (Vs. Underlying Plateau 3) (µm) |
|---|---|
| 18.1 ± 2.3 | 20.9 ± 2.5 |
Table 7.
Comparison of coefficients of friction measured during wear resistance (long-term: 125 N, 2 h) and load-varying (short-term: 25-200 N, 5 min. per load level) tribological tests.
Table 7.
Comparison of coefficients of friction measured during wear resistance (long-term: 125 N, 2 h) and load-varying (short-term: 25-200 N, 5 min. per load level) tribological tests.
| Sample Denomination | Coefficient of Friction | |
|---|---|---|
| Wear Resistance Test (Figure 13a @ 15 min) | Load-Varying Test (Figure 13b @ 125 N) | |
| Benchmark + AF320E | 0.294 | 0.298 |
| 3D Microtexture (90°) + AF320E | 0.201 | 0.211 |
| 3D Microtexture (45°) + AF320E | 0.192 | 0.155 |
Table 8.
Calculations of ratio of real contact pressures for both microtextures with different angles to the direction of motion during long-term tribological tests.
Table 8.
Calculations of ratio of real contact pressures for both microtextures with different angles to the direction of motion during long-term tribological tests.
| Angle | Number of Pillars/Unit Surface Area | Number of Pillars/Unit Surface Area | Normalized Contact Area | Calculated Contact Pressure | Ratio Contact Pressures | |
|---|---|---|---|---|---|---|
| 90° | 100 | A90° = A | p90° = FN/A90° | p90° = FN/A | p45°/p90° = 1/0.8 ~1.25 | |
| 45° | ~80 | A45° ~0.8*A90° | p45° = FN/A45° | p45° = FN/0.8*A | ||
© 2019 by the authors. Licensee MDPI, Basel, Switzerland. This article is an open access article distributed under the terms and conditions of the Creative Commons Attribution (CC BY) license (http://creativecommons.org/licenses/by/4.0/).
Share and Cite
MDPI and ACS Style
Voyer, J.; Zehetner, J.; Klien, S.; Ausserer, F.; Velkavrh, I. Production and Tribological Characterization of Tailored Laser-Induced Surface 3D Microtextures. Lubricants 2019, 7, 67. https://doi.org/10.3390/lubricants7080067
AMA Style
Voyer J, Zehetner J, Klien S, Ausserer F, Velkavrh I. Production and Tribological Characterization of Tailored Laser-Induced Surface 3D Microtextures. Lubricants. 2019; 7(8):67. https://doi.org/10.3390/lubricants7080067
Chicago/Turabian StyleVoyer, Joel, Johann Zehetner, Stefan Klien, Florian Ausserer, and Igor Velkavrh. 2019. "Production and Tribological Characterization of Tailored Laser-Induced Surface 3D Microtextures" Lubricants 7, no. 8: 67. https://doi.org/10.3390/lubricants7080067
Note that from the first issue of 2016, this journal uses article numbers instead of page numbers. See further details here.