3.2. Energy Density in Transient Flow
As previously detailed [
24,
25,
27,
28,
29,
30], grease structure degradation process in transient flow tests may be described through the shear stress decay over time, from the stress overshoot, τ
max, representative of the initial elastic deformational process, to the remaining shear stress after completion of the degradation process,
i.e., the steady-state value, τ
lim. Kuhn [
30] further concludes that the integration of the τ(
t) curve for any given period of time is to be interpreted as energy expenditure per stressed grease volume, namely the rheological energy density, which is expressed by:
where
is the given constant shear rate applied and
is the evaluation time period.
In previous studies [
31], the energy density approach was used to interpret wear as a direct consequence of friction, so that the definition of wear is expanded and liberated from the limitation of the sole solid state unto the introduction of liquid state wear, meaning the degradation processes and the production of irreversibility in the separating lubricant film as a reaction to the applied frictional energy. Consequently, friction may be defined as an “irreversible process, which leads to the transformation and accumulation of mechanical energy accompanied by the production of entropy” (see [
31] on page 32)
. Therefore, the aforementioned degradation process in rotational tests may be expressed as rheological wear.
Figure 1 shows different transient flow curves for selected Li-grease samples formulated with all examined base oils. In order to obtain values of rheological energy densities e
rheo-rot, as defined in Equation (1), the monitored development of shear stress over time was numerically integrated within bounds corresponding to τ
max and τ
lim, respectively, as limiting time constraints. Results of these integrations of tests performed in exemplary temperature conditions of −10 °C and 40 °C are displayed in
Figure 2 and
Figure 3 with greases arranged in groups of thickeners. For the purpose of a better discernibility, the values were converted into mJ/mm
3 and displayed in linear scale.
Figure 1.
Transient flow curves of selected Li-grease samples determined at 40 °C.
Figure 1.
Transient flow curves of selected Li-grease samples determined at 40 °C.
Figure 2.
Energy densities (erheo-rot) determined by integration of shear stress over time at −10 °C.
Figure 2.
Energy densities (erheo-rot) determined by integration of shear stress over time at −10 °C.
Figure 3.
Energy densities (erheo-rot) determined by integration of shear stress over time at 40 °C.
Figure 3.
Energy densities (erheo-rot) determined by integration of shear stress over time at 40 °C.
The diagram in
Figure 2 clearly depicts a good correlation between energy densities and base oil polarities. All greases based on the highly-polar oils, HOSO and TMPO, show a higher energy density within their respective thickener group than those based on the low-polarity oils, PAO and OCT. The only exception to this rule is the HDS-TMPO system, which exhibits a value of e
rheo-rot lower than expected. However, this result does not constitute an outlier because it is physically explicable by some effects which occurred only at very low temperature conditions. Thus, in all tests at −10 °C, it turned into solid matter, which was expelled from the measuring plate-plate gap at around 100 s. So the true value of energy density of HDS-TMPO, although not detected, must be higher than displayed in the diagram. The difference of energy densities between greases formulated with high-polarity and low-polarity oils, respectively, is most apparent in the group of BT-greases (72.4%), followed by Li-greases (48.7%) and Ca-greases (46.5%). If ignoring the value obtained for the HDS-TMPO system, the average difference of energy densities between high and low polarity greases rise up to 88.6% within the group of HDS-thickened greases.
The diagram of energy densities determined at 40 °C displayed in
Figure 3 does not show this distinct differentiation between greases based on high and low polarity oils for all grease systems. Only Li-thickened greases reveal such behavior. Most interestingly the effect is reversed in the BT-thickened greases, with low polarity oils PAO and OCT now evoking higher energy densities in the greases.
As previously reported in [
32], compositional variables are the most influencing factors affecting the rheology of greases. Particularly in this investigation, the nature of the different components (base oil and thickener), with individual solid or liquid characteristics, and concentrations are considered. The base oil viscosity and especially the percentage of thickener exert an influence on the structural degradation. The base oil viscosities do not differ significantly from each other in the given grease systems. The situation is different, however, with the percentage of thickener as shown in
Table 1. These values reveal a polarity dependence of thickener percentage for all clay-thickened greases and for the Li-grease systems to fit a desired NLGI (National Lubricating Grease Institute) class 2. This influence is made manifest by a higher thickener ratio needed for highly polar oils than for low polarity oils. Ca-greases, on the other hand, do not show this dependence, probably due to the presence of the double charged cation. This influence most severely comes into effect within the groups of BT and HDS greases. In order to understand the underlying mechanisms of this effect one must consider the structure and composition of clay thickeners.
Bentonite, e.g., is a clay-based thickener extracted from clays of volcanic ashes with montmorillonite, a triple-layer particle structure phyllosilicate, as main constituent. Montmorillonite itself chemically consists of 60% SiO
2 and 20% Al
2O
3 and contains several other metal ions stored in the layer lattice [
33]. Substitution of these ions by quaternary ammonium salts results in organophillic modification, which enables thickening processes of petrochemical as well as oleochemical oils [
33,
34,
35,
36]. As a result of this modification the surface of the montmorillonite particles is activated with hydrocarbon alkyls of different chain lengths. The length and polarity of these chains influences the affinity for oils according to their polarity. In the thickening process intense shearing is needed in the process of blending the base oil with the organically modified bentonite in order to break up the plate layer aggregates and completely wet all surfaces. Addition of other chemical activators (carbonates, glycols, ketones, alcohols, and especially water) is needed to overcome adhesion forces between the particles and enable the thickening process. During the latter, the particles form a three-dimensional stable network, which physically traps the base oil [
33,
37]. According to Goerz [
33], the hydrocarbon alkyl-chain rests highly influence the bonding character and the consequent thickening behavior in BT greases. For this reason highly polar oils more naturally attach to these hydrocarbon molecule chain rests in organosilicon particles of BT greases than low polarity oils. Thus, they interfere with, and partially prevent, the formation of the BT matrix. Therefore, it is stressed that tailor-made organophyllic modifiers should be used for each prevailing oil polarity. This fact was not considered in the formulation of the investigated model greases. For this reason the use of the same BT thickener type, containing equal ammonium ions with similar hydrocarbon alkyl-chains, must result in individual thickener percentages for all base oils.
As can be seen in
Table 1, the formulation of HDS greases is also subjected to polarity influences. Due to its main constituent, SiO
2, HDS-thickener, like BT is regarded as a clay thickener. In the production process, quartz sands are firstly enriched with chlorine resulting in SiCl
4, which is then pyrolytically cracked in oxyhydrogen-reactive flame hydrolysis resulting in SiO
2 primary particles consisting of tetrahedral SiO
4 connected via siloxane bridges and outstanding silanol groups. These primary particles link together in the flame reaction and form flaky chain aggregates with a very high specific surface (up to 400 m
2/g). The silanol groups of the primary particles enable hydrogen bonds to organosilicon compounds in the hydrophobization process and to the hydrocarbon chains of surrounding base oils in the thickening process. Through the latter, a three-dimensional network structure is formed that provides mechanical stability [
33]. It is observed that highly polar oils show a higher tendency to dock with Si-OH groups, protruding from primary particles of HDS greases, than low-polarity oils. This causes a disturbance of the formation of the three-dimensional network and generally results in higher percentages of thickener needed to thicken highly polar oils with equal mechanical stability.
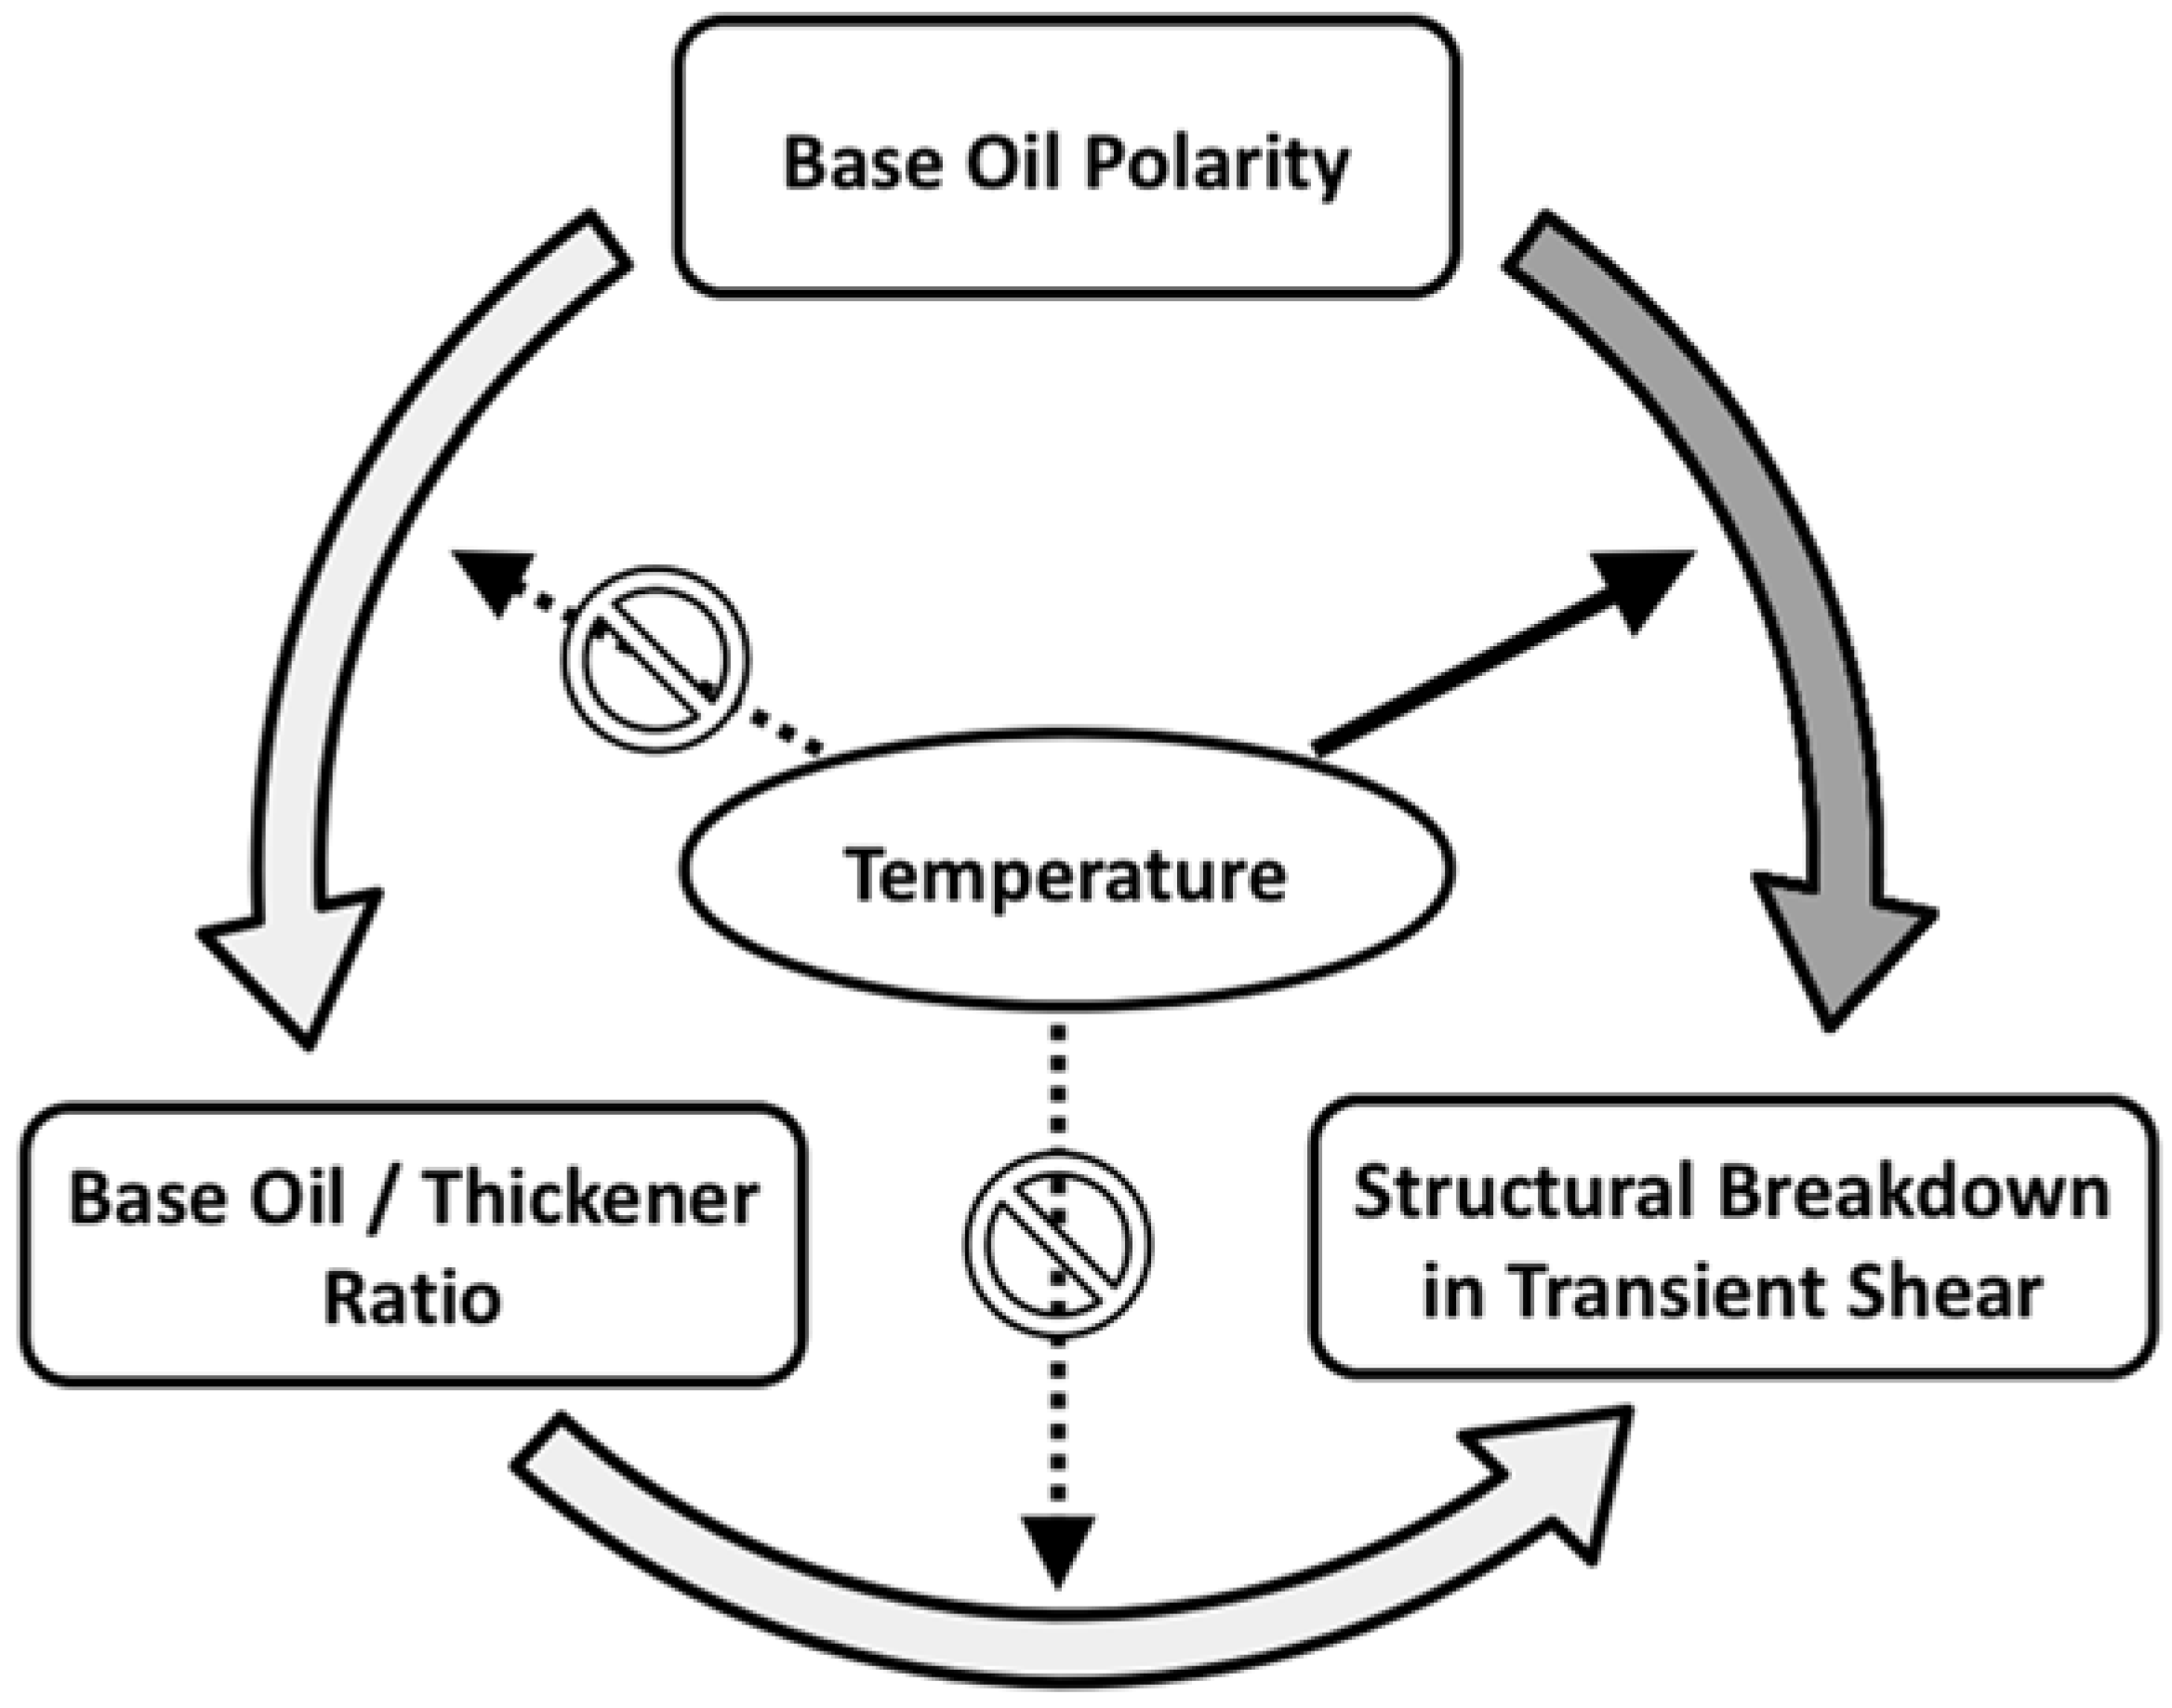
So far, two different polarity-related effects on greases and their characteristics have emerged as illustrated in
Figure 4. In this chart curved filled arrows represent all direct influences whilst slim straight arrows represent possible mutilations of direct influences. On the one hand, there is a direct influence on the base oil/thickener ratio even in the formulation of the greases, as discussed earlier. On the other hand the structural breakdown of greases under transient shear is also directly affected by base oil polarities, as has been shown by means of the energetic evaluation of the transient shear results. This double effect makes it exceedingly difficult to reveal the exclusive influence of the base oil polarity on mechanical structural breakdown because this degradation is also essentially influenced by the thickener concentration. In order to disclose the exclusive influence of the base oil polarity on mechanical structural degradation it is necessary to establish measurement conditions, which solely reveal the same by keeping constant all other influencing factors. The bond forces evoked and influenced by base oil polarities are mainly Keesom forces, as discussed in the introduction of this article. They are the strongest secondary valence bond forces, hence, in the context of adjustment of measuring conditions, it seems plausible to find conditions which solely mutilate or even eliminate Keesom forces. It is well known that the formation of Keesom forces is highly temperature-dependent [
11]. Through atomic scale oscillation evoked by a temperature increase, they are intensively reduced. In other words, the higher the medium temperature during the test, the lower the Keesom forces in the grease microstructure are. At low temperature conditions, however, Keesom forces are maximized. For this reason the above-described temperature range from −10 °C up to 80 °C was chosen and polarity influences were isolated from other effects, such as percentage of thickener content. This is illustrated by the slim arrows in
Figure 4 pointing to the bold filled arrows representing a mutilation of these direct influences. This way
Figure 4 makes clear that the temperature only disturbs the direct influence of base oil polarity on the structural breakdown. In reality the temperature could also marginally mutilate the influence of base oil polarities on the thickener concentration. This influence, as inherently limited, is only exerted in the moment of grease production and loses its effect after completion of the production. Moreover the temperature does not mutilate the influence of the base oil/thickener ratio on the structural breakdown in transient shear.
Figure 4.
Scheme considering the different polarity influences on structural breakdown under transient shear. Note: Bold curved arrows represent direct influences, slim straight arrows (dotted and solid) represent possible mutilations of direct influences.
Figure 4.
Scheme considering the different polarity influences on structural breakdown under transient shear. Note: Bold curved arrows represent direct influences, slim straight arrows (dotted and solid) represent possible mutilations of direct influences.
For further discussion of the investigation of temperature influences, all energy densities analytically determined by integration according to Equation (1) are plotted as a function of temperature in the complete region of all measurement points.
Figure 5 collects these values of energy densities for all greases studied. In this data plot the grease systems with highly polar oils, TMPO, and HOSO, are color-coded in black solid lines with different line tags for the respective groups of thickeners and base oils. All curves of greases based on low-polarity oils are color-coded with gray solid lines without any information on the thickener or base oil. This figure clearly shows that energy densities determined at temperatures higher than 25 °C all quite much resemble. The largest deviation from a linear trend mainly occurs in measurements performed at −10 °C. This deviation from a linear trend highly depends on the base oil polarity. While all energy densities determined for greases based on low-polarity oils stay within a narrow fluctuation band even at −10 °C the greases based on highly polar oils do not show this behavior. In fact they even result in curves that are best fitted by an exponential approximation. The largest deviations from a linear trend are found for the grease systems formulated with clay thickeners. As expected, HDS-TMPO is an exception to this rule for the prior-discussed reasons. The greases formulated with metal soaps and highly polar oils measured at −10 °C only slightly but still clearly result in higher energy densities than all other greases based on low polarity oils.
Figure 5.
Energy densities (erheo-rot) vs. temperature plot.
Figure 5.
Energy densities (erheo-rot) vs. temperature plot.
This apparent exponential temperature dependent behavior of energy densities leads to the assumption that it may follow an Arrhenius type fitting. Adaption of the Arrhenius-type fitting to the here-investigated physical process of temperature dependent degradation under transient shear leads to:
where
T (K) represents the temperature, R represents the universal gas constant (8.314 J·K
−1·mol
−1), A is a dimensionless pre-exponential factor and
Ea (J·mol
−1) is an activation energy which, in this case, may have a physical meaning of the energy input necessary to produce structural degradation in the grease sample under transient shear. Plotting the results of Arrhenius fits in logarithmic scale over the reciprocal temperature reveals the ratio of
Ea and
R as the slope of the function.
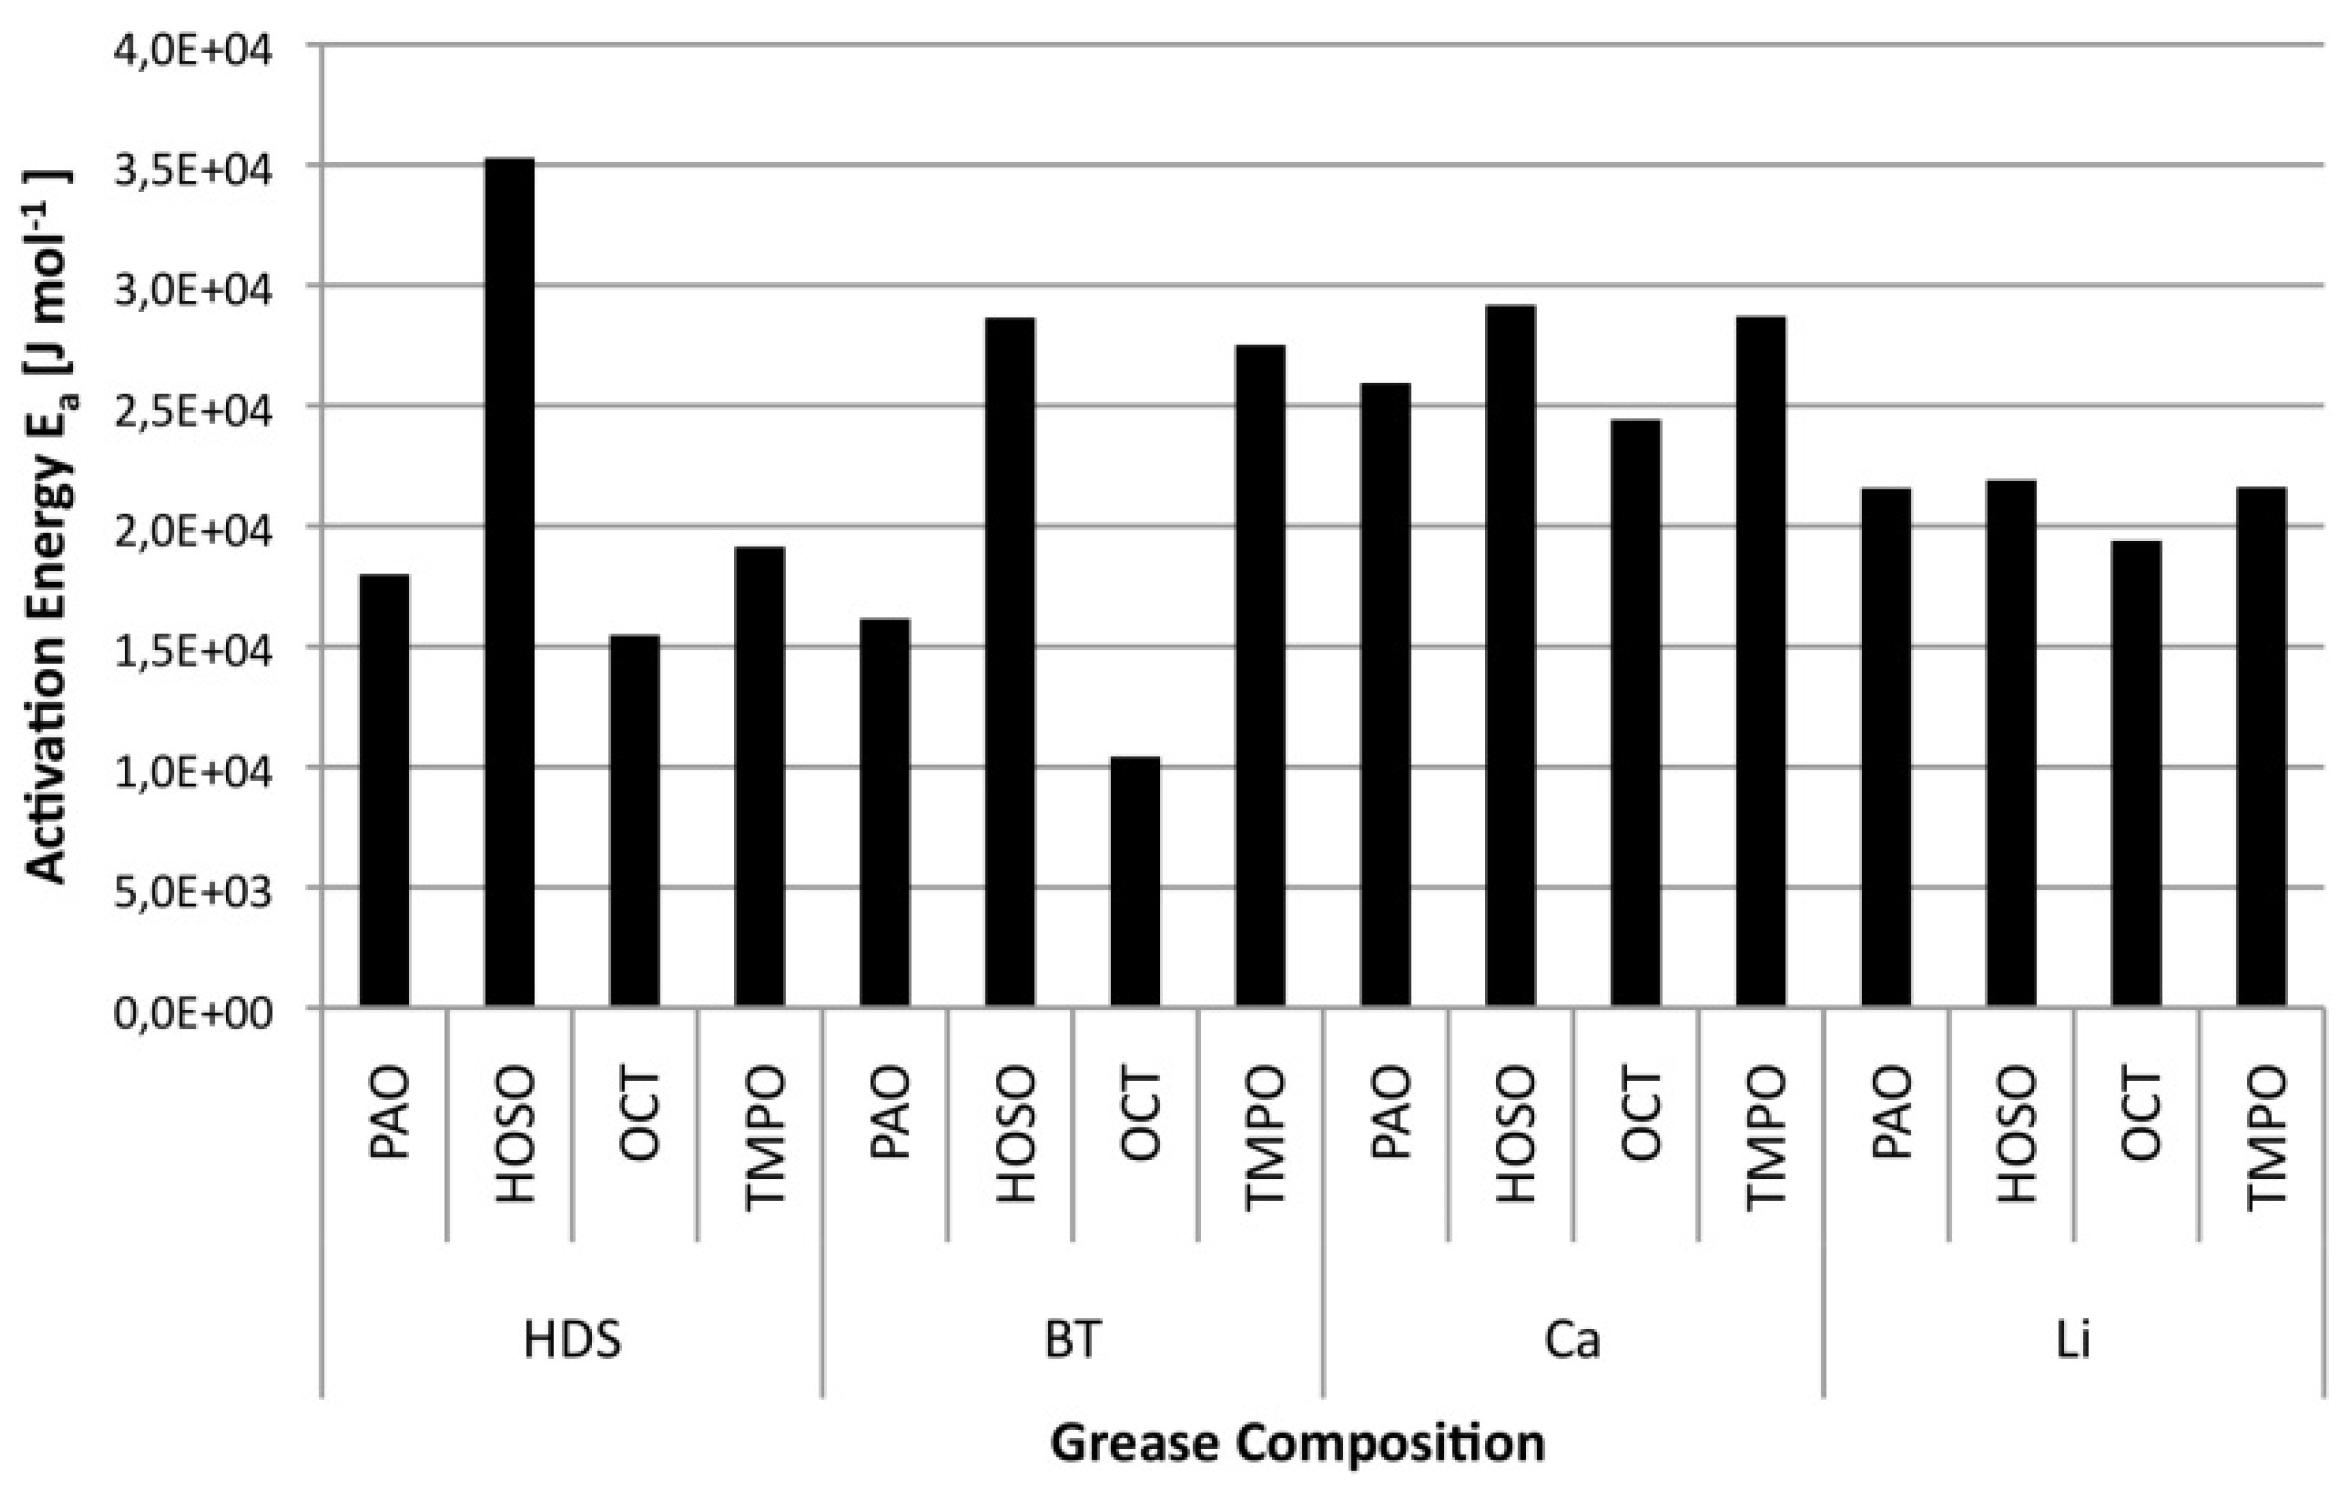
Figure 6 depicts the original data along with the corresponding Arrhenius type fits in the mentioned scales of some selected highly-polar and non-polar greases. Excepting for HDS-HOSO system, reasonably good fitting was obtained considering only the four temperatures analyzed. This figure, directly confronting both polarity groups, also shows a clear distinction between highly polar and low-polarity greases. It appears that the highly polar oil-based grease systems require a larger portion of activation energy in order to produce structural degradation in the grease samples under transient shear. This presumption is supported with the data shown in
Figure 7 where all values of activation energy
Ea are displayed in groups of thickeners. In all of these groups a polarity influence more or less severely affects the activation energy, resulting in higher activation energies necessary to evoke structural degradation in transient shear with greases based on highly-polar oils than with those based on low-polarity oils.
Figure 6.
Original data and Arrhenius fits of greases based on highly polar high-oleic sunflower oil (HOSO) and non-polar polyalpha olefin (PAO). HDS, highly dispersed silica acid; Bt, bentonite; Ca, calcium; Li, lithium.
Figure 6.
Original data and Arrhenius fits of greases based on highly polar high-oleic sunflower oil (HOSO) and non-polar polyalpha olefin (PAO). HDS, highly dispersed silica acid; Bt, bentonite; Ca, calcium; Li, lithium.
Figure 7.
Activation energy, Ea, in transient shear flow.
Figure 7.
Activation energy, Ea, in transient shear flow.
This effect results, most significantly, in larger differences between greases based on high and low-polarity oils within the groups of clay thickened greases HDS (38.5%) and BT (52.7%). HDS-TMPO, for explained reasons, is presumed to have resulted in much higher activation energy than displayed by the found data. A polarity influence is also found in both soap-thickened grease systems although its effect results in smaller differences between the activation energies of high and low polarity greases—Ca (13.0%) and Li (5.9%). This effect may be explained by the stronger bond forces evoked between the thickener matrix and the highly polar oils surrounding it. It is presumed that the clay thickeners, which all required more activation energy to commence the structural breakdown in combination with highly polar oils, more naturally interact with the same. Low-polarity base oils consequently result in less activation energy needed in the process of structural breakdown. It is generally noted that clay thickeners react much more sensitively to a change of oil polarity in lubricating greases. Reasons for this effect are found in the microstructure and the physical mode of action of all investigated thickeners as will be discussed in the next section.
3.3. Atomic Force Microscopy (AFM)
In order to elucidate the above-discussed behavior, one needs to understand the physical functionality of the investigated thickener systems at the molecular as well as the macro level. This especially applies if considering that only the synergy and interaction of the different grease ingredients on the mentioned levels cause the overall transient flow response.
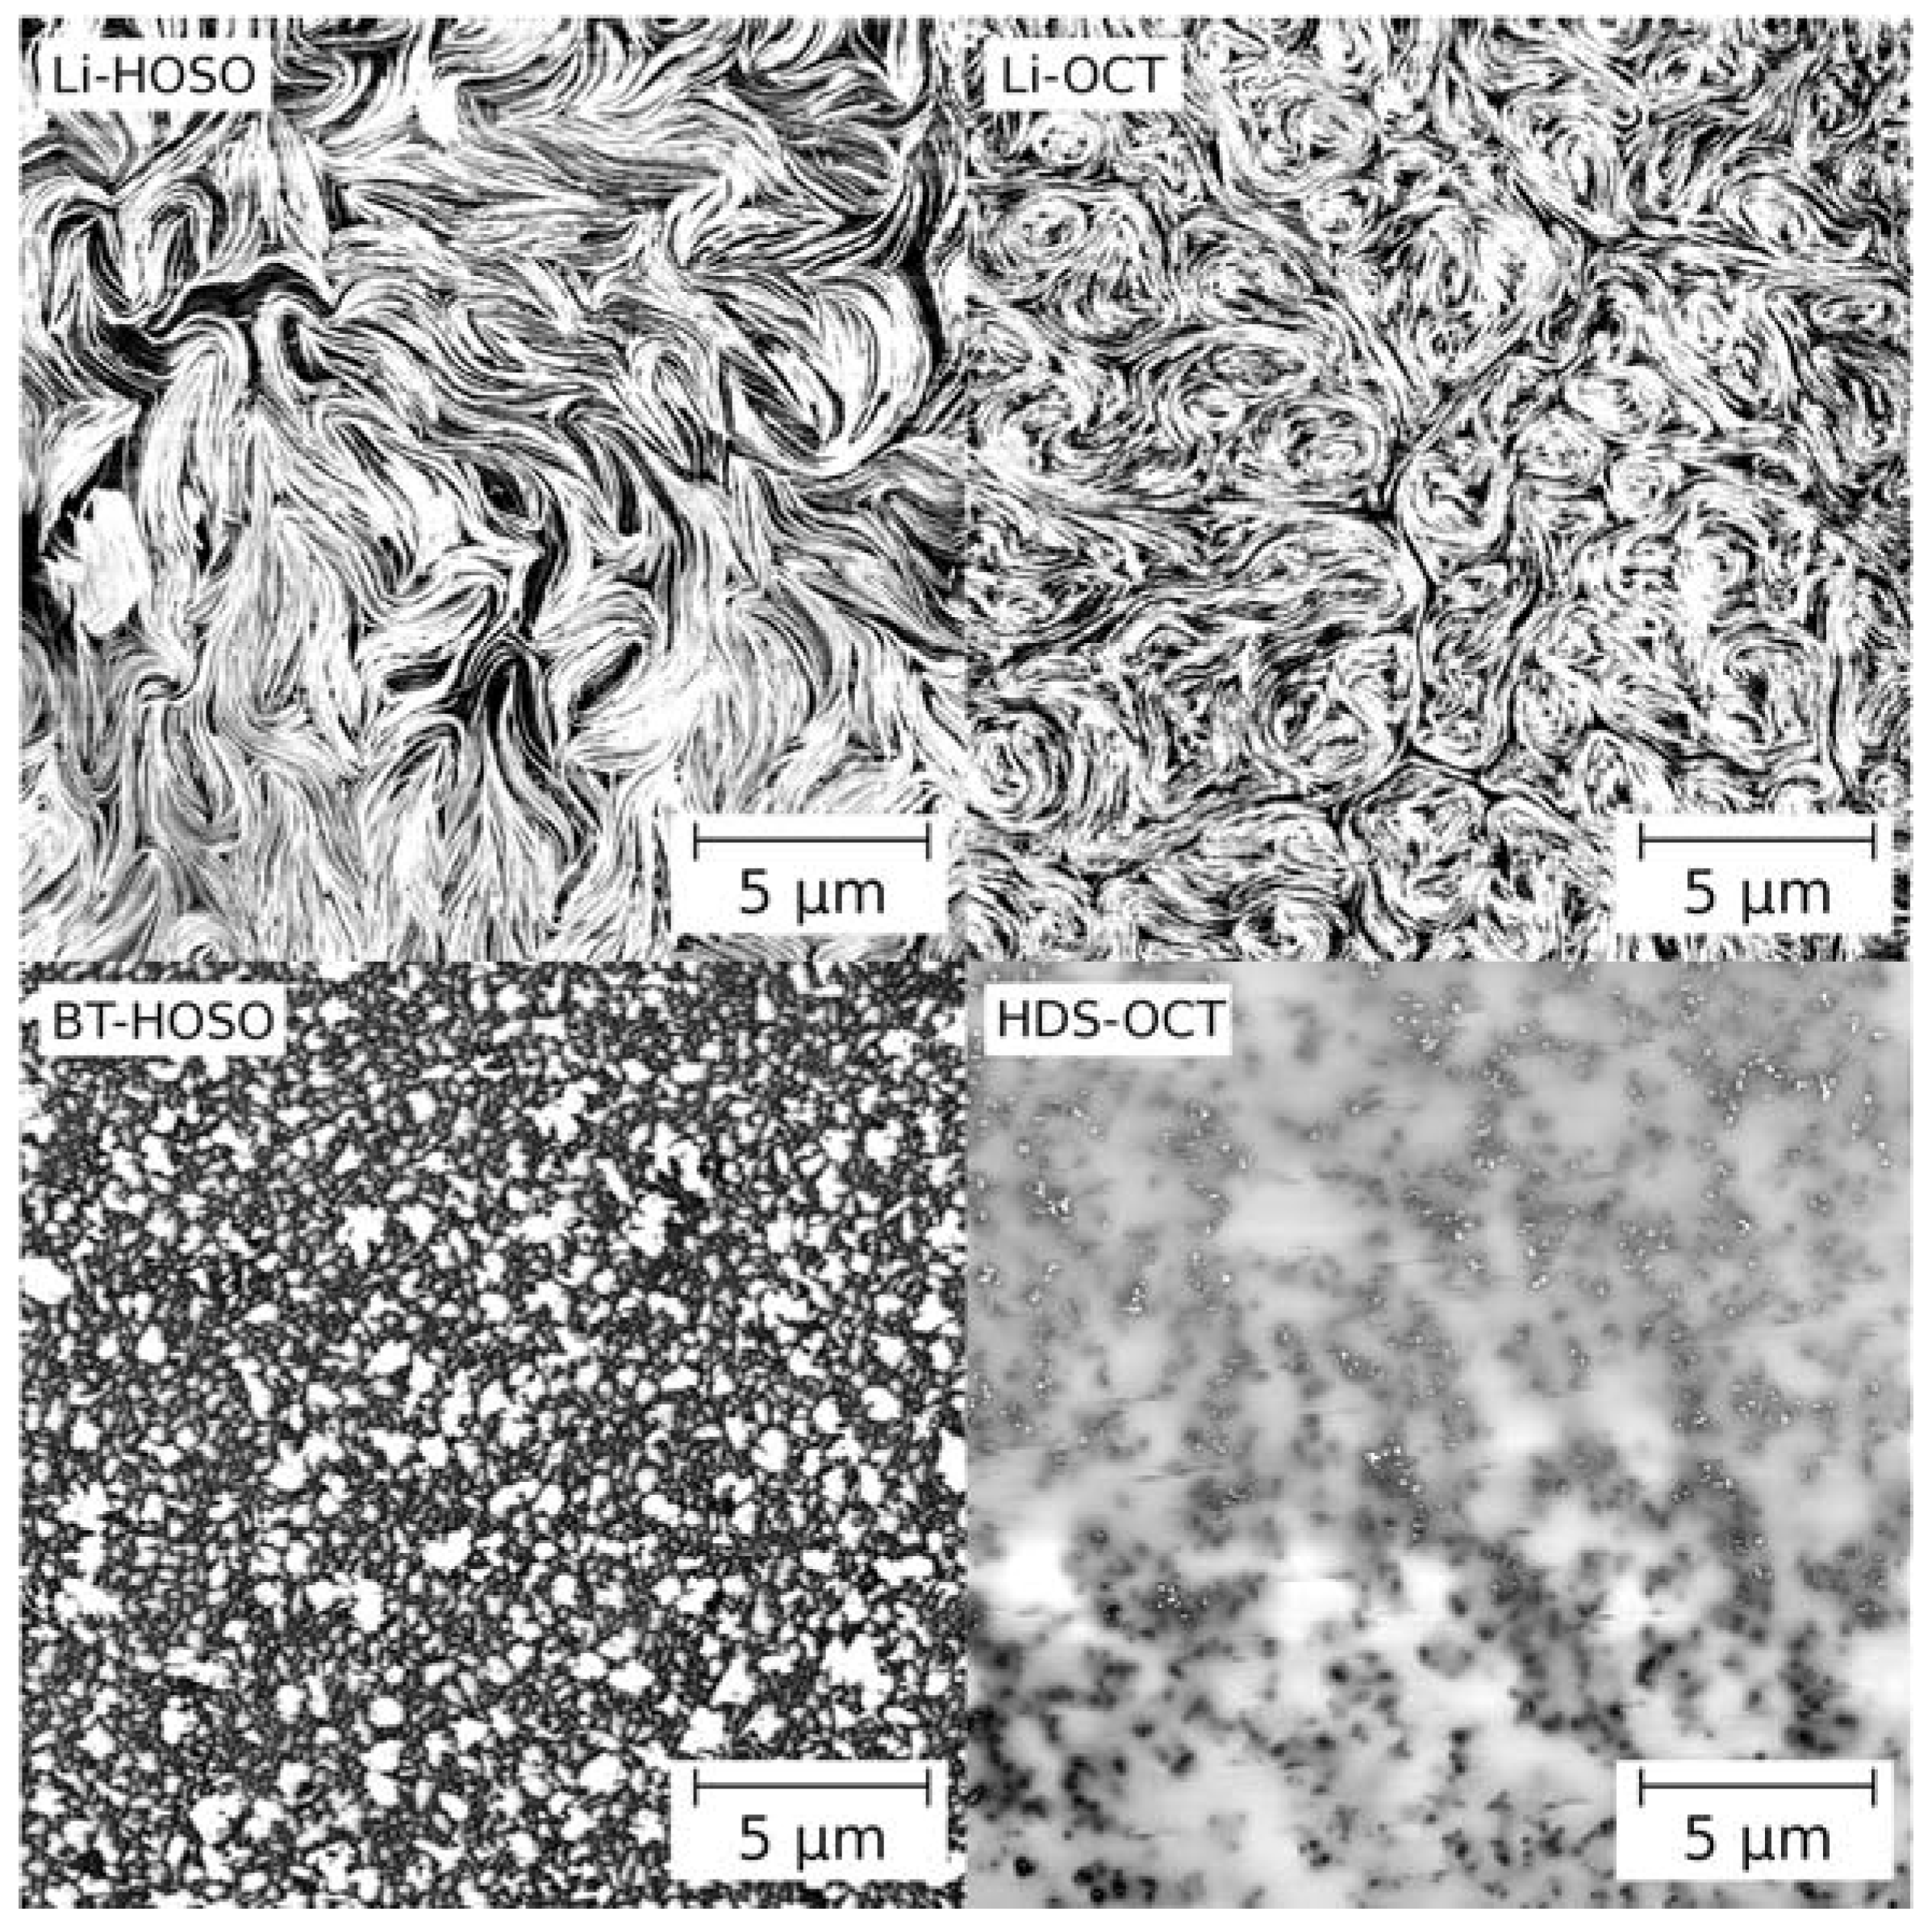
Figure 8 displays selected AFM micrographs of four of the greases investigated in this study.
Figure 8.
Atomic Force Microscopy (AFM) micrographs of four examined sample greases (image width: 20 × 20 µm). Li, lithium; HOSO, highly polar high-oleic sunflower oil; OCT, octyldodecyl isostearate; BT, bentonite; HDS, highly dispersed silica acid.
Figure 8.
Atomic Force Microscopy (AFM) micrographs of four examined sample greases (image width: 20 × 20 µm). Li, lithium; HOSO, highly polar high-oleic sunflower oil; OCT, octyldodecyl isostearate; BT, bentonite; HDS, highly dispersed silica acid.
The thickeners of the greases appear as bright to white areas in the partial images of
Figure 8. The brighter an area appears in the AFM image the more rigid is the scanned part of the specimen. Dark areas in the AFM image analogously represent soft or even liquid parts representing the enclosed base oil. It should be mentioned that the rigidities of the displayed AFM images in
Figure 8 are not to be compared to each other because each partial image was manually normalized to picture the full spectrum of gray scales before they were put together. Still, the structure and the composition of the grease thickeners appear very clearly. The two split images of the Li greases very clearly depict the fibrillar structure of the thickener with single, partially interwoven and entangled loops of different size. The two bottom split images of the clay-thickened greases very clearly display clusters of spherical or platelet solid particles. In the case of BT-HOSO one not only notices the size of these platelets but also how densely and multi directionally they are arranged. The HDS-OCT, on the other hand, displays only a few very small solid particle aggregates distributed evenly in the visible superficial layer. This is attributed to the very small size of the primary particles of HDS. They form a rather rigid system if mixed thoroughly as marked in grayish areas. However, if they agglutinate, as marked in bright spots, the thickener particles lose their ability to tie the base oil as shown in the dark edges surrounding each aggregate.
Figure 8 allows to elucidate the physical mechanism acting in the above-discussed transient shear flow as well as the mixing ratio of the greases. Hence, a lubricating grease based on a chemically-bound metallic soap with all its fibrillar, interwoven, and entangled loops is expected to respond differently to changing oil polarities than a clay-grease with its micro platelet structure. This occurs although both thickening systems only physically interact with the surrounding base oil and with each other.
Figure 8 also shows that the base oil polarity may very well influence the type and length of Li-soap fibers. Longer and less entangled fibers with less loops per examined unit of volume result from the combination with highly polar HOSO as compared to the low polarity base oil OCT. This circumstance permits the deduction that base oil polarities in combination with Li thickeners may exert an influence on the thickener/base oil ratio as shown in
Table 1. In addition, the fact that base oil polarities only marginally affect the activation energy needed for structural breakdown in transient shear, which might also be labeled a thickener-share-adjusted degradation behavior, leads to the presumption that they exert their influence on Li greases mainly once—during the formulation of the grease. As soon as the Li soap is completely formulated, the indirect influence of base oil polarities on the transient flow response depends on the length, type and, rate of entanglement as well as on the ratio of soap fibers.
For technical reasons it was not possible to obtain accurate AFM micrographs of the examined Ca greases. Hence, the response of their microstructure to alternating polarities cannot be fully elucidated. Due to the above-discussed polarity-independent constant thickener ratio (see
Table 1) it is presumed, however, that the structure of Ca greases is independent of oil polarity to a large degree. In combination with the relatively high polarity difference in the thickener-share-adjusted evaluation of grease degradation by means of activation energy it is presumed that the structural breakdown of Ca-thickened greases is mainly subject to polarity influences.
As previously mentioned, the platelets of the clay particles are considerably smaller than the fibers of the soap greases. They can only physically interact with each other in the formation of the supporting matrix structure. The smaller the particles, the more bonding sites are available per considered volume unit. Therefore, it is presumed that they evoke greater polarity-dependent rheological shear stress responses in the grease. Furthermore, this is substantiated by the fact that the interaction of the solid body particles only occurs through the surrounding base oil in the formation of the support network. In other words, the base oil works as an adhesive between the particles. This is also the case for soap fibers, yet they are significantly longer and, thus, although naturally offering a greater target surface per fiber in this adhesion process, they offer less target surface per considered unit of grease volume. In addition, they are much more flexible than clay particles, and thus they offer a greater contact surface even in sliding produced by mechanical shearing. In summary, it is presumed that the rheologically-measured polarity-dependence of clay greases is evoked by the small size of clay particles, their solid body characteristics and its associated lack of flexibility. This would also elucidate why, with the activation energy, the clay-thickened grease systems HDS and BT showed greater polarity dependence than the Li and Ca soap-thickened greases.


 ,
, 


