Experimental Investigation of Tribology-Related Topography Parameters of Hard-Turned and Ground 16MnCr5 Surfaces


Institute of Manufacturing Science, University of Miskolc, H-3515 Miskolc, Hungary
Lubricants 2023, 11(6), 263; https://doi.org/10.3390/lubricants11060263
Submission received: 21 May 2023
/
Revised: 9 June 2023
/
Accepted: 14 June 2023
/
Published: 16 June 2023
(This article belongs to the Special Issue Advances in Sustainable Cooling/Lubrication Techniques for Improving the Tribological Characteristics and Machining Performance)
Abstract
:Several surface topography parameters are available for the quantification of tribological properties of machined surfaces. Although these parameters and their influences are widely studied, there are contradictory findings due to the nature of the topography parameters, i.e., the behavior of different materials and cutting tool interactions lead to relatively varying numerical results. A comprehensive study of these interactions can contribute to more exact industrial machining applications. In this study, tribology-related 3D topography parameters of hard-machined (hard-turned and ground) surfaces were analyzed. The machining experiments were carried out based on a detailed design of the experiment; the analyzed material was case-hardened low-carbon content steel, which is widely used for automotive, industrial components such as bearings or gears. From the topography data, response function, correlation, and relative deviation analyses were carried out for the analyzed topography parameters, and tribology maps were created to support the selection of optimal cutting parameter values.
1. Introduction
Friction, wear, and the role of lubricants in contacting surfaces are widely studied areas because of their significant roles in the functionality of contacting surfaces [1]. As a result of the development of high-reliability and high-accuracy sensors and imaging technologies [2], novel tools and IT solutions [3] are available to study these tribological phenomena.
In this study, hard turning and grinding are compared. Hard turning is an alternative technology to grinding if random surface topography is not needed because the same accuracy and surface quality can be achieved [4]. At the same time, hard turning requires no coolant or lubricant, which results in a lower environmental load compared to grinding [5]. However, minimum quantity lubrication might be satisfactory from the accuracy point of view in grinding [6]. Due to the relatively large depth of cut, hard turning is more effective than grinding; the material removal rate of the former is significantly higher [7]. With the appearance and development of high-hardness cubic boron nitride inserts, the application and research of hard turning became a focal point of investigation [8,9]. It was found that white layer formation is a problem of this technology, similar to grinding. Several studies have analyzed this problem and provided solutions for avoiding it [10].
Machined surfaces consist of peaks and valleys; the shape and quantity of these topographical elements and the distribution of the height points of a surface determine several tribological properties. If a surface is characterized by relatively few and not high peaks, i.e., if it is filled in its upper zone, then the load-bearing capacity is high. The initial wear-in phase of such a surface is relatively short, and during wear, the surface reaches a large bearing area, and therefore a more wear-resistant surface is quickly formed. The number and height of the valleys provide information about the lubricant retention ability. If the total volume of the valleys is high, more lubricant can remain in them. At the same time, a narrow valley supports the capillary phenomenon, which allows lubricant retention. If peaks dominate on a surface, the wear resistance is lower, but the volume of valleys is high. If a surface is filled (which can typically be done by honing), the wear resistance is favorable, but the lubricant is present only in the thin valleys. The topography parameters connected to the peak zone of the surface provide information about the wear resistance, and those connected to the valley zone about the lubricant retention ability.
In this study, peak height (Sp) and valley depth (Sv) height, reduced peak height (Spk) and reduced valley depth (Svk), peak material volume (Vmp) and valley void volume (Vvv), and skewness (Ssk) and kurtosis (Sku) parameters are analyzed (in Section 2.2). A center area is a plane that divides the surface points into two equal parts. The Sp is the height of the highest surface point measured from this plane, and the Sv is that of the lowest point [11]. By analyzing these simple parameters, initial information about the analyzed tribological properties can be obtained, which can be made more exact by the use of more suitable parameters, such as those of the Sk parameter group. In surface topography, a surface consists of material and void. At the highest points of a surface, the material ratio is the least, and at the lowest points, the largest. The areal material ratio curve demonstrates these ratios at different heights. From the lowest to the highest point of a surface (maximum height), three zones are defined: valley, core, and peak zones. Based on the material ratio curve, these zones can be designated numerically. The equivalent line that fits the best on the flattest 40% (measured in the direction of the material ratio axis) designates the border between the core and peak zones and between the valley and core zones at 0% and 100% material ratio, respectively [12]. These points of the height designate the core height (Sk), the reduced peak height (Spk), and the reduced valley depth (Svk), and the division of the surface into three zones provides more detailed information about the tribological behavior of a surface than the Sp and Sv parameters. The result of the latest topography development is the group of volume parameters that consist of the peak material volume (Vmp), core material volume (Vmc), core void volume (Vvc), and valley void volume (Vvv). These are also calculated from the areal material ratio curve but provide more exact information than the parameters of the Sk group. Vmp is the volume of the material between 0 and 10% of the material ratio, while Vvv is between 80 and 100%. A relatively low Sp, Spk, and Vmp indicate favorable wear resistance, and a high Sv, Svk, and Vvv indicate favorable lubricant retention ability [13,14].
Skewness (Ssk) and kurtosis (Sku) are the third and fourth-order standardized moments of the height distribution [15,16], respectively. The former provides information about the asymmetry of a surface; its negative value indicates a more wear-resistant surface [17,18]. The latter is related to the peaky feature of a surface. A value above three indicates more sharp peaks on a surface [19]. Negative Ssk (skewed surface) indicates a higher load-bearing capacity and increased load-bearing area [20,21], and at the same time, the number of peaks is relatively low, which results in a shorter wear-in phase [22]. On the other hand, if the value of Ssk is high, the probability of crack nucleation increases [23]. Concerning the Sku parameter, if its value is higher than three, the lubricant retention ability of a surface increases [24] because the narrow valleys act as lubricant reservoirs [25,26]. It is difficult to describe the role of the Ssk and Sku parameters generally because there are contradictory findings in the research; however, they are widely studied parameters [27,28]. Contrary to the above characteristics of these, it was found in other studies that the lubricant retention ability is not influenced by the Sku significantly, and the Ssk has a higher impact on it [29] because the Ssk is more sensitive for peaks [30,31]. It was also found that skewness is not strongly correlated with the machining parameters, meaning that surface engineering based on this parameter incorporates challenges [32].
Several surface engineering-related studies focus on the effects of machining process parameters [33], the peak zone analysis and its effects on surface functionality, and the characteristics of the valley zone from the aspect of lubricant retention ability [34,35]. Various technologies that are suitable to create tribologically favorable surfaces are studied widely, including shot peening [36], milling [37,38], ball burnishing [39], ultrasonic assisted griding [40], turning [41,42], rotational turning [43,44], and grinding [45]. Velázquez Corral et al. found that vibration-assisted ball burnishing technology increases the wear resistance of Ti6Al4V components [46]. Beyond technological diversity, the range of studied topics is also wide. For example, Szlachetka et al. studied the connections between the mechanical and physical properties of the material and the topography characteristics [47]. Bingley et al. analyzed the effects of machining procedures on the behavior of lubricants [48]. Korkmaz et al. analyzed cryo-MQL to improve tribological properties [49]. Grzesik et al. obtained findings in the field of the functionality of hard-machined surfaces [30,50]. Flack et al. studied the connections between surface texture and friction characteristics [51].
Functionality and tribology-related analysis of surface texture and roughness is challenging; it is recommended to analyze several parameters parallelly to obtain the most exact and generalizable information about the important surface characteristics [52,53]. This was confirmed by Szala et al., who compared the wear resistance of several types of material grades [54]. It is recommended to use 3D topography analysis techniques in research and development due to their high accuracy [55]. This was confirmed by Krolczyk et al., who studied tribological characteristics of difficult-to-cut steels [56].
As highlighted, functionality, tribological properties, and their connections to surface topography are widely studied. The steel grade 16MnCr5 is also a focus of research. Ghera et al. found correlations among roughness parameters by analyzing the resistance to cavitation erosion based on different thermomechanical and heat treatment states of this steel [57]. Bartels et al. compared conventionally and additively manufactured (AM) 16MnCr5 steel and found that higher case-hardened depth can be reached in the latter case [58]. Saelzer et al. studied simulation possibilities and provided novel aspects for supporting decisions among experimental methods [59]. Dhar et al. analyzed the grinding process and found that minimal-quantity lubrication improves the grindability characteristics [60]. Agarwal et al. carried out turning experiments, applied analysis of variance, and determined optimum cutting parameters for minimization of surface roughness and maximization of material removal rate; however, they only analyzed the average roughness [61]. Knyazeva et al. analyzed the wear progress of gear wheels made of 16MnCr5 by different material-characterization techniques [62]. Several research directions and areas can be identified, but the detailed characterization of tribological properties of 16MnCr5 based on 3D surface topography parameters can be considered a research gap.
In this study, the results of hard turning and grinding experiments and 3D topography measurements are reported. The hard turning was carried out dry, and the grinding was carried out by using coolant fluid to improve the surface quality and decrease friction and cutting temperature. Eight topography parameters were analyzed from wear resistance and lubrication aspects. These parameters provide similar information about the mentioned tribological properties; however, their calculation methods and reliability are different.
The purpose of this study is to analyze surface topography parameters that describe the same tribological properties (wear resistance and lubricant retention ability) and compare them based on their reliability. For the comparison, statistical methods were applied. The results will contribute to industrial and academic applications and provide numerical information about the differences among the analyzed topography parameters and their reliabilities. The experiment was carried out on 16MnCr5 case-hardened steel, widely used in the automotive industry, but even so, there is a lack of up-to-date studies that are based on detailed machining experiments and apply the latest surface analyzing techniques, which can be considered another research gap. The obtained measurement data are discussed in the following order: summarization of the measured topography data; response functions; correlation analyses; study of the relative deviations; and topography maps for selecting the most favorable cutting data.
2. Material and Methods
2.1. Machining and Measurement
In the experiment, 60 mm diameter and 13 mm length external cylindrical surfaces were machined by hard turning and grinding. The same machining center was used for both procedures. The material grade was 16MnCr5, which is a low-carbon content steel and suitable for case hardening. Hard turning was carried out dry; for grinding, water-oil emulsion was used as a coolant fluid. The process parameters are summarized in Table 1, and the process of the research is demonstrated in Figure 1.
The workpieces were heat treated (case hardening) in three steps:
- Carburization at 920 °C for 14 h, then slow cooling on air.
- Quenching from 860 °C in oil.
- Tempering at 19 °C for 2 h, then slow cooling on air.
After heat treatment, a ~0.2 mm decarburized surface layer was removed, and the obtained hardness of the resulting surface varied between 60 and 63 HRC. The microstructure of the hardened layer is martensitic (Figure 2).
The three machining parameters of both the hard turning and grinding were varied at three levels. This resulted in 27 setups. The parameter values (low, medium, and high) were selected from the ranges recommended by the tool manufacturers. The design of the experiment is presented in Table 2 for the two machining procedures.
2.2. Analyzed Topography Parameters
In the analysis, ten topography parameters were compared. The height of the peak zone is the peak height (Sp), and the height of the valley zone is the valley depth (Sv). The skewness (Ssk) and the kurtosis (Sku) of the height distribution provide information about how skewed the distribution is and about the peaky feature of a surface, respectively (Equations (3) and (4)). Four other parameters were analyzed from the Sk and the volume parameter groups: reduced peak height (Spk), reduced valley depth (Svk), peak material volume (Vmp), and valley void volume (Vvv). The latter two are volume parameters and indicate the material or the void volume (ml) for one mm2 (Figure 3). The parameter definitions for Sp and Sv are demonstrated in Figure 3a, Spk and Svk are demonstrated in Figure 3b, and Vmp and Vvv are demonstrated in Figure 3c. The topographical features of the different Ssk and Sku values are demonstrated in Figure 3d.
In the analysis, the correlation coefficient (r) and its square, the coefficient of determination (r2), are used. The formula of the former is expressed by Equation (5).
where x and y are random variables between which the correlation is calculated.
3. Results and Discussion
3.1. Topography Parameters
The mean values and ranges of the topography parameters are summarized in Figure 4, Figure 5 and Figure 6 for the different feed rates (f1 = 0.04 mm/rev, f2 = 0.12 mm/rev, f3 = 0.2 mm/rev) and wheel revolutions (nT1 = 3000 rev/min, nT1 = 4500 rev/min, nT1 = 6000 rev/min) of hard turning and grinding, respectively. The topography parameter value ranges on each feed rate and wheel revolution level incorporate the data points connected to all the analyzed cutting parameters and their levels. This means that a single value range consists of nine data points.
The means of the peak parameter values (Vmp, Sp, and Spk) of the hard-turned surfaces show significant increases with the feed rate. At the lowest feed rate (f1), Vmp varies between 0.005 and 0.016 ml/m2, at the middle value (f2) between 0.016 and 0.027 ml/m2, and at the highest (f3) between 0.044 and 0.059 ml/m2 (Figure 4a). These ranges for Sp are 0.319–0.894 µm, 1.197–1.361 µm, and 3.182–3.684 µm (Figure 4b), and for Spk are 0.085–0.324 µm, 0.727–1.055 µm, and 2.211–2.588 µm (Figure 4c). The deviations slightly increase with the feed rate. The mean values of the peak parameters for the ground surfaces show significant decreases with the rpm of the tool. At the lowest rpm (nT1), Vmp varies between 0.035 and 0.186 ml/m2, at the middle value (nT2) between 0.024 and 0.116 ml/m2, and at the highest (nT3) between 0.021 and 0.050 ml/m2 (Figure 4a). These ranges for Sp are 1.932–11.333 µm, 1.316–6.163 µm, and 1.202–2.706 µm (Figure 4b), and for Spk are 0.668–3.579 µm, 0.391–2.051 µm, and 0.351–0.928 µm (Figure 4c). The deviations significantly decrease with the tool rpm.
The mean of the volume parameter values (Vvv, Sv, and Svk) of the hard-turned surfaces show a slight increase with the feed rate. At the lowest feed rate (f1), Vvv varies between 0.017 and 0.038 ml/m2, at the middle value (f2) between 0.019 and 0.031 ml/m2, and at the highest (f3) between 0.039 and 0.077 ml/m2 (Figure 5a). These ranges for Sv are 0.411–0.975 µm, 0.762–0.981 µm, and 1.872–2.936 µm (Figure 5b), and for Svk are 0.111–0.285 µm, 0.121–0.251 µm, and 0.133–0.449 µm (Figure 5c). The means of the valley parameters for the ground surfaces show a significant decrease with the rpm of the tool. At the lowest rpm (nT1), Vvv varies between 0.077 and 0.726 ml/m2, at the middle value (nT2) between 0.059 and 0.263 ml/m2, and at the highest (nT3) between 0.059 and 0.107 ml/m2 (Figure 5a). These ranges for Sv are 2.009–15.380 µm, 1.442–6.040 µm, and 1.382–2.728 µm (Figure 5b), and for Svk are 0.604–7.459 µm, 0.466–1.627 µm, and 0.440–0.814 µm (Figure 5c). The deviations significantly decrease with the tool rpm. The obtained results confirm that the surface height-related parameters are favorable at lower feed rates and higher tool rpm for hard turning and grinding, respectively. The significant differences in the deviations of the parameters of ground surfaces indicate that these parameters are also influenced by the feed rate.
In the case of the hard-turned surfaces, at the lowest feed rate (f1), Ssk varies between −0.663 and 0.139, at the middle value (f2) between 0.705 and 0.963, and at the highest (f3) between 0.557 and 0.715 (Figure 6a). These ranges for Sku are 3.146–4.065, 2.478–3.120, and 2.095–2.352 (Figure 6b). In the case of the ground surfaces, at the lowest feed rate (f1), Ssk varies between −1.277 and 0.700, at the middle value (f2) between −0.106 and 0.384, and at the highest (f3) between −0.253 and 0.075 (Figure 6a). These ranges for Sku are 2.738–5.941, 2.921–3.276, and 2.960–3.232 (Figure 6b). No tendency (outlying mean in hard turning at f2 feed rate) was obtained for the means of Ssk values, but the deviations show significant decreases with the considered cutting parameters in both technologies, which confirms the findings in [20,30] that this parameter is sensitive to texture deviations and contradicts the finding in [29]. Concerning Sku, both its means and deviations significantly decrease with the cutting parameters in both technologies.
3.2. Response Functions
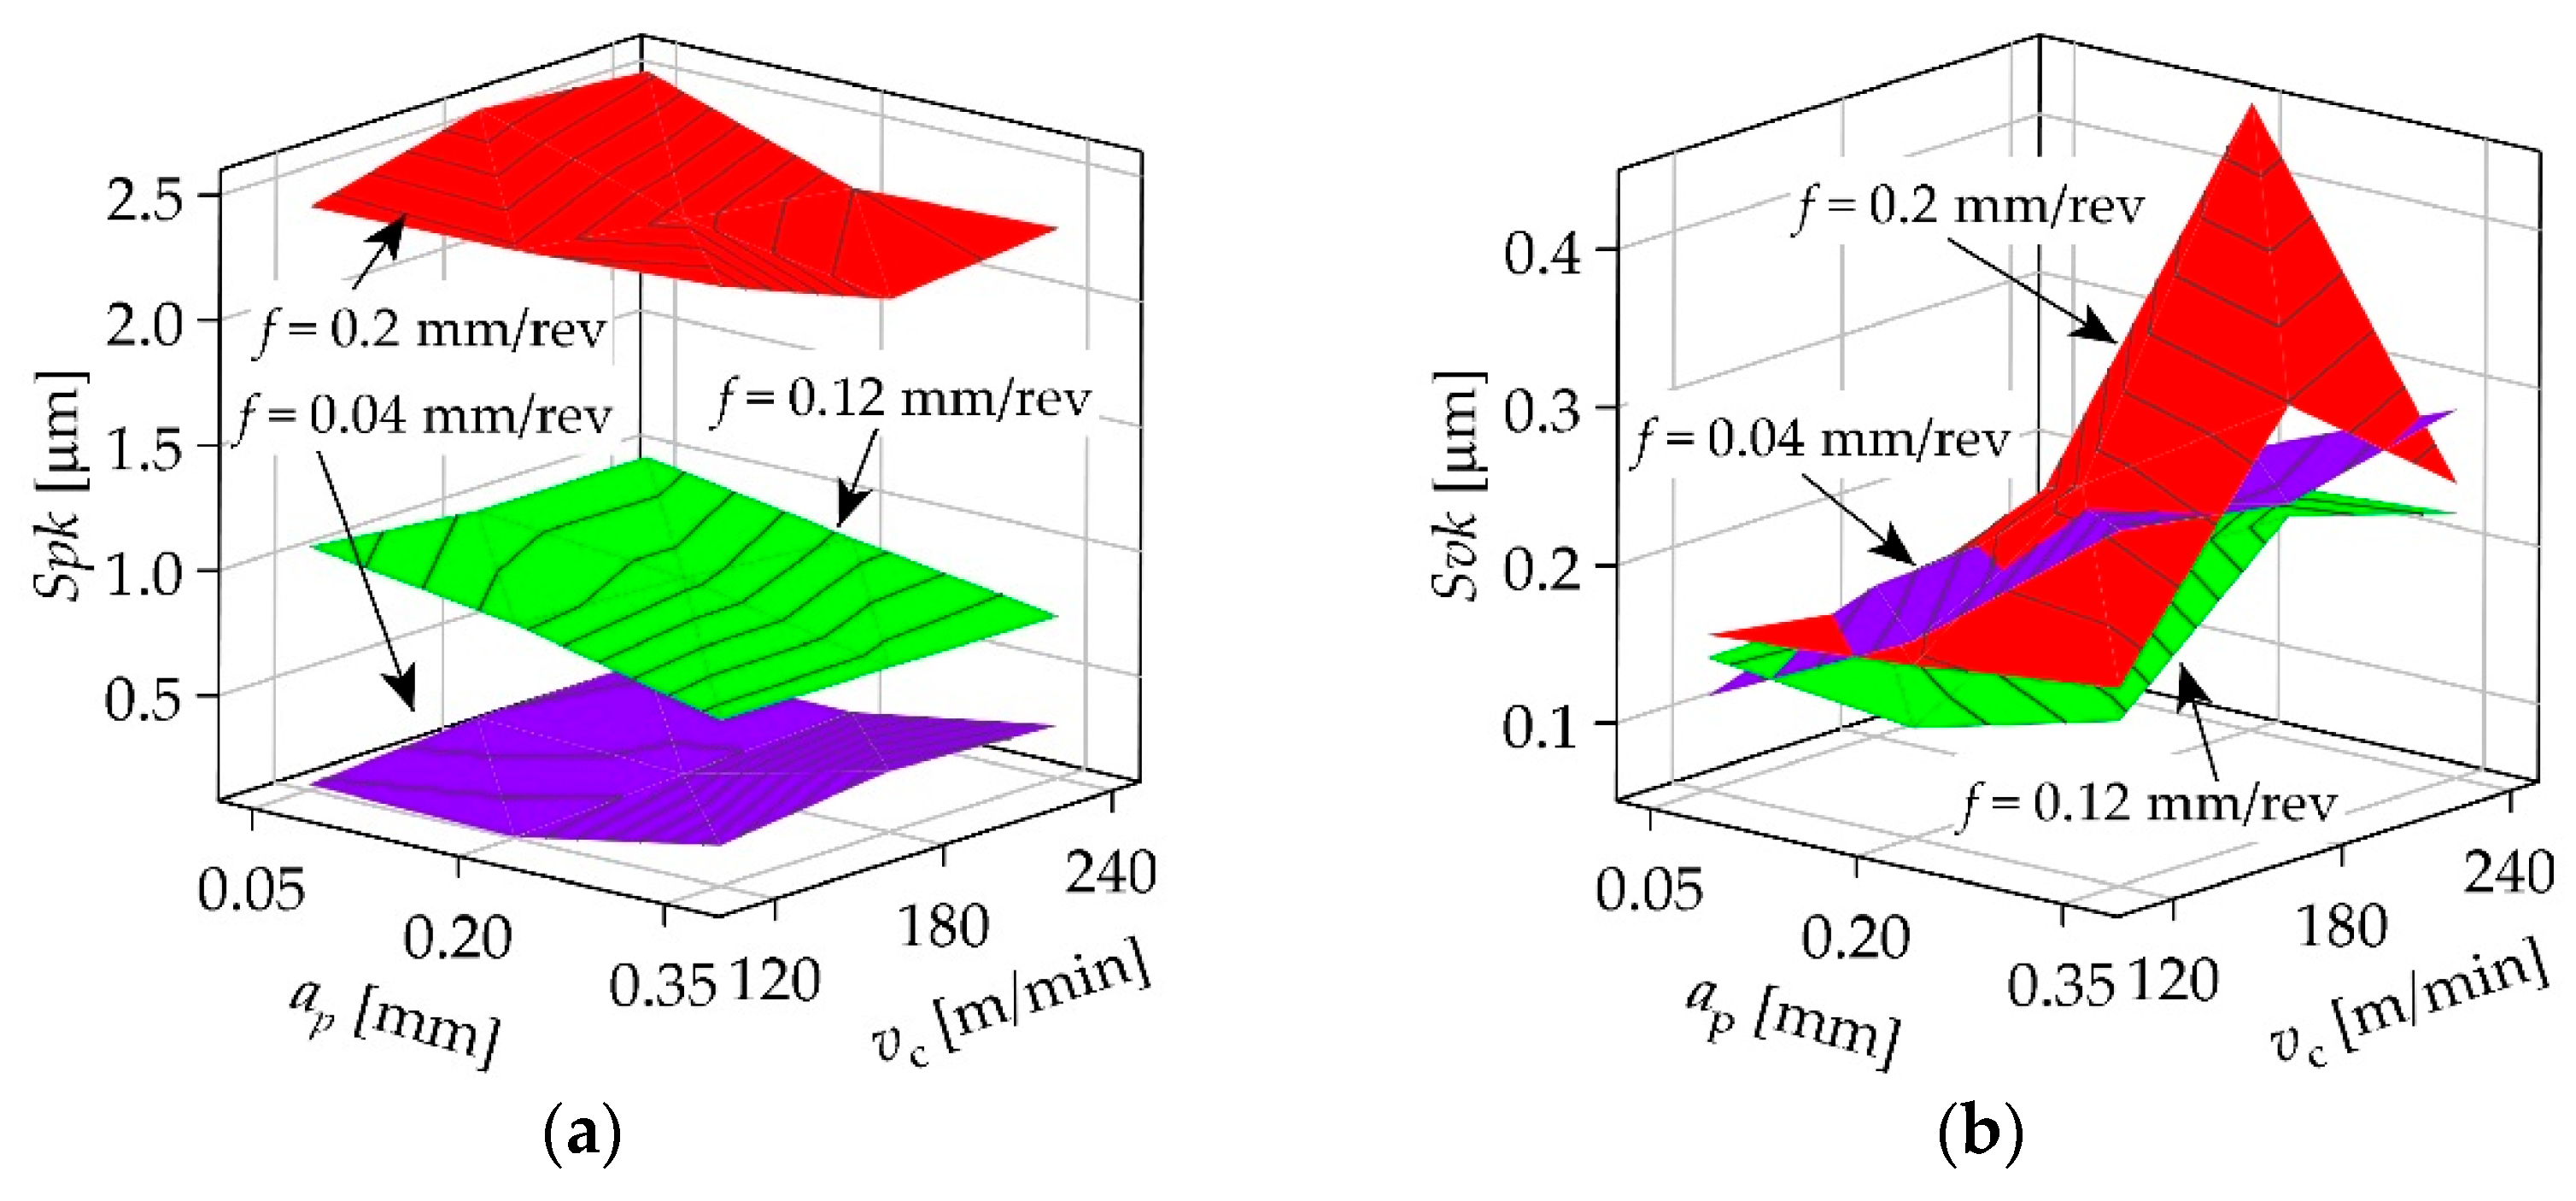
It is not favorable to have a high deviation in a tribological property-related topography parameter that can be the basis of cutting parameter value selection. However, as shown by the results, the most favorable (minimum or maximum) parameter value can be found among values that show high deviation in some cases. At the same time, there are topography parameters where the means are close to each other, and the topography parameter value ranges are overlapped. Examples are demonstrated in Figure 7 and Figure 8 for hard turning and grinding, respectively. It can be observed that there are topography parameters (Figure 7b and Figure 8b) that are not influenced clearly by either the feed rate or the workpiece revolution, and therefore, the corresponding surfaces are overlapped.
Response functions that fit well to the measured data points can be a more suitable tool in cutting parameter selection. Quadratic three-factor response functions were created for the analyzed topography parameters, which incorporate the interactions of the cutting parameters, too. The general formulas of the functions are presented by Equations (6) and (7) for hard turning and grinding, respectively. The c parameters are collected in Table A1 and Table A2.
The goodness of fit can be quantified by the coefficient of determination (r2). This value provides information about how the constructed response functions fit on the measured topography data points. If the r2 value is at least 0.81, the fit is extremely strong, and when between 0.49 and 0.8, it indicates a strong relationship. The r2 values are summarized in Table 3 for the analyzed parameters. In hard turning, only Svk has a strong relationship, and in the case of grinding, Ssk and Sku. The connections in the other parameters are extremely strong. These values confirm the results obtained in the analysis of means and value ranges: in hard turning, the data point ranges of Svk were relatively narrow and overlapped; in grinding, Ssk and Sku values were overlapped. It can be concluded that the cutting parameter selection in these topography parameters can be less reliable than in the others. However, the strong relationships indicate that the chosen type of response function is suitable for predicting the topography values. This confirms the findings in [63,64].
3.3. Correlation Analysis
Correlations (r) were analyzed for the topography parameters to quantify the relationships among them. The strength of a correlation can be classified as extremely strong: 0.9 < r < 1, strong: 0.7 < r < 0.9, medium: 0.4 < r < 0.7, weak: 0.2 < r < 0.4, or extremely weak: 0 < r < 0.2. The correlograms in Figure 9 and Figure 10 summarize the correlation coefficient values for hard turning and grinding, respectively. Concerning the three analyzed peak parameters, extremely strong correlations were obtained for all of them. This indicates that in the cutting parameters selection, Vmp, Sp, and Spk are equivalent. Extremely strong correlations were obtained for the Vvv–Sv relationship in hard turning and for all three volume parameters in grinding. The Vvv–Svk relationship (r = 0.71) is still strong, although this and the Sv–Svk relationship (r = 0.46) in hard turning cannot be considered as reliable as the other pairs. These results indicate that the parameter pair Vvv–Sv in hard turning and all three volume parameter pairs in grinding are equivalent.
In hard turning, strong or extremely strong correlations were not obtained for the parameter pairs that include Ssk, and in grinding, only the pair Ssk–Svk showed a strong (near to the lower limit of the range) negative correlation. This indicates that Ssk is not strongly equivalent to the analyzed parameters. Concerning Sku, strong negative correlations were obtained by pairing it with Vmp, Sp, Spk, Sv, and Ssk in hard turning. It should be noted that in the case of the last one, the correlation coefficient is at the lowest part of the ‘strong relationship’ range. In grinding, strong positive correlations were obtained only by pairing with Vmp and Vvv. Sku can be considered equivalent with the Vmp, Sp, Spk, and Sv in hard turning and with Vmp and Vvv in grinding.
3.4. Analysis of the Relative Deviations
To confirm the obtained results, another analysis was carried out. The relative deviations of the topography parameters are demonstrated in Figure 11, Figure 12, Figure 13 and Figure 14 for the different feed rate (hard turning) or tool rpm (grinding) levels. The total relative deviations are calculated by considering all the topography data points independently from the cutting parameter values. This analysis provides information about the similarity of tendencies in the means and deviations.
In the case of hard turning, the relative deviations of the peak parameters (Figure 11) at the f1 feed rate differ from each other by 9.4%, at f2 by 15.7%, and at f3 by 5.2%. By involving all the data points, the relative deviations differ from each other by 18.2%. These findings indicate that the interchangeability of the peak parameters is the most reliable at the analyzed highest feed rate; however, a difference of around 10–15% can still be considered reliable. Concerning the equivalence of the parameters, the obtained correlation results can be confirmed by the relative deviation results.
The relative deviations of the valley parameters (Figure 12) at the f1 feed rate differ from each other by 4%, at f2 by 17.9%, and at f3 by 29.5%. By involving all the data points, the relative deviations differ from each other by 21.8%. These findings indicate that the interchangeability of the peak parameters is most reliable at the analyzed lowest feed rate.
Analyzing the parameter pairs separately, the relative deviations for the parameter pair Vvv–Sv at the three feed rates differ from each other by less than 10%; for the pair Vvv–Svk, the differences vary between 4% and 21.8%, and for the pair Sv–Svk, between 0.6% and 29.5%. These results reflect the strength of correlations. Concerning the equivalence of the parameters, the obtained correlation results can be confirmed by the relative deviation results in the case of the parameter pair Vvv–Sv.
In the case of grinding, the relative deviations of the peak parameters (Figure 13) at nT1 tool rpm differ from each other by 3.7%, at nT2 by 3.2%, and at nT3 by 5.4%. By involving all the data points, the relative deviations differ from each other by 1.7%. Concerning the equivalence of the parameters, the obtained correlation results can be confirmed by the relative deviation results.
The relative deviations of the valley parameters (Figure 14) at nT1 tool rpm differ from each other by 13.3%, at nT2 by 8.8%, and at nT3 by 2.4%. By involving all the data points, the relative deviations differ from each other by 20.9%. Concerning the equivalence of the parameters, the obtained correlation results can be confirmed by the relative deviation results; however, the correlation coefficients are relatively low compared to those of the peak parameters, and this is reflected in the higher differences in relative deviations.
3.5. Tribology Map—Cutting Parameter Selection
For the cutting parameter selection, the actual values of topography parameters provide reliable information. The maximum or minimum values (depending on their tribological suitability) of the topography parameters and their cutting parameter value combinations are summarized in Table 4.
In hard turning, except for Sku, the most favorable values were obtained at a 0.2 mm depth of cut, which is the middle of the parameter range recommended by the tool manufacturer. Although the most influencing cutting parameter is the feed rate, it can be observed that the minimum peak parameters were obtained at 120 m/min and the maximum valley parameters at 240 m/min. The most favorable Ssk and Sku values were obtained at the middle level of the range recommended by the tool manufacturer (180 m/min). Concerning the feed rates, the minimum peak parameter values and the most favorable Ssk and Sku values were obtained at 0.04 mm/rev, and the maximum valley parameter values were obtained at 0.2 mm/rev.
In grinding, the minimum peak parameter values were obtained at 6000 rev/min tool rpm, and for the maximum valley parameter values, the most favorable Ssk and Sku values were obtained at 3000 rev/min. Concerning the workpiece rpm, the minimum peak parameters were obtained at 100 rev/min and the most favorable Ssk and Sku at 200 rev/min. The maximum valley parameters (except for Sv) were obtained at 100 rev/min. However, at 100 rev/min, a similar Sv value (13.202 µm) was obtained, which can also be considered extremely high. The peak parameters are the lowest at a 2 mm/min feed rate; the maximum valley parameters and the most favorable Ssk and Sku parameters were obtained at 8 mm/min.
The cutting parameter combinations of the most favorable values of each analyzed topography parameter are included in Figure 15 and Figure 16. In the figures, the blue arrows indicate the directions of approaching the optimum value. The most favorable peak parameters and similarly favorable values of Ssk and Sku parameters can be obtained at 0.04 mm/rev feed rate, and the 0.2 mm/rev feed rate belongs to the most favorable valley parameter values in the case of hard turning. When a low feed rate is applied, both the peak and valley zones are small in both their heights and volumes. This is the reason why the peak parameters are favored at low feed rates, and the valley parameters are favored at high rates. The theoretical topography is not influenced by the depth of cut and the cutting speed; however, in the case of a real surface, dynamic effects occur, which may be the reason why the low peak parameters were obtained at a low cutting speed and the high valley parameters at high speed. Most of the favorable parameter values were obtained at a middle depth of cut, which is the recommended value of the tool manufacturer.
The most favorable peak parameters and a couple of similarly favorable values can be obtained at 6000 rev/min tool rpm, and 3000 rev/min tool rpm is associated with the most favorable valley parameter Ssk and Sku values in the case of grinding. Another significant influencing cutting parameter is the feed rate. The most favorable peak parameters were obtained at 2 mm/min, and the most favorable valley parameters, Ssk and Sku values were obtained at 8 mm/min. Many of the lowest peak parameter values and many of the lowest valley parameter values were found for 100 rev/min workpiece rpm; however, this is not a significantly influential cutting parameter. The most favorable Ssk and Sku values are for 200 rev/min workpiece rpm. These results confirm the findings in [65,66]. High tool revolution results in a smoother surface with lower peaks and valleys. This effect is strengthened by the low value of the feed rate. This explains that the favorable peak parameters were obtained at the highest tool revolution and at the lowest feed rate, and the most favorable valley parameters at the lowest tool revolution and highest feed rate. The effects of the wheel revolution are not considerable, although a more in-depth analysis is recommended for this cutting parameter.
4. Conclusions
Hard turning and grinding experiments and topography measurements were carried out for the parameters of peak material volume (Vmp), peak height (Sp), reduced peak height (Spk), valley void volume (Vvv), valley depth (Sv), reduced valley depth (Svk), skewness (Ssk), and kurtosis (Sku). The cutting parameters were set in the ranges recommended by the tool manufacturers. The findings of the experiment and measurements are valid for the applied cutting parameter values:
- The means of Vmp, Sp, and Spk increase significantly and the deviations increase slightly in hard turning. The means and the deviations of Vmp, Sp, and Spk decrease significantly in grinding. The means of Vvv, Sv, and Svk increase slightly in hard turning. The means and deviations of Vvv, Sv, and Svk decrease significantly in grinding. No tendencies can be observed in the means and deviations of the Ssk values in the analyzed technologies. The means and deviations of Sku decrease significantly both in hard turning and grinding.
- Quadratic response functions were created for the analyzed topography parameter, and this type is suitable for predicting the topography values, which is indicated by the coefficients of determination that varied between 0.52 and 0.99.
- The correlation coefficients among Vmp, Sp, and Spk vary between 0.95 and 099 in the case of hard turning and grinding. The correlation coefficients among Vvv, Sv, and Svk vary between 0.92 and 1 in the case of grinding, and its value is 0.94 between Vvv and Sv in the case of hard turning. These findings indicate that these parameters are equivalent to each other. Ssk is not strongly equivalent to the analyzed parameters in hard turning and grinding (−0.71 < r < 0.58). Sku can be considered equivalent to Vmp, Sp, Spk, and Sv (−0.89 < r < −0.77) in hard turning and to Vmp and Vvv (0.72 < r < 0.85) in grinding. These results are confirmed by the analysis of the relative deviations carried out for the different feed rates and tool revolutions in the case of hard turning and grinding, respectively.
- Tribology maps were constructed to determine the cutting parameters of the most favorable topography parameters. The most favorable Vmp, Sp, Spk, Ssk, and Sku parameter values were obtained at 0.04 mm/rev feed rate, and the most favorable Vvv, Sv, and Svk parameter values at 0.2 mm/rev feed rate in hard turning. The most favorable Vmp, Sp, and Spk parameter values were obtained at 6000 rev/min tool rpm and 2 mm/min feed rate, and the most favorable Vvv, Sv, Svk, Ssk, and Sku at 3000 rev/min tool rpm and 8 mm/min feed rate in grinding.
The research can be extended to analyzing and comparing further material grades that have similar properties to 16MnCr5 and to analyzing further (rarely applied or special) topography parameters. Different edge geometries of turning inserts and different wheel properties (bonding material, grain size) influence surface topography; including such dependent variables in the experiment would be another important extension and is worth analysis.
Funding
This research received no external funding.
Data Availability Statement
Not applicable.
Conflicts of Interest
The author declares no conflict of interest.
Appendix A

Table A1.
Parameters of the quadratic response functions of the hard-turned surfaces.
| c1 | c2 | c3 | c4 | c5 | c6 | c7 | c8 | c9 | c10 | |
|---|---|---|---|---|---|---|---|---|---|---|
| Vmp | 0.013 | −0.012 | −0.0001 | −0.088 | 0.082 | 0.00000 | 1.355 | 0.0000 | −0.035 | 0.0001 |
| Sp | 0.543 | 1.149 | −0.0013 | −6.942 | 0.834 | 0.00000 | 105.610 | −0.0014 | −7.304 | 0.0018 |
| Spk | −0.127 | 0.058 | 0.0013 | 1.332 | 2.142 | 0.00000 | 63.518 | −0.0024 | −6.925 | −0.0077 |
| Vvv | 0.021 | 0.086 | 0.0001 | −0.417 | −0.138 | 0.00000 | 2.135 | 0.0001 | −0.053 | 0.0004 |
| Sv | 0.699 | 3.247 | −0.0011 | −12.460 | −4.716 | 0.00000 | 84.476 | −0.0003 | −5.307 | 0.0140 |
| Svk | 0.041 | 0.866 | 0.0012 | −2.177 | −1.277 | 0.00000 | 6.853 | 0.0005 | −0.892 | 0.0046 |
| Ssk | −0.863 | −3.343 | −0.0024 | 29.381 | 9.285 | 0.00001 | −96.741 | −0.0010 | −1.728 | −0.0036 |
| Sku | 1.859 | 1.580 | 0.0200 | −8.381 | −2.790 | −0.00005 | 6.886 | 0.0004 | −0.476 | −0.0077 |
Table A2.
Parameters of the quadratic response functions of the ground surfaces.
| c1 | c2 | c3 | c4 | c5 | c6 | c7 | c8 | c9 | c10 | |
|---|---|---|---|---|---|---|---|---|---|---|
| Vmp | 0.290 | −0.0007 | −0.0001 | 0.019 | 0.00000 | 0.00000 | 0.0000 | 0.00000 | 0.0001 | 0.00000 |
| Sp | 11.575 | 0.0081 | −0.0043 | 1.377 | −0.00026 | 0.00000 | 0.0005 | 0.00001 | 0.0028 | −0.00028 |
| Spk | 6.434 | −0.0091 | −0.0019 | 0.282 | −0.00007 | 0.00000 | −0.0097 | 0.00000 | 0.0017 | −0.00007 |
| Vvv | 0.453 | 0.0022 | −0.0003 | 0.122 | −0.00001 | 0.00000 | 0.0049 | 0.00000 | 0.0001 | −0.00003 |
| Sv | 8.408 | 0.0666 | −0.0064 | 2.410 | −0.00027 | 0.00000 | 0.0644 | 0.00000 | 0.0039 | −0.00062 |
| Svk | 7.147 | −0.0098 | −0.0035 | 1.266 | 0.00000 | 0.00000 | 0.0272 | 0.00000 | −0.0001 | −0.00027 |
| Ssk | 1.674 | −0.0139 | 0.0001 | −0.220 | −0.00001 | 0.00000 | −0.0135 | 0.00000 | 0.0000 | 0.00007 |
| Sku | 8.404 | −0.0257 | −0.0011 | −0.294 | 0.00006 | 0.00000 | 0.0253 | 0.00000 | 0.0020 | −0.00005 |
References
- Sasaki, S. Advances in Tribology Driven by Surface Science. e-J. Surf. Sci. Nanotechnol. 2023, 21, 98–104. [Google Scholar] [CrossRef]
- Mathia, T.G.; Pawlus, P.; Wieczorowski, M. Recent trends in surface metrology. Wear 2011, 271, 494–508. [Google Scholar] [CrossRef]
- Kamarthi, S.; Sultornsanee, S.; Zeid, A. Recurrence quantification analysis to estimating surface roughness in finish turning processes. Int. J. Adv. Manuf. Technol. 2016, 87, 451–460. [Google Scholar] [CrossRef]
- Kumar, R.; Sahoo, A.K.; Mishra, P.C.; Das, R.K. Measurement and machinability study under environmentally conscious spray impingement cooling assisted machining. Measurement 2019, 135, 913–927. [Google Scholar] [CrossRef]
- Li, C.; Piao, Y.; Meng, B.; Hu, Y.; Li, L.; Zhang, F. Phase transition and plastic deformation mechanisms induced by self-rotating grinding of GaN single crystals. Int. J. Mach. Tools Manuf. 2022, 172, 103827. [Google Scholar] [CrossRef]
- Javaroni, R.L.; Lopes, J.C.; Sato, B.K.; Sanchez, L.E.A.; Mello, H.J.; Aguiar, P.R.; Bianchi, E.C. Minimum quantity of lubrication (MQL) as an eco-friendly alternative to the cutting fluids in advanced ceramics grinding. Int. J. Adv. Manuf. Technol. 2019, 103, 2809–2819. [Google Scholar] [CrossRef]
- Kumar, P.; Chauhan, S.R.; Aggarwal, A. Effects of cutting conditions, tool geometry and material hardness on machinability of AISI H13 using CBN tool. Mater. Today Proc. 2021, 46, 9217–9222. [Google Scholar] [CrossRef]
- Dosbaeva, G.K.; El Hakim, M.A.; Shalaby, M.A.; Krzanowski, J.E.; Veldhuis, S.C. Cutting temperature effect on PCBN and CVD coated carbide tools in hard turning of D2 tool steel. Int. J. Refract. Hard Met. 2015, 50, 1–8. [Google Scholar] [CrossRef]
- Karpuschewski, B.; Schmidt, K.; Beno, J.; Mankova, I.; Prilukova, J. Measuring procedures of cutting edge preparation when hard turning with coated ceramics tool inserts. Measurement 2014, 55, 627–640. [Google Scholar] [CrossRef]
- Niaki, F.A.; Haines, E.; Dreussi, R.; Weyer, G. Machinability and surface integrity characterization in hard turning of AISI 4320 bearing steel using different CBN inserts. Proc. Manuf. 2020, 48, 598–605. [Google Scholar] [CrossRef]
- Skoczy, A. Selected Properties of the Surface Layer of C45 Steel Parts Subjected to Laser Cutting and Ball Burnishing. Materials 2020, 13, 3429. [Google Scholar] [CrossRef] [PubMed]
- Stout, K.; Blunt, L. Three-Dimensional Surface Topography, 2nd ed.; Penton Press: London, UK, 2000; ISBN 9781857180268. [Google Scholar]
- Pawlus, P.; Reizer, R.; Zelasko, W. Prediction of parameters of equivalent sum rough surfaces. Materials 2020, 13, 4898. [Google Scholar] [CrossRef] [PubMed]
- Yang, Y.; Knust, S.; Schwiderek, S.; Qin, Q.; Yun, Q.; Grundmeier, G.; Keller, A. Protein adsorption at nanorough titanium oxide surfaces: The importance of surface statistical parameters beyond surface roughness. Nanomaterials 2021, 11, 357. [Google Scholar] [CrossRef] [PubMed]
- Sedlacek, M.; Podgornik, B.; Vizintin, J. Correlation between standard roughness parameters skewness and kurtosis and tribological behaviour of contact surfaces. Tribol. Int. 2012, 48, 102–112. [Google Scholar] [CrossRef]
- Trzepiecinski, T.; Szpunar, M.; Dzierwa, A.; Zaba, K. Investigation of surface roughness in incremental sheet forming of conical drawpieces from pure titanium sheets. Materials 2022, 15, 4278. [Google Scholar] [CrossRef] [PubMed]
- Pawlus, P.; Reizer, R.; Wieczorowski, M. Functional importance of surface texture parameters. Materials 2021, 14, 5326. [Google Scholar] [CrossRef]
- Liang, G.; Schmauder, S.; Lyu, M.; Schneider, Y.; Zhang, C.; Han, Y. An investigation of the influence of initial roughness on the friction and wear behavior of ground surfaces. Materials 2018, 11, 237. [Google Scholar] [CrossRef] [Green Version]
- Dzierwa, A.; Pawlus, P.; Zelasko, W. The influence of disc surface topography after vapour blasting on friction and wear of sliding pairs under dry friction conditions. Coatings 2020, 10, 102. [Google Scholar] [CrossRef] [Green Version]
- Sedlacek, M.; Gregorcic, P.; Podgornik, B. Use of the roughness parameters Ssk and Sku to control friction—A method for designing surface texturing. Tribol. Trans. 2017, 60, 260–266. [Google Scholar] [CrossRef]
- Dzierwa, A. Influence of surface preparation on surface topography and tribological behaviours. Arch. Civ. Mech. Eng. 2017, 17, 502–510. [Google Scholar] [CrossRef]
- Gu, H.; Jiao, L.; Yan, P.; Liang, J.; Qiu, T.; Liu, Z.; Wang, X. Effect of machined surface texture on fretting crack nucleation under radial loading in conformal contact. Tribol. Int. 2021, 153, 106575. [Google Scholar] [CrossRef]
- Kovacs, Z.; Viharos, Z.J.; Kodacsy, J. The effects of machining strategies of magnetic assisted roller burnishing on the resulted surface structure. Mater. Sci. Eng. 2018, 448, 012002. [Google Scholar] [CrossRef] [Green Version]
- Etsion, I. State of the art in laser surface texturing. J. Tribol. 2005, 127, 248–253. [Google Scholar] [CrossRef]
- Zhua, Z.; Loub, S.; Majewski, C. Characterisation and correlation of areal surface texture with processing parameters and porosity of high speed sintered parts. Addit. Manuf. 2020, 36, 101402. [Google Scholar] [CrossRef]
- Orrillo, P.A.; Santalla, S.N.; Cuerno, R.; Vazquez, L.; Ribotta, S.B.; Gassa, L.M.; Mompean, F.J.; Salvarezza, R.C.; Vela, M.E. Morphological stabilization and KPZ scaling by electrochemically induced co-deposition of nanostructured NiW alloy films. Sci. Rep. 2017, 7, 17997. [Google Scholar] [CrossRef] [PubMed] [Green Version]
- Yu, N.; Polycarpou, A.A. Combining and contacting of two rough surfaces with asymmetric distribution of asperity heights. J. Tribol. 2004, 126, 225–232. [Google Scholar] [CrossRef]
- Grzesik, W.; Zak, K.; Kiszka, P. Comparison of surface textures generated in hard turning and grinding operations. Procedia CIRP 2014, 13, 84–89. [Google Scholar] [CrossRef] [Green Version]
- Ba, E.C.T.; Dumont, M.R.; Martins, P.S.; Drumond, R.M.; Martins da Cruz, M.P.; Vieira, V.F. Investigation of the effects of skewness Rsk and kurtosis Rku on tribological behavior in a pin-on-disc test of surfaces machined by conventional milling and turning processes. Mater. Res. 2021, 24, e20200435. [Google Scholar] [CrossRef]
- Naylor, A.; Talwalkar, S.C.; Trail, I.A.; Joyce, T.J. Evaluating the surface topography of pyrolytic carbon finger prostheses through measurement of various roughness parameters. J. Funct. Biomater. 2016, 7, 9. [Google Scholar] [CrossRef] [Green Version]
- Gadelmawla, E.S.; Koura, M.M.; Maksoud, T.M.A.; Elewa, I.M.; Soliman, H.H. Roughness parameters. J. Mater. Process. Technol. 2002, 123, 133–145. [Google Scholar] [CrossRef]
- Karkalos, N.E.; Karmiris-Obratanski, P.; Kurpiel, S.; Zagorski, K.; Markopoulos, A.P. Investigation on the surface quality obtained during trochoidal milling of 6082 aluminum alloy. Machines 2021, 9, 75. [Google Scholar] [CrossRef]
- Bilek, O.; Pata, V.; Kubisova, M.; Reznicek, M. Mathematical methods of surface roughness evaluation of areas with a distinctive inclination. Manuf. Technol. 2018, 18, 363–368. [Google Scholar] [CrossRef]
- Zabala, A.; Saenz de Argandona, E.; Canizares, D.; Llavori, I.; Otegi, N.; Mendiguren, J. Numerical study of advanced friction modelling for sheet metal forming: Influence of the die local roughness. Tribol. Int. 2022, 165, 107259. [Google Scholar] [CrossRef]
- Chen, H.; Xu, C.; Xiao, G.; Yi, M.; Chen, Z.; Zhang, J. Analysis of the relationship between roughness parameters of wear surface and tribology performance of 5CB liquid crystal. J. Mol. Liq. 2022, 352, 118711. [Google Scholar] [CrossRef]
- Zhu, L.; Guan, Y.; Wang, Y.; Xie, Z.; Lin, J.; Zhai, J. Influence of process parameters of ultrasonic shot peening on surface roughness and hydrophilicity of pure titanium. Surf. Coat. Technol. 2017, 317, 38–53. [Google Scholar] [CrossRef]
- Edelbi, A.; Kumar, R.; Sahoo, A.K.; Pandey, A. Comparative machining performance investigation of dual-nozzle MQL-assisted ZnO and Al2O3 nanofluids in face milling of Ti–3Al–2.5V alloys. Arab. J. Sci. Eng. 2023, 48, 2969–2993. [Google Scholar] [CrossRef]
- Nagy, A.; Kundrak, J. Investigation of face milled surface topography on C45 workpiece assuming movement at 30° and 60° to feed direction. Cut. Tools Technol. Syst. 2023, 98, 116–127. [Google Scholar] [CrossRef]
- Sagbas, A. Analysis and optimization of surface roughness in the ball burnishing process using response surface methodology and desirability function. Adv. Eng. Softw. 2011, 42, 992–998. [Google Scholar] [CrossRef]
- Wdowik, R. Measurements of surface texture parameters after ultrasonic assisted and conventional grinding of carbide and ceramic samples in selected machining conditions. Procedia CIRP 2018, 78, 329–334. [Google Scholar] [CrossRef]
- Maruda, R.W.; Krolczyk, G.M.; Wojciechowski, S.; Powalka, B.; Klos, S.; Szczotkarz, N.; Matuszak, M.; Khanna, N. Evaluation of turning with different cooling-lubricating techniques in terms of surface integrity and tribologic properties. Tribol. Int. 2020, 148, 106334. [Google Scholar] [CrossRef]
- Mallick, R.; Kumar, R.; Panda, A.; Sahoo, A.K. Hard turning performance investigation of AISI D2 steel under a dual nozzle MQL environment. Lubricants 2023, 11, 16. [Google Scholar] [CrossRef]
- Sztankovics, I.; Kundrak, J. The characteristic parameters of the twist structure on cylindrical surfaces machined by turning procedures. Appl. Mech. Mater. 2014, 693, 418–423. [Google Scholar] [CrossRef]
- Sztankovics, I.; Kundrak, J. Theoretical value and experimental study of arithmetic mean deviation in rotational turning. Cut. Tools Technol. Syst. 2022, 96, 73–81. [Google Scholar] [CrossRef]
- Grzesik, W.; Rech, J.; Zak, K. High-precision finishing hard steel surfaces using cutting, abrasive and burnishing operations. Procedia Manuf. 2015, 1, 619–627. [Google Scholar] [CrossRef] [Green Version]
- Velazquez Corral, E.; Wagner, V.; Jerez Mesa, R.; Delbe, K.; Lluma, J.; Travieso Rodriguez, J.A.; Dessein, G. Wear resistance and friction analysis of Ti6Al4V cylindrical ball burnished specimens with and without vibration assistance. Int. J. Adv. Manuf. Technol. 2023. [Google Scholar] [CrossRef]
- Szlachetka, O.; Witkowska-Dobrev, J.; Baryla, A.; Dohojda, M. Low-density polyethylene (LDPE) building films—Tensile properties and surface morphology. J. Build. Eng. 2021, 44, 103386. [Google Scholar] [CrossRef]
- Bingley, R.; Buttery, M.; Romera, R.F. The effect of surface production techniques on the tribological behaviour of fluid lubricants. In Proceedings of the 18 European Space Mechanisms and Tribology Symposium, Munich, Germany, 18–20 September 2019. [Google Scholar]
- Korkmaz, M.E.; Gupta, M.K.; Demirsoz, R. Understanding the lubrication regime phenomenon and its influence on tribological characteristics of additively manufactured 316 Steel under novel lubrication environment. Tribol. Int. 2022, 173, 107686. [Google Scholar] [CrossRef]
- Grzesik, W. Prediction of the functional performance of machined components based on surface topography: State of the art. J. Mater. Eng. 2016, 25, 4460–4468. [Google Scholar] [CrossRef] [Green Version]
- Flack, K.A.; Schultz, M.P.; Barros, J.M. Skin friction measurements of systematically-varied roughness: Probing the role of roughness amplitude and skewness. Flow. Turbul. Combust. 2020, 104, 317–329. [Google Scholar] [CrossRef]
- Korzynski, M.; Dudek, K.; Palczak, A.; Kruczek, B.; Kocurek, P. Experimental models and correlations between surface parameters after slide diamond burnishing. Meas. Sci. Rev. 2018, 18, 123–129. [Google Scholar] [CrossRef] [Green Version]
- Deltombe, R.; Kubiak, K.J.; Bigerelle, M. How to select the most relevant 3D roughness parameters of a surface? Scanning 2014, 36, 150–160. [Google Scholar] [CrossRef] [PubMed] [Green Version]
- Szala, M.; Szafran, M.; Matijosius, J.; Drozd, K. Abrasive wear mechanisms of S235JR, S355J2, C45, AISI 304, and Hardox 500 steels tested using garnet, corundum and carborundum abrasives. Adv. Sci. Technol. Res. J. 2023, 17, 147–160. [Google Scholar] [CrossRef]
- Townsend, A.; Senin, N.; Blunt, L.; Leach, R.K.; Taylor, J.S. Surface texture metrology for metal additive manufacturing: A review. Precis. Eng. 2016, 46, 34–47. [Google Scholar] [CrossRef] [Green Version]
- Krolczyk, J.B.; Maruda, R.W.; Krolczyk, G.M.; Wojciechowski, S.; Gupta, M.K.; Korkmaz, M.E. Investigations on surface induced tribological characteristics in MQCL assisted machining of duplex stainless steel. J. Mater. Res. Technol. 2022, 18, 2754–2769. [Google Scholar] [CrossRef]
- Ghera, C.; Mitelea, I.; Bordeaşu, I.; Craciunescu, C.M. Effect of heat treatment on the surfaces topography tested at the cavitation erosion from steel 16MnCr5. Adv. Mat. Res. 2015, 1111, 85–90. [Google Scholar] [CrossRef]
- Bartels, D.; Klaffki, J.; Pitz, I.; Merklein, C.; Kostrewa, F.; Schmidt, M. Investigation on the case-hardening behavior of additively manufactured 16MnCr5. Metals 2020, 10, 536. [Google Scholar] [CrossRef]
- Saelzer, J.; Thimm, B.; Zabel, A. Systematic in-depth study on material constitutive parameter identification for numerical cutting simulation on 16MnCr5 comparing temperature-coupled and uncoupled Split Hopkinson pressure bars. J. Mater. Process. Technol. 2022, 302, 117478. [Google Scholar] [CrossRef]
- Dhar, N.R.; Hossain, M.; Kamruzzaman, M. MQL applications in grinding of 16MnCr5 steel: A comparison with wet and dry grinding. In Proceedings of the International Conference on Mechanical Engineering 2005, Dhaka, Bangladesh, 28–30 December 2005. [Google Scholar]
- Agarwal, S.; Suman, R.; Bahl, S.; Haleem, A.; Javaid, M.; Sharma, M.K.; Prakash, C.; Sehgal, S.; Singhal, P. Optimisation of cutting parameters during turning of 16MnCr5 steel using Taguchi technique. Int. J. Interact. Des. Manuf. 2022, 933. [Google Scholar] [CrossRef]
- Knyazeva, M.; Vasquez, J.R.; Gondecki, L.; Weibring, M.; Pöhl, F.; Kipp, M.; Tenberge, P.; Theisen, W.; Walther, F.; Biermann, D. Micro-magnetic and microstructural characterization of wear progress on case-hardened 16MnCr5 gear wheels. Materials 2018, 11, 2290. [Google Scholar] [CrossRef] [Green Version]
- da Silva Campos, P.H.; de Carvalho Paes, V.; de Carvalho Gonçalves, E.D.; Ferreira, J.R.; Balestrassi, P.P.; da Silva, J.P.D.T. Optimizing production in machining of hardened steels using response surface methodology. Acta Sci. Technol. 2019, 41, e38091. [Google Scholar] [CrossRef]
- Roy, R.; Ghosh, S.K.; Kaisar, T.I.; Ahmed, T.; Hossain, S.; Aslam, M.; Kaseem, M.; Rahman, M. Multi-response optimization of surface grinding process parameters of AISI 4140 alloy steel using response surface methodology and desirability function under dry and wet conditions. Coatings 2022, 12, 104. [Google Scholar] [CrossRef]
- Karthik, M.S.; Raju, V.R.; Reddy, K.N.; Balashanmugam, N.; Sankar, M.R. Cutting parameters optimization for surface roughness during dry hard turning of EN 31 bearing steel using CBN insert. Mater. Today Proc. 2020, 26, 1119–1125. [Google Scholar] [CrossRef]
- Neseli, S.; Asilturk, D.; Celik, L. Determining the optimum process parameter for grinding operations using robust process. J. Mech. Sci. Technol. 2012, 26, 3587–3595. [Google Scholar] [CrossRef]
Figure 1.
The process of the research.

Figure 2.
Microstructure of the (a) bulk material, (b) and the hardened layer.

Figure 3.
Explanation of the analyzed topography parameters: (a) Sp and Sv, (b) Sk parameter group, (c) volume parameter group, (d) Ssk and Sku.
Figure 3.
Explanation of the analyzed topography parameters: (a) Sp and Sv, (b) Sk parameter group, (c) volume parameter group, (d) Ssk and Sku.

Figure 4.
Means and value ranges of the parameters (a) Vmp, (b) Sp, and (c) Spk.

Figure 5.
Means and value ranges of the parameters (a) Vvv, (b) Sv, and (c) Svk.

Figure 6.
Means and value ranges of the parameters (a) Ssk and (b) Sku.

Figure 7.
Values of the (a) Spk and (b) Svk parameters of the hard-turned surfaces at different feed rates.
Figure 7.
Values of the (a) Spk and (b) Svk parameters of the hard-turned surfaces at different feed rates.

Figure 8.
Values of the (a) Vvv and (b) Sku parameters of the ground surfaces at different grinding wheel revolutions.
Figure 8.
Values of the (a) Vvv and (b) Sku parameters of the ground surfaces at different grinding wheel revolutions.

Figure 9.
Correlogram of the analyzed topography parameters of the hard-turned surfaces.

Figure 10.
Correlogram of the analyzed topography parameters of the ground surfaces.

Figure 11.
Relative deviations of the peak parameters of the hard-turned surfaces.

Figure 12.
Relative deviations of the valley parameters of the hard-turned surfaces.

Figure 13.
Relative deviations of the peak parameters of the ground surfaces.

Figure 14.
Relative deviations of the valley parameters of the ground surfaces.

Figure 15.
Topography map for the hard-turned surfaces at different depths of cuts.

Figure 16.
Topography map for the ground surfaces at different workpiece revolutions.

Table 1.
Process parameters of the experiment.
| Workpiece Clamping | Process Parameters |
|---|---|
 | Hard turning Machining center: EMAG VSC 400 DDS (EGAM Salach GmbH, Salach, Germany). Tool holder: PCLNR 2020-K12; CBN Insert: NP-CNGA 120408 TA4. Cutting parameters:
|
 | Grinding Machining center: EMAG VSC 400 DDS (EGAM Salach GmbH, Salach, Germany). Grinding wheel: Norton 3AS80J8VET; 01_180 × 12 × 50.8 (Abrasive: aluminum oxide, grit size: 80—fine; grade: medium; bond type: vitrified). Wheel diameter during the experiment: 120 mm. Cutting parameters:
|
 | Topography measurement Equipment: AltiSurf 520 (Altimet, Thonon-les-Bains, France). Sensor: confocal chromatic, type CL2. Resolution in z direction: 0.012 µm; resolution in x and y directions: 1 µm. Evaluated area: 2 × 2 mm. Cut-off lengths: 0.08; 0.25; 0.8 mm (according to ISO 25178). |
Table 2.
Design of experiment.
| Hard Turning | Grinding | ||||||||||
|---|---|---|---|---|---|---|---|---|---|---|---|
| 1 | ap1, vc1, f1 | 10 | ap2, vc1, f1 | 19 | ap3, vc1, f1 | 1 | nW1, nT1, f1 | 10 | nW2, nT1, f1 | 19 | nW3, nT1, f1 |
| 2 | ap1, vc1, f2 | 11 | ap2, vc1, f2 | 20 | ap3, vc1, f2 | 2 | nW1, nT1, f2 | 11 | nW2, nT1, f2 | 20 | nW3, nT1, f2 |
| 3 | ap1, vc1, f3 | 12 | ap2, vc1, f3 | 21 | ap3, vc1, f3 | 3 | nW1, nT1, f3 | 12 | nW2, nT1, f3 | 21 | nW3, nT1, f3 |
| 4 | ap1, vc2, f1 | 13 | ap2, vc2, f1 | 22 | ap3, vc2, f1 | 4 | nW1, nT2, f1 | 13 | nW2, nT2, f1 | 22 | nW3, nT2, f1 |
| 5 | ap1, vc2, f2 | 14 | ap2, vc2, f2 | 23 | ap3, vc2, f2 | 5 | nW1, nT2, f2 | 14 | nW2, nT2, f2 | 23 | nW3, nT2, f2 |
| 6 | ap1, vc2, f3 | 15 | ap2, vc2, f3 | 24 | ap3, vc2, f3 | 6 | nW1, nT2, f3 | 15 | nW2, nT2, f3 | 24 | nW3, nT2, f3 |
| 7 | ap1, vc3, f1 | 16 | ap2, vc3, f1 | 25 | ap3, vc3, f1 | 7 | nW1, nT3, f1 | 16 | nW2, nT3, f1 | 25 | nW3, nT3, f1 |
| 8 | ap1, vc3, f2 | 17 | ap2, vc3, f2 | 26 | ap3, vc3, f1 | 8 | nW1, nT3, f2 | 17 | nW2, nT3, f2 | 26 | nW3, nT3, f2 |
| 9 | ap1, vc3, f3 | 18 | ap2, vc3, f3 | 27 | ap3, vc3, f3 | 9 | nW1, nT3, f3 | 18 | nW2, nT3, f3 | 27 | nW3, nT3, f3 |
| ap1 = 0.05 mm, ap2 = 0.2 mm, ap3 = 0.35 mm vc1 = 120 m/min, vc2 = 180 m/min, vc3 = 240 m/min f1 = 0.04 mm/rev, f2 = 0.12 mm/rev, f3 = 0.2 mm/rev | nW1, = 100 rev/min, nW2, = 150 rev/min, nW3, = 200 rev/min nT1, = 3000 rev/min, nT2, = 4500 rev/min, nT3, = 6000 rev/min f1 =2 mm/min, f2 =5 mm/min, f3 =8 mm/min | ||||||||||
Table 3.
Coefficients of determination (r2) of the response surfaces.
| Vmp | Sp | Spk | Vvv | Sv | Svk | Ssk | Sku | |
|---|---|---|---|---|---|---|---|---|
| Hard-turned | 0.97 | 0.99 | 0.99 | 0.84 | 0.94 | 0.66 | 0.93 | 0.88 |
| Ground | 0.84 | 0.89 | 0.84 | 0.92 | 0.95 | 0.84 | 0.69 | 0.52 |
Table 4.
The most favorable topography parameter values and the connecting cutting parameter combinations.
Table 4.
The most favorable topography parameter values and the connecting cutting parameter combinations.
| Vmp | Sp | Spk | Vvv | Sv | Svk | Ssk | Sku | ||
|---|---|---|---|---|---|---|---|---|---|
| min | min | min | max | max | max | min | max | ||
| Hard-turned surface | 0.005 | 0.319 | 0.085 | 0.077 | 2.936 | 0.449 | −0.663 | 4.065 | |
| ap [mm] | 0.2 | 0.2 | 0.2 | 0.2 | 0.2 | 0.2 | 0.2 | 0.35 | |
| vc [m/min] | 120 | 120 | 120 | 240 | 240 | 240 | 180 | 180 | |
| f [mm/rev] | 0.04 | 0.04 | 0.04 | 0.2 | 0.2 | 0.2 | 0.04 | 0.04 | |
| Ground surface | 0.021 | 1.202 | 0.351 | 0.726 | 15.380 | 7.459 | −1.277 | 5.941 | |
| nT [rev/min] | 6000 | 6000 | 6000 | 3000 | 3000 | 3000 | 3000 | 3000 | |
| nW [rev/min] | 100 | 100 | 100 | 100 | 150 | 100 | 200 | 200 | |
| f [mm/min] | 2 | 2 | 2 | 8 | 8 | 8 | 8 | 8 |
Disclaimer/Publisher’s Note: The statements, opinions and data contained in all publications are solely those of the individual author(s) and contributor(s) and not of MDPI and/or the editor(s). MDPI and/or the editor(s) disclaim responsibility for any injury to people or property resulting from any ideas, methods, instructions or products referred to in the content. |
© 2023 by the author. Licensee MDPI, Basel, Switzerland. This article is an open access article distributed under the terms and conditions of the Creative Commons Attribution (CC BY) license (https://creativecommons.org/licenses/by/4.0/).
Share and Cite
MDPI and ACS Style
Molnar, V. Experimental Investigation of Tribology-Related Topography Parameters of Hard-Turned and Ground 16MnCr5 Surfaces. Lubricants 2023, 11, 263. https://doi.org/10.3390/lubricants11060263
AMA Style
Molnar V. Experimental Investigation of Tribology-Related Topography Parameters of Hard-Turned and Ground 16MnCr5 Surfaces. Lubricants. 2023; 11(6):263. https://doi.org/10.3390/lubricants11060263
Chicago/Turabian StyleMolnar, Viktor. 2023. "Experimental Investigation of Tribology-Related Topography Parameters of Hard-Turned and Ground 16MnCr5 Surfaces" Lubricants 11, no. 6: 263. https://doi.org/10.3390/lubricants11060263
Note that from the first issue of 2016, this journal uses article numbers instead of page numbers. See further details here.