Effect of Ceramic Particles on Ni-Based Alloy Coating Fabricated via Laser Technology

1
School of Sciences, Liaoning Petrochemical University, No. 1 Dandong Road, Fushun 113001, China
2
Faculty of Electrical and Control Engineering, Liaoning Technical University, Huludao 125105, China
*
Authors to whom correspondence should be addressed.
Lubricants 2023, 11(11), 483; https://doi.org/10.3390/lubricants11110483
Submission received: 8 October 2023
/
Revised: 20 October 2023
/
Accepted: 31 October 2023
/
Published: 9 November 2023
(This article belongs to the Special Issue Microstructure, Anti-wear Properties and Numerical Simulation of Lubricants, Volume II)
Abstract
:Laser cladding is a new technology for fabricating coatings with good properties, such as wear resistance, lubrication, and corrosion resistance. Usually, parts of 45 steel are used as a shaft under conditions of high-speed rotation or friction and wear, and they have a short service life and sometimes cause accidents. In order to avoid serious accidents, a cladding coating made from a Ni-based alloy with ceramic particles was fabricated via laser technology on a substrate of 45 steel in this research. The microstructure and properties were investigated via SEM, EDS, XRD, and a wear and friction tester. The results show that there was an obvious boundary between the cladding coating and the substrate. The main phases were γ(Fe, Ni), WC, TiC, Cr2Ti, and Cr23C6. In the middle of cladding coating, the microstructure was composed of dendrite and cellular crystals, while the microstructure was composed of equiaxial crystals in the bonding region. Inside the cellular crystal, the main phase was γ~(Fe, Ni), which occasionally also showed the appearance of some white particles inside the cellular crystal. Compared with the cellular crystal, the boundary had less of the Fe and Ni elements and more of the Cr and W elements. The amount of C element around the dendrite crystal was more than that around the boundary of cellular crystal due to the long formation time of dendrite. The white particles around the boundary were carbides, such as WC and Cr23C6 phases. Meanwhile, the segregation of the Si element also appeared around the boundaries of the crystal. The maximum microhardness was 772.4 HV0.5, which was about 3.9 times as much as the substrate’s microhardness. The friction coefficients of the 45 steel substrate and Ni-based alloy coating were usually around 0.3 and 0.1, respectively. The Ni-based coating had a smaller coefficient and more stable fluctuations. The wear volume of the cladding coating (0.16 mm3) was less than that of the substrate (1.1 mm3), which was about 14.5% of the wear volume of 45 steel substrate. The main reason was the existence of reinforced phases, such as γ~(Fe, Ni), Cr23C6, and Cr2Ti. The added small WC and TiC particles also enhanced the wear resistance further. The main wear mechanism of the cladding coating was changed to be adhesive wear due to the ceramic particles, which was helpful in improving the service life of 45 steel.
1. Introduction
Laser cladding is a surface modification technology with the advantages of causing no pollution, and comprising a short process and smart manufacturing, and it is widely used in the steel, automobile, and aeronautical and space fields [1,2,3]. Usually, 45 steel parts are used as the shaft under the condition of high-speed rotation or friction and wear [4,5,6,7]. In these harsh conditions, these parts usually have a short service life or cause accidents. In order to avoid serious accidents, some surface modification technologies are used to improve the properties of 45 steel parts. Of these, laser cladding is a new technology to enhance the service life of parts and equipment and is widely used in production [8,9,10,11,12].
Researchers have used lasers to fabricate coatings with different alloy powders, such as Ni-based, Co-based, and Fe-based alloy powders [13,14,15,16,17,18,19], of which the Ni-based alloy powder is widely used due to its advantages. Zhang et al. fabricated a Ni60 coating on a 45 steel substrate and investigated the friction and wear behavior of the cladding coating. The microhardness of the coating was about 2.6 times as much as that of the substrate. The wear rates of the coating were about 1/6.2 of that of the substrate under the higher load [20]. Zhu et al. used laser cladding technology to remanufacture the broken 45 steel part with H13 steel powder, which led to a higher hardness and better wear resistance [21]. Liu et al. prepared a Ni60-Cu composite coating, which was used to enhance wear resistance [22].
In order to enhance the properties of a Ni-based alloy coating, the benefits of the addition of some ceramic particles, such as WC and TiC, were investigated [23,24,25,26,27]. Liu et al. prepared four Ni-based alloy coatings with different amounts of WC-TiC ceramic particles in order to improve the wear resistance and service life of die steel. The result was that, when the mass fraction of WC particles was 30%, the coating had the minimum wear volume and demonstrated the best wear resistance [8]. Xiao et al. took WC as the reinforcing phase particles; the Fe-WC composite coatings with mass fractions 0~60 wt.% of WC were fabricated on a 15CrNiMo steel cone bit via laser cladding. The result was that the existing WC and W2C, as well as the presence of precipitated M23C6, M7C3, and η phases, were significant in the improvement of the wear resistance of WC-Fe composite coatings [28]. Chen et al. investigated the effect of WC particles on the corrosion properties of laser cladding composite coatings. The experimental results showed that better corrosion properties were obtained owing to the synergistic effect of the excellent performance and fine microstructures of the composite coatings with the ultrafine WC particles of a nano-size [29]. Although 45 steel parts have been improved using Ni-based alloy powder, the Ni-based alloy with ceramic particles WC and TiC has not been investigated on the substrate of 45 steel. The higher properties of 45 steel parts are also required due to the harsh operating conditions. The effect of different WC and TiC particles on a Ni-based alloy coating was not clear, which restricted the improvement in the wear and friction properties of the Ni-based alloy coating. Therefore, it is of great significance to fabricate a coating with ceramic particles on the substrate of 45 steel, which is helpful in obtaining good properties for, and improving the service life of, 45 steel parts.
In this paper, laser cladding technology was used to fabricate a coating. The Ni-based alloy powder was selected, and some ceramic particles of WC and TiC were added to this powder, which was used to fabricate a coating on the substrate of 45 steel. The microstructure and properties were investigated via SEM, XRD, a Vickers microhardness meter, and a wear and friction tester. The research focused on the effect of different WC and TiC particles on a Ni-based alloy coating.
2. Materials and Methods
2.1. Materials
A 45 steel plate was selected as the substrate (Dongzhuang Mould Co., Ltd., Shanghai, China). The length, width, and height were 80, 50, and 20 mm, respectively. The chemical composition is included in Table 1. The mass fraction of the C element was approximately 0.42–0.5%. The mass fraction of the Mn element was approximately 0.5–0.8%. The mass fraction of the Si element was approximately 0.17–0.37%. The mass fractions of the S and P elements were less than 0.035%. The remainder was represented by Fe.
The Ni-based alloy powder was selected as the cladding material (Zhuoyue Metal Products Co., Ltd., Shandong, China). In order to enhance the properties of the cladding coating, ceramic particles of WC and TiC were added. The chemical composition is included in Table 2. The mass fractions of the C, Si, B, and Fe elements were about 0.65, 4.2, 4.6, and 6.3%, respectively. The mass fractions of WC and TiC were 10 and 10%, respectively. The remainder was represented by the Ni element.
2.2. Experimental Methods
Laser cladding was a technology where the laser was used as the energy source. Before the beginning of the experiment, the cladding material would be put on the surface of a 45 steel substrate. The laser moved on this surface with the robotic arm or a mobile machine tool. Then, the cladding material melted with the energy of laser, and it became a molten pool. After a few seconds, the molten pool cooled and solidified, and it became a coating.
In this research, a CO2 laser was used to fabricate the coating (DL-HL-T2000). The wavelength was 10.6 μm. In order to obtain a good coating, the laser power was set as 1700 W, and the scanning speed was set as 100 mm/min during the process of laser cladding. The spot diameter was 2.1 mm. The laser cladding coating would be cut into three pieces, and they were investigated using instruments. The microstructures were observed via scanning election microscopy (SEM, FEI Quanta 200), and the element distribution was analyzed via energy dispersive spectrometer (EDS, 10 kV voltage). The phases were detected via X-ray diffraction (XRD, TD-3500). The microhardness was tested via a Vickers microhardness meter (HXD-1000TMC/LCD) with a load of 500 gf at 15 s. The first point was 0.1 mm away from the surface of the cladding layer. The distance of subsequent points was 0.1 mm. The points of three rows were measured on the surface of samples. Then, the average value was calculated and its standard error was also calculated. The friction and wear properties were tested via a reciprocating fatigue friction and wear tester (MGW-02). The GCr15 ball was used to connect the sample surface. The tip force and friction frequency were 10 N and 2 Hz, respectively. The scratch would appear on the surface of the cladding coating under the function of tip force and friction frequency.
3. Results and Discussion
3.1. Phases
Figure 1 shows the X-ray diffraction pattern of the Ni-based alloy cladding coating with WC and TiC ceramic particles. It can be seen that the main phases are γ~(Fe, Ni), WC, TiC, Cr2Ti, and Cr23C6. The Ni and Fe elements formed γ~(Fe, Ni) solid solution, and the Cr and C elements in the Ni-based alloy powder formed the Cr23C6 phase. The γ~(Fe, Ni) and Cr23C6 were the typical phases in the Ni-based alloy powder, and they formed the basic properties, such as microhardness, wear and corrosion resistance. Some added ceramic particles of WC and TiC existed in the coating as the original pattern. The others decomposed under the high laser energy. It also can be seen that there were some Cr2Ti formed in the coating.
3.2. Microstructure
Figure 2 shows the SEM images of the whole and bonding region of the laser cladding coating. In Figure 2a, the whole layer was smooth and had no crack, which had a good quality, however, it can also be seen that there were some holes. The bonding region between the cladding layer and substrate was obvious. In Figure 2b, it can be seen that the layer was connected with the substrate, which had a metallurgical bonding. The layer also had some smaller crystals than the bonding and substrate. Some dendrite crystals appeared at the bottom of layer as shown at the location of the arrows, because the cooling rate was smaller than that of the upper layer; therefore, the crystals had more time to grow.
Figure 3 shows the SEM images in the middle and bonding region of the laser cladding coating. In Figure 3a, it can be seen that there were many cellular crystals and a few dendrites. Because the overcooling degree and temperature gradient became smaller in the middle of laser cladding coating, the direction of crystal growth was not obvious. Meanwhile, the decomposed ceramic particles WC and TiC also needed some laser energy, which hindered the crystal growth and formed some small compounds. So there were more cellular crystals in the middle of the laser cladding coating. When the cooling rate was small, a few dendrites can also appear in the middle of the laser cladding coating. In Figure 3b, it can be seen that the crystals in the bonding region were bigger than those in the middle of the laser cladding coating. The reason was that the bonding region had a long time to be liquid, which offered the crystal enough time to grow. On the other hand, the molten pool in the bonding region included more of the Fe element, which formed more Fe and Ni solid solution. There were a few ceramic particles to form crystal nuclei in the bonding region. Therefore, a lot of big crystals appeared in the bonding region.
Figure 4 shows the SEM images and elemental distribution of W, Ti, C, Fe and Ni. In Figure 4a, it can be seen that there were some particles in the background. The size of the particles was in the range of 0.5 μm to 3 μm. In order to investigate these particles and background, an elemental distribution was obtained. In Figure 4b–d, the particles included more W, Ti, and C elements. It can be known that those were WC and TiC particles combined with analysis of the main phases. The WC and TiC ceramic particles appeared in the crystals and boundary. Some carbides were smaller than 1 μm, which had the function of fine grain strengthening. In Figure 4e,f, the background area had more Fe and Ni elements, and they formed the Fe and Ni solid solution. Therefore, the crystal took the Fe and Ni solid solution as the background, and the carbides were uniformly distributed in the interior and boundary of the crystal. The combination of those phases was helpful in improving the properties of laser cladding coating.
Figure 5 shows the SEM images and points 1 and 2 inside the cellular crystal. It can be seen that the crystals were basically cellular crystals. In order to investigate the elemental distribution inside the cellular crystals, points 1 and 2 were selected in Figure 5a,b. In Figure 5a, point 1 was in the cellular crystal, but point 2 was the white particle in the cellular crystal.
Table 3 includes the percentage of elemental distribution at point 1 and 2 inside the cellular crystal. Point 1 had the Fe element of 67.0 wt.% and the Ni element of 14.8 wt.%; meanwhile, there were some Cr, W, and Si elements. So, the main phase was γ~(Fe, Ni) in the cellular crystal. Some white particles appeared inside the cellular crystal as shown with point 2. From Table 3, it can be known that point 2 had the Fe element of 41.6wt.% and the Ni element of 5.2 wt.%, and there were less than those of point 1. The reason was that the Cr and C elements increased. Therefore, the white particle may be some carbide, such Cr23C6 and WC.
Figure 6 shows the SEM images and points 3 and 4 inside the cellular crystal. It can be seen that the crystals were cellular and dendrite crystals. In order to investigate the elemental distribution around the crystals, points 3 and 4 were selected in Figure 6a,b. In Figure 6a, point 3 was selected around the boundary of cellular crystal and point 4 was selected around the boundary of dendrite crystal.
Table 4 includes the percentage of elemental distribution at point 3 and 4 around the boundary of cellular and dendrite crystals. Point 3 had the Fe element of 50.2 wt.%, the Cr element of 29.0 wt.%, and the Ni element of 5.3 wt.%; meanwhile, there were some C, W, and Si elements. Compared with point 1, the boundary had less Fe and Ni elements and more Cr and W elements. It means that the carbides appeared more around the boundary. Point 4 had the Fe element of 46.7 wt.%, the Cr element of 21.5 wt.%, and the Ni element of 9.6 wt.%; meanwhile, there were some C, W, and Si elements. Compared with point 3, the amount of the C element was more than that of point 3. It demonstrates that there were more carbides formed during the formation of dendrite crystals. Because the process of the dendrite formation was a long time compared to cellular crystals, the carbides had more time to form.
Figure 7 shows the SEM images and points 5 and 6 of the white particles around the boundary. It can be seen that the white particles were usually around the boundary of crystals. There were also some white particles inside the crystals. Points 5 and 6 were selected from different positions around the boundary of crystals. In order to investigate the white particles, the element distribution was detected.
Table 5 includes the percentage of the elemental distribution at points 5 and 6 of white particles around the boundary. Point 5 had the Fe element of 27.3 wt.% and the Ni element of 4.6 wt.% Fe and the amounts of C, Si, Cr, and W elements were 11.9, 6.1, 9.6 and 40.5 wt.%, respectively. The W element had the maximum weight compared with the other elements. It means that the main carbides were WC phase. Point 6 had the Fe element of 29.6 wt.% and the Ni element of 4.8 wt.% and the amounts of C, Si, Cr and W elements were 25.5, 16.7, 18.4 and 5.0 wt.%, respectively. Compared with point 5, point 6 of the white particles around the boundary included more Si and C elements. On the one hand, the white particles were from some carbides, such as WC and Cr23C6 phases. On the other hand, the segregation of the Si element appeared around the boundary of crystal.
3.3. Microhardness
Figure 8 shows the microhardness of the laser cladding coating from the surface to the bottom. The maximum microhardness was 772.4 HV0.5, which appeared near the surface of the laser cladding coating. The microhardness of the 45 steel substrate was about 200 HV0.5. The maximum microhardness of the laser cladding coating was about 3.9 times higher than the substrate. In the middle of the layer, the error bars were larger than others. It means that the values of microhardness in the middle had large fluctuations due to the large amount of the reinforced particles. Along with the increase in the distance from the surface to the bottom, the microhardness decreased. The reason was that more and more substrate materials entered into the laser cladding coating, and they caused the decrease of coating’s microhardness. The microhardness near the bonding region was around 400 HV0.5, which was less than that of the layer and more than that of the 45 steel substrate. It can be seen that the phases γ~(Fe, Ni) and Cr23C6 could increase the microhardness of the cladding coating, and the added WC and TiC ceramic particles made this microhardness increase further, which formed a cladding coating with better properties.
3.4. Friction and Wear Resistance
The GCr15 ball was used for the friction and wear test. The ball radius was 6.5 mm. The length and width of the friction trace on the surface of the coating and substrate were measured and are included in Table 6. The length and width of the friction trace on the surface of substrate were 5.58 and 2.48 mm, respectively. The length and width of the friction trace on the surface of the Ni-based coating were 5.23 and 1.35 mm, which were less than those of substrate.
In order to investigate the wear and friction, the wear volume was also calculated [30]. Figure 9 shows the wear volume of the 45 steel substrate and Ni-based coating for 20 min. It can be seen that the wear volume of the Ni-based coating (0.16 mm3) was less than that of the 45 steel substrate (1.1 mm3). The wear volume of the Ni-based coating was only 14.5% of the substrate’s wear volume, which had a better wear resistance. The main reason was that the Ni-based alloy powder could form some reinforced phases, such as γ~(Fe, Ni) and Cr23C6, and the added WC and TiC ceramic particles formed some Cr2Ti phases. There were still some small WC and TiC particles in the crystals. These phases increased the wear resistance of the Ni-based coating.
Figure 10 shows the friction coefficient of the substrate and Ni-based coating for 20 min. The friction coefficient of the 45 steel substrate was in the range of 0.16–0.49, and it was usually around 0.3. This friction coefficient became stable after 30 s. The friction coefficient of the Ni-based alloy coating was in the range of 0.02–0.19, and it was usually around 0.1. After 10 s, the friction coefficient became stable. It can be seen that the Ni-based coating had a smaller coefficient and more stable fluctuations. The reinforced phases and small crystals made the friction and coefficient between GCr15 ball and Ni-based alloy coating smaller.
Figure 11 shows the microscopic morphology on the sliding surface of the substrate and Ni-based coating. In Figure 11a, it can be seen that there were some spalling zones with the large area and deep furrows on the sliding surface of the substrate. The main wear mechanism of the substrate was abrasive and adhesive wear. In Figure 11b, there were some spalling zones with the small area and shallow furrows on the sliding surface of the cladding coating. The main wear mechanism of the cladding coating was adhesive wear. The added WC and TiC ceramic particles provided more hard particles and changed the wear mechanism. Therefore, the ceramic particles not only increase the microhardness of the cladding coating, but also offer a good wear resistance.
4. Conclusions
(1) A Ni-based cladding coating with the WC and TiC ceramic particles was fabricated on the surface of a 45 steel substrate. In this coating, some phases were found, such as γ~(Fe, Ni), WC, TiC, Cr2Ti, and Cr23C6. The added ceramic particles of WC and TiC existed in the coating as the original pattern. The others decomposed under the high laser energy. In the middle of the cladding coating, there were many cellular crystals and a few dendrites. In addition, there were some dendrite crystals that appeared at the bottom of the cladding layer due to the smaller cooling rate. The bonding region between the layer and substrate was obvious and had a metallurgical bonding.
(2) Inside the cellular crystal, the main phase was γ~(Fe, Ni), which also had some white particles appear occasionally. Compared with the cellular crystal, the boundary had less Fe and Ni elements and more Cr and W elements. The dendrite crystal had a greater amount of the C element than the cellular crystal. The white particles around the boundary were carbides, such as WC and Cr23C6 phases. Meanwhile, the segregation of the Si element also appeared around the boundary of crystal.
(3) The maximum microhardness was 772.4 HV0.5, which was about 3.9 times higher than the substrate. Along with the increase of the distance from the coating’s surface to the bottom, the microhardness decreased gradually. The reason was that the proportion of substrate materials increased gradually along with this distance, and it caused the decrease of this coating’s microhardness. The phases γ~(Fe, Ni) and Cr23C6 could increase the microhardness of the cladding coating, and the added WC and TiC ceramic particles enhanced this microhardness further.
(4) The friction coefficients of the 45 steel substrate and Ni-based alloy coating were around 0.3 and 0.1, respectively. The Ni-based coating had a smaller coefficient and more stable fluctuations. The length and width of the friction trace on the surface of the Ni-based coating were less than the substrate. The wear volume of the cladding coating (0.16 mm3) was less than the substrate (1.1 mm3), which was about 14.5% wear volume of substrate. The main reason was the existence of reinforced phases, such as γ~(Fe, Ni), Cr23C6, and Cr2Ti, which offered a basic wear resistance. The added small WC and TiC particles also enhanced this wear resistance further.
Author Contributions
Conceptualization, Y.Z.; methodology, Y.W. and L.W.; software, Y.W.; data curation, Y.Z.; writing—original draft, Y.Z.; writing—review and editing, Y.J., Z.W. and X.S.; supervision, Y.Z. and Z.W.; project administration, Y.Z.; funding acquisition, Y.Z. and Z.W. All authors have read and agreed to the published version of the manuscript.
Funding
This research was funded by the Scientific Research Funds Project of Liaoning Education Department of China (No. L2019049).
Data Availability Statement
Not applicable.
Conflicts of Interest
The authors declare no conflict of interest.
References
- Siddiqui, A.A.; Dubey, A.K. Recent trends in laser cladding and surface alloying. Opt. Laser Technol. 2021, 134, 106619. [Google Scholar] [CrossRef]
- Yuan, W.; Li, R.; Chen, Z. A comparative study on microstructure and properties of traditional laser cladding and high-speed laser cladding of Ni45 alloy coatings. Surf. Coat. Technol. 2021, 405, 126582. [Google Scholar] [CrossRef]
- Gao, Y.L.; Lu, P.Y.; Bai, S.C.; Qin, B.L.; Zhang, D.D. Influence of laser power on microstructure and properties of Al-Si+Y2O3 coating. Coatings 2023, 13, 1289. [Google Scholar] [CrossRef]
- Rukanskis, M.; Padgurskas, J.; Sabalius, A. Friction and wear of electrospark coatings made of molybdenum, bronze, and combined (Ti+Al+C) composition on steel 45 in a lubricant medium. J. Frict. Wear 2021, 42, 56–62. [Google Scholar] [CrossRef]
- Li, J.; Cao, Z.; Liu, L. Effect of microstructure on hardness and wear properties of 45 steel after induction hardening. Steel Res. Int. 2021, 92, 2000540. [Google Scholar] [CrossRef]
- Ma, W.L.; Zhao, J.; Wang, F.B. Effect of textured surface on friction and wear properties of 45 steel. Tribology 2022, 43, 314–324. [Google Scholar] [CrossRef]
- Li, W.Y.; Ma, T.J.; Yang, S.Q. Effect of friction time on flash shape and axial shortening of linear friction welded 45 steel. Mater. Lett. 2008, 62, 293–296. [Google Scholar] [CrossRef]
- Liu, Y.; Li, Z.Y.; Li, G.H.; Tang, L. Friction and wear behavior of Ni-based alloy coatings with different amount of WC-TiC ceramic particles. J. Mater. Sci. 2023, 58, 1116–1126. [Google Scholar] [CrossRef]
- Thawari, N.; Gullipalli, C.; Katiyar, J.K. Effect of multi-layer laser cladding of Stellite 6 and Inconel 718 materials on clad geometry, microstructure evolution and mechanical properties. Mater. Today Commun. 2021, 28, 102604. [Google Scholar] [CrossRef]
- Lu, K.; Zhu, J.; Guo, D.; Yang, M.; Sun, H.; Wang, Z.; Hui, X.; Wu, Y. Microstructures, corrosion resistance and wear resistance of high-entropy alloys coatings with various compositions prepared by laser cladding: A review. Coatings 2022, 12, 1023. [Google Scholar] [CrossRef]
- Kim, R.E.; Kim, E.S.; Karthik, G.M.; Gu, G.H.; Ahn, S.Y.; Park, H.; Moon, J.; Kim, H.S. Heterostructured alloys with enhanced strength-ductility synergy through laser-cladding. Scr. Mater. 2022, 215, 114732. [Google Scholar] [CrossRef]
- Ouyang, W.; Xu, Z.; Chao, Y.; Liu, Y.; Luo, W.; Jiao, J.; Sheng, L.; Zhang, W. Effect of electrostatic field on microstructure and mechanical properties of the 316L stainless steel modified layer fabricated by laser cladding. Mater. Charact. 2022, 191, 112123. [Google Scholar] [CrossRef]
- Hu, Y.; Wang, Z.; Pang, M. Effect of WC content on laser cladding Ni-based coating on the surface of stainless steel. Mater. Today Commun. 2022, 31, 103357. [Google Scholar] [CrossRef]
- Ocelík, V.; Oliveira, U.; Boer, M. Thick Co-based coating on cast iron by side laser cladding: Analysis of processing conditions and coating properties. Surf. Coat. Technol. 2007, 201, 5875–5883. [Google Scholar] [CrossRef]
- Fu, Z.K.; Ding, H.H.; Wang, W.J. Investigation on microstructure and wear characteristic of laser cladding Fe-based alloy on wheel/rail materials. Wear 2015, 330, 592–599. [Google Scholar] [CrossRef]
- Shan, B.; Chen, J.; Chen, S.; Ma, M.; Ni, L.; Shang, F.; Zhou, L. Laser cladding of Fe-based corrosion and wear-resistant alloy: Genetic design, microstructure, and properties. Surf. Coat. Technol. 2022, 433, 128117. [Google Scholar] [CrossRef]
- Gao, Z.; Geng, H.; Qiao, Z.; Sun, B.; Gao, Z.; Zhang, C. In situ TiBX/TiXNiY/TiC reinforced Ni60 composites by laser cladding and its effect on the tribological properties. Ceram. Int. 2023, 49, 6409–6418. [Google Scholar] [CrossRef]
- Qi, K.; Yang, Y. Microstructure, wear, and corrosion resistance of Nb-modified magnetic field-assisted Co-based laser cladding layers. Surf. Coat. Technol. 2022, 434, 128195. [Google Scholar] [CrossRef]
- Ouyang, C.; Wang, R.; Bai, Q.; Chen, Z.; Yan, X. Aging strengthening treatment of laser cladding Co-based alloy coating. Mater. Lett. 2022, 313, 131746. [Google Scholar] [CrossRef]
- Zhang, J.; Hu, Y.; Tan, X.J.; Liang, G.; Zhang, Q.M. Microstructure and high temperature tribological behavior of laser cladding Ni60A alloys coatings on 45 steel substrate. Trans. Nonferrous Met. Soc. China 2015, 25, 1525–1532. [Google Scholar] [CrossRef]
- Zhu, L.D.; Wang, S.H.; Pan, H.C.; Yuan, C.T.; Chen, X.S. Research on remanufacturing strategy for 45 steel gear using H13 steel powder based on laser cladding technology. J. Manuf. Process. 2020, 49, 344–354. [Google Scholar] [CrossRef]
- Liu, Q.S.; Liu, X.B.; Wang, G.; Liu, Y.F.; Meng, Y.; Zhang, S.H. Effect of Cu content on microstructure evolution and tribological behaviors of Ni60 composite coatings on 45# steel by laser cladding. Opt. Laser Technol. 2022, 156, 108549. [Google Scholar] [CrossRef]
- Sun, S.Y.; Wang, J.L.; Xu, J.H.; Cheng, X.Y.; Jing, C.H.; Chen, Z.D.; Ru, H.L.; Liu, Y.Y.; Jiao, J.K. Preparing WC-Ni coatings with laser cladding technology: A review. Mater. Today Commun. 2023, 37, 106939. [Google Scholar] [CrossRef]
- Zhang, Z.; Yang, Q.; Yu, Z.; Wang, H.; Zhang, T. Influence of Y2O3 addition on the microstructure of TiC reinforced Ti-based composite coating prepared by laser cladding. Mater. Charact. 2022, 189, 111962. [Google Scholar] [CrossRef]
- Li, Y.; Wang, K.; Fu, H.; Guo, X.; Lin, J. Microstructure and wear resistance of in-situ TiC reinforced AlCoCrFeNi-based coatings by laser cladding. Appl. Surf. Sci. 2022, 585, 152703. [Google Scholar] [CrossRef]
- Hu, Z.; Li, Y.; Lu, B.; Tan, N.; Cai, L.; Yong, Q. Effect of WC content on microstructure and properties of high-speed laser cladding Ni-based coating. Opt. Laser Technol. 2022, 155, 108449. [Google Scholar] [CrossRef]
- Li, Y.T.; Fu, H.G.; Ma, T.J.; Wang, K.M.; Yang, X.J.; Lin, J. Microstructure and wear resistance of AlCoCrFeNi-WC/TiC composite coating by laser cladding. Mater. Charact. 2022, 194, 112479. [Google Scholar] [CrossRef]
- Xiao, Q.; Sun, W.L.; Yang, K.X.; Xing, X.F.; Chen, Z.H.; Zhou, H.N.; Lu, J. Wear mechanisms and micro-evaluation on WC particles investigation of WC-Fe composite coatings fabricated by laser cladding. Surf. Coat. Technol. 2021, 420, 127341. [Google Scholar] [CrossRef]
- Chen, C.L.; Feng, A.X.; Wei, Y.C.; Wang, Y.; Pan, X.M.; Song, X.Y. Role of nano WC particles addition on the corrosion behavior of laser cladding WC/Ni coatings. Mater. Lett. 2023, 337, 133939. [Google Scholar] [CrossRef]
- Jie, M.; Gao, Y.L. Study on hardness and wear resistance of laser cladding Al-Si coating. Appl. Laser. 2015, 35, 629–633. [Google Scholar] [CrossRef]
Figure 1.
X-ray diffraction pattern of Ni-based alloy cladding coating with WC and TiC ceramic particle.
Figure 1.
X-ray diffraction pattern of Ni-based alloy cladding coating with WC and TiC ceramic particle.

Figure 2.
SEM images of the whole (a) and bonding region (b) of laser cladding coating.
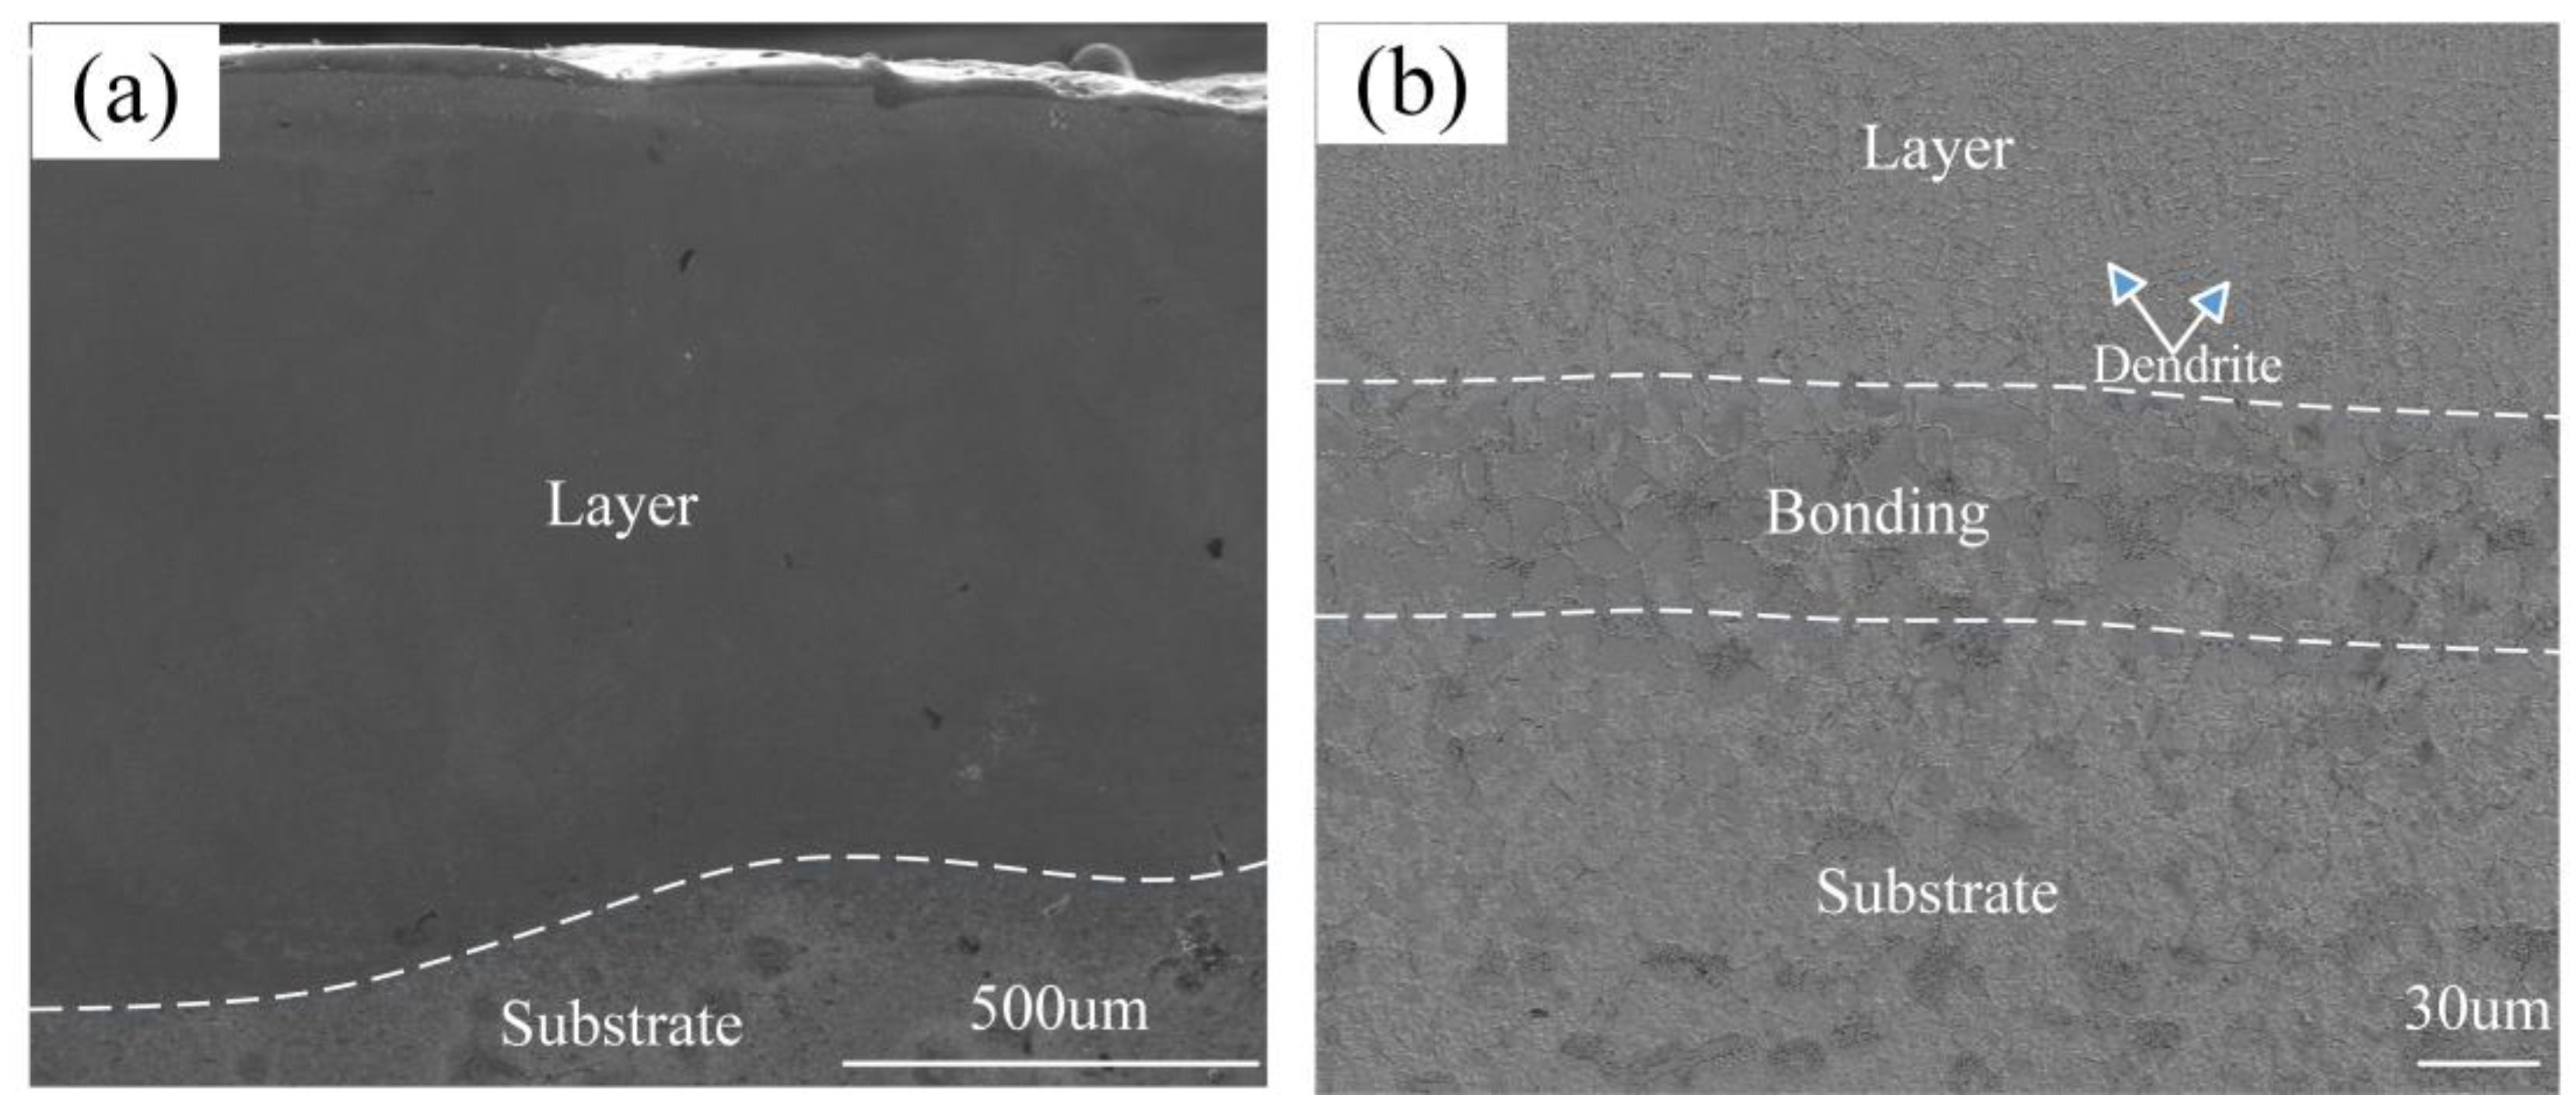
Figure 3.
SEM images in the middle (a) and bonding region (b) of the laser cladding coating.

Figure 4.
SEM image (a) and elemental distribution of W (b), Ti (c), C (d), Fe (e) and Ni (f).

Figure 5.
SEM images and point 1 (a) and 2 (b) inside the cellular crystal.
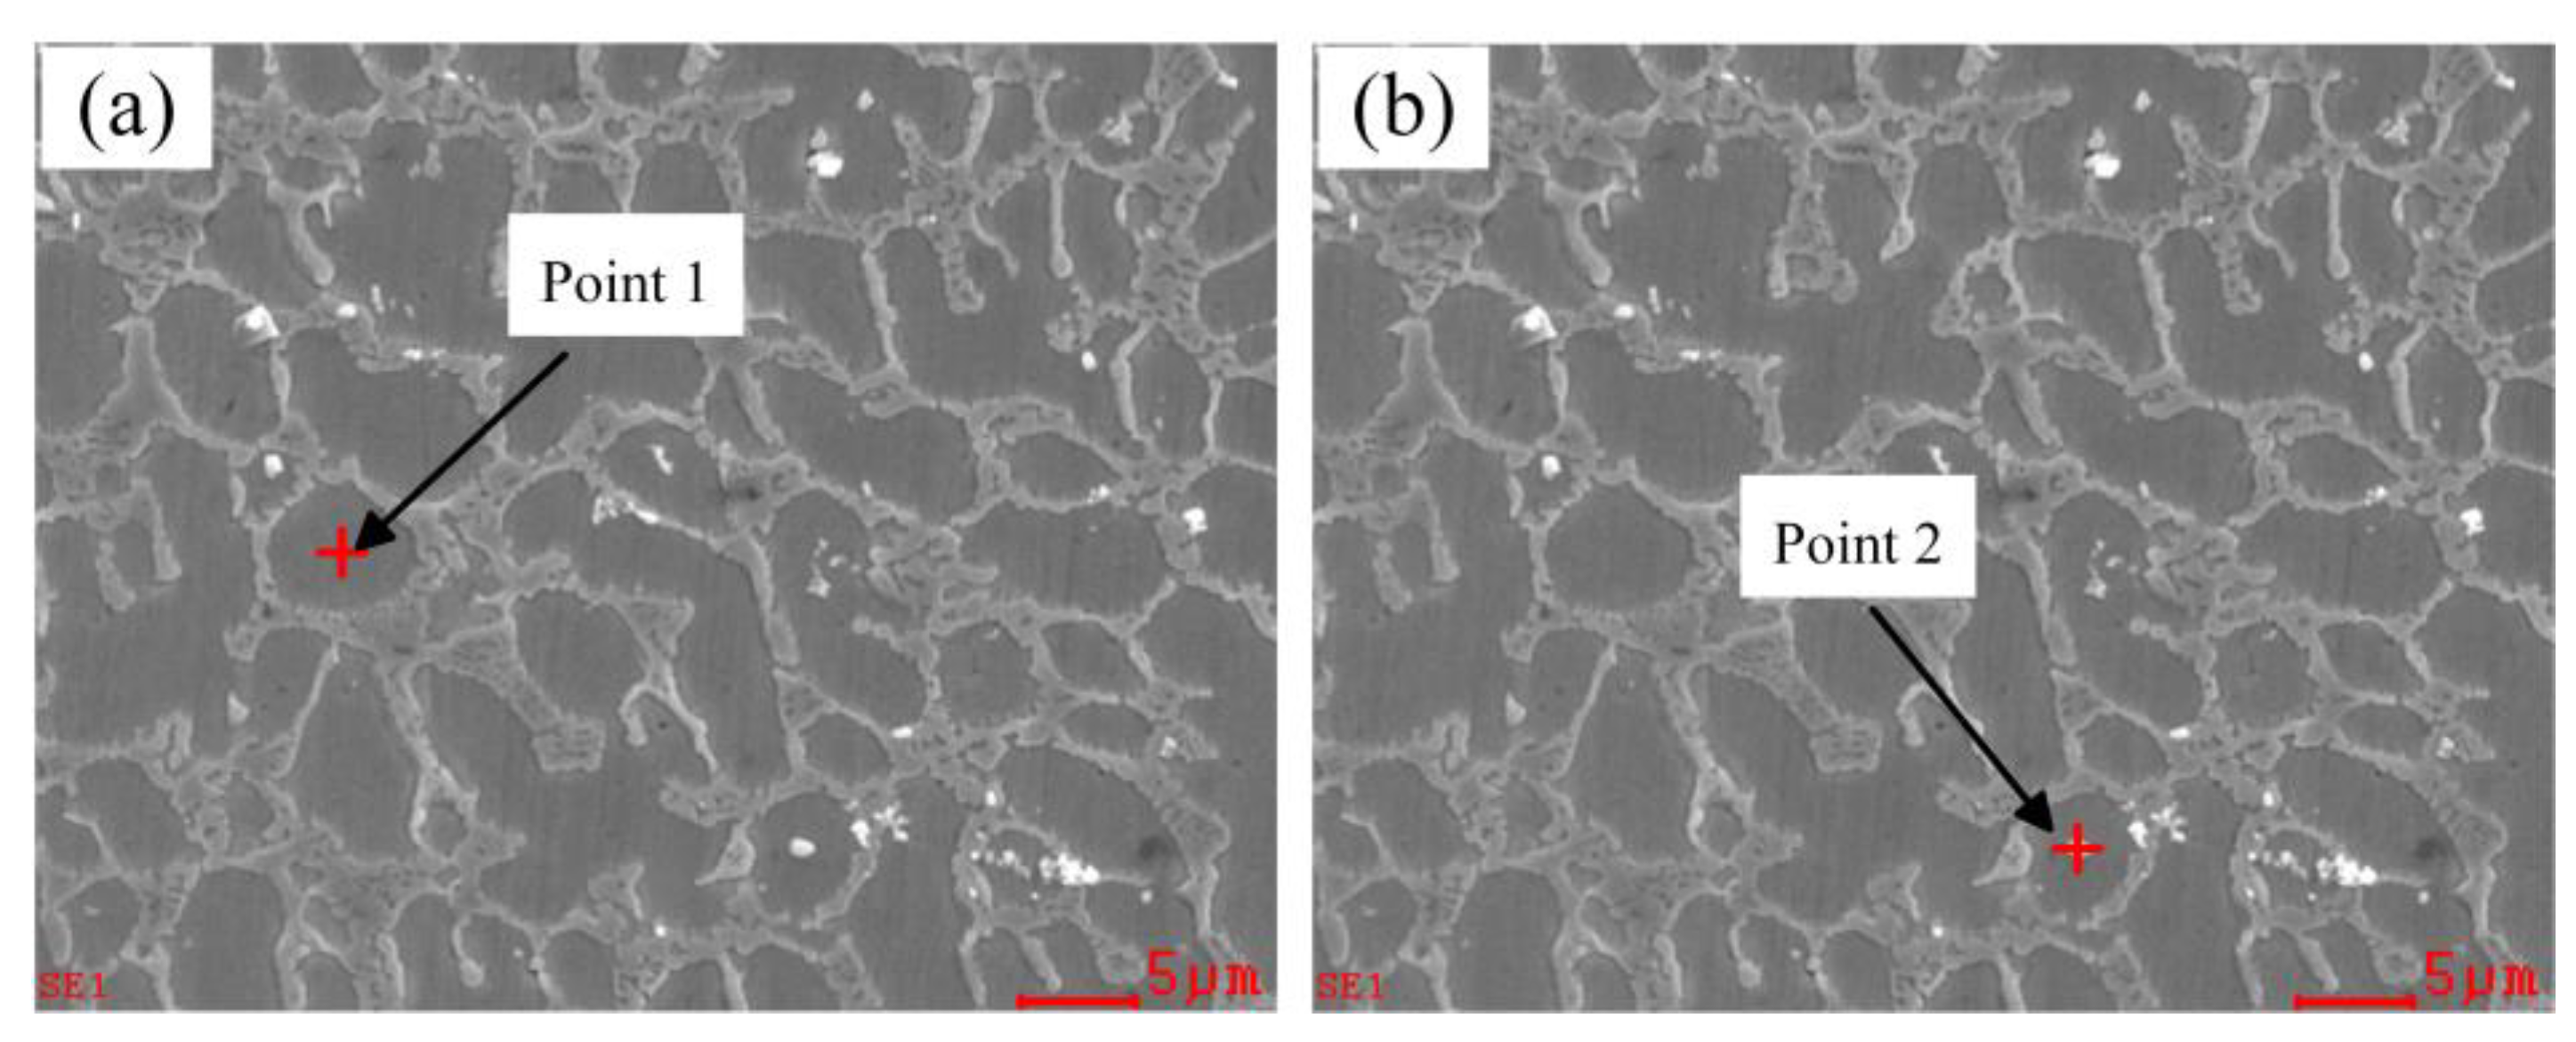
Figure 6.
SEM images and point 3 (a) and 4 (b) inside the cellular crystal.

Figure 7.
SEM images and points 5 (a) and 6 (b) of white particles around the boundary.

Figure 8.
Microhardness and error bars of the laser cladding coating.

Figure 9.
The wear volume and error bars of the substrate and Ni-based coating for 20 min.

Figure 10.
Friction coefficient of the substrate and Ni-based coating for 20 min.

Figure 11.
Microscopic morphology on the sliding surface of substrate (a) and Ni-based coating (b).


Table 1.
The chemical composition (wt.%) of 45 steel.
| Element | C | Mn | Si | S | P | Fe |
|---|---|---|---|---|---|---|
| Mass fraction (%) | 0.42–0.5 | 0.5–0.8 | 0.17–0.37 | ≤0.035 | ≤0.035 | Bal. |
Table 2.
The chemical composition (wt.%) of Ni-based alloy powder.
| Element | C | Si | B | Fe | Cr | WC | TiC | Ni |
|---|---|---|---|---|---|---|---|---|
| Mass fraction (%) | 0.65 | 4.2 | 4.6 | 6.3 | 17.5 | 10 | 10 | Bal. |
Table 3.
Percentage of elemental distribution at point 1 and 2 inside the cellular crystal (wt.%).
| Element | Fe | Ni | C | Si | Cr | W |
|---|---|---|---|---|---|---|
| Point 1 | 67.0 | 14.8 | 1.7 | 1.3 | 9.7 | 5.5 |
| Point 2 | 41.6 | 5.2 | 19.3 | 0.5 | 28.5 | 4.9 |
Table 4.
Percentage of elemental distribution at points 3 and 4 around the boundary of cellular and dendrite crystals (wt.%).
Table 4.
Percentage of elemental distribution at points 3 and 4 around the boundary of cellular and dendrite crystals (wt.%).
| Element | Fe | Ni | C | Si | Cr | W |
|---|---|---|---|---|---|---|
| Point 3 | 50.2 | 5.3 | 2.7 | 0.3 | 29.0 | 12.5 |
| Point 4 | 46.7 | 9.6 | 12.2 | 0.3 | 21.5 | 9.7 |
Table 5.
Percentage of the elemental distribution at points 5 and 6 of white particles around the boundary (wt.%).
Table 5.
Percentage of the elemental distribution at points 5 and 6 of white particles around the boundary (wt.%).
| Element | Fe | Ni | C | Si | Cr | W |
|---|---|---|---|---|---|---|
| Point 5 | 27.3 | 4.6 | 11.9 | 6.1 | 9.6 | 40.5 |
| Point 6 | 29.6 | 4.8 | 25.5 | 16.7 | 18.4 | 5.0 |
Table 6.
The length and width of the friction trace on the surface of coating and substrate.
| Item | Ball Radius (mm) | Length (mm) | Width (mm) |
|---|---|---|---|
| Ni-based coating | 6.5 | 5.23 | 1.35 |
| Substrate | 6.5 | 5.58 | 2.48 |
Disclaimer/Publisher’s Note: The statements, opinions and data contained in all publications are solely those of the individual author(s) and contributor(s) and not of MDPI and/or the editor(s). MDPI and/or the editor(s) disclaim responsibility for any injury to people or property resulting from any ideas, methods, instructions or products referred to in the content. |
© 2023 by the authors. Licensee MDPI, Basel, Switzerland. This article is an open access article distributed under the terms and conditions of the Creative Commons Attribution (CC BY) license (https://creativecommons.org/licenses/by/4.0/).
Share and Cite
MDPI and ACS Style
Zhang, Y.; Wang, Y.; Wang, L.; Jin, Y.; Wang, Z.; Shi, X. Effect of Ceramic Particles on Ni-Based Alloy Coating Fabricated via Laser Technology. Lubricants 2023, 11, 483. https://doi.org/10.3390/lubricants11110483
AMA Style
Zhang Y, Wang Y, Wang L, Jin Y, Wang Z, Shi X. Effect of Ceramic Particles on Ni-Based Alloy Coating Fabricated via Laser Technology. Lubricants. 2023; 11(11):483. https://doi.org/10.3390/lubricants11110483
Chicago/Turabian StyleZhang, Yanhua, Yinan Wang, Li Wang, Ying Jin, Zhaofeng Wang, and Xiaoling Shi. 2023. "Effect of Ceramic Particles on Ni-Based Alloy Coating Fabricated via Laser Technology" Lubricants 11, no. 11: 483. https://doi.org/10.3390/lubricants11110483
Note that from the first issue of 2016, this journal uses article numbers instead of page numbers. See further details here.