Simulation Study on the Influence of a Laser Power Change on the Residual Stress of a Laser-Melting RuT300 Valve Seat

1
College of Foreign Languages, Civil Aviation University of China, Tianjin 300300, China
2
College of Aeronautical Engineering, Civil Aviation University of China, Tianjin 300300, China
*
Author to whom correspondence should be addressed.
Lubricants 2023, 11(10), 435; https://doi.org/10.3390/lubricants11100435
Submission received: 25 August 2023
/
Revised: 2 October 2023
/
Accepted: 7 October 2023
/
Published: 9 October 2023
(This article belongs to the Special Issue Recent Advances in High Temperature Tribology)
Abstract
:In order to effectively suppress the cracking induced by the excessive residual stress of a laser-melting RuT300 valve seat, the influence of a laser power change on the residual stress was studied by constructing a finite element simulation model of a new power valve seat. The absorption rate of the laser energy on the surface of the material and the change in thermophysical parameters with temperature were taken into account in the model. The results show that the melting and phase-change-hardening areas can be obtained by the laser-melting process. With the increase in laser power, the peak temperature of the molten pool increased almost linearly. The melting zone area and the phase-change-hardening zone depth increased. When the laser power was increased from 2000 to 2600 W, the peak temperature of the laser-melting RuT300 valve seat increased from 2005.09 to 2641.93 °C, the maximum depth of the melting area increased from 0.55 to 0.86 mm, the maximum width of the melting area increased from 3.42 to 4.21 mm, and the maximum depth of the phase-change-hardening area increased from 0.55 to 0.64 mm. The circumferential residual tensile stress in the melting area was much higher than in the radial and axial directions. Along the laser scanning direction, the residual stress in the melting area increased as a whole, and the residual stress in the laser-scanning finishing area greatly increased. With the increase in laser power, the circumferential residual stress at the previous scanning moment decreased, and at the closing moment of the scan, the circumferential residual stress increased with the increase in laser power.
1. Introduction
In order to improve the compactness of the structure, a new high-strength power was integrally molded with a valve seat and cylinder head, and the material used was RuT300 vermicular graphite cast iron. This material has excellent mechanical, thermal conductivity, shock-absorption, thermal fatigue-resistance, and castability properties. It is an ideal material for casting cylinder heads [1,2,3,4,5,6]. However, it cannot meet the wear-resistance needs of the valve seat bore; therefore, the valve seat bore area needs to be surface modified to improve its wear resistance [7,8,9]. The existing methods used to increase the surface hardness of valve seat bores are high-frequency induction or laser phase-change hardening [10]. The use of the phase-change-hardening method can improve the hardness of the material to a certain extent and increase the anti-wear performance of the material surface. This method uses a heat source to rapidly heat the surface temperature of the material above the phase transition temperature and below the melting point, and improves the hardness by forming martensite through the rapid phase change of the material [11,12]. However, the phase-change-hardening depth of this method is relatively shallow, and the processing allowance reserved for the project is small. In order to improve the depth of the modified area, some scholars use the high energy density of the laser to achieve the rapid heating and solidification of the local area, so as to realize the fine crystallization of the molten area and increase the surface hardness and wear resistance [13,14,15,16,17]. This method can greatly improve the modification depth.
The laser melting of valve seat inserts involves many process parameters. The experimental method has a long cycle to optimize the process parameters. A simulation is an effective way to shorten processes. At present, the simulation research on laser-melting or phase-change-hardening techniques is conducted at home and abroad. An et al. [18] used the in situ laser-remelting process to improve an extremely high-speed laser cladding copper–nickel alloy coating. A one-pass finite element model of the remelting process was established, and the influence of the remelting speed on the solidification of the molten pool was analyzed. The copper–nickel coating performed best at a remelting speed of 5 m/min. Temmler et al. [19] studied the mechanism of surface microstructure formation during laser remelting on hot work steel H11. The newly developed finite element model showed that the change in the molten pool caused the deformation of the molten pool surface, which led to the formation of the surface structure. The Marangoni convection had little effect on the formation of surface structures during laser remelting. Xing Chen et al. [20] conducted a numerical simulation analysis of the thermal effect of a laser rapid-melting Zr65Al7.5Ni10Cu17.5 amorphous alloy, and found that the thermal change in the laser single-point melting met the growth conditions of the amorphous alloy. During the laser single-pass melting process, relaxation accumulation occurred in the heat-affected zone, which might have caused a certain degree of crystallization. The simulation and experimental results of Ali et al. [21] showed that the laser-remelting process could effectively reduce the residual stress of SLM forming Ti6Al4V. Rescanning at a 150% energy density reduced the residual stress by 33.6%; however, the effect on the mechanical properties was detrimental and the sample failed prematurely. Chunyan Zhang et al. [22] simulated the temperature field of laser-melting rare-earth magnesium alloy and found that the temperature field showed the characteristics of sudden heating, rapid cooling, and dynamic change. The temperature gradient of the surface was the largest, and the temperature gradient decreased sequentially from the surface to the inside. Bonek et al. [23] used ANSYS to simulate the laser-melting PMHSS6-5-3 high-speed steel process. Laser remelting created fused, heat-affected, and interface zones to form on the surface of the material. The depth of the molten layer increased with the increase in the laser power. Numerical simulations guided the selection of the optimal process parameters. Vastola et al. [24] discovered through modeling that there was an optimal beam shape for laser remelting when the cross-section of the laser beam was fixed. When the input laser heat was the same, the scanning speed could affect the maximum remelting quantity and the optimal beam size for remelting. The finite element simulation model proposed by Schüßler et al. [25] aimed to improve the hardness and residual stress prediction of the simulation by considering the tempering effect that occurred during the laser surface hardening of AISI 4140. The model was used to analyze the parametric studies of the effects of different initial tempering states and other post-process tempering methods. Due to the self-tempering effect, the hardness of the hardened zone (HZ) was reduced by 30 HV0.1, and the hardness levels of the transition zone (TZ) and heat-affected zone (HAZ) were significantly reduced, resulting in local hardness that might be lower than the substrate hardness. Chen et al. [26] adopted a laser-hardening process to improve the hardness and wear resistance of a QT700-2 ductile cast iron crankshaft. Through a finite element temperature field simulation, the appropriate parameter range was preliminarily estimated, and then the effect of individual laser parameters was verified by single-factor experiments. The optimal laser-processing parameters for the QT700-2 ductile cast iron were a laser power range of 1000–1100 W, a scanning speed of 10–12 mm/s, and a defocusing distance of 40–45 mm. By optimizing the laser parameter set, the hardening layer hardness increased from 250 to more than 800 HV, the corresponding wear depth reduced from 17.57 to 11.45 μm, and the coefficient of friction reduced from 0.8 to 0.6. Evdokimov et al. [27] developed a heat source model. The model calculated the intensity distribution of the workpiece surface as a function of beam parameters (beam waistline and divergence half-angle) and process parameters (laser power, angle of incidence, and focal plane distance). The applicability of the heat source model was proved by simulating four different laser-hardening mechanisms. Han et al. [28] established a thermomechanical coupling model for a laser-quenching SUS301L-HT stainless-steel process considering grain heterogeneity. The thermal stress field and temperature field distribution of the single laser surface hardening under different process parameters were obtained. Laser power and laser scanning speed were the main factors affecting the average residual stress of the grain, and the influence of the two was opposite. The influence of laser scanning speed on the residual stress of the substrate was greater than that of laser power. Xiaogang Xu [29] established a numerical simulation model for the laser phase-change-hardening of Cr12MoV materials. Using the transient thermal analysis module from ANSYS, the temperature field of the laser phase-change-hardening process was simulated. With the help of the simulation results, the depth and width of the hardened layer were predicted, and the suitable process parameters were obtained. Liverani et al. [30] proposed a numerical model to evaluate the residual stress after the laser surface treatment of mechanical components of arbitrary geometry. Heat treatment experiments were performed on AISI 9810 steel cams using lasers. The model accuracy was verified by comparing the stresses calculated by the model with the measured values. Higher laser fluxes, or increased exposure speeds at a constant flux, led to an increase in the hardening depth and a decrease in the compression residual stress. Fortunato et al. [31] proposed a regression model for a reflectance coefficient evaluation in the laser surface hardening of cylindrical AISI 420B steel. A sensitivity analysis was performed by changing the input data and calculating the output temperature change, and different reflectivities were evaluated by comparing the predicted and measured hardness values. This reflectivity could be well approximated for simulating laser-hardening treatments of many carbon steels. Tobar et al. [32] proposed a three-dimensional numerical model of laser phase-change hardening of hot work tool steel AISI H13. The model coupled the solution of the transient heat transfer equation with a metallurgical phase-change model based on the Johnson–Mayer–Aframi and Coistinen–Malberg equations. A hardened surface layer with a depth of about 0.3 mm and a hardness of 5 GPa was obtained.
At present, laser modification simulation studies are mainly used for steel materials, magnesium alloys, titanium alloys, copper alloys, etc. There is no simulation of the residual stress in a laser-melting valve seat. In engineering, the main bottleneck of a laser-melting valve seat is cracking induced by excessive residual stress. By constructing a simulation model of a laser-melting RuT300 valve seat, this paper analyzes the influence of laser parameters on residual stress. The research results provide support for the optimization of engineering parameters.
2. Finite Element Simulation Model
2.1. Mesh Model
Based on the real shape and size of a new dynamic vermicular cast iron valve seat, a geometric model for a laser-melting finite element simulation was constructed in ANSYS, as shown in Figure 1. The inner and outer diameters of the valve seats were 32 and 48 mm, respectively. The z-height was 6 mm. The outer diameter of the cone was 40 mm and the busbar length was 5.66 mm. In order to harden and strengthen the valve seat cone, the laser heat source scanned in a circular direction along the valve seat cone from the location of point I in Figure 1. A–I points were the monitoring points used along the scanning direction during the laser-melting process, and they were also the spot center points in the laser-scanning process. Paths 1–4 were radial monitoring paths. Meshing was the basis for the finite element simulation. The model was meshed using the eight-node hexahedral element solid 70 and the surface effect element surface 152. Due to the small size of the valve seat model, the overall meshing was adopted to improve the calculation accuracy. The principle of meshing was that, as the mesh became denser, the simulation results hardly changed.
2.2. Mathematical Model
In order to evenly distribute the laser energy in the laser spot, a flat-top circular spot was used as the laser heat source. The laser power density within the laser spot was evenly distributed. The laser power density is:
where q is the laser power density; α is the absorption rate of the laser energy on the surface of the material; P is the laser power; and r is the laser spot radius.
The laser-melting valve seat was a heat transfer process with heating and cooling. According to Fourier’s law of thermal conductivity and the law of the conservation of energy, the differential control equation for three-dimensional transient temperature thermal conduction considering the latent heat of the phase change [33] is:
where ρ is the material density; c is the specific heat capacity of the material; k is the thermal conductivity of the material; x, y, and z are three-dimensional coordinates; T is the temperature; t is time; and Q is the latent heat of the phase change.
In the finite element simulation, the phase-change latent heat problem was addressed by defining the change in the enthalpy of the material with temperature. The change formula for enthalpy [34] is:
where H is the enthalpy value.
The ANSYS indirect coupling method was adopted to use the temperature field calculated by the thermal analysis as the temperature boundary for the stress calculation. The temperature data included the transient temperature field from the beginning to end of the laser-melting process to the overall cooling of the model to 25 °C. Displacement constraints were applied to the bottom of the model during the stress analysis. During the laser-melting intensification stage, the stress created by a sharp change in the temperature led to the elastoplastic deformation of the valve seat. According to the thermo-elastoplastic theory, the thermo-elastoplastic constitutive equation [35] is:
where dσ is the stress increment; [Dep] is the elastoplastic stiffness matrix; dε is the strain increment; [Cth] is the thermal stiffness matrix; [M] is a function of the temperature shape; and [∆T] is the level of the temperature change.
2.3. Thermophysical Property Parameters of the RuT300 Material
The thermophysical property parameters of the material determined the correctness and validity of the simulation results. In the new power, the valve seat cast with the cylinder head was composed of a vermicular graphite cast iron RuT300 material. When the temperature reached the melting point of the RuT300 material, the material was no longer within the elastic deformation range. Mechanical property parameters, such as elastic modulus and yield strength, lost their physical connotations and should have been set to 0. However, the simulation of the laser-melting RuT300 valve seat was based on the thermo-elastic plastic theory; in order to avoid the difficulty of convergence in the simulation calculation, the thermophysical parameters of the material must be non-zero and the value should not be too small. After many simulation calculations and comparative analyses, the elastic modulus and yield strength of the material at the melting point and higher temperatures were set to a reasonable and small value in the finite element analysis. The selection of the thermophysical parameters of the material provided the basic data for the laser-melting simulation research. The thermophysical property parameters of the RuT300 material are shown in Table 1. The thermophysical parameters of the material at low temperatures were obtained by experimental measurements and referred to [36]. The parameters at high temperatures were approximated by interpolation and extrapolation methods. The trend and derivation of the thermal conductivity and specific heat capacity at high temperatures referred to [37].
2.4. Parameters of the Laser-Melting Process
In the numerical simulation study of the laser-melting vermicular graphite cast iron valve seat, the laser scanning speed and laser spot radius were fixed, and only the laser power was changed. A total of four different laser powers were selected in the simulation study to analyze the influence of the laser power on the thermodynamic coupling field. The laser-melting process parameters are shown in Table 2.
3. Results Analysis and Discussion
When the laser power is 2400 W, the temperature field distribution and the corresponding melting and phase-change-hardening areas of the laser scanning along the valve seat cone at different times are shown in Figure 2. According to the temperature field simulation results, the area where the material temperature was above the melting point (1200 °C) was the laser-melting area. The area where the material temperature was between the phase-change temperature (800 °C) and the melting point (1200 °C) was the laser phase-change-hardening area.
The laser-melting process could precisely modify the cone area. The rapid heating of the laser caused the surface temperature of the material to rise rapidly. After the laser left the scanning area, the surface temperature of the material decreased rapidly through heat conduction and heat exchange with the outside world. From the temperature distribution of the cross-section at each time point, it could be seen that, from the surface of the material downwards were the melting area, the phase-change-hardening area, and the matrix. As the laser scanned, the molten pool temperature continued to be high and the increase was small. In the closing area of the scan, there was a significant increase in the temperature due to the increasing warm-up effect at the previous moment. At the end of the scan at t = 22.68 s, the peak temperature of the valve seat reached 2424.31 °C. At the same time, the temperature field also corresponded to the area of the melting zone and the depth of the phase-change-hardening zone. In the first three moments, that is, t = 5.88 s, t = 11.48 s, and t = 17.08 s, the depth and width of the melting area and the depth of the phase-change-hardening area did not change much. This was because the thermal conductivity of the vermicular graphite cast iron RuT300 material decreased, despite the increase in temperature. The rate of the heat transfer downward slowed down. Until the finishing stage of the scan, the temperature considerably increased and the decrease in the thermal conductivity of the material had less of an effect. Heat diffused rapidly downward from the surface of the material. At the end of the scan at t = 22.68 s, the depth of the melting area was 0.73 mm, the width of the melting area was 3.85 mm, and the depth of the phase-change-hardening area was 0.63 mm.
At the end of the laser scanning process, the effects of the laser power changes on the peak temperature of the molten pool, the depth and width of the melting area, and the depth of the phase-change-hardening region were analyzed, and the results are shown in Figure 3. As the laser power increased, the peak temperature of the molten pool continued to increase. When the laser power was increased from 2000 to 2600 W, the peak temperature increased from 2005.09 to 2641.93 °C. The peak temperature increased almost linearly with the increase in the laser power.
When the laser power was increased from 2000 to 2600 W, the laser power density increased. The laser energy input to the surface of the material increased, resulting in corresponding changes in the molten and phase-change-hardening regions. The depth of the melting area increased from 0.55 to 0.86 mm, the width of the melting area increased from 3.42 to 4.21 mm, and the depth of the phase-change-hardening area increased from 0.55 to 0.64 mm.
The circumferential, radial, and axial residual stress distributions of the laser-melting RuT300 valve seat at different laser powers are shown in Figure 4. When the laser power was 2000 W, the peak circumferential, radial, and axial residual stresses of the valve seat were 224, 140, and 133 MPa, respectively. When the laser power was 2200 W, the peak circumferential, radial, and axial residual stresses of the valve seat were 230, 139, and 133 MPa, respectively. When the laser power was 2400 W, the peak circumferential, radial, and axial residual stresses of the valve seat were 237, 155, and 145 MPa, respectively. When the laser power was 2600 W, the peak circumferential, radial, and axial residual stresses of the valve seat were 246, 158, and 148 MPa, respectively. Due to the influence of the circumferential structure constraint of the valve seat, the maximum circumferential residual stress at different laser powers was 246 MPa, while the maximum radial and axial residual stress value was only 158 MPa. The circumferential residual stress at either laser power was much higher than the radial and axial stresses. During the laser-melting process, the stress generated by the extremely high temperature in the scanning area exceeded the yield limit of the vermicular graphite RuT300 material. The material was plastically deformed and could not be restored to its original state during the cooling process, resulting in the residual stress in the molten area being tensile stress. It can also be seen in Figure 4 that, due to the considerable increase in the temperature of the laser scanning end area, the binding force of the plastically deformed material in this area increases. In the final stage of the laser-melting process, the residual stress greatly increased. As the laser power increased, the peak temperature of the molten pool increased, resulting in an increase in the peak value of the circumferential residual stress. When the laser power was increased from 2000 to 2600 W, the peak circumferential residual stress increased from 224 to 246 MPa.
Along the laser scanning direction, different monitoring points and monitoring paths, shown in Figure 1, were selected in the melting area to further analyze the change in the residual stress. The A–I points in Figure 1 are the center points of the laser spot in the scanning direction. Figure 5 shows the change in the residual stress at points A–I at different laser powers. Due to the competitive relationship between the temperature increase in the valve seat and the decrease in the thermal conductivity of the material, the change in the circumferential residual stress could be roughly divided into three stages: the circumferential residual stress values at points A–D were relatively low and the fluctuation change was not considerable. As the laser power increased, the residual stress decreased. The residual stress values at points D–G increased; however, the change in the laser power was not obvious. The residual stress values at points G–I were high and there was a maximum residual stress value. The residual stress increased with the increase in the laser power. The radial and axial residual stress values can be roughly divided into two stages: the residual stress values at points A–G were low. However, at the end of the scan, there was a sudden increase in the residual stress values at points G–I; however, they were still lower than the circumferential residual stress values.
Figure 6 shows the residual stress change in monitoring paths 1–4 at different laser powers. In the laser-melting area, the change in the residual stress with laser power was basically consistent with the results of the monitoring points. The residual stress was high at the end of the laser scan, and the circumferential residual stress increased with the increase in laser power.
4. Validation of Simulation Results
In order to verify the effectiveness of the simulation model, a laser-melting experiment was conducted on the RuT300 valve seat with the same parameters as the simulation parameters, that is, the laser power was 2600 W, the laser scanning speed was 5 mm·s−1, and the laser spot radius was 1.5 mm. After the laser-melting process, metallographic samples were prepared by wire cutting perpendicular to the laser scanning direction and corroded with a nitrate ethanol solution with a mass fraction of 5%. The topography of the melting area of the valve seat was observed by scanning electron microscopy, as shown in Figure 7a. The depth and width of the melting area were measured and compared to the simulation results, as shown in Figure 7b. The laser-melting depth and width errors of the simulation and experiment were 5.5% and 7.1%, respectively, which met the engineering requirement error. The simulated maximum value of the circumferential residual stress under this experimental parameter was 246 MPa, which did not exceed the tensile strength of the RuT300 material. Therefore, in theory, there was no crack in the laser-melting valve seat. During the experiment, the surface of the valve seat was observed by the phosphor flaw-detection method, and there were no cracks, as shown in Figure 8. The experimental and simulation results were consistent.
5. Conclusions
In order to improve the wear resistance of the new power RuT300 vermicular cast iron material and effectively suppress the cracking induced by the excessive residual stress of the laser-melting RuT300 valve seat, the simulation study of the influence of laser power change on residual stress was conducted for the laser-melting process of vermicular graphite cast iron. The conclusions were:
- (1)
- The laser-melting process could precisely modify the valve seat cone area. Melting and phase-change-hardening areas could be obtained from the surface of the material downwards. With the increase in the laser power, the peak temperature of the molten pool increased almost linearly, and the area of the melting zone and depth of the phase-change-hardening region increased. When the laser power was increased from 2000 to 2600 W, the peak temperature of the laser-melting RuT300 valve seat increased from 2005.09 to 2641.93 °C, the depth of the melting area increased from 0.55 to 0.86 mm, the width of the melting area increased from 3.42 to 4.21 mm, and the depth of the phase-change-hardening area increased from 0.55 to 0.64 mm.
- (2)
- Due to the influence of the circumferential structure constraint of the valve seat, the circumferential residual tensile stress in the melting area was much higher than in the radial and axial directions. Along the laser scanning direction, the residual stress in the melting area increased as a whole. The temperature of the laser scanning finishing area was greatly increased, resulting in a significant increase in the residual stress in this area, and the highest value of the circumferential residual stress was evident in this area.
- (3)
- The distribution of the valve seat temperature and temperature gradient competed in the contribution of residual stress. As the laser power increased, the circumferential residual stress at the front scanning moment decreased. At the end of the scan, the increase in temperature increased the circumferential residual stress with the increase in laser power. When the laser power was increased from 2000 to 2600 W, the peak circumferential residual stress increased from 224 to 246 MPa.
Author Contributions
Methodology, W.T. and M.P.; investigation, W.T.; data curation, W.T.; writing—original draft preparation, W.T.; writing—review and editing, W.T. and M.P.; supervision, M.P. All authors have read and agreed to the published version of the manuscript.
Funding
This research was funded by the Fundamental Research Funds for the Central Universities—Special Project of Civil Aviation University of China, grant number 3122022074.
Data Availability Statement
Data sharing does not apply to this article.
Conflicts of Interest
The authors declare no conflict of interest.
References
- Zou, C.; Pang, J.; Qiu, Y.; Liu, R.; Li, S.; Jing, G.; Xu, C.; Zhang, Z. The high-cycle fatigue fracture mechanism and fatigue strength prediction of compacted graphite iron. Int. J. Fatigue 2022, 161, 106881. [Google Scholar] [CrossRef]
- Qiu, Y.; Pang, J.; Li, S.; Zhang, M.; Zhang, Z. Influence of temperature on the low-cycle fatigue properties of compacted graphite iron. Int. J. Fatigue 2018, 117, 450–460. [Google Scholar] [CrossRef]
- Sun, F. Research on Laser Cladding Integrated Forming Technology of Compacted Graphite Iron; University of Science and Technology Beijing: Beijing, China, 2022. [Google Scholar]
- Qiu, Y.; Pang, J.; Yang, E.; Li, S.; Zhang, Z. Transition of tensile strength and damaging mechanisms of compacted graphite iron with temperature. Mater. Sci. Eng. A 2016, 677, 290–301. [Google Scholar] [CrossRef]
- Qiu, Y.; Pang, J.; Zhang, M.; Zou, C.; Li, S.; Zhang, Z. Influence of temperature on the high-cycle fatigue properties of compacted graphite iron. Int. J. Fatigue 2018, 112, 84–93. [Google Scholar] [CrossRef]
- Qiu, Y.; Pang, J.; Li, S.; Yang, E.; Fu, W.; Liang, M.; Zhang, Z. Influence of thermal exposure on microstructure evolution and tensile fracture behaviors of compacted graphite iron. Mater. Sci. Eng. A 2016, 664, 75–85. [Google Scholar] [CrossRef]
- Lang, T.; Pang, M. Influence of laser power on properties of additive Ni25 layer on valve seat surface. Trans. Mater. Heat Treat. 2022, 43, 120–127. [Google Scholar]
- Chen, Y.; Pang, J.; Li, S.; Zou, C.; Zhang, Z. Damage mechanism and fatigue strength prediction of compacted graphite iron with different microstructures. Int. J. Fatigue 2022, 164, 107126. [Google Scholar] [CrossRef]
- Liu, H.; Yu, G.; He, X.; Li, S.; Zhu, T.; Ning, W.; Zheng, C. Microstructure and mechanical properties of NiCoCrAlY coating on compacted graphite iron by laser cladding. Trans. Mater. Heat Treat. 2015, 36, 171–176. [Google Scholar]
- Pang, M.; Tan, W. Microscopic characteristic analysis and crack suppression of laser-surface remelting of vermicular-graphite cast-iron valve seats. Laser Optoelectron. Prog. 2019, 56, 211402. [Google Scholar] [CrossRef]
- Chen, X.; Wang, H.; Zhou, X.; Zhao, J.; Fu, L.; Liu, W. Laser surface modification technology and research progress. Mater. Rep. 2018, 32, 341–344. [Google Scholar]
- Pang, M.; Tan, W. Effect of preheating temperature on residual stress field of laser melting RuT300 valve seats. Surf. Technol. 2019, 48, 296–301. [Google Scholar]
- Xu, J.; Tan, W.; Hu, Z.; Wang, S.; Zhou, J. Study on tribological properties of laser surface melting 316L stainless steel. Appl. Laser 2022, 42, 129–134. [Google Scholar]
- Qiu, A.; Chen, H.; Song, J.; Cheng, X.; Ding, H.; Zhou, G. Laser melting treatment on NiTi alloy and its biological corrosion properties. Surf. Technol. 2023, 52, 364–371. [Google Scholar]
- Wang, Z.; Hu, Y.; Pang, M. Microstructure and comprehensive properties of laser-melted stainless steel. Laser Optoelectron. Prog. 2021, 58, 1914006. [Google Scholar]
- Bukhari, S.; Husnain, N.; Siddiqui, F.; Anwar, M.; Khosa, A.; Imran, M.; Qureshi, T.; Ahmad, R. Effect of laser surface remelting on Microstructure, mechanical properties and tribological properties of metals and alloys: A review. Opt. Laser Technol. 2023, 165, 109588. [Google Scholar] [CrossRef]
- Castro, R.; Curi, E.; Inacio, L.; Rocha, A.; Pereira, M.; Silva, R.; Pereira, A. Laser remelting of WC-CoCr surface coated by HVOF: Effect on the tribological properties and energy efficiency. Surf. Coat. Technol. 2021, 427, 127841. [Google Scholar] [CrossRef]
- An, Y.; Zheng, S.; Pang, X.; Pu, J. Effect of laser remelting on copper-nickel alloy coating prepared by extreme high-speed laser cladding. J. Manuf. Process. 2023, 95, 497–507. [Google Scholar] [CrossRef]
- Temmler, A.; Pirch, N. Investigation on the mechanism of surface structure formation during laser remelting with modulated laser power on tool steel H11. Appl. Surf. Sci. 2020, 526, 146393. [Google Scholar] [CrossRef]
- Chen, X.; Ge, Y. Simulation of thermal effect of Zr65Al7.5Ni10Cu17.5 amorphous alloy by laser melting. Laer Technol. 2020, 44, 202–205. [Google Scholar]
- Ali, H.; Ghadbeigi, H.; Mumtaz, K. Effect of scanning strategies on residual stress and mechanical properties of selective laser melted Ti6Al4V. Mater. Sci. Eng. A 2018, 712, 175–187. [Google Scholar] [CrossRef]
- Zhang, C.; Yang, W.; Ma, C. Numerical simulation of temperature field in laser surface remelting rare earth magnesium alloy and its corrosion resistance. Hot Work. Technol. 2017, 46, 143–147+154. [Google Scholar]
- Bonek, M.; Śliwa, A.; Mikuła, J. Computer simulation of the relationship between selected properties of laser remelted tool steel surface layer. Appl. Surf. Sci. 2016, 388, 174–179. [Google Scholar] [CrossRef]
- Vastola, G.; Zhang, G.; Pei, Q.; Zhang, Y. Modeling and control of remelting in high-energy beam additive manufacturing. Addit. Manuf. 2015, 7, 57–63. [Google Scholar] [CrossRef]
- Schüßler, P.; Damon, J.; Mühl, F.; Dietrich, S.; Schulze, V. Laser surface hardening: A simulative study of tempering mechanisms on hardness and residual stress. Comput. Mater. Sci. 2023, 221, 112079. [Google Scholar] [CrossRef]
- Chen, Z.; Yu, X.; Ding, N.; Cong, J.; Sun, J.; Jia, Q.; Wang, C. Wear resistance enhancement of QT700-2 ductile iron crankshaft processed by laser hardening. Opt. Laser Technol. 2023, 164, 109519. [Google Scholar] [CrossRef]
- Evdokimov, A.; Jasiewicz, F.; Doynov, N.; Ossenbrink, R.; Michailov, V. Simulation of surface heat treatment with inclined laser beam. J. Manuf. Process. 2022, 81, 107–114. [Google Scholar] [CrossRef]
- Han, X.; Li, C.; Liu, Z.; Chen, X.; Deng, S. Analysis of residual stress distribution characteristics of laser surface hardening based on Voronoi model. Opt. Laser Technol. 2022, 156, 108613. [Google Scholar] [CrossRef]
- Xu, X. Research on Numerical Simulation and Temperature Control Technology of Laser Transformation Hardening; Shandong University: Jinan, China, 2022. [Google Scholar]
- Liverani, E.; Lutey, A.; Ascari, A.; Fortunato, A.; Tomesani, L. A complete residual stress model for laser surface hardening of complex medium carbon steel components. Surf. Coat. Technol. 2016, 302, 100–106. [Google Scholar] [CrossRef]
- Fortunato, A.; Ascari, A.; Orazi, L.; Campana, G.; Cuccolini, G. Numerical evaluation of the reflectivity coefficient in laser surface hardening simulation. Surf. Coat. Technol. 2012, 206, 3179–3185. [Google Scholar] [CrossRef]
- Tobar, M.; Álvarez, C.; Amado, J.; Ramil, A.; Saavedra, E.; Yáñez, A. Laser transformation hardening of a tool steel: Simulation-based parameter optimization and experimental results. Surf. Coat. Technol. 2006, 200, 6362–6367. [Google Scholar] [CrossRef]
- Hu, X.; Xu, Y.; Hu, Y.; Yao, J. Research on laser transformation hardening and simulation model in temperature control mode. Trans. Mater. Heat Treat. 2016, 37, 235–240. [Google Scholar]
- Sun, W.; Li, Y.; Yin, B. Effect of optimizing parameters of laser transformation hardening on 5CrNiMo steel temperature field. J. Tianjin Univ. Technol. 2012, 28, 34–38. [Google Scholar]
- Li, Y.; Li, W. Numerical simulation on welding residual stresses of X80 pipeline girth weld joint. Trans. China Weld. Inst. 2010, 31, 97–100, 104, 118. [Google Scholar]
- GB/T 26655-2011; Compacted (Vermicular) Graphite Iron Castings. General Administration of Quality Supervision, Inspection and Quarantine of the People’s Republic of China, Standardization Administration of the People’s Republic of China: Beijing, China, 2012.
- Guo, G.; Ma, H.; Zhang, J. The measurement of thermophysical properties of cast iron and the relationship to its microstructure. Phys. Test. Chem. Anal. (Part A Phys. Test.) 2005, 41, 13–16. [Google Scholar]
- Feng, Z.; Cai, A.; Fan, S.; Cheng, J. Effect of temperature on mechanical properties of vermicular graphite iron. Mod. Cast Iron 2016, 36, 61–64+83. [Google Scholar]
Figure 1.
Geometric model for finite element simulation of the laser-melting valve seat.

Figure 2.
Temperature field distribution, melting area, and phase-change-hardening area at different times of laser scanning at P = 2400 W. (a) t = 5.88 s; (b) t = 11.48 s; (c) t = 17.08 s; (d) t = 22.68 s.
Figure 2.
Temperature field distribution, melting area, and phase-change-hardening area at different times of laser scanning at P = 2400 W. (a) t = 5.88 s; (b) t = 11.48 s; (c) t = 17.08 s; (d) t = 22.68 s.

Figure 3.
Changes in the peak temperatures of the molten pool, melting area, and phase-change-hardening area at different laser powers at t = 22.68 s. (a) Change in peak temperature of the molten pool; (b) changes in the depth and width of the melting area and the depth of the phase-change-hardening area.
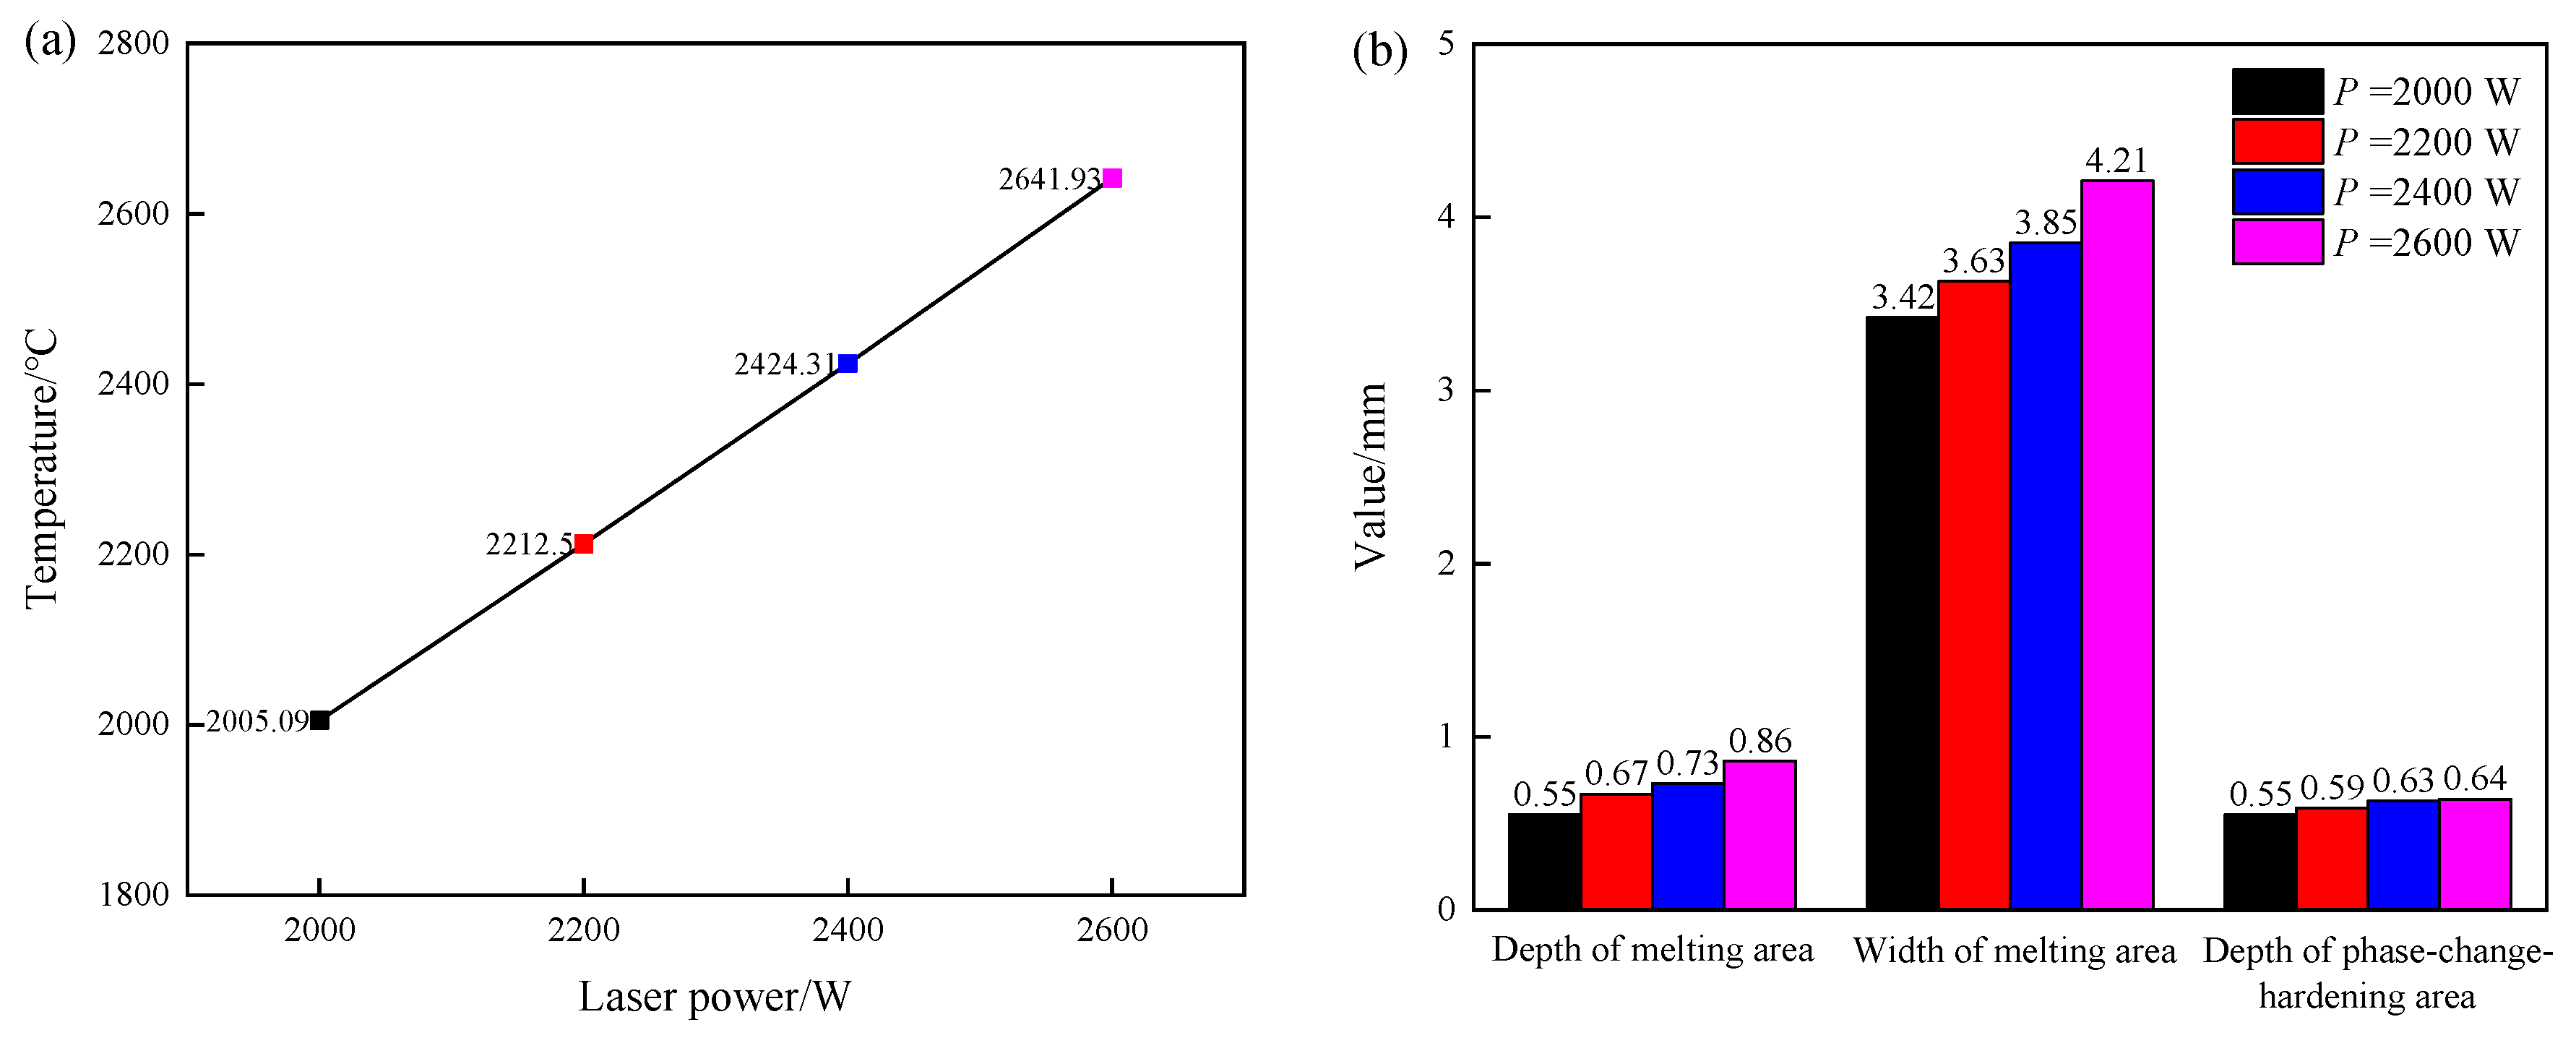
Figure 4.
Residual stress distributions of laser-melting RuT300 valve seat at different laser powers: (a) P = 2000 W; (b) P = 2200 W; (c) P = 2400 W; (d) P = 2600 W.
Figure 4.
Residual stress distributions of laser-melting RuT300 valve seat at different laser powers: (a) P = 2000 W; (b) P = 2200 W; (c) P = 2400 W; (d) P = 2600 W.
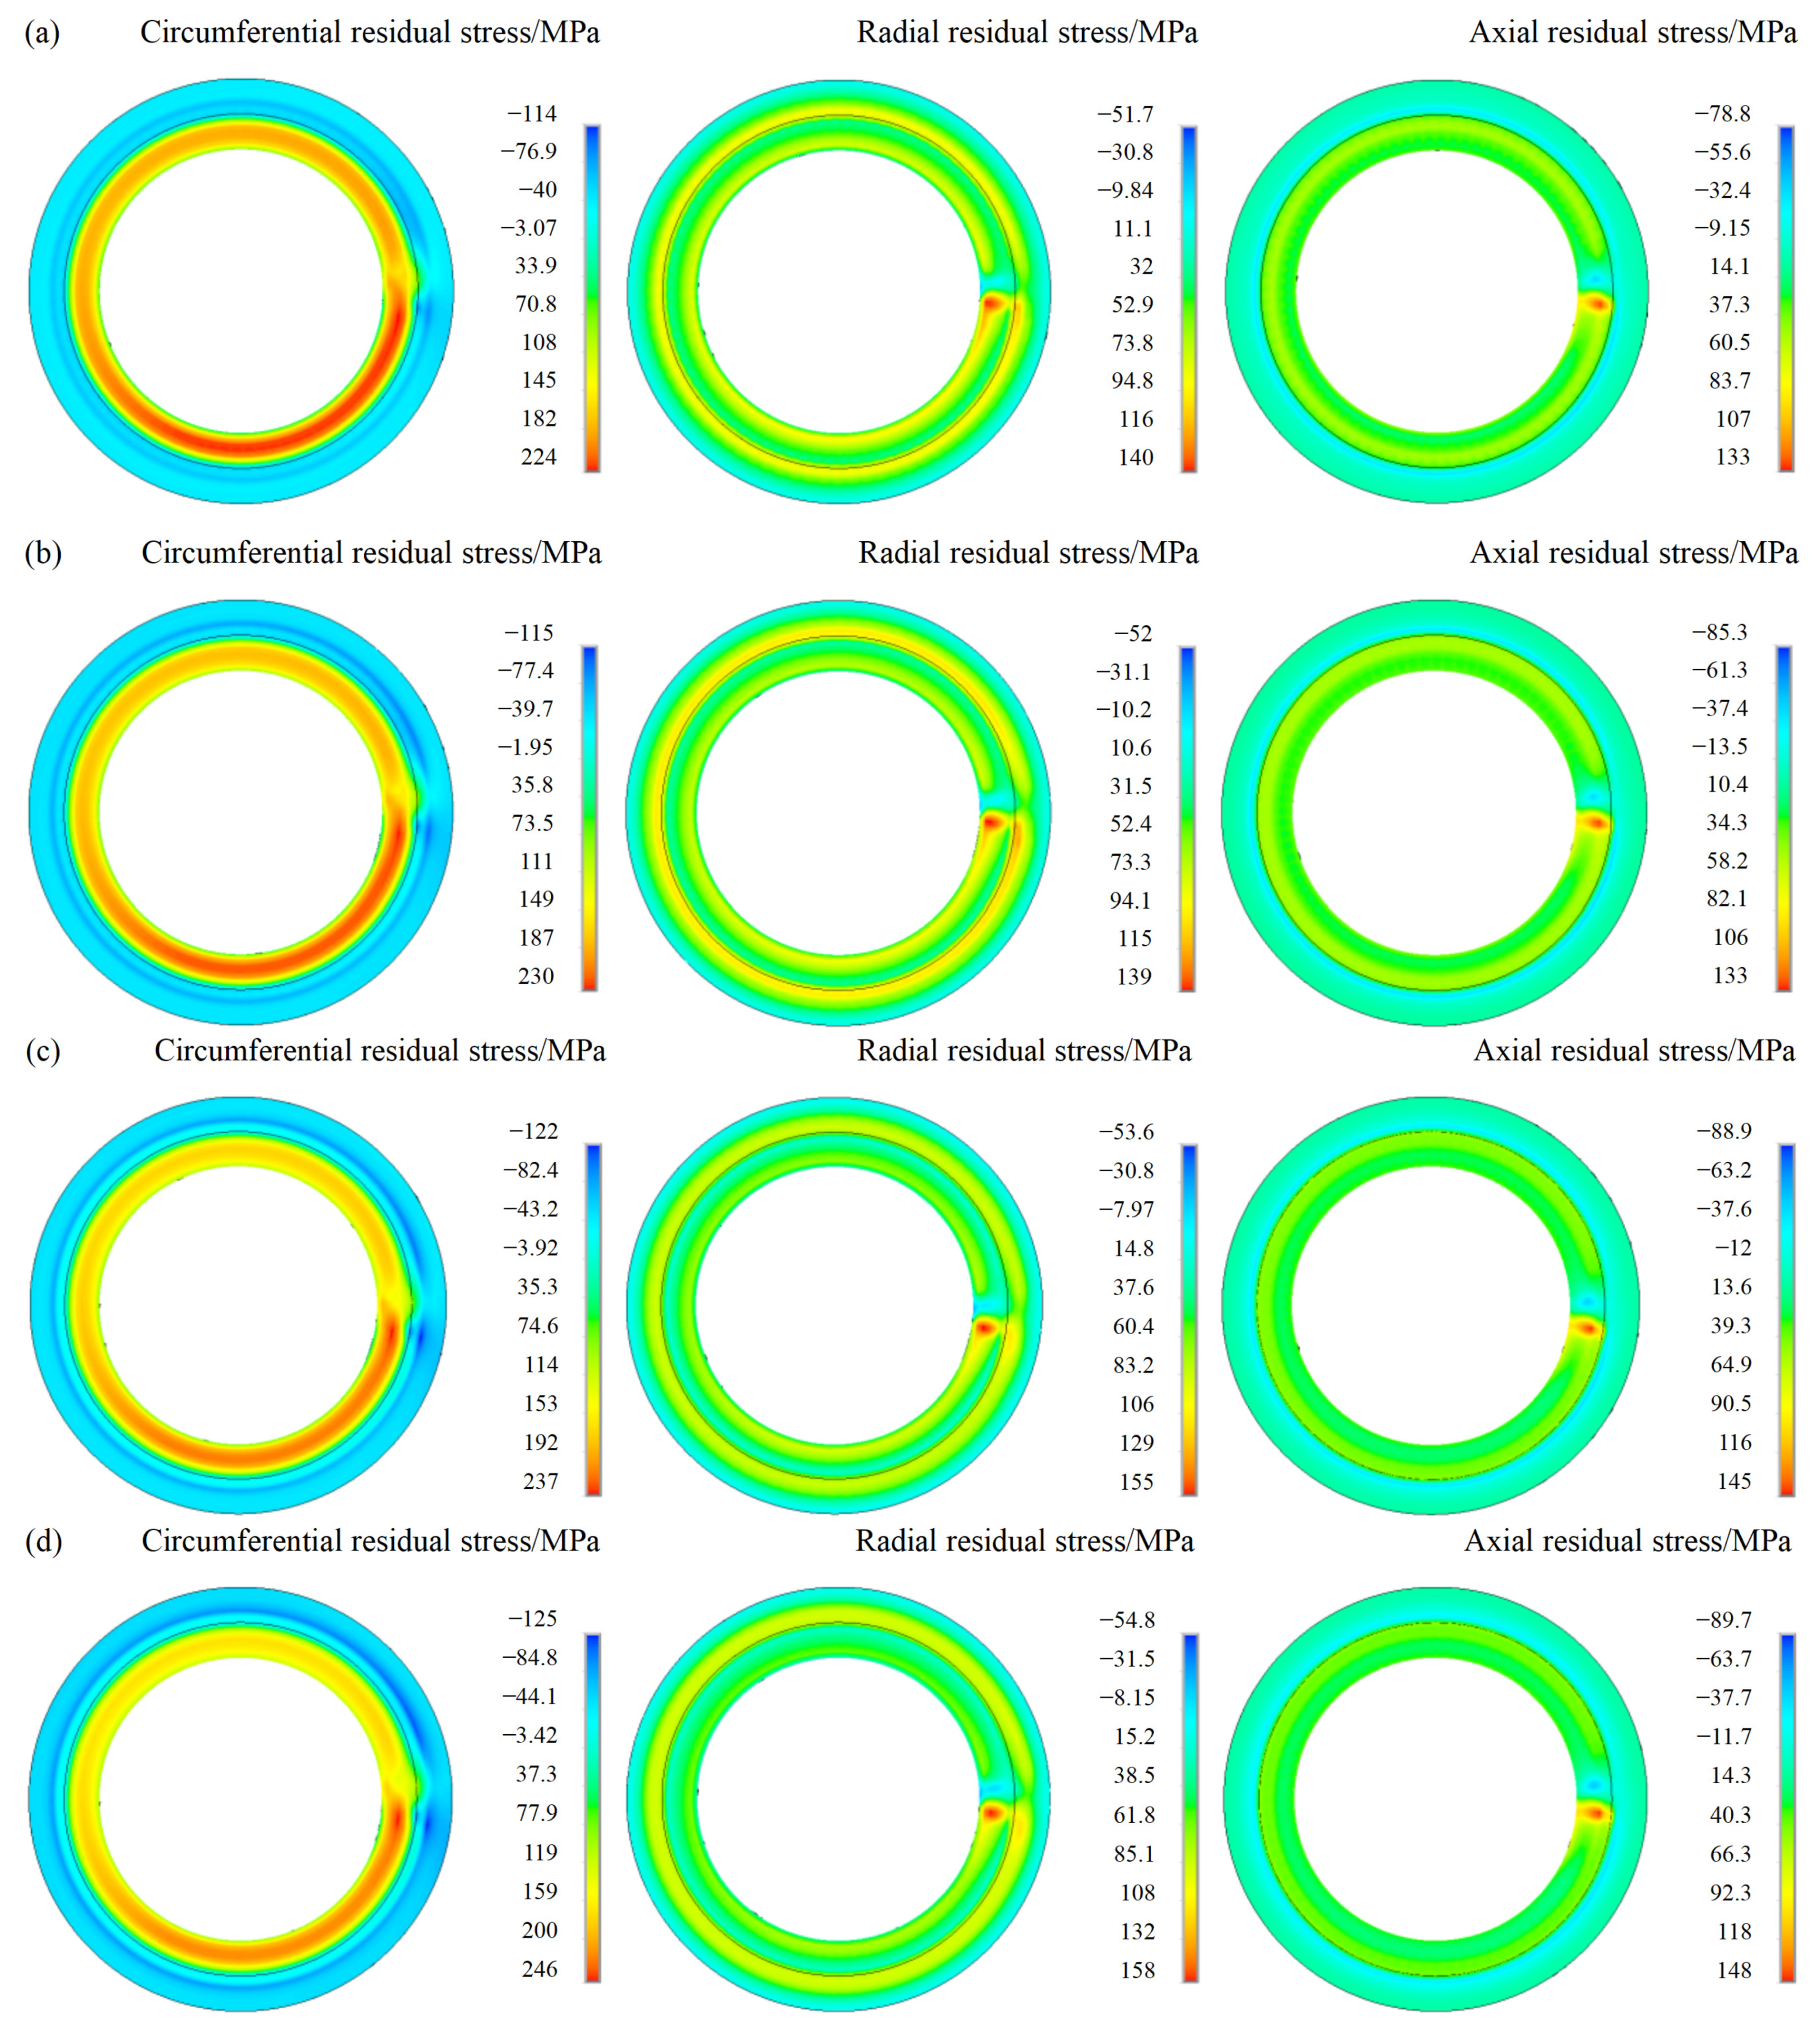
Figure 5.
Change in the residual stress values of monitoring points A–I with laser power: (a) circumferential residual stress; (b) radial residual stress; (c) axial residual stress.
Figure 5.
Change in the residual stress values of monitoring points A–I with laser power: (a) circumferential residual stress; (b) radial residual stress; (c) axial residual stress.
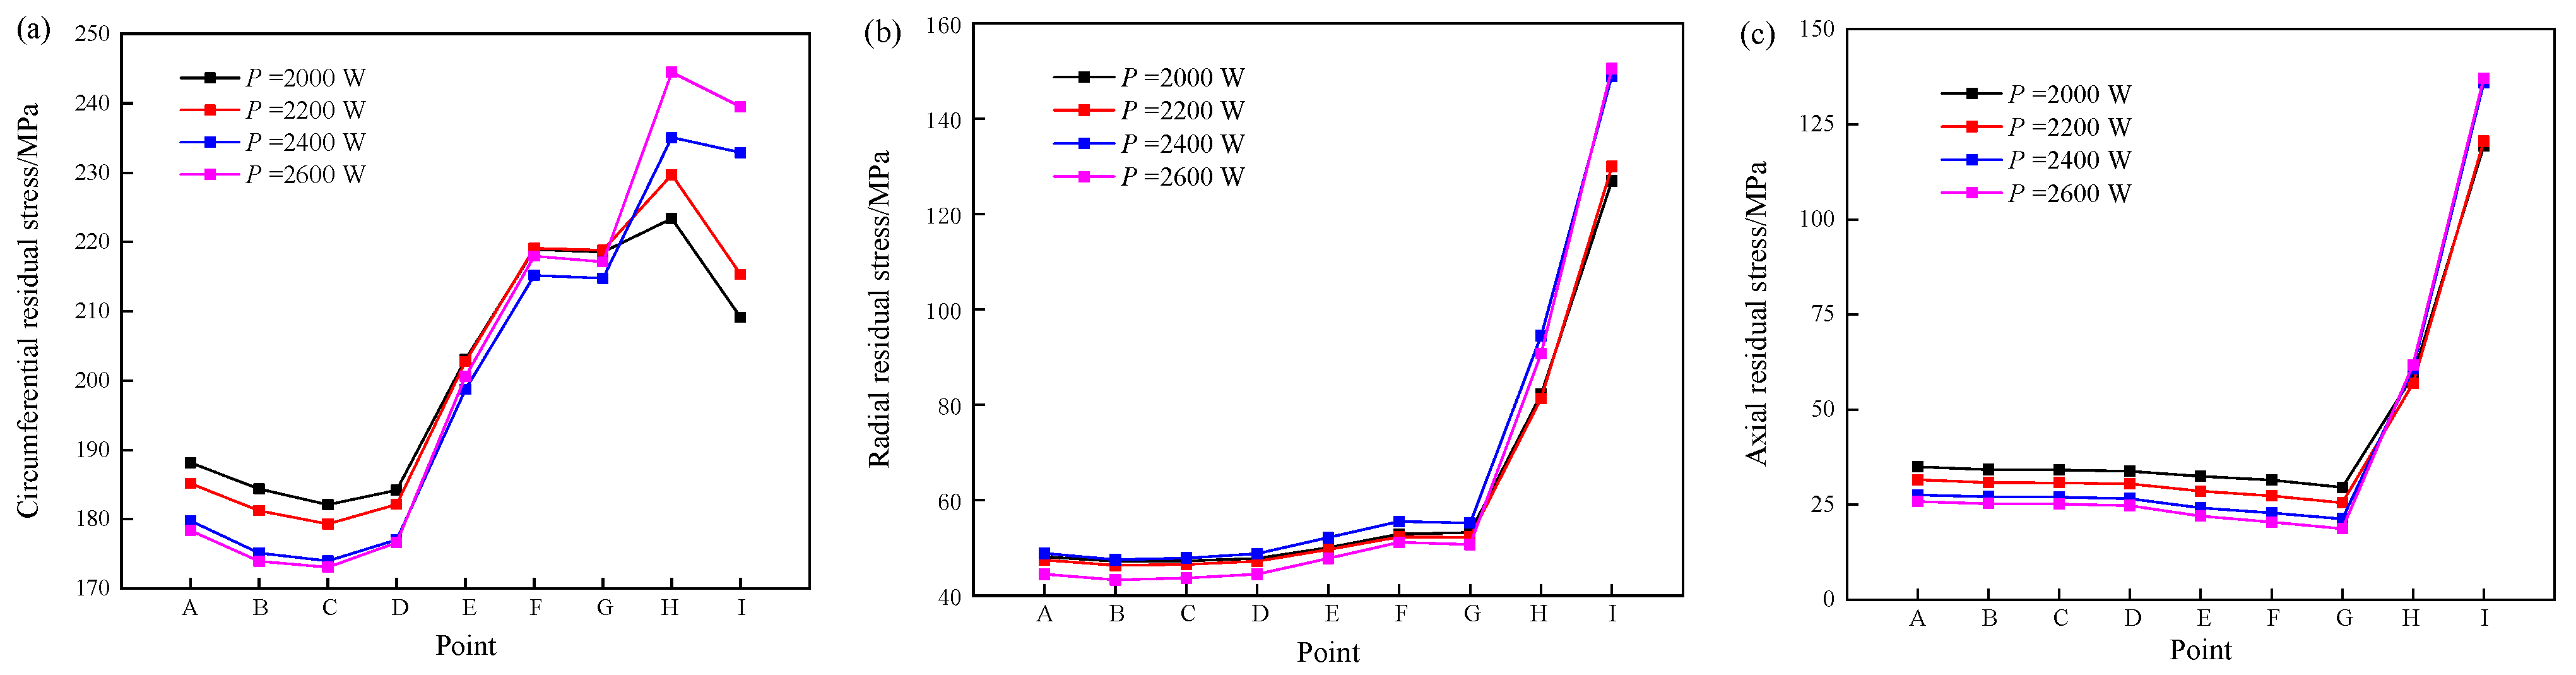
Figure 6.
Change in the residual stress values of monitoring paths 1–4 with laser power: (a) path 1; (b) path 2; (c) path 3; (d) path 4.
Figure 6.
Change in the residual stress values of monitoring paths 1–4 with laser power: (a) path 1; (b) path 2; (c) path 3; (d) path 4.

Figure 7.
(a) Topography of the melting area; (b) experimental and simulation comparison results of the depth and width of the melting area.
Figure 7.
(a) Topography of the melting area; (b) experimental and simulation comparison results of the depth and width of the melting area.
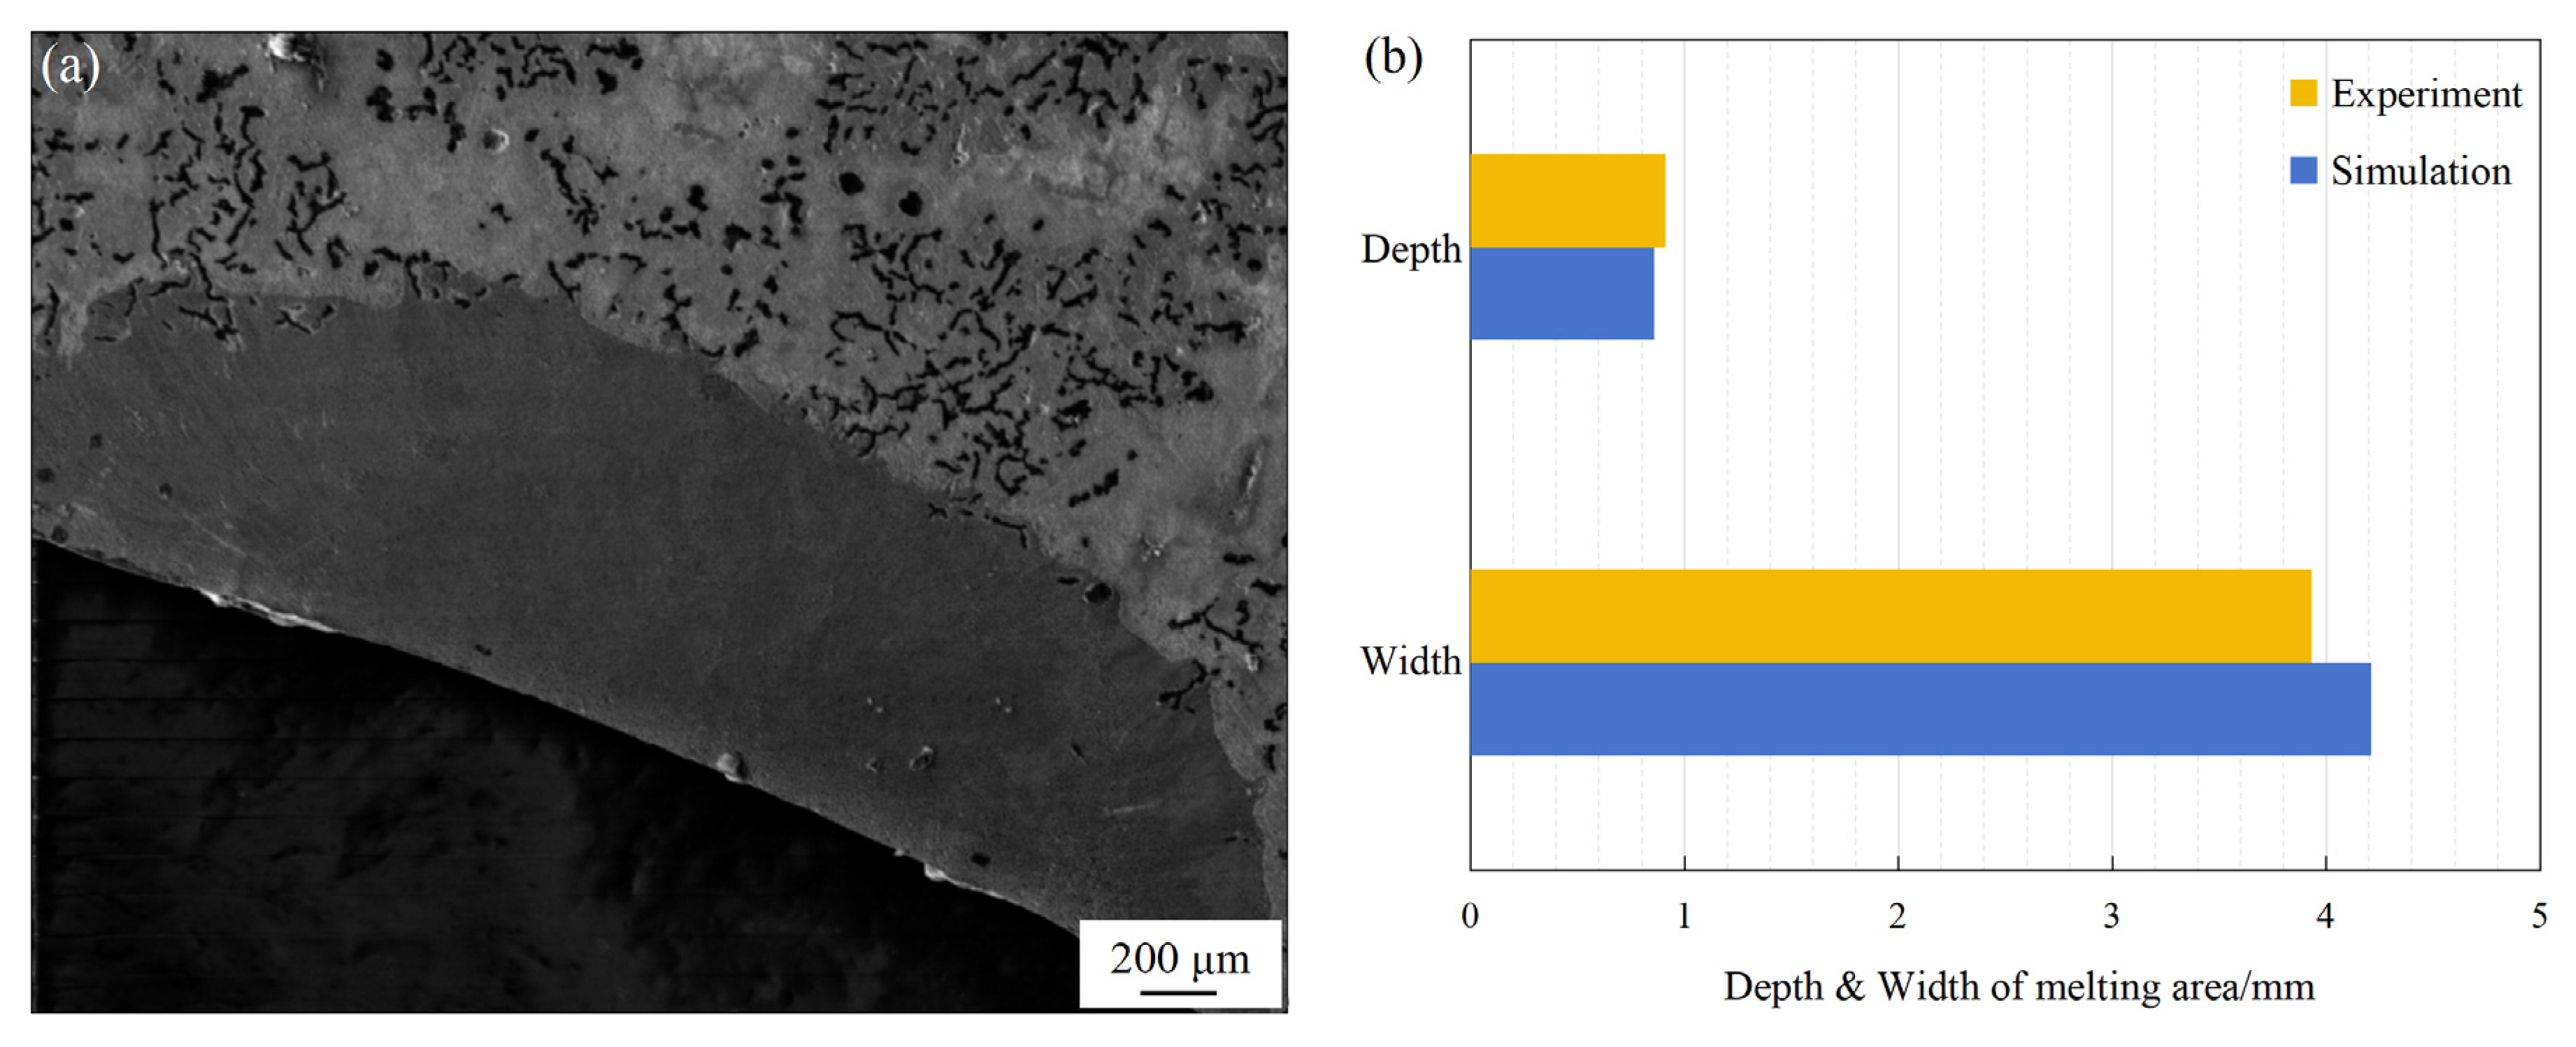
Figure 8.
Phosphor flaw-detection results of the laser-melting valve seat.

Table 1.
Thermophysical property parameters of vermicular graphite cast iron RuT300.
| Parameters | Value | |||||
|---|---|---|---|---|---|---|
| Temperature/℃ | 25 | 400 | 800 (Phase transition temperature [38]) | 1200 (Melting point) | 1600 | 2000 |
| Specific heat capacity/(J·kg−1·K−1) | 465 | 645 | 871 | 938 | 888 | 880 |
| Thermal conductivity/(W·m−1·K−1) | 42.37 | 41.03 | 37.29 | 34.89 | 33.29 | 31.69 |
| Density/(kg·m−3) | 7086 | 7086 | 7086 | 7086 | 7086 | 7086 |
| Elastic modulus/GPa | 145 | 135 | 124 | 80 | 60 | 60 |
| Yield strength/MPa | 240 | 200 | 157 | 20 | 20 | 20 |
| Thermal expansion coefficient/(10−6·°C−1) | 10.6 | 12.5 | 14.5 | 15.7 | 16.1 | 16.5 |
| Poisson’s ratio | 0.26 | 0.26 | 0.26 | 0.26 | 0.26 | 0.26 |
Table 2.
Parameters of laser-melting process.
| Parameters | Value | |||
|---|---|---|---|---|
| Laser power/W | 2000 | 2200 | 2400 | 2600 |
| Laser scanning speed/(mm·s−1) | 5 | |||
| Laser spot radius/mm | 1.5 | |||
Disclaimer/Publisher’s Note: The statements, opinions and data contained in all publications are solely those of the individual author(s) and contributor(s) and not of MDPI and/or the editor(s). MDPI and/or the editor(s) disclaim responsibility for any injury to people or property resulting from any ideas, methods, instructions or products referred to in the content. |
© 2023 by the authors. Licensee MDPI, Basel, Switzerland. This article is an open access article distributed under the terms and conditions of the Creative Commons Attribution (CC BY) license (https://creativecommons.org/licenses/by/4.0/).
Share and Cite
MDPI and ACS Style
Tan, W.; Pang, M. Simulation Study on the Influence of a Laser Power Change on the Residual Stress of a Laser-Melting RuT300 Valve Seat. Lubricants 2023, 11, 435. https://doi.org/10.3390/lubricants11100435
AMA Style
Tan W, Pang M. Simulation Study on the Influence of a Laser Power Change on the Residual Stress of a Laser-Melting RuT300 Valve Seat. Lubricants. 2023; 11(10):435. https://doi.org/10.3390/lubricants11100435
Chicago/Turabian StyleTan, Wendan, and Ming Pang. 2023. "Simulation Study on the Influence of a Laser Power Change on the Residual Stress of a Laser-Melting RuT300 Valve Seat" Lubricants 11, no. 10: 435. https://doi.org/10.3390/lubricants11100435
Note that from the first issue of 2016, this journal uses article numbers instead of page numbers. See further details here.