
Accounting for Selection Bias and Redshift Evolution in GRB Radio Afterglow Data

1
National Astronomical Observatory of Japan, 2-21-1 Osawa, Tokyo 181-8588, Japan
2
Space Science Institute, Boulder, CO 80301, USA
3
Department of Astronomical Science, School of Physical Sciences, The Graduate University for Advanced Studies, SOKENDAI, Shonankokusaimura, Miura District, Hayama 240-0193, Japan
4
Department of Astronomy, University of Maryland, College Park, MD 20742, USA
5
Instituto de Astronomia, Universidad Nacional Autónoma de México, Mexico City 04510, Mexico
6
National Centre for Radio Astrophysics, Tata Institute of Fundamental Research, Pune 411007, India
*
Author to whom correspondence should be addressed.
†
These authors contributed equally to this work.
Galaxies 2021, 9(4), 95; https://doi.org/10.3390/galaxies9040095
Submission received: 30 September 2021
/
Revised: 30 October 2021
/
Accepted: 4 November 2021
/
Published: 7 November 2021
(This article belongs to the Special Issue Gamma-Ray Burst Science in 2030)
Abstract
:Gamma-ray Bursts (GRBs) are highly energetic events that can be observed at extremely high redshift. However, inherent bias in GRB data due to selection effects and redshift evolution can significantly skew any subsequent analysis. We correct for important variables related to the GRB emission, such as the burst duration, , the prompt isotropic energy, , the rest-frame end time of the plateau emission, , and its correspondent luminosity , for radio afterglow. In particular, we use the Efron–Petrosian method presented in 1992 for the correction of our variables of interest. Specifically, we correct and for 80 GRBs, and and for a subsample of 18 GRBs that present a plateau-like flattening in their light curve. Upon application of this method, we find strong evolution with redshift in most variables, particularly in , with values similar to those found in past and current literature in radio, X-ray and optical wavelengths, indicating that these variables are susceptible to observational bias. This analysis emphasizes the necessity of correcting observational data for evolutionary effects to obtain the intrinsic behavior of correlations to use them as discriminators among the most plausible theoretical models and as reliable cosmological tools.
1. Introduction
Gamma-ray bursts (GRBs) can be observed at extremely high redshift, making them a valuable tool for studies of the early Universe. The ability to observe these highly energetic objects at redshifts out to [1,2,3,4,5,6,7,8,9,10,11] has created significant interest in using them as standardizable candles, similar to Type Ia supernovae. However, observations of GRBs have shown a very diverse population with few common characteristics.
Phenomenologically, GRBs are characterized by the main event, called the prompt emission, which is usually observed in gamma-rays, hard X-rays and sometimes in optical, while the afterglow is the counterpart in soft X-rays (≈66% of observed GRBs), in optical (≈38% of observed GRBs) and sometimes in radio (≈6.6% of observed GRBs). GRB radio afterglows are very difficult to observe, indeed, similar to the X-ray observations which are characterized by the detector limits, and additional difficulties rise due to the limited allocated time for the follow-up observations in the radio band after the GRB trigger. Bursts are classified following the duration of the prompt episode (). The population of short GRBs (sGRBs) usually has harder spectra and a duration of less than 2 s. In contrast, the population of long GRBs (lGRBs) has softer spectra and a duration larger than 2 s [12]. However, this classification is still in debate, and so in some bursts, it is not clear if GRBs with intermediate features belong to short or long GRBs [13,14]. LGRBs are associated with the core collapses of dying massive stars [15,16] and sGRBs by merging two compact objects; a black hole (BH) with a neutron star (NS) and two NSs [17,18,19].
A crucial breakthrough in the analysis of GRB features is the discovery of the plateau emission by the Neils Gehrels Swift Observatory [20]. The plateau emission is a flat part of the lightcurves which follows the decay phase of the prompt emission [21,22,23,24]. In the current paper we focus on properties resulting from this plateau emission, as well as both the prompt and afterglow emission. In general, attempts have been made to find standardizable properties, such as a plateau of GRBs or through prompt and afterglow correlation studies. We here mention a few of them: Yonetoku et al. [25], Dai and Wang [26], Ghirlanda [27], Dainotti et al. [28], Amati et al. [29], Dainotti et al. [30,31,32,33,34], Dainotti [35].
However, it is clear from past and current studies [36,37,38,39] that observations of GRBs are further susceptible to selection bias and evolutionary effects, which may change the results of any subsequent analysis and can substantially impact the results related to cosmological application of GRB relations [40]. In GRB studies, it is, therefore, crucial to know whether the studied correlations are intrinsic or artificially created as a result of observational biases and redshift evolution. “Redshift evolution" is the dependence of the variable of interest on redshift, and thus “independent of redshift" indicates the absence of such evolution.
In the study of GRB correlations, all variables must be computed in the rest-frame, as we are comparing objects at different epochs. This introduces another source of redshift dependence included in the definition of luminosity distance:
where is the Hubble constant at the present day and is the matter density in a flat Universe assuming the equation of state parameter w = −1. Indeed, usually one of the variables in the correlation is either a luminosity or energy which, by definition, depends on the luminosity distance. Ideally, all correlations we use must be corrected for redshift evolution, if any, requiring the removal of any existing redshift dependence.
There do exist statistical techniques that are capable of correcting for these effects, as well as correcting for data truncation from detector limits [41,42,43]. Among the methods to remove evolution, we consider here the Efron–Petrosian (EP) [41] method. The EP method is a well-established example of these kinds of techniques, and has been used to recover intrinsic relationships in many correlations in the past [7,40,44,45,46,47,48].
Lloyd et al. [44] discuss the correlation between , or the peak of the spectrum, with flux and fluence in GRBs, later investigated in the rest-frame and known as the relation [49]. A further modification of this relation is the one discovered by Yonetoku et al. [25] in which is correlated with the prompt isotropic luminosity, . The EP method provides an explanation on how to perform analysis on truncated data, and in Yonetoku et al. [25], Amati et al. [49] it is illustrated that the method is capable of recovering the correlation present in the original “parent" sample with the truncated data.
This technique has been further explored regarding the luminosity function and formation rate of sGRBs in a recent study by Dainotti et al. [48]. They look at the intrinsic distributions of these variables using the EP method, and introduce a method of accounting for incompleteness of redshift data with the Kolmogorov–Smirnov (KS) test (this is described in more detail in Section 2.2). They find a strong evolution of luminosity with redshift, emphasizing the necessity of this correction. The analysis presented in Dainotti et al. [48] is also relevant, as it emphasizes that both sGRBs and lGRBs undergo strong redshift evolution.
It should also be noted that though this method is mainly applied to GRB correlation studies, it has been also successfully applied in studies of Active Galactic Nuclei as well [45].
Among GRB correlations in particular we focus our attention to the rest-frame time at the end of the plateau emission, , and its correspondent luminosity , this is an extension in radio of the so-called 2D Dainotti relation in X-rays [29,30,31] and optical [50]. For the very recent analysis on the 2D Dainotti relation in radio see Levine et al. (2021) in preparation. For a review of the subject of GRB correlations and selection biases in the prompt and afterglow see Dai and Wang [26], Ghirlanda [27], Dainotti [35], Dainotti and Del Vecchio [51], Dainotti et al. [52], Dainotti and Amati [53].
One of the main problems in the application of GRB relationships as theoretical model discriminators and as cosmological tools is the fact that correlations must be intrinsic to the physics and not induced by biases. There are several examples of how the correlations are used to interpret theoretical models both in the prompt and afterglow emission. The photospheric emission and the Comptonization models [54,55,56,57,58,59,60,61,62] are the two main models used to test the − and the Yonetoku et al. [25] correlations, the latter between and the isotropic energy in the prompt emission. Otherwise, the parameter space pinpointed by those correlations can be the effect of selection biases and not of the true underlying physics. To this end, it is necessary to apply these correlations as model discriminators only after correction for such biases. Indeed, for example the plateau emission in X-rays and optical, which reconciles with the existence of the 2D Dainotti relation, can be derived through the equations of a fast rotating NS, the so-called magnetar model [17,18,19,63,64,65]. In Rowlinson et al. [66], Rea et al. [67], Stratta et al. [68] the derivation of the parameter space of the magnetic field and spin period have been computed accounting for selection biases and redshift evolution. The current status in the literature is that only a few correlations have been corrected for selection biases and evolutionary effects through the EP method, such as Dainotti et al. [7,48,69,70,71].
Specifically, Dainotti et al. [7] examine this correlation in X-ray for a sample of 101 GRBs that present a plateau, or flattening, in their light curves. After correction for evolutionary effects using the EP method, they conclude that the observed correlation is intrinsic at the 12 level. In mimicking the evolution of each variable with redshift, they tested both a simple and more complex model, finding similar results in both cases. Dainotti et al. [40] further examine the importance of these corrections when studying the cosmological properties of GRBs, applying the EP method to a simulated correlation between luminosity and time at the end of the plateau emission for 101 GRBs and testing whether a 5 deviation from the intrinsic values strongly changes the cosmological results. They demonstrated that their results change with this deviation by 13% regarding the values of , emphasizing the necessity of applying such corrections. The problem of evolution of the variables and their correction is not only important for GRB-cosmology studies, but also for more general cosmological studies. Indeed, in Dainotti et al. [72] it has been shown that there is indication of a possible evolution even of the Hubble constant. If this is not due to selection biases, a new physical cosmological model which relies on alternative theories, such as the modified theory of gravity, must be accounted for.
Regarding the correlations in GRB afterglows, Lloyd-Ronning et al. [46,73] discussed the correlation of not only luminosity with redshift, but also isotropic energy, , , and the jet opening angle, , for a sample of 376 GRBs. They emphasize the difficulty of obtaining intrinsic values for these quantities due to inherent biases in observation methods, and additional truncation from detector limits that can introduce false correlations in the data [74]. They find strong evolution with redshift for each of these variables, indicating that achromatic properties of GRBs are also susceptible to selection bias. A further study by Lloyd-Ronning et al. [47] discusses the evolution of with redshift in greater detail, using the EP method to recover the intrinsic behavior of the jet opening angle.
In this study, we seek to determine whether the strong evolution of and vs. redshift initially found by Lloyd-Ronning et al. [46,73] is still the same for GRBs with observed radio afterglow. In addition to the isotropic energy, we apply the EP method to the luminosity, and break time in radio wavelengths to determine if these variables are strongly affected by inherent bias and evolutionary effects.
We here point out that we are aware that the plateau sample is a subsample of a more extended population of plateaus that we cannot see. We have fixed the issue of the biases related to the redshift evolution and due to the selection threshold with the Efron–Petrosian method; however, we cannot account for the missing population of GRBs for which the follow-up has not been tackled. Nonetheless, it is crucial to discuss the versus the redshift, since this correlation has been studied in X-rays and optical extensively and it is important to investigate if this correlation holds true in radio with comparable slopes to optical and X-ray. The first step to investigate the correlation is to determine if the variables involved are subjected to redshift evolution and selection biases.
In summary, the main point of the paper is the study of the redshift evolution and the removal of selection biases through the EP method. The analysis of the true correlations can be done only if we first determine the evolution among the variables. The plateau emission has been extensively investigated in X-rays and optical, but so far there has not been a statistical analysis of the existence of the plateau in radio. The radio observations of the plateau emission can cast a light on whether or not the end time of the plateau is indeed a jet break. This point can be revealed only through such a study. The evaluation of the jet break allows one to better understand the evolution of the GRB and its physics in relation to the standard fireball model [75,76] or other scenarios.
This paper is organized as follows: in Section 2, we discuss the selection of our sample, as well as the formulation of the EP method and its application to our sample. In Section 3, we present the results of this analysis, and in Section 4, we discuss the implications of our study, as well as a comparison to previous studies, and present our conclusions.
2. Methods
2.1. Variables of Interest
The EP method uses a modified version of Kendall’s statistics to test for independence of variables in a truncated data set. Here, is defined as:
with defined as the rank defined as the expectation value, and defined as the variance. For a more complete discussion of the method and the algebra involved, see Dainotti et al. [7,34], Efron and Petrosian [41], Singal et al. [45], Dainotti et al. [77], Petrosian et al. [78], Lloyd-Ronning and Petrosian [79]. Here, we use the EP method to determine the impact of redshift evolution and selection bias on four variables: , where the star denotes the rest-frame, , the radio light curve break time , and the radio luminosity at the time of break . These variables are considered to be they are pertinent to the correlations analyzed in Levine et al. (2021 in preparation). Throughout our analysis, we consider these variables in logarithmic scale for convenience.
We look at the and for a sample of 80 GRBs with observed radio afterglow published in the literature [80,81,82,83,84,85,86,87,88,89,90,91,92,93,94,95,96,97,98]. Values of are taken from the literature. If no value could be found, the , in units of ergs, is calculated using the equation:
where S is the fluence in units of erg , is the luminosity distance assuming a flat model with and km (see Equation (1)), and K is the correction for cosmic expansion [99]:
with as the spectral index of the GRB. Fluence and values are taken from the literature.
To analyze the impact of selection bias and redshift evolution for and , we first fit each of the 80 GRBs with a broken power law (BPL) according to the formulation:
where refers to the flux at the break, refers to the rest-frame time of break, refers to the slope before the break, and refers to the slope after the break. We can only obtain values of and for light curves that show a “plateau” feature, or a flattening of the light curve before a clear break. In our analysis, we consider a light curve to display a plateau if . Therefore, we discard fits to light curves with scattered observations, unreliable error bars, or shapes incompatible with a BPL and plateau. In our subsequent analysis we include those light curves whose analysis of the BPL best-fit parameters are suitable following the Avni [100] methodology. After the rejection process, we are left with 18 GRBs that present a plateau and clear break in the light curve.
The luminosity in units of erg is computed at time using the equation:
where is the observed flux at , is defined as in Equation (3), and K is the k-correction:
with as the radio spectral index and as the fitted BPL temporal index before the break. values are taken from Chandra and Frail [80] or other literature—if no value could be found, the average of published spectral indices, , was assigned. We show the distribution of spectral indices for the plateau sample in Figure 1.
2.2. Limiting Fluxes, Fluences, and Times
The EP method can overcome selection bias for a particular variable of interest, but it must first be determined if the variable is dependent or independent of redshift.
It is then necessary to define limiting values for each of the variables. In Dainotti et al. [7], it was demonstrated that a good choice of limiting times and luminosities retains at least 90% of the total sample. For time variables, and (in units of seconds), we define a general form for the limiting values as , where is the minimum observed time. We need to choose a compromise between a limit which is representative of the population of data points, but still retains most of the sample size. It has been shown in Monte Carlo simulations in [7] that such a strategy with limiting values is accurate. For , we find the best limiting duration to be s, with a limiting boundary defined as s, which excludes 5/80 (<) GRBs. The limiting line for is shifted at a higher value to be allow the sample data to be representative of the whole population. For , we find the limiting time to be the observed minimum s, thus defining the boundary as s, which does not exclude any data points.
For the isotropic energy, we instead define the limiting energy according to the methodology of Dainotti et al. [7], in which the limiting fluence should be representative of the population while including at least of the sample. We use the following formula:
where is the fluence limit. For our sample, we define as 6.3 × erg . Applying this limit excludes 8/80 GRBs, which is 10% of our sample. In all the method described here we use GRBs that have , , , and . For the luminosity, however, a caveat should be posed when we consider the total distribution of the parent population of GRBs with and without redshift (see [48]).
Using the method presented in Dainotti et al. [48], we compare the parent sample of all GRBs with observed radio afterglow and known peak flux to a smaller “subsample" of GRBs with known peak flux and known redshift. We then apply cuts to the data by defining limiting fluxes at regular intervals. Considering only the data with values above the limiting fluxes, fluences and time, we conduct a two-sample Kolmogorov–Smirnov (KS) test between the data of the total sample and the data for which the limiting cuts have been applied to determine the distribution of the probability that the subsample was drawn from the parent sample, as well as the geometric distance between the two samples as determined by the KS test. We take the limiting flux to be the value of where the probability as a function of limiting flux reaches a plateau in which the probability that two samples are drawn by the same population is 100%. In our sample, we find this limit to be . We define the flux throughout our analysis in units of erg s.
2.3. Removing Selection Bias and Redshift Evolution
After defining the limiting lines, we can then mimic the evolution of this variable with redshift using a simpler function of redshift, . We here adopt the choice of a simple function, but in principle it is possible to use a more complex function as already shown in [77] and obtain compatible results. Using a modified version of Kendall’s statistics, we can compute an evolutionary function where the slope of the function is defined by . The values for where represent the removal of evolutionary effects. We define errors on out to 1 , corresponding to the values where .
3. Results
We here clarify that the purpose of our analysis is to show how similar our results are, compared to other ones in the literature given that our sample size differs from other studies for and (our sample has 80 GRBs), while this is the first time in the literature that we compare the results for the and (our sample has 18 GRBs) with the previous results in the literature performed in X-rays and optical. This is an essential comparison to allow the determination of the intrinsic nature of the and correlation and to check for the universality of the results related to the evolutionary functions for these variables with the EP method.
Using the procedure outlined above, we correct , using the formulation and , where all quantities that have symbol are the variables for which the evolution has been removed, thus they are no longer dependent on the redshift. We find , with the 1 errors defined as the average of the values of and , and . Figure 3 shows these results—the top left panel shows for the sample of 80 GRBs as a function of redshift, with the limiting value shown in red. The top right panel highlights the evolutionary function for , with dashed lines at . The same plots for are shown in the bottom panels.
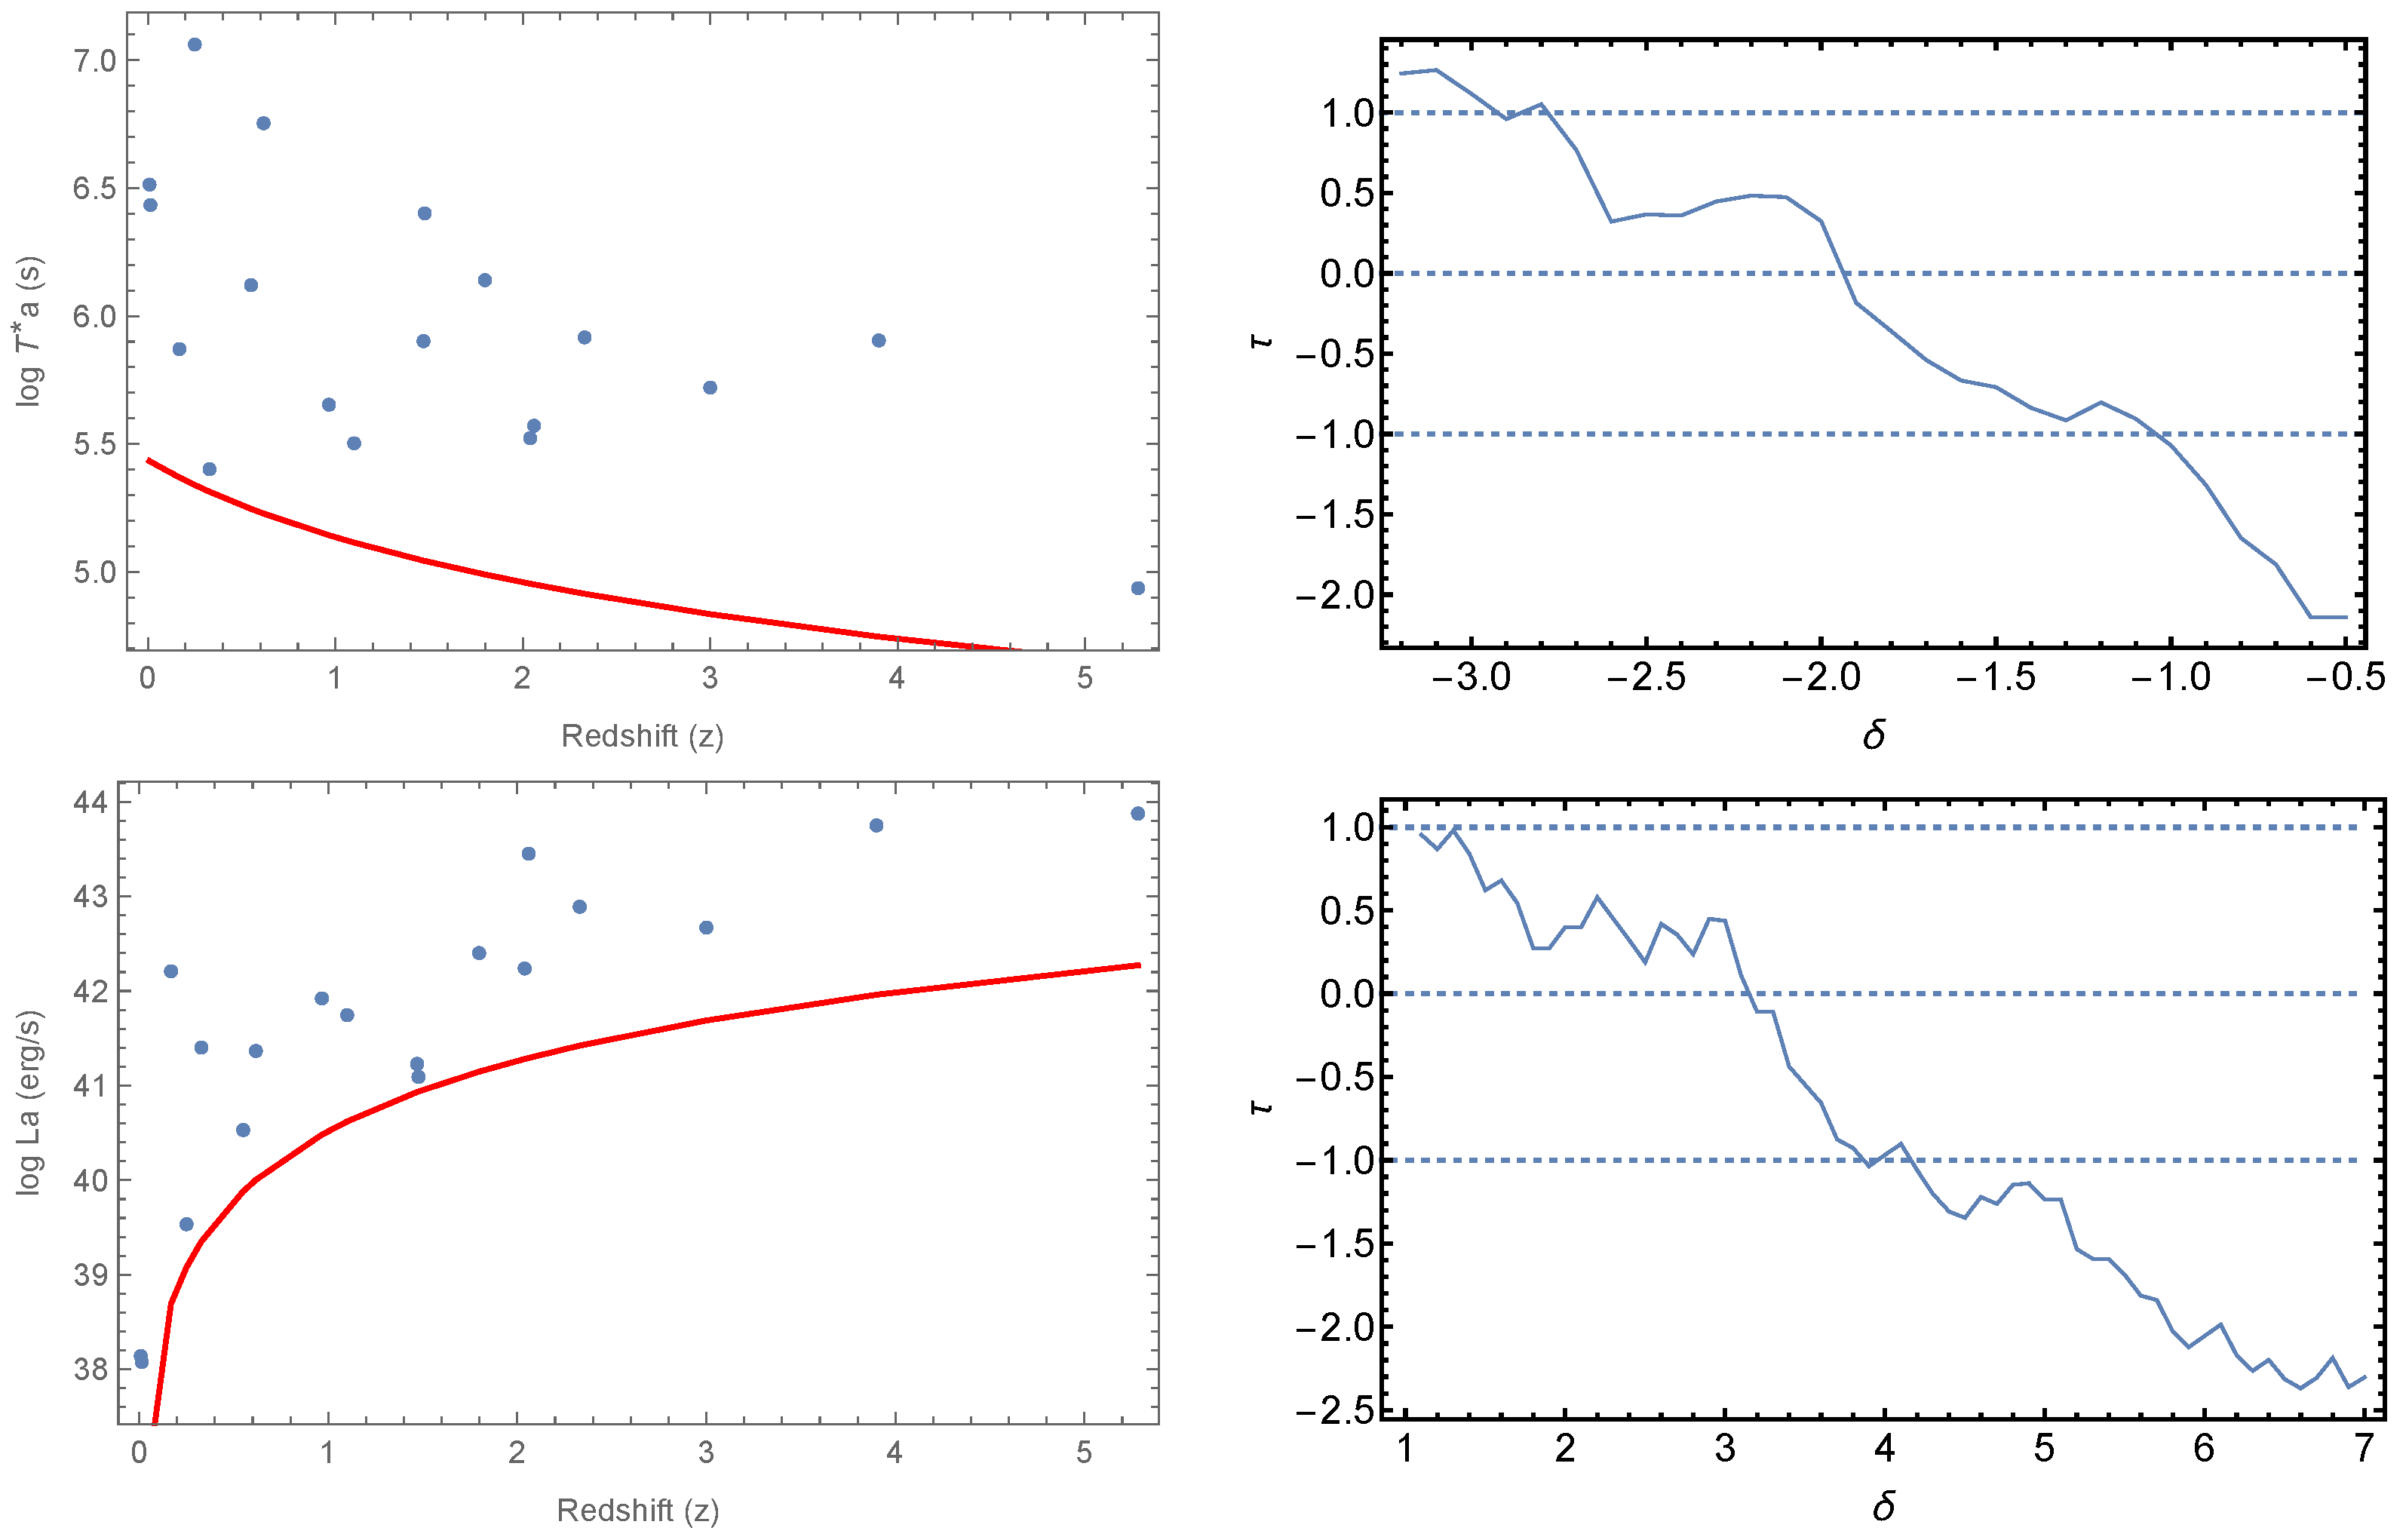
For the plateau sample of 18 GRBs, we use the same formulation to obtain and . We find the values of for and as and . These results are shown in Figure 4— as a function of redshift is shown in the top left panel, with the limiting values in red. The evolutionary function is shown in the top right panel, with dashed blue lines at . The bottom two panels display the same plots for .
4. Discussion and Conclusions
Using a sample of 80 GRBs with observed radio afterglow, we test the use of the EP method on and for a subsample 80 GRBs, and on and for a subsample of 18 GRBs. We find that when considering and , we obtain indices for the parameter of redshift evolution, , of and , while the values of for and are as and .
For , for , and , we find relatively strong evolution of each variable with redshift. The luminosity presents the strongest correlation with redshift, emphasizing the necessity of correction for these effects before using data in correlation analysis. , by contrast, appears to be the most independent from redshift, with the smallest value for .
We find that our values are comparable to values obtained in previous studies. A study by Lloyd-Ronning et al. [46] of the cosmological evolution of isotropic energy , burst duration , jet opening angle , and luminosity reports values compatible with our findings and within 1 , and values compatible with our within approximately 2 . Specifically, they find a value of , which agrees with our value of within 2.17 . We also see agreement with , with a 0.55 difference from our value of , and in the luminosity with , a 0.2 difference from our value of .
These results also agree with previous values of for and in X-ray and optical wavelengths. Dainotti et al. [7] conduct a similar analysis of the luminosity and rest-frame end time of the plateau emission using X-ray data. Their value for correction for , reported as , is compatible with our value of within 1.23 . However, they find a very slow evolution in luminosity, with a value of , which is a 1.94 difference from our value of . This discrepancy is likely due in part to the small sample size, which may exaggerate the extent of the evolution present in our sample, but may also be due to differences in the behavior of the X-ray and radio emission.
We have corrected the luminosity and time in X-rays with 222 GRB lightcurves with a given redshift, presenting plateaus according the Willingale et al. [23] model and in optical with 181 GRBs with plateaus taken from Dainotti et al. [50], but with the additional analysis of 80 GRBs found in the literature. For tackling this analysis, we followed the same procedure described in the current paper. The results of this analysis reports , and , which is a 0.44 difference from our value. They also report values in optical of and , which both agree with our result within 1 .
In general, it can be seen that a larger sample size is preferred when applying the EP method. In our case, for the sample pertinent to , and we choose the limiting values while excluding of the overall sample. However, for the smaller sample of 18 plateau GRBs, the limiting values are chosen so that we do not exclude any data points due to the small sample size. In addition, this conservative choice would allow us to have smaller error bars on the slope of the evolutionary functions. However, the values obtained for and are similar to values found in previous studies of larger sample sizes, thus indicating that the EP method is still successful even with a small dataset.
GRB correlations in radio afterglows related to the plateau emission are crucial to understand if the jet break is coincident with the end of the plateau emission. To investigate this point, a multiwavelength analysis not only in optical and X-rays must be performed together with the radio data. Since the evolution of the variables with redshift can change the time at which the break happens, it is crucially important to correct for the redshift evolution. This study is also the preliminary step to the investigation of the intrinsic nature of the plateau emission correlations.
After our analysis on the radio observations both for the prompt emission in relation to the variables of and and for the afterglow emission in relation to , , we can conclude:
- 1.
- After testing intrinsic properties of a GRB, such as and , as well as properties such as and , we see , and present strong correlation with redshift, thus indicating that they are susceptible to redshift evolution.
- 2.
- The values obtained in this work agree with those of previous studies, indicating that this trend of strong correlation with redshift still holds true in radio wavelengths.
- 3.
- The study of these evolutionary functions is the first necessary step to determine the true intrinsic nature of the correlations, object of our study.
Author Contributions
Conceptualization: M.D.; Methodology: M.D.; Software: M.D.; Validation: M.D. and D.L.; Formal Analysis: D.L.; Investigation, D.L. and M.D.; Data Curation: P.C.; Writing—Original Draft Preparation: D.L.; Writing—Review and Editing Draft: M.D., N.F. and D.L.; Supervision: M.D. and N.F. All authors have read and agreed to the published version of the manuscript.
Funding
This research was funded by the National Astronomical Observatory of Japan (NAOJ).
Institutional Review Board Statement
Not applicable.
Informed Consent Statement
Not applicable.
Data Availability Statement
The data are taken from Chandra and Frail [80], Zauderer et al. [81], Laskar et al. [82,83], Cucchiara et al. [84], Bright et al. [85], Anderson et al. [86], Singer et al. [87], Laskar et al. [88], Kangas et al. [89], Laskar et al. [90], Chen et al. [91], Bhalerao et al. [92], Hallinan et al. [93], Mooley et al. [94], Resmi et al. [95], Margutti et al. [96], Maity and Chandra [97] and Rhodes et al. [98].
Acknowledgments
This work was made possible in part by the United States Department of Energy, Office of Science, Office of Workforce Development for Teachers and Scientists (WDTS) under the Science Undergraduate Laboratory Internships (SULI) program. We thank Cuellar for managing the SULI program at Stanford National Accelerator Laboratory. We also acknowledge the National Astronomical Observatory of Japan for their support in making this research possible, as well as Kevin J. Zvonarek for his help in preparing the dataset in this work. NF acknowledges financial support from UNAM-DGAPA-PAPIIT through grant IN106521. D. Levine acknowledges support from NAOJ division of Science.
Conflicts of Interest
The authors declare no conflict of interest. The founding sponsors had no role in the design of the study; in the collection, analyses, or interpretation of data; in the writing of the manuscript, and in the decision to publish the results.
References
- Cucchiara, A.; Levan, A.J.; Fox, D.B.; Tanvir, N.R.; Ukwatta, T.N.; Berger, E.; Krühler, T.; Küpcü Yoldaş, A.; Wu, X.F.; Toma, K.; et al. A Photometric Redshift of z~9.4 for GRB 090429B. Astrophys. J. 2011, 736, 7. [Google Scholar] [CrossRef] [Green Version]
- Cardone, V.F.; Capozziello, S.; Dainotti, M.G. An updated gamma-ray bursts Hubble diagram. Mon. Not. R. Astron. Soc. 2009, 400, 775–790. [Google Scholar] [CrossRef]
- Salvaterra, R.; Della Valle, M.; Campana, S.; Chincarini, G.; Covino, S.; D’Avanzo, P.; Fernández-Soto, A.; Guidorzi, C.; Mannucci, F.; Margutti, R.; et al. GRB090423 at a redshift of z~8.1. Nature 2009, 461, 1258–1260. [Google Scholar] [CrossRef] [PubMed] [Green Version]
- Tanvir, N.R.; Fox, D.B.; Levan, A.J.; Berger, E.; Wiersema, K.; Fynbo, J.P.U.; Cucchiara, A.; Krühler, T.; Gehrels, N.; Bloom, J.S.; et al. A γ-ray burst at a redshift of z~8.2. Nature 2009, 461, 1254–1257. [Google Scholar] [CrossRef] [Green Version]
- Cardone, V.F.; Dainotti, M.G.; Capozziello, S.; Willingale, R. Constraining cosmological parameters by gamma-ray burst X-ray afterglow light curves. Mon. Not. R. Astron. Soc. 2010, 408, 1181–1186. [Google Scholar] [CrossRef] [Green Version]
- Postnikov, S.; Dainotti, M.G.; Hernandez, X.; Capozziello, S. Nonparametric Study of the Evolution of the Cosmological Equation of State with SNeIa, BAO, and High-redshift GRBs. Astrophys. J. 2014, 783, 126. [Google Scholar] [CrossRef]
- Dainotti, M.G.; Petrosian, V.; Singal, J.; Ostrowski, M. Determination of the Intrinsic Luminosity Time Correlation in the X-ray Afterglows of Gamma-ray Bursts. Astrophys. J. 2013, 774, 157. [Google Scholar] [CrossRef] [Green Version]
- Littlejohns, O.M.; Tanvir, N.R.; Willingale, R.; Evans, P.A.; O’Brien, P.T.; Levan, A.J. Are gamma-ray bursts the same at high redshift and low redshift? Mon. Not. R. Astron. Soc. 2013, 436, 3640–3655. [Google Scholar] [CrossRef] [Green Version]
- Laskar, T.; Berger, E.; Tanvir, N.; Zauderer, B.A.; Margutti, R.; Levan, A.; Perley, D.; Fong, W.F.; Wiersema, K.; Menten, K.; et al. GRB 120521C at z~6 and the Properties of High-redshift γ-Ray Bursts. Astrophys. J. 2014, 781, 1. [Google Scholar] [CrossRef] [Green Version]
- McGuire, J.T.W.; Tanvir, N.R.; Levan, A.J.; Trenti, M.; Stanway, E.R.; Shull, J.M.; Wiersema, K.; Perley, D.A.; Starling, R.L.C.; Bremer, M.; et al. Detection of Three Gamma-ray Burst Host Galaxies at z~6. Astrophys. J. 2016, 825, 135. [Google Scholar] [CrossRef] [Green Version]
- Tanvir, N.R.; Laskar, T.; Levan, A.J.; Perley, D.A.; Zabl, J.; Fynbo, J.P.U.; Rhoads, J.; Cenko, S.B.; Greiner, J.; Wiersema, K.; et al. The Properties of GRB 120923A at a Spectroscopic Redshift of z≈7.8. Astrophys. J. 2018, 865, 107. [Google Scholar] [CrossRef] [Green Version]
- Gehrels, N.; Razzaque, S. Gamma-ray bursts in the swift-Fermi era. Front. Phys. 2013, 8, 661–678. [Google Scholar] [CrossRef] [Green Version]
- Norris, J.P.; Bonnell, J.T. Short Gamma-ray Bursts with Extended Emission. Astrophys. J. 2006, 643, 266–275. [Google Scholar] [CrossRef]
- Norris, J.P.; Gehrels, N.; Scargle, J.D. Heterogeneity in Short Gamma-ray Bursts. Astrophys. J. 2011, 735, 23. [Google Scholar] [CrossRef]
- Woosley, S.E. Gamma-ray Bursts from Stellar Mass Accretion Disks around Black Holes. Astrophys. J. 1993, 405, 273. [Google Scholar] [CrossRef]
- Paczyński, B. Are Gamma-ray Bursts in Star-Forming Regions? Astrophys. J. 1998, 494, L45–L48. [Google Scholar] [CrossRef] [Green Version]
- Usov, V.V. Millisecond pulsars with extremely strong magnetic fields as a cosmological source of gamma-ray bursts. Nature 1992, 357, 472–474. [Google Scholar] [CrossRef]
- Duncan, R.C.; Thompson, C. Formation of Very Strongly Magnetized Neutron Stars: Implications for Gamma-ray Bursts. Astrophys. J. 1992, 392, L9. [Google Scholar] [CrossRef]
- Metzger, B.D.; Giannios, D.; Thompson, T.A.; Bucciantini, N.; Quataert, E. The protomagnetar model for gamma-ray bursts. Mon. Not. R. Astron. Soc. 2011, 413, 2031–2056. [Google Scholar] [CrossRef] [Green Version]
- Gehrels, N.; Chincarini, G.; Giommi, P.; Mason, K.O.; Nousek, J.A.; Wells, A.A.; White, N.E.; Barthelmy, S.D.; Burrows, D.N.; Cominsky, L.R.; et al. The Swift Gamma-ray Burst Mission. Astrophys. J. 2004, 611, 1005–1020. [Google Scholar] [CrossRef] [Green Version]
- Sakamoto, T.; Hill, J.E.; Yamazaki, R.; Angelini, L.; Krimm, H.A.; Sato, G.; Swindell, S.; Takami, K.; Osborne, J.P. Evidence of Exponential Decay Emission in the Swift Gamma-ray Bursts. Astrophys. J. 2007, 669, 1115–1129. [Google Scholar] [CrossRef] [Green Version]
- O’Brien, P.T.; Willingale, R.; Osborne, J.; Goad, M.R.; Page, K.L.; Vaughan, S.; Rol, E.; Beardmore, A.; Godet, O.; Hurkett, C.P.; et al. The Early X-ray Emission from GRBs. Astrophys. J. 2006, 647, 1213–1237. [Google Scholar] [CrossRef] [Green Version]
- Willingale, R.; O’Brien, P.T.; Osborne, J.P.; Godet, O.; Page, K.L.; Goad, M.R.; Burrows, D.N.; Zhang, B.; Rol, E.; Gehrels, N.; et al. Testing the Standard Fireball Model of Gamma-ray Bursts Using Late X-ray Afterglows Measured by Swift. Astrophys. J. 2007, 662, 1093–1110. [Google Scholar] [CrossRef] [Green Version]
- Pe’er, A. Physics of Gamma-ray Bursts Prompt Emission. Adv. Astron. 2015, 2015, 907321. [Google Scholar] [CrossRef] [Green Version]
- Yonetoku, D.; Murakami, T.; Nakamura, T.; Yamazaki, R.; Inoue, A.K.; Ioka, K. Gamma-ray Burst Formation Rate Inferred from the Spectral Peak Energy-Peak Luminosity Relation. Astrophys. J. 2004, 609, 935–951. [Google Scholar] [CrossRef] [Green Version]
- Dai, Z.G.; Wang, F.Y. Recent progress on GRB cosmology. Adv. Space Res. 2007, 40, 1244–1249. [Google Scholar] [CrossRef]
- Ghirlanda, G. Gamma-ray bursts spectral correlations and their cosmological use. Philos. Trans. R. Soc. Lond. Ser. A 2007, 365, 1385–1394. [Google Scholar] [CrossRef] [PubMed]
- Dainotti, M.G.; Cardone, V.F.; Capozziello, S. A time-luminosity correlation for γ-ray bursts in the X-rays. Mon. Not. R. Astron. Soc. 2008, 391, L79–L83. [Google Scholar] [CrossRef]
- Amati, L.; Guidorzi, C.; Frontera, F.; Della Valle, M.; Finelli, F.; Landi, R.; Montanari, E. Measuring the cosmological parameters with the Ep,i − Eiso correlation of gamma-ray bursts. Mon. Not. R. Astron. Soc. 2008, 391, 577–584. [Google Scholar] [CrossRef] [Green Version]
- Dainotti, M.G.; Willingale, R.; Capozziello, S.; Fabrizio Cardone, V.; Ostrowski, M. Discovery of a Tight Correlation for Gamma-ray Burst Afterglows with “Canonical” Light Curves. Astrophys. J. 2010, 722, L215–L219. [Google Scholar] [CrossRef] [Green Version]
- Dainotti, M.G.; Fabrizio Cardone, V.; Capozziello, S.; Ostrowski, M.; Willingale, R. Study of Possible Systematics in the L*X-T*a Correlation of Gamma-ray Bursts. Astrophys. J. 2011, 730, 135. [Google Scholar] [CrossRef] [Green Version]
- Dainotti, M.G.; Ostrowski, M.; Willingale, R. Towards a standard gamma-ray burst: Tight correlations between the prompt and the afterglow plateau phase emission. Mon. Not. R. Astron. Soc. 2011, 418, 2202–2206. [Google Scholar] [CrossRef]
- Dainotti, M.G.; Postnikov, S.; Hernandez, X.; Ostrowski, M. A Fundamental Plane for Long Gamma-ray Bursts with X-ray Plateaus. Astrophys. J. 2016, 825, L20. [Google Scholar] [CrossRef] [Green Version]
- Dainotti, M.G.; Nagataki, S.; Maeda, K.; Postnikov, S.; Pian, E. A study of gamma ray bursts with afterglow plateau phases associated with supernovae. Astron. Astrophys. 2017, 600, A98. [Google Scholar] [CrossRef]
- Dainotti, M. Gamma-ray Burst Correlations: Current Status and Open Questions; IOP Publishing Ltd.: Bristol, UK, 2019. [Google Scholar] [CrossRef]
- Kocevski, D.; Butler, N.; Bloom, J.S. Pulse Width Evolution of Late-Time X-ray Flares in Gamma-ray Bursts. Astrophys. J. 2007, 667, 1024–1032. [Google Scholar] [CrossRef]
- Shahmoradi, A.; Nemiroff, R.J. The possible impact of gamma-ray burst detector thresholds on cosmological standard candles. Mon. Not. R. Astron. Soc. 2011, 411, 1843–1856. [Google Scholar] [CrossRef] [Green Version]
- Shahmoradi, A.; Nemiroff, R.J. Short versus long gamma-ray bursts: A comprehensive study of energetics and prompt gamma-ray correlations. Mon. Not. R. Astron. Soc. 2015, 451, 126–143. [Google Scholar] [CrossRef] [Green Version]
- Coward, D.M.; Howell, E.J.; Wan, L.; MacPherson, D. Selection biases in the gamma-ray burst Eiso-Lopt, X correlation. Mon. Not. R. Astron. Soc. 2015, 449, L6–L10. [Google Scholar] [CrossRef] [Green Version]
- Dainotti, M.G.; Cardone, V.F.; Piedipalumbo, E.; Capozziello, S. Slope evolution of GRB correlations and cosmology. Mon. Not. R. Astron. Soc. 2013, 436, 82–88. [Google Scholar] [CrossRef] [Green Version]
- Efron, B.; Petrosian, V. A Simple Test of Independence for Truncated Data with Applications to Redshift Surveys. Astrophys. J. 1992, 399, 345. [Google Scholar] [CrossRef]
- Lynden-Bell, D. A method of allowing for known observational selection in small samples applied to 3CR quasars. Mon. Not. R. Astron. Soc. 1971, 155, 95. [Google Scholar] [CrossRef]
- Efron, B.; Petrosian, V. Nonparametric Methods for Doubly Truncated Data. arXiv 1998, arXiv:astro-ph/9808334. [Google Scholar] [CrossRef]
- Lloyd, N.M.; Petrosian, V.; Mallozzi, R.S. Cosmological versus Intrinsic: The Correlation between Intensity and the Peak of the νFν Spectrum of Gamma-ray Bursts. Astrophys. J. 2000, 534, 227–238. [Google Scholar] [CrossRef] [Green Version]
- Singal, J.; Petrosian, V.; Lawrence, A.; Stawarz, Ł. On the Radio and Optical Luminosity Evolution of Quasars. Astrophys. J. 2011, 743, 104. [Google Scholar] [CrossRef]
- Lloyd-Ronning, N.M.; Aykutalp, A.; Johnson, J.L. On the cosmological evolution of long gamma-ray burst properties. Mon. Not. R. Astron. Soc. 2019, 488, 5823–5832. [Google Scholar] [CrossRef] [Green Version]
- Lloyd-Ronning, N.; Hurtado, V.U.; Aykutalp, A.; Johnson, J.; Ceccobello, C. The evolution of gamma-ray burst jet opening angle through cosmic time. Mon. Not. R. Astron. Soc. 2020, 494, 4371–4381. [Google Scholar] [CrossRef]
- Dainotti, M.G.; Petrosian, V.; Bowden, L. Cosmological Evolution of the Formation Rate of Short Gamma-ray Bursts with and without Extended Emission. Astrophys. J. 2021, 914, L40. [Google Scholar] [CrossRef]
- Amati, L.; Frontera, F.; Tavani, M.; In’t Zand, J.J.M.; Antonelli, A.; Costa, E.; Feroci, M.; Guidorzi, C.; Heise, J.; Masetti, N.; et al. Intrinsic spectra and energetics of BeppoSAX Gamma-ray Bursts with known redshifts. Astron. Astrophys. 2002, 390, 81–89. [Google Scholar] [CrossRef]
- Dainotti, M.G.; Livermore, S.; Kann, D.A.; Li, L.; Oates, S.; Yi, S.; Zhang, B.; Gendre, B.; Cenko, B.; Fraija, N. The Optical Luminosity-Time Correlation for More than 100 Gamma-ray Burst Afterglows. Astrophys. J. 2020, 905, L26. [Google Scholar] [CrossRef]
- Dainotti, M.G.; Del Vecchio, R. Gamma ray Burst afterglow and prompt-afterglow relations: An overview. nar 2017, 77, 23–61. [Google Scholar] [CrossRef] [Green Version]
- Dainotti, M.G.; Del Vecchio, R.; Tarnopolski, M. Gamma-ray Burst Prompt Correlations. Adv. Astron. 2018, 2018, 4969503. [Google Scholar] [CrossRef]
- Dainotti, M.G.; Amati, L. Gamma-ray Burst Prompt Correlations: Selection and Instrumental Effects. Adv. Astron. 2018, 130, 051001. [Google Scholar] [CrossRef] [Green Version]
- Titarchuk, L.; Farinelli, R.; Frontera, F.; Amati, L. An Upscattering Spectral Formation Model for the Prompt Emission of Gamma-ray Bursts. Astrophys. J. 2012, 752, 116. [Google Scholar] [CrossRef] [Green Version]
- Beloborodov, A.M.; Mészáros, P. Photospheric Emission of Gamma-ray Bursts. Space Sci. Rev. 2017, 207, 87–110. [Google Scholar] [CrossRef] [Green Version]
- Dereli-Bégué, H.; Pe’er, A.; Ryde, F. Classification of Photospheric Emission in Short GRBs. Astrophys. J. 2020, 897, 145. [Google Scholar] [CrossRef]
- Toma, K.; Wu, X.F.; Mészáros, P. Photosphere-internal shock model of gamma-ray bursts: Case studies of Fermi/LAT bursts. Mon. Not. R. Astron. Soc. 2011, 415, 1663–1680. [Google Scholar] [CrossRef]
- Zheng, Z.; Lu, Y.; Zhao, Y.H. A Comptonization Model for the Prompt Optical and Infrared Emission of GRB 041219A. Astrophys. J. 2006, 646, L25–L28. [Google Scholar] [CrossRef] [Green Version]
- Ito, H.; Matsumoto, J.; Nagataki, S.; Warren, D.C.; Barkov, M.V.; Yonetoku, D. The photospheric origin of the Yonetoku relation in gamma-ray bursts. Nat. Commun. 2019, 10, 1504. [Google Scholar] [CrossRef] [Green Version]
- Ahlgren, B.; Larsson, J.; Nymark, T.; Ryde, F.; Pe’er, A. Confronting GRB prompt emission with a model for subphotospheric dissipation. Mon. Not. R. Astron. Soc. 2015, 454, L31–L35. [Google Scholar] [CrossRef]
- Ghirlanda, G.; Pescalli, A.; Ghisellini, G. Photospheric emission throughout GRB 100507 detected by Fermi. Mon. Not. R. Astron. Soc. 2013, 432, 3237–3244. [Google Scholar] [CrossRef] [Green Version]
- Ito, H.; Nagataki, S.; Matsumoto, J.; Lee, S.H.; Tolstov, A.; Mao, J.; Dainotti, M.; Mizuta, A. Spectral and Polarization Properties of Photospheric Emission from Stratified Jets. Astrophys. J. 2014, 789, 159. [Google Scholar] [CrossRef] [Green Version]
- Dall’Osso, S.; Stratta, G.; Guetta, D.; Covino, S.; De Cesare, G.; Stella, L. Gamma-ray bursts afterglows with energy injection from a spinning down neutron star. Astron. Astrophys. 2011, 526, A121. [Google Scholar] [CrossRef] [Green Version]
- Rowlinson, A.; O’Brien, P.T.; Metzger, B.D.; Tanvir, N.R.; Levan, A.J. Signatures of magnetar central engines in short GRB light curves. Mon. Not. R. Astron. Soc. 2013, 430, 1061–1087. [Google Scholar] [CrossRef] [Green Version]
- Fraija, N.; Veres, P.; Beniamini, P.; Galvan-Gamez, A.; Metzger, B.D.; Barniol Duran, R.; Becerra, R.L. On the Origin of the Multi-GeV Photons from the Closest Burst with Intermediate Luminosity: GRB 190829A. Astrophys. J. 2021, 918, 12. [Google Scholar] [CrossRef]
- Rowlinson, A.; Gompertz, B.P.; Dainotti, M.; O’Brien, P.T.; Wijers, R.A.M.J.; van der Horst, A.J. Constraining properties of GRB magnetar central engines using the observed plateau luminosity and duration correlation. Mon. Not. R. Astron. Soc. 2014, 443, 1779–1787. [Google Scholar] [CrossRef]
- Rea, N.; Gullón, M.; Pons, J.A.; Perna, R.; Dainotti, M.G.; Miralles, J.A.; Torres, D.F. Constraining the GRB-Magnetar Model by Means of the Galactic Pulsar Population. Astrophys. J. 2015, 813, 92. [Google Scholar] [CrossRef]
- Stratta, G.; Dainotti, M.G.; Dall’Osso, S.; Hernandez, X.; De Cesare, G. On the Magnetar Origin of the GRBs Presenting X-ray Afterglow Plateaus. Astrophys. J. 2018, 869, 155. [Google Scholar] [CrossRef] [Green Version]
- Dainotti, M.G.; Del Vecchio, R.; Shigehiro, N.; Capozziello, S. Selection Effects in Gamma-ray Burst Correlations: Consequences on the Ratio between Gamma-ray Burst and Star Formation Rates. Astrophys. J. 2015, 800, 31. [Google Scholar] [CrossRef] [Green Version]
- Dainotti, M.G.; Hernandez, X.; Postnikov, S.; Nagataki, S.; O’brien, P.; Willingale, R.; Striegel, S. A Study of the Gamma-ray Burst Fundamental Plane. Astrophys. J. 2017, 848, 88. [Google Scholar] [CrossRef]
- Dainotti, M.G.; Lenart, A.Ł.; Sarracino, G.; Nagataki, S.; Capozziello, S.; Fraija, N. The X-ray Fundamental Plane of the Platinum Sample, the Kilonovae, and the SNe Ib/c Associated with GRBs. Astrophys. J. 2020, 904, 97. [Google Scholar] [CrossRef]
- Dainotti, M.G.; De Simone, B.; Schiavone, T.; Montani, G.; Rinaldi, E.; Lambiase, G. On the Hubble Constant Tension in the SNe Ia Pantheon Sample. Astrophys. J. 2021, 912, 150. [Google Scholar] [CrossRef]
- Lloyd-Ronning, N.M.; Gompertz, B.; Pe’er, A.; Dainotti, M.; Fruchter, A. A Comparison between Radio Loud and Quiet Gamma-ray Bursts, and Evidence for a Potential Correlation between Intrinsic Duration and Redshift in the Radio Loud Population. Astrophys. J. 2019, 871, 118. [Google Scholar] [CrossRef]
- Bryant, C.M.; Osborne, J.A.; Shahmoradi, A. How unbiased statistical methods lead to biased scientific discoveries: A case study of the Efron-Petrosian statistic applied to the luminosity-redshift evolution of gamma-ray bursts. Mon. Not. R. Astron. Soc. 2021, 504, 4192–4203. [Google Scholar] [CrossRef]
- Piran, T. Gamma-ray bursts and the fireball model. Phys. Rep. 1999, 314, 575–667. [Google Scholar] [CrossRef] [Green Version]
- Sari, R.; Piran, T. GRB 990123: The Optical Flash and the Fireball Model. Astrophys. J. 1999, 517, L109–L112. [Google Scholar] [CrossRef] [Green Version]
- Dainotti, M.; Petrosian, V.; Willingale, R.; O’Brien, P.; Ostrowski, M.; Nagataki, S. Luminosity-time and luminosity-luminosity correlations for GRB prompt and afterglow plateau emissions. Mon. Not. R. Astron. Soc. 2015, 451, 3898–3908. [Google Scholar] [CrossRef] [Green Version]
- Petrosian, V.; Kitanidis, E.; Kocevski, D. Cosmological Evolution of Long Gamma-ray Bursts and the Star Formation Rate. Astrophys. J. 2015, 806, 44. [Google Scholar] [CrossRef] [Green Version]
- Lloyd-Ronning, N.M.; Petrosian, V. Interpreting the Behavior of Time-resolved Gamma-ray Burst Spectra. Astrophys. J. 2002, 565, 182–194. [Google Scholar] [CrossRef] [Green Version]
- Chandra, P.; Frail, D.A. A Radio-selected Sample of Gamma-ray Burst Afterglows. Astrophys. J. 2012, 746, 156. [Google Scholar] [CrossRef] [Green Version]
- Zauderer, B.A.; Berger, E.; Margutti, R.; Levan, A.J.; Olivares, E.F.; Perley, D.A.; Fong, W.; Horesh, A.; Updike, A.C.; Greiner, J.; et al. Illuminating the Darkest Gamma-ray Bursts with Radio Observations. Astrophys. J. 2013, 767, 161. [Google Scholar] [CrossRef] [Green Version]
- Laskar, T.; Berger, E.; Margutti, R.; Perley, D.; Zauderer, B.A.; Sari, R.; Fong, W.F. Energy Injection in Gamma-ray Burst Afterglows. Astrophys. J. 2015, 814, 1. [Google Scholar] [CrossRef]
- Laskar, T.; van Eerten, H.; Schady, P.; Mundell, C.G.; Alexander, K.D.; Barniol Duran, R.; Berger, E.; Bolmer, J.; Chornock, R.; Coppejans, D.L.; et al. A Reverse Shock in GRB 181201A. Astrophys. J. 2019, 884, 121. [Google Scholar] [CrossRef] [Green Version]
- Cucchiara, A.; Veres, P.; Corsi, A.; Cenko, S.B.; Perley, D.A.; Lien, A.; Marshall, F.E.; Pagani, C.; Toy, V.L.; Capone, J.I.; et al. Happy Birthday Swift: Ultra-long GRB 141121A and Its Broadband Afterglow. Astrophys. J. 2015, 812, 122. [Google Scholar] [CrossRef] [Green Version]
- Bright, J.S.; Horesh, A.; van der Horst, A.J.; Fender, R.; Anderson, G.E.; Motta, S.E.; Cenko, S.B.; Green, D.A.; Perrott, Y.; Titterington, D. A detailed radio study of the energetic, nearby, and puzzling GRB 171010A. Mon. Not. R. Astron. Soc. 2019, 486, 2721–2729. [Google Scholar] [CrossRef]
- Anderson, G.E.; van der Horst, A.J.; Staley, T.D.; Fender, R.P.; Wijers, R.A.M.J.; Scaife, A.M.M.; Rumsey, C.; Titterington, D.J.; Rowlinson, A.; Saunders, R.D.E. Probing the bright radio flare and afterglow of GRB 130427A with the Arcminute Microkelvin Imager. Mon. Not. R. Astron. Soc. 2014, 440, 2059–2065. [Google Scholar] [CrossRef] [Green Version]
- Singer, L.P.; Kasliwal, M.M.; Cenko, S.B.; Perley, D.A.; Anderson, G.E.; Anupama, G.C.; Arcavi, I.; Bhalerao, V.; Bue, B.D.; Cao, Y.; et al. The Needle in the 100 deg2 Haystack: Uncovering Afterglows of Fermi GRBs with the Palomar Transient Factory. Astrophys. J. 2015, 806, 52. [Google Scholar] [CrossRef] [Green Version]
- Laskar, T.; Berger, E.; Margutti, R.; Zauderer, B.A.; Williams, P.K.G.; Fong, W.F.; Sari, R.; Alexander, K.D.; Kamble, A. A VLA Study of High-redshift GRBs. II. The Complex Radio Afterglow of GRB 140304A: Shell Collisions and Two Reverse Shocks. Astrophys. J. 2018, 859, 134. [Google Scholar] [CrossRef] [Green Version]
- Kangas, T.; Fruchter, A.S.; Cenko, S.B.; Corsi, A.; de Ugarte Postigo, A.; Pe’er, A.; Vogel, S.N.; Cucchiara, A.; Gompertz, B.; Graham, J.; et al. The Late-time Afterglow Evolution of Long Gamma-ray Bursts GRB 160625B and GRB 160509A. Astrophys. J. 2020, 894, 43. [Google Scholar] [CrossRef]
- Laskar, T.; Alexander, K.D.; Berger, E.; Fong, W.F.; Margutti, R.; Shivvers, I.; Williams, P.K.G.; Kopač, D.; Kobayashi, S.; Mundell, C.; et al. A Reverse Shock in GRB 160509A. Astrophys. J. 2016, 833, 88. [Google Scholar] [CrossRef]
- Chen, W.J.; Urata, Y.; Huang, K.; Takahashi, S.; Petitpas, G.; Asada, K. Two-component Jets of GRB 160623A as Shocked Jet Cocoon Afterglow. Astrophys. J. 2020, 891, L15. [Google Scholar] [CrossRef]
- Bhalerao, V.; Kasliwal, M.M.; Bhattacharya, D.; Corsi, A.; Aarthy, E.; Adams, S.M.; Blagorodnova, N.; Cantwell, T.; Cenko, S.B.; Fender, R.; et al. A Tale of Two Transients: GW 170104 and GRB 170105A. Astrophys. J. 2017, 845, 152. [Google Scholar] [CrossRef] [Green Version]
- Hallinan, G.; Corsi, A.; Mooley, K.P.; Hotokezaka, K.; Nakar, E.; Kasliwal, M.M.; Kaplan, D.L.; Frail, D.A.; Myers, S.T.; Murphy, T.; et al. A radio counterpart to a neutron star merger. Science 2017, 358, 1579–1583. [Google Scholar] [CrossRef] [PubMed] [Green Version]
- Mooley, K.P.; Nakar, E.; Hotokezaka, K.; Hallinan, G.; Corsi, A.; Frail, D.A.; Horesh, A.; Murphy, T.; Lenc, E.; Kaplan, D.L.; et al. A mildly relativistic wide-angle outflow in the neutron-star merger event GW170817. Nature 2018, 554, 207–210. [Google Scholar] [CrossRef] [PubMed] [Green Version]
- Resmi, L.; Schulze, S.; Ishwara-Chandra, C.H.; Misra, K.; Buchner, J.; De Pasquale, M.; Sánchez-Ramírez, R.; Klose, S.; Kim, S.; Tanvir, N.R.; et al. Low-frequency View of GW170817/GRB 170817A with the Giant Metrewave Radio Telescope. Astrophys. J. 2018, 867, 57. [Google Scholar] [CrossRef] [Green Version]
- Margutti, R.; Alexander, K.D.; Xie, X.; Sironi, L.; Metzger, B.D.; Kathirgamaraju, A.; Fong, W.; Blanchard, P.K.; Berger, E.; MacFadyen, A.; et al. The Binary Neutron Star Event LIGO/Virgo GW170817 160 Days after Merger: Synchrotron Emission across the Electromagnetic Spectrum. Astrophys. J. 2018, 856, L18. [Google Scholar] [CrossRef] [Green Version]
- Maity, B.; Chandra, P. 1000 Days of the Lowest-frequency Emission from the Low-luminosity GRB 171205A. Astrophys. J. 2021, 907, 60. [Google Scholar] [CrossRef]
- Rhodes, L.; van der Horst, A.J.; Fender, R.; Monageng, I.M.; Anderson, G.E.; Antoniadis, J.; Bietenholz, M.F.; Böttcher, M.; Bright, J.S.; Green, D.A.; et al. Radio afterglows of very high-energy gamma-ray bursts 190829A and 180720B. Mon. Not. R. Astron. Soc. 2020, 496, 3326–3335. [Google Scholar] [CrossRef]
- Bloom, J.S.; Frail, D.A.; Sari, R. The Prompt Energy Release of Gamma-ray Bursts using a Cosmological [ITAL]k[/ITAL]-Correction. Astron. J. 2001, 121, 2879–2888. [Google Scholar] [CrossRef]
- Avni, Y. Parameter estimation for X-ray sources: Positions. Astron. Astrophys. 1978, 66, 307–309. [Google Scholar]
Figure 1.
Distribution of spectral indices () for sample of 18 GRBs that display a plateau in their light curve.
Figure 1.
Distribution of spectral indices () for sample of 18 GRBs that display a plateau in their light curve.
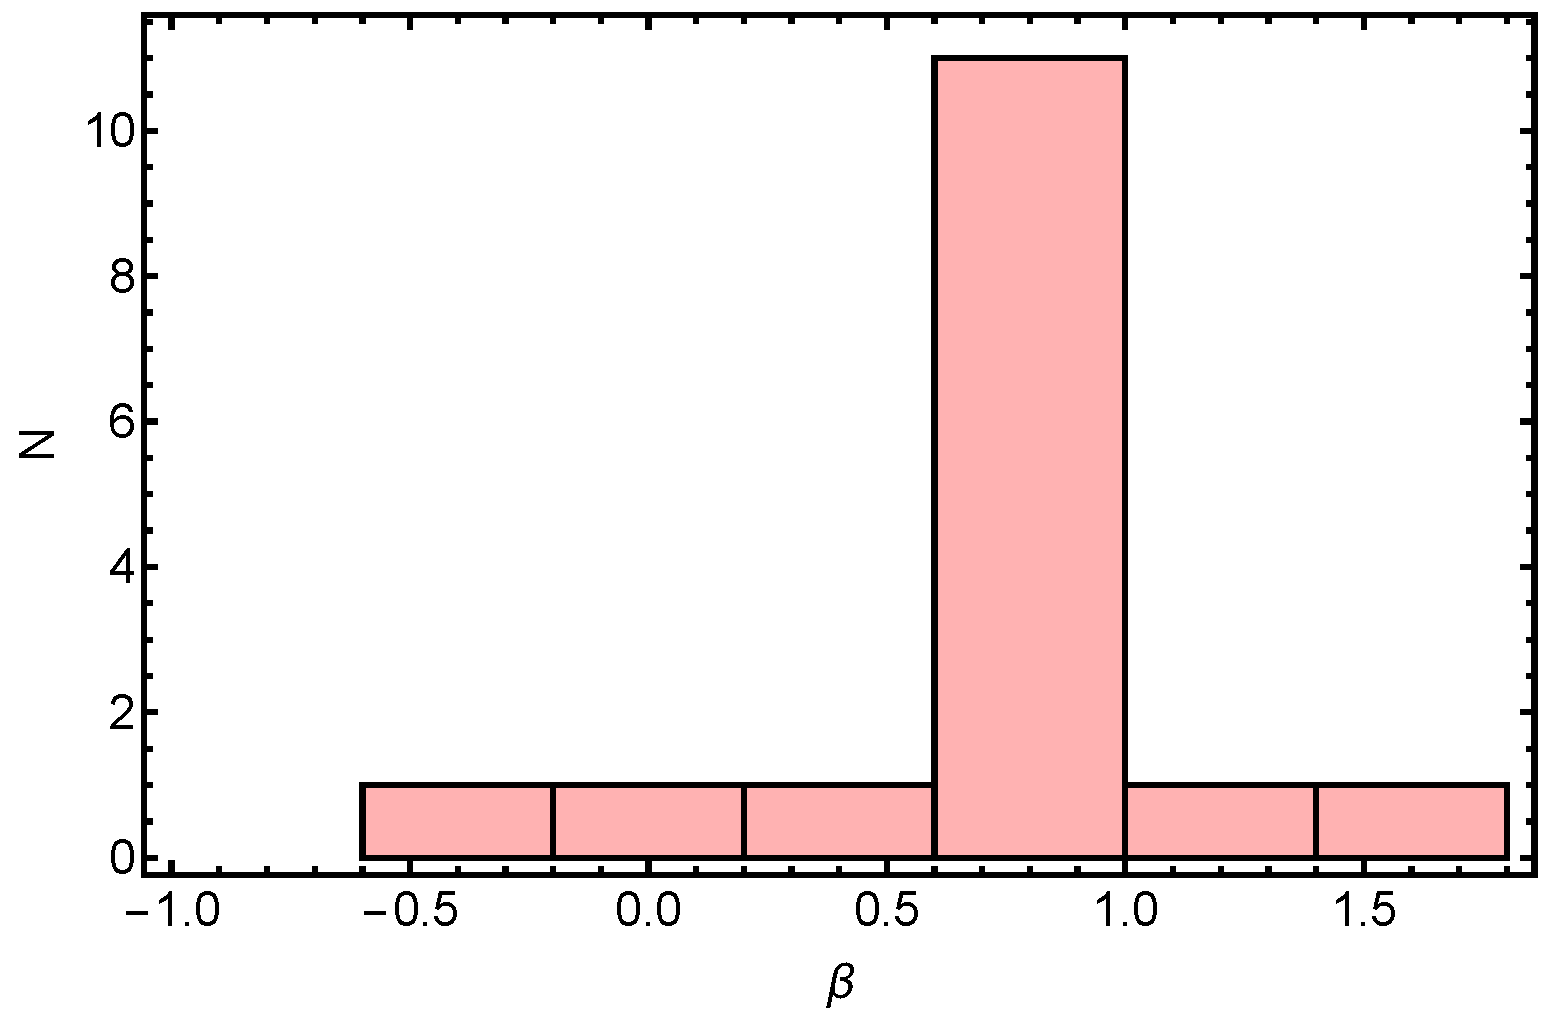
Figure 2.
(Left): peak flux distribution for “parent” sample and subsample with known redshift. Limiting flux shown in red. (Right): plot of probability (blue) and distance between samples as given by the KS test (orange) as a function of flux limit. Limiting line shown in red.
Figure 2.
(Left): peak flux distribution for “parent” sample and subsample with known redshift. Limiting flux shown in red. (Right): plot of probability (blue) and distance between samples as given by the KS test (orange) as a function of flux limit. Limiting line shown in red.
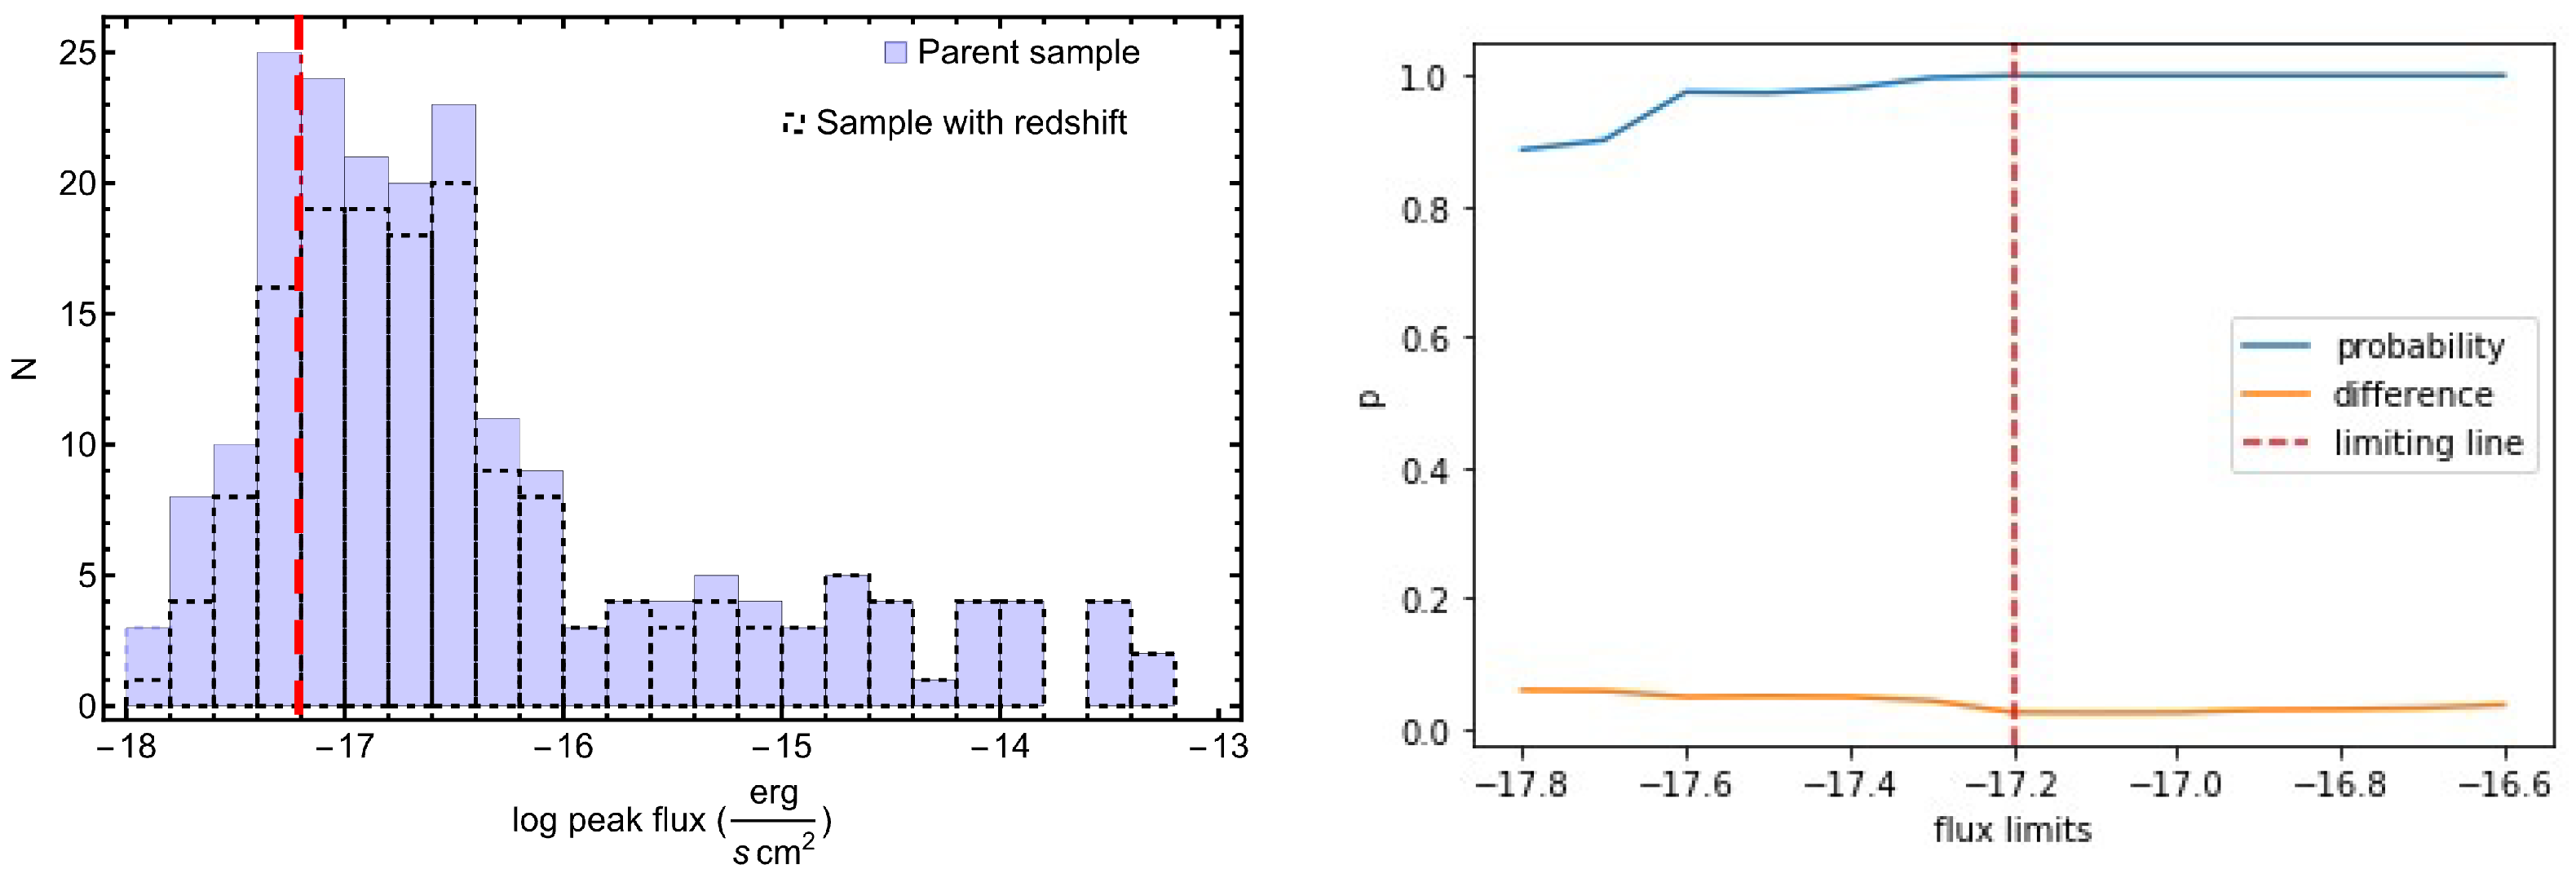
Figure 3.
The (upper left) panel shows the values of vs. redshift in blue and the limiting in the rest-frame in red. The (upper right) panel shows the Kendall vs. the slope of the evolutionary function with 1 errors shown with dashed blue lines. As with the upper panels, the (lower left) panel shows values of vs. redshift in blue with the limiting line in red, and the (right) panel shows the Kendall vs. slope of the evolutionary function with 1 errors as dashed blue lines.
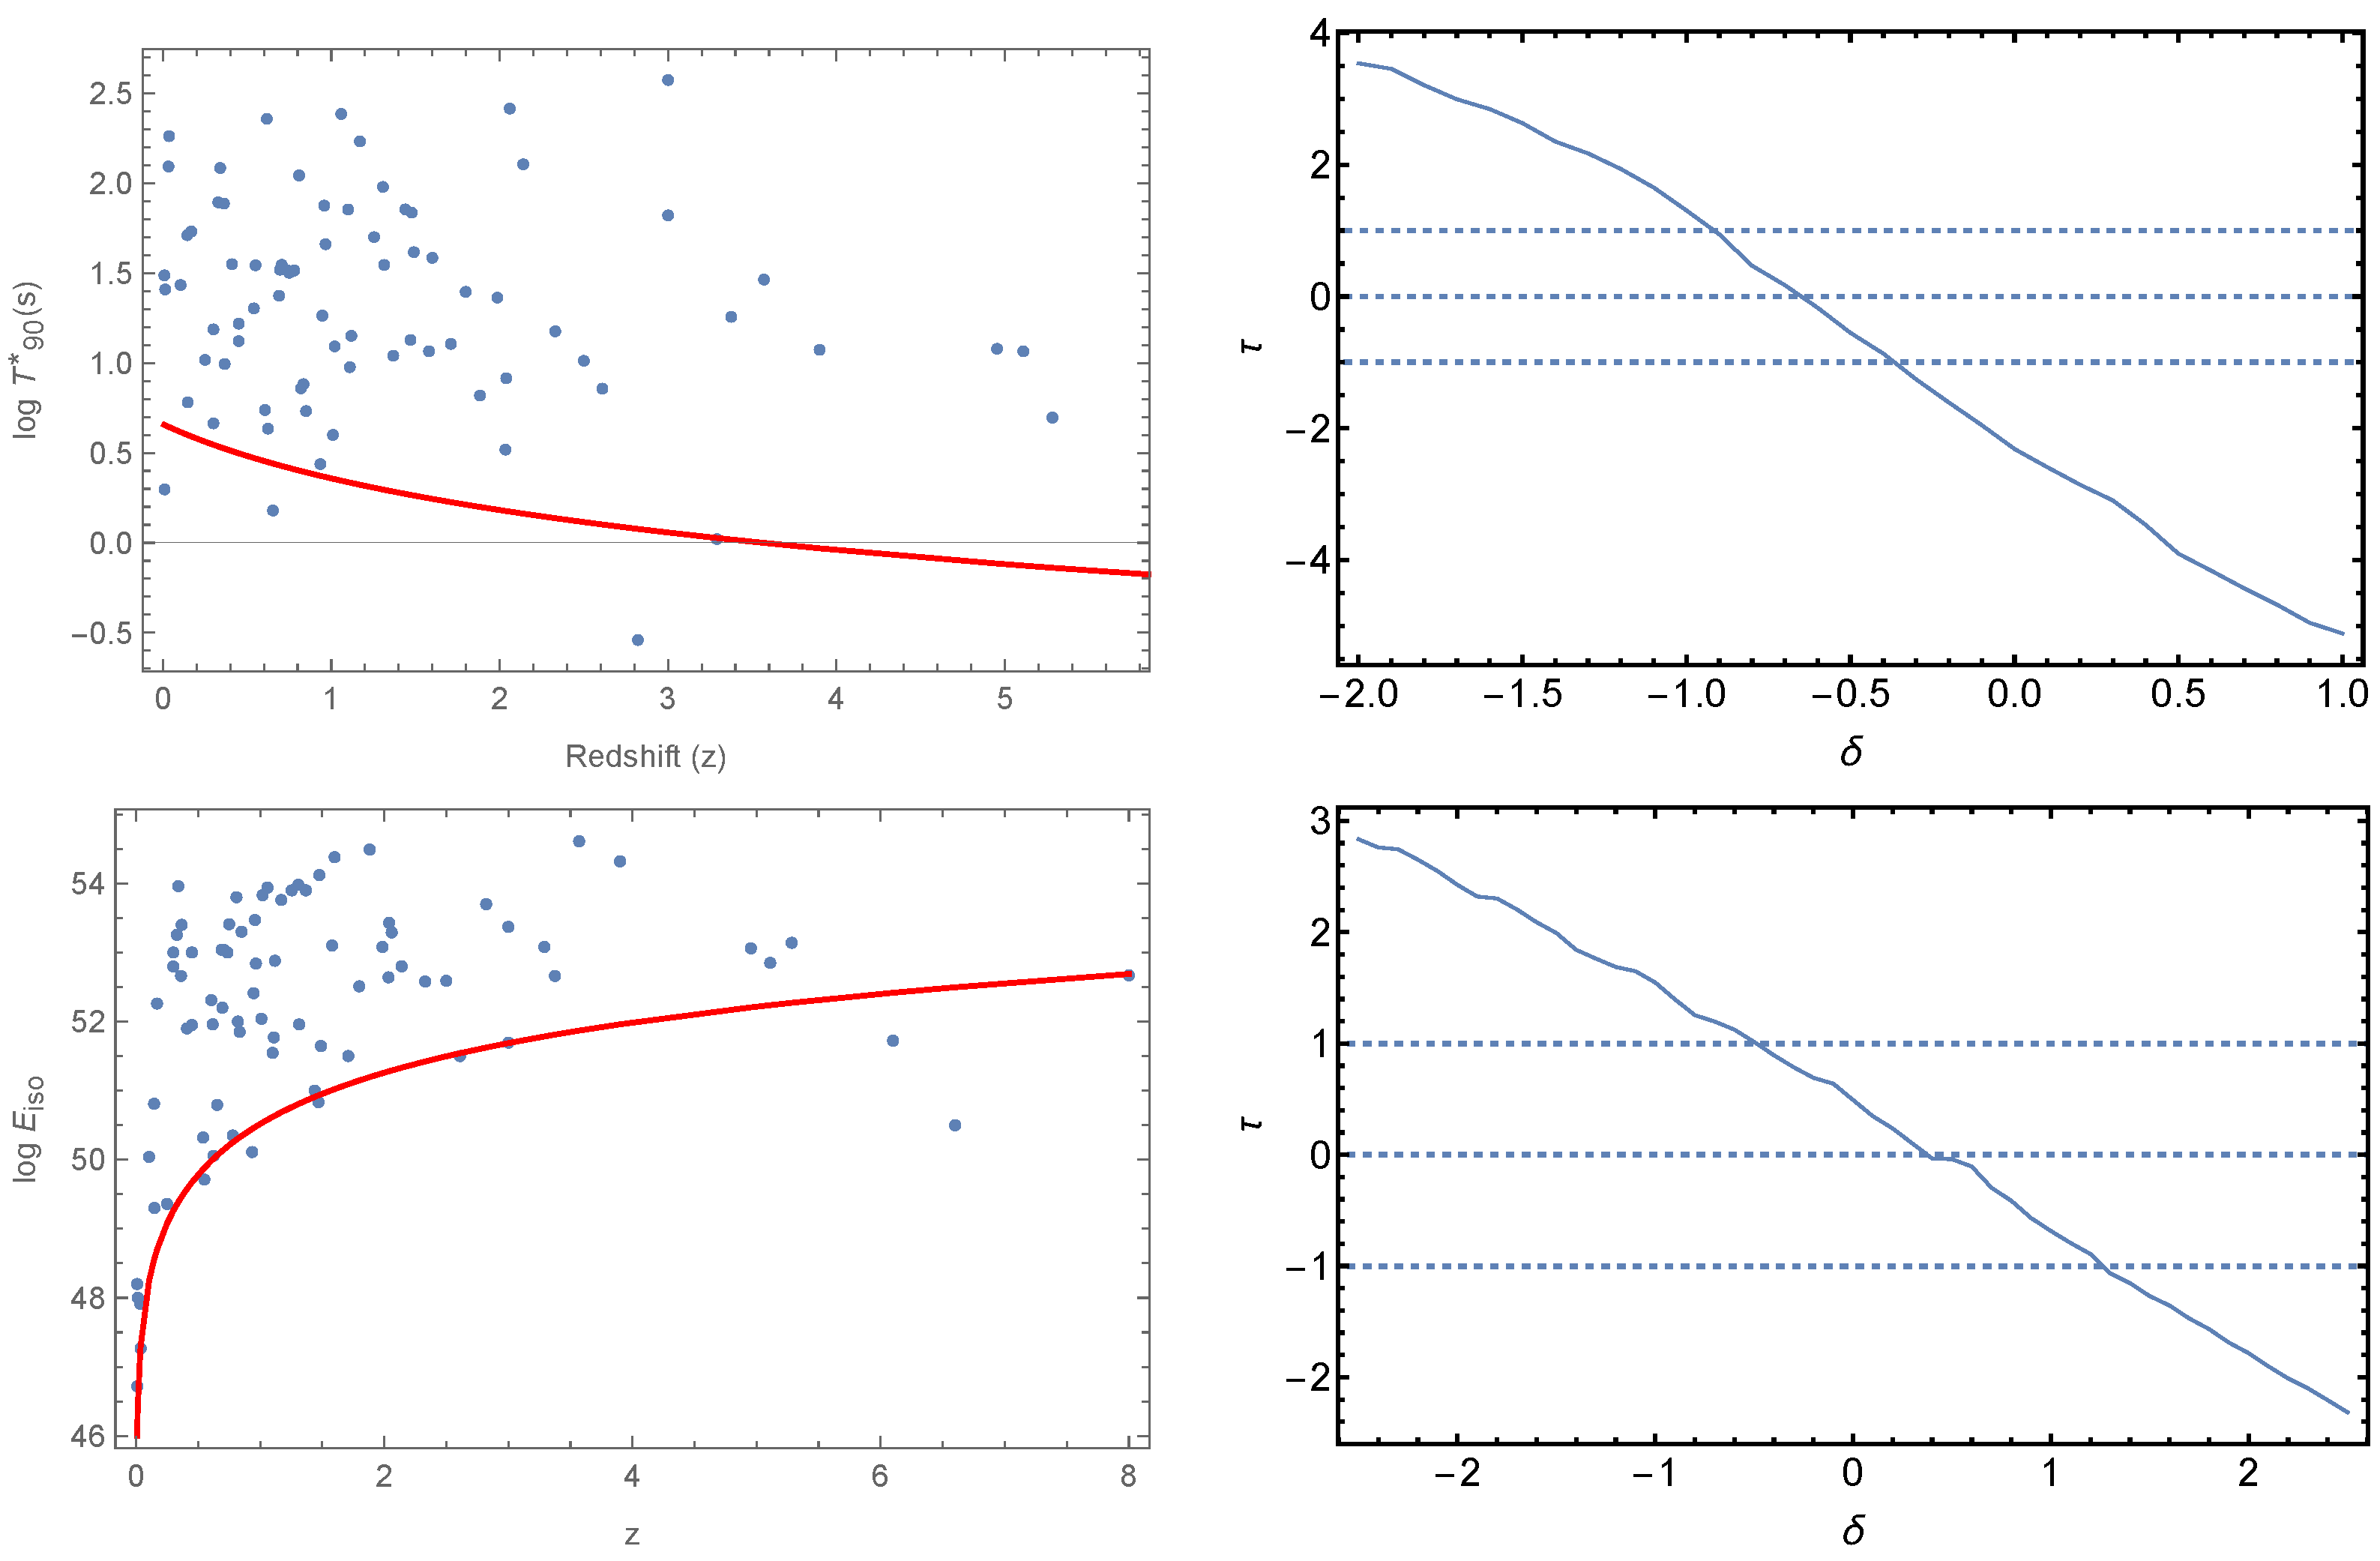
Figure 4.
The (upper left) panel shows the values of vs. redshift in blue and the limiting in the rest-frame in red. The (upper right) panel shows the Kendall vs. the slope of the evolutionary function with 1 errors shown with dashed blue lines. As with the upper panels, the (lower left) panel shows values of vs. redshift in blue with the limiting line in red, and the (right) panel shows the Kendall vs. slope of the evolutionary function with 1 errors as dashed blue lines.
Publisher’s Note: MDPI stays neutral with regard to jurisdictional claims in published maps and institutional affiliations. |
© 2021 by the authors. Licensee MDPI, Basel, Switzerland. This article is an open access article distributed under the terms and conditions of the Creative Commons Attribution (CC BY) license (https://creativecommons.org/licenses/by/4.0/).
Share and Cite
MDPI and ACS Style
Dainotti, M.; Levine, D.; Fraija, N.; Chandra, P. Accounting for Selection Bias and Redshift Evolution in GRB Radio Afterglow Data. Galaxies 2021, 9, 95. https://doi.org/10.3390/galaxies9040095
AMA Style
Dainotti M, Levine D, Fraija N, Chandra P. Accounting for Selection Bias and Redshift Evolution in GRB Radio Afterglow Data. Galaxies. 2021; 9(4):95. https://doi.org/10.3390/galaxies9040095
Chicago/Turabian StyleDainotti, Maria, Delina Levine, Nissim Fraija, and Poonam Chandra. 2021. "Accounting for Selection Bias and Redshift Evolution in GRB Radio Afterglow Data" Galaxies 9, no. 4: 95. https://doi.org/10.3390/galaxies9040095
Note that from the first issue of 2016, this journal uses article numbers instead of page numbers. See further details here.