
Modelling the Energy Spectra of Radio Relics

1
Hamburger Sternwarte, Gojenbergsweg 112, 21029 Hamburg, Germany
2
Dipartimento di Fisica e Astronomia, Universita di Bologna, Via Gobetti 93/2, 40122 Bologna, Italy
3
Thüringer Landessternwarte, Sternwarte 5, 07778 Tautenburg, Germany
*
Author to whom correspondence should be addressed.
Galaxies 2021, 9(4), 111; https://doi.org/10.3390/galaxies9040111
Submission received: 1 October 2021
/
Revised: 22 November 2021
/
Accepted: 27 November 2021
/
Published: 1 December 2021
(This article belongs to the Special Issue A New Window on the Radio Emission from Galaxies, Galaxy Clusters and Cosmic Web: Current Status and Perspectives)
Abstract
:Radio relics are diffuse synchrotron sources that illuminate shock waves in the intracluster medium. In recent years, radio telescopes have provided detailed observations about relics. Consequently, cosmological simulations of radio relics need to provide a similar amount of detail. In this methodological work, we include information on adiabatic compression and expansion, which have been neglected in the past in the modelling of relics. In a cosmological simulation of a merging galaxy cluster, we follow the energy spectra of shock accelerated cosmic-ray electrons using Lagrangian tracer particles. On board of each tracer particle, we compute the temporal evolution of the energy spectrum under the influence of synchrotron radiation, inverse Compton scattering, and adiabatic compression and expansion. Exploratory tests show that the total radio power and, hence, the integrated radio spectrum are not sensitive to the adiabatic processes. This is attributed to small changes in the compression ratio over time.
1. Introduction
Radio relics are diffuse radio sources observed at the periphery of galaxy clusters. Relics are the manifestations of cosmic-ray electrons being "shock accelerated" to high energies [1,2,3]. The shock waves develop naturally in the intracluster medium (ICM) during cluster mergers and the accretion of matter. These shock waves (re-) accelerate the ICM electrons to high energies via diffusive shock acceleration (DSA) [4,5].
As of writing this paper, about 60 relics and candidates are known, and radio observations are detecting more relics. Furthermore, high-resolution observations show that relics are non-uniform structures and they show threads and filaments on -scales [6,7]. The origin of these filaments is still unknown. They might trace magnetic filaments, the underlying gas density, or the Mach number distribution of the shock wave.
When computing the cosmic-ray energy spectra in cosmological simulations, previous studies have included energy losses due to synchrotron radiation and inverse Compton scattering only [8,9,10,11,12]. These works neglected any modification of the energy spectrum due to adiabatic expansion and compression, as done, for example in [13,14]. However, if adiabatic processes are relevant, they might be important when studying the filamentary morphologies of relics. Yet, it is still uncertain if cosmic-ray electrons are subjected to significant adiabatic expansion or compression after they are shock accelerated. It might also be that the post-shock gas dilutes gently. In this case, the cosmic-ray electrons are not exposed to any significant adiabatic processes.
In this contribution, we extend the model derived by [8] and used in [9,10,11,12] to model radio relics. To this end, we include the effects of adiabatic compression and expansion when computing the cosmic-ray energy spectra. Furthermore, we use Lagrangian tracer particles to follow the spectral evolution of shock accelerated cosmic-ray electrons. We note that this is a methodological paper and we focus on the presentation of the model. An analysis of the filamentary structures in relics is subjected to future works.
This paper is structured as follows. In Section 2, we present the cosmic-ray model. In addition, we present the cosmological simulation that we used. In Section 3, we analyse how adiabatic effects change the total radio power and integrated radio spectra. In Section 4, we summarise and conclude our work.
2. Materials and Methods
In this section, we derive the energy spectrum of shocked accelerated cosmic-ray electrons under the influence of synchrotron radiation, inverse Compton scattering, and adiabatic compression and expansion. Furthermore, we present the simulation used in this work.
2.1. Modelling of the Cosmic-Ray Spectra
In [11,12], we followed the approach of [8] to model the radio emission of radio relics. Here, we expand our approach by two components. First, the original model only includes synchrotron and inverse Compton energy losses. Here, we also include adiabatic gains and losses connected to changes of the volume [15]. Second, in [11,12], we computed the electron spectrum using the physical properties at the shock front. This assumption is crude as the physical properties might change in the shock downstream. Hence, we follow the energy spectra using Lagrangian tracer particles, see Section 2.2. Consequently, the new approach is sensitive to local variations of the physical properties as well as adiabatic compression and expansion.
It is commonly assumed that radio relics are produced by DSA [5]. The energy spectrum produced by DSA is a power-law distribution.
The energy spectral index depends only on the compression ratio r of the shock and, hence, it is directly connected to the Mach number M:
After injection, the energy spectrum is modified by adiabatic processes as well as synchrotron radiation and inverse Compton scattering. The modifications are described by [16]:
For consistency with [8], the energy is given in units of : . The constant accounts for synchrotron and inverse Compton losses. describes adiabatic compression and expansion of the volume V:
The different variables are: is the Thomson cross section; is the electron mass; c is the speed of light; is the downstream magnetic field and is the equivalent magnetic field of the cosmic microwave background. The adiabatic index is . In principle, changes of the cosmic-ray energy due to adiabatic processes can also lead to radio emission, e.g., [17]. However, this is expected to be negligible compared to the synchrotron emission.
To compute the aged energy spectrum, we follow the method described in [18]. Therefore, we introduce the compression ratio
which is the ratio of the initial volume and the compressed/expanded volume at time t. The substitution of reduces Equation (3) to
This equation integrates to
The integration constant is given by k. Substituting E back and using the initial condition gives
Here, is the integral . The corresponding energy spectrum is computed as
with the initial spectrum Equation (1) and
the energy spectrum becomes
Similar to [8], we included a high energy cut-off in Equation (12). The spectrum is only computed when . Furthermore, if adiabatic compression and expansion are neglected, i.e., setting the compression ratio to one, the spectrum becomes the solution derived by [8]. In this case, only synchrotron and inverse Compton losses determine the spectrum’s shape. Finally, to have consistency with [8], we compute the normalisation of the spectrum as
with
In the three equations above, the different variables are: is the fraction of energy that goes into the acceleration of electrons to suprathermal energies; is the internal energy of the downstream gas; and are the proton and electron masses, respectively; c is the speed of light; q is the entropy jump; is the minimum energy for particles to be considered suprathermal; and is the maximum energy to which particles are accelerated.
The similarity with the spectrum derived in [8] allows us to use the same substitution of the variable to compute the corresponding radio emission as the integral of the spectrum and the modified Bessel function:
where is a function of E and takes the form:
For the pitch-angle , we assume .
2.2. Cluster Simulation
In this work, we combine cosmological simulations carried out with the ENZO code [19] and a Lagrangian analysis performed with the code CRaTer [20]. For details on the algorithms and implementation, we point to the given references.
Here, we analyse one cluster from the SanPedro-cluster sample. The SanPedro-cluster sample is an on-going campaign to enlarge the number of simulated radio relics. The final goal is to produce a collection of high-resolution relics that can be compared with observations, e.g., [12,21,22]. The simulation covers a root-grid volume of (140 Mpc/h) and is sampled with cells. Five levels of nested refinements and one additional level of adaptive mesh refinements were used to achieve a high and uniform resolution in the (4.85 Mpc) volume centred on the cluster. The resolution is h on the most refined level. A uniform magnetic field with was initialised in each direction.
The cluster, analysed in this work, is of particular interest as it undergoes a major merger that produces several shock waves. A large shock wave is developed at redshift . The shock wave is produced by a Mach number distribution that has an average of ∼2.8 and a standard deviation of ∼1.4. This is a typical shock wave produced during a cluster merger, e.g., compared with Figure 10 in [12]. The shock wave produces a bright radio relic that has the typical arc-shaped morphology as most observed relics. Hence, the cluster merger and the radio relic are typical when compared to other simulated and observed radio relics. An expansion of the analysis to different cluster mergers, including more extreme ones, will be a task for future works. In Figure 1, we show the evolution of the cluster’s baryonic density.
To follow the shock injected cosmic-ray energy spectrum, i.e., Equation (12), we use the Lagrangian tracer code CRaTer [20,22,23,24]. At redshift , we inject passive tracers onto the ENZO-data. Each tracer carries a mass of and additional tracers are injected at runtime following the mass inflow of the simulation. At the end of the simulation, the cluster is sampled with tracers. The relic itself is sampled by ∼5.8 tracers.
Using the cloud-in-cell-interpolation and an additional correction term to cure for numerical biases in converging flows see [25], for an elaborated discussion and testing of the scheme, the tracers are advected across the ENZO-data. The tracers use a temperature based shock-finder to detect shock waves in the simulated ICM. The strength of the corresponding shock waves is computed as:
Once a tracer detects a shock, the injection spectrum, Equation (12) with , is computed. At the subsequent timesteps, the integral and the compression ratio are computed using the grid quantities, recorded by the tracers. Following the CFL-condition, the tracers read the grid quantities and, hence, compute the aged spectrum about every 2–4 . The compression ratio, Equation (6), of the tracers is computed as
is the local baryonic density measured from the grid at two adjacent timesteps and , with .
In Figure 2, we plot the average density and the average compression ratio measured by the tracers after they have passed the shock at . We find that the measured density slowly increases over time, with two drops at ∼60 Myr and ∼120 Myr after the shock passage. Consequently, the average compression ratio is rather small with values around ∼1. Only at ∼60 Myr and ∼120 Myr, the comparison ratio increases to ∼1.1 and ∼1.2, respectively. The two spikes are of numerical nature, which we explain in the following.
CRaTer analyses the ENZO-data in post-processing. The temporal spacing between the saved ENZO-datasets is larger than allowed by the CFL-condition. However, for a stable advection, the tracers need to follow the CFL-condition. Therefore, they are advected over one ENZO-dataset multiple times For an elaborated description of the CRaTer-implementation, we point the reader to [25]. Once, the tracers reach the timestep of the next ENZO-dataset, the new data are loaded and the tracers record the new ENZO-data. Hence, when new ENZO-data are loaded, the measured tracer data are not only sensitive to the spatial changes due to the tracer advection, but are also sensitive to temporal changes due to the new ENZO-data. This effect can produce stronger jumps in the tracer data. However, as seen in Figure 2, this numerical effect is rather mild.
3. Results
Using the methods described in Section 2.1, we compute the cosmic-ray spectra and the associated radio emission of the shock accelerated particles. Therefore, we distinguish between two models: first, we neglect adiabatic effects and only compute the spectral evolution under synchrotron radiation and inverse Compton scattering. This model is called relic S. The second model includes adiabatic effects and is called relic A. In the following, we highlight the differences of the two models. Therefore, we focus on the radio power and the integrated radio spectra. Any analysis concerning filamentary structures or the polarisation properties are targets of future works.
3.1. Radio Power
Using Equation (16), we compute the radio power at of the two relics at after the shock passage. The radio power of relic S is about . The radio power of relic A is about . Consequently, the difference of the two is marginal and they can be considered equal. Hence, the adiabatic effects do not affect the total radio power of the relic.
Figure 3 shows the maps of the radio emission at of the two models. For both relics, we find a largest-linear scale of . Furthermore, the relic morphologies appear similar. In order to investigate the difference of the two maps, we compute a residual map normalised to the map of relic S, i.e., we compute:
The residual map is shown in the first panel of Figure 4. For the most part, the difference between the two maps is small and approaches zero. Only in a few regions that are mostly located in the far downstream do we find significant differences between the two.
To better quantify the difference between the two models, we computed the pixel-weighted and radio-weighted distribution of the residual map. The distributions are given in the second panel of Figure 4. The pixel weighted distribution peaks around zero, with of the pixels showing a difference between and . For the radio-weighted distribution, the peak between and increases above . Consequently, the relative difference between relic A and relic S is minor in the radio bright regions. Vice versa, the relative difference is larger in fainter regions.
The results above show that the adiabatic effects are neglectable when studying the total radio power and maps of radio relics.
3.2. Integrated Radio Spectra
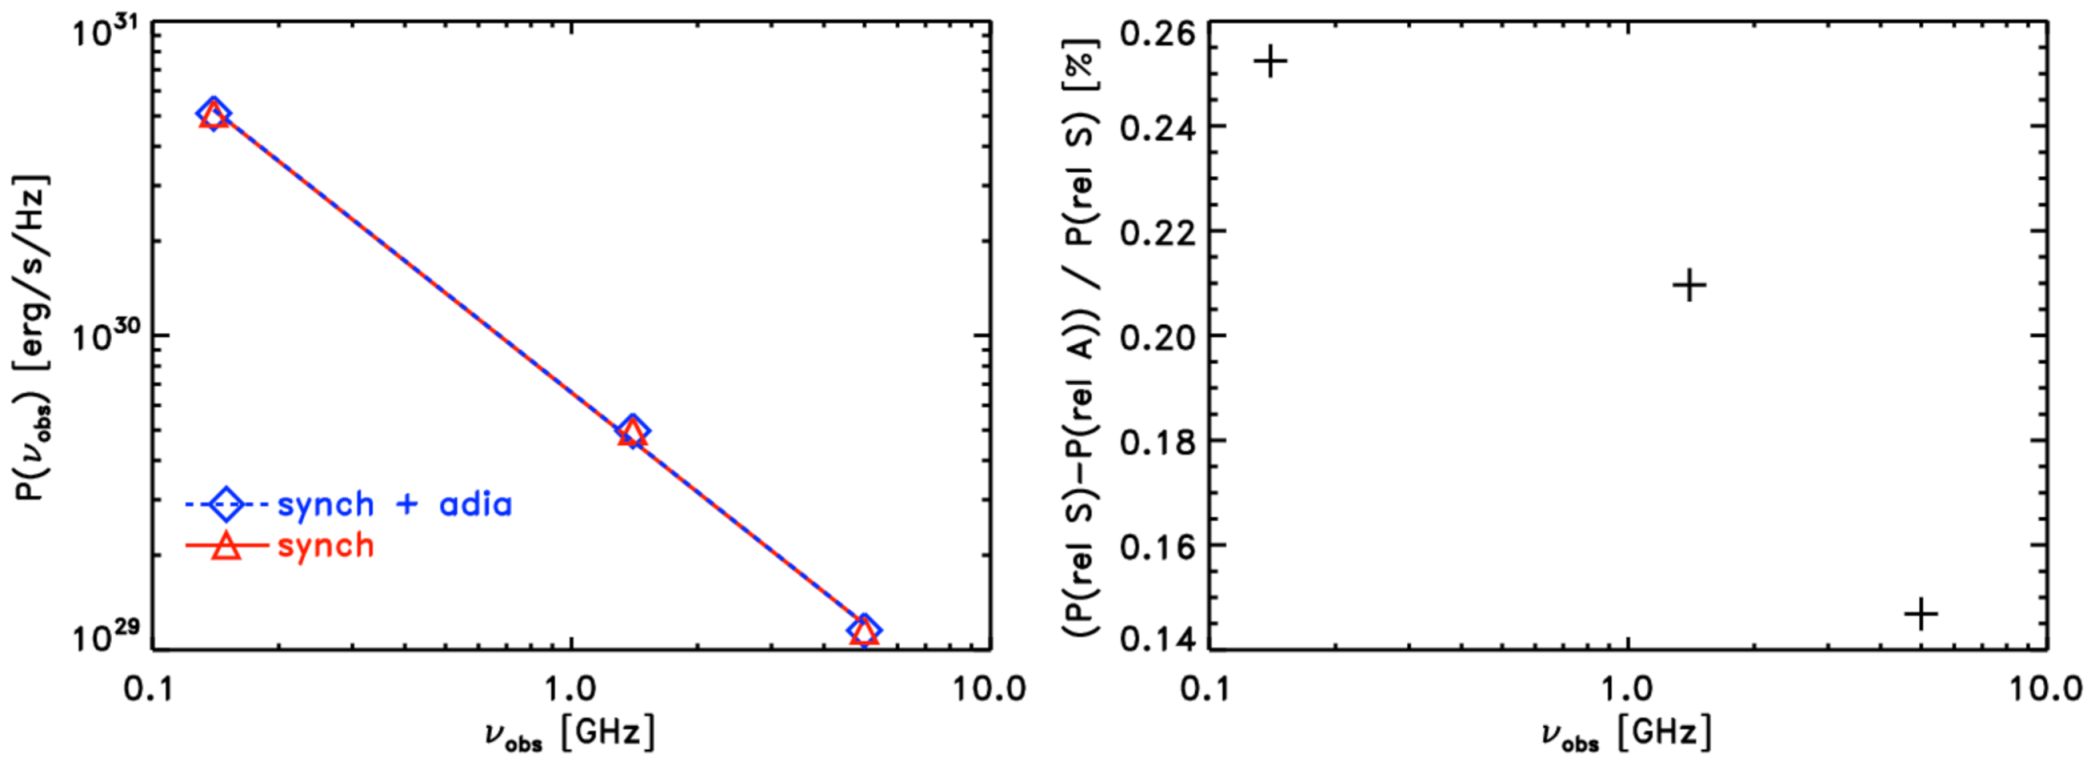
To investigate the effect on observing frequencies other than , we computed the radio emission at and . Using the radio power at the three different frequencies, we computed the integrated radio spectra for both relics. The radio spectra are plotted in Figure 5. Here, we use the convention that
Fitting a power-law to the spectra, we find the same spectral index for both relic A and relic S. The spectral indices are . The fitted spectral indices start to diverge at the fourth decimal place and, hence, they can be considered equal. Consequently, the integrated radio spectrum remains unaffected by adiabatic effects.
In Figure 5, we also show the relative difference of the radio power of the two relics at the three frequencies. We find that independent of the frequency, the radio power differ by less than . This explains the similar spectral indices.
The integrated radio spectrum plotted in Figure 5, shows a nearly perfect power-law over a large frequency range. In principle, relics should show a high frequency cut-off because they are affected by radiation cooling. However, in the quasi-stationary shock scenario, as analysed here, a power-law spectra is expected. Nevertheless, Loi et al. [26] and Rajpurohit et al. [27] produced the most detailed integrated radio spectra for the sausage relic and toothbrush relic, respectively. These observations cover an even larger frequency range, i.e., up to . Yet, neither of them observed a high frequency cut-off. Rajpurohit et al. [28] argued that the high Mach number tail of the distribution producing the relic dominates the spectral distribution.
The integrated spectra were computed at at ∼142 Myr after the shock passage. During this period, the average compression ratio is very mild, . Despite its numerical nature, we investigated if the strongest change in density at affected the total radio power and the integrated spectra. During this period, the radio power and, hence, the spectral index differed more. This relative difference between the radio power of relic A and relic S is the largest at low frequencies: at 0.14 GHz, the relative difference is about ∼8.7%; at 1.4 GHz, it is about ∼2.3%; and at 5 GHz, it is about ∼0.3%. Hence, the integrated spectral index for relic A and relic S differs as well. The relative difference of the integrated spectral index was ∼2.8%. Consequently, for a larger compression ratio, the two models did not differ significantly.
3.3. Numerical Caveats
Our results show that adiabatic effects are most likely negligible when modelling radio relics. However, these results could also vary with the spatial resolution, the number of tracers, or the time resolution of the simulation. Hence, we performed a few tests to determine the corresponding effects.
First, we reconstructed the ENZO-data at a higher AMR level, with a resolution of ∼17.08 kpc/h. Following Section 2.2, we analysed this simulation with ∼2.6 tracer particles. However, we find that the differences in radio between relic A and relic S are infinitesimal small. This is due to the fact that the spatial resolution decreases, while the temporal resolution remains the same. Hence, the tracer particles remain in a volume of constant density for a longer time than the tracer particles in the high-resolution simulation. We note that the density remains constant within a simulation cell for one timestep of the ENZO-simulation. Hence, a high spatial resolution is needed, when studying adiabatic effects. They might become even more relevant at an even higher resolution. Following the results at , we do not expect adiabatic processes to become significantly relevant at a higher-resolution. Yet, this needs to be explored using tailored simulations.
Second, we re-simulated the simulation described in Section 2.2 using twice the mass resolution of tracers, i.e., , for a total of tracer particles at the end of the simulation. At 1.4 GHz, the relic has a total power of and for relic S and relic A, respectively We note that the radio power is higher than in Section 3.1. We attribute this to the larger normalisation, Equation (13). Consequently, the radio power at 1.4 GHz can be considered equal between the two models. Moreover, the integrated spectral index does not differ between the two models. Hence, we conclude that the number of tracer particles does not increase or decrease the relevance of adiabatic processes.
Finally, we are already using the highest time resolution possible. Hence, we cannot increase it any further. However, we argue that a higher temporal resolution would not alter the results. The tracer particles record the compression ratio, Equation (20), as the ratio between densities measured at two adjacent timesteps. If this ratio was measured at a higher temporal resolution, the change in density would be smaller or the same, but never larger. Hence, the measured compression could only be milder or the same. Consequently, the adiabatic effects on the spectrum will be the same or less.
4. Conclusions
In this work, we included adiabatic expansion and compression when modelling radio relics. Therefore, we followed the approach of [18] to compute the aged electron spectrum, see Equations (3) and (12). Following, reference [8] we computed the associated radio emission. The inclusion of adiabatic processes might be relevant, when studying the filamentary structures observed in several relics. In these structures, the volume differences might be larger and, hence, compression might be more relevant. Moreover, the filamentary structures evolve on timescales that are shorter than the cooling times. Hence, the role of adiabatic processes might be relevant on small timescales. Adiabatic processes are also relevant in the radio phoenices scenario, e.g., [18,29,30,31], which cannot be studied with the current simulation set-up. We stress that this is meant to be a methodological work and that we focus on the presentation of the model. Hence, this study lays the groundwork for future studies of the filamentary structures observed in relics.
To investigate the effects of adiabatic processes, we analysed a simulated galaxy cluster from the SanPedro-cluster catalogue. We used the Lagrangian tracer code CRaTer to follow the shock injected electron spectrum and the subsequent modifications of the spectrum due to synchrotron and inverse Compton losses, as well as adiabatic compression and expansion, see Section 2. The usage of Lagrangian tracer particles allowed us to compute the changes of the energy spectrum based on the local gas properties. The latter is also an improvement compared to our previous works [11,12]. Here, we analysed a typical cluster merger. The shock wave that produces the relic was produced by a distribution with an average of ∼2.8 and a standard deviation of ∼1.4, e.g., compared with Figure 10 in [12]. In the future, it will be useful to conduct a parameter study for mergers of different strengths.
To this end, we modelled the relic emission twice, see Section 3. In the first model, named relic S, we neglected adiabatic processes, while in the second model, named relic A, adiabatic processes were included. To find differences between the two models, we compared: the total radio power at , maps of the radio power at , and the integrated radio spectrum measured between , , and . For all three proxies, we found marginal differences between the two models.
These findings are attributed to the small changes in the compression ratio that mostly oscillates around ∼1, see Figure 2. This indicates that the post-shock gas dilutes mildly. Hence, the adiabatic compression and expansion are rather unimportant when computing the cosmic-ray spectrum, see in Equation (12). These results might change with a higher spatial resolution, see Section 3.3. This needs to be investigated in the future. However, at ∼60 Myr and ∼120 Myr, the simulation shows two spikes of stronger compression. Even though, these spikes are due to numerical reasons, they can be used to estimate the effect of events of strong compression. During the periods, the radio power of relic A and relic S start to diverge more significantly at low frequencies. On the other hand, the radio powers at high frequencies remain similar. Consequently, the integrated radio spectrum differs between relic S and relic A. Yet, the relative difference of the integrated spectral index is small, ∼2.7%. Hence, we conclude that adiabatic effects are most likely negligible when modelling radio relics.
Author Contributions
D.W. ran the simulation, implemented the codes, and performed the data analysis. D.W., M.H., and M.B. analysed and interpreted the data. All authors have read and agreed to the published version of the manuscript.
Funding
D.W. is funded by the Deutsche Forschungsgemeinschaft (DFG, German Research Foundation)—441694982. M.H. acknowledges support by the BMBF Verbundforschung under the grant 05A20STA. M.B. acknowledges funding by the Deutsche Forschungsgemeinschaft (DFG, German Research Foundation) under Germany’s Excellence Strategy—EXC 2121 “Quantum Universe”—390833306.
Institutional Review Board Statement
Not applicable.
Informed Consent Statement
Not applicable.
Data Availability Statement
The data presented in this is study are part of an ongoing study, and are too large to be archived; hence, the data are not publicly available yet. However, we are happy to share the data upon request.
Acknowledgments
The authors gratefully acknowledge the Gauss Centre for Supercomputing e.V. (www.gauss-centre.eu) for supporting this project by providing computing time through the John von Neumann Institute for Computing (NIC) on the GCS Supercomputer JUWELS at Jülich Supercomputing Centre (JSC), under project no. hhh44. The cosmological simulations used in this work were initialised and performed with the MUSIC-code https://bitbucket.org/ohahn/music/wiki/Home [32] and the ENZO-code http://enzo-project.org [19], respectively. This research made use of the radio astronomical database galaxyclusters.com, maintained by the Observatory of Hamburg.
Conflicts of Interest
The authors declare no conflict of interest. The funders had no role in the design of the study; in the collection, analyses, or interpretation of the data; in the writing of the manuscript, or in the decision to publish in this work.
References
- Brunetti, G.; Jones, T.W. Cosmic Rays in Galaxy Clusters and Their Nonthermal Emission. Int. J. Mod. Phys. D 2014, 23, 1430007. [Google Scholar] [CrossRef] [Green Version]
- van Weeren, R.J.; de Gasperin, F.; Akamatsu, H.; Brüggen, M.; Feretti, L.; Kang, H.; Stroe, A.; Zandanel, F. Diffuse Radio Emission from Galaxy Clusters. Sci. Space Rev. 2019, 215, 16. [Google Scholar] [CrossRef] [Green Version]
- Bykov, A.M.; Vazza, F.; Kropotina, J.A.; Levenfish, K.P.; Paerels, F.B.S. Shocks and Non-thermal Particles in Clusters of Galaxies. Sci. Space Rev. 2019, 215, 14. [Google Scholar] [CrossRef] [Green Version]
- Drury, L.O. An introduction to the theory of diffusive shock acceleration of energetic particles in tenuous plasmas. Rep. Prog. Phys. 1983, 46, 973–1027. [Google Scholar] [CrossRef] [Green Version]
- Ensslin, T.A.; Biermann, P.L.; Klein, U.; Kohle, S. Cluster radio relics as a tracer of shock waves of the large-scale structure formation. Astron. Astrophys. 1998, 332, 395–409. [Google Scholar]
- Rajpurohit, K.; Wittor, D.; van Weeren, R.J.; Vazza, F.; Hoeft, M.; Rudnick, L.; Locatelli, N.; Eilek, J.; Forman, W.R.; Bonafede, A.; et al. Understanding the radio relic emission in the galaxy cluster MACS J0717.5+3745: Spectral analysis. Astron. Astrophys. 2021, 646, A56. [Google Scholar] [CrossRef]
- Rajpurohit, K.; Vazza, F.; van Weeren, R.J.; Hoeft, M.; Brienza, M.; Bonnassieux, E.; Riseley, C.J.; Brunetti, G.; Bonafede, A.; Brüggen, M.; et al. Dissecting nonthermal emission in the complex multiple-merger galaxy cluster Abell 2744: Radio and X-ray analysis. arXiv 2021, arXiv:2104.05690. [Google Scholar] [CrossRef]
- Hoeft, M.; Brüggen, M. Radio signature of cosmological structure formation shocks. Mon. Not. R. Astron. Soc. 2007, 375, 77–91. [Google Scholar] [CrossRef] [Green Version]
- Nuza, S.E.; Hoeft, M.; van Weeren, R.J.; Gottlöber, S.; Yepes, G. How many radio relics await discovery? Mon. Not. R. Astron. Soc. 2012, 420, 2006–2019. [Google Scholar] [CrossRef] [Green Version]
- Nuza, S.E.; Gelszinnis, J.; Hoeft, M.; Yepes, G. Can cluster merger shocks reproduce the luminosity and shape distribution of radio relics? Mon. Not. R. Astron. Soc. 2017, 470, 240–263. [Google Scholar] [CrossRef] [Green Version]
- Wittor, D.; Hoeft, M.; Vazza, F.; Brüggen, M.; Domínguez-Fernández, P. Polarization of radio relics in galaxy clusters. Mon. Not. R. Astron. Soc. 2019, 490, 3987–4006. [Google Scholar] [CrossRef]
- Wittor, D.; Ettori, S.; Vazza, F.; Rajpurohit, K.; Hoeft, M.; Domínguez-Fernández, P. Exploring the spectral properties of radio relics—I: Integrated spectral index and Mach number. Mon. Not. R. Astron. Soc. 2021, 506, 396–414. [Google Scholar] [CrossRef]
- Dominguez-Fernandez, P.; Bruggen, M.; Vazza, F.; Banda-Barragan, W.E.; Rajpurohit, K.; Mignone, A.; Mukherjee, D.; Vaidya, B. Morphology of radio relics—I. What causes the substructure of synchrotron emission? Mon. Not. R. Astron. Soc. 2021, 500, 795–816. [Google Scholar] [CrossRef]
- Domínguez-Fernández, P.; Brüggen, M.; Vazza, F.; Hoeft, M.; Banda-Barragán, W.E.; Rajpurohit, K.; Wittor, D.; Mignone, A.; Mukherjee, D.; Vaidya, B. Morphology of radio relics—II. Properties of polarized emission. Mon. Not. R. Astron. Soc. 2021, 507, 2714–2734. [Google Scholar] [CrossRef]
- Shklovskii, I.S. Secular Variation of the Flux and Intensity of Radio Emission from Discrete Sources. Astron. Zhurnal 1960, 37, 256. [Google Scholar]
- Kardashev, N.S. Nonstationarity of Spectra of Young Sources of Nonthermal Radio Emission. Sov. Astron. 1962, 6, 317. [Google Scholar]
- Longair, M.S. High Energy Astrophysics. An Informal Introduction for Students of Physics and Astronomy; Cambridge University Press: Cambridge, UK, 1981. [Google Scholar]
- Enßlin, T.A.; Gopal-Krishna. Reviving fossil radio plasma in clusters of galaxies by adiabatic compression in environmental shock waves. Astron. Astrophys. 2001, 366, 26–34. [Google Scholar] [CrossRef] [Green Version]
- Bryan, G.L.; Norman, M.L.; O’Shea, B.W.; Abel, T.; Wise, J.H.; Turk, M.J.; Reynolds, D.R.; Collins, D.C.; Wang, P.; Skillman, S.W.; et al. ENZO: An Adaptive Mesh Refinement Code for Astrophysics. ApJS 2014, 211, 19. [Google Scholar] [CrossRef]
- Wittor, D.; Vazza, F.; Brüggen, M. Testing cosmic ray acceleration with radio relics: A high-resolution study using MHD and tracers. Mon. Not. R. Astron. Soc. 2017, 464, 4448–4462. [Google Scholar] [CrossRef] [Green Version]
- Banfi, S.; Vazza, F.; Wittor, D. Shock waves in the magnetized cosmic web: The role of obliquity and cosmic ray acceleration. Mon. Not. R. Astron. Soc. 2020, 496, 3648–3667. [Google Scholar] [CrossRef]
- Wittor, D.; Vazza, F.; Ryu, D.; Kang, H. Limiting the shock acceleration of cosmic ray protons in the ICM. Mon. Not. R. Astron. Soc. 2020, 495, L112–L117. [Google Scholar] [CrossRef]
- Wittor, D.; Vazza, F.; Brüggen, M. Studying the Effect of Shock Obliquity on the γ-ray and Diffuse Radio Emission in Galaxy Clusters. Galaxies 2016, 4, 71. [Google Scholar] [CrossRef] [Green Version]
- Wittor, D.; Jones, T.; Vazza, F.; Brüggen, M. Evolution of vorticity and enstrophy in the intracluster medium. Mon. Not. R. Astron. Soc. 2017, 471, 3212–3225. [Google Scholar] [CrossRef] [Green Version]
- Wittor, D. Origin and Effects of the Non-Thermal Components in Large-Scale Structures of the Universe. Ph.D. Thesis, Universität Hamburg, Hamburg, Germany, 2017. [Google Scholar]
- Loi, F.; Murgia, M.; Vacca, V.; Govoni, F.; Melis, A.; Wittor, D.; Kierdorf, M.; Bonafede, A.; Boschin, W.; Brienza, M.; et al. Spectropolarimetric observations of the CIZA J2242.8+5301 northern radio relic: No evidence of high-frequency steepening. Mon. Not. R. Astron. Soc. 2020, 498, 1628–1637. [Google Scholar] [CrossRef]
- Rajpurohit, K.; Vazza, F.; Hoeft, M.; Loi, F.; Beck, R.; Vacca, V.; Kierdorf, M.; van Weeren, R.J.; Wittor, D.; Govoni, F.; et al. A perfect power-law spectrum even at the highest frequencies: The Toothbrush relic. Astron. Astrophys. 2020, 642, L13. [Google Scholar] [CrossRef]
- Rajpurohit, K.; Hoeft, M.; Vazza, F.; Rudnick, L.; van Weeren, R.J.; Wittor, D.; Drabent, A.; Brienza, M.; Bonnassieux, E.; Locatelli, N.; et al. New mysteries and challenges from the Toothbrush relic: Wideband observations from 550 MHz to 8 GHz. Astron. Astrophys. 2020, 636, A30. [Google Scholar] [CrossRef] [Green Version]
- Enßlin, T.A.; Brüggen, M. On the formation of cluster radio relics. Mon. Not. R. Astron. Soc. 2002, 331, 1011–1019. [Google Scholar] [CrossRef] [Green Version]
- de Gasperin, F.; Ogrean, G.A.; van Weeren, R.J.; Dawson, W.A.; Brüggen, M.; Bonafede, A.; Simionescu, A. Abell 1033: Birth of a radio phoenix. Mon. Not. R. Astron. Soc. 2015, 448, 2197–2209. [Google Scholar] [CrossRef] [Green Version]
- Mandal, S.; Intema, H.T.; van Weeren, R.J.; Shimwell, T.W.; Botteon, A.; Brunetti, G.; de Gasperin, F.; Brüggen, M.; Di Gennaro, G.; Kraft, R.; et al. Revived fossil plasma sources in galaxy clusters. Astron. Astrophys. 2020, 634, A4. [Google Scholar] [CrossRef] [Green Version]
- Hahn, O.; Abel, T. Multi-scale initial conditions for cosmological simulations. Mon. Not. R. Astron. Soc. 2011, 415, 2101–2121. [Google Scholar] [CrossRef] [Green Version]
Figure 1.
Time-sequence of the cluster merger. The maps show the projected gas density in units of at six different snapshots of the simulation. In the last panel, the black contours give the radio power at . The red arrows mark the relic that we study in this work.
Figure 1.
Time-sequence of the cluster merger. The maps show the projected gas density in units of at six different snapshots of the simulation. In the last panel, the black contours give the radio power at . The red arrows mark the relic that we study in this work.
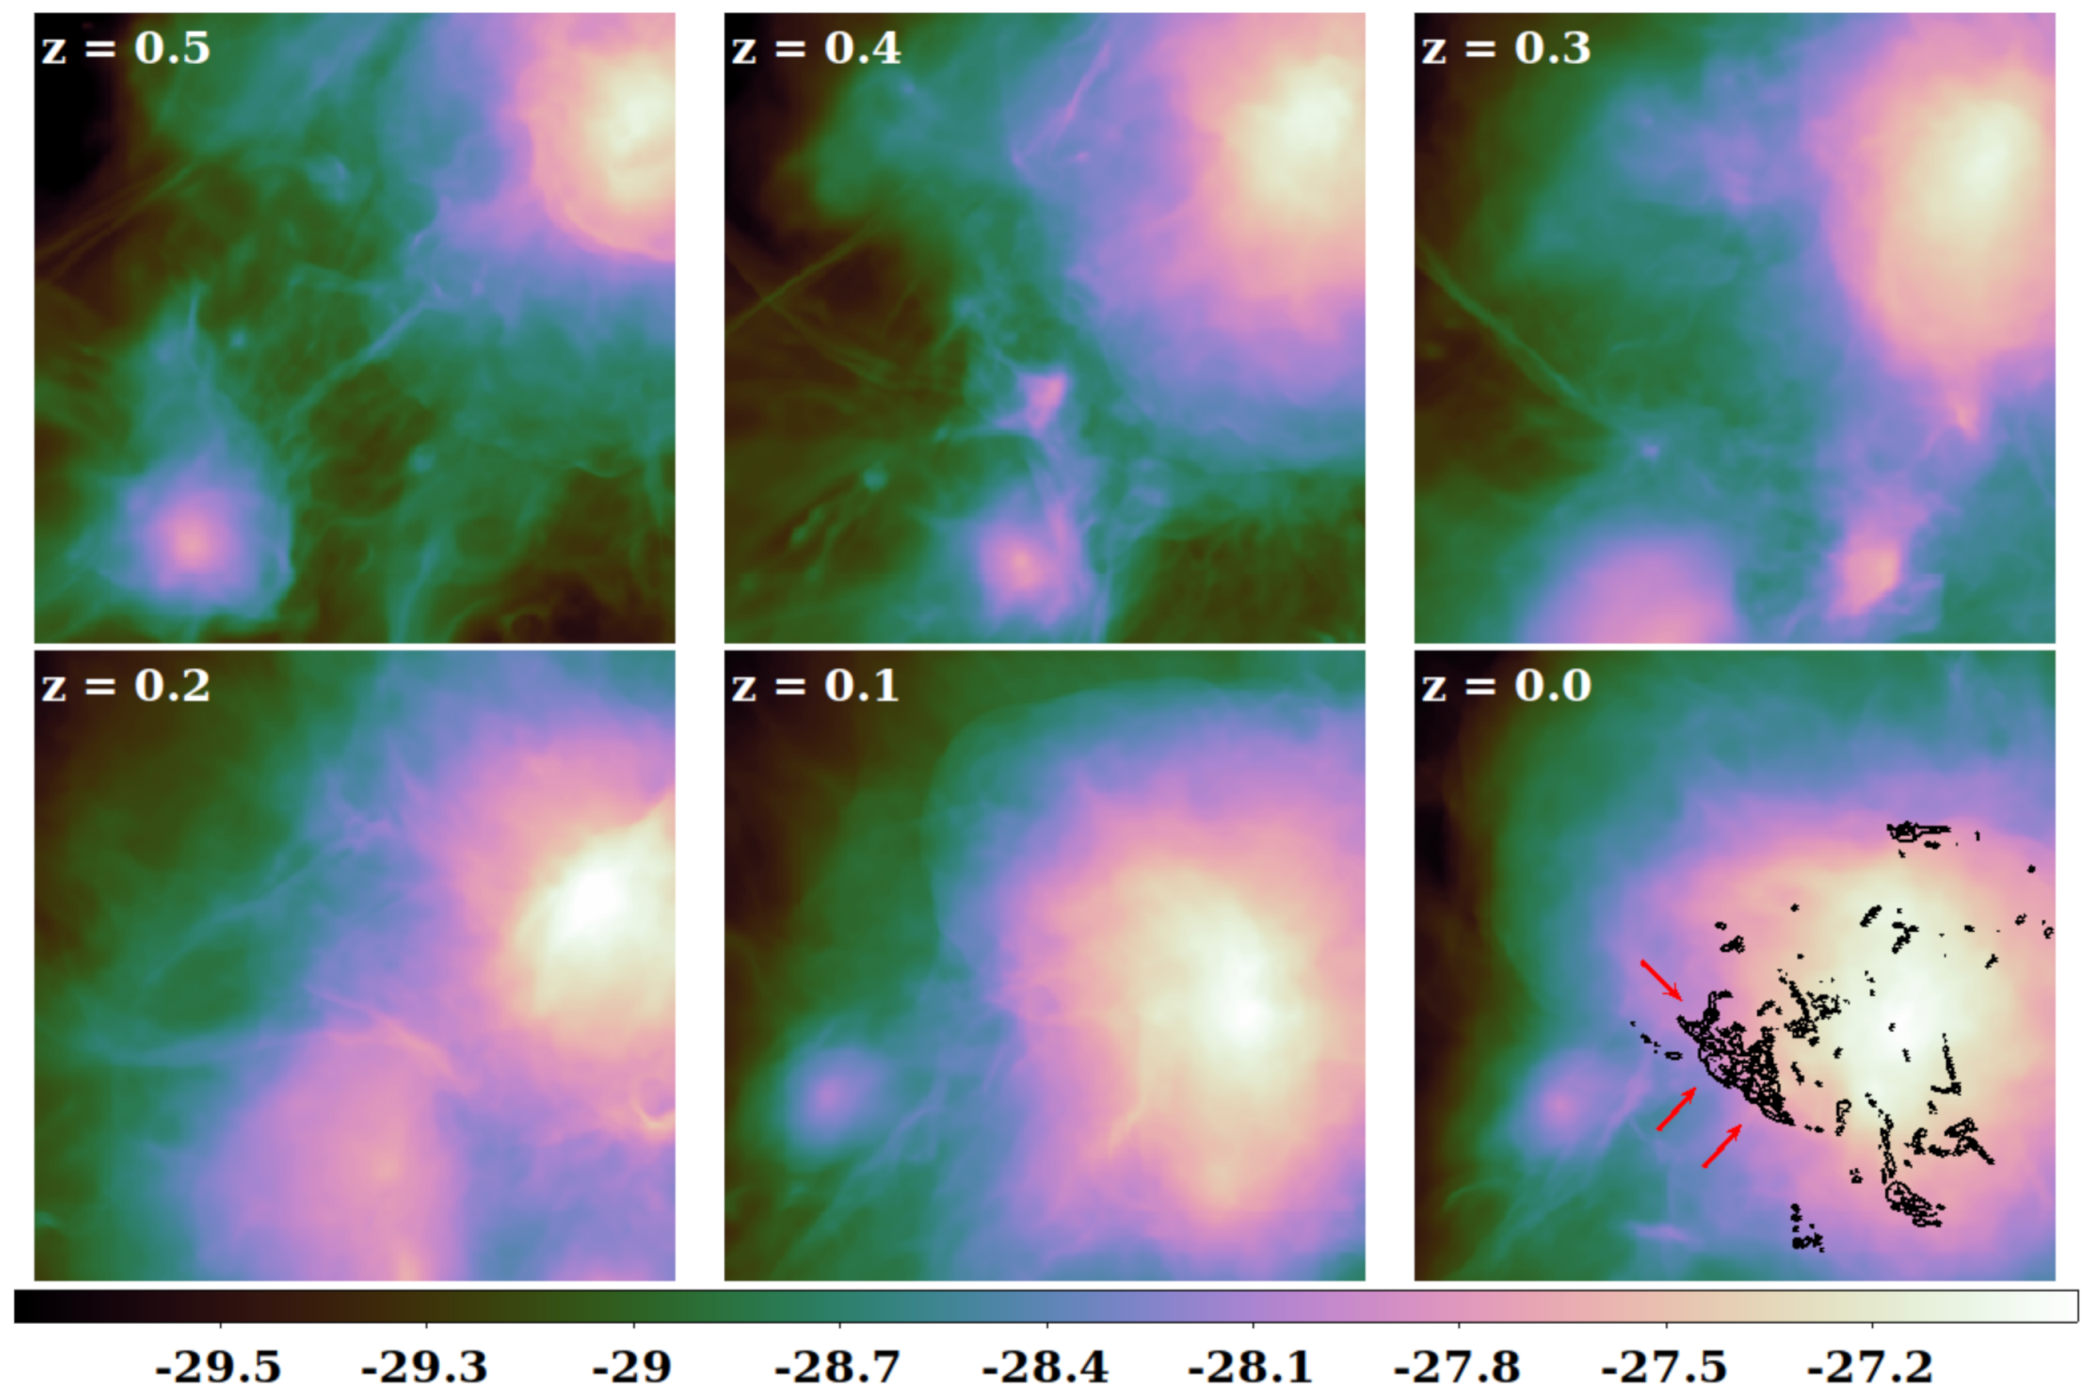
Figure 2.
The left panel shows average density measured by the tracers after shock passage, . The right panel shows the average compression ratio measured by the tracers after shock passage. In both panels, the two vertical lines mark the timestep, when a new ENZO-snapshot is loaded.
Figure 2.
The left panel shows average density measured by the tracers after shock passage, . The right panel shows the average compression ratio measured by the tracers after shock passage. In both panels, the two vertical lines mark the timestep, when a new ENZO-snapshot is loaded.
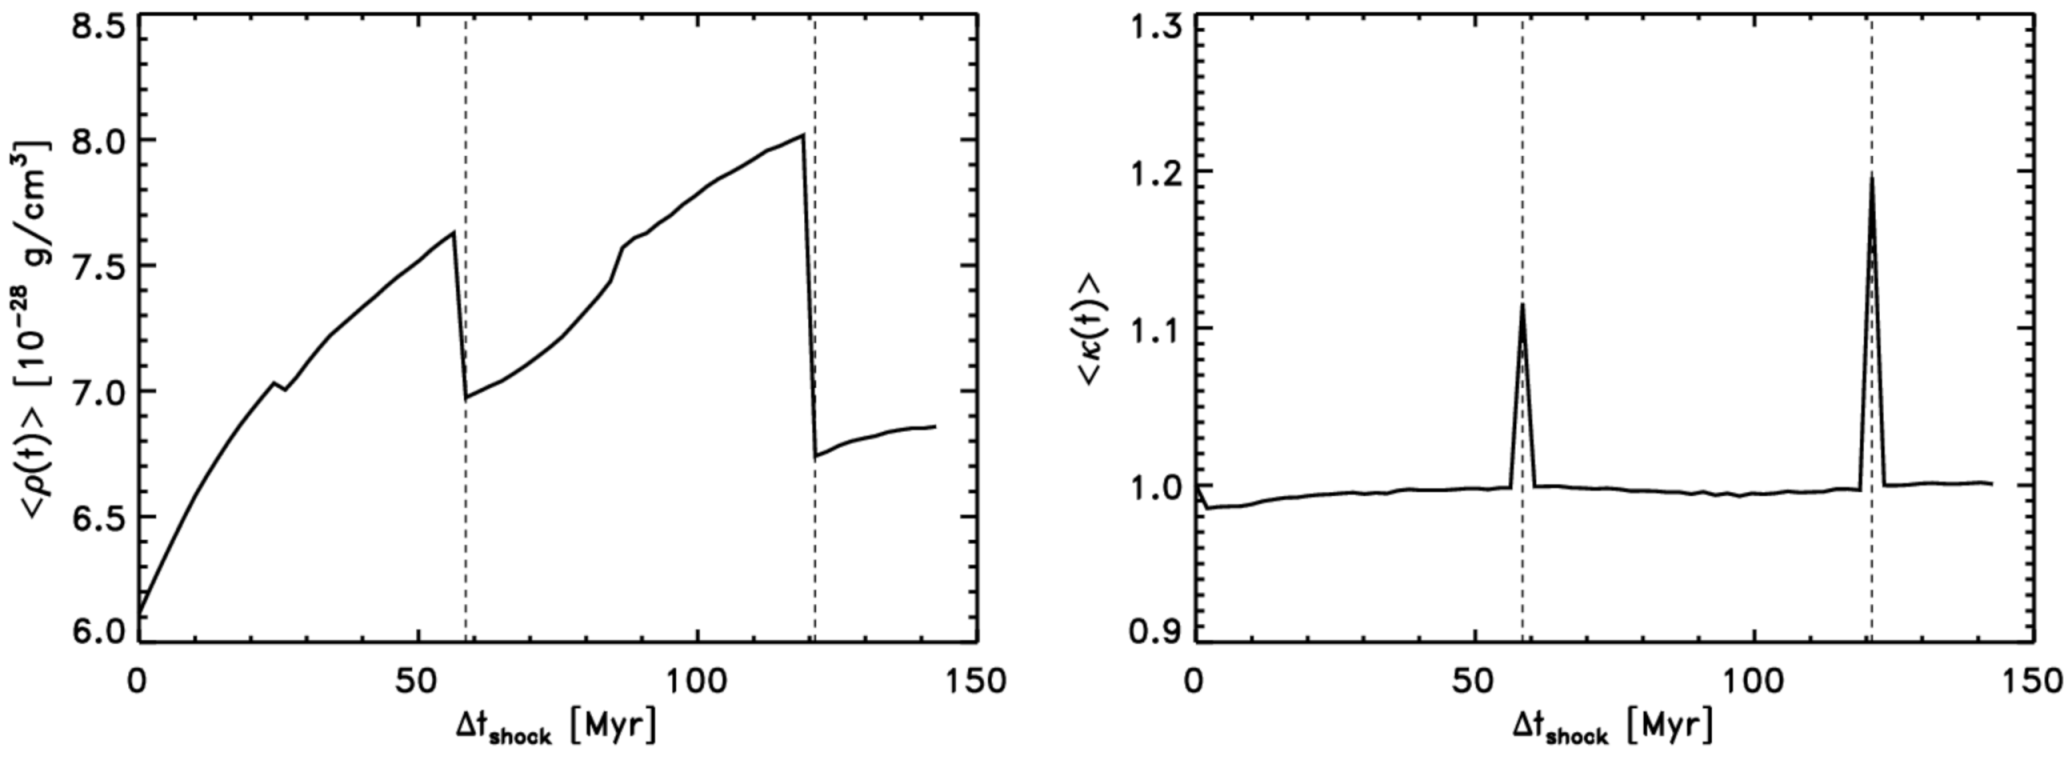
Figure 3.
Maps of the radio power for our two models in units of . The left panel shows relic S. The right panel shows relic A.
Figure 3.
Maps of the radio power for our two models in units of . The left panel shows relic S. The right panel shows relic A.
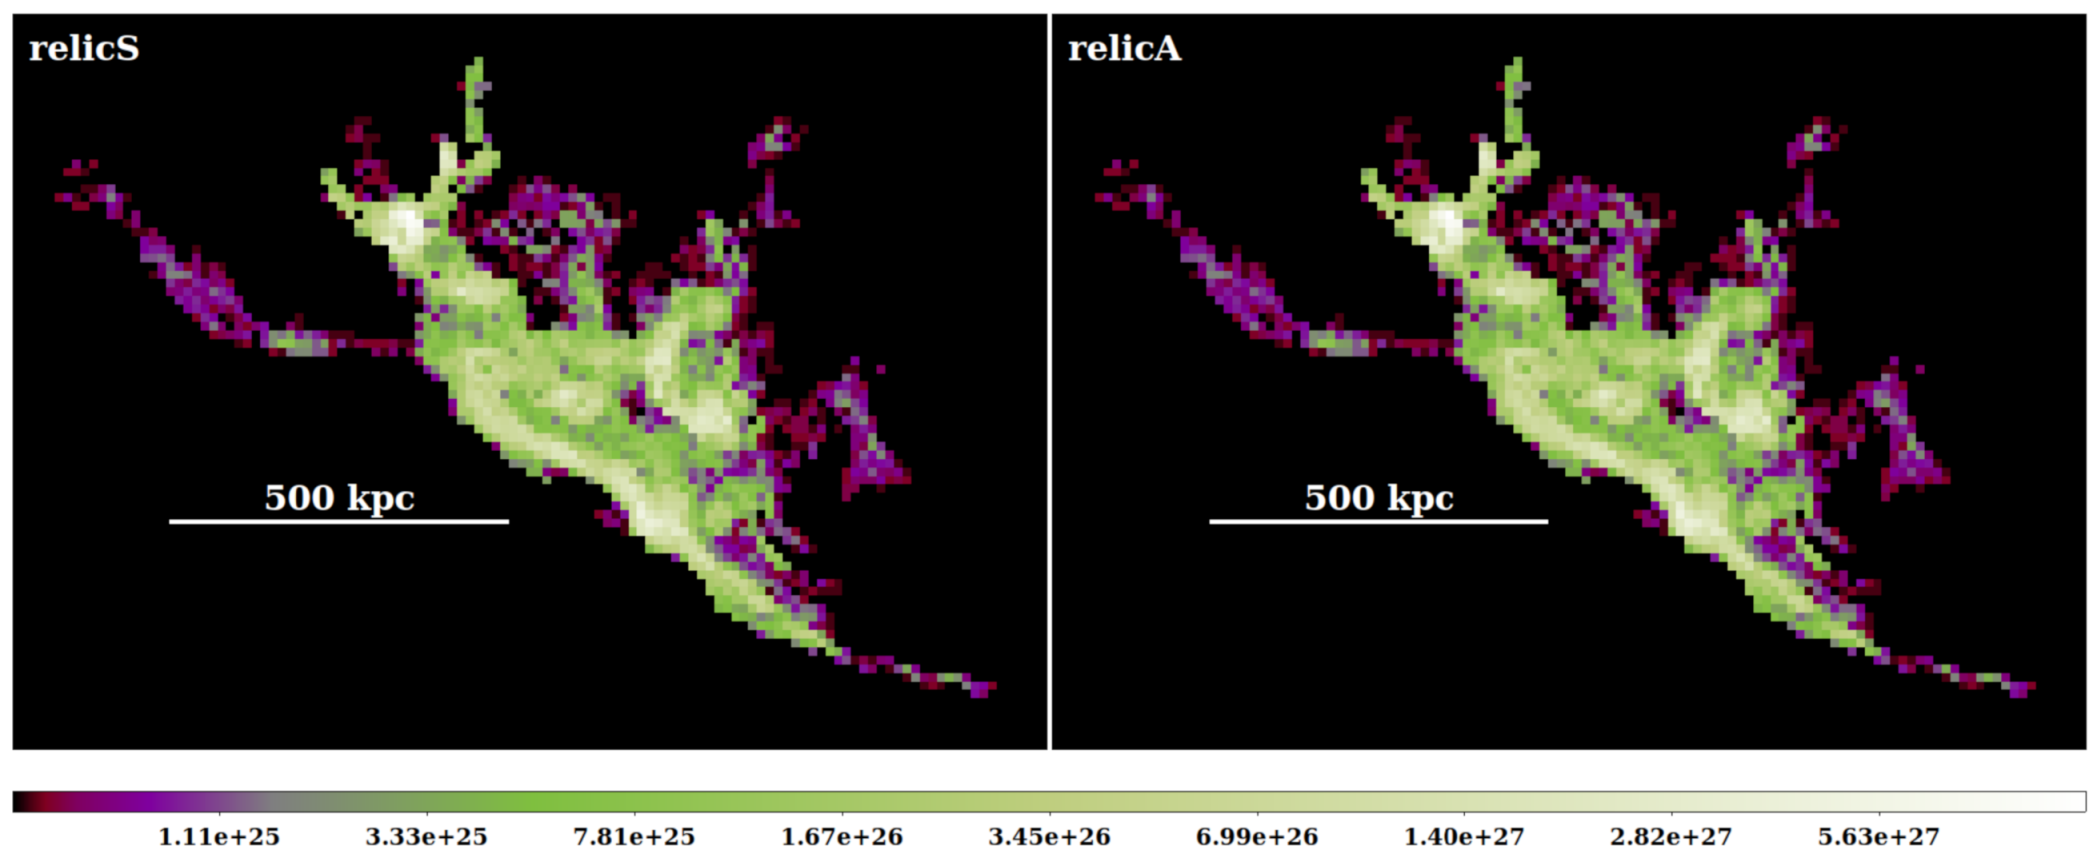
Figure 4.
The left panel shows the residual map of the two relics (see Equation (21)). The right panel shows the volume weighted and radio-weighted distributions of the residuals.
Figure 4.
The left panel shows the residual map of the two relics (see Equation (21)). The right panel shows the volume weighted and radio-weighted distributions of the residuals.

Figure 5.
Left panel: Comparison of the integrated radio spectra measured at . The red triangles give the spectrum of relic S. The blue diamonds give the spectrum for relic A. The red solid line and the blue dashed line give the fitted power-laws. Right panel: relative difference of the integrated radio spectra.
Publisher’s Note: MDPI stays neutral with regard to jurisdictional claims in published maps and institutional affiliations. |
© 2021 by the authors. Licensee MDPI, Basel, Switzerland. This article is an open access article distributed under the terms and conditions of the Creative Commons Attribution (CC BY) license (https://creativecommons.org/licenses/by/4.0/).
Share and Cite
MDPI and ACS Style
Wittor, D.; Hoeft, M.; Brüggen, M. Modelling the Energy Spectra of Radio Relics. Galaxies 2021, 9, 111. https://doi.org/10.3390/galaxies9040111
AMA Style
Wittor D, Hoeft M, Brüggen M. Modelling the Energy Spectra of Radio Relics. Galaxies. 2021; 9(4):111. https://doi.org/10.3390/galaxies9040111
Chicago/Turabian StyleWittor, Denis, Matthias Hoeft, and Marcus Brüggen. 2021. "Modelling the Energy Spectra of Radio Relics" Galaxies 9, no. 4: 111. https://doi.org/10.3390/galaxies9040111
Note that from the first issue of 2016, this journal uses article numbers instead of page numbers. See further details here.