Article

Optical Outburst of the Blazar S4 0954+658 in Early 2015

1
Department of Astrophysics, St. Petersburg State University, Universitetsky Prospekt, 28, Peterhof, St. Petersburg 198504, Russia
2
Institute for Astrophysical Research, Boston University, 725 Commonwealth Ave., Boston, MA 02215, USA
3
Department of Physics, Institute for Plasma Physics, University of Crete, Heraklion GR-71003, Greece
4
Crimean Astrophysical Observatory, P/O Nauchny, Crimea 298409, Russia
5
Harvard-Smithsonian CfA, Cambridge, MA 02138, USA
*
Author to whom correspondence should be addressed.
Galaxies 2016, 4(3), 24; https://doi.org/10.3390/galaxies4030024
Submission received: 12 July 2016 / Revised: 29 August 2016 / Accepted: 30 August 2016 / Published: 3 September 2016
(This article belongs to the Special Issue Blazars through Sharp Multi-wavelength Eyes)

Abstract

:
We analyze the behavior of the BL Lac object S4 0954+658 during an unprecedented bright optical flare in early 2015. The optical flare was accompanied by a powerful γ -ray flare and the detection of very-high-energy γ -ray emission. We analyze total and polarized intensity images obtained with the VLBA at 43 GHz and discover a new bright polarized superluminal knot, which was ejected from the VLBI-core during the peak of the flare.

Graphical Abstract

1. Introduction

The BL Lac object S4 0954+658 ( z = 0 . 367 ) displays significant flux and polarization variability on both intra-day and longer timescales. Optical variability of the source has been comprehensively studied in [1,2]. The multi-wavelength behavior of S4 0954+658 during a powerful outburst in March–April 2011 was analyzed in [3]. Here we perform an analysis of an outburst that occurred in early 2015. We combine observations from cm-wave to γ -ray energies, and compare the light curves with the evolution of the parsec-scale jet structure of the source at 43 GHz.

2. Observation and Data Reduction

Optical (R-band) flux densities were obtained from photometric observations at the 0.4 m telescope of St. Petersburg State U. (LX200) and the 0.7 m telescope of the Crimean Astrophysical Observatory (AZT-8). The data analysis for these telescopes is described in [4]. We also use R-band data obtained with the Perkins Telescope of Lowell Observatory.
We derived 0.1–200 GeV γ -ray flux densities by analyzing data from the Large Area Telescope (LAT) of the Fermi γ -ray Space Telescope with the standard software [5], and constructed a γ -ray light curve with seven- day binning, with a detection criterion that the maximum-likelihood test statistic (TS) should exceed 10.0. Swift/XRT 0.3–10 keV automatically processed data [6] were used to construct an X-ray light curve.
S4 0954+658 is monitored approximately monthly by the Boston University (BU) group with the VLBA at 43 GHz within a sample of bright γ -ray blazars. We analyze total and polarized intensity images produced by the BU group and collaborators. Each image in Stokes I, Q, and U parameters is fit by a model consisting of a number of components with circular Gaussian brightness distributions. Identification of components in the jet across epochs is based on analysis of their flux, position angle, distance from the core, size, degree of polarization, and EVPA (Electric Vector Position Angle). We have computed kinematic parameters of knots (proper motion, velocity, and acceleration) by fitting the positions of each component over epochs by different polynomials, in the same manner as described in [7]. In addition, we use data from the Owens Valley Radio Observatory (OVRO) [8] and the Submillimeter Array (SMA) [9] to construct radio-band light curves.

3. Results and Discussion

In early 2015, S4 0954+658 underwent a dramatic outburst at all wavelengths from gamma to radio band. Figure 1 presents the light curves of the source at different wavelengths during 2006–2016. The flare in February–March of 2015 was the brightest optical state ever observed for the blazar. High-amplitude intra-night variations were detected in both optical light and fractional polarization. Two noticeable episodes of fast variability were observed on February 11 (MJD = 57064), when the flux varied by 0.24 mag in 1.92 h and 0.4 mag in 6.0 h, while the fractional polarization varied from 9.4% to 16.7%. An episode of spectacular variability occurred on March 4 (MJD = 57085), including a 0.23 mag flux increase in 2.1 h, and 0.57 mag smooth decline 6.48 h later, while the fractional polarization varied from 3% to 15%. It should be noted that violent intra-night variability (∼0.7 mag in 7 h and ∼1.0 mag in 5 h) was previously observed during the prominent outburst in March–April of 2011 [3].
Although the γ -ray flux falls below the detection limit during most of the period of Fermi observations, the source exhibits the highest γ -ray activity and shows substantial variability during the 2015 flare. According to the Swift data, there is a bright X-ray flare contemporaneous with the γ -ray flare. In addition to the prominent GeV γ -ray activity, VHE emission was discovered by MAGIC [10] on 13–14 February 2015 (MJD = 57067). Tanaka et al. [11] reported significant hardening of the spectrum in MeV/GeV during the flare maximum.
The flux of the 43 GHz VLBI-core, as well as the polarization degree, increased just before and after the optical flare maximum. Unfortunately, we have no VLBA data at 43 GHz during the flare maximum. Because of this, we cannot determine directly whether the core was in a high state, but the optical flare was contemporaneous with flares at 1 mm and 2 cm, which most likely originated in the core. One can see in Figure 1 that the VLBI-core light curve is in agreement with the flux variations at 1 mm and 2 cm during the entire time span of the observations. The pattern of the flux variations in radio and optical bands is quite similar, although the radio light curve is smoother.
We carefully study the optical and radio polarization behavior of S4 0954+658 near the ejection times of the components. At the quiescent state, the optical EVPA is quite stable (∼ 10 ) and tends to align with the parsec-scale jet direction at 43 GHz (∼ 20 ). Figure 1 shows that the optical EVPA is also in good agreement with the EVPA of the core. The fractional polarization of the core usually increases during optical activity (see [3]).
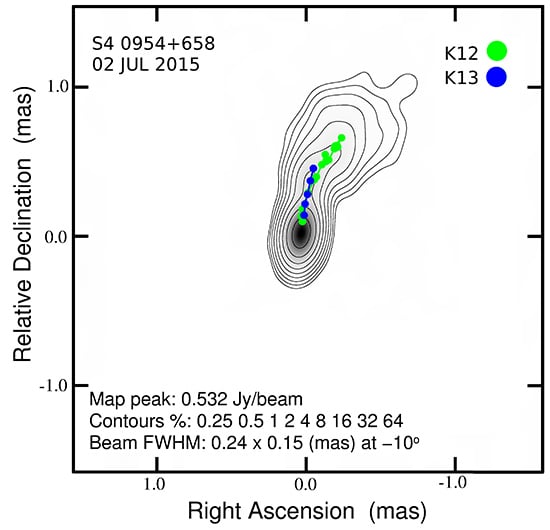
During 2015, several components can be seen in the jet at 43 GHz: K12,K13, A, and T (see [3] for an analysis of the jet kinematics during 2006–2012). Knot K12 was ejected at ∼ MJD 56570 ( β a p p = 12.9 ± 0.23 c, P.A. = 13 ± 8 ). Knot A is a stationary component, and knot T is most likely a trailing component generated by K12 [12]. Separations of knots from the VLBI-core as a function of time at 43 GHz and the trajectories of the knots are presented in Figure 2.
The polarization parameters of K12 (EVPA and polarization degree) are similar to the optical polarization parameters at several epochs after its ejection from the 43 GHz VLBI-core (Figure 1). The knot maintained a high degree of polarization during later epochs (see Figure 3).
The ejection of knot K13 (MJD 57080±15) is contemporaneous with the optical flare in early 2015 (see Figure 1). The apparent velocity of the knot ( β a p p = 23.8 ± 0.5 c) is higher than that of previous components, and the P.A. ( 7 ± 2 ) is quite different from the mean direction of previously ejected components (∼ 15 to 25 , see [3]). The EVPA of K13 is also close to the optical value, but, due to gaps in time coverage of the VLBA data, it is difficult to resolve the 180 ambiguity at MJD ∼ 57200 (see Figure 1).
The observed simultaneous multi-wavelength flares and the ejection of a new superluminal component confirm the connection between the jet behavior at 43 GHz and activity at higher energies that was inferred from previous observations of S4 0954+658. The presence of such a connection implies that the multi-wavelength flare in early 2015 occurred near the 43 GHz VLBA-core.

Acknowledgments

The research at St. Petersburg State University was partly funded by RFBR grants 16-32-00036, 15-02-00949 and SPbSU grant 6.38.335.2015. The research at BU was supported in part by NASA grants NNX14AQ58G and NNX15AR34G. This research has made use of data from the OVRO 40-m monitoring program (Richards, J. L. et al. 2011, ApJS, 194, 29) which is supported in part by NASA grants NNX08AW31G, NNX11A043G, and NNX14AQ89G and NSF grants AST-0808050 and AST-1109911. The Submillimeter Array is a joint project between the Smithsonian Astrophysical Observatory and the Academia Sinica Institute of Astronomy and Astrophysics and is funded by the Smithsonian Institution and the Academia Sinica.

Author Contributions

All authors have participated in both the analysis and the scientific discussion.

Conflicts of Interest

The authors declare no conflict of interest.

References

  1. Raiteri, C.M.; Villata, M.; Tosti, G.; Fiorucci, M.; Ghisellini, G.; Takalo, L.O.; Sillanpää, A.; Valtaoja, E.; Teräsranta, H.; Tornikoski, M.; et al. Optical and radio behaviour of the blazar S4 0954+65. Astron. Astrophys. 1999, 352, 19–31. [Google Scholar]
  2. Hagen-Thorn, V.A.; Larionov, V.M.; Arkharov, A.A.; Hagen-Thorn, E.I.; Blinov, D.A.; Morozova, D.A.; Troitskaya, Y.V.; Takalo, L.O.; Sillanpyää, A. Optical variability of the blazar S4 0954+658 in 2008–2012. Astron. Rep. 2015, 59, 551–562. [Google Scholar] [CrossRef]
  3. Morozova, D.A.; Larionov, V.M.; Troitsky, I.S.; Jorstad, S.G.; Marscher, A.P.; Gómez, J.L.; Blinov, D.A.; Efimova, N.V.; Hagen-Thorn, V.A.; Hagen-Thorn, E.I.; et al. The Outburst of the Blazar S4 0954+658 in 2011 March–April. Astron. J. 2014, 148, 42. [Google Scholar] [CrossRef]
  4. Larionov, V.M.; Jorstad, S.G.; Marscher, A.P.; Raiteri, C.M.; Villata, M.; Agudo, I.; Aller, M.F.; Arkharov, A.A.; Asfandiyarov, I.M.; Bach, U.; et al. Results of WEBT, VLBA and RXTE monitoring of 3C 279 during 2006–2007. Astron. Astrophys. 2008, 492, 389–400. [Google Scholar] [CrossRef]
  5. Atwood, W.B.; Abdo, A.A.; Ackermann, M.; Althouse, W.; Anderson, B.; Axelsson, M.; Baldini, L.; Ballet, J.; Band, D.L.; Barbiellini, G.; et al. The Large Area Telescope on the Fermi Gamma-Ray Space Telescope Mission. Astrophys. J. 2009, 697, 1071–1102. [Google Scholar] [CrossRef]
  6. Stroh, M.C.; Falcone, A.D. Swift X-Ray Telescope Monitoring of Fermi-LAT Gamma-Ray Sources of Interest. Astrophys. J. Suppl. Ser. 2013, 207, 28. [Google Scholar] [CrossRef]
  7. Jorstad, S.G.; Marscher, A.P.; Lister, M.L.; Stirling, A.M.; Cawthorne, T.V.; Gear, W.K.; Gómez, J.L.; Stevens, J.A.; Smith, P.S.; Forster, J.R.; et al. Polarimetric Observations of 15 Active Galactic Nuclei at High Frequencies: Jet Kinematics from Bimonthly Monitoring with the Very Long Baseline Array. Astron. J. 2005, 130, 1418–1465. [Google Scholar] [CrossRef]
  8. Richards, J.L.; Max-Moerbeck, W.; Pavlidou, V.; King, O.G.; Pearson, T.J.; Readhead, A.C.S.; Reeves, R.; Shepherd, M.C.; Stevenson, M.A.; Weintraub, L.C.; et al. Blazars in the Fermi Era: The OVRO 40 m Telescope Monitoring Program. Astrophys. J. Suppl. Ser. 2011, 194, 29. [Google Scholar] [CrossRef]
  9. Gurwell, M.A.; Peck, A.B.; Hostler, S.R.; Darrah, M.R.; Katz, C.A. Monitoring phase calibrators at submillimeter wavelengths. In Z-Machines to ALMA: (Sub)Millimeter Spectroscopy of Galaxies; NASA: Greenbelt, MD, USA, 2007; Volume 375, p. 234. [Google Scholar]
  10. Mirzoyan, R. Discovery of Very High Energy Gamma-Ray Emission from the FSRQ S4 0954+65 with the MAGIC telescopes. The Astronomer’s Telegram ATel7080. Available online: http://www.astronomerstelegram.org/?read=7080 (accessed on 20 August 2016).
  11. Tanaka, Y.T.; Gonzalez, J.B.; Itoh, R.; Finke, J.D.; Inoue, Y.; Ojha, R.; Carpenter, B.; Lindfors, E.; Krauss, F.; Desiante, R.; et al. A significant hardening and rising shape detected in the MeV/GeV νFν spectrum from the recently discovered very-high-energy blazar S4 0954+65 during the bright optical flare in 2015 February. Publ. Astron. Soc. Jpn. 2016. [Google Scholar] [CrossRef]
  12. Agudo, I.; Gomez, J.L.; Marti, J.M.; Ibanez, J.M.; Marscher, A.P.; Alberdi, A.; Aloy, M.A.; Hardee, P.E. Jet Stability and the Generation of Superluminal and Stationary Components. Astrophys. J. 2001, 549, L183–L186. [Google Scholar] [CrossRef]
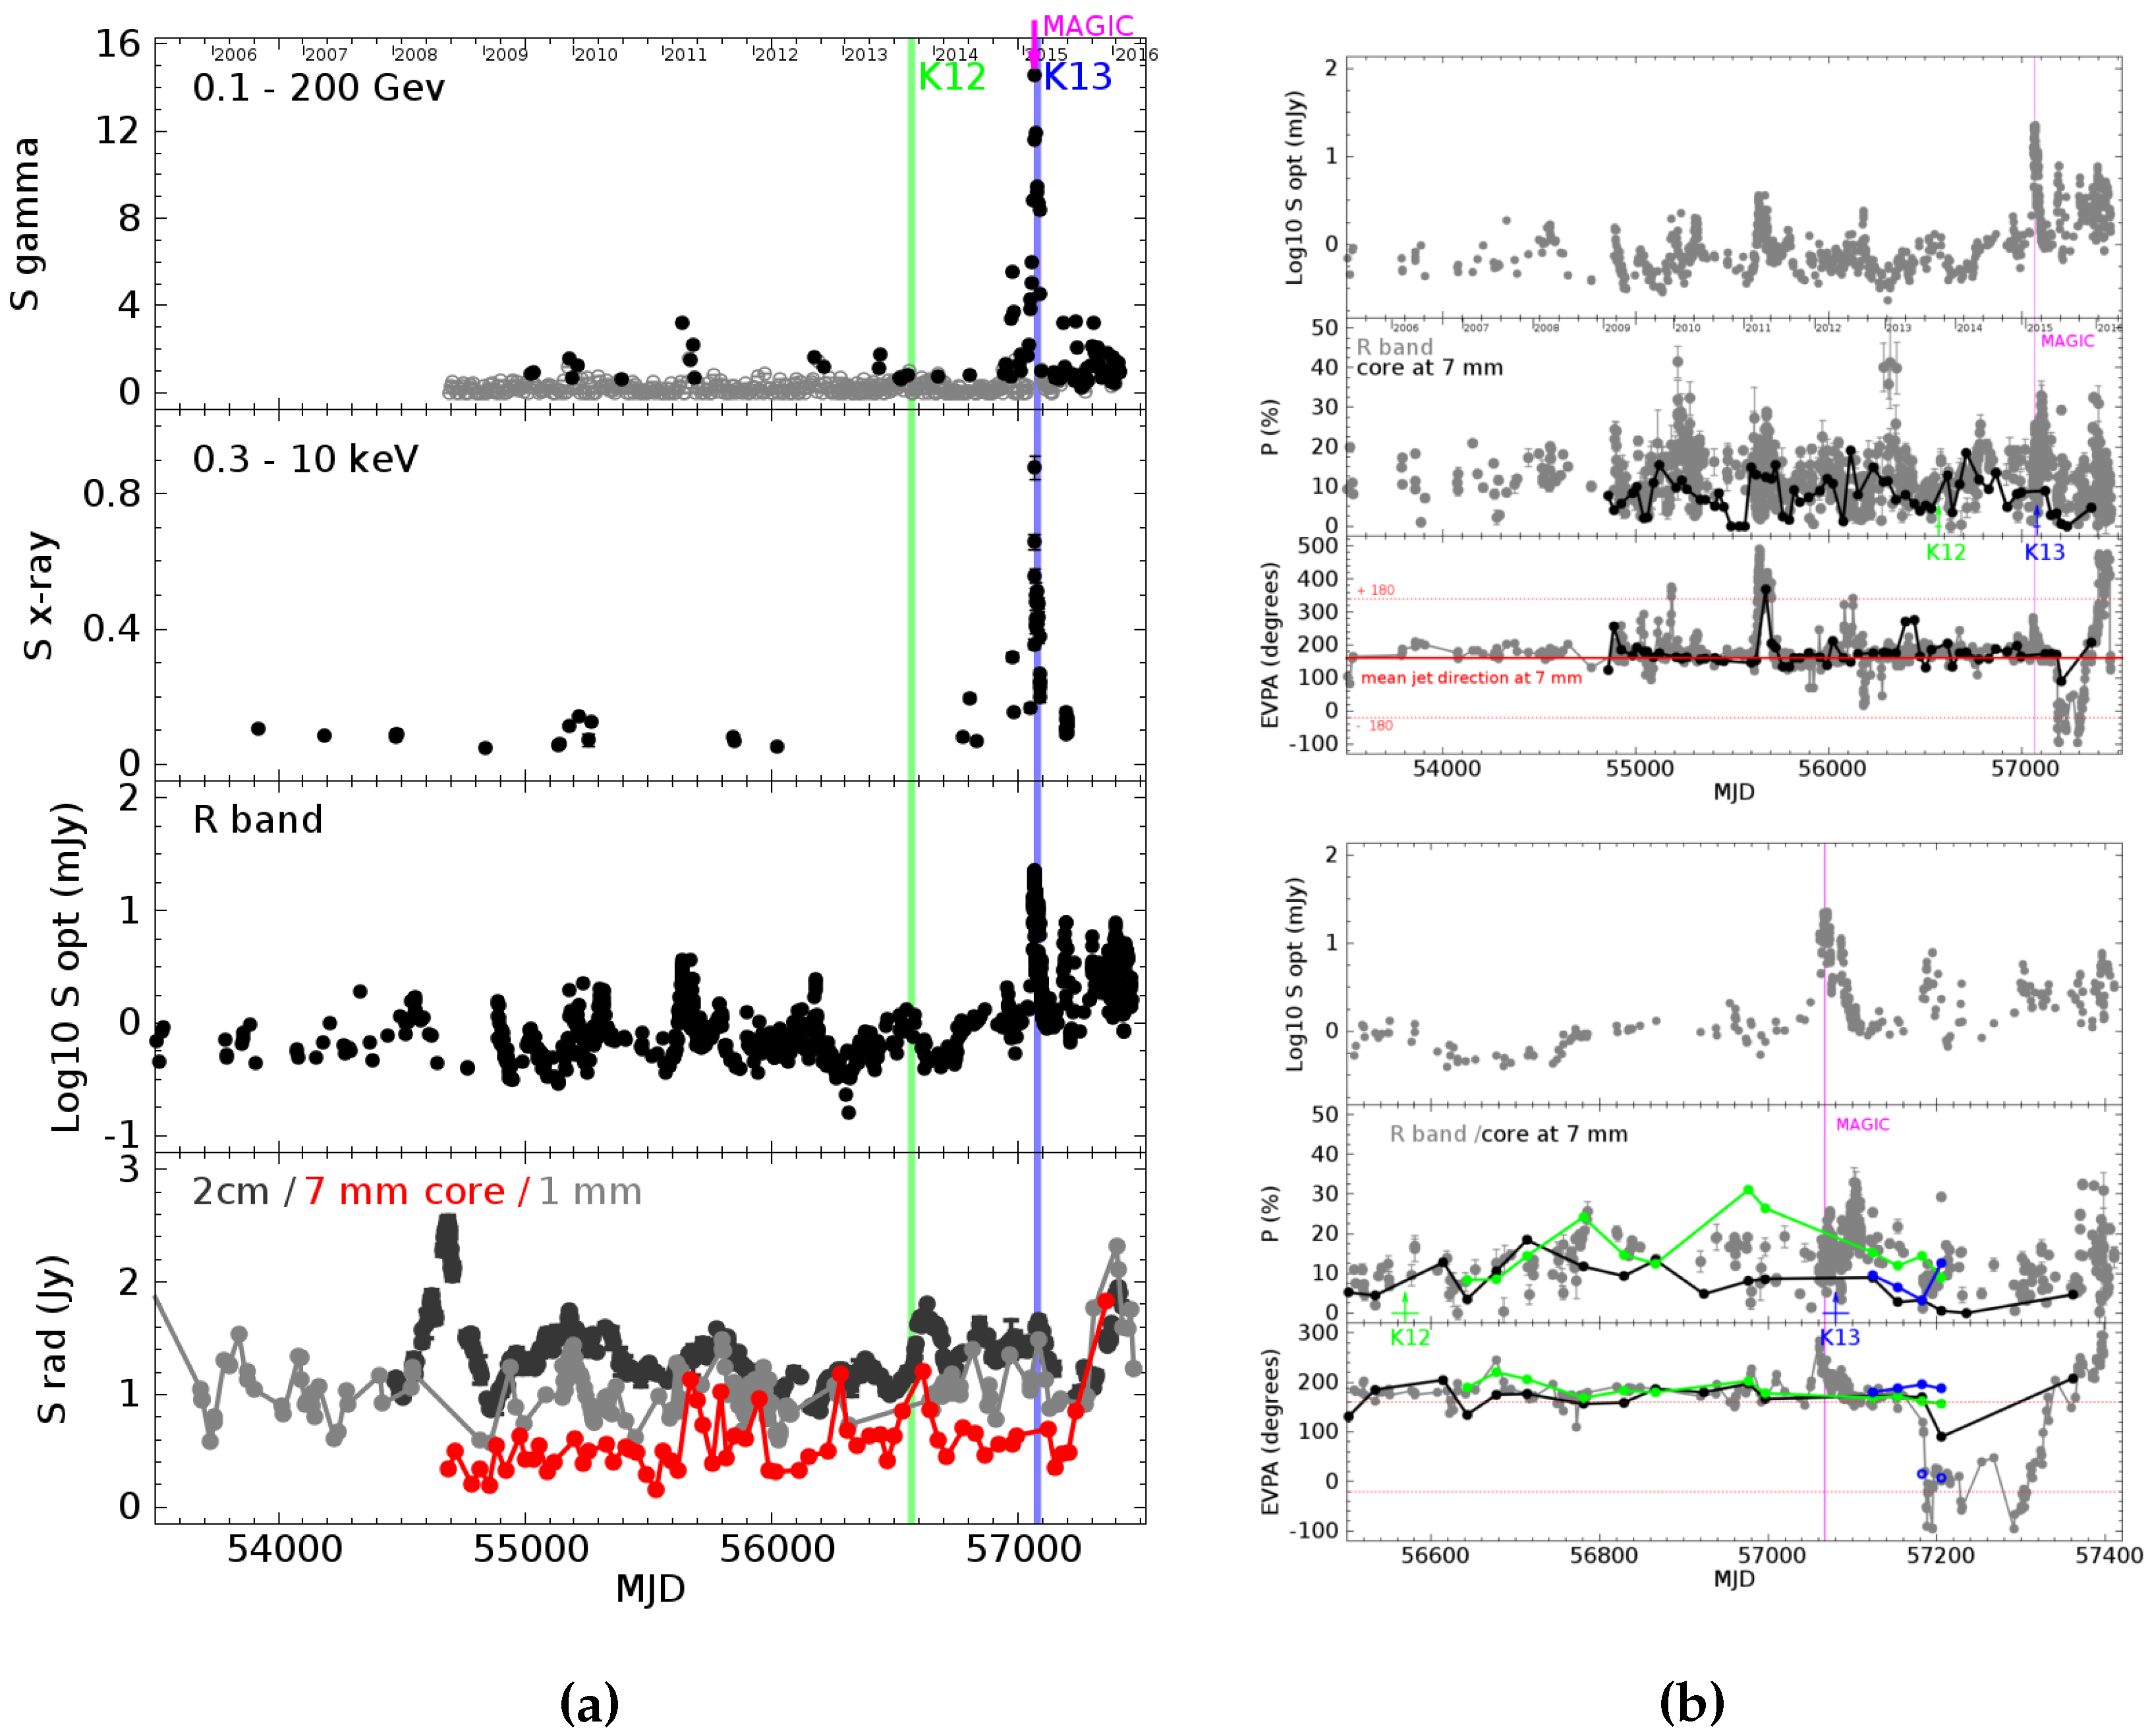
Figure 1. (a) Light curves of S4 0954+658 from 2005 to 2016 (from top to bottom): γ -ray, X-ray, R-band optical, and radio (1 mm, 7 mm, and 2 cm). The ejections of new superluminal knots are marked with green bands. (b) Upper panel shows R-band optical light curve, fractional polarization, and EVPA. Gray dots show measurements in the R band, black dots are those of the VLBI-core at 43 GHz. Lower panel shows an enlargement of the light curve during the ejections of knots K12 and K13. Green and blue dots correspond to knots K12 and K13, respectively.
Galaxies 04 00024 g001
Figure 2. (a) Separations of knots from the VLBI-core as a function of time at 43 GHz; (b) 43 GHz image of S4 0954+658 with trajectories of knots superposed.
Galaxies 04 00024 g002
Figure 3. Total (yellow contours) and polarized (color scale) intensity images at 43 GHz; yellow line segments over the color scale show the direction of the electric vector.
Galaxies 04 00024 g003