1. Introduction
The development of a rapid and accurate means for identifying the cause of a systemic infection has been a subject of intense interest due to the need for proper course of treatment in order to improve patient outcomes. Additionally, there is a growing need for accurate diagnoses due to the toll in human and economic terms caused by endemic diseases transmitted by mosquitoes in tropical regions. Of particular focus in developing countries in the tropical region is the ability to ascertain whether a patient has contracted Dengue virus and specifically which serotype (DEN-1, 2, 3, 4) is the probable cause of the illness. While symptomatic diagnostics play an important role in all febrile disease management, some patients are asymptomatic or have mild symptoms, and diagnosis of these patients can be critical because Dengue Fever serotypes are believed to be directly linked to severe courses of infection such as Dengue Shock syndrome (DSS) and Dengue Hemorrhagic Fever (DHF), making early serotype identification a potentially valuable tool. Moreover, confirmation of whether the patient has had a prior serotype infection, which has also been linked to DSS and DHF, can also help to determine the course of treatment and further steps to prevent an outbreak of Dengue [
1,
2,
3,
4].
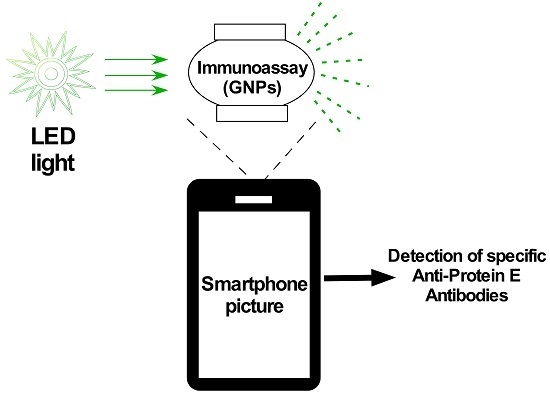
In order to meet the need for a rapid diagnostic that can be implemented in the field and closely based on patient exposure and/or immune response at an early stage of patient-reported symptoms, a hybrid approach that combines gold nanoparticle conjugates (similar to what is used in low-cost paper diagnostics based on lateral flow immunoassay technology) in conjunction with a portable sensor for detecting a positive response with a high level of sensitivity at low antigen levels is the subject of this feasibility study. In order to establish a relatively low-cost diagnostic tool, the hybrid technology described in this paper builds upon the employment of an optical caustic light scattering technology that employs no lenses and does not need filters [
5]. Moreover, the use of battery-powered LEDs and the deployment of a smartphone to analyze the scattered light are also helpful in reducing costs, as well as in improving access to the device for low and middle income countries.
To commence a process of verifying the capabilities of the new hybrid technology platform in a simulated low resource setting, our approach was to first determine if an existing Dengue molecular reagent used for gold nanoparticle conjugation in paper assays could detect Dengue antibodies with human patient samples by employing this new hybrid technology platform. For the first part of this study, we analyzed the 90° light scattering response of conjugated gold nanoparticles to different concentrations of anti-protein E antibody in vitro to determine key parameters, such as: (1) the size of the gold nanoparticle that should be used; and (2) the stability of the gold nanoparticle conjugates when subjected to transportation and varying temperature conditions. For the second part of the study, a direct approach with clinically-relevant human serum samples, was used since it is a faster way to determine other important parameters such as: (1) whether very small amounts of human serum samples can yield reasonable signals; (2) determine the need for additional dilution or blocking steps when working with human serum; and (3) whether room or body temperature and incubation time generate differences in measurement. Thus, the overall objective of this feasibility study is solely to gain experience in practical aspects of developing a rapid and hybrid quantitative assay for determining Dengue infection by monitoring patient antibody response while simulating a low resource setting in order to expand testing in a variety of locales and with a wider variation in infrastructure than is normally the case in high-income country clinics and hospitals.
2. Materials and Methods
2.1. Gold Nanoparticle Light-Scattering Calibration
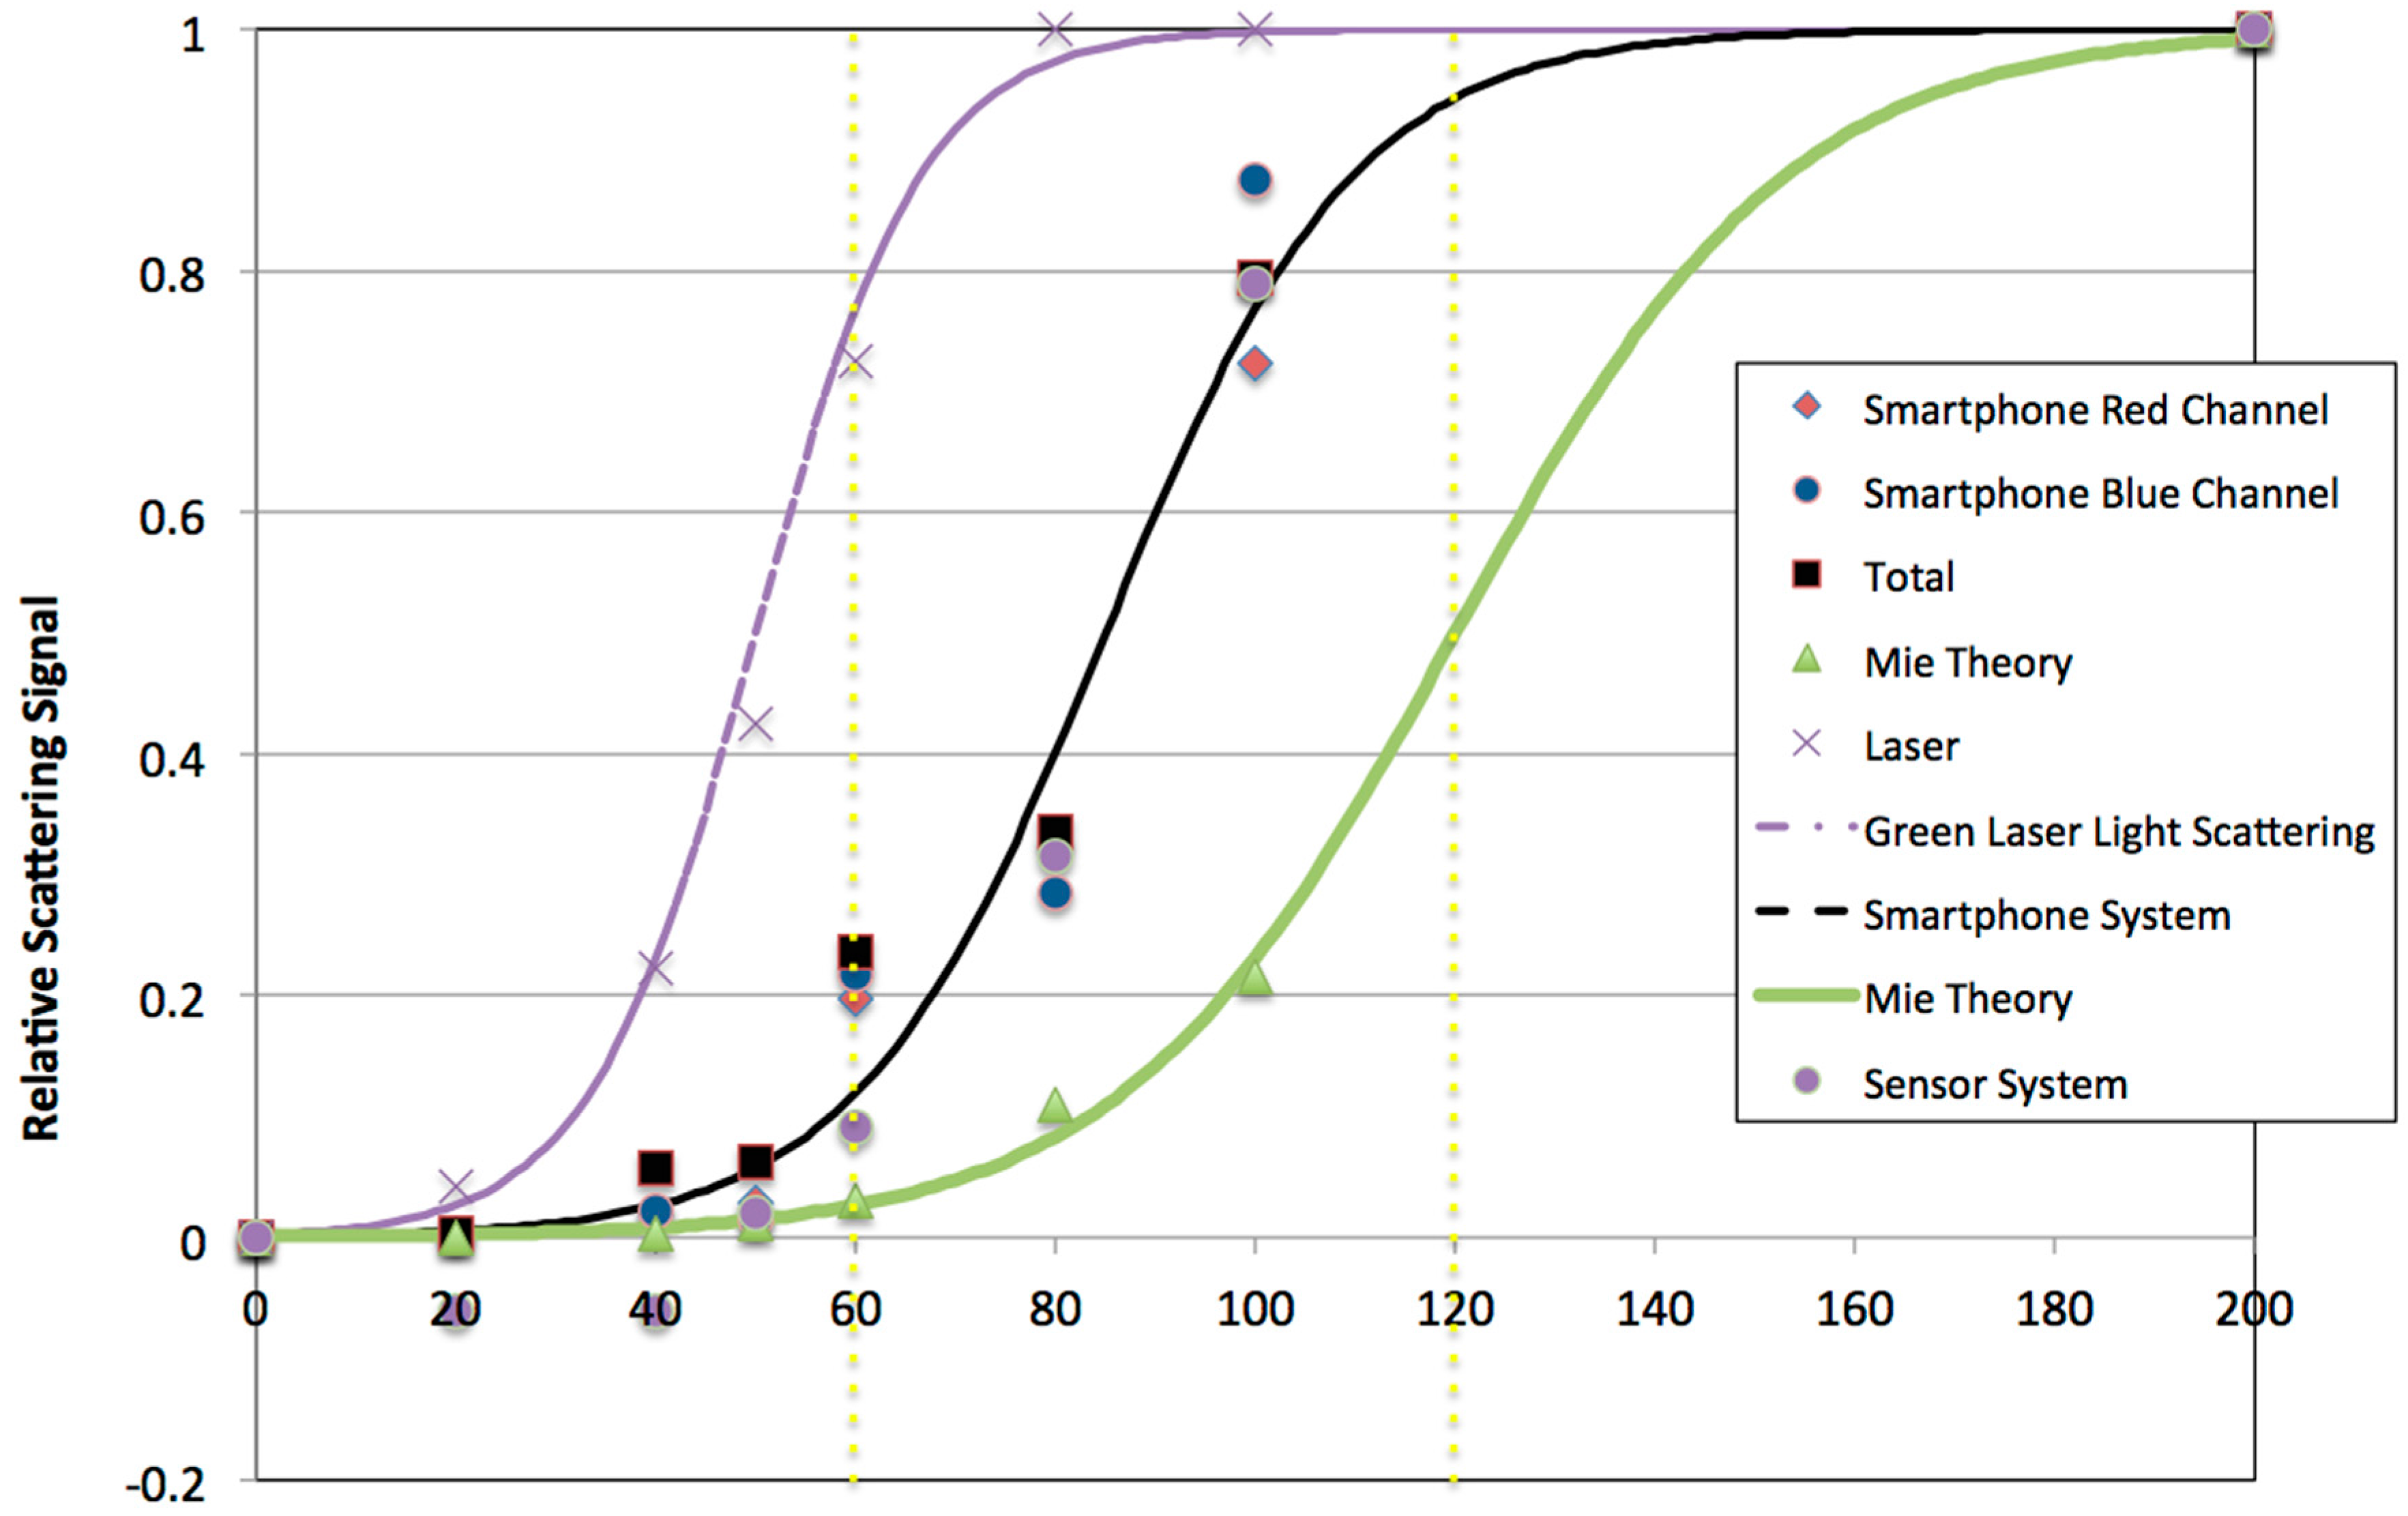
For calibration purposes, unconjugated gold nanoparticles of 20, 40, 50, 60, 80, 100, and 200 nm (Ted Pella Inc., Redding, CA, USA) were diluted 1:10 in distilled deionized water and analyzed for light scattering and extinction using three separate detection methods. Each gold particle size sample contained the same overall molar concentration of gold. Light extinction spectra acquisition were taken with an Ocean Optics Fiber Optic Spectrometer (Ocean Optics, Dunedin, FL, USA,
http://oceanoptics.com) specifically a USB4000 spectrometer and SpectraSuite software (Ocean Optics, Dunedin, FL, USA,
http://oceanoptics.com) for control and data acquisition. A quartz cuvette of 1 cm path length was used to acquire samples. Spectra for ultraviolet-visible (UV-VIS) data was generally collected between 10 and 100 ms integration time and 20 and 100 spectra were averaged for each sample.
2.2. Gold Nanoparticle Conjugation
In a 1.5 mL Eppendorf tube, an aliquot of 1 mL containing 2.6 × 10
10 spherical particles/mL (37.7 pM) of 60 nm citrate stabilized gold colloids (Ted Pella Inc., Redding, CA, USA) was combined with 100 microliters of freshly prepared 1 M pH = 8.5 borate buffer, which has the same pH as the protein E, prior to the addition of protein E Dengue Envelope-2 32 kDA (MCR-054, Reagent Proteins, Pfenex Inc., San Diego, CA, USA). The amount of protein E was established performing a titration with different amounts of protein E and salt addition to determine the amount of protein needed when colloid stability is reached, as it was described before [
6,
7]. Aggregation of the gold nanoparticles was observed when the amount of protein was not enough, and it was evidenced by visual aggregation and color change from pink to purple or a clear solution. Three different amounts of protein E were conjugated to 1 mL of 60 nm gold nanoparticles, showing that at least 42.5 µg were needed to cover the gold nanoparticles and not induce aggregation in the presence of PBS after the last re-suspension. Fifty microliters of a 0.85 mg/mL Dengue Protein E solution were added to the solution of borate buffer and gold nanoparticles described above. A frozen cold pack was placed on the tube and the mixture was gently rocked using an orbital table for 30 min. This was followed by the addition of 2.5 microliters of 10% Tween 20 and rocking on the orbital table for five more minutes.
One or three centrifugation steps were then conducted in order to reduce the concentration of unbound protein E form the suspension. A Beckman Coulter Microfuge 18 (Beckman Coulter, Brea, CA, USA) was placed in a 4 °C environmental room in order to minimize aggregation of gold nanoparticles and ensure resuspension after centrifugation. The first centrifugation was for 30 min at 3500× g. Immediately after centrifugation, as much of the supernatant as possible was carefully removed from the pellet using a 200 µL micropipette, while not disturbing the pellet. Once this was accomplished, 1 mL of 1 M pH = 8.5 borate buffer was added to re-suspend the pellet. An aliquot of 2.5 microliters of 10% Tween 20 was then added to the suspension and the mixture was gently rocked for 5 min. Afterwards, the suspension was centrifuged again for 15 min at 3500× g. The same procedure was used following the second centrifugation as described for the first centrifugation step. For the third centrifugation, the time was shortened to 10 min. After the third and final centrifugation, the pellet was re-suspended in 0.5 mL of a 0.2 mg/mL solution of bovine serum albumin (BSA) in deionized (DI) water to block the remaining unreacted sites on the gold nanoparticles. The particles were then incubated on the orbital table for an additional 5 min. This was followed by the addition of 0.5 mL of DI water and 0.5% sodium azide. The final concentration of the conjugated gold nanoparticles was calculated using the absorbance measured using a NanoDrop 2000 (Bio Rad Laboratory, Hercules, CA, USA) and the molar extinction coefficient, and it was 1.19 × 10¹⁰ particles/mL. The stability and confirmation of the conjugation of the gold nanoparticles was monitored using UV-VIS spectrophotometry using a Nanodrop 1000 (Bio Rad Laboratory, Hercules, CA, USA) and dynamic light scattering measurements.
2.3. Detection of Anti-Protein E Antibody In Vitro
To 100 µL of the conjugated gold nanoparticle solution (1.19 × 10¹⁰ particles/mL), 900 µL of phosphate buffer saline (PBS) were added. Posteriorly, 10 µL of different concentrations of anti-protein E antibody (0–10 ng/mL) were added prior to measuring 90-degree light scattering using the oval plastic chamber and the handheld optical caustic sensor which used a Nokia 920 smartphone and Lumia software for imaging. Pictures of the oval chamber were taking using different times of exposure (0.1 s or 1 s) and by reducing overall brightness to the lowest level in the Lumia camera app. The images were analyzed measuring the raw intensity in ImageJ (NIH, Bethesda, MD, USA) using the green or red channel, depending upon the level of saturation of the green channel, and by focusing in the zone of the sample chamber where scattering by the gold nanoparticles provides pixels with brightness above the typical PBS solution pixel values of 0–5 (out of a maximum range of 255). The controls were compared with the samples for statistical differences using the two-tailed t-test.
2.4. Dot Blot Using Conjugated Gold Nanoparticles
Standard dot blot paper (Bio Rad Laboratories, Hercules, CA, USA) was cut into rectangular or hexagonal shapes in order to fit into 12 well Corning Costar Tissue Culture Plates (Ted Pella Inc., Reading, CA, USA). After punching a hole in the center of the paper with a sterile pin, 3 µL of 1:100 PBS diluted human serum was placed over the area around the pin hole and allowed to dry for 5 min at 37 °C. Then, the paper was cooled to 4 °C and allowed to incubate for 15 min. Following incubation, an aliquot of 1 mL of a 3% skim milk in PBS blocking solution was added to the chamber and mixed for 15 min at room temperature. After incubating in the blocking solution for 30 min at 37 °C, an aliquot of 500 µL of a 1:10 diluted suspension of 60 nm protein E conjugated gold nanoparticle was added to the paper. Incubation with the gold nanoparticle conjugate was conducted for 1 h at 37 °C. After the final incubation, the paper was rinsed three times in PBS–Tween 20 buffer and allowed to dry.
2.5. Testing of Human Serum Samples
The Committee of Bioethics from the Regional Research Center, and Dr. Hideyo Noguchi at the Autonomous University of Yucatan (UADY), approved the use of sera samples previously obtained for another research project (CIRB-2010-0021, 1 December 2010). The samples were obtained between 2010 and 2015 by medical personnel. The frozen stored samples coded and linked to their test results were donated in a depersonalized manner, making sure no researcher was involved in the identification process of any sample.
Two 6 mL bottles of conjugated gold nanoparticle reagent gold nanoparticles (GNP)-60-E were created (1.19 × 10¹⁰ particles/mL) according to the protocol described above except that while one GNP reagent (GNP-60-E-3) was centrifuged three times to remove unbound protein E, a second reagent (GNP-60-E-1) was centrifuged only once. Both reagents were stored for 16 h at 4 °C then transported at room temperature for 19 h, until refrigerated at 4 °C at the UADY. Both GNP-60-E reagents arrived un-aggregated at UADY based on both Nanodrop 2000 spectrometer (Bio Rad Laboratory, Hercules, CA, USA) visible spectra taken at the Universidad Autónoma del Yucatán before using the reagents and by visual observation of the gold nanoparticle suspension.
For each test, in a 1.5 mL Eppendorf tube, 900 µL of PBS were combined with 100 µL of the gold nanoparticle conjugate solution followed by the addition of 5 or 10 µL of the human serum samples or a negative control of PBS. For the testing at 37 °C, GNP-60-E-3 was used and 10 microliters of undiluted human serum was added. Incubation was performed for 30 min at 37 °C without agitation. Afterwards, each test sample was placed in an oblate spheroid chamber and capped, followed by imaging with the smartphone sensor. For the first trial at 22 °C, GNP-60-E-3 was used and 5 µL of undiluted human serum was added. Incubation was performed for 15 min at 22 °C without agitation. Afterwards, each test sample was placed in an oblate spheroid chamber and capped, followed by imaging. For the second trial at 22 °C, GNP-60-E-1 was used and 2 µL of 1:10 diluted human serum was added. Incubation was performed for 15 min at 22 °C without agitation. Afterwards, each test sample was placed in an oblate spheroid chamber and capped, followed by imaging. Light scattering was analyzed using ImageJ using the average gray values obtained in vitro with the controls as a reference for positive and negative values. Negative values would be classified as the negatively value plus two standard deviations, positive if it was close to the positive control, and weakly positive if it was a mean gray value in the middle.
2.6. Light Scattering Measurement Systems
For 90-degree laser light benchtop scattering measurements, an Ocean Optics Fiber Optic Spectrometer (Ocean Optics, Dunedin, FL, USA) was used with a USB4000 spectrometer and SpectraSuite Software for control and data acquisition. A quartz cuvette of 1 cm path length with all four windows clear for measurement enables 90-degree placement of an InPhotonics 532 nm laser, with an Ocean Optics controller from the fiber optic collector, to measure counts of scattered light. Readings of 1 s integration time with five spectra averaging was used.
For dynamic light-scattering measurements, a Beckman Coulter DelsaNano C particle analyzer (Fullerton, CA, USA) was used to perform size analysis (with 50 measurements over 2 s for each sample) with CONTIN, Marquandt or non-negative least squares (NNLS) analysis to obtain the intensity distribution.
2.7. 3D Printed Oblate Spheroid Chamber
Autodesk Fusion 360 software was used to generate the 3D oblate spheroid sample chamber used in the handheld optical caustic sensor. In order to place the sample chamber in the LED illumination chamber and easily remove it after imaging, a solid rectangular peg was added to the center of the base. The opening of the sample chamber was sized and designed with a small ridge in order to accommodate lids cut from 200 microliter PCR tubes. Fabrication of the sample chambers were done in batches of 12 by transmitting the drawing to a 3D printing company (iMaterialise, Leuven, Belgium). 3D printing is conducted using stereolithography with a transparent resin and the finished product is between water clear and translucent, in terms of visibility to the naked eye.
2.8. Handheld Smartphone Optical Caustic Light Scattering Sensor
A previously described handheld smartphone-enabled optical caustic light scattering sensor was used to capture images of samples in an oblate spheroid chamber [
5,
8]. A 532 nm green photodiode (Industrial Fiber Optics, Tempe, AZ, USA) illuminated the sample chamber at a 90° angle from a Nokia Lumia 920 (Nokia, Espoo, Finland) smartphone camera lens. Images were collected at 0.5 s exposure using the Lumia camera app. At this exposure level, and with the intensity of light used, the green channel of the Red, Green, Blue color model (RGB) images saturate. However, excess light due to scattering can be imaged in the center of the sample chamber by splitting the color channels using ImageJ. ImageJ software was used to collect the intensity of the red, green, and blue channels for each image. Integrated density measurements from ImageJ was collected for a constant image area and used to quantify the amount of scattering observed for gold nanoparticles in water, conjugated gold nanoparticles with a serum sample, or a phosphate-buffered saline (PBS) control.
2.9. Digital Color Optical Caustic Light-Scattering Sensor
In lieu of a smartphone to collect images and in order to corroborate the gold nanoparticle scattering vs. size calibration with the optical caustic sample chamber, a digital color sensor S9706 (Hamamatsu Photonics, Hamamatsu, Japan) collected light from the oblate spheroid sample chamber at a 90° angle and a distance of 10 mm from the center of the chamber. Due to the proximity of the sensor to the sample chamber, a 3D printed tubular mask with an opening of 7 mm in diameter was used to block the incident light. A 3D printed chamber with interior angled walls was also fabricated and used to minimize light reflection. The digital color sensor was connected to an Arduino Uno computer and the manufacturer’s recommended algorithm was deployed to acquire data at different integration times. Data for the gold nanoparticles in water was acquired using between 0.1 and 30 s integration time. Since a lower intensity of LED light was used than with the smartphone system, data for 20, 40, 50, 60, 80, 100, and 200 nm was collected for the green channel of the sensor. The most accurate data to compare scattering using the digital color sensor in this system was the highest integration time of 30 s, which was then used to compare with the smartphone light-scattering results.
4. Discussion
Detection methods in developing countries for tropical diseases need to be accurate and performed in a timely manner to prevent disease. The approach described in this study aimed to combine gold nanoparticle conjugates with a portable (smartphone) sensor for detecting with a high level of sensitivity at low antigen levels [
8]. The first part of the study described was the calibration of the gold nanoparticle size (
Figure 1). The overall interpretation of the calibration data is that using 60 nm gold particles is very practical for the intended application. The reason for this is that there is a dramatic (approximately 340%) increase in signal predicted when two 60 nm gold particles aggregate upon antibody-antigen binding, basically the change in relative signal from 60 to 120 nm gold particle size.
The stability of the conjugated gold nanoparticles is a factor that directly affects the efficiency of the assay. The process of conjugation was first performed with one or three centrifugation steps in order to eliminate free protein that was not bound to the gold nanoparticles adding before each step a surfactant (Tween 20) to help resuspend the gold nanoparticles [
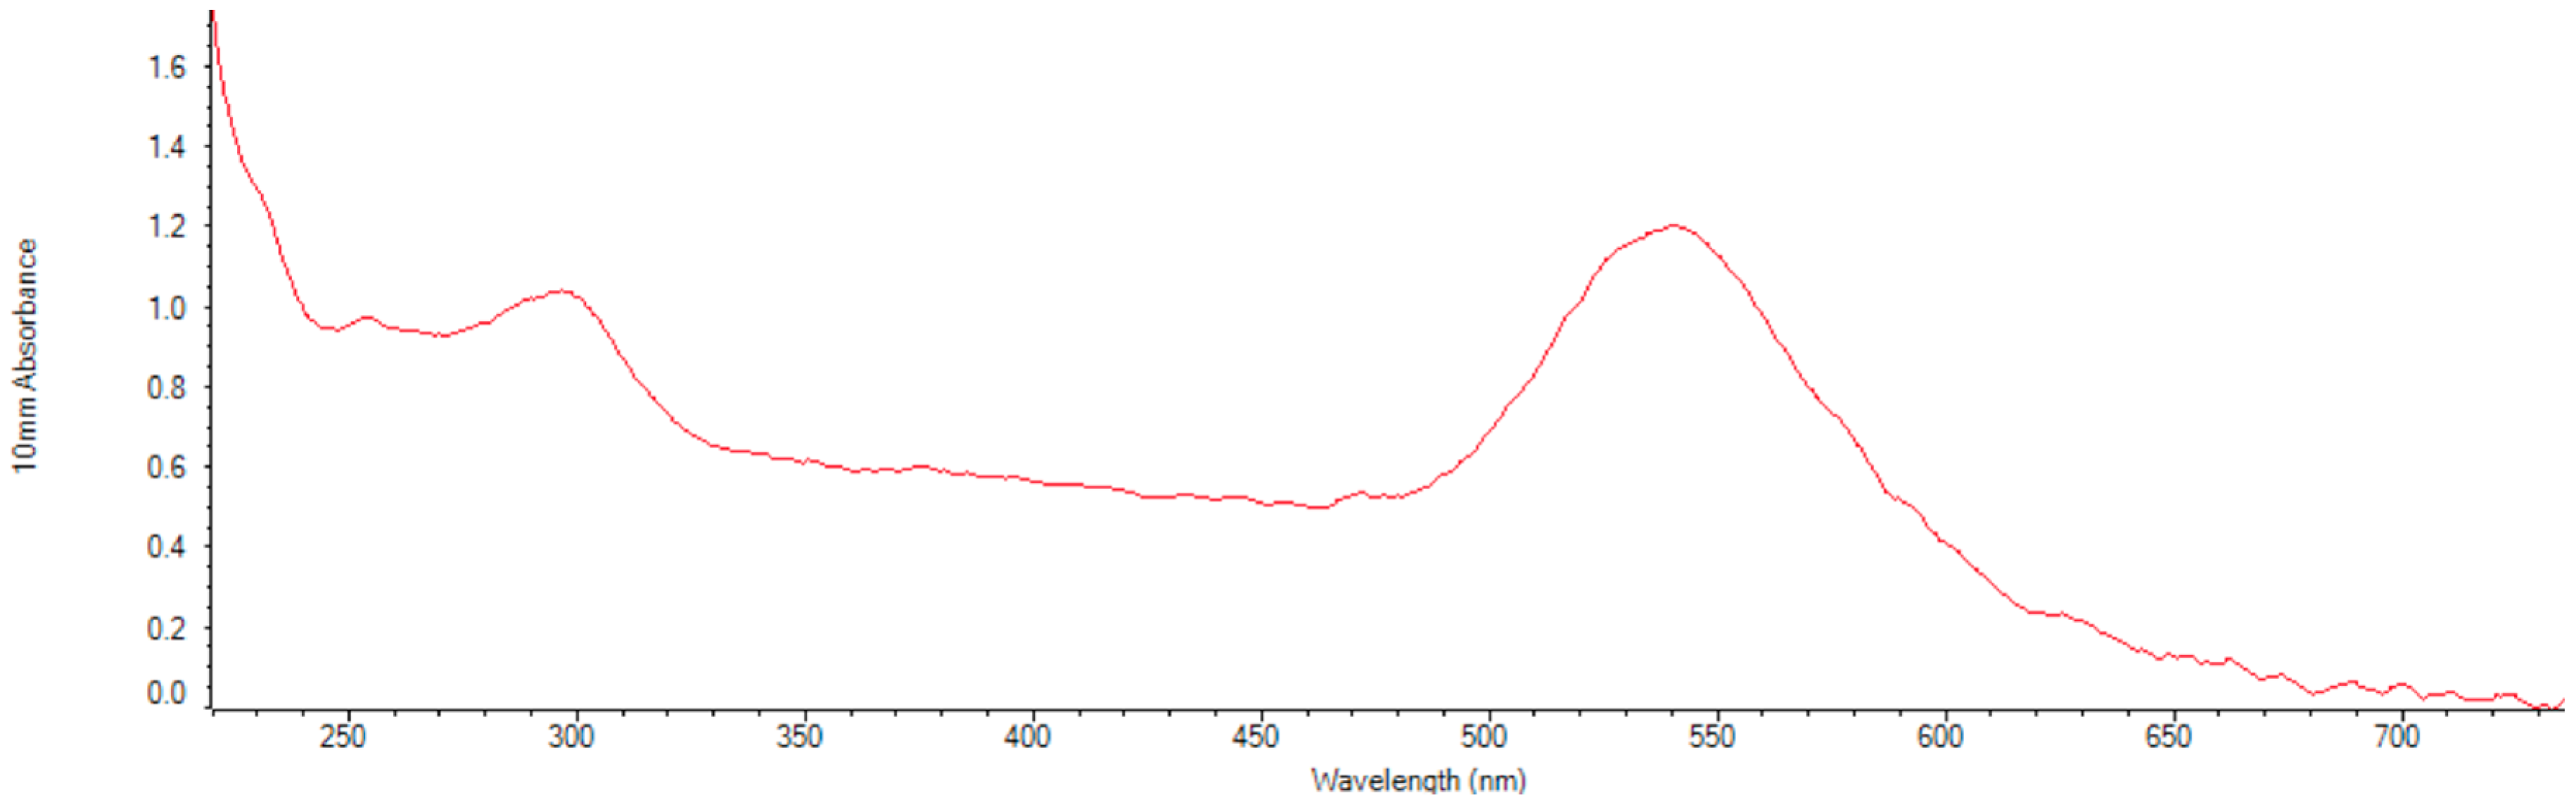
10]. After the gold nanoparticles were conjugated with protein E, light extinction and DLS measurements were performed confirming the conjugation (
Figure S2). The conjugated nanoparticles were then exposed to different temperatures during long periods of time (~36 h) and after characterized again, they showed they were stable by observing the plasmon peak at 544 nm in the light extinction spectrum.
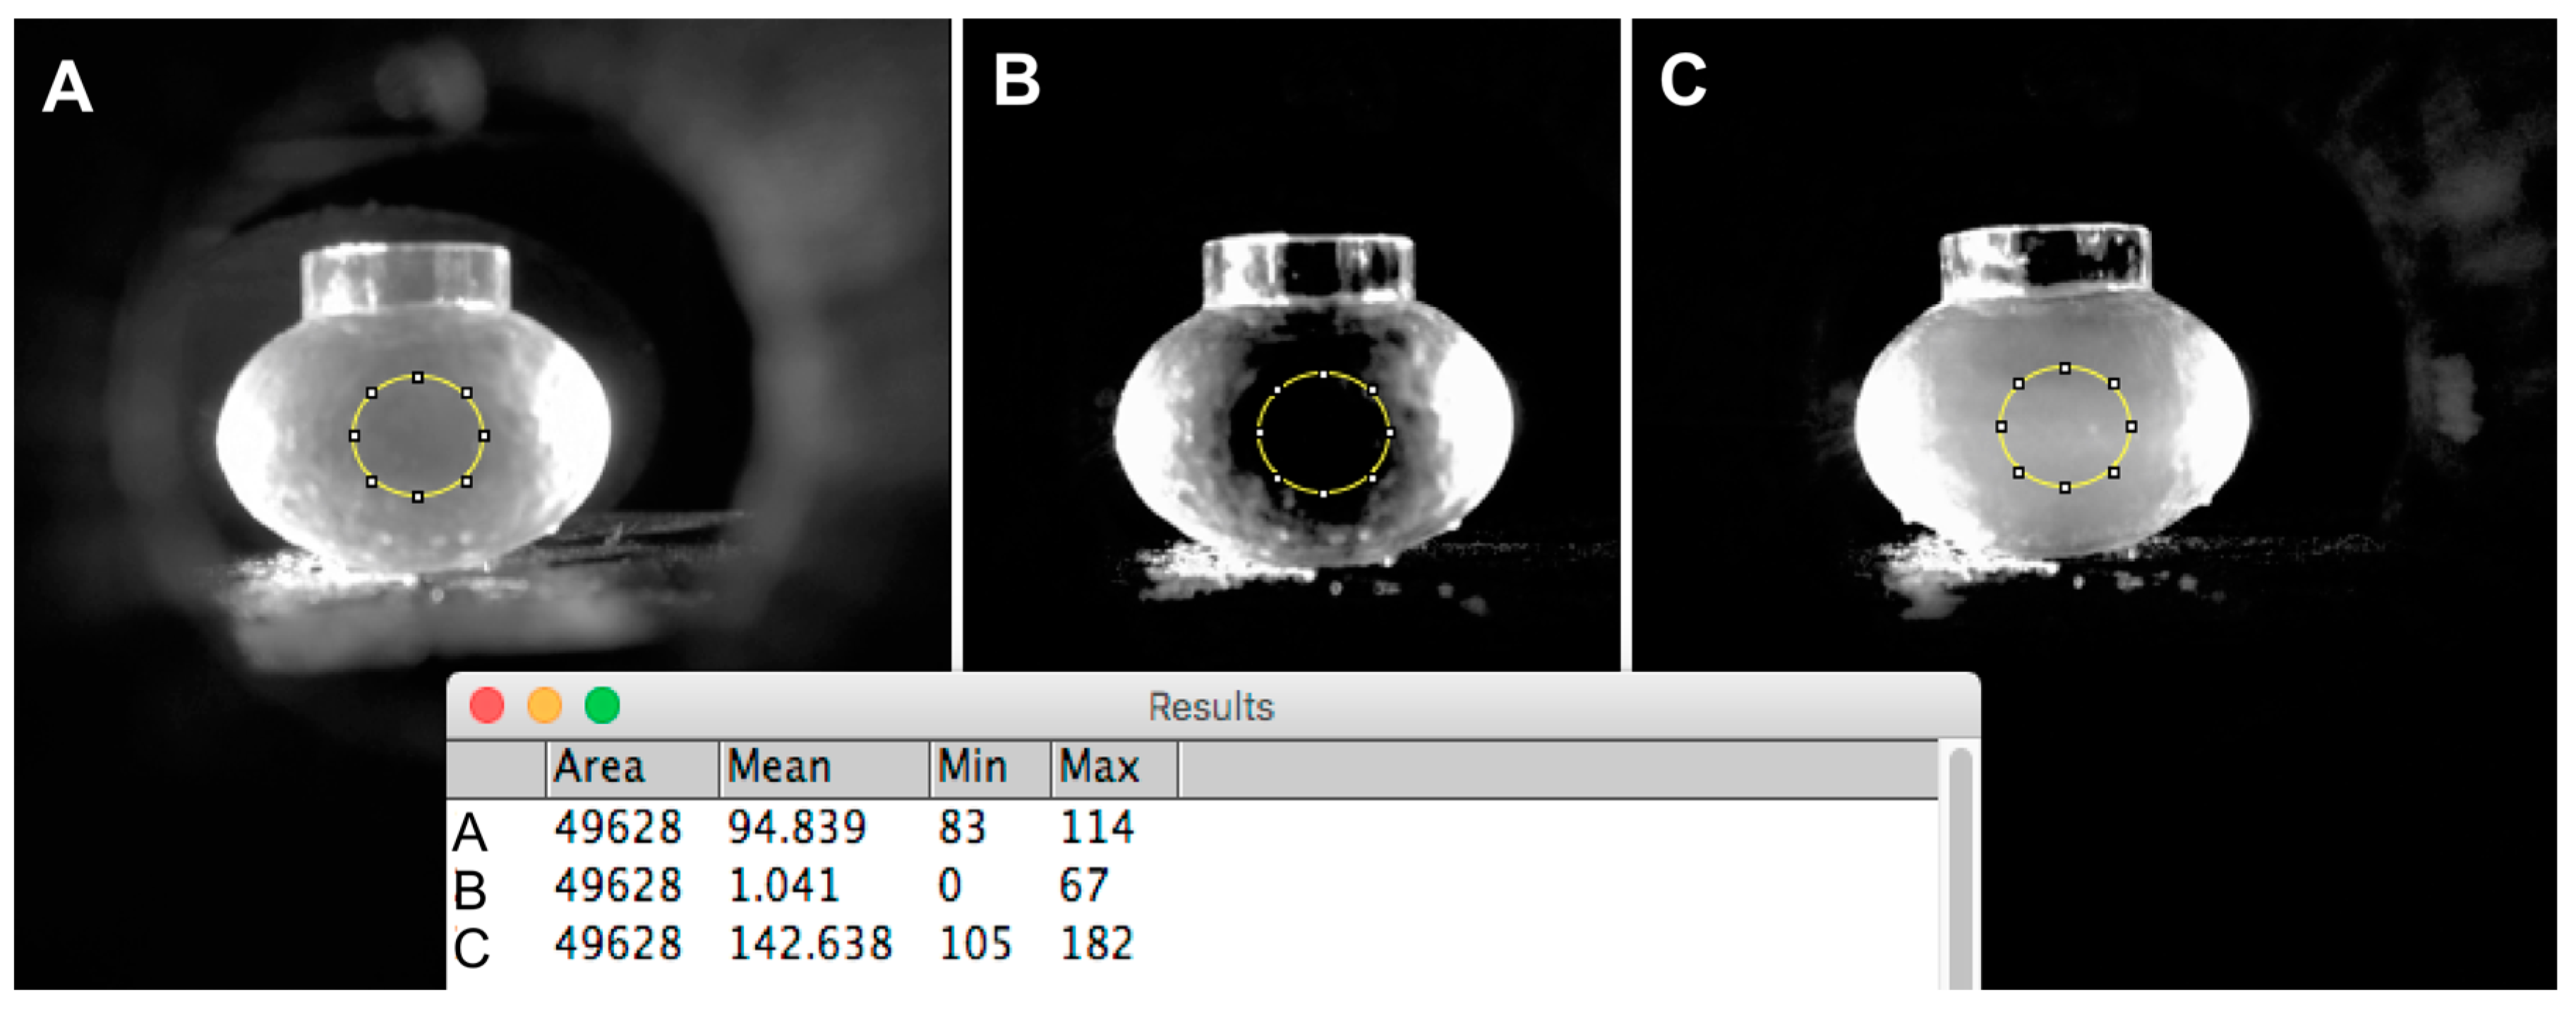
The second part of the calibration was to establish the response of the system in terms of 90° light scattering near the plasmon resonant peak. Images of PBS in the oblate chamber were taken using different exposure times and analyzed with the green channel, which did not provide a sufficiently good baseline dark zone. Images analyzed with the red channel provided a good baseline dark zone with PBS (
Figure 2B), so the most appropriate exposure time for imaging for the handheld optical caustic smartphone was determined to be a 1 s exposure in the center zone of the images’ red channel. This was confirmed when the results obtained with PBS were compared to the image obtained with conjugated gold nanoparticles (
Figure 2C). The integrated difference for these two measurements is on the order of 100×, which clearly provides a high range for detecting small changes in gold nanoparticle scattering. It is important to note that this signal is based on only 3 billion gold nanoparticles in 0.7 mL of suspension, which suggests that detection to a sensitivity of 50 pg/mL of antibody or antigen should be possible since it could represent a 1% difference in nanoparticle scattering signal. These conditions were then used when 10 µg/mL of anti-protein E antibody was added to the conjugated gold nanoparticles and a picture was taken which confirmed the sensitivity of the conditions used for the assay.
When working with human serum samples other components that are present in serum need to be taken into account when analyzing the sensitivity and specificity of the assay. In the case of Dengue, there are other factors that could affect sensitivity and specificity: if the sample is taken at an early stage or late stage of the disease, and the possible cross-reactivity with other antibodies Patients with early stage and primary dengue infection should present IgM against Dengue antigens after a few days of infection and the IgM levels should decrease after 90 days [
1,
2,
3,
4,
11,
12,
13]. Patients with a secondary infection should mostly present IgG antibodies [
1,
2,
3,
4,
13]. The antigen protein E used was from Dengue Serotype 2 and is described by the manufacturer as being most sensitive to IgM levels. However, it is known that there can be cross-reactivity to other Dengue serotype antibodies, as well as from patients who have experienced other arbovirus infections from the group known as flaviviruses, such as West Nile, St. Louis Encephalitis, Zika Virus, and Chikungunya [
12,
14]. These considerations suggest that there should be some variation in test results, but the variations may be difficult to discern without a more comprehensive series of human serum controls, which would be performed in the future.
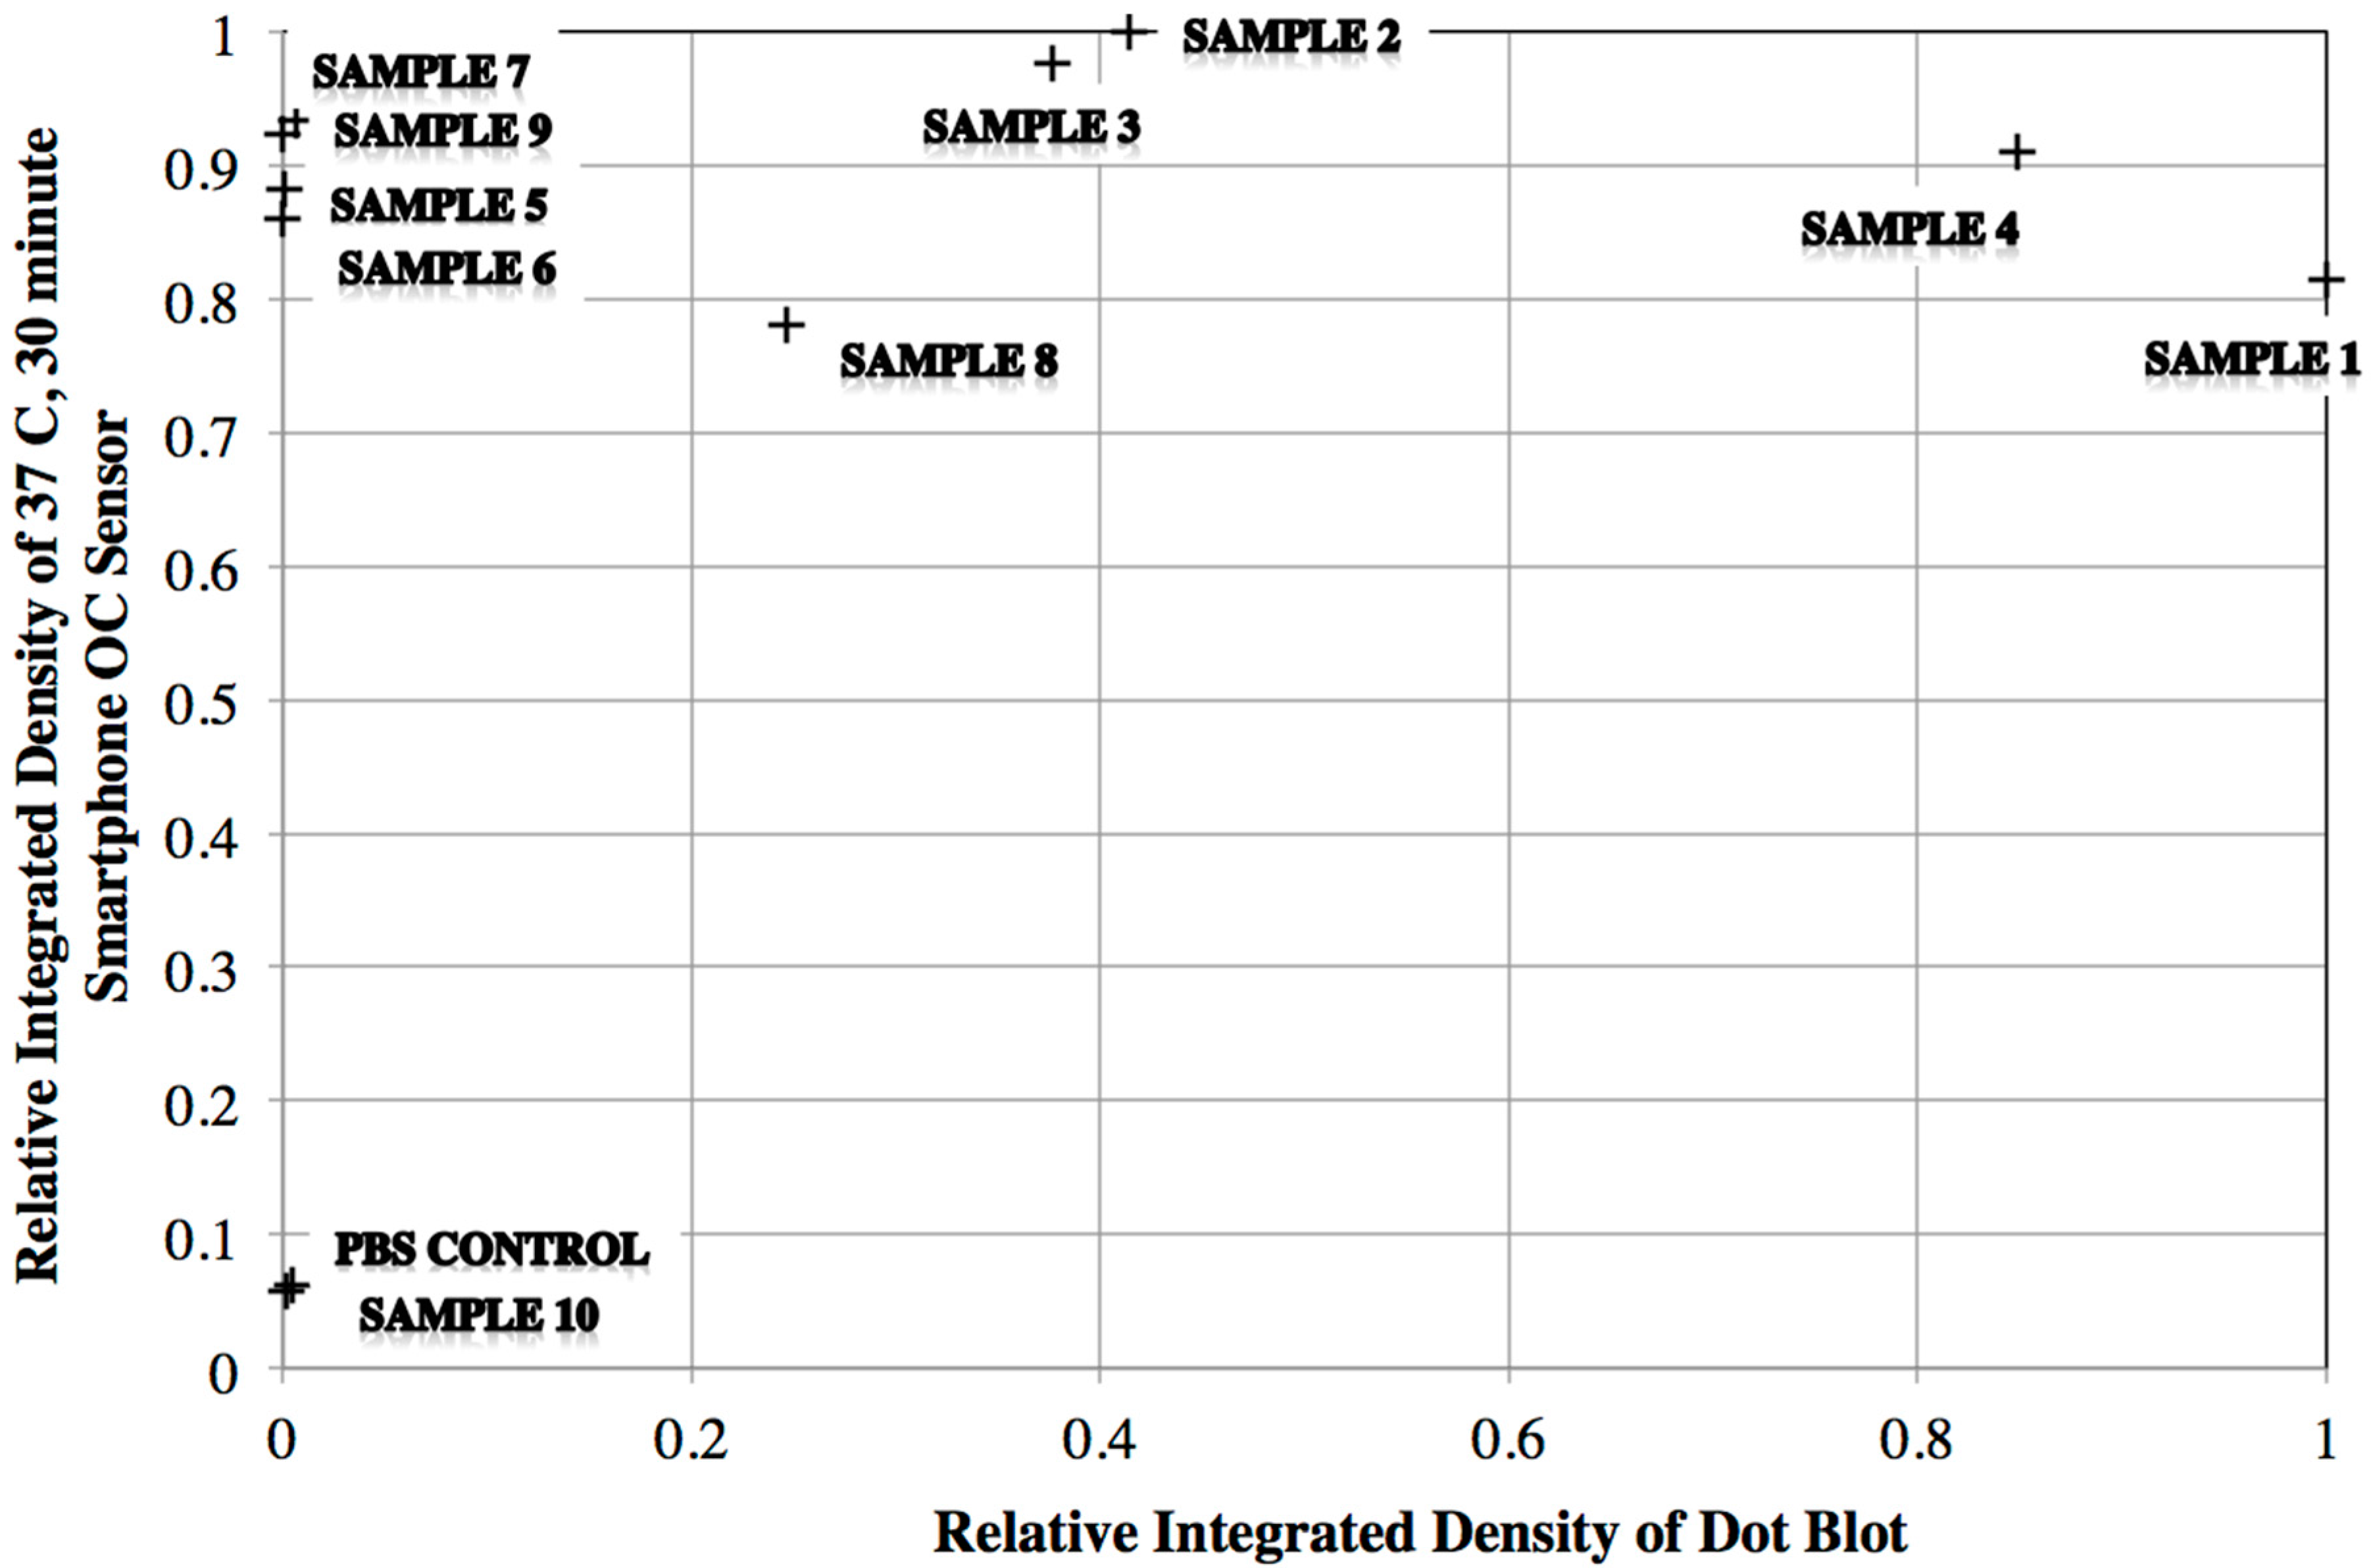
The overall agreement between the dot blot score and the expected results is very good. However, the two Dengue-negative patients appear to give positive dot blot results. It is not clear why this is the case, but perhaps a current or prior flavivirus infection is being detected by the gold conjugate reagent. Additionally, the sample with PBS added and no human serum was correctly identified as a negative control in the dot blot experiment. It is also important to note that a dot blot test with a monoclonal antibody that reacts with flavivirus group specific antigens (4G2, KPL; Abcam, San Francisco, CA, USA) was found to be negative (not shown). The negative result suggests that epitopes of the protein envelope needed for the monoclonal antibody to bind to the GNP-60-E-3 were blocked due to the immobilization of protein E to the gold nanoparticles. This is a potentially useful observation for further gold conjugate development, namely if a methodology for protein E binding to gold based on covalent attachment rather than his-tag is used. For this study, it appears that the results with GNP-60-E-1 at 22 °C for 15 min seem to be most closely related to the characterization based on the dengue patient status information (
Table 4).
When comparing the dot blot results with the smartphone optical caustic sensor results, as observed in
Figure 4 there are two main features to note. The smartphone signal saturates at low signals compared to the dot blot, which seems reasonable given the high signal change described in
Figure 1 and
Figure 2 for aggregates consisting of 60 nm gold particles. The second feature is the differences in results of samples 5 and 6 for both methods. This may be due to the higher sensitivity of the optical caustic sensor as compared to the dot blot which used gold nanoparticles at a higher level of dilution. Dot blots are also considered to be lower in sensitivity due to diffusion and orientation effects when binding to a fixed surface. Additionally, it is important to mention the weak signals observed with dot blot of samples 7 and 10, which may be due to higher sensitivity of the optical caustic system and cross reactivity of the Dengue Serotype 2 recombinant protein E with other Dengue serotypes. As noted in the results for GNP-60-E-1 at 22 °C and 15 min seen in
Table 4, it appears that this cross-reactivity may be diminished by using a higher dilution of human serum, lower temperature, and allowing some unbound antigen in the gold nanoparticle conjugation suspension.


