
A Novel Lightweight CNN Architecture for the Diagnosis of Brain Tumors Using MR Images
School of Electronics Engineering (SENSE), VIT-AP University, Amaravati 522237, India
*
Author to whom correspondence should be addressed.
Diagnostics 2023, 13(2), 312; https://doi.org/10.3390/diagnostics13020312
Submission received: 8 November 2022
/
Revised: 22 December 2022
/
Accepted: 11 January 2023
/
Published: 14 January 2023
(This article belongs to the Special Issue Brain Tumor Imaging)
Abstract
:Over the last few years, brain tumor-related clinical cases have increased substantially, particularly in adults, due to environmental and genetic factors. If they are unidentified in the early stages, there is a risk of severe medical complications, including death. So, early diagnosis of brain tumors plays a vital role in treatment planning and improving a patient’s condition. There are different forms, properties, and treatments of brain tumors. Among them, manual identification and classification of brain tumors are complex, time-demanding, and sensitive to error. Based on these observations, we developed an automated methodology for detecting and classifying brain tumors using the magnetic resonance (MR) imaging modality. The proposed work includes three phases: pre-processing, classification, and segmentation. In the pre-processing, we started with the skull-stripping process through morphological and thresholding operations to eliminate non-brain matters such as skin, muscle, fat, and eyeballs. Then we employed image data augmentation to improve the model accuracy by minimizing the overfitting. Later in the classification phase, we developed a novel lightweight convolutional neural network (lightweight CNN) model to extract features from skull-free augmented brain MR images and then classify them as normal and abnormal. Finally, we obtained infected tumor regions from the brain MR images in the segmentation phase using a fast-linking modified spiking cortical model (FL-MSCM). Based on this sequence of operations, our framework achieved 99.58% classification accuracy and 95.7% of dice similarity coefficient (DSC). The experimental results illustrate the efficiency of the proposed framework and its appreciable performance compared to the existing techniques.
1. Introduction
The brain plays a crucial role in every aspect of human activity but studying its clinical elements is very challenging due to the complexity associated with its structure and functionality. Behind many medical complications in the brain, tumors are observed to be the main reason. Usually, it is created in or around the brain due to the unconstrained development of irregular cells, which may spread to other parts [1]. Typically, brain tumors are classified into primary and secondary (metastatic). Primary tumors begin in the brain, while secondary brain tumors arise from other body regions such as lungs, breasts, kidneys, skin, etc., and migrate to brain tissues through the bloodstream [2].
Further, primary brain tumors can be categorized as either cancerous (malignant) or non-cancerous (benign). Non-cancerous tumors do not have any active cells; hence, they can be wholly restrained and treated by a surgical process. On the other hand, cancerous tumors have active cells proliferating and attacking other brain areas. These tumors cannot be cured under regular medication but may be controlled by radiotherapy/chemotherapy. The survival rate of victims of cancerous tumors is low compared to non-cancerous tumors, so early brain tumor detection is crucial. In this process, imaging modalities such as magnetic resonance (MR) imaging and computed tomography (CT) [3] play an essential role. MR imaging modality is preferred since it generates high-contrast images without ionizing X-rays [4].
Researchers have recently focused on automated detection methodologies to detect brain tumors from MR images. Among them, segmentation-based approaches are more popular. The primary task of segmentation is to separate the affected and non-affected regions of the tumor. In many scenarios, the tumor area is visually distinguishable. However, it is challenging to attain accurate segmentation due to tumor intensity, texture, size, shape, and location variations. Many authors introduced automated methodologies to identify tumors from MR images [5]. Artificial neural networks (ANN) and deep learning approaches are used widely since they efficiently characterize complex tasks [6]. Motivated by this, various methodologies have been developed in the recent past to detect and classify brain MR images [7]. Among them, we discuss a few noted studies.
Kale et al. [8] suggested a diagnosis approach for brain diseases using local binary patterns (LBP), steerable pyramid (SP), and back-propagation neural network (BPNN). Singh et al. [9] proposed a hybrid technique based on discrete wavelet transform (DWT), independent component analysis (ICA), and kernel support vector machine (k-SVM). Bahadureet al. [10] introduced a computer-aided diagnosis system with the help of watershed, fuzzy C-means (FCM), and Berkeley wavelet transform (BWT). Gokulalakshmi et al. [11] implemented an enhanced classification technique using K-means clustering, DWT, and support vector machine (SVM). Toğaçar et al. [12] designed a BrainMRNet architecture based on hyper-column approaches and attention modules.
Neffati et al. [13] proposed a compulsive brain tumor identification system with the help of DWT, kernel principal component analysis (KPCA), and SVM. Wang et al. [14] introduced an automatic diagnosis approach for classifying brain tumors using stationary wavelet entropy and energy features along with SVM. Arunkumar et al. [15] developed an enhanced automated brain tumor detection system using K-means clustering and ANN. Toğaçar et al. [16] presented a novel deep-learning approach with the help of recursive feature elimination (RFE) and SVM. Chanu et al. [17] suggested a two-dimensional convolutional neural network (2D-CNN) system based on data augmentation.
Lu et al. [18] utilized AlexNet with transfer learning to develop an automatic brain tumor classification system. Vishnuvarthanan et al. [19] implemented an unsupervised methodology for the segmentation of brain tumors using a self-organizing map (SOM) and fuzzy K-means (FKM). Hasan et al. [20] proposed a computer-aided methodology based on a modified gray-level co-occurrence matrix (MGLCM) and multi-layer perceptron (MLP) neural network. Nagarathinam et al. [21] introduced an automated computer-aided approach using genetic algorithm (GA) and adaptive neuro-fuzzy inference system (ANFIS) methods. Ahmadi et al. [22] suggested a deep learning approach based on brain tumor segmentation using a convolutional neural network (CNN) and robust principal component analysis (RPCA). Toufiq et al. [23] suggested a hybrid feature extraction approach for identifying brain tumors from MR images.
Ginni Garg et al. [24] proposed a hybrid ensemble model for classifying brain tumors from MR images using stationary wavelet transform (SWT), GLCM, and a hybrid classifier. Pitchai et al. [25] developed an MR-based brain tumor segmentation model using FKM and ANN. Siyuan et al. [26] suggested an improved AlexNet and extreme learning machine (ELM) followed by a chaotic bat optimization (CBM) framework for identifying abnormal brain tumors from MR images. Mantripragada et al. [27] introduce a novel brain tumor segmentation, and classification framework based on deep neural networks (DNN) and adaptive fuzzy deformable fusion (AFDM) approaches. Amin et al. [28] employed a CNN framework to detect and classify brain tumors. Arpit Kumar Sharma et al. [29] a modified ResNet50 architecture along with an enhanced watershed (EWS) algorithm was presented to differentiate abnormal from normal brain MR images. Sarang Sharma et al. [30] designed a deep-learning framework for predicting MR-based brain tumors. Alsaif et al. [31] suggested a novel brain tumor classification model based on CNN.
From Table 1, we summarize the issues encountered in the existing approaches.
- Traditional automatic detection approaches utilized conventional machine learning algorithms, whose performance depends on the choice of appropriate features and learning approaches.
- Some classification methods employed wavelets for image analysis. However, they fail to acquire directional information; the selection of subbands and mother wavelets is also critical.
- Some approaches use handcrafted features but are not robust to noise and exhibit poor discrimination.
- The authors implemented some traditional CNN frameworks such as pre-trained CNN models with transfer learning to classify brain MR images in a few works. However, they demand a large number of parameters and high computational time.
To address the abovementioned problems, we suggested a new approach for identifying and classifying brain MR images using a fast-linking modified spiking cortical model (FL-MSCM) and lightweight CNN.
Significant Contributions
The significant contributions of this work are summarized as follows:
- Skull-stripping is performed to enhance the robustness of the segmentation process by eliminating extra-meningeal mater (or dura mater) based on thresholding and morphological operations.
- Image data augmentation is implemented to enhance the sufficiency and diversity of the training database by geometric transformation operators. By this, we significantly reduce the overfitting issues encountered during training progress.
- We proposed a novel lightweight CNN architecture to detect high-level features from brain MR images. We can effectively minimize the parameters, including trainable and non-trainable, compared to the existing CNN models and automatically extract the significant features. Due to this, we limit the influence of human beings in the analysis of brain MR tumor images, which is the considerable benefit of the suggested CNN model.
- Analyze the impact of various optimization algorithms (Stochastic gradient descent with moment (SGDM), Adam, Adagrad, AdaMax, Adadelta, Nadam, and RMSProp) during training of the CNN model with the help of K-fold cross-validation (KFC). It is the fundamental difference between the existing and proposed models.
- The FL-MSCM is employed to separate the foreground (affected regions) and background (non-affected areas) from brain MR images, which can minimize issues of other traditional segmentation algorithms, such as the impact of noise, spurious blobs, and other imaging artifacts, by making each region as uniform as possible. Due to this, we improve the segmentation accuracy, which is a significant advantage of the presented FL-SCM technique.
The remaining part of the work is organized as follows: Section 2 represents the background of the CNN model. Section 3 illustrates the proposed technique and metrics to evaluate the performance of the models. Section 4 analyzes the outcomes and reasons behind the proposed method’s success and compares it with other state-of-the-art approaches. Section 5 discusses the conclusion of the present work.
2. Preliminaries
In this section, we discuss the background of deep learning and describe various layers used in the implementation of the proposed model in detail. Deep learning (DL) architectures can learn complex tasks by hierarchically constructing feature maps. CNN-based methods are more popular among the available DL models and have the following layers: convolutional, pooling, activation, batch normalization, fully connected (FC), and softmax, respectively.
2.1. Convolutional Layer
The convolutional layer plays a crucial role in classification. Typically, it produces many feature maps, by convolving the input image with a set of filters in a sliding window manner as follows:
where represents the convolution operator, is the segmented image, denotes the filter kernel, and are the indices of the generated feature map.
2.2. Batch Normalization Layer
It is also termed the batch norm and is mainly used to enhance the stability of a network by normalizing the features obtained from a convolutional layer, or FC layer. Typically, it lies between the convolutional and activation layer. The main advantages of this layer are:
- Improving the training speed of the network.
- Minimizing the internal covariance shift [32].
- Reducing overfitting since it has slight regularization.
The entire process of the batch norm is described in Algorithm 1.
| Algorithm 1. Batch normalization |
| Input: Values of over a mini-batch: . Parameters to be learned: . (2) (3) (4) (5) where represents scale; illustrates shift; is the number of feature inputs; and are the mean and variance across the batch, ; is a constant, which is used to enhance the stability when is too small. Output: |
2.3. Activation Functions
Usually, activation functions are incorporated after the convolutional layer, establishing non-linearity in each neuron’s output. Due to this, the network will be able to learn many complex tasks. In this work, we utilized the softplus activation function, which is a smoothed version of rectified linear unit (ReLU) as shown in Figure 1. Mathematically the softplus function is defined as
2.4. Pooling Layer
The main goal of this layer is to scale down the spatial size of feature maps obtained from the preceding layers, minimizing the number of parameters to be learned and reducing computational time. Average pooling and max-pooling are the most frequently used approaches [33]. In our work, we utilized average and global average pooling (GAP), which is achieved by estimating the average value from each/entire region of the feature map, as shown in Figure 2 and Figure 3. Here, the main objective of the GAP is to yield one feature map for each corresponding classification task category, which avoids the overfitting problem.
2.5. Softmax
Typically, the softmax is employed at the end of the neural network to transform the features into class probabilities. The softmax yields a value for each class based on the computation of probabilities given by
where is the feature vector; indicates the transpose operator; illustrates the weight vector; is the predicted probability of -th class and finally, represents the number of classes. Here, we have chosen as 2 since we perform binary classification.
3. Materials and Methods
The proposed system for identifying and classifying brain MR images is represented in Figure 4, and it includes the collection of the database, skull-stripping, image data augmentation, feature extraction and classification by CNN model, and tumor detection using FL-MSCM.
3.1. Database
To measure the effectiveness of the presented framework, we collected 60 normal and 125 abnormal T2-weighted brain MR images (glioma, metastatic adenocarcinoma, meningioma, sarcoma, and Alzheimer’s diseases) from a publicly available data source such as Harvard Medical School [34]. However, we cannot develop an effective diagnosis model based on this small sample size. Therefore, further, we generated augmented images with the help of rotation, translation, reflection, shearing, and scaling geometric transformation operations. Before implementing this step, we performed a skull-stripping process to improve the detection accuracy of the model.
3.2. Skull-Stripping
Skull-stripping is a significant preliminary stage in the analysis of biomedical images, which helps improve the effectiveness of brain tumor segmentation during the diagnosis of patients [35]. The main objective of this approach is to extract brain tissues by eliminating non-brain matters such as fat, skin, skull, etc. There have been numerous approaches [36]; thresholding and morphology-based procedures are more popular among them. Inspired by this, we proposed a combination of thresholding and morphological operations to achieve better skull-stripping.
- Initially, we separate the image, into two regions and over an intensity-level of , and . Here, is the number of intensity levels, usually an integer power of 2.
- Obtain the binary image, by setting the optimal thresholding value, which is estimated by the following equationswhere , and , represents the mean and variance of the regions over , and ; define the thresholding.
- Construct a disk-shaped structuring element, with a required radius.
- Eliminate the small peak objects from using a simple area opening operation and then fill the regions with an image filling operation.
- Employ the erosion operation on the outcome of step 3 with the defined . Using this, we can eliminate small objects which appear in the binary image .
- Finally, the binary image obtained in step 5 is superimposed on the original image, and replaces the non-binary region with zeros. With this process, the skull-free brain MR image is obtained, which improves the segmentation accuracy.
3.3. Image Data Augmentation
Deep learning heavily depends upon the massive amount of data to prevent overfitting. Overfitting is the phenomenon that occurs when a model learns a function with huge variance, which results in high performance on the training database, but fails to obtain high accuracy on the testing database. Hence, to mitigate this problem, we need to increase the number of samples in the given database. To meet this criterion, in this work, we employed data augmentation on skull-stripped images using geometric transformation techniques such as rotation, scaling, translation, and shearing along x- and y-directions, and reflection. Table 2 illustrates the configurations of the suggested augmented operators. We finally attained 540 normal and 1125 abnormal brain MR images with these operators. After that, we deployed the lightweight CNN model onto augmented images to predict the abnormality of brain MR images.
3.4. The Suggested Lightweight CNN Architecture
In the literature, various conventional CNN frameworks [18,26,29,30] were discussed to identify the abnormality of brain MR images. However, they demand a large number of parameters to yield better accuracy, as results increase the computational complexity. Hence, we proposed a lightweight CNN architecture. With the help of our model, we can minimize the number of learning parameters and reduce the training speed without compromising the classification performance. It is the significant difference between the conventional and lightweight CNN models. The architecture of the presented CNN model is illustrated in Figure 5. The fundamental building block of our model is ConvNet, and it includes a convolutional layer, softplus activation function, and batch norm. The structure of the ConvNet is illustrated on the left side of Figure 5.
The proposed CNN model has four blocks, denoted by Blocks 1, 2, 3, and 4. The first block has only one ConvNet module. But the rest of the blocks have three ConvNet modules followed by a 2 × 2 average pooling with the stride of 2 and an adder operator to add the feature map values by point-to-point except the first block. The configurations of ConvNet in each block are as follows:
- In the first block, the ConvNet module has 32 filters with a 5 × 5 kernel size, and the stride is 2. Here, the stride of 2 for the convolutional filter minimizes the input’s size to half, resulting in reduced computational complexity. Usually, the initial convolutional layers extract edge features; therefore, the stride of 2 will not significantly impact the model’s accuracy at initial convolutional layers.
- Block 2 has three ConvNets, and they have 48 filters with a kernel size of 3 × 3, 3 × 3, and 1 × 1, and the strides of 2, 1, and 1, respectively. Similarly, blocks 3 and 4 contain three ConvNets with 64 and 128 filters. Each filter has a size of 3 × 3, 3 × 3, and 1 × 1, with a stride of 1. Here, the 1 × 1 convolutional filter is mainly used to minimize the computational requirements, i.e., reduce the dimensionality of the feature map. Due to that, the proposed CNN model required significantly fewer learnable parameters to train the model, as illustrated in Table 3. From this table, we observed that the total number of parameters is nearly 0.35 million. This number is much less than the other traditional CNN models discussed in the literature such as AlexNet [18,26], ResNet-50 [29], VGG-19 [30], etc. Hence, we called as a lightweight CNN.
- In each ConvNet, we used a batch norm layer to improve the training speed and minimize overfitting.
At the end of block 4, we incorporated one GAP layer, a dense layer, and a softmax layer having two classes in sequence. Here, the GAP is used to compress the feature map by taking an average of each incoming feature map. After implementing the proposed CNN model, the resultant outcomes fed to the segmentation phase for identifying the infected area of abnormal brain MR images.
3.5. Segmentation
The main objective of segmentation is to improve diagnosis by automatically identifying suspicious patterns. However, it is a challenging task due to the artifacts, soft tissue boundaries, irregular shapes of brain tissues, etc. To address this, we developed a new brain tumor segmentation methodology termed fast-linking modified spiking cortical model (FL-MSCM), motivated by the work in [37].
3.5.1. Modified Spiking Cortical Model (MSCM)
The spiking cortical model (SCM) [38] is derived from Eckhorn’s visual cortex model [39] and is developed especially for image processing applications such as segmentation, fusion, texture retrieval, etc. The functional flow graph of the SCM is illustrated in Figure 6, and it consists of a receptive field, a modulation field, and a pulse generator. In the receptive field, each -th neuron has a feeding input and linking input . In the modulation area, the membrane potential (internal activity), of the neuron is obtained by multiplying with . Finally, the neuron fires and provides a pulse output, when greater than threshold . The equivalent mathematical expressions for this procedure are given below:
where denotes the positions of neighboring neurons, is the number of iterations, , and represent the weight matrix and magnitude scaling factor of linking field, respectively, is the linking strength, is decay constant which always lies between 0 and 1. In our work, is the input image and is the intensity value at pixel location.
In the conventional SCM model [38], to estimate , an exponential decay function is used, which results in slow computation. To speed up the process, we employed the MSCM approach with a linear decay mechanism to obtain the value as follows
where is the threshold magnitude component and ensures that the entire neuron threshold decays linearly.
From Equations (11)–(14), we note that the proposed approach has only one convolution term and two leaky integrators. It is the significant advantage of MSCM over pulse-coupled neural networks [40].
3.5.2. Parameter Settings of MSCM
In the implementation of MSCM, the parameters are initialized as follows:
- Firstly, the output, and internal activity, are initialized as ‘zero’.
- Threshold, .
- Decay constant, .
- Magnitude scaling factor, .
- Threshold decay, .
- Due to the position invariant nature can be determined by a 7 × 7 Gaussian filter with standard deviation ‘1′, which is utilized to estimate the precision level of the image pixel.
- The threshold magnitude component, is employed to ensure that each neuron will not fire more than once and is estimated using Equation (16).where the linking strength, is obtained by the following expression:where and , are the central difference gradient of along - direction and - direction.
- The maximum number of iterations can be determined as follows:where is the gray-level thresholding of , estimated from Otsu’s approach [41]. Here, the primary objective of thresholding is to calculate the number of iterations. For better segmentation, we apply the fast-linking algorithm to MSCM.
3.5.3. Fast-Linking
Here, compared to normal linking [42], the neurons with similar stimuli respond quickly and synchronously. It mainly includes two loops:
- Internal loop: Here, and are repeated until does not vary.
- External loop: Here, the function is iterated.
The above process is depicted in Algorithm 2, and the corresponding outputs of FL-MSCM are shown in Figure 7i–l. This figure shows that the proposed segmentation approach significantly separated the tumor and non-tumor regions from skull-free brain MR images.
| Algorithm 2. The fast-linking approach. |
whiledo Update by Equation (14) repeat , Update , and by Equations (11)–(13), until end while |
3.6. Performance Metrics
The performance of the proposed model is evaluated using various well-known metrics such as true positive rate (TPR), true negative rate (TNR), positive predictive value (PPV), F-score, accuracy, and the area under the curve (AUC) [43]. TPR estimates the percentage of accurately identified abnormal brain MR images, while TNR measures the percentage of precisely recognized normal brain MR images. PPV calculates the fraction of correctly identified brain MR images flagged as abnormal. F-score is the weighted average or harmonic mean of PPV and TPR. AUC is an effective way of quantifying the overall performance of the test. Accuracy represents the percentage of correctly classified brain MR images, including both normal and abnormal, over the total number of images. The mathematical interpretations of all these parameters are described as follows:
where = segmented image; = ground truth; = true positive; = false negative; = false positive and = true negative.
4. Results and Discussion
In this section, we present experimental outcomes to demonstrate the performance of the proposed methodology. To assess the efficiency of our model, we conduct a wide range of experiments using K-FCV. Typically, it is a simple and effective method compared to other cross-validation approaches [44] and is mainly used to reduce overfitting. The selection of the K-value is a significant aspect of the classification problems. A small value of K will result in high bias, low variance, and an underfitting model. Similarly, a high value of K yields low bias, high variance, and an overfitting model. Therefore, we have chosen a moderate value for K as five to avoid this ambiguity.
4.1. Experimental Outcomes
This study implemented an efficient framework to identify and classify brain MR images using lightweight CNN and FL-MSCM. Primarily, we extracted brain cells from MR images to improve the accuracy of diagnosis by removing the non-brain matter using mathematical morphology and thresholding operations. Then, we employed data augmentation to enhance the model’s generalization ability. Afterward, we employed CNN model to differentiate the brain MR images as normal and abnormal. Finally, we separated the infected and non-infected tumor regions from abnormal samples using the FL-MSCM-based image segmentation framework. All these experiments were carried out on Intel (R) Core (TM) i3-5005U CPU @ 2 GHz using MATLAB 2020 and Google Colab. For a better understanding, the outcomes of the proposed methodology are separated into two phases. The first phase engages the classification results; the second phase describes the segmentation results.
4.1.1. Classification Analysis
To classify brain MR images, we applied a CNN model to the skull-free augmented images. Typically, our architecture automatically tries to attain the relevant features using a series of hidden layers and learns using the back-propagation approach. During the training process, we used the cross-entropy loss function. Here, to train the model, we consider the batch size of 64 and the number of epochs of 30. In addition to that, stochastic gradient descent with momentum (SGDM) [45], Adam [46], AdaMax [46], Adagrad [47], Adadelta [48], RMSProp [49], and Nadam [50] optimizers were taken into account for minimizing the loss. Table 4 represents the parameters to be considered for optimization.
The performance of the proposed approach on various optimization techniques using 5-FCV is presented in Table 5, Table 6, Table 7, Table 8, Table 9, Table 10 and Table 11. From the representations, we identified that Adadelta yields poor results among all other optimizers (see Table 9), especially in predicting normal brain MR images because the learning rate will become very low in the late training period. Similarly, we noted that Adam, AdaMax, and Nadam optimizers performed significantly better than others, with more than 99% accuracy on average. However, Adam optimization effectively minimizes the loss function since it slows down when converging to the local minima and minimizes the high variance. Hence, it provides better results on the suggested lightweight CNN model with 99.45% TPR, 99.80% TNR, 99.91% PPV, 99.68% F-score, 99.66% AUC, and 99.58% accuracy (see Table 6).
The suggested methodology is compared with other well-received techniques, as illustrated in Table 12. From this, we note that the proposed diagnosis approach provides better results on the given benchmark dataset than the traditional CNN-based approaches [12,16,17,18,25,27,28,29,30]) and other machine learning frameworks. The significant advantages of the proposed method are:
- Fewer parameters to train the model, approximately 0.35 million.
- Minimize the overfitting problems due to the initialization of weights in the layer.
- Significantly achieved high performance due to image data augmentation.
- Low computational time.
- Extraction of complex features without human intervention.
4.1.2. Segmentation Analysis
The assessment of the proposed segmentation methodology is presented in Table 13, while an evaluation of the suggested approach with existing techniques is illustrated in Table 14. The outcomes of our framework are 0.96 DSC, 99.83% PPV, 99.8% TPR, 96.5% TNR, 99.82% F-score, 98.15% AUC, and 99.65 % accuracy. Based on the analysis of segmentation results (Table 14), we conclude that the proposed framework achieved remarkable performance compared to the existing techniques in terms of DSC. It must be noted that in evaluating the segmentation, higher values of DSC represent good performance. Even a small increment in this metric is remarkable and essential for clinical decisions. The reasons behind the success of the proposed segmentation methodology are:
- Using the proposed skull-stripping process, we significantly isolate the brain tissues from non-brain matters. Due to this, the implemented approach accurately identifies brain-related diseases.
- The proposed FL-MSCM makes each region as homogeneous as possible, with high computational efficiency, simple parameter tuning, low reduction in contrast, and image details. It is a significant advantage of the FL-MSCM.
- The implemented approach access adequately visible edges or boundaries.
Due to the above three reasons, the segmentation method obtained a high DSC value compared to state-of-the-art approaches mentioned in Table 14.
5. Conclusions and Future Scope
Considering the spread of brain tumor-related cases and their impact on human life, we proposed an efficient methodology to differentiate between normal/abnormal brain MR images based on CNN and FL-MSCM. This study initially utilized the skull-stripping process to isolate extra-cranial tissues from MR images. Further, we generated augmented images using geometric transformation operators. After that, each augmented slice is fed to our lightweight CNN model to classify brain MR slices as normal and abnormal. Finally, the FL-MSCM-based automatic segmentation approach is applied to abnormal brain MR slices for identifying the region of interest (or pixels of infected organs). Based on a detailed analysis of experimental outcomes, we observed that our framework has low-computational time and achieved high performance with an accuracy of 99.58% compared to the well-received approaches due to the automatic feature learning, appropriate selection of the number of training/testing samples, effective hyper-parameter tuning, and adequately access the visible edges or boundaries from an image. Hence, anatomists can use the recommended method as a decision-making tool during clinical therapy. This paper mainly focused on binary classification (normal vs. abnormal). In the future, our work would extend to the multiclass classification of brain MR images (normal vs. sarcoma vs. glioma vs. meningioma vs. Alzheimer’s) and other medical diseases such as breast, skin, and lung cancers, etc. In addition, we would like to extend our work on real-time experimental data.
Author Contributions
Conceptualization, K.R.R.; methodology, K.R.R.; software, K.R.R.; validation, K.R.R.; formal analysis, K.R.R.; investigation, K.R.R.; resources, R.D.; data creation, K.R.R.; writing—original draft preparation, K.R.R.; writing—review and editing K.R.R. and R.D.; visualization, K.R.R.; supervision, R.D.; project administration, R.D.; funding acquisition, R.D. All authors have read and agreed to the published version of the manuscript.
Funding
This research received no external funding.
Data Availability Statement
The data presented in this study are available on request from the corresponding author. The data are not publicly available due to privacy restrictions.
Conflicts of Interest
The authors declare that they have no known competing financial interests or personal relationships that could have appeared to influence the work reported in this paper. All of the authors have read and approved the paper, and it has not been published previously nor is it being considered by any other peer-reviewed journal.
References
- Soltaninejad, M.; Yang, G.; Lambrou, T.; Allinson, N.; Jones, T.L.; Barrick, T.R.; A Howe, F.; Ye, X. Supervised learning based multimodal MRI brain tumour segmentation using texture features from supervoxels. Comput. Methods Programs Biomed. 2018, 157, 69–84. [Google Scholar] [CrossRef]
- Hagargi, A.P.; Shubhangi, D.C. Brain tumour detection and ART classification technique in MR brain images using RPCA QT decomposition. Brain 2018, 5, 1717–1725. [Google Scholar]
- Kasban, H. A comparative study of medical imaging techniques. Int. J. Inf. Sci. Intell. Syst. 2015, 4, 37–58. [Google Scholar]
- Amin, J.; Sharif, M.; Yasmin, M.; Fernandes, S.L. A distinctive approach in brain tumor detection and classification using MRI. Pattern Recognit. Lett. 2017, 139, 118–127. [Google Scholar] [CrossRef]
- Gordillo, N.; Montseny, E.; Sobrevilla, P. State of the art survey on MRI brain tumor segmentation. Magn. Reson. Imaging 2013, 31, 1426–1438. [Google Scholar] [CrossRef]
- Arabahmadi, M.; Farahbakhsh, R.; Rezazadeh, J. Deep Learning for Smart Healthcare—A Survey on Brain Tumor Detection from Medical Imaging. Sensors 2022, 22, 1960. [Google Scholar] [CrossRef]
- Xie, Y.; Zaccagna, F.; Rundo, L.; Testa, C.; Agati, R.; Lodi, R.; Manners, D.N.; Tonon, C. Convolutional neural network techniques for brain tumor classification (from 2015 to 2022): Review, chal-lenges, and future perspectives. Diagnostics 2022, 12, 1850. [Google Scholar] [CrossRef]
- Kale, V.V.; Hamde, S.T.; Holambe, R.S. Brain disease diagnosis using local binary pattern and steerable pyramid. Int. J. Multimedia Inf. Retr. 2019, 8, 155–165. [Google Scholar] [CrossRef]
- Singh, R.; Goel, A.; Raghuvanshi, D.K. M.R. brain tumor classification employing ICA and kernel-based support vector machine. Signal Image Video Process. 2020, 15, 501–510. [Google Scholar] [CrossRef]
- Bahadure, N.B.; Ray, A.K.; Thethi, H.P. Comparative Approach of MRI-Based Brain Tumor Segmentation and Classification Using Genetic Algorithm. J. Digit. Imaging 2018, 31, 477–489. [Google Scholar] [CrossRef]
- Gokulalakshmi, A.; Karthik, S.; Karthikeyan, N.; Kavitha, M.S. ICM-BTD: Improved classification model for brain tumor diagnosis using discrete wavelet trans-form-based feature extraction and SVM classifier. Soft Comput. 2020, 24, 18599–18609. [Google Scholar] [CrossRef]
- Toğaçar, M.; Ergen, B.; Cömert, Z. BrainMRNet: Brain tumor detection using magnetic resonance images with a novel convolutional neural network model. Med. Hypotheses 2019, 134, 109531. [Google Scholar] [CrossRef]
- Neffati, S.; Ben Abdellafou, K.; Taouali, O.; Bouzrara, K. Enhanced SVM–KPCA Method for Brain MR Image Classification. Comput. J. 2019, 63, 383–394. [Google Scholar] [CrossRef]
- Wang, S.; Du, S.; Atangana, A.; Liu, A.; Lu, Z. Application of stationary wavelet entropy in pathological brain detection. Multimedia Tools Appl. 2016, 77, 3701–3714. [Google Scholar] [CrossRef]
- Arunkumar, N.; Mohammed, M.A.; Ghani, M.K.A.; Ibrahim, D.A.; Abdulhay, E.; Ramirez-Gonzalez, G.; de Albuquerque, V.H.C. K-means clustering and neural network for object detecting and identifying abnormality of brain tumor. Soft Comput. 2019, 23, 9083–9096. [Google Scholar] [CrossRef]
- Toğaçar, M.; Cömert, Z.; Ergen, B. Classification of brain MRI using hyper column technique with convolu-tional neural network and feature selection method. Expert Syst. Appl. 2020, 149, 113274. [Google Scholar] [CrossRef]
- Chanu, M.M.; Thongam, K. Computer-aided detection of brain tumor from magnetic resonance images using deep learning network. J. Ambient. Intell. Humaniz. Comput. 2021, 12, 6911–6922. [Google Scholar] [CrossRef]
- Lu, S.; Lu, Z.; Zhang, Y.-D. Pathological brain detection based on AlexNet and transfer learning. J. Comput. Sci. 2018, 30, 41–47. [Google Scholar] [CrossRef]
- Vishnuvarthanan, G.; Rajasekaran, M.P.; Subbaraj, P.; Vishnuvarthanan, A. An unsupervised learning method with a clustering approach for tumor identification and tissue segmentation in magnetic resonance brain images. Appl. Soft Comput. 2016, 38, 190–212. [Google Scholar] [CrossRef]
- Hasan, A.M.; Meziane, F. Automated screening of MRI brain scanning using grey level statistics. Comput. Electr. Eng. 2016, 53, 276–291. [Google Scholar] [CrossRef]
- Nagarathinam, E.; Ponnuchamy, T. Image registration-based brain tumor detection and segmen-tation using ANFIS classification approach. Int. J. Imaging Syst. Technol. 2019, 29, 510–517. [Google Scholar] [CrossRef]
- Ahmadi, M.; Sharifi, A.; Fard, M.J.; Soleimani, N. Detection of brain lesion location in MRI images using convolutional neural network and robust PCA. Int. J. Neurosci. 2021, 1–12. [Google Scholar] [CrossRef] [PubMed]
- Toufiq, D.M.; Sagheer, A.M.; Veisi, H. Brain tumor identification with a hybrid feature extraction method based on discrete wavelet transform and principle component analysis. Bull. Electr. Eng. Inform. 2021, 10, 2588–2597. [Google Scholar] [CrossRef]
- Garg, G.; Garg, R. Brain tumor detection and classification based on hybrid ensemble classifier. arXiv 2021, arXiv:2101.00216. [Google Scholar]
- Pitchai, R.; Supraja, P.; Victoria, A.H.; Madhavi, M. Brain tumor segmentation using deep learning and fuzzy K-Means clustering for magnetic resonance im-ages. Neural Processing Lett. 2021, 53, 2519–2532. [Google Scholar] [CrossRef]
- Lu, S.; Wang, S.-H.; Zhang, Y.-D. Detection of abnormal brain in MRI via improved AlexNet and ELM optimized by chaotic bat algorithm. Neural Comput. Appl. 2021, 33, 10799–10811. [Google Scholar] [CrossRef]
- Murthy, M.Y.B.; Koteswararao, A.; Babu, M.S. Adaptive fuzzy deformable fusion and optimized CNN with ensemble classification for automated brain tumor diagnosis. Biomed. Eng. Lett. 2021, 12, 37–58. [Google Scholar] [CrossRef]
- Dehkordi, A.A.; Hashemi, M.; Neshat, M.; Mirjalili, S.; Sadiq, A.S. Brain Tumor Detection and Classification Using a New Evolutionary Convolutional Neural Network. arXiv 2022, arXiv:2204.12297. [Google Scholar] [CrossRef]
- Sharma, A.K.; Nandal, A.; Dhaka, A.; Koundal, D.; Bogatinoska, D.C.; Alyami, H. Enhanced Watershed Segmentation Algorithm-Based Modified ResNet50 Model for Brain Tumor Detection. BioMed Res. Int. 2022, 2022, 1–14. [Google Scholar] [CrossRef]
- Sharma, S.; Gupta, S.; Gupta, D.; Juneja, A.; Khatter, H.; Malik, S.; Bitsue, Z.K. Deep Learning Model for Automatic Classification and Prediction of Brain Tumor. J. Sensors 2022, 2022, 3065656. [Google Scholar] [CrossRef]
- Haitham, A.; Guesmi, R.; Alshammari, B.M.; Hamrouni, T.; Guesmi, T.; Alzamil, A.; Belguesmi, L. A Novel Data Augmentation-Based Brain Tumor Detection Using Convolutional Neural Network. Appl. Sci. 2022, 12, 3773. [Google Scholar]
- Ioffe, S.; Szegedy, C. Batch normalization: Accelerating deep network training by reducing internal covariate shift. arXiv 2015, arXiv:1502.03167. [Google Scholar]
- Montavon, G.; Samek, W.; Müller, K.-R. Methods for interpreting and understanding deep neural networks. Digit. Signal Process. 2018, 73, 1–15. [Google Scholar] [CrossRef]
- Harvard Medical School Data. Available online: http://www.med.harvard.edu/AANLIB/ (accessed on 16 March 2021).
- Benson, C.C.; Lajish, V.L. Morphology Based Enhancement and Skull Stripping of MRI Brain Images. In Proceedings of the 2014 International Conference on Intelligent Computing Applications, Coimbatore, India, 6–7 March 2014; pp. 254–257. [Google Scholar] [CrossRef]
- Kalavathi, P.; Prasath, V.B.S. Methods on skull stripping of MRI head scan images—A review. J. Digit. Imag. 2016, 29, 365–379. [Google Scholar] [CrossRef] [PubMed]
- Zhan, K.; Shi, J.; Li, Q.; Teng, J.; Wang, M. Image segmentation using fast linking SCM. In Proceedings of the International Joint Conference on Neural Networks (IJCNN), Killarney, Ireland, 12–17 July 2015. [Google Scholar]
- Zhan, K.; Zhang, H.; Ma, Y. New Spiking Cortical Model for Invariant Texture Retrieval and Image Processing. IEEE Trans. Neural Netw. 2009, 20, 1980–1986. [Google Scholar] [CrossRef] [PubMed]
- Eckhorn, R.; Frien, A.; Bauer, R.; Woelbern, T.; Kehr, H. High frequency (60–90 Hz) oscillations in primary visual cortex of awake monkey. Neuro Rep. Int. J. Rapid Commun. Res. Neurosci. 1993, 4, 243–246. [Google Scholar] [CrossRef]
- Kuntimad, G.; Ranganath, H. Perfect image segmentation using pulse coupled neural networks. IEEE Trans. Neural Networks 1999, 10, 591–598. [Google Scholar] [CrossRef]
- Otsu, N. A threshold selection method from gray-level histograms. IEEE Trans. Syst. Man Cybern. 1979, 9, 62–66. [Google Scholar] [CrossRef] [Green Version]
- Johnson, J.L.; Padgett, M.L. PCNN models and applications. IEEE Trans. Neural Netw. 1999, 10, 480–498. [Google Scholar] [CrossRef]
- Reddy, K.R.; Dhuli, R. Segmentation and classification of brain tumors from MRI images based on adaptive mechanisms and ELDP feature descriptor. Biomed. Signal Process. Control. 2022, 76, 103704. [Google Scholar] [CrossRef]
- Arlot, S.; Celisse, A. A survey of cross-validation procedures for model selection. Stat. Surv. 2010, 4, 40–79. [Google Scholar] [CrossRef]
- Bottou, L. Stochastic gradient descent tricks. In Neural Networks: Tricks of the Trade; Springer: Berlin/Heidelberg, Germany, 2012; pp. 421–436. [Google Scholar]
- Kingma, D.P.; Ba, J. Adam: A method for stochastic optimization. arXiv 2014, arXiv:1412.6980. [Google Scholar]
- Duchi, J.; Hazan, E.; Singer, Y. Adaptive subgradient methods for online learning and stochastic optimization. J. Mach. Learn. Res. 2011, 12, 2121–2159. [Google Scholar]
- Zeiler, M.D. Adadelta: An adaptive learning rate method. arXiv 2012, arXiv:1212.5701. [Google Scholar]
- Available online: http://www.cs.toronto.edu/~tijmen/csc321/slides/lecture_slides_lec6.pdf (accessed on 12 August 2022).
- Timothy, D. Incorporating nesterov momentum into adam. Nat. Hazards 2016, 3, 437–453. [Google Scholar]
Figure 1.
Softplus activation function.

Figure 2.
2 × 2 average pooling with stride 2.
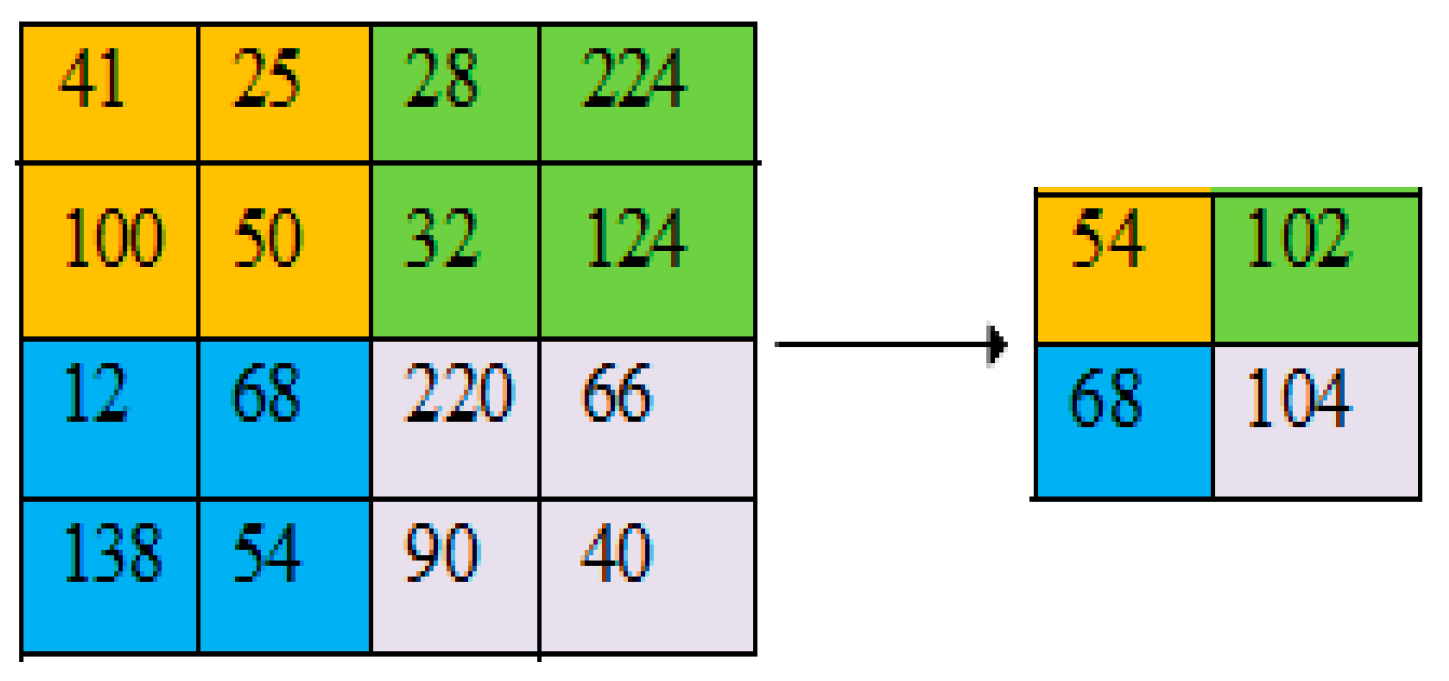
Figure 3.
Global average pooling with stride 2.
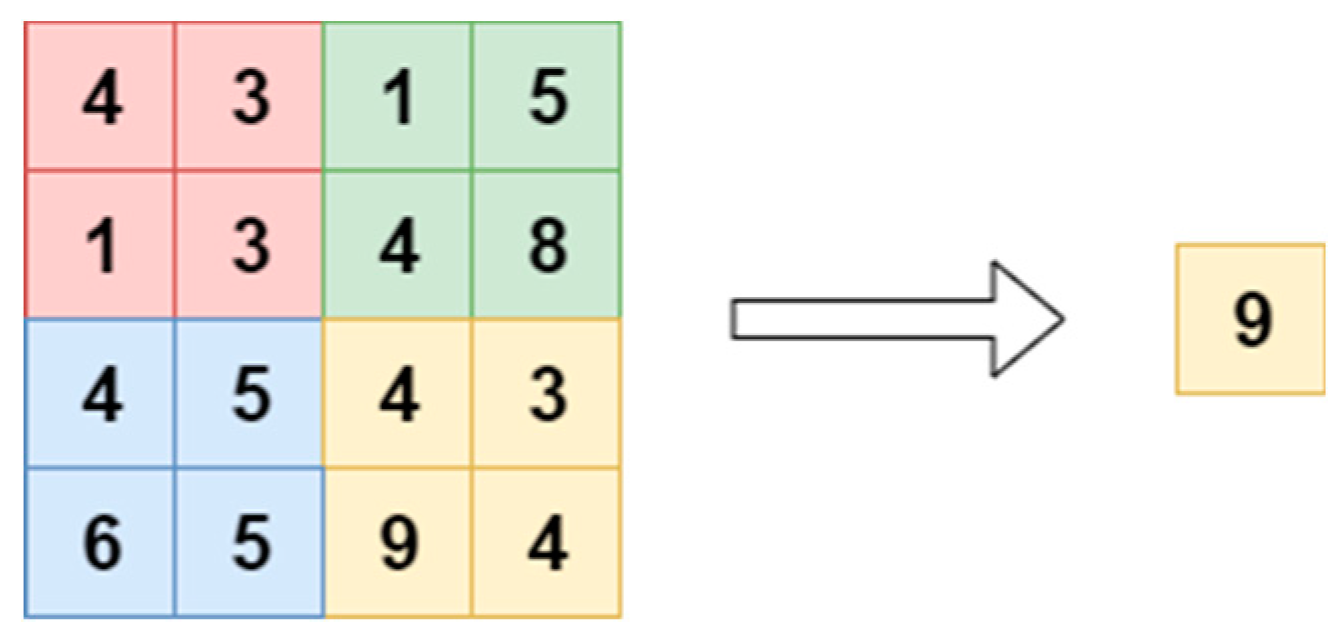
Figure 4.
Flow diagram of the suggested brain tumor segmentation and classification approach.

Figure 5.
Architecture of the suggested CNN model.
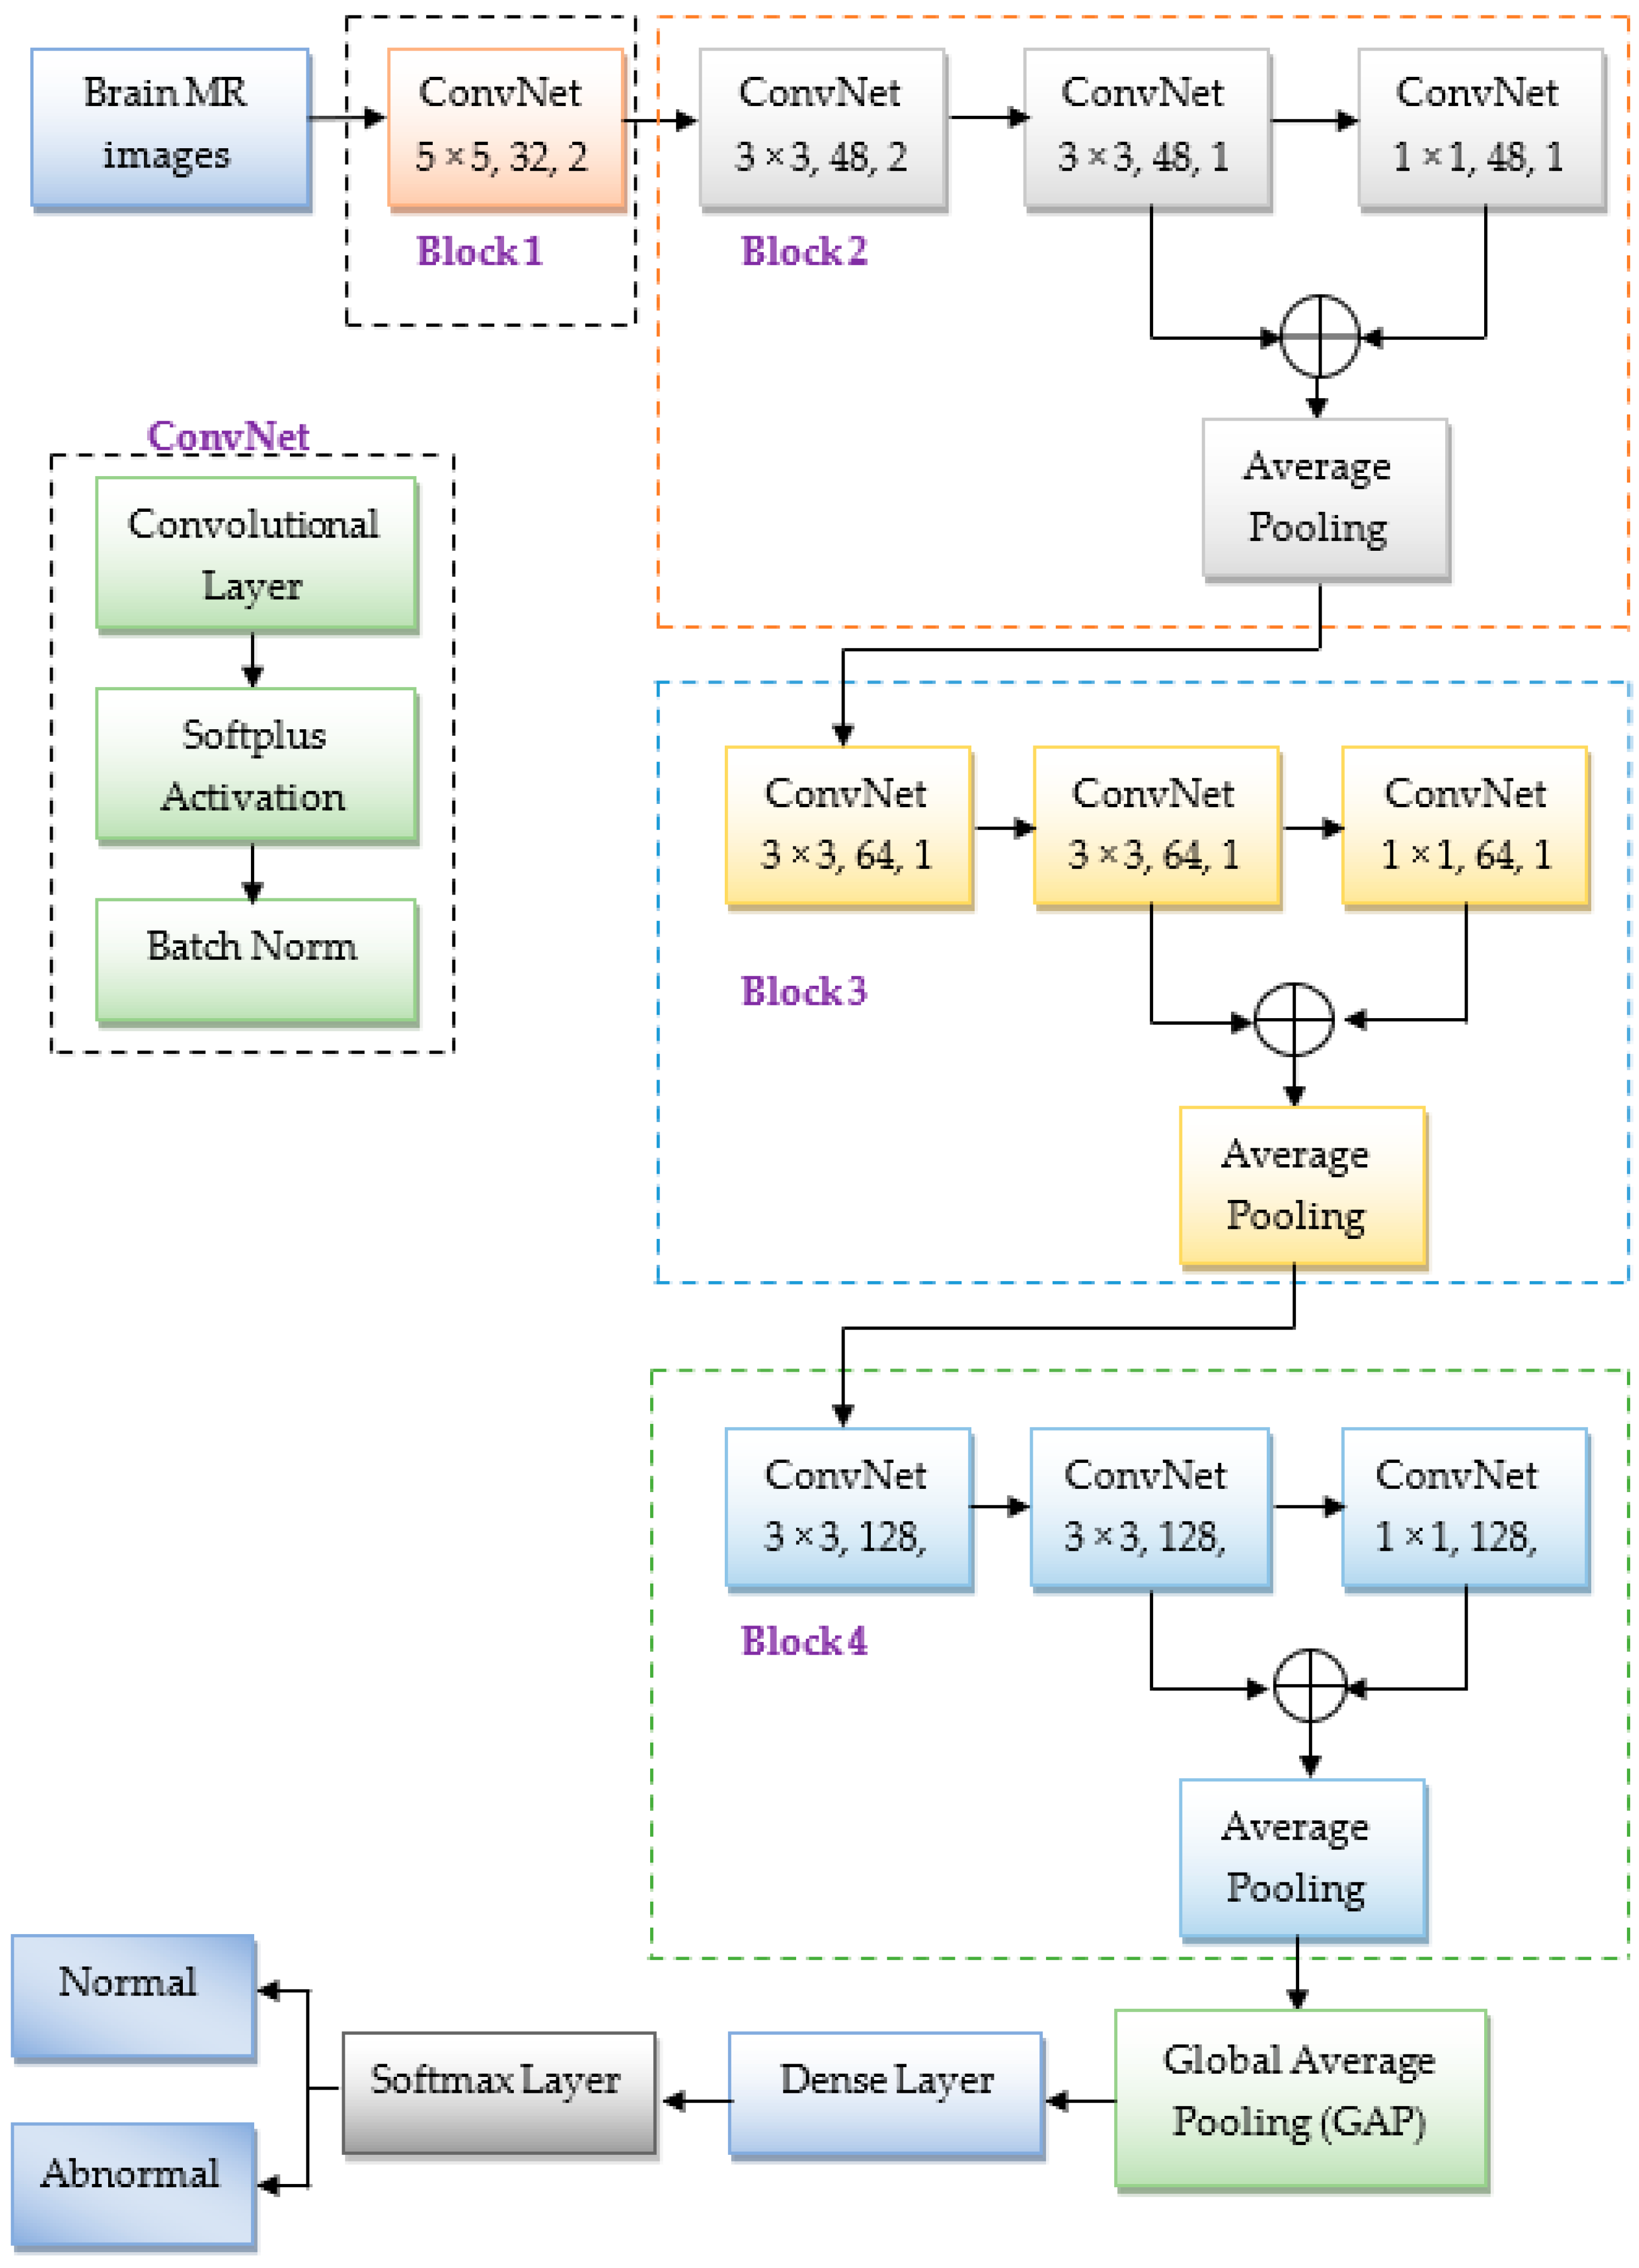
Figure 6.
Flow diagram of the SCM model.
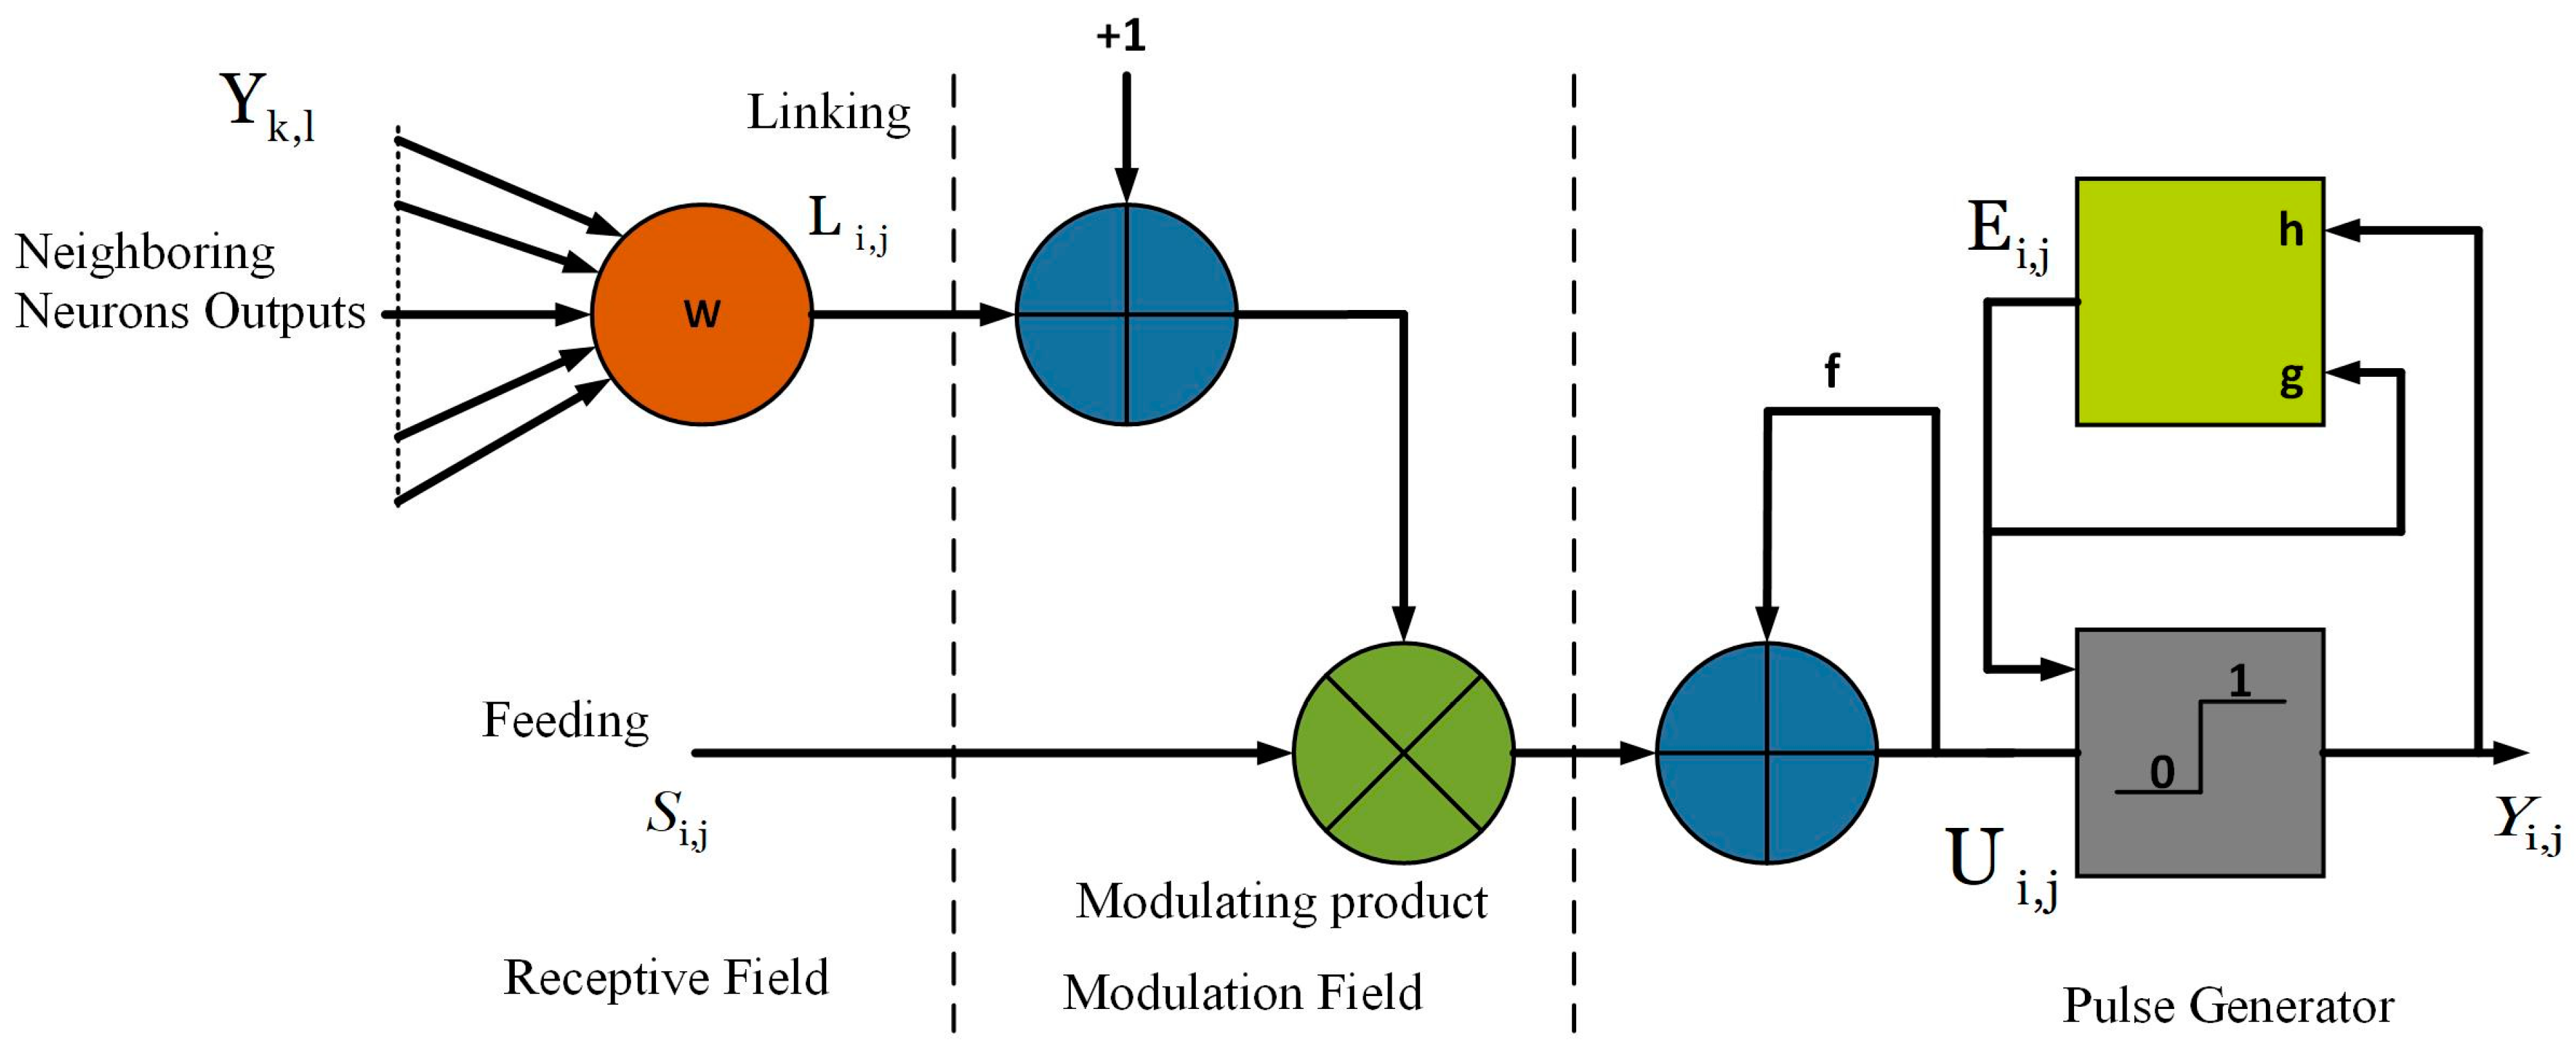
Figure 7.
Outcomes of the proposed brain tumor segmentation: (a–d) Original brain tumor MR images. (e–h) Skull-stripped images. (i–l) Infected tumor region of the brain MR images by FL-MSCM.
Figure 7.
Outcomes of the proposed brain tumor segmentation: (a–d) Original brain tumor MR images. (e–h) Skull-stripped images. (i–l) Infected tumor region of the brain MR images by FL-MSCM.


Table 1.
Summary of the state-of-the-art-approaches.
| Reference | Methods to Be Used | Accuracy | Pros | Cons |
|---|---|---|---|---|
| Kale et al. [8] | LBP and SP | Accuracy = 96.17% | Significantly extract the directional details of abnormal tissues. | Performance of the model depends upon the selection of orientation bands. |
| Singh et al. [9] | DWT and ICA | Accuracy = 98.87% | Relatively obtain the spatial information that is useful in the classification of brain MR images. | The selection of an appropriate mother wavelet is a major challenge. |
| Bahadure et al. [10] | FCM and BWT | DSC = 82% | In expensive to compute and manipulate. | Relatively required large number of coefficients for approximating the smooth functions. |
| Gokulalakshmi et al. [11] | DWT and GLCM | Accuracy = 92.76% | Low-processing time and easy to implement. | Selection of displacement vector. |
| Toğaçar et al. [12] | BrainMRNet | Accuracy = 96.05% | Substantially abstract the features. | Working on low-resolution images. |
| Neffati et al. [13] | DWT and PCA | Accuracy = 97.02% | Reduce overfitting and improve visualization. | Loose the some significant information. |
| Wang et al. [14] | SWT and Entropy | Accuracy = 96.6% | Significantly highlighting the image edge features. | Irrelevant features might be extracted due to wavelet aliasing. |
| Arunkumar et al. [15] | K-means clustering and ANN | Accuracy = 94.07% | Woks very well on limited data. | Selection of K-value is difficult. |
| Toğaçar et al. [16] | CNN and hyper-column feature selection | Accuracy = 96.77% | Relatively retain the local discriminative features. | High computational time. |
| Chanu et al. [17] | CNN | Accuracy = 97.14 % | Less computational time. | Low performance on normal brain MR images |
| Lu et al. [18] | AlexNet | Accuracy = 95.71 % | Perform well on abnormal brain MR images. | Large number of parameters to be need for training. |
| Vishnuvarthanan et al. [19] | SOM-FKM | DSC = 47% | Faster convergence with significant accuracy. | Requires necessary and sufficient information for developing significant clusters. |
| Hasan et al. [20] | Modified GLCM | Accuracy = 97.8 % | Achieved remarkable accuracy and also independent on atlas registration. | Large memory requirements and computationally expensive. |
| Nagarathinam et al. [21] | GLCM and Morphological operations | DSC = 92% | Does not required any seed points for identification of brain MR tumor Images. | Low classification accuracy on abnormal brain MR images. |
| Ahmadi et al. [22] | CNN | DSC = 91% | Faster segmentation. | Heavily depends upon the network design parameters. |
| Toufiq et al. [23] | DWT, PCA, GLCM | Accuracy = 98 % | Minimizing the overfitting problems. | Loss of essential details due to the feature reduction process. |
| Ginni Garg et al. [24] | SWT, PCA, and Hybrid Ensemble classifier | Accuracy = 97.305% | Relatively improve the robustness of derived texture features. | High time complexity. |
| Pitchai et al. [25] | GLCM, FKM and ANN | Accuracy = 94% | Does not effect by over segmentation. | The accuracy of the ANN classifier entirely depends on the number of hidden neurons (HN). |
| Siyuan et al. [26] | Improved AlexNet, ELM and CBM | Accuracy = 98 % | Minimizing the overfitting problems | High computational complexity. |
| Mantripragada et al. [27] | AFDM and DNN | Accuracy = 96.22% | High convergence rate. | Low training speed and high complexity. |
| Amin et al. [28] | CNN and Nonlinear Lévy Chaotic Moth Flame Optimizer (NLCMFO) | Accuracy = 97.4% | Effective hyper-parameter tuning. | Difficulty in deterinming the ideal control parameters in NLCMFO. |
| Sharma et al. [29] | ResNet 50, EWS | Accuracy = 92 % | Significantly locate the boundary pixels of the tumor. | High computational time and heavily depends on batch normalization layers. |
| Sharma et al. [30] | VGG 19 | Accuracy = 98.04% | Relatively working on a more extensive database. | Only the axial dataset of brain tumors was considered. |
| Haitham et al. [31] | Cascaded CNN | DSC = 85.3% | Relatively achieved good performance in a limited brain MR image database. | Required more time to train the parameters. |
Table 2.
Parameter settings of the proposed augmentation operators.
| Augmentation Operator | Value |
|---|---|
| Rotation | Randomly from −30° to 30° |
| Translation | Translate along X (horizontal) and Y (vertical) directions with a range of [−10,10] |
| Reflection | Reflect randomly along X and Y-direction |
| Scale | Uniform scaling with a range of [0.5 to 4] |
| Shear | Shearing along vertical and horizontal with a range of [0° to 30°] |
Table 3.
Configurations of the suggested CNN model.
| Block | Layers and Specifications | Size of the Activations | Parameters |
|---|---|---|---|
| - | Input image | 224 × 224 × 3 | 0 |
| - | 5 × 5 Convolution with 32 filters | 110 × 110 × 32 | 2432 |
| Batch norm | 110 × 110 × 32 | 128 | |
| 1 | 3 × 3 Convolution with 48 filters | 54 × 54 × 48 | 13,872 |
| Batch norm | 54 × 54 × 48 | 192 | |
| 3 × 3 Convolution with 48 filters | 52 × 52 × 48 | 20,784 | |
| Batch Norm | 52 × 52 × 48 | 192 | |
| 1 × 1 Convolution with 48 filters | 52 × 52 × 48 | 2352 | |
| Batch Norm | 52 × 52 × 48 | 192 | |
| 2 × 2 Average pooling with stride 2 | 26 × 26 × 48 | 0 | |
| 2 | 3 × 3 Convolution with 64 filters | 24 × 24 × 64 | 27,712 |
| Batch Norm | 24 × 24 × 64 | 256 | |
| 3 × 3 Convolution with 64 filters | 22 × 22 × 64 | 36,928 | |
| Batch Norm | 22 × 22 × 64 | 256 | |
| 1 × 1 Convolution with 64 filters | 22 × 22 × 64 | 4160 | |
| Batch Norm | 22 × 22 × 64 | 256 | |
| 2 × 2 Average pooling with stride 2 | 11 × 11 × 64 | 0 | |
| 3 | 3 × 3 Convolution with 128 filters | 9 × 9 × 128 | 73,856 |
| Batch Norm | 9 × 9 × 128 | 512 | |
| 3 × 3 Convolution with 128 filters | 7 × 7 × 128 | 147,584 | |
| Batch Norm | 7 × 7 × 128 | 512 | |
| 1 × 1 Convolution with 128 filters | 7 × 7 × 128 | 16,512 | |
| Batch Norm | 7 × 7 × 128 | 512 | |
| 2 × 2 Average pooling with stride 2 | 3 × 3 × 128 | 0 | |
| Global average pooling | - | 0 | |
| Fully connected layer | - | 258 | |
| Trainable parameters | 347,954 | ||
| Non- trainable parameters | 1504 | ||
| Total parameters | 349,458 |
Table 4.
Parameter settings of optimizer.
| Optimizer | Parameters |
|---|---|
| SGDM | = 0.001, momentum = 0.9 |
| Adam | = 0.001, = 0.9, = 0.999, and = 10×10−7 |
| Adamax | = 0.001, = 0.9, =0.999, and = 10×10−7 |
| Adagrad | = 0.001 and = 10×10−7 |
| Adadelta | = 0.001, = 10 × 10−7 and rho = 0.95 |
| RMSprop | = 0.001, = 10×10−7 and rho = 0.9 |
| Nadam | = 0.001, = 0.9, =0.999, and = 10×10−7 |
Note: represents learning rate; , and ‘rho’ are the decay factors; is the constant for numerical stability and usually taken smaller value.
Table 5.
Classification performance of the proposed model on SGDM optimizer.
| 5-FCV | Performance Metrics (%) | |||||
|---|---|---|---|---|---|---|
| TPR | TNR | PPV | F-Score | AUC | Accuracy | |
| 1st Fold | 100 | 99.13 | 99.54 | 99.77 | 99.56 | 99.7 |
| 2nd Fold | 99.11 | 98.15 | 99.11 | 99.11 | 98.63 | 98.8 |
| 3rd Fold | 100 | 95.57 | 97.78 | 98.87 | 97.78 | 98.5 |
| 4th Fold | 97.85 | 99 | 99.56 | 98.67 | 98.42 | 98.2 |
| 5th Fold | 99.56 | 96.15 | 98.27 | 98.91 | 97.85 | 98.5 |
| Mean ± SD | 99.3 ± 0.4 | 97.6 ± 0.73 | 98.85 ± 0.35 | 99.06 ± 0.19 | 98.45 ± 0.32 | 98.74 ± 0.52 |
Note: SD = for standard deviation.
Table 6.
Classification performance of the proposed model on Adam optimizer.
| 5-FCV | Performance Metrics (%) | |||||
|---|---|---|---|---|---|---|
| TPR | TNR | PPV | F-Score | AUC | Accuracy | |
| 1st Fold | 100 | 100 | 100 | 100 | 100 | 100 |
| 2nd Fold | 100 | 100 | 100 | 100 | 100 | 100 |
| 3rd Fold | 97.7 | 100 | 100 | 98.84 | 98.9 | 98.5 |
| 4th Fold | 100 | 100 | 100 | 100 | 100 | 100 |
| 5th Fold | 99.57 | 98.98 | 99.57 | 99.57 | 99.4 | 99.4 |
| Mean ± SD | 99.45 ± 0.44 | 99.80 ± 0.2 | 99.91 ± 0.08 | 99.68 ± 0.36 | 99.66 ± 0.22 | 99.58 ± 0.29 |
Note: SD = for standard deviation.
Table 7.
Classification performance of the proposed model on Adamax optimizer.
| 5-FCV | Performance Metrics (%) | |||||
|---|---|---|---|---|---|---|
| TPR | TNR | PPV | F-Score | AUC | Accuracy | |
| 1st Fold | 98.68 | 100 | 100 | 99.33 | 99.34 | 99.1 |
| 2nd Fold | 98.58 | 100 | 100 | 99.28 | 99.3 | 99.1 |
| 3rd Fold | 97.4 | 100 | 100 | 98.68 | 98.7 | 98.2 |
| 4th Fold | 99.56 | 99.04 | 99.56 | 99.56 | 99.3 | 99.4 |
| 5th Fold | 100 | 100 | 100 | 100 | 100 | 100 |
| Mean ± SD | 98.84 ± 0.45 | 99.80 ± 0.19 | 99.91 ± 0.08 | 99.37 ± 0.29 | 99.33 ± 0.21 | 99.16 ± 0.29 |
Note: SD = for standard deviation.
Table 8.
Classification performance of the proposed model on Nadam optimizer.
| 5-FCV | Performance Metrics (%) | |||||
|---|---|---|---|---|---|---|
| TPR | TNR | PPV | F-Score | AUC | Accuracy | |
| 1st Fold | 100 | 100 | 100 | 100 | 100 | 100 |
| 2nd Fold | 99.56 | 100 | 100 | 99.78 | 99.8 | 99.7 |
| 3rd Fold | 100 | 89.52 | 95.4 | 97.64 | 97.7 | 96.7 |
| 4th Fold | 100 | 100 | 100 | 100 | 100 | 100 |
| 5th Fold | 99.56 | 100 | 100 | 99.78 | 99.8 | 99.7 |
| Mean ± SD | 99.82 ± 0.11 | 97.90 ± 2.1 | 99.08 ± 0.92 | 99.44 ± 0.45 | 99.46 ± 0.44 | 99.22 ± 0.63 |
Note: SD = for standard deviation.
Table 9.
Classification performance of the proposed model on Adadelta optimizer.
| 5-FCV | Performance Metrics (%) | |||||
|---|---|---|---|---|---|---|
| TPR | TNR | PPV | F-Score | AUC | Accuracy | |
| 1st Fold | 89.57 | 83.60 | 90.43 | 89.99 | 86.6 | 87.38 |
| 2nd Fold | 96.44 | 79.63 | 90.79 | 93.53 | 88.04 | 90.99 |
| 3rd Fold | 99.54 | 80.35 | 90.90 | 95.02 | 89.94 | 93.01 |
| 4th Fold | 96.10 | 81.37 | 92.12 | 94.07 | 88.74 | 91.6 |
| 5th Fold | 99.58 | 58.33 | 85.51 | 92.01 | 78.95 | 87.68 |
| Mean ± SD | 96.25 ± 1.82 | 76.66 ± 4.63 | 89.95 ± 1.14 | 92.92 ± 0.88 | 86.45 ± 1.95 | 90.13 ± 1.1 |
Note: SD = for standard deviation.
Table 10.
Classification performance of the proposed model on RMSProp optimizer.
| 5-FCV | Performance Metrics (%) | |||||
|---|---|---|---|---|---|---|
| TPR | TNR | PPV | F-Score | AUC | Accuracy | |
| 1st Fold | 100 | 100 | 100 | 100 | 100 | 100 |
| 2nd Fold | 98.68 | 100 | 100 | 99.33 | 99.34 | 99.01 |
| 3rd Fold | 87.66 | 99.06 | 99.5 | 93.20 | 93.36 | 91.3 |
| 4th Fold | 100 | 80.33 | 89.78 | 94.61 | 90.2 | 92.8 |
| 5th Fold | 100 | 100 | 100 | 100 | 100 | 100 |
| Mean ± SD | 97.268 ± 2.41 | 95.88 ± 3.89 | 97.85 ± 2.02 | 97.43 ± 1.46 | 96.58 ± 2.02 | 96.62 ± 1.89 |
Note: SD = for standard deviation.
Table 11.
Classification performance of the proposed model on Adagrad optimizer.
| 5-FCV | Performance Metrics (%) | |||||
|---|---|---|---|---|---|---|
| TPR | TNR | PPV | F-Score | AUC | Accuracy | |
| 1st Fold | 98.16 | 100 | 100 | 99.07 | 99.08 | 98.8 |
| 2nd Fold | 97.8 | 95.24 | 97.8 | 97.8 | 96.52 | 96.99 |
| 3rd Fold | 99.54 | 97.34 | 98.65 | 99.09 | 98.44 | 98.8 |
| 4th Fold | 100 | 75.96 | 90.16 | 94.82 | 87.98 | 92.5 |
| 5th Fold | 97.83 | 95.14 | 97.83 | 97.83 | 96.48 | 96.99 |
| Mean ± SD | 98.67 ± 0.46 | 92.74 ± 4.28 | 96.88 ± 1.73 | 96.82 ± 0.77 | 97.72 ± 1.99 | 96.82 ± 1.15 |
Note: SD = for standard deviation.
Table 12.
Classification performance of the suggested method and existing works.
| Methodology | Number of Images | Data Augmentation (Yes/No) | Parameters (Millions) | Metrics (%) | ||
|---|---|---|---|---|---|---|
| TPR | TNR | Accuracy | ||||
| MGLCM + MLP [20] | 165 | No | - | 98.1 | 97.6 | 97.8 |
| SW Entropy + RBF-SVM [14] | 255 | No | - | 98.97 | 85 | 96.6 |
| ANN [15] | 230 | No | - | 90.9 | 96.78 | 94.07 |
| DWT + KPCA + SVM [13] | 255 | No | - | 100 | 85 | 97.02 |
| AlexNet [18] | 291 | No | 56.8 | 100 | 75 | 95.71 |
| LBPSPEnerg + BPNN [8] | 612 | No | - | 98.97 | 87.5 | 96.17 |
| DWT + ICA + RBF-SVM [9] | 240 | No | - | 98.97 | 97.68 | 98.87 |
| DWT + GLCM + SVM [11] | 750 | No | - | 99.48 | 60 | 92.76 |
| BrainMRNet [12] | 253 | Yes | 0.605 | 96 | 96.08 | 96.05 |
| AlexNet + VGG-16 + RFE [16] | 310 | Yes | 27.82 | 97.83 | 95.74 | 96.77 |
| 2D CNN [17] | 309 | Yes | - | 100 | 94.11 | 97.14 |
| DWT + PCA + RF [23] | 181 | No | - | 99.2 | 97.8 | 98 |
| SWT-GLCM-Hybrid Classifier [24] | 2556 | No | - | 97.04 | 97.60 | 97.31 |
| FKM-ANN [25] | - | - | - | 98 | 99 | 94 |
| AlexNet-ELM-CBM [26] | 359 | No | 62.3 | 97.14 | 95.71 | 96.43 |
| AFDF-DNN [27] | - | - | - | 98.35 | 50 | 96.44 |
| CNN [28] | 694 | No | - | 96 | 98.6 | 97.4 |
| Modified ResNet50 [29] | 278 | Yes | 23.68 | 83 | 80 | 92 |
| VGG-19 [30] | 257 | No | 143 | 100 | 94.73 | 98.04 |
| The Proposed (lightweight CNN) | 185 | Yes | 0.349 | 99.45 | 99.8 | 99.58 |
Table 13.
Performance of the suggested MR based brain tumor segmentation approach.
| Sample Image | DSC | PPV | TPR | TNR | F-Score | AUC | Accuracy |
|---|---|---|---|---|---|---|---|
| 1 | 96.46 | 99.76 | 99.94 | 94.41 | 99.85 | 97.17 | 99.71 |
| 2 | 94.8 | 99.96 | 99.97 | 94.58 | 99.96 | 97.27 | 99.93 |
| 3 | 96.05 | 99.85 | 99.85 | 96.03 | 99.85 | 97.94 | 99.71 |
| 4 | 99.4 | 99.94 | 99.96 | 99.29 | 99.95 | 99.63 | 99.91 |
| 5 | 89.04 | 99.8 | 99.77 | 89.81 | 99.78 | 94.75 | 99.57 |
| 6 | 88 | 99.86 | 99.73 | 91.53 | 99.79 | 95.63 | 99.59 |
| 7 | 99.53 | 99.99 | 99.95 | 99.8 | 99.97 | 99.8 | 99.94 |
| 8 | 93.16 | 99.37 | 99.53 | 92.23 | 99.45 | 95.88 | 98.98 |
| 9 | 87.98 | 99.4 | 99.86 | 81.91 | 99.62 | 90.88 | 99.28 |
| 10 | 98.58 | 99.82 | 99.98 | 97.51 | 99.89 | 98.74 | 99.81 |
| 11 | 99.94 | 100 | 100 | 99.97 | 99.99 | 99.98 | 99.99 |
| 12 | 98.82 | 99.9 | 99.99 | 97.87 | 99.94 | 98.93 | 99.89 |
| 13 | 97.68 | 99.94 | 99.96 | 97.16 | 99.95 | 98.56 | 99.91 |
| 14 | 89.43 | 99.95 | 99.15 | 98.76 | 99.55 | 98.96 | 99.14 |
| 15 | 95.3 | 99.99 | 99.62 | 99.84 | 99.8 | 99.73 | 99.62 |
| 16 | 95.61 | 99.82 | 99.9 | 94.44 | 99.86 | 97.17 | 99.73 |
| 17 | 91.77 | 100 | 99.74 | 100 | 99.86 | 99.87 | 99.74 |
| 18 | 95.6 | 99.21 | 99.46 | 94.78 | 99.33 | 97.12 | 98.84 |
| 19 | 97.15 | 99.94 | 99.44 | 99.44 | 99.68 | 99.44 | 99.44 |
| 20 | 95.6 | 99.37 | 99.83 | 93.26 | 99.6 | 96.55 | 99.27 |
| 21 | 97.12 | 99.68 | 99.95 | 95.12 | 99.81 | 97.54 | 99.65 |
| 22 | 98.49 | 100 | 99.94 | 100 | 99.97 | 99.97 | 99.94 |
| 23 | 96.29 | 99.99 | 99.82 | 99.57 | 99.9 | 99.69 | 99.81 |
| 24 | 97.22 | 99.98 | 99.64 | 99.75 | 99.81 | 99.7 | 99.65 |
| 25 | 88.74 | 99.51 | 99.46 | 89.3 | 99.78 | 94.75 | 99.01 |
| 26 | 99.56 | 99.98 | 99.98 | 99.56 | 99.98 | 99.77 | 99.96 |
| 27 | 96.36 | 100 | 99.79 | 100 | 99.89 | 99.9 | 99.8 |
| 28 | 98.28 | 99.99 | 99.9 | 99.69 | 99.95 | 99.8 | 99.9 |
| 29 | 99.76 | 100 | 100 | 99.93 | 99.99 | 99.96 | 99.99 |
| 30 | 98.88 | 99.97 | 99.97 | 98.85 | 99.97 | 99.41 | 99.94 |
| Average | 95.7 | 99.83 | 99.8 | 96.5 | 99.82 | 98.15 | 99.65 |
Disclaimer/Publisher’s Note: The statements, opinions and data contained in all publications are solely those of the individual author(s) and contributor(s) and not of MDPI and/or the editor(s). MDPI and/or the editor(s) disclaim responsibility for any injury to people or property resulting from any ideas, methods, instructions or products referred to in the content. |
© 2023 by the authors. Licensee MDPI, Basel, Switzerland. This article is an open access article distributed under the terms and conditions of the Creative Commons Attribution (CC BY) license (https://creativecommons.org/licenses/by/4.0/).
Share and Cite
MDPI and ACS Style
Reddy, K.R.; Dhuli, R. A Novel Lightweight CNN Architecture for the Diagnosis of Brain Tumors Using MR Images. Diagnostics 2023, 13, 312. https://doi.org/10.3390/diagnostics13020312
AMA Style
Reddy KR, Dhuli R. A Novel Lightweight CNN Architecture for the Diagnosis of Brain Tumors Using MR Images. Diagnostics. 2023; 13(2):312. https://doi.org/10.3390/diagnostics13020312
Chicago/Turabian StyleReddy, Kamireddy Rasool, and Ravindra Dhuli. 2023. "A Novel Lightweight CNN Architecture for the Diagnosis of Brain Tumors Using MR Images" Diagnostics 13, no. 2: 312. https://doi.org/10.3390/diagnostics13020312
Note that from the first issue of 2016, this journal uses article numbers instead of page numbers. See further details here.