1. Introduction
The rise of cellular life on the early Earth provided a unique opportunity for escaping from the vagaries of chemical interactions happening in a compartment-free context [
1]. Once formed, lipid membranes or other types of prebiotic compartments (e.g., coacervates [
2]) constitute the natural source of asymmetries that fundamentally characterize cells as non-equilibrium systems [
3]. In that context, gradients and selective diffusion forces may start ruling the matter and energy flows between an internal distinct medium and the external environment. These flows are ultimately responsible for powering reactions that sustain cellular processes and structures. In our modern, evolved living world, cells exhibit a highly complex set of feedbacks and control mechanisms between biosynthetic reaction pathways and the dynamical organization of the membrane, including channels, receptors and complex supramolecular structures. On these lines, some authors [
4] claim that metabolisms should no longer be conceived just as complex networks of cyclic, strongly-regulated and coupled reactions, but in addition, ought to be understood as intrinsically “vectorial” [
5],
i.e., involving membrane processes and dynamics from their very core.
In this theoretical study, we take as a starting point a prebiotic scenario in which primitive protocells (lipid vesicles) would spontaneously form and behave as dynamic supramolecular structures that can host and get coupled to various chemical reactions within their inner aqueous medium. We shall focus on the non-linear cross-effects appearing when these chemically-active protocellular systems are treated as proper dynamic entities; in particular, when they are no longer considered to have a fixed volume. For that purpose, we develop a minimal semi-spatial mathematical model of a variable-volume vesicle reactor, in which reaction and compartment dynamics can affect each other, driven by the relatively rapid water exchanges between the inner and outer media. Although other processes (such as growth, competition, eventual reproduction and inheritance) are fundamental to understand the evolutionary role of protocells [
6,
7,
8,
9], our goal in this article is to begin exploring the potential for chemical innovation
in situ, in vesicle compartments that do not necessarily divide and have any offspring [
10]. More specifically, we are interested in how coupling both components of the protocellular organization (semi-permeable membrane and encapsulated chemistry) can allow, under some circumstances, to expand the space of possible steady states exhibited by the whole system, beyond what is associated with the pure reaction dynamics inside.
Before proceeding with the definition of our model, which is based on the original work of [
11,
12], we will briefly review other theoretical studies of compartmentalized chemical systems that have addressed, one way or the other, the question of inner volume variability. This survey will allow placement of our model within a wider context of ongoing research.
Variable solvent volume was obviously recognized early on as an important factor affecting, for example, catalytic activity [
13], but it is only recently that a handful of studies paying attention to this aspect have started to appear. In 2004, a “dilution term” was introduced as a necessary addition in deterministic concentration ODEs to properly describe reactions in changing solvent volume [
14], and more recently, this framework has been used to expose the unexpected character of enzymatic reactions happening inside changing volume cell organelles [
15]. In the arena of stochastic modeling, and also in 2004, initial extensions to the Gillespie Stochastic Simulation Algorithm (SSA) were proposed to handle the simulation of reactions in a cell volume that periodically doubled and then divided [
16].
With respect to protocells, the major shortcoming of the latter studies was that the system volume did not have an osmotic dependence on the concentrations of the reaction species involved. Rather, variations in the volume were conceived as a result of a deterministic process independent of the chemical reaction dynamics. The reason was that the reactions under study were thought to form small sub-networks of a much larger system whose complete dynamics were unspecified, but which was, nevertheless, known to change volume in a predictable way (e.g., through cell division).
More recently, Martín
et al. [
17] have used the dilution term to model primitive cells, where metabolic complexity is strongly reduced. In this protocell scenario, the complete description of the reaction system encapsulated within the membrane is known, and this permits the variation of volume to be formulated, via osmotic considerations, as explicitly depending on the total concentration of internal species. They revealed that well-studied chemical oscillators, when in variable volume “vesicle-like” conditions (even if the membrane as such is not modeled), showed altered limit cycles depending on how strongly the rate of change in volume was influenced by the rate of change in total solute concentrations. Degeneration to a single, stable steady state was generally observed for larger volume changes. On the stochastic front, an approach to extending the Gillespie SSA to vesicle systems whose volume changes, via water osmosis, as a function of internal reactant concentrations has been proposed [
11,
12,
18]. Here, the assumption is made that vesicle volume updates instantaneously, with zero lag, after each event producing or consuming solute molecules inside the vesicle. This strategy leaves the core mathematics of the Gillespie algorithm unchanged by simply re-calculating the molecular event propensities from deterministic rate constants [
19] after each event, taking into account the updated volume. Neglecting water osmosis, an alternative line of research has been to consider reactions inside variable surface area compartments instead and derive the compartment volume by assuming that the enclosing membrane is always spherical (for example, Villani
et al. in this Special Issue [
20], or models of Ganti’s chemoton [
21,
22,
23]). In the stochastic domain, [
24] have made an approximate reformulation of the Gillespie SSA to deal with reactions in a volume whose growth is dictated by a monotonically increasing spherical membrane.
While all of the models reviewed thus far acknowledge the relevance of changing volume to a cell or protocell system, it is quite remarkable that almost all neglect that solutes actually have to passively diffuse across a lipid bilayer surface in order to enter or leave the variable volume water pool. One recent semi-empirical study that does pay attention to how finite membrane diffusion rates could limit resources to a compartmentalized proto-metabolism (but within a fixed volume, fixed surface area vesicle) is [
25]. Along the same lines, our own previous work has performed a theoretical analysis of a very simple “bioreactor” consisting of a unimolecular reaction happening inside a vesicle, where the vesicle has again fixed surface area, but now variable volume and mechano-sensitive channels in the membrane [
26]. The vesicle reactor model of the current study is a significant extension of this latter model, further incorporating a first approach to variable vesicle surface area and considering more complex reaction chemistries inside the vesicle reactor.
All studies briefly reviewed above, including the present study, fall within the category of semi-spatial, “well-stirred” compartment models. Under this simplifying approach, diffusion of solutes only occurs across membrane interfaces and is otherwise considered instantaneous throughout solution phases. However, it is important to mention that fully spatially explicit models of compartmentalized chemistries inside vesicles have also been developed. In particular, Macía and Solé [
27] presented a two-dimensional vesicle model in which a membrane-bound “Turing” reaction-diffusion system was able to exert non-uniform osmotic pressures along the surface of the (spatially resolved) membrane, leading to spontaneous and indefinitely repeatable vesicle division. In another recent work [
28], a two-dimensional hypothetical vesicle was instead modeled as a one-dimensional periodic array of micro cells, spatially representing the portion of solution contacting the vesicle membrane on the interior side. Stochastic simulation of this model with autocatalytic reactions lead to oscillations between microcells, again providing non-uniform osmotic pressures along the surface of the membrane.
With respect to these advanced studies, our current contribution can be regarded as a minimal model to demonstrate, in the simplest possible way, the consequences that a changing solvent volume may have on a set of encapsulated reactions. The article is structured as follows. First, in the Reactor Models section, two classical bulk reaction scenarios are introduced, which will be later used for comparative purposes. Then, the vesicle reactor model is described, followed by a qualitative graphical method used to find its fixed points. The Results section examines three case studies, where it is shown that our treatment of the problem to encompass variable-volume conditions does have relevant effects on the internal chemical dynamics. More concretely, multiple states are found to emerge from the coupling of reactions and variable volume provided by a surrounding semi-permeable membrane. Here, the new idea of “osmotic coupling” of reactions is explained in detail. The Discussion section summarizes the significance of our results, recapitulates limitations and suggests future research directions to explore. Finally, the Methods section outlines the strategy used to tackle the large parameter space of the vesicle reactor model, a strategy indispensable in producing the main results. The
Supplementary Material (on line) contains essential supporting derivations and data.
2. Reactor Models
The traditional and mathematically most simple way to formalize a reaction system held far from equilibrium (FFE) is to assume well-stirred conditions and the existence of a permanent concentration gradient in the form of two (or more) inexhaustible reservoir species (
Figure 1a). Under these reservoir conditions, the dynamic behavior of reaction intermediate species is of interest, species which dissipate energy between the high and low energy reservoirs (resource and waste species). Such a system has a dimension equal to the number of intermediate species only, and each concentration time derivative contains just mass action kinetics (MAK) terms.
Figure 1.
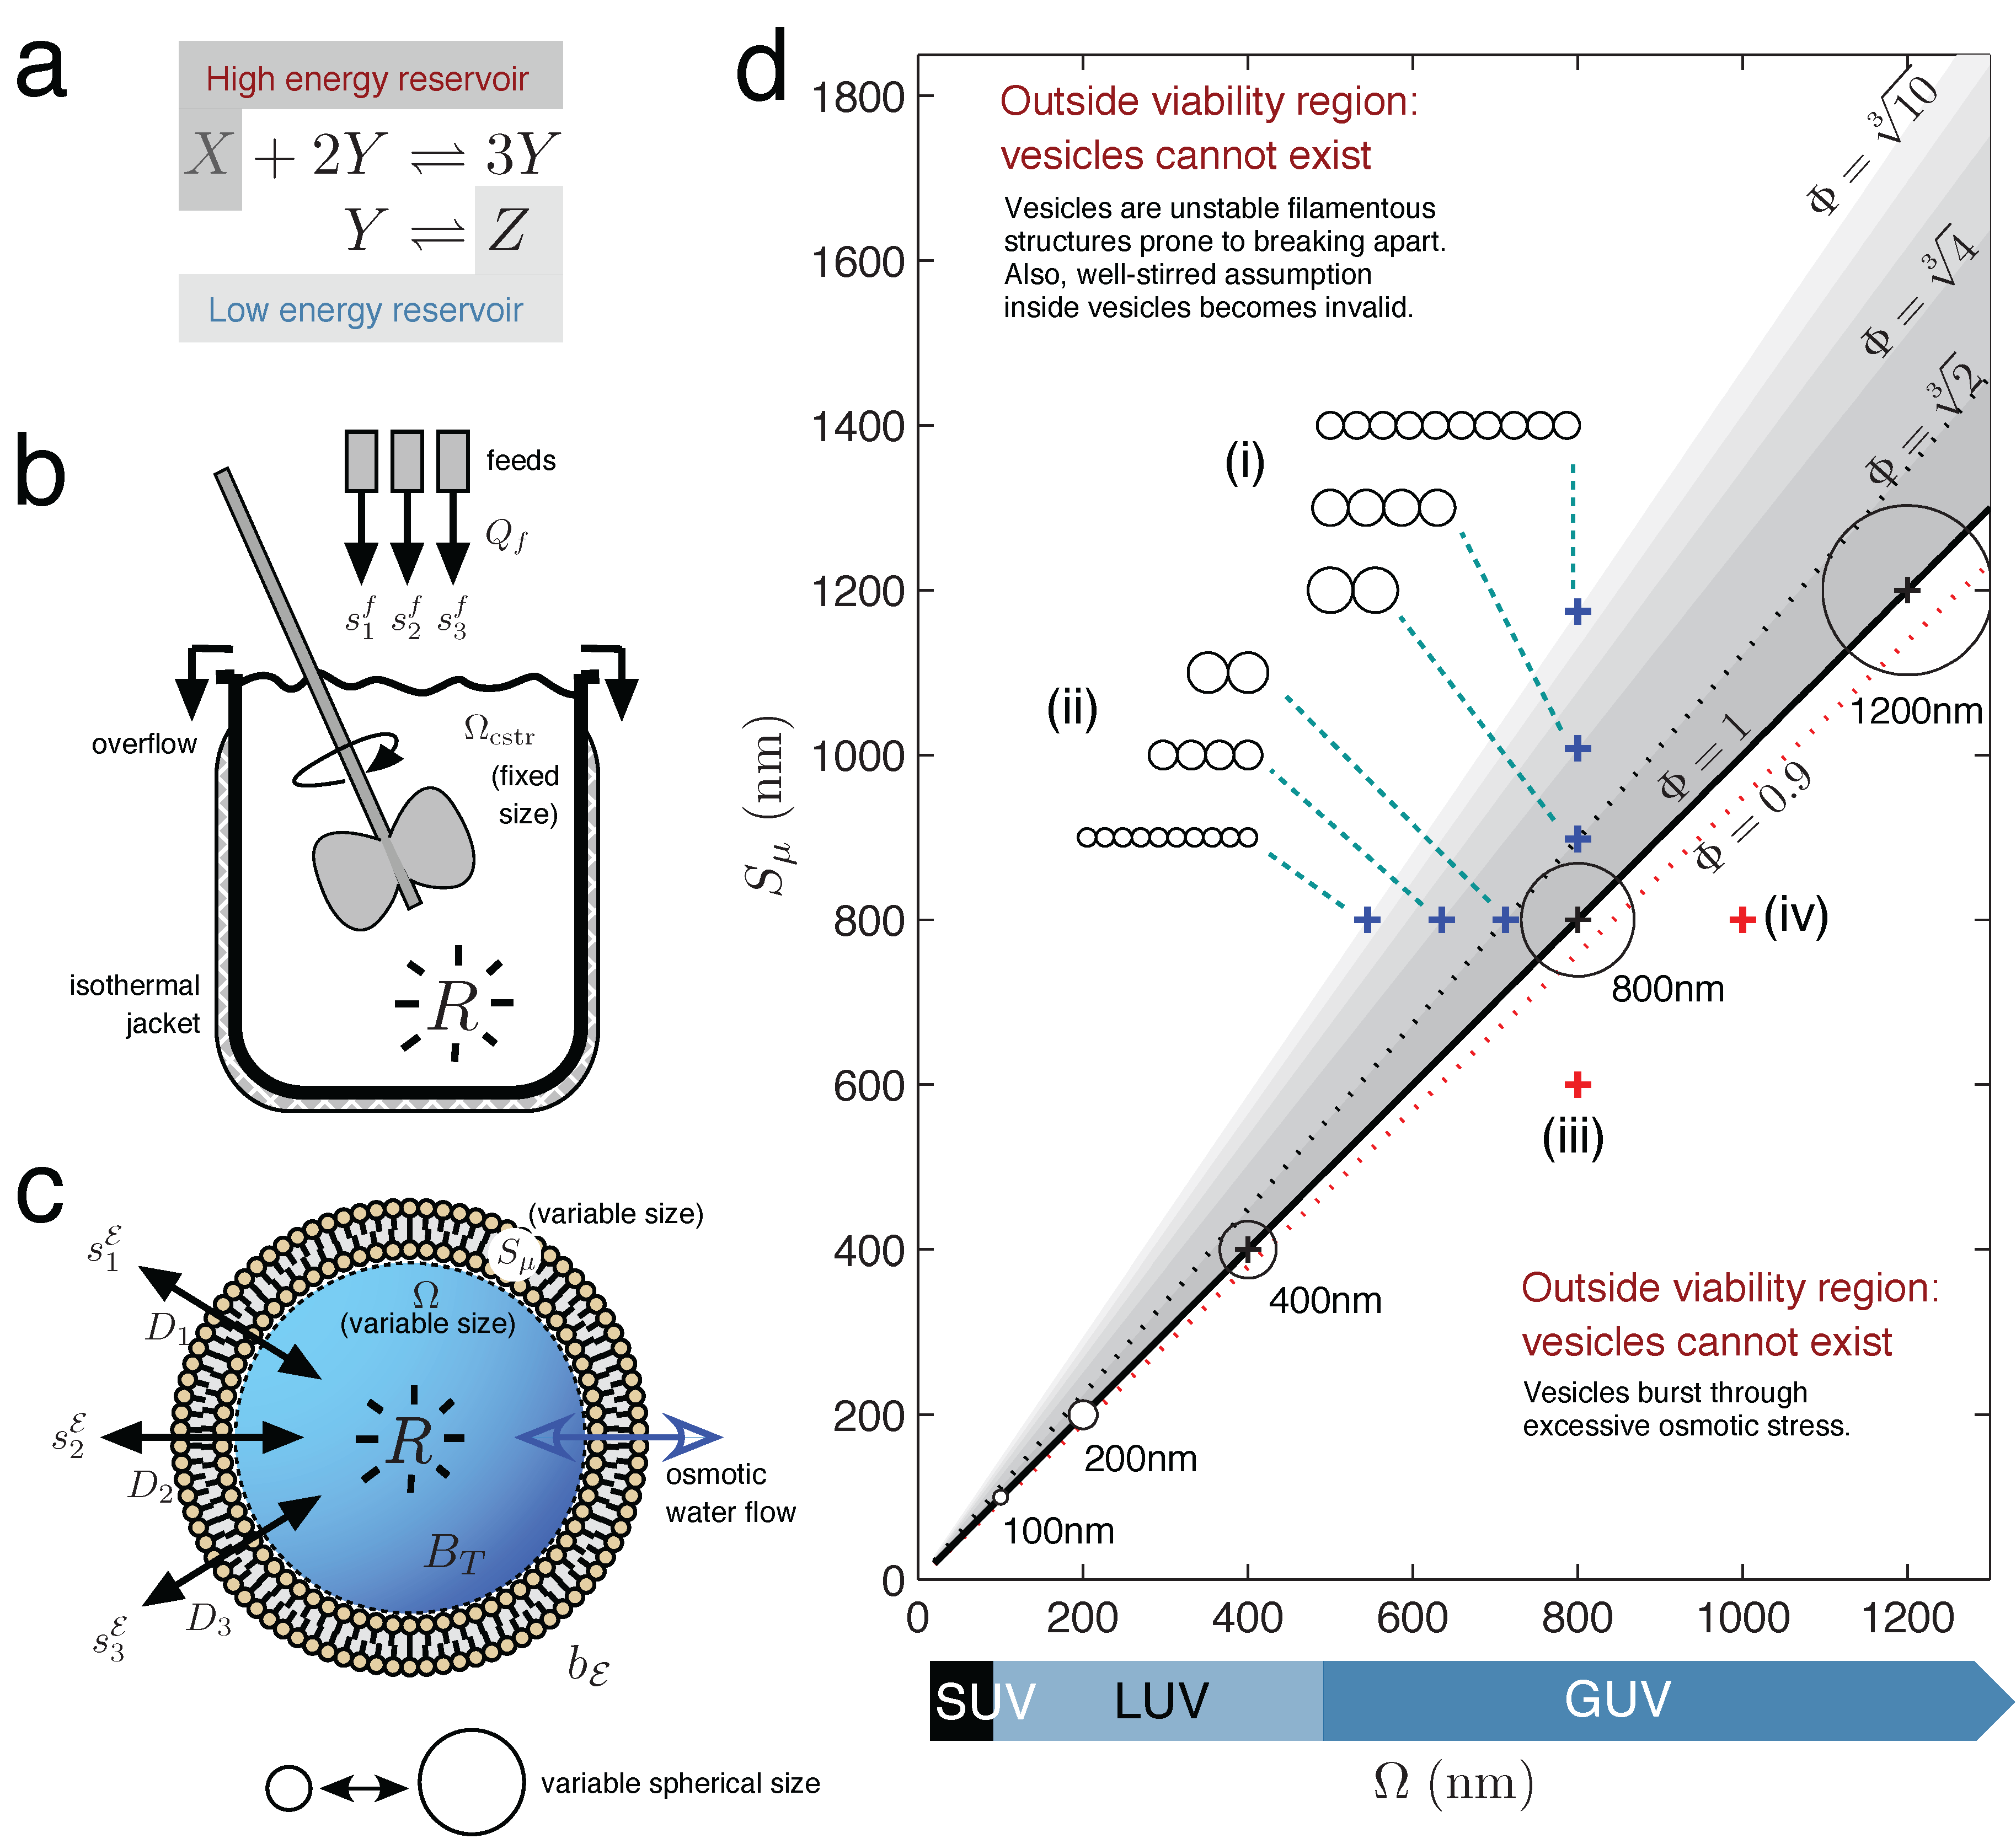
Chemical Reactor Models. (a) A chemical reaction held far-from-equilibrium by use of two constant concentration reservoirs (reservoir conditions). (b) Continuous-flow stirred tank reactor (CSTR) model with non-limiting outflow, constant solvent volume and constant reaction temperature. (c) Unilamellar lipid vesicle, with variable internal solvent volume determined by osmotic water flow equalizing the total solute concentration difference across the semi-permeable membrane. (d) Lipid vesicle morphology space, with vesicle viability space drawn as the sub-region of all possible morphologies (grayscale region). Axes express vesicle volume Ω and surface area Sµ as the nm diameter of a sphere having volume Ω or surface area Sµ, respectively. Spherical vesicles (Φ = 1) are located when Ω (in nm)= Sµ (in nm). Circles represent vesicle cross-sections, drawn to scale (8.5% of the axes’ scale). Blue crosses indicate how the morphology of a spherical d = 800 nm giant unilamellar vesicle (GUV) changes, when (i) gaining surface or (ii) losing volume. Both conditions bring the vesicle toward more filamentous or prolate states. Prolate states are depicted as strings of smaller spherical vesicles, only to give an idea of the volume and surface ratio at the {Ω, Sµ} point; the meaning is not that the vesicle has necessarily divided into identical daughters at this stage. Red crosses indicate that the spherical d = 800 nm vesicle will burst by (iii) losing too much surface or, conversely, (iv) gaining too much volume.
Figure 1.
Chemical Reactor Models. (a) A chemical reaction held far-from-equilibrium by use of two constant concentration reservoirs (reservoir conditions). (b) Continuous-flow stirred tank reactor (CSTR) model with non-limiting outflow, constant solvent volume and constant reaction temperature. (c) Unilamellar lipid vesicle, with variable internal solvent volume determined by osmotic water flow equalizing the total solute concentration difference across the semi-permeable membrane. (d) Lipid vesicle morphology space, with vesicle viability space drawn as the sub-region of all possible morphologies (grayscale region). Axes express vesicle volume Ω and surface area Sµ as the nm diameter of a sphere having volume Ω or surface area Sµ, respectively. Spherical vesicles (Φ = 1) are located when Ω (in nm)= Sµ (in nm). Circles represent vesicle cross-sections, drawn to scale (8.5% of the axes’ scale). Blue crosses indicate how the morphology of a spherical d = 800 nm giant unilamellar vesicle (GUV) changes, when (i) gaining surface or (ii) losing volume. Both conditions bring the vesicle toward more filamentous or prolate states. Prolate states are depicted as strings of smaller spherical vesicles, only to give an idea of the volume and surface ratio at the {Ω, Sµ} point; the meaning is not that the vesicle has necessarily divided into identical daughters at this stage. Red crosses indicate that the spherical d = 800 nm vesicle will burst by (iii) losing too much surface or, conversely, (iv) gaining too much volume.
![]()
However, actually constructing a chemical reactor that implements the reservoir conditions outlined above seems problematic. In order to maintain the chemical system in an FFE state indefinitely, the constant resource-waste concentration gradient would have to exist in an infinite reservoir, and an infinite reservoir would not allow the concentrations of the intermediate species to be measured. In terms of an actual chemical apparatus that is routinely used to carry out sustained FFE chemical reactions, the continuous-flow stirred tank reactor (CSTR) stands as one of the simplest devices [
29].
Figure 1b shows the schematic of one of several CSTR designs available, a design that features a constant reaction volume due to a non-limited overflow of reactor effluent. A mechanical stirrer keeps the solution well-mixed, despite its potentially large volume. A system of reactions taking place in this type of CSTR, depending on the specific reaction kinetics involved, has a dimension up to the total number of species
N [
30]. If the reactor is isothermal, the dynamic concentration behavior of the
i-th solute species is described by:
where
= {
s1, · · · , sN} is the vector of all species concentrations inside the reactor, function
contains all reaction MAK terms producing or consuming the
i-th species,
is the constant concentration of species
i in the reactor feed pipe and
θ is the mean residence time of the CSTR. The mean residence time is defined as the ratio of reactor solvent volume (constant) divided by the flow rate of solvent into the reactor
θ = Ω
CSTR/Qf and represents that solutes are “washed out” faster from a reactor having a higher inflow rate or a smaller volume.
The two previous scenarios may be described as “bulk conditions” for chemical reactions, whereby a relatively large homogeneous solution exists for chemical transformations to take place. As stated, in this work, we begin to investigate the behavioral possibilities that minimal chemical reaction systems can have inside variable-volume unilamellar lipid vesicle reactors.
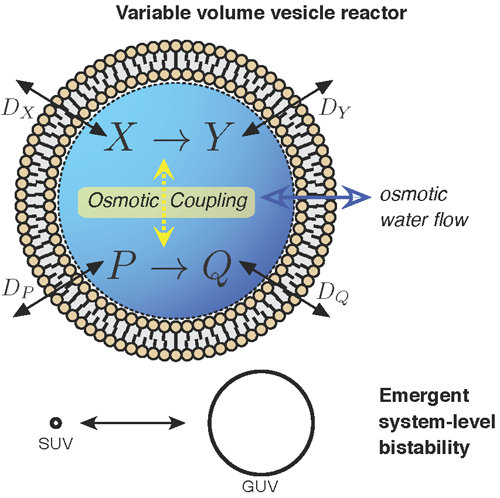
Figure 1c shows the full schematic of the vesicle reactor model, which is drawn more simply in the following figures as a clear sphere with a blue arrow crossing the membrane, depicting the important feature of osmotic water flow.
A lipid vesicle departs from bulk conditions as it partitions a solution into at least two heterogeneous phases (inside and outside), introducing structure into a chemical reaction medium [
31]. As mentioned, the aqueous phase inside a lipid vesicle might provide a unique space for chemical reactions because of its variable solvent volume, following as a consequence of osmotic water flow through the surrounding semi-permeable lipid bilayer membrane. This osmotic flow quickly equilibrates the total solute concentration gradient existing between the vesicle interior and exterior, with water molecules moving across the membrane in the opposite direction to the net solute gradient. The bilayer also implies finite passive diffusion rates for permeating solutes.
To elaborate the details, the vesicle reactor is a system with a dimension equal to the total number of solute species
N [
32]. We assume that the aqueous volume of the vesicle changes instantaneously, such that total internal and external solute concentrations remain always equal (isotonic condition). Therefore, this volume is given directly by the following function:
where Ω is the scaled volume Ω =
NA (Avogadro’s constant multiplied by the liter volume of the vesicle),
BT > 0 is the number of non-reacting impermeable buffer molecules trapped inside the vesicle [
33],
Cε is the total external concentration, that is the sum of all the external solute concentrations
, and
is the total internal concentration of chemically-reacting solute species inside the vesicle. The assumption of instantaneous vesicle volume change is based on the observation that water permeates a fatty acid membrane on a time scale that is orders of magnitude faster than the passive diffusion of solutes [
34] and simplifies the model, because it does not require treating Ω as an extra state variable.
For the surface area kinetics of our vesicle reactor model, as a first approximation, we assume that the membrane surface area immediately follows changes in vesicle volume, maintaining a spherical shape,
i.e.:
where constant
. Under these conditions, an increase in internal vesicle volume is considered to be instantly accompanied by lipids associating with the bilayer from the surrounding solution, flip-flopping and enlarging the surface of the vesicle, with the reverse process happening for a decrease in internal volume. This simplification avoids having to explicitly specify lipid exchange kinetics for the membrane, which can be complex [
9] and would further introduce extra state variables into the model.
Initially, one may consider the vesicle model under high buffer conditions, which is the limit case of the external buffer concentration
bε being very high with respect to the possible range of external and internal solute concentrations (
bε and
). Under such conditions, there is little net water movement across the membrane, and the vesicle volume is approximately constant at
. Assuming well-stirred kinetics within the vesicle water pool [
35], the dynamic behavior of the concentration of the
i-th solute species inside the vesicle would be described by:
where
is the constant membrane surface area corresponding to the approximately constant volume
and
Di is the diffusion constant for species
si calculated as:
where diffusion constants in this work are specified more meaningfully as multipliers (
) to the diffusion constant that ribose has through an oleic acid membrane
Dribose = 2
.65
× 10
8 dm
2 s
−1 mol
−1 [
11], and the vesicle bilayer is considered to have constant thickness
λ = 4
× 10
−8 dm. Fick’s law provides the basis for the membrane diffusion term.
It is useful to review the high buffer case of the vesicle reactor, since the reservoir and CSTR reaction scenarios described previously can both be interpreted as theoretical limit cases of it. In other words, the vesicle reactor model is the general case of the reaction scenarios shown on
Figure 1. Reservoir conditions for an internal reaction in the vesicle model in a high buffer regime can be ensured if the diffusion constants for resource and waste species are sufficiently high, so that any variation in internal concentration is quickly equilibrated back to the respective constant external concentration, and conversely, the diffusion constants for the intermediate species are set to zero. Likewise, CSTR conditions are reproduced when all species have an identical diffusion constant
D, and external vesicle solute concentrations are set to the CSTR feed concentrations
[
36]. Then, the CSTR mean residence time is related to the vesicle reactor parameters by:
Nevertheless, in this work, we precisely aim to relax the high buffer assumption and study chemical behavior in the vesicle reactor under low buffer conditions, when the concentrations of diffusing solutes are in the same order of magnitude as the concentration of external buffer. This moves the model well away from reservoir and CSTR conditions, providing a very different context for internal reactions. In low buffer conditions, a significant net movement of water across the vesicle membrane must be accounted for, and hence, the aqueous volume inside the vesicle must be considered variable. This variable volume introduces several non-linear terms into the solute concentration derivatives, as can be seen below, providing a rich substrate for emergent chemical behavior in the vesicle reactor. The concentration derivatives specifically change to:
where
Sµ is now variable and given by Equation (3). The above expression is formed by substituting Equation (2) into Equation (4) and then adding the dilution term [
14] to properly account for changing volume in a concentration ODE. Considering that vesicle volume is a function of internal solute concentrations Equation (2), the dilution term is given by:
which is derived and explained in detail in the
Supplementary Material. On the subject of emergent chemical behavior, one important observation following from the fact that each derivative is now a function of all solute concentrations
is that chemically-independent reaction sets sharing the vesicle volume will become “osmotically” coupled. This aspect is explored in detail later.
To narrow its scope, this work will just analyze the fixed points of the ODE set Equation (7) and only for very simple reaction networks encapsulated inside the vesicle reactor. A fixed point is a special set of internal solute concentrations at which all solutes have no further change in their concentrations, i.e., dsj /dt = 0, j = 1, . . . , N. In this state, the vesicle volume and surface are stationary.
In particular, in these initial stages, we will focus on the emergence of bistability in the vesicle reactor model, a dynamical feature deducible directly from the number and stability of the fixed points present (i.e., two asymptotically stable points separated by an unstable saddle point). We also expect that more complicated dynamical regimes could also be present in the model, like multi-stability or global phase space features, such as limit cycles, giving rise to sustained oscillations. However, the investigation of these regimes will be deferred to later work: for the time being, the “emergent chemical behavior” referred to in the title will be restricted to bistability.
The following two subsections describe a graphical method used for seeing, in a qualitative way, what fixed point solutions to Equation Set (7) can exist. These subsections introduce the concepts of vesicle morphology space, bifurcation curve and vesicle viability space, which are necessary to properly understand the results presented in
Section 3, and the Discussion.
2.1. Solution of Vesicle Reactor Model: Graphical Method
In trying to solve fixed points of the variable volume vesicle reactor model ODE Equations (7), it can be observed that the dilution terms Equation (8) can be usefully disregarded, since the vesicle volume is not changing at steady state (dΩ/dt = 0). However, whilst this provides a significant simplification, the Sµ term in Equation (3) still makes the remaining equations difficult to solve for zeros, even numerically.
We proceed by relaxing the need for exact fixed point solutions to Equation (7). Instead, we pursue a graphical approach that pictorially shows how many fixed point solutions will exist to the equation set (and the approximate values of those fixed points), given a certain parameter regime. This graphical approach uses the following algorithm:
Step 1: The fixed points for a variable volume vesicle reactor with constant surface
are solved. With constant surface, the concentration derivatives at fixed points simplify to a set of multivariate polynomials in the species concentrations:
This equation set is solved numerically by a polynomial homotopy continuation procedure ([
37], see the Methods section). There may be zero or many fixed points present. Indeed, one interesting aspect is that its not obvious from inspection of Equation (9) what the limit number of fixed points will be, even for a simple reaction system inside the vesicle reactor.
Step 2: The solute concentrations at each fixed point are converted to the corresponding fixed point vesicle volume Ω
∗, using Equation (2). Then, all of the fixed point volumes are plotted on a two-dimensional graph, which we call the vesicle morphology space, where the x-axis represents vesicle volume and the y-axis represents vesicle surface (
Figure 1d). The fixed point volumes are plotted along horizontal line
y =
in this space.
Step 3: Vesicle surface is incremented, and the process repeated from Step 1.
The above algorithm effectively assesses a series of fixed surface vesicles to build up “branches” of fixed point solutions, which run throughout the vesicle morphology space. We will call this the “bifurcation curve” throughout the text, since it tracks the existence and locations of fixed point locations of Equation Set (9), under variation of control parameter Sµ.
Crucially, the branches of the bifurcation curve define different (not necessarily spherical) vesicle shapes and sizes {Ω, Sµ} that allow the encapsulated reaction network to reach steady state, for a given model parameter set. The fixed point solutions to the full reactor model Equation (7) are precisely where the branches of the bifurcation curve intersect the line, giving spherical vesicle morphologies (Φ = 1 line; see the next subsection). Local stabilities of fixed points can also be calculated at Step 1. However, at best, these are “quasi-stabilities” or predictors of stability in the full model, because the dilution term and the fact that surface area is actually variable are both not taken into account.
Now that an approximate method to find the fixed points of the full vesicle model Equation (7) has been established, the second problem involves finding working parameter regimes, in the high-dimensional parameter space of the model, which will give three crossings of the spherical morphologies line (i.e., potentially corresponding to bistability in the full model). The Methods section at the end of the article defines our approach to this non-trivial “needle and haystack” issue.
2.2. Vesicle Viability Space within Vesicle Morphology Space
Figure 1d draws the vesicle morphology space for unilamellar vesicles ranging from small unilamellar vesicles (SUV) to giant unilamellar vesicles (GUV) and additionally draws the vesicle viability space sub-region (colored grey). The vesicle viability sub-region arises because lipid vesicles are soft supra-molecular structures held together by entirely non-covalent forces and, as such, can only provide an internal aqueous domain for a restricted set of volume and surface area combinations. The vesicle viability region is calculated from simple geometric considerations, by defining a dimensionless ratio called reduced surface:
When Φ = 1, a unilamellar vesicle is spherical (the surface area wraps the volume as a sphere), whereas Φ
> 1 represents a deflated vesicle (surplus surface area) and Φ < 1 a vesicle in osmotic tension. Vesicles cannot venture too far into the osmotic tension region before bursting (Φ ≈ 0.9; see [
11]), which provides a hard lower limit on valid vesicle morphologies. At the other end of the Φ scale, vesicles cannot become excessively filamentous structures before becoming prone to division into smaller structures. The upper Φ limit for vesicle morphologies is less well defined that the lower Φ limit and is better thought of as an increasing probability to divide rather than an absolute cut-off (hence the fading grey scale bars in
Figure 1d. Lines for
indicate vesicles becoming more filamentous, not any absolute divide limit).
Even if vesicle viability space is not directly relevant to the vesicle reactor model Equation (7) in this present study (since the vesicle maintains a valid spherical Φ = 1 state at all times), it is nevertheless a concept relevant in the wider implications of this work (see the Discussion).
3. Results
In this section, we perform three case studies that assess the behavior of basic chemical reaction sets inside the variable volume vesicle reactor model. The first case study takes two reaction mechanisms, which are bistable in bulk conditions, and illustrates how encapsulation inside a vesicle water pool may trigger the disappearance of this property of bistability. The second and third case studies support the opposite scenario, whereby very simple reactions, which are not bistable in bulk, show emergent bistability when encapsulated inside the variable volume reaction environment of the vesicle model. Case Studies 2 and 3 convey the main message of this paper.
3.1. Case Study 1: Compartment as a Bottleneck to the Internal Reaction System
A lipid membrane undoubtedly provides a barrier to the free movement of solutes in and out of the vesicle interior. A common conception is that this barrier has a suffocating influence on an internal reaction by limiting the supply of nutrients and preventing the escape of waste products, such that the interesting chemical behavior originally present in the reaction under bulk conditions may degenerate [
25]. This case study demonstrates that degeneration is, indeed, a real possibility. Two previously studied minimal reaction systems, which are bistable in reservoir conditions, are encapsulated in the vesicle reactor model and assessed for stability.
Firstly, the Schlögl model [
38,
39] was encapsulated. In reservoir conditions and permitting reversible tri-molecular reactions, this is the simplest chemical model to show bistability. It is one-dimensional, since there are just two reactions involving one intermediate species
Y :
One of the many possible parameter regimes leading to bistability in reservoir conditions is given by
= {6
.47
×10
−4, 6
.32
×10
−4,5
.25
×10
4,2
.85
×10
−3,9
.15
×10
−2,7
.15
×10
−3}, where concentrations are in molar, first order reaction rate constants in s
−1 and third order in M
−2s
−1. The following molar concentrations represent the low stable state, the unstable state and the high stable state of species
Y respectively:
= {5
.03
×10
−5, 4
.01
×10
−3,7
.86
×10
−3}.
The reaction system was incorporated inside the constant surface vesicle reactor model by setting the external solute concentrations to the original reservoir concentrations (xε = x and zε = z) and using the same reaction rate parameters. The remaining parameters were assigned at random in 5000 different combinations, in ranges given in the Methods section. The vesicle surface area was fixed at that of a 400-nm diameter sphere.
The number of fixed points present in the constant surface reactor was taken as a heuristic for the number that could exist in the full variable volume (and variable surface) vesicle reactor. If the reaction gave three fixed points, then three individual bifurcation branches passed through line in the vesicle morphology space at some stage, and these branches had the potential of being manipulated to cross through the Φ = 1 line and vesicle viability region.
Of the 5000 parameter set tested under constant surface area, 82% (4098) gave a single fixed point, 15.7% (785) gave two fixed points and 2.3% (117) no fixed points. No parameter regimes giving three fixed points (a bifurcation curve with three branches) were found in this sparse Monte-Carlo parameter sampling, and therefore, this dynamical feature of the reaction appears to have degenerated.
Secondly, the bistable Wilhelm model [
40] of four irreversible reactions was encapsulated in the vesicle model
Under reservoir conditions, one possible parameter regime giving bistability is {x, w, k1, k2, k3, k4}= {1.17×10⁻³, any, 5.86×10², 9.26×10², 5.75×10², 9.98×10⁻²} with units the same as before and second order reaction rates in M−1 s−1. The following three solution pairs (in molar concentrations) for fixed points of the intermediate species are obtained: = {0, 0}, = {1.20×10⁻⁴, 1.94×10⁻⁵}, = {1.07×10⁻³, 1.55×10⁻³}.
When the reaction system was incorporated inside the constant surface vesicle reactor model, of the 5000 random parameter sets sampled, 74.3% (3716) gave one fixed point, 20.9% (1045) gave two fixed points, 3.8% (192) no fixed points and <1% (47) gave three fixed points. Therefore, in this case, a very small proportion of the parameter sets showed potential to exhibit bistability in the full vesicle model, but the majority did not.
In summary, these results seem to demonstrate that only a very small proportion of parameter space is able to create bistability in the full vesicle model and that encapsulated reaction schemes are likely to degenerate to a single fixed point. However, this hypothesis cannot be easily confirmed, since a systematic exploration of parameter space is virtually impossible due to the curse of dimensionality. Thus, it could be argued that the random Monte-Carlo sampling of such a high dimensional space was far too sparse to be truly representative of the fixed point motifs possible for each of the switch reactions above.
In contrast, the following two case studies provide counterexamples that support the opposite scenario, in which interesting emergent chemistry may develop as a consequence of the volume-changing aqueous interior of a vesicle.
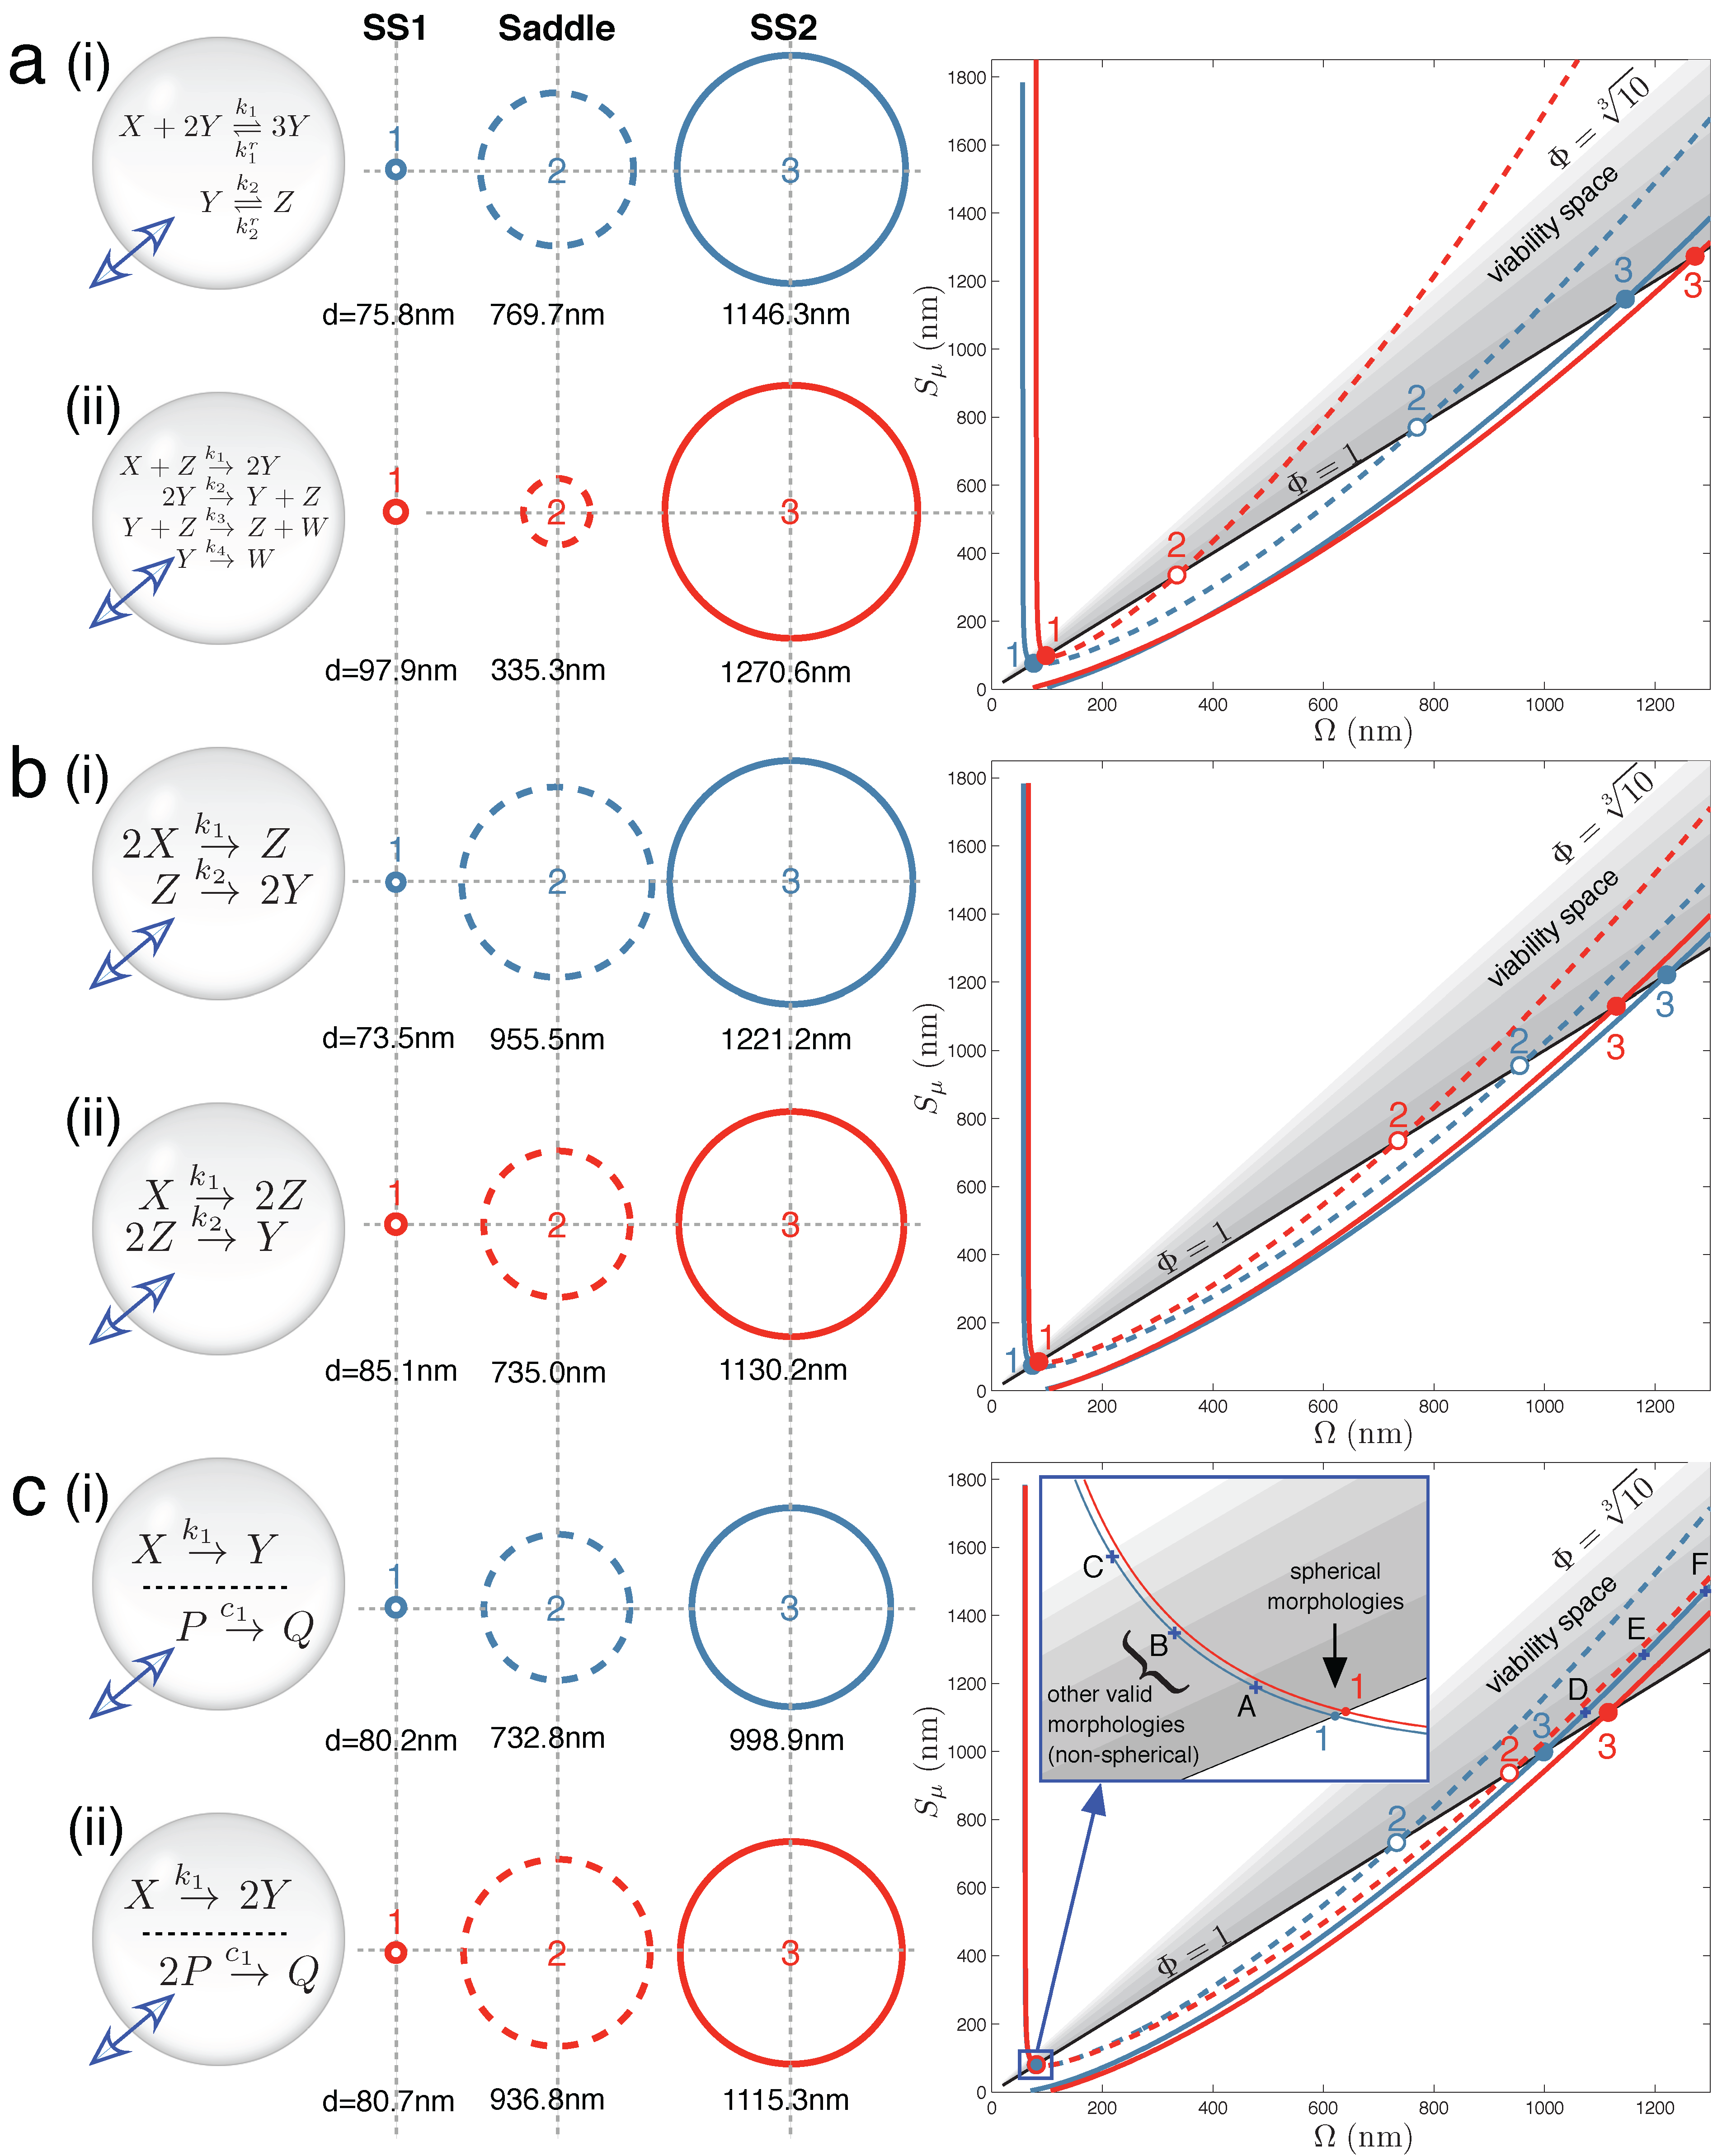
Figure 2 displays the main results for Case Studies 1–3. It demonstrates that under the correct parameter regimes, each of the two reaction schemes discussed in each case study can show bistability within the full vesicle model. Vesicle morphology space and bifurcation curves are drawn for each reaction scheme. Even the Schlögl and Wilhelm reaction systems of the present case study can exhibit bistability for some parameters (
Figure 2a(i) and 2a(ii), respectively).
Figure 3 accompanies
Figure 2, to make clear the concentration values of all internal solutes at stable steady states SS1 and SS2 for each of the six schemes.
3.2. Case Study 2: Compartment as Enabling New Steady States for Single Reaction Sets
In this case study, two very simple reaction sequences are demonstrated to be capable of bistability under specific parameter regimes of the vesicle reactor model (the Methods section details how these parameter schemes were obtained). Conversely, these reaction sequences can be easily proven to lack bistability in reservoir conditions and in CSTR conditions, under any parameter regime (see
Supplementary Material). Irreversible reaction sequences were chosen intentionally for their fairly straightforward steady-state calculations in CSTR; reactions involving feedbacks are typically very difficult or impossible to solve analytically in CSTR flow conditions.
Figure 2.
Main results: vesicle bistability in Case Studies 1–3. The reaction sets of (
a) Case Study 1, (
b) Case Study 2 and (
c) Case Study 3 can yield bistability in the vesicle model under suitable parameter conditions (given in
Supplementary Material). Circles (
middle) depict spherical vesicle shapes (drawn to scale) at which steady states can occur, corresponding to where stable branches (solid lines) and unstable branches (dashed lines) on the bifurcation diagrams (
right) cross the the Φ = 1 line. Labels A–F on the bifurcation diagram (c) refer to non-spherical morphologies drawn in
Figure S2 of the Supplementary Material.
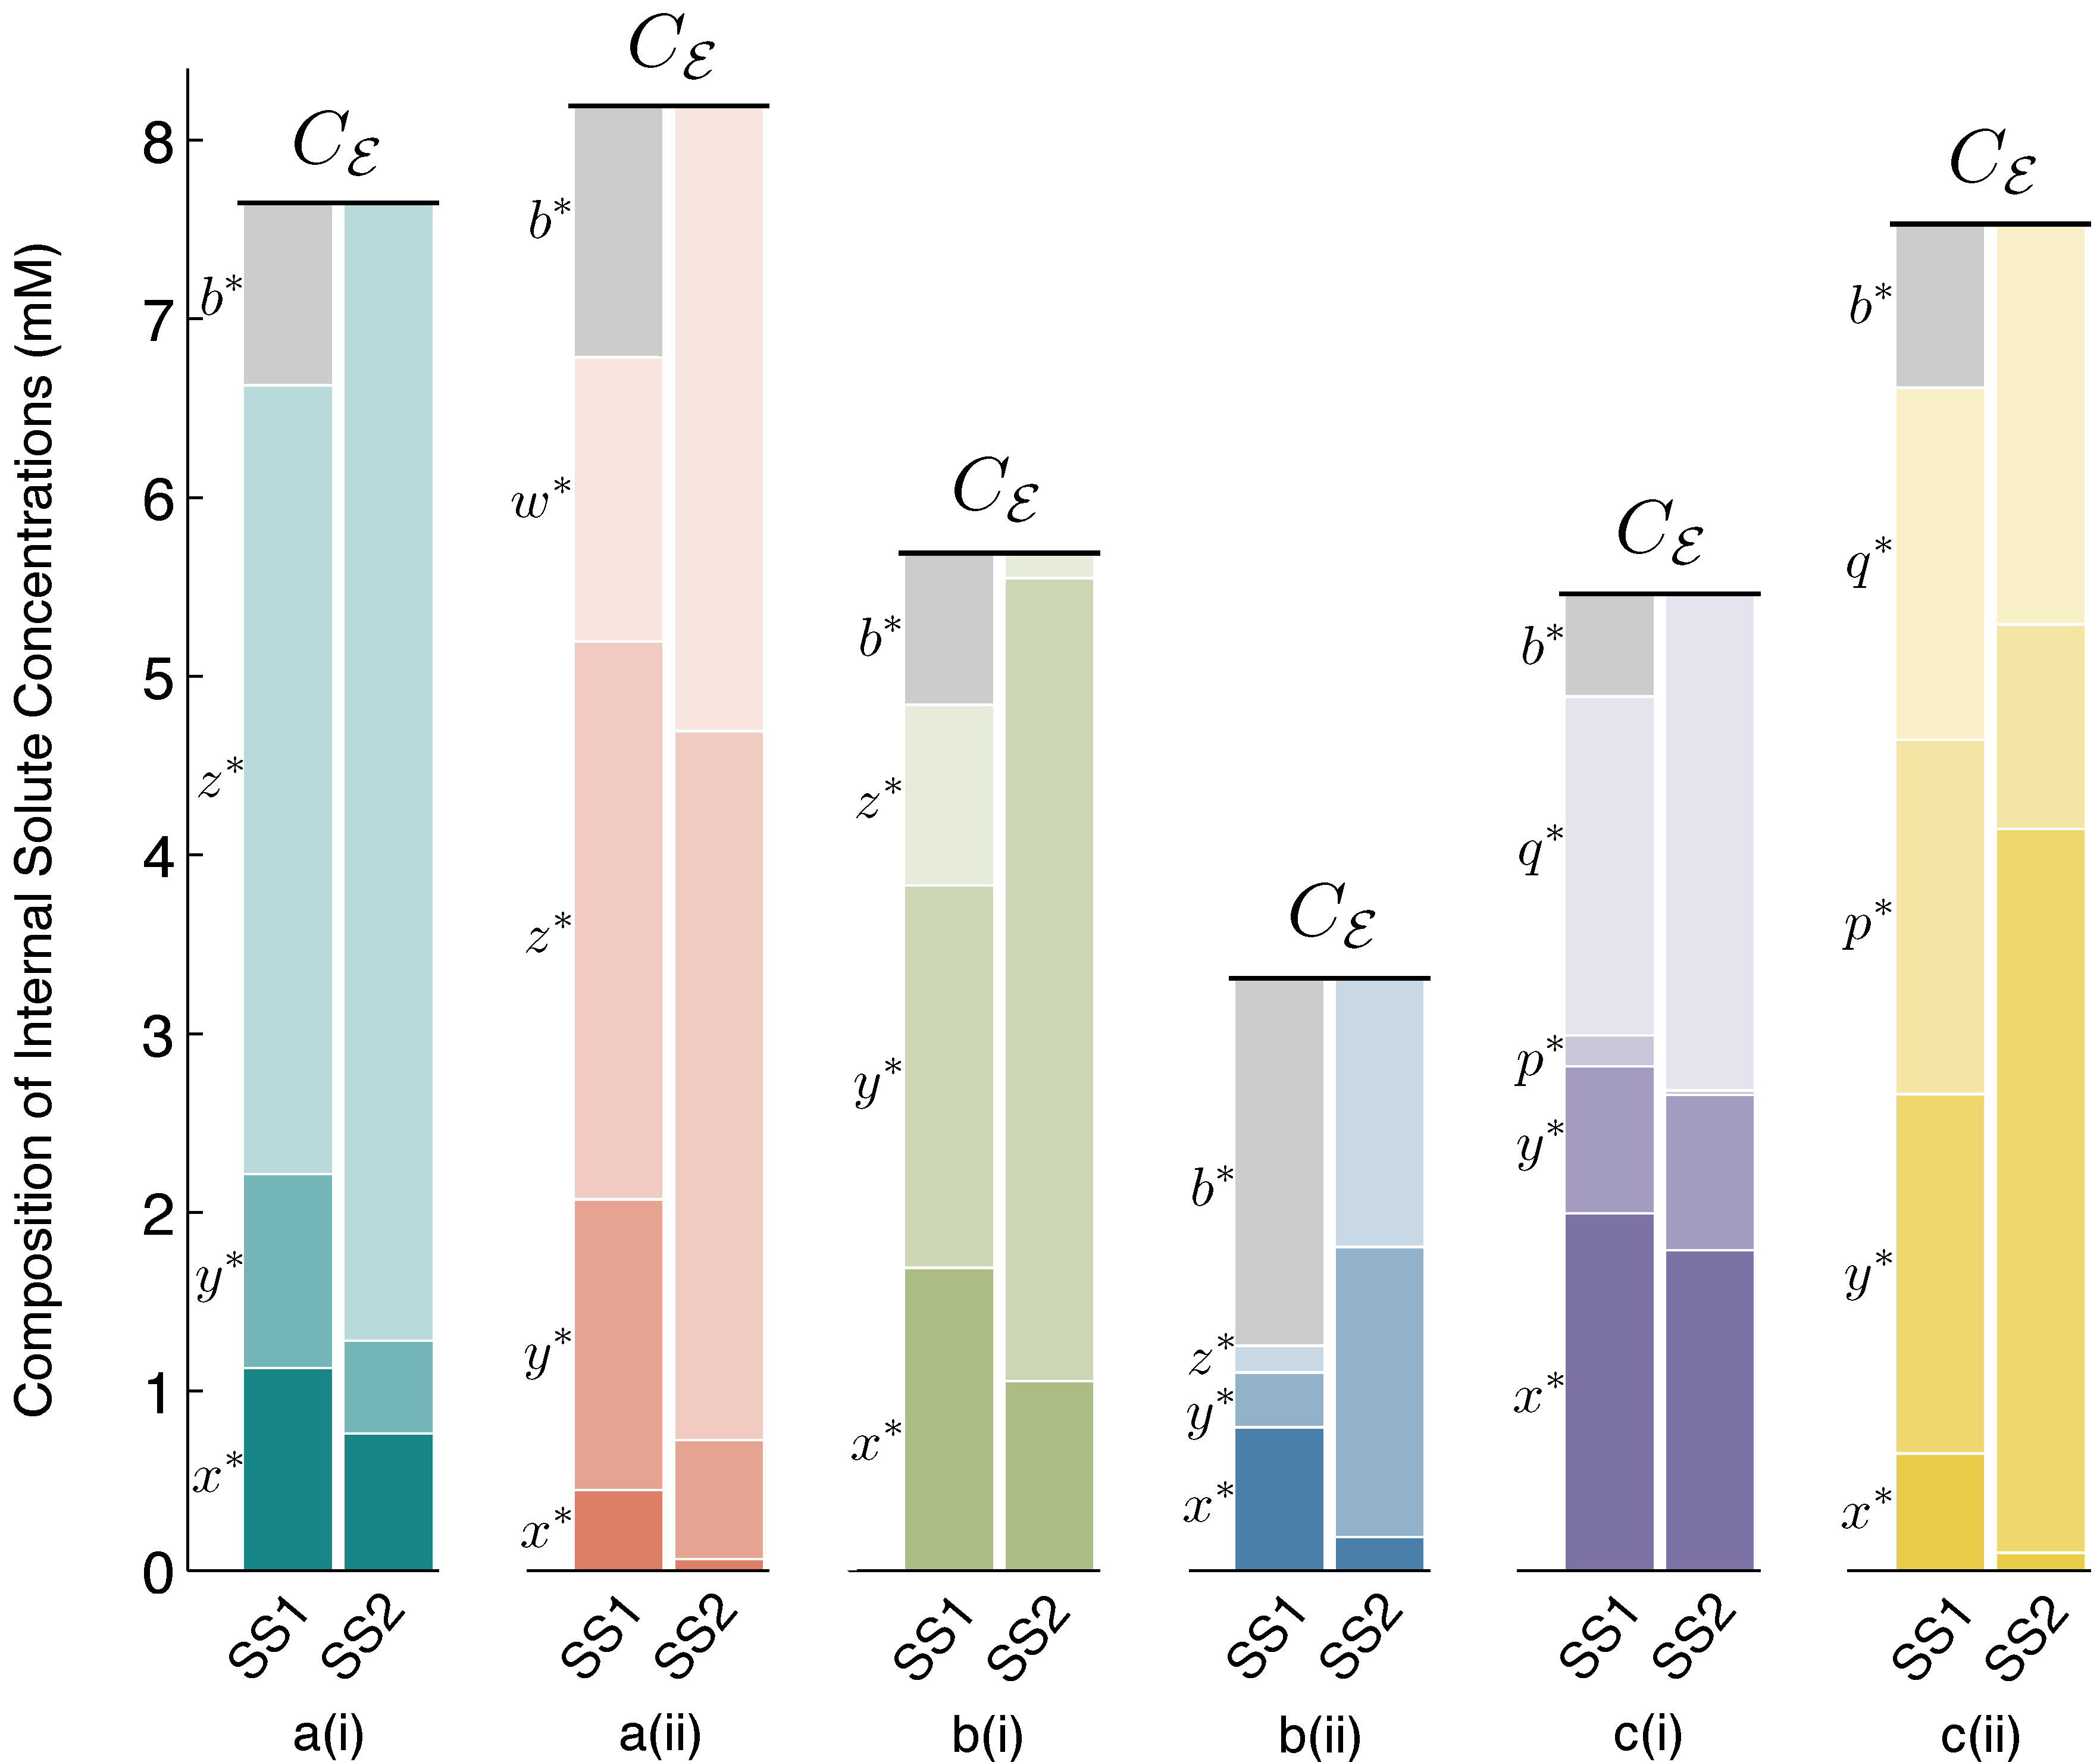
Figure 3.
Steady State 1 (SS1) and SS2 internal solute concentrations. Solute concentrations inside the vesicle reactor, at spherical steady states SS1 and SS2, for each reaction scheme reported in
Figure 2. Comparing SS1 and SS2 for each scheme, it can be observed that there are quantifiable differences in solute concentrations between steady states, but these differences are fairly small. Owing to the osmotic water balance, the total concentration of solutes inside the vesicle (height of the stacked bars) is always constrained to be equal to the total external solute concentration of the environment,
Cε. Thus, in the vesicle reactor model, the main feature distinguishing steady states is vesicle size (see
Section 4.2 for details). Symbol
b∗denotes the steady-state concentration of the
BTbuffer molecules trapped inside the vesicle. At SS2,
b∗→ 0, due to large vesicle sizes, and the diffusing solutes constitute the majority of total internal concentration. The
Supplementary Material supplies data supporting the figure.
![]()
Figure 2b(i) shows one instance of the following second order-first order reaction sequence:
in which bistability was found in the context of the vesicle model. Likewise,
Figure 2b(ii) shows one instance of the following first order-second order reaction sequence:
that also demonstrates bistability. In each case, three crossings of vesicle viability space are obtained by the bifurcation curve. In the full vesicle model, this translates into a stable spherical state at a small SUV vesicle size (Ω and
Sµ ≈ 80 nm diameter) and another stable state at a much larger GUV vesicle size (Ω and
Sµ ≈ 1200 nm diameter). To re-iterate, the stable steady state means that the vesicle sphere is providing the correct diffusion surface and inner volume for all of the solute concentrations in the reaction network to be stationary, and at the same time, the total concentration of solutes and buffer inside the vesicle is equal to the total external concentration; and so, there is no net movement of water across the bilayer membrane. The steady-state sizes are separated by an unstable saddle point at an intermediate vesicle size.
3.3. Case Study 3: Compartment as Osmotically Coupling Two Chemically-Independent Reaction Sets
As commented briefly before, one interesting result from the vesicle reactor time evolution Equation (7) is that, in low buffer conditions, two (or more) chemically-independent reaction sets that share the variable vesicle volume will become indirectly coupled. Although each of the reaction sets have an exclusive set of chemical species, the sets still indirectly influence each other by changing the solvent volume in which all reactions are taking place. To our knowledge, this possibility, which could be coined “osmotic coupling”, has been totally neglected in the protocell literature until now. The often followed route has been to assume a single chemically-connected reaction system to constitute a vesicle proto-metabolism. Nevertheless, osmotic coupling appears as a relevant principle, considering that (i) lipid vesicles are extremely sensitive to osmotic pressure [
41,
42], like modern cells still are [
43,
44], and that (ii) in an origins of life scenario, they would constitute micro-environments to carry out “natural experiments” of “combinatorial chemistry” [
1] (p. 217), self-assembling in solutions containing many reaction systems performing different and sometimes unrelated chemical transformations.
Figure 2c(i) demonstrates that vesicle bistability can emerge quite unexpectedly in our vesicle reactor model from two chemically-independent unimolecular reactions:
when these reactions share the internal volume of the vesicle.
Figure 4 further explores this interesting case, showing the time dynamics of switching between SS1 and SS2, prompted by extra molecules being injected into the vesicle reactor by a simulated syringe.
Likewise, a unimolecular reaction with two identical products and a chemically-independent bi-molecular reaction with a single product:
also display bistability under certain parameter conditions (
Figure 2c(ii)).
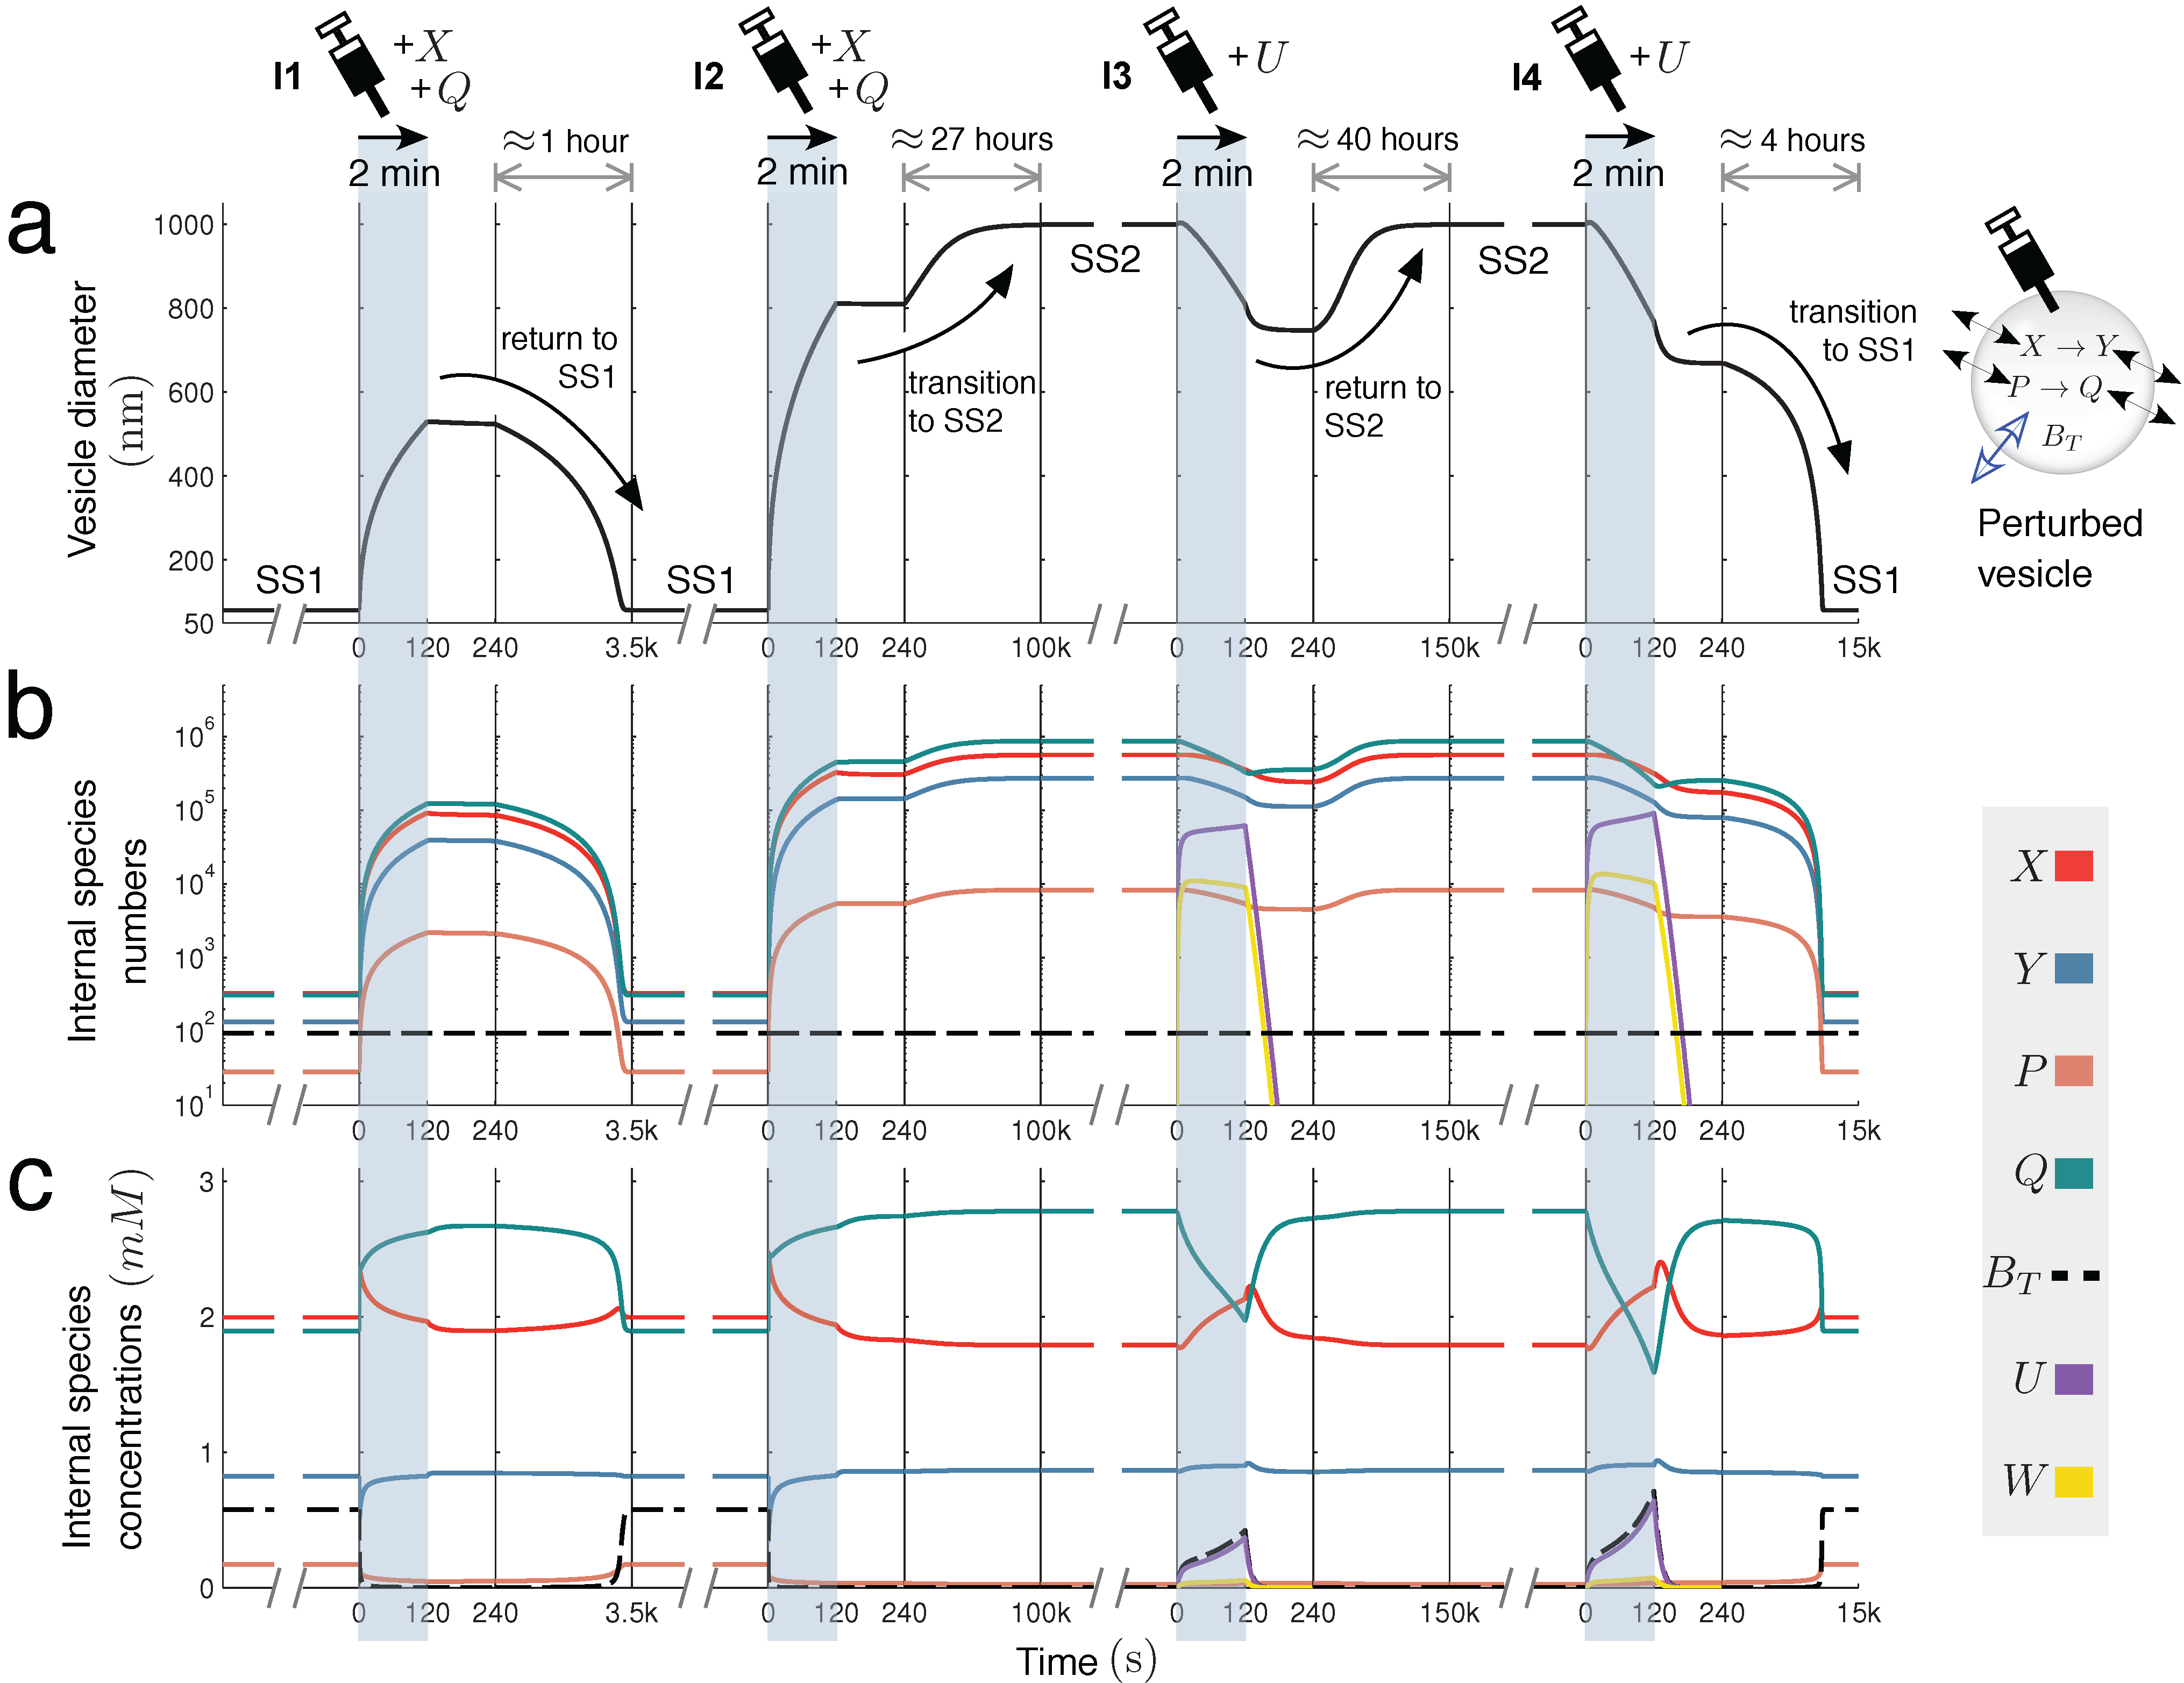
Figure 4.
Switching dynamics: bistability in two unimolecular reactions. Encapsulating two unimolecular reactions
X → Y and
P → Q in the variable-volume vesicle reactor model gives a bistable system under the correct parameter regime (
Figure 2c(i)). Below, switching dynamics between steady states SS1 and SS2 are demonstrated by injecting molecules into the reactor by a simulated syringe. Following four different two-minute injections of molecules, changes in (
a) spherical vesicle diameter, (
b) vesicle internal species numbers and (
c) vesicle internal species concentrations are monitored. Injection
I1 releases both
X and
Q into the vesicle at a linear rate of 1000 molecules per second. This perturbation is not sufficiently strong to switch the reactor into SS2, but injection
I2, releasing
X and
Q at 3500 molecules per second, is able to prompt the transition. Once in the larger vesicle SS2 state, the switch back to SS1 is achieved by injecting a new species
U into the reactor. This species undergoes reaction
, which depletes
Q inside the vesicle by quickly transforming it into waste
W (
k = 60
.0) that rapidly diffuses out of the compartment (
). Injection
I3 releases
U into the vesicle at a rate of 8000 molecules per second, but cannot initiate the switch back to SS1. Injection
I4 successfully completes the transition, releasing
U at a rate of 10
, 000 molecules per second. Time is divided into windows to accommodate different timescales (from minutes to days).
![]()
It can be proven that the individual reactions composing reaction pair Equations (15) and (16) cannot show bistability under any parameter conditions in the CSTR model, nor in the vesicle reactor model (see [
26] and the
Supplementary Material), and therefore, bistability can be claimed as an emergent feature of the system when the two reactions are present together in the low buffer vesicle model. Incidentally, bistability would be lost if a vesicle were to relocate itself to a region of high external buffer concentration. In high buffer, non-chemically-coupled reaction systems follow independent dynamics, and the non-linearity in the vesicle reactor model is reduced, largely due to the MAK reaction kinetic terms
in Equation (4).
In
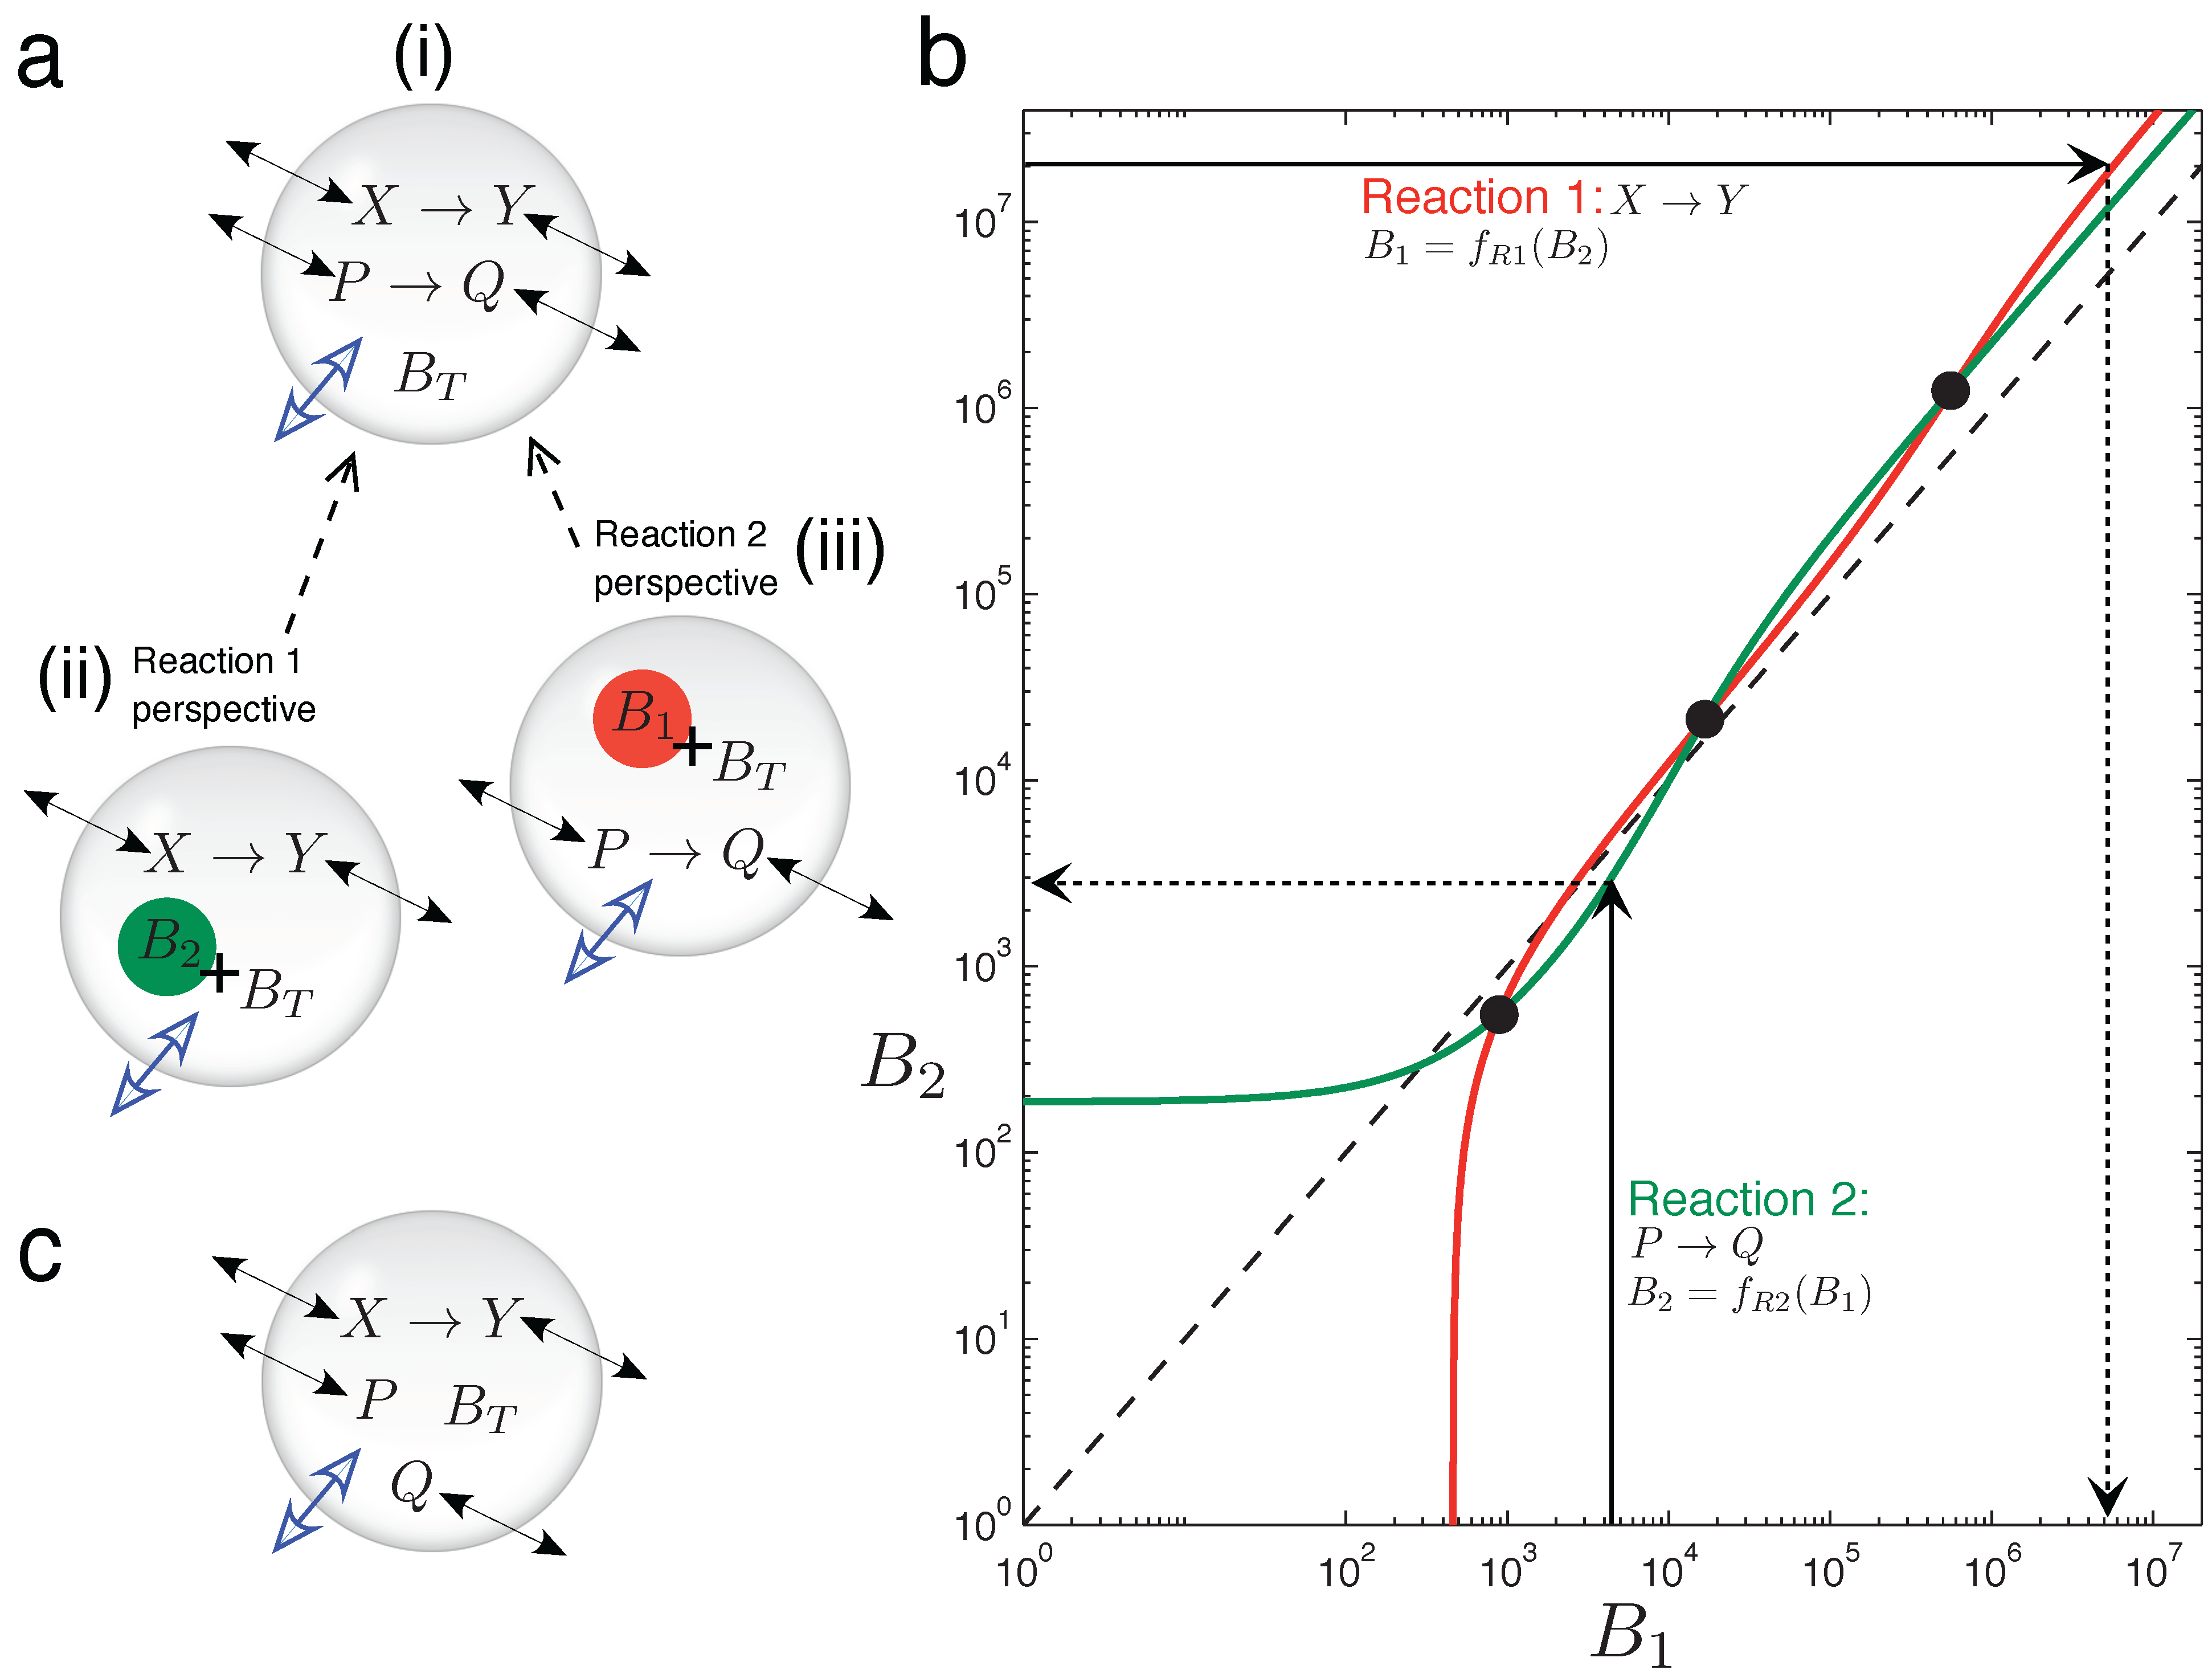
Figure 5, graphical intuition is developed as to why the two chemically-independent unimolecular reactions, Equation (15), can display emergent bistability in the variable volume vesicle model. It is not at all trivial that two such reactions should display bistability, since both are kinetically simple mechanisms with rates linearly dependent on the reactant concentration. Furthermore, stoichiometrically speaking, there is no net production of molecules in the system (one consumed molecule per produced one, in both reactions), so the asymmetry triggering volume changes can only come from the different diffusion (or permeability) properties of the four chemical species involved.
In order to understand the osmotic coupling, it is convenient to consider the two-reaction system (
Figure 5) from the perspective of each reaction. From the view point of the
X → Y reaction (
Figure 5a(ii)), the species involved in the
P → Q reaction cannot have reactive collisions with
X and
Y ,and, thus, appear as chemically inert.
P and
Q therefore just provide an extra contribution
B2 to the number of impermeable buffer molecules
BT trapped inside the vesicle. Conversely, from the view point of the
P → Q reaction (
Figure 5a(iii)), species
X and
Y appear as inert, and they add
B1 extra buffer molecules to
BT . Therefore, we have the situation that the total number of buffer molecules “experienced” by one reaction depends on the instantaneous species concentrations of the other reaction.
Now, we consider the two reactions to be in the fixed surface vesicle reactor model Equation (9), and analyze how they manage to generate three fixed points (which come from three branches of the bifurcation curve running through the vesicle morphology space).
Figure 5b plots, for a bistable parameter set, how the total particle number that each reaction effectively gives at the steady state is a function of the number of extra buffer molecules that the other reaction is providing [
45]. The red line (plotted with the y-axis as the independent variable) is function
B1 =
fR1(
B2). This function returns the total effective number of molecules that reaction
X → Y (Reaction 1) has at steady state,
B1, given that
BT +
B2 buffer molecules exist inside the vesicle. The green line (plotted normally: x-axis independent) is function
B2 =
fR2(
B1), which returns the total effective number of molecules that reaction
P → Q (Reaction 2) has at steady state,
B2, given that there are
BT +
B1 buffer molecules inside the vesicle. The whole two-reaction system has a steady state only when the following cyclic condition is fulfilled: Reaction 1, “seeing”
B2 extra buffer molecules inside the vesicle, has a steady state equivalent to
B1 extra buffer molecules, and Reaction 2, “seeing”
B1 extra buffer molecules inside the vesicle, has a steady state equivalent to
B2 extra buffer molecules. The cyclic condition is fulfilled at three points, marked by circles in
Figure 5b.
Figure 5.
Graphical intuition into emergent bistability through osmotic coupling. (a)Emergent bistability in the vesicle reactor model: (i) two chemically-independent unimolecular reactions can be understood by taking a “reactions-eye view” from the perspective of each reaction; (ii) from the perspective of the X → Y reaction (Reaction 1), all molecules associated with the P → Q reaction simply act as extra inert buffer (B2) in addition to the trapped impermeable buffer molecules BT inside the compartment; (iii) conversely, from the perspective of the P → Q reaction (Reaction 2), all molecules associated with the P → Q reaction act as extra inert buffer (B1). (b) Graph showing how the total steady-state particle number of each reaction responds to the extra number of buffer molecules that the other reaction is providing, where Reaction 1 has the y-axis as independent and Reaction 2 has the x-axis as independent. The three cross points represent fulfillment of the cyclic condition referred to in the text. The dotted line shows the relation B1 = B2. Two chemically-independent reaction sets with identical stoichiometry and identical kinetic constants would give curves that are reflections in this line. (c) When the chemical transformation between P and Q is removed, the latter solutes simply diffuse across the membrane until their respective concentration gradients are equalized. A unimolecular reaction sharing the vesicle compartment with such inert diffusing species cannot be bistable (see the text).
![]()
In summary, the potential for bistability in this system comes from the non-linearity of functions
fR1 and
fR2,
i.e., from the non-linear response that the steady state of a reaction has to a modification in the total number of buffer molecules inside the vesicle [
46]. This non-linearity allows multiple cross points of the red and green curves in
Figure 5b. Indeed, writing function
fR1 in explicit form (derivation and constants
K in the
Supplementary Material):
where the steady-state concentration of species
X is:
we observe that
B1 is a highly non-linear function of
B2. Likewise,
B2 will be a similar non-linear function of
B1.
An important note is that
Figure 5b is drawn for a constant vesicle surface area,
i.e., for a single horizontal line through vesicle morphology space. Changing the vesicle surface area to generate the bifurcation diagram in morphology space would be represented on
Figure 5b as a family of red and green curves. Bifurcation points would be marked as the various crossings of these curves.
Figure 5c shows a curious side case to be considered, in which the chemical transformation involved in reaction
P → Q no longer occurs, leaving two inert solutes that just passively diffuse across the vesicle membrane. In this scenario, the whole system loses the potential for bistability. In general, inert diffusing solutes do not change the potential for different steady states in the vesicle reactor model, for each one is restricted to always equilibrate its respective inside-outside gradient. As such, any steady state will see all inert diffusing solutes at the same concentration inside the vesicle as outside (regardless of the diffusion constants of these solutes, the size of the membrane or the volume of the aqueous vesicle water pool). Therefore, in the example of
Figure 5c, solutes
P and
Q can only change the steady state of the
X → Y reaction, in so far as effectively decreasing the total external concentration parameter to
Cε− pε− qε. Nevertheless, even if inert diffusing solutes cannot expand steady-state possibilities already present, they do change dynamic trajectories toward existing steady states.


