
Assessing the per Capita Food Supply Trends of 38 OECD Countries between 2000 and 2019—A Joinpoint Regression Analysis

 ,
,
Abstract
:1. Introduction
2. Materials and Methods
2.1. Sources of Data
2.2. Statistical Methods
3. Results
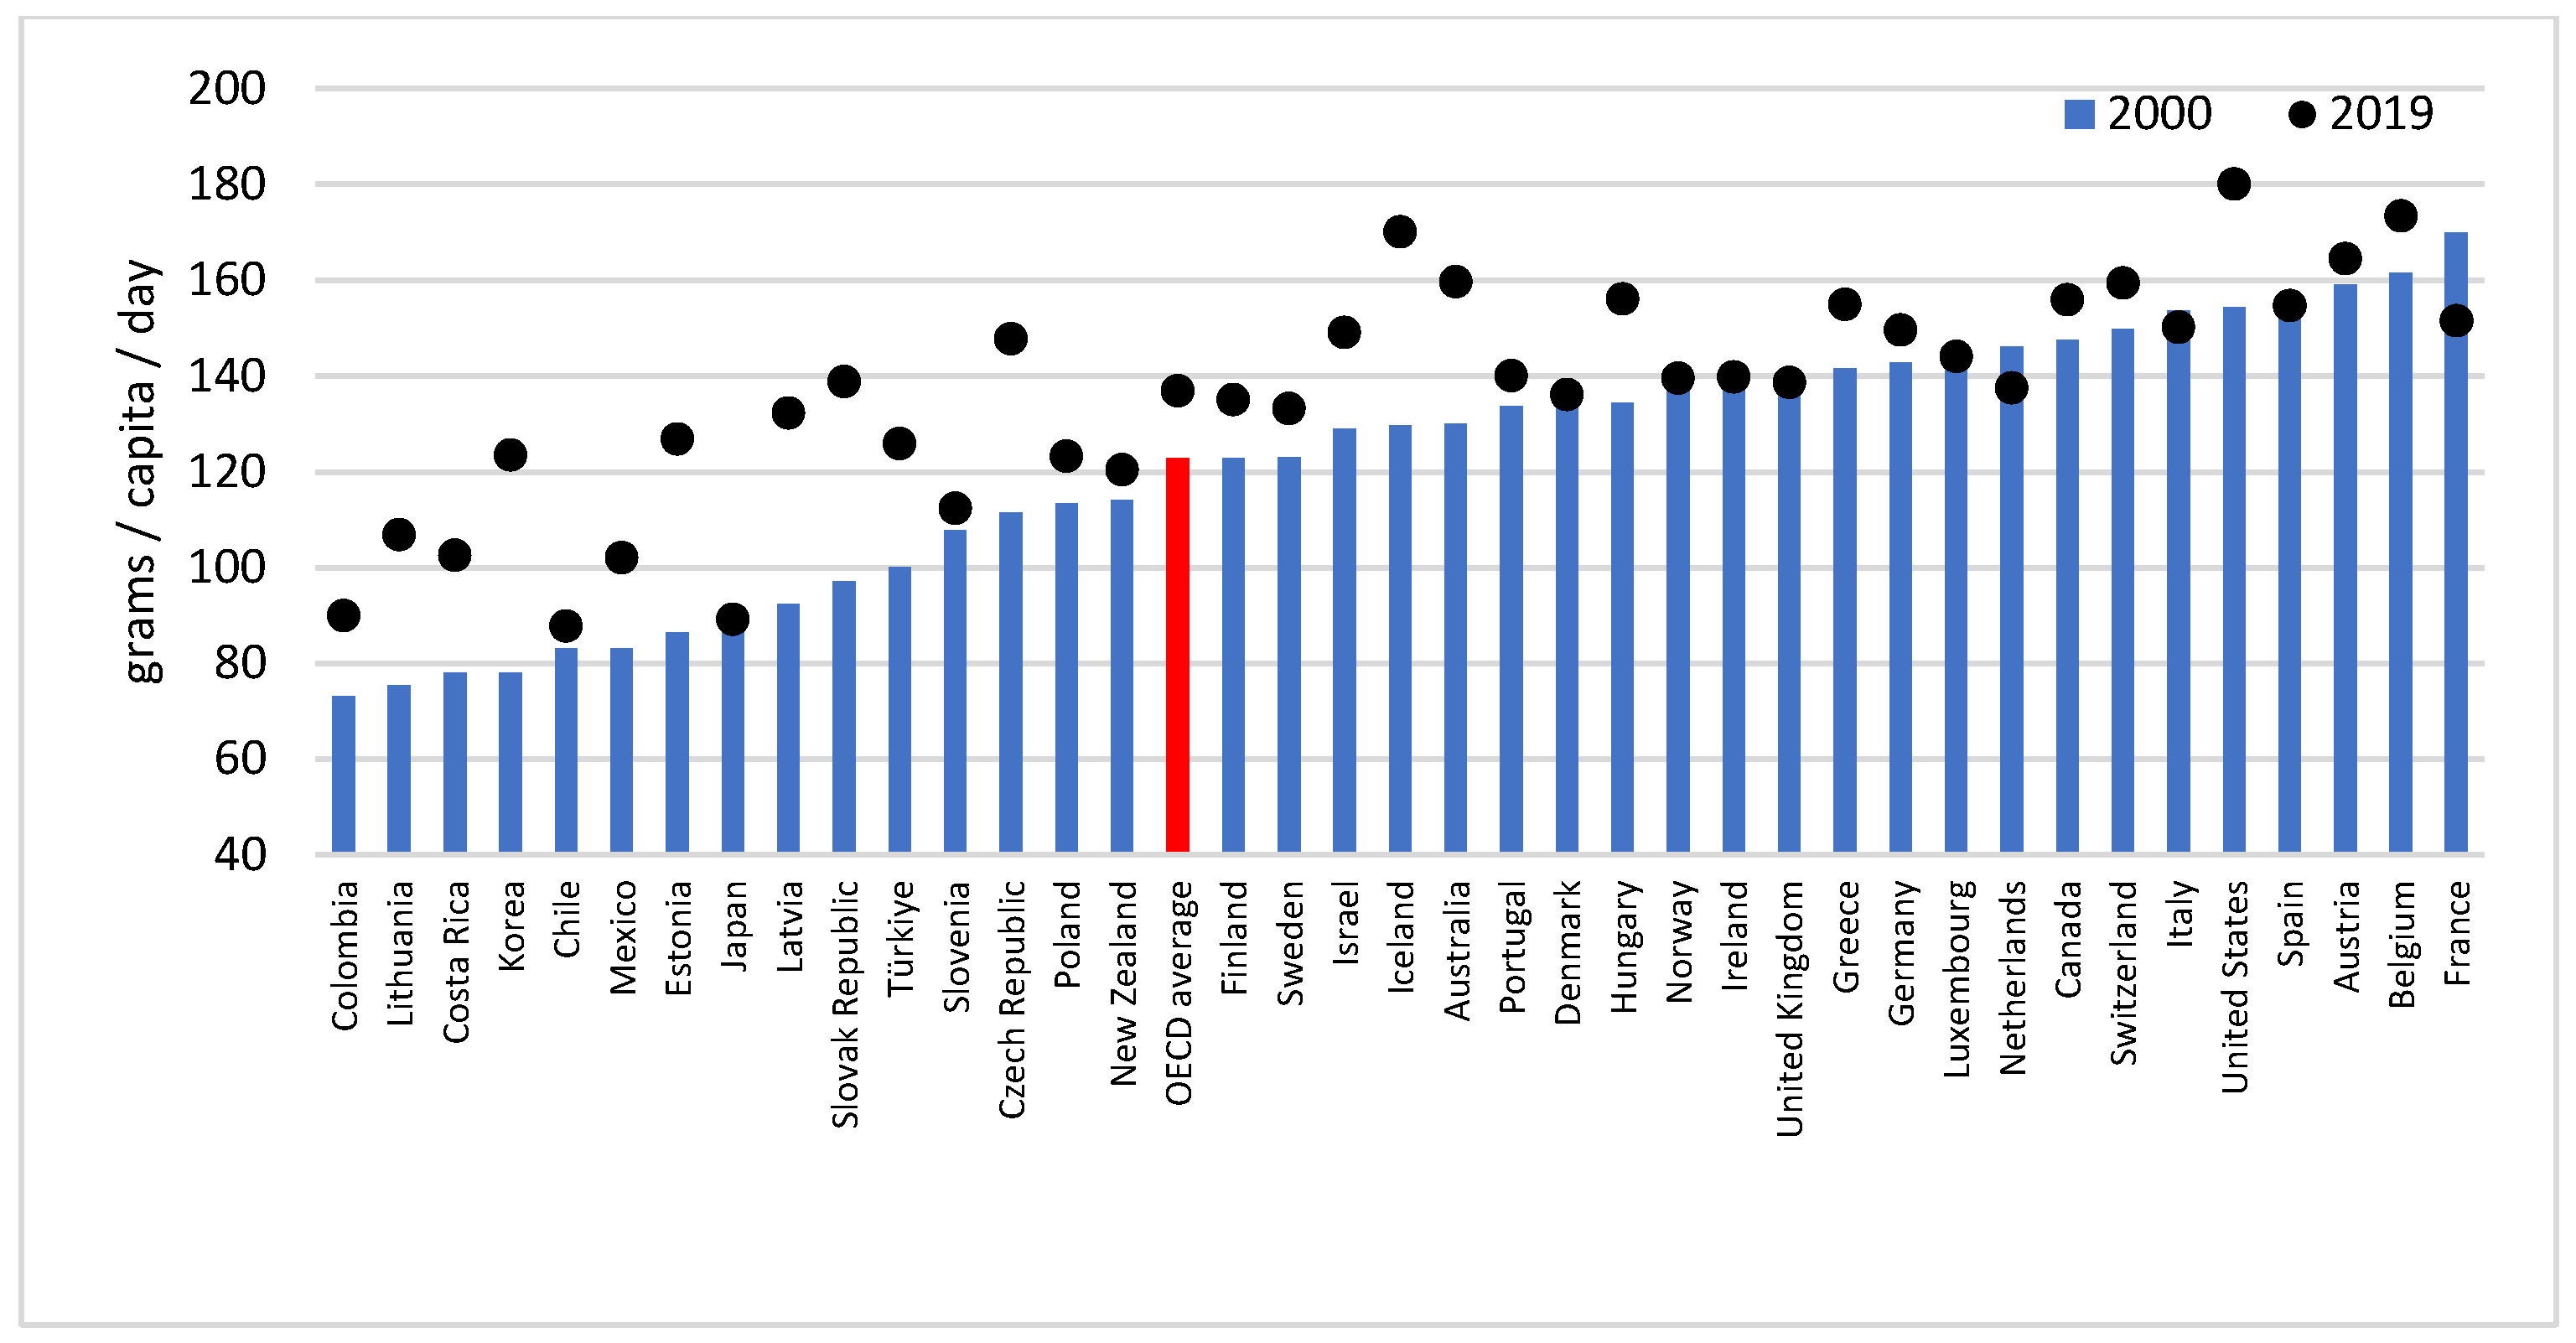
3.1. Fat Supply
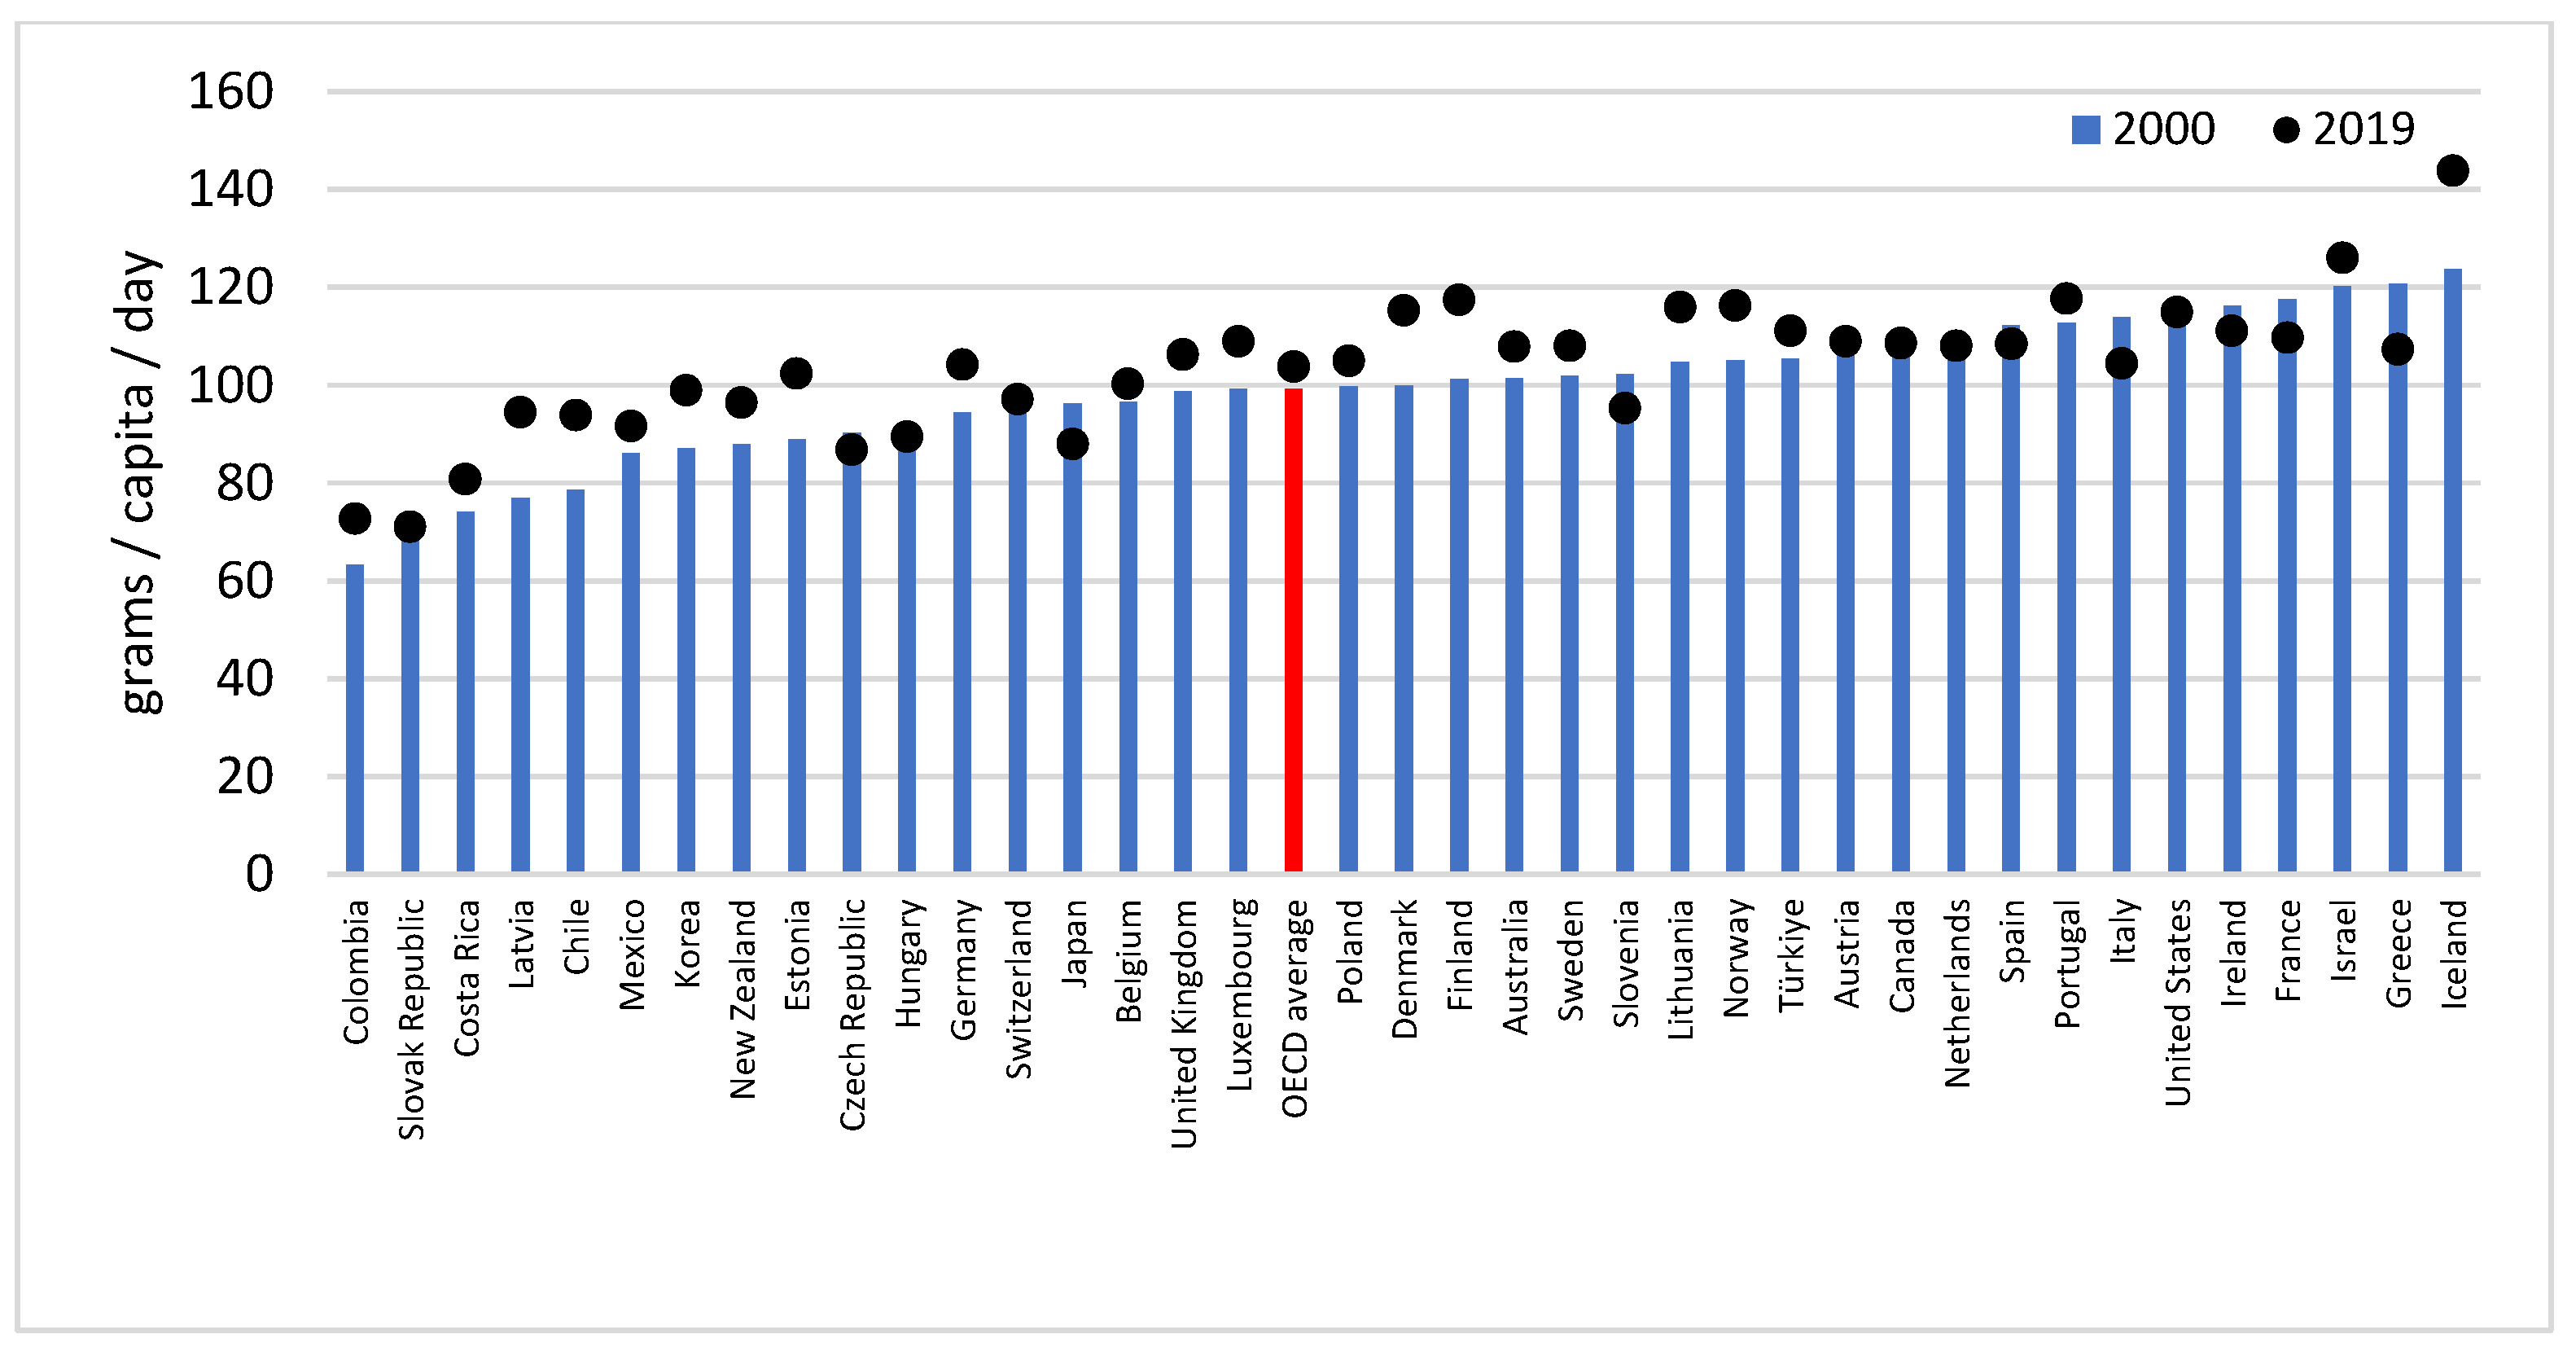
3.2. Protein Supply
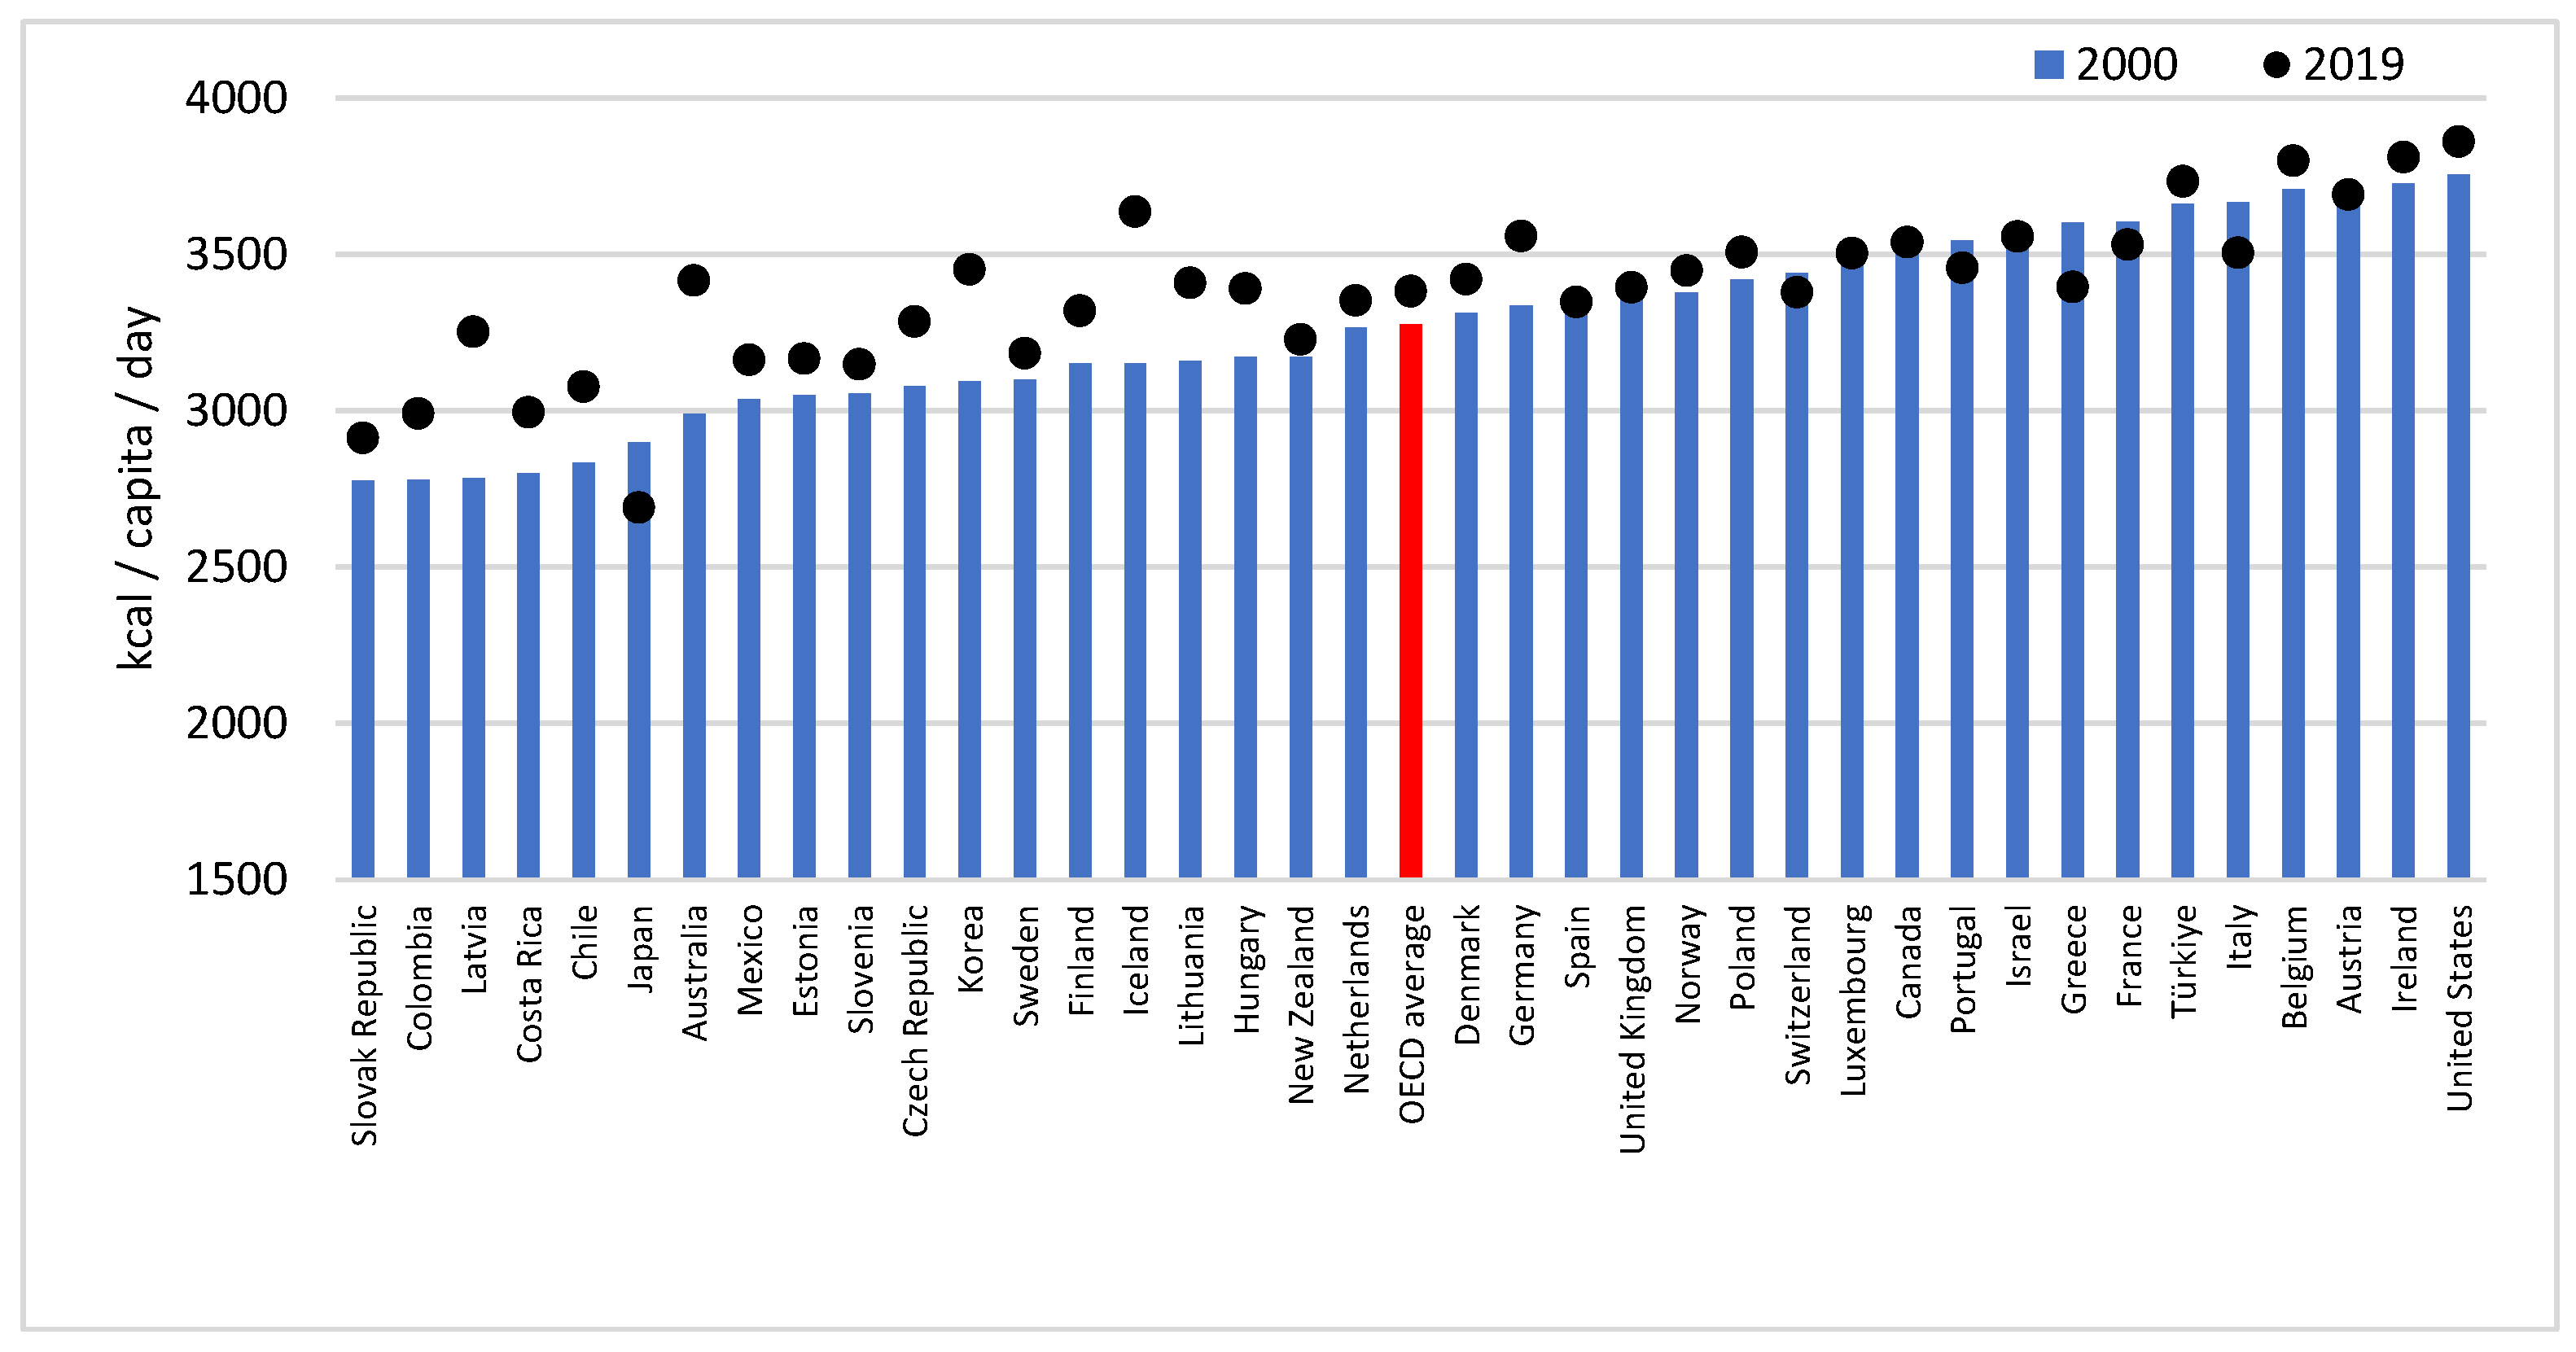
3.3. Calorie Supply
4. Discussion
5. Conclusions
Supplementary Materials
Author Contributions
Funding
Institutional Review Board Statement
Informed Consent Statement
Data Availability Statement
Acknowledgments
Conflicts of Interest
References
- Megyesiova, S.; Lieskovska, V. Premature Mortality for Chronic Diseases in the EU Member States. Int. J. Environ. Res. Public Health 2019, 16, 4021. [Google Scholar] [CrossRef] [PubMed]
- Global Health Observatory, World Health Organization. Probability of Dying between Age 30 and Exact Age 70 from Any of Cardiovascular Disease, Cancer, Diabetes, or Chronic Respiratory Disease. 2022. Available online: https://www.who.int/data/gho/data/indicators/indicator-details/GHO/probability-(-)-of-dying-between-age-30-and-exact-age-70-from-any-of-cardiovascular-disease-cancer-diabetes-or-chronic-respiratory-disease (accessed on 17 November 2022).
- Jayedi, A.; Soltani, S.; Abdolshahi, A.; Shab-Bidar, S. Healthy and unhealthy dietary patterns and the risk of chronic disease: An umbrella review of meta-analyses of prospective cohort studies. Br. J. Nutr. 2020, 124, 1133–1144. [Google Scholar] [CrossRef]
- Hunter, D.J.; Reddy, K.S. Noncommunicable diseases. N. Engl. J. Med. 2013, 369, 1336–1343. [Google Scholar] [CrossRef] [PubMed]
- GBD 2017 Diet Collaborators. Health effects of dietary risks in 195 countries, 1990-2017: A systematic analysis for the Global Burden of Disease Study 2017. Lancet 2019, 393, 1958–1972, Erratum in Lancet 2021, 397, 2466. [Google Scholar]
- World Health Organization: Obesity and Overweight (Fact Sheet). 2021. Available online: https://www.who.int/news-room/fact-sheets/detail/obesity-and-overweight (accessed on 17 November 2022).
- Thow, A.M.; Jan, S.; Leeder, S.; Swinburn, B. The effect of fiscal policy on diet, obesity and chronic disease: A systematic review. Bull. World Health Organ. 2010, 88, 609–614. [Google Scholar] [CrossRef]
- World Health Organization. Thirteenth General Programme of Work, 2019–2023; World Health Organization: Geneva, Switzerland, 2018. [Google Scholar]
- World Cancer Research Fund, American Institute for Cancer Research. Diet, Nutrition, Physical Activity and Cancer: A Global Perspective. Continuous Update Project Expert Report. 2018. Available online: https://www.wcrf.org/dietandcancer (accessed on 9 September 2022).
- Schulze, M.B.; Martínez-González, M.A.; Fung, T.T.; Lichtenstein, A.H.; Forouhi, N.G. Food based dietary patterns and chronic disease prevention. BMJ 2018, 361, k2396. [Google Scholar] [CrossRef] [PubMed]
- Jang, E.H.; Han, Y.J.; Jang, S.E.; Lee, S. Association between Diet Quality and Sarcopenia in Older Adults: Systematic Review of Prospective Cohort Studies. Life 2021, 11, 811. [Google Scholar] [CrossRef] [PubMed]
- Ferretti, F.; Mariani, M.; Sarti, E. Is the development of obesogenic food environments a self-reinforcing process? Evidence from soft drink consumption. Glob. Health 2021, 17, 91. [Google Scholar] [CrossRef]
- Alexandratos, N.; Bruinsma, J. World Agriculture towards 2030/2050: The 2012 Revision; ESA Working Paper No. 12-03; FAO: Rome, Italy, 2012; Available online: https://www.fao.org/3/ap106e/ap106e.pdf (accessed on 10 November 2022).
- Moradi, S.; Mirzababaei, A.; Dadfarma, A.; Rezaei, S.; Mohammadi, H.; Jannat, B.; Mirzaei, K. Food insecurity and adult weight abnormality risk: A systematic review and meta-analysis. Eur. J. Nutr. 2019, 58, 45–61. [Google Scholar] [CrossRef]
- Zobel, E.H.; Hansen, T.W.; Rossing, P.; von Scholten, B.J. Global Changes in Food Supply and the Obesity Epidemic. Curr. Obes. Rep. 2016, 5, 449–455. [Google Scholar] [CrossRef]
- Hu, F.B.; van Dam, R.M.; Liu, S. Diet and risk of type II diabetes: The role of types of fat and carbohydrate. Diabetologia 2001, 44, 805–817. [Google Scholar] [CrossRef] [PubMed]
- Ley, S.H.; Hamdy, O.; Mohan, V.; Hu, F.B. Prevention and management of type 2 diabetes: Dietary components and nutritional strategies. Lancet 2014, 383, 1999–2007. [Google Scholar] [CrossRef] [PubMed]
- Mozaffarian, D. Dietary and Policy Priorities for Cardiovascular Disease, Diabetes, and Obesity: A Comprehensive Review. Circulation 2016, 133, 187–225. [Google Scholar] [CrossRef]
- Basu, S.; Yoffe, P.; Hills, N.; Lustig, R.H. The relationship of sugar to population-level diabetes prevalence: An econometric analysis of repeated cross-sectional data. PLoS ONE 2013, 8, e57873. [Google Scholar] [CrossRef] [PubMed]
- Hawkes, C. Uneven dietary development: Linking the policies and processes of globalization with the nutrition transition, obesity and diet-related chronic diseases. Glob. Health 2006, 2, 4. [Google Scholar] [CrossRef]
- Smith, D.; Cummins, S.; Clark, C.; Stansfeld, S. Does the local food environment around schools affect diet? Longitudinal associations in adolescents attending secondary schools in East London. BMC Public Health 2013, 13, 70. [Google Scholar] [CrossRef]
- Vandevijvere, S.; Chow, C.C.; Hall, K.D.; Umali, E.; Swinburn, B.A. Increased food energy supply as a major driver of the obesity epidemic: A global analysis. Bull. World Health Organ. 2015, 93, 446–456. [Google Scholar] [CrossRef]
- EFSA Panel on Dietetic Products, Nutrition and Allergies (NDA): Scientific Opinion on Dietary Reference Values for energy. EFSA J. 2013, 11, 3005. [CrossRef]
- Senior, A.M.; Nakagawa, S.; Raubenheimer, D.; Simpson, S.J. Global associations between macronutrient supply and age-specific mortality. Proc. Natl. Acad. Sci. USA 2020, 117, 30824–30835, Erratum in Proc. Natl. Acad. Sci. USA 2021, 118, e2101933118. [Google Scholar] [CrossRef]
- Institute of Medicine. Dietary Reference Intakes for Energy, Carbohydrate, Fiber, Fat, Fatty Acids, Cholesterol, Protein, and Amino Acids; The National Academies Press: Washington, DC, USA, 2005; pp. 21–37. [Google Scholar]
- Del Gobbo, L.C.; Khatibzadeh, S.; Imamura, F.; Micha, R.; Shi, P.; Smith, M.; Myers, S.S.; Mozaffarian, D. Assessing global dietary habits: A comparison of national estimates from the FAO and the Global Dietary Database. Am. J. Clin. Nutr. 2015, 101, 1038–1046. [Google Scholar] [CrossRef]
- Al Hasan, S.M.; Saulam, J.; Kanda, K.; Murakami, A.; Yamadori, Y.; Mashima, Y.; Ngatu, N.R.; Hirao, T. Temporal Trends in Apparent Energy and Macronutrient Intakes in the Diet in Bangladesh: A Joinpoint Regression Analysis of the FAO’s Food Balance Sheet Data from 1961 to 2017. Nutrients 2020, 12, 2319. [Google Scholar] [CrossRef]
- Al Hasan, S.M.; Saulam, J.; Mikami, F.; Kanda, K.; Ngatu, N.R.; Yokoi, H.; Hirao, T. Trends in per Capita Food and Protein Availability at the National Level of the Southeast Asian Countries: An Analysis of the FAO’s Food Balance Sheet Data from 1961 to 2018. Nutrients 2022, 14, 603. [Google Scholar] [CrossRef]
- Sheehy, T.; Sharma, S. Trends in energy and nutrient supply in Trinidad and Tobago from 1961 to 2007 using FAO food balance sheets. Public Health Nutr. 2013, 16, 1693–1702. [Google Scholar] [CrossRef] [PubMed]
- Sheehy, T.; Carey, E.; Sharma, S.; Biadgilign, S. Trends in energy and nutrient supply in Ethiopia: A perspective from FAO food balance sheets. Nutr. J. 2019, 18, 46. [Google Scholar] [CrossRef]
- Sheehy, T.; Sharma, S. The nutrition transition in the Republic of Ireland: Trends in energy and nutrient supply from 1961 to 2007 using Food and Agriculture Organization food balance sheets. BJN 2011, 106, 1078–1089. [Google Scholar] [CrossRef]
- Grünberger, K. Estimating Food Consumption Patterns by Reconciling Food Balance Sheets and Household Budget Surveys; ESS Working Paper, No. 14-08; Food and Agriculture Organization of the United Nations: Rome, Italy, 2014. [Google Scholar]
- Convention on the OECD. Available online: https://www.oecd.org/about/document/oecd-convention.htm (accessed on 29 November 2022).
- FAO. Chapter 3: Calculation of the Energy Content of Foods—Energy Conversion Factors. In FAO Food and Nutrition Paper 77: Food Energy—Methods of Analysis and Conversion Factors; Report of a Technical Workshop, Rome, 3–6 December 2002; Food And Agriculture Organization of the United Nations: Rome, Italy, 2003; pp. 18–37. [Google Scholar]
- Schmidhuber, J.; Sur, P.; Fay, K.; Huntley, B.; Salama, J.; Lee, A.; Cornaby, L.; Horino, M.; Murray, C.; Afshin, A. The Global Nutrient Database: Availability of macronutrients and micronutrients in 195 countries from 1980 to 2013. Lancet Planet Health 2018, 2, e353–e368. [Google Scholar] [CrossRef] [PubMed]
- National Cancer Institute, Division of Cancer Control & Population Sciences. Surveillance Research Program: Number of Joinpoints. 2022. Available online: https://surveillance.cancer.gov/help/joinpoint/setting-parameters/method-and-parameters-tab/number-of-joinpoints (accessed on 10 November 2022).
- Cochrane Effective Practice and Organisation of Care (EPOC). Interrupted time series (ITS) analyses. EPOC Resources for Review Authors. 2017. Available online: https://epoc.cochrane.org/sites/epoc.cochrane.org/files/public/uploads/Resources-for-authors2017/interrupted_time_series_analyses.docx (accessed on 21 April 2019).
- Pakai, A.; Kívés, Z. Research for Nurses Part 2: Methods of sampling and data collection in health science research. Nővér 2013, 26, 20–44. [Google Scholar]
- Joinpoint Regression Program, Version 4.9.0.0. Statistical Research and Applications Branch, National Cancer Institute. 2021. Available online: https://surveillance.cancer.gov/joinpoint/ (accessed on 20 July 2022).
- Oberlander, L.; Disdier, A.C.; Etilé, F. Globalisation and national trends in nutrition and health: A grouped fixed-effects approach to intercountry heterogeneity. Health Econ. 2017, 26, 1146–1161. [Google Scholar] [CrossRef] [PubMed]
- Rehm, C.D.; Peñalvo, J.L.; Afshin, A.; Mozaffarian, D. Dietary Intake Among US Adults, 1999–2012. JAMA 2016, 315, 2542–2553. [Google Scholar] [CrossRef]
- Austin, G.L.; Ogden, L.G.; Hill, J.O. Trends in carbohydrate, fat, and protein intakes and association with energy intake in normal-weight, overweight, and obese individuals: 1971–2006. Am. J. Clin. Nutr. 2011, 93, 836–843. [Google Scholar] [CrossRef]
- Ortinau, L.C.; Hoertel, H.A.; Douglas, S.M.; Leidy, H.J. Effects of high-protein vs. high-fat snacks on appetite control, satiety, and eating initiation in healthy women. Nutr. J. 2014, 13, 97. [Google Scholar] [CrossRef] [PubMed]
- Ebbeling, C.B.; Feldman, H.A.; Klein, G.L.; Wong, J.M.W.; Bielak, L.; Stelz, S.K.; Luoto, P.K.; Wolfe, R.K.; Wong, W.W.; Ludwig, D.S. Effects of a low carbohydrate diet on energy expenditure during weight loss maintenance: Randomized trial. BMJ 2018, 363, k4583, Erratum in BMJ 2020, 371, m4264. [Google Scholar] [CrossRef]
- Russell, W.R.; Gratz, S.W.; Duncan, S.H.; Holtrop, G.; Ince, J.; Scobbie, L.; Duncan, G.; Johnstone, A.M.; Lobley, G.E.; Wallace, R.J.; et al. High-protein, reduced-carbohydrate weight-loss diets promote metabolite profiles likely to be detrimental to colonic health. Am. J. Clin. Nutr. 2011, 93, 1062–1072. [Google Scholar] [CrossRef]
- Sylvetsky, A.C.; Edelstein, S.L.; Walford, G.; Boyko, E.J.; Horton, E.S.; Ibebuogu, U.N.; Knowler, W.C.; Montez, M.G.; Temprosa, M.; Hoskin, M.; et al. A High-Carbohydrate, High-Fiber, Low-Fat Diet Results in Weight Loss among Adults at High Risk of Type 2 Diabetes. J. Nutr. 2017, 147, 2060–2066. [Google Scholar] [CrossRef]
- Yach, D.; Khan, M.; Bradley, D.; Hargrove, R.; Kehoe, S.; Mensah, G. The role and challenges of the food industry in addressing chronic disease. Glob. Health 2010, 6, 10. [Google Scholar] [CrossRef]
- Kearney, J. Food consumption trends and drivers. Philos. Trans. R. Soc. B Biol. Sci. 2010, 365, 2793–2807. [Google Scholar] [CrossRef] [PubMed]
- Levy, R.B.; Rauber, F.; Chang, K.; Louzada, M.L.D.C.; Monteiro, C.A.; Millett, C.; Vamos, E.P. Ultra-processed food consumption and type 2 diabetes incidence: A prospective cohort study. Clin. Nutr. 2021, 40, 3608–3614. [Google Scholar] [CrossRef]
- Khandpur, N.; Neri, D.A.; Monteiro, C.; Mazur, A.; Frelut, M.L.; Boyland, E.; Weghuber, D.; Thivel, D. Ultra-Processed Food Consumption among the Paediatric Population: An Overview and Call to Action from the European Childhood Obesity Group. Ann. Nutr. Metab. 2020, 76, 109–113. [Google Scholar] [CrossRef]
- Le, T.H.; Disegha, M.; Lloyd, T. National Food Consumption Patterns: Converging Trends and the Implications for Health. EuroChoices 2020, 19, 60–66. [Google Scholar] [CrossRef]
- Khatibzadeh, S.; Saheb Kashaf, M.; Micha, R.; Fahimi, S.; Shi, P.; Elmadfa, I.; Kalantarian, S.; Wirojratana, P.; Ezzati, M.; Powles, J.; et al. A global database of food and nutrient consumption. Bull. World Health Organ. 2016, 94, 931–934. [Google Scholar] [CrossRef] [PubMed]
- Männistö, S.; Laatikainen, T.; Helakorpi, S.; Valsta, L. Monitoring diet and diet-related chronic disease risk factors in Finland. Public Health Nutr. 2010, 13, 907–914. [Google Scholar] [CrossRef] [PubMed]
- Swarnamali, H.; Jayawardena, R.; Chourdakis, M.; Ranasinghe, P. Is the proportion of per capita fat supply associated with the prevalence of overweight and obesity? An ecological analysis. BMC Nutr. 2022, 8, 4. [Google Scholar] [CrossRef] [PubMed]
- Brambila-Macias, J.; Shankar, B.; Capacci, S.; Mazzocchi, M.; Perez-Cueto, F.J.A.; Verbeke, W.; Traill, W.B. Policy interventions to promote healthy eating: A review of what works, what does not, and what is promising. Food Nutr. Bull. 2011, 32, 365–375. [Google Scholar] [CrossRef] [PubMed]
- Cassani, L.; Gomez-Zavaglia, A. Sustainable Food Systems in Fruits and Vegetables Food Supply Chains. Front. Nutr. 2022, 9, 829061. [Google Scholar] [CrossRef]
- Jacobson, M.F.; Krieger, J.; Brownell, K.D. Potential Policy Approaches to Address Diet-Related Diseases. JAMA 2018, 320, 341–342. [Google Scholar] [CrossRef]
- Diani, L.; Forchielli, M.L. Sugar Intake: Are All Children Made of Sugar? Life 2021, 11, 444. [Google Scholar] [CrossRef]
- Goiana-da-Silva, F.; Cruz-E-Silva, D.; Bartlett, O.; Vasconcelos, J.; Nunes, A.M.; Ashrafian, H.; Miraldo, M.; do Céu Machado, M.; Araújo, F.; Darzi, A. The Ethics of Taxing Sugar-Sweetened Beverages to Improve Public Health. Front. Public Health 2020, 8, 110. [Google Scholar] [CrossRef]
- Mazzocchi, M.; Traill, W.B.; Shogren, J.F. “Policy interventions”. In Fat Economics: Nutrition, Health and Economic Policy; Oxford University Press: New York, NY, USA, 2009; pp. 114–157. [Google Scholar]
- Csákvári, T.; Németh, N.; Kerner, Á.; Sebestyén, A.; Endrei, D.; Boncz, I. Assessing the effect of the public health product tax in Hungary between 2011–2017. Value Health 2018, 21, S52. [Google Scholar] [CrossRef]
- Clark, J.S.; Dittrich, L.O.; Xu, Q. Empirical Evidence of the Efficiency and Efficacy of Fat Taxes and Thin Subsidies. Cent. Eur. J. Public Health 2014, 22, 201–206. [Google Scholar] [CrossRef]
- Pfinder, M.; Heise, T.L.; Hilton Boon, M.; Pega, F.; Fenton, C.; Griebler, U.; Gartlehner, G.; Sommer, I.; Katikireddi, S.V.; Lhachimi, S.K. Taxation of unprocessed sugar or sugar-added foods for reducing their consumption and preventing obesity or other adverse health outcomes. Cochrane Database Syst. Rev. 2020, 4, CD012333. [Google Scholar] [CrossRef] [PubMed]
- Boer, J.; Driesenaar, J.; Blokstra, A.; Vennemann, F.; Pushkarev, N.; Hansen, J. Supporting the Mid-Term Evaluation of the EU Action Plan on Childhood Obesity. Study for the European Commission. 2018. Available online: https://data.europa.eu/doi/10.2875/722984 (accessed on 13 October 2022).
- Pakai, A.; Dér, A.; Kriszbacher, I.; Németh, K.; Zsigmond, E.; Balázs, P. Why don’t Hungarian women take part in organized cervical screening? New Med. 2010, 14, 25–28. [Google Scholar]
- Boaz, M.; Kaufman-Shriqui, V.; Azoulay, O.; Weinstein, T. Status of Nutrition in Hemodialysis Patients Survey (SNIPS): Nutrition Intake in Obese and Overweight vs. Healthy Weight Patients. Life 2021, 11, 166. [Google Scholar] [CrossRef]
- Bentham, J.; Singh, G.M.; Danaei, G.; Green, R.; Lin, J.K.; Stevens, G.A.; Farzadfar, F.; Bennett, J.E.; Di Cesare, M.; Dangour, A.D.; et al. Multi-dimensional characterisation of global food supply from 1961–2013. Nat. Food 2020, 1, 70–75. [Google Scholar] [CrossRef] [PubMed]
- Pravst, I.; Raats, M.M.; Chang, B.P.I. Editorial: The Effects of the COVID-19 Outbreak on Food Supply, Dietary Patterns, Nutrition, and Health: Volume 1. Front Nutr. 2022, 9, 845374. [Google Scholar] [CrossRef] [PubMed]
- Magliano, D.J.; Islam, R.M.; Barr, E.; Gregg, E.W.; Pavkov, M.E.; Harding, J.L.; Tabesh, M.; Koye, D.N.; Shaw, J.E. Trends in incidence of total or type 2 diabetes: Systematic review. BMJ 2019, 366, l5003. [Google Scholar] [CrossRef] [PubMed]

| AAPC (95%CI) | Trends | ||||||
|---|---|---|---|---|---|---|---|
| Trend 1 | Trend 2 | Trend 3 | |||||
| APC (95%CI) | Period | APC (95%CI) | Period | APC (95%CI) | Period | ||
| Protein | 0.3 * (0.2–0.4) | 0.4 ** (0.2–0.5) | 2000–2007 | −0.2 (−0.5–0.1) | 2007–2012 | 0.5 ** (0.3–0.6) | 2012–2019 |
| Fat | 0.6 * (0.5–0.7) | 0.7 ** (0.5–0.9) | 2000–2006 | 0.1 (0.0–0.3) | 2006–2013 | 1.0 ** (0.8–1.1) | 2013–2019 |
| Calories | 0.2 * (0.1–0.2) | 0.2 ** (0.1–0.3) | 2000–2006 | 0.0 (−0.1–0.1) | 2006–2014 | 0.4 ** (0.3–0.5) | 2014–2019 |
| Nutrient | 2000 | 2019 | Change | p Value | |
|---|---|---|---|---|---|
| Fat | % of daily kcal supply | 32.7% | 37.6% | 4.9% | <0.001 |
| (95%CI) | (30.7–34.7%) | (36.0–39.3%) | |||
| Protein | % of daily kcal supply | 11.7% | 12.7% | 1.0% | <0.001 |
| (95%CI) | (11.3–12.2%) | (12.2–13.1%) | |||
| Carbohydrates (and fiber) | % of daily kcal supply | 55.6% | 49.7% | −5.9% | <0.001 |
| (95%CI) | (53.4–57.8%) | (47.9–51.5%) | |||
Disclaimer/Publisher’s Note: The statements, opinions and data contained in all publications are solely those of the individual author(s) and contributor(s) and not of MDPI and/or the editor(s). MDPI and/or the editor(s) disclaim responsibility for any injury to people or property resulting from any ideas, methods, instructions or products referred to in the content. |
© 2023 by the authors. Licensee MDPI, Basel, Switzerland. This article is an open access article distributed under the terms and conditions of the Creative Commons Attribution (CC BY) license (https://creativecommons.org/licenses/by/4.0/).
Share and Cite
Csákvári, T.; Elmer, D.; Németh, N.; Komáromy, M.; Kajos, L.F.; Kovács, B.; Boncz, I. Assessing the per Capita Food Supply Trends of 38 OECD Countries between 2000 and 2019—A Joinpoint Regression Analysis. Life 2023, 13, 1091. https://doi.org/10.3390/life13051091
Csákvári T, Elmer D, Németh N, Komáromy M, Kajos LF, Kovács B, Boncz I. Assessing the per Capita Food Supply Trends of 38 OECD Countries between 2000 and 2019—A Joinpoint Regression Analysis. Life. 2023; 13(5):1091. https://doi.org/10.3390/life13051091
Chicago/Turabian StyleCsákvári, Tímea, Diána Elmer, Noémi Németh, Márk Komáromy, Luca Fanni Kajos, Bettina Kovács, and Imre Boncz. 2023. "Assessing the per Capita Food Supply Trends of 38 OECD Countries between 2000 and 2019—A Joinpoint Regression Analysis" Life 13, no. 5: 1091. https://doi.org/10.3390/life13051091