Article

Non-Destructive Testing for Winding Insulation Diagnosis Using Inter-Turn Transient Voltage Signature Analysis

Department of Electrical Engineering, Mouloud Mammeri University, BP 15000 Tizi-Ouzou, Algeria
*
Author to whom correspondence should be addressed.
Machines 2018, 6(2), 21; https://doi.org/10.3390/machines6020021
Submission received: 4 March 2018 / Revised: 12 April 2018 / Accepted: 4 May 2018 / Published: 10 May 2018

Abstract

:
The paper proposes a novel approach to assess the integrity of Electrical Insulation Systems (EIS) by evaluating the response of the Transient Voltage Signature Analysis (VSA) to voltage source inverters correlated with changes in the Insulation Capacitance (IC). The involved model structures are derived from the in-situ estimation of high-frequency electromagnetic RLMC lumped network parameters. Different physical phenomena such as inductive and capacitive effects, as well as skin and proximity effects are combined. To account for these phenomena, we use an approach based on equivalent multi-transmission line electric circuits with distributed parameters (R: resistances, L, M: self and mutual inductances, and C: capacitances) which are frequency-dependent. Using the finite element method, firstly the turn-to-ground and turn-to-turn capacitance parameters are performed by solving an electrostatic model with a floating electric potential approach, and secondly, the resistance and self/mutual inductances are computed from the strongly coupled magneto-harmonic and total current density equations, including the conduction and displacement eddy current densities. The sensitivity of the capacitances is measured according to insulation thickness, and the dielectric properties are adopted to test the degradation order scenarios of the EIS and comparing their time and frequency domains of transient voltage waveform behavior with respect to healthy assessed insulation systems.

1. Introduction

The Electrical Insulation System (EIS) materials are the heart of electrical equipment. During operation, EIS materials may be subject to different aging mechanisms or insulation failure resulting from stresses induced by a variety of factors, including thermal (additional heating, thermal overload), electrical (high-energy transient voltages, partial discharges), ambient stress (contamination, accumulated moisture, high humidity, aggressive chemicals), mechanical (moving/vibrations of coils), and voltage spikes, caused by the voltage source of the converters [1,2,3].
The high frequency switching of semiconductor devices results in repetitive and uneven voltage transients, an increased high frequency harmonic content, highly-distorted waveform magnitudes, and over voltages because of resonance. Each of these factors play an important role in degradation of insulation reliability and cause localized supplementary electrical and thermal stresses on EIS, and increased dielectric and Joule losses as well as an increased operating temperature. Moreover, increased electric stress is the main cause of accelerated degradation of insulation dielectric properties, which drastically impacts the lifetime of insulation [4,5,6,7].
Insulation testing and monitoring methods can generally be divided into two different categories. The first one is offline testing, which requires the electrical equipment to be removed from service, whereas the second one is online monitoring, which can be performed during operation. The popular, reliable, and very frequently used online methods to assess the turn-to-turn insulation system of medium and high voltage electrical equipment are the Voltage Surge test and the Partial Discharge (PD) test, which also can be applied offline [8,9]. Common offline test methods used to test the phase-to-ground insulation are the Insulation Resistance (IR), the Polarization Index (PI), and the Dissipation Factor (DF). Other new techniques, such as the Recovery Voltage Method (RVM), the Dielectric Frequency Response (DFR) measurements, the Fourier Transform Infrared (FTI), and Power Factor (PF) as a function of frequency, etc., are still being explored. Online monitoring refers to “tests” that are done during operation of the motor or generator. Therefore, no outage is needed, although, for some monitors, the operating condition of the machine is changed to extract the greatest amount of diagnostic information [10,11,12,13].
Various monitoring methods have been developed using different physical quantities to detect the health condition of a stator insulation system. These methods utilize different motor parameters, like magnetic flux, temperature, stator current, or input power for monitoring purposes. Online condition monitoring is usually preferred in applications that have a continuous process, such as petro/chemical, water treatment, material handling, etc. The major advantage of this method is that the machine does not have to be taken out of service. As a result, the health condition while the motor is operating can be assessed. Predictive maintenance is made easier because the machine is under constant monitoring, an incipient failure can immediately be detected, and actions can be scheduled to avoid more severe downtime. A disadvantage is that the online monitoring techniques often require the installation of additional equipment, which has to be installed on every machine. Compared to the offline tests, it is more difficult or even impossible to detect some failure processes. However, many sensorless and non-intrusive methods have been recently developed using electrical signatures, e.g., current and voltage, such that the monitoring algorithm can reside in the motor control center or even inside of motor control devices, such as the drives. Therefore, the online monitoring can be non-intrusive without the need for additional sensors and installations [14,15].
Capacitance is considered a critical factor which can define the lifetime of the EIS. So, the premature supervision of insulation ageing or degradation requires the evolution of capacitance to be followed during operation, specifically its dielectric and geometrical characteristics. Ambient stresses, such as humidity, affect the insulation material in two different ways: first, by penetrating inside the bulk of the insulation and second, by corrosion or copper oxidation processes which form a conductive layer of moisture on the insulation internal surface. To achieve these goals, Non-Destructive Testing (NDT) condition assessment is necessary to evaluate and diagnose the EIS quality.
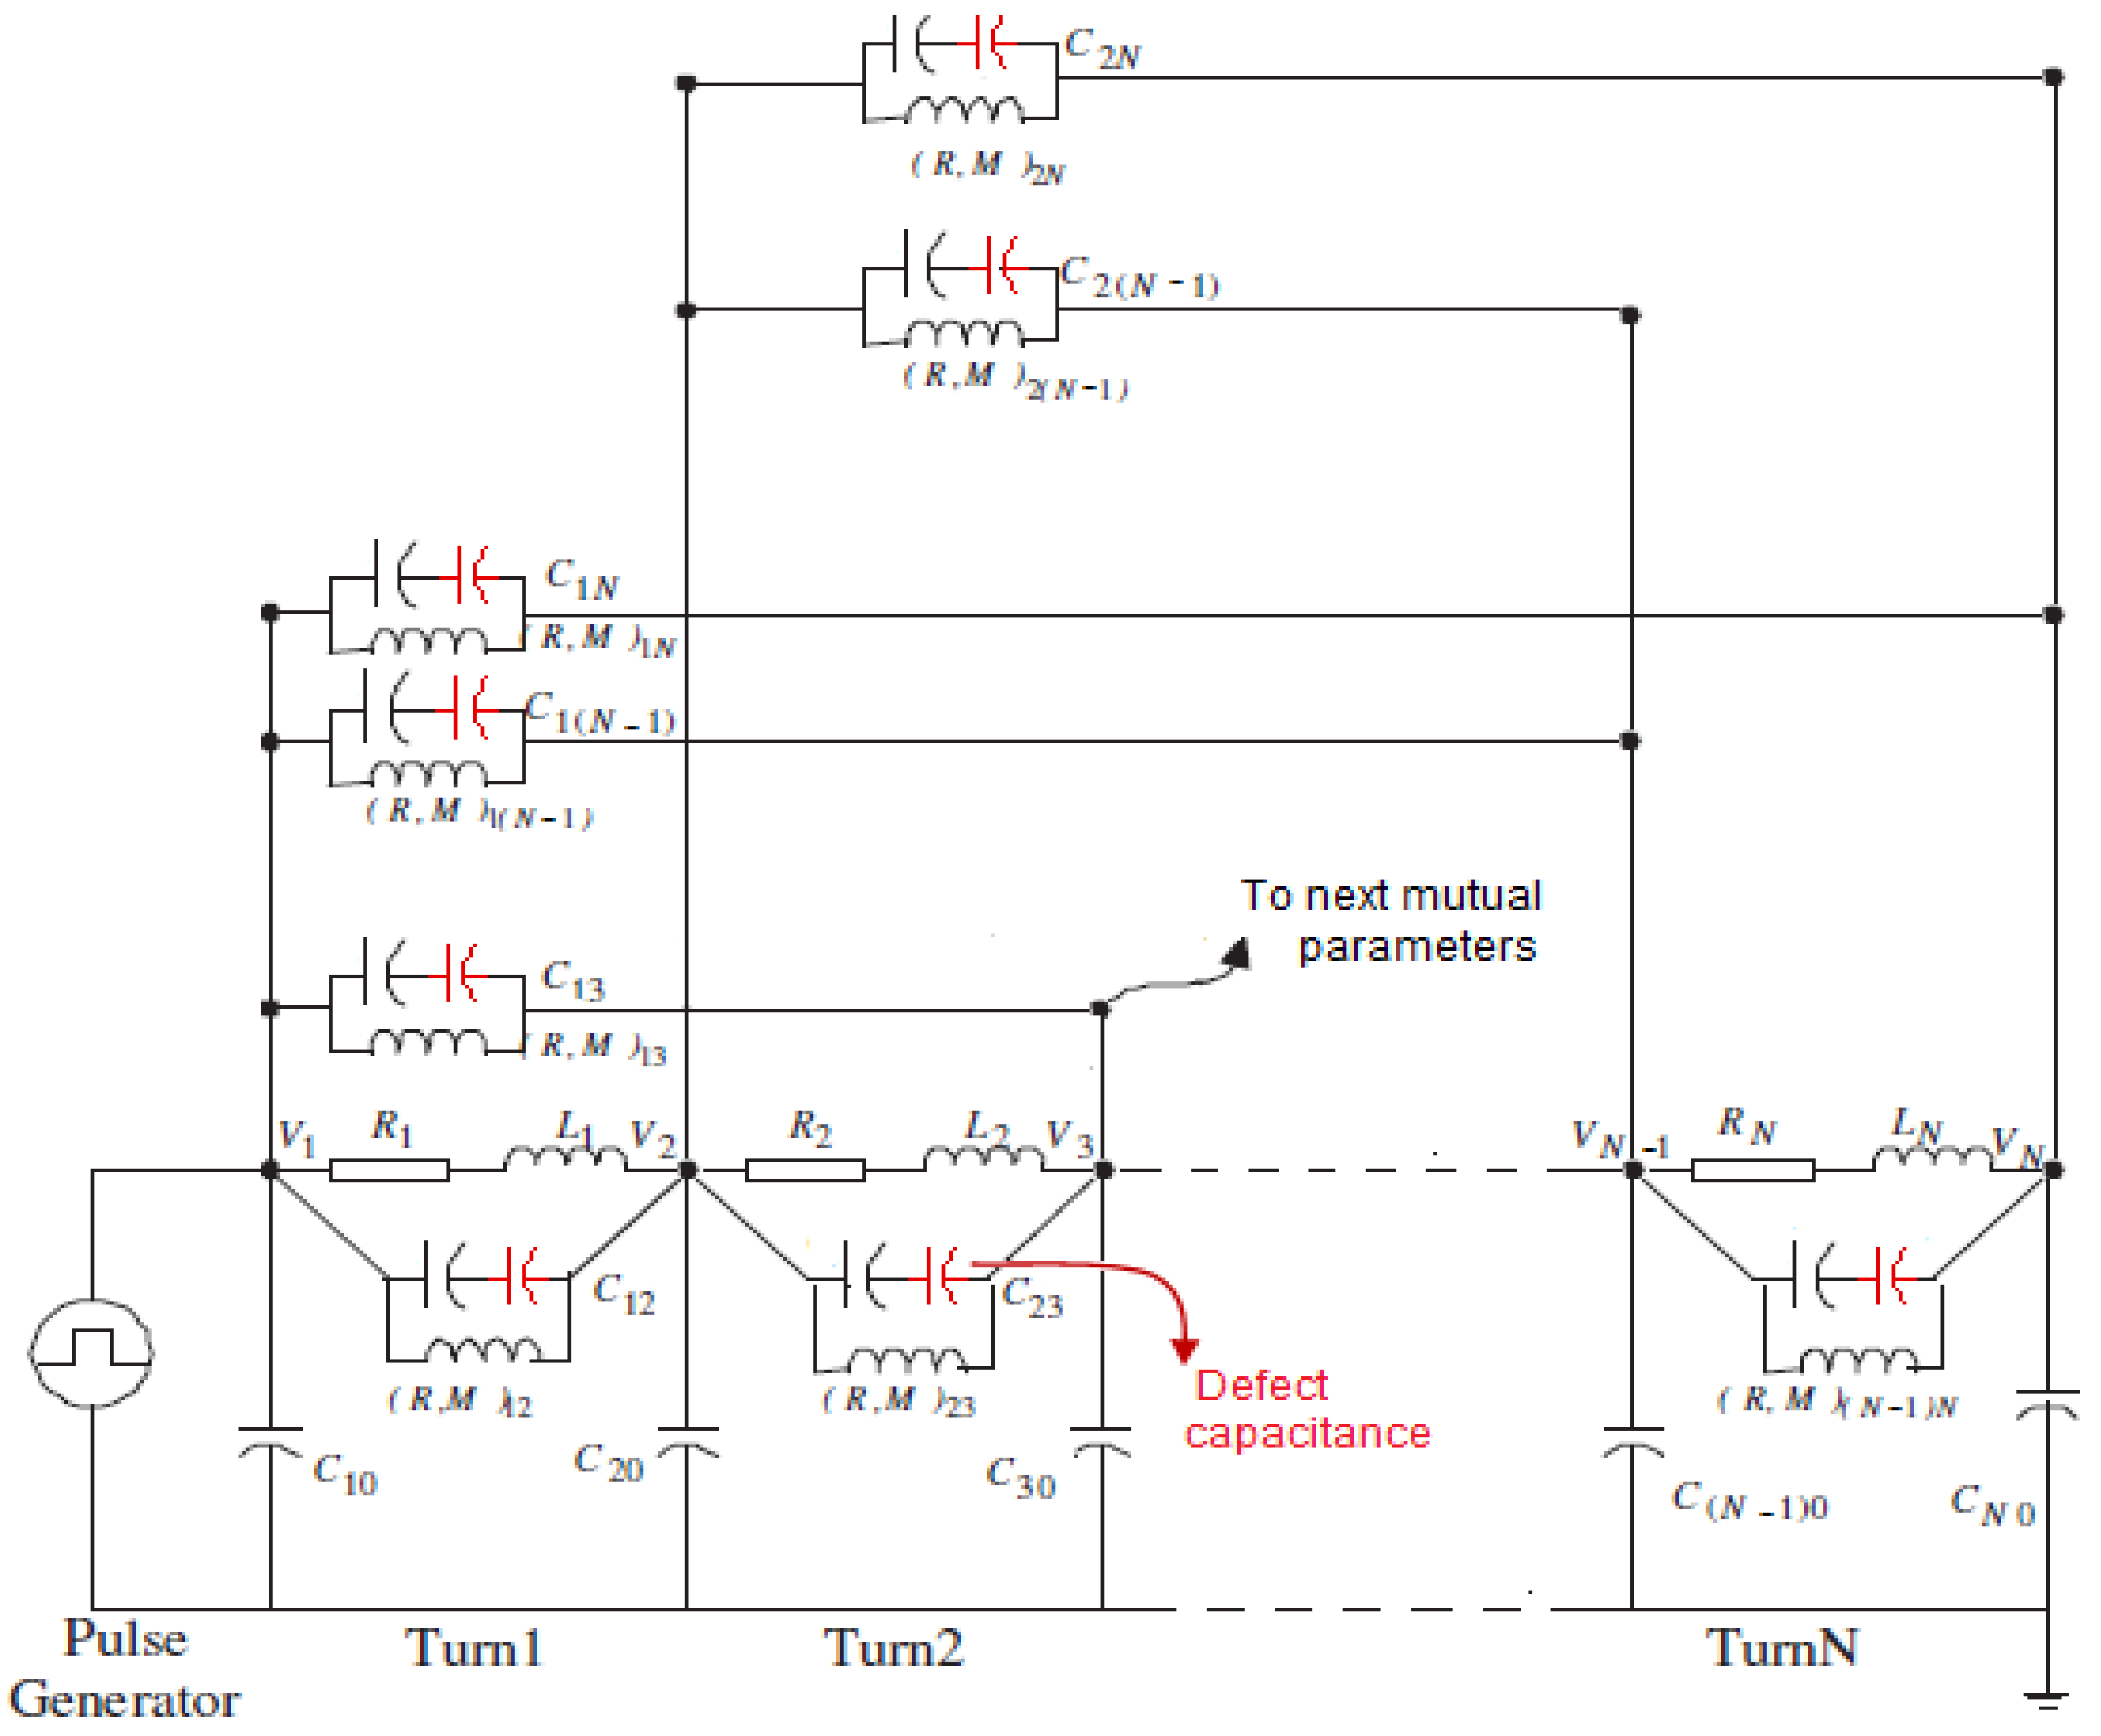
The paper focuses on the investigation of Winding-(EIS) Diagnosis Indicators (DI) through the correlations between the capacitance changes and the resulting Transient Voltage Signature Analysis (VSA) along the turns obtained from the model-based High Frequency Transmission Line Lumped Electromagnetic RLMC-Circuits. These transient voltages initiated by the fast switching in voltage source converters are mainly influenced by the parasitic capacitive components of the drive. Insulation degradation is always linked with a change of capacitance that is considered one of the DI parameters for insulation health state evaluation.
The first part of the paper aims to establish an accurate Finite Element (FE) Electromagnetic (EM) model to compute distributed RLMC-circuits parameters, like resistance (R), self/mutual inductance (L/M) and capacitance (C) between turn-to-ground and between turn-to-turn according to their frequency dependency. Significant improvements are achieved through the correlation between the predominant skin and inductive/capacitive proximity effects and the frequency dependent (R,L,M,C) parameters. Using the Supply Electric Total Current (SETC) process, the frequency-dependent (R,L,M) parameter matrices of the insulated-winding are derived from Finite Element (FE) formulation of the strongly coupled (A-I) model formed by the magnetic field diffusion equation expressed in terms of magnetic vector potential (A), and the total current (I) equation expressed in terms of source, conductive eddy current and displacement eddy current densities. The capacitance matrix, derived from the electrostatic energy, is calculated after sequentially solving the FE formulation of the electrostatic Laplace equation, expressed in terms of electric scalar potential (V). The Floating Electrostatic Potential (FEP) process is used to assign appropriate voltages to the conductor boundaries.
The state of health of the insulation can be assessed by identifying and tracking changes in capacitance; consequently, the second part of this paper describes the insulated-winding high-frequency RLMC-circuit model developed in order to investigate the impact of the turn-to-ground and the turn-to-turn capacitance changes on the transient voltage distribution behavior following various defects. The considered insulation degradation concerns a single turn, turn-to-turn adjacent turns, all turns, and the geometrical thickness insufficiency of the turns’ insulation. Then, the online monitoring system, based on the Transient Voltage Signature along the winding turns is described following changes in the quality of the insulation because of ageing/degradation. This is the guiding idea of the proposed NDT of winding-EIS early diagnosis based on the DI investigation built with the turn-to-turn or turn-to-ground capacitance computed values according to the transient voltage waveform signatures.

2. Insulated Multiconductor Distributed Lumped Electric Circuits

Based on the transmission line approach [16,17,18,19,20], the insulated winding is formed by Nc turns modeled by the distributed lumped electric RLMC-circuits depicted in Figure 1. The electromagnetic parameters associated with each turn i, in the RLMC-circuits are proposed to be the longitudinal resistance (Ri) and self-inductance (Li) of each winding turn, the turn-to-ground capacitance (Ci0), and mutual resistance (Rij) and inductance (Mij), and the capacitive coupling (Cij)between turn i and turn j. The occurrence of the insulation degradation is introduced by the addition of the inter-turn capacitance (defect capacitance) in series with the inter-turn capacitance in the healthy state.

3. Eddy Current Model for R,L,M Matrices Computation

3.1. Magnetodynamic-Total Current (A−I) Model

The magnetodynamic-total Current ( A I ) model is obtained through the coupling between the magnetodynamic equation, expressed in terms of magnetic vector potential ( A ) and the total current ( I ) equation. The total current density ( J t ) is decomposed into source ( J s ) and eddy current densities which are associated with the skin and proximity effects, and the displacement current density is associated with the capacitive effects. The problem becomes two-dimensional in the ( x , y ) plane; the magnetic vector potential only has a z-direction component A = ( 0 , 0 , A z ) . The above two-dimensional problem associated with the coupled ( A I ) model with the associated current flow in each conductor’s ( k ) cross section area ( Ω c k ) is described by the following system of equations:
x y [ ( 1 / μ ) ( x y A z ( x , y ) ) ] j ω ( σ + j ω ε ) ( A z ( x , y ) + G s z ( x , y ) ) = 0 ,
Ω c k j ω ( σ + j ω ε ) A z ( x , y ) d Ω c k + Ω c k j ω ( σ + j ω ε ) G s z ( x , y ) d Ω c k = Ω c k J k t z d Ω c k = I k t ,
where μ is the magnetic permeability, σ is the electric conductivity, and G s z is the modified electric scalar potential associated with the effective source current density. To ensure the solution’s uniqueness, appropriate boundary conditions are required.

3.2. Magnetic-Eddy Current (FE) Formulation

The FE formulation of the ( A I ) model shown in Equations (1) and (2) is based on the first order triangular discretization mesh elements in which the weighted residual method and the approximation function of the magnetic vector potential ( A z ) and the modified electric field ( G s z ) are expressed for each conductor into the discrete form, as follows:
j = 1 N n o d e s Ω [ 1 μ ( x y N i ) ( x y N m ) ] { A s z } d Ω + j = 1 N n o d e s Ω j ω ( σ + j ω ε ) N m { A s z } d Ω + k = 1 N c [ i = 1 N n o d e s Ω c k N i j ω ( σ + j ω ε ) { G s z k } d Ω c k ] = 0 ,
k = 1 N c Ω c k i = 1 N n o d e s ( ( j ω ( σ + j ω ε ) N m ) { A s z } ) d Ω c k + k = 1 N c [ j = 1 N n o d e s N i j ω ( σ + j ω ε ) { G s z k } ] d Ω c k = I k t .
After having expressed Equations (3) and (4) for N n o d e s and N c conductors, the algebraic equation system to be solved is as follows:
[ ( [ K ] [ Q 0 ] [ Q 0 ] t r [ H 0 ] ) + j ω σ ( [ T ] [ Q ] [ Q ] t r [ H ] ) + j ω ( j ω ε ) ( [ K ] [ Q ] [ Q ] t r [ H ] ) ] ( A z G s z ) = ( 0 I k t ) .
The usual finite element stiffness and mass matrices are, respectively, K ( N n o d e s , N n o d e s ) and T ( N n o d e s , N n o d e s ) . The current density matrices of the N c conductors are:
[ Q ] t r = j = 1 N n o d e s ( Ω c 1 ( N m d Ω c m 1 ) Ω c k ( N m d Ω c m k ) Ω c N c ( N m d Ω c m N c ) ) ,
[ G ] = ( G 1 G 2 G k G N c ) ,
[ H ] = j = 1 N c 1 n o d e s Ω c 1 ( d Ω c m 1 ) ( 1 0 0 0 1 0 0 0 1 ) .
The zero matrices are related to the Q 0 ( 1 , N c ) and H 0 ( N c , N c ) matrices. The inductive density, conduction eddy current density, and displacement current density behavioral terms, respectively, expressed with the sub-matrices M A , M A I , and M A D lead to a condensed form of algebraic equations system (5), as follows:
( [ M A ] + j ω σ [ M A I ] + j ω ( j ω ε ) [ M A D ] ) ( A z G s z ) = ( 0 I k t ) .

3.3. Computation of Frequency Dependent R,L,M Parameters

The magnetodynamic-total current ( A I ) coupled model is used to perform the FE analysis from which the frequency-dependent R,L parameter matrices of the insulation multiconductor system are obtained. The sequential Supply Electric Total Current process (SETC) approach is based on an N c supply sequence, such as ( I t , 0 , 0 , , 0 ) , ( 0 , I t , 0 , , 0 ) , ( 0 , 0 , I t , 0 , , 0 ) , until ( 0 , 0 , , I t ) where I t is an arbitrary total current. While each sequence of forced electric total current process is considered for the FE formulation of the coupled magnetic-eddy current ( A I ) models (1)–(2), the related algebraic equation system (5) is solved to get the unknown magnetic vector potential values and the modified electric scalar potential of each conductor mesh node. The source and eddy current terms lead to unknown matrices of resistance and inductance, which are deduced through the impedance expression as follows:
R i k + j ω L i k = [ V i k ] [ I k ] = ( [ J s z ] i k σ [ I k ] ) ( i , k ) = 1 , 2 , , N c .
The indices i = k are related to the resistance ( R i i ) and self inductance ( L i i ) , and the indices i k are related to the ( R i k ) and ( M i k ) mutual resistances and inductances, respectively. The source current density is expressed as J s z = ( j ω σ ) G s z , where G s z is the modified electric scalar potential.

4. Electrostatic Model and Capacitance Matrix Computation

4.1. Electrostatic (FE) Formulation

In general, two approaches can be used to calculate capacitances. The first uses the principle of Electric Charges Source (ECS), and the second is based on the Floating Scalar Electric Potential (FEP) method. However, since the charge density is assumed to be equal to zero in the insulated media, the FEP method consists of applying a fixed voltage magnitude as Dirichlet conditions on the conductors’ boundaries. The electrostatic model expressed in terms of electric scalar potential in the two-dimensional Cartesian ( x , y ) plane obtained from the Maxwell equations is performed to calculate the capacitances according to the insulated multiconductor’s geometry, and the dielectric properties are given as follows:
x y [ ε x y V ( x , y ) ] = 0 ,
V ( x , y ) | Γ d = { V 0 f o r e x c i t e d c o n d u c t o r s 0 f o r g r o u n d o r u n e x c i t e d c o n d u c t o r ,
where V 0 is the applied voltage on the Γ d boundaries and ε is the electric permittivity.
The first order triangular finite element is used to mesh the slot box containing the insulated multiconductor system. Using the weighted residual method with approximation function of the electric scalar potential ( V ), the finite element formulation of Equation (11) with boundary condition (12) is written for each mesh node into the discrete form, as follows:
j = 1 N n o d e s Ω ε [ ( x y N i ) ( x y N j V j ) ] d Ω = Γ e ε V ( x , y ) n n d Γ e ,
where N n o d e s is the total number of nodes, N i is the Galerkine shape function of node i = 1 , , N n o d e s , N j is the approximation function of the electric scalar potential ( V j ) at node j , and Ω is the total region. For each node in the meshed domain, Equation (13), leads to the following algebraic equations system:
[ K ] . { V } = { F } Γ e + { F } Γ d ,
where [ K ] is the stiffness matrix, and { F } Γ e and { F } Γ d are, respectively, the source terms related to the Dirichlet or Neumann boundary conditions.

4.2. Floating Electric Potential for Capacitance Computation

The extraction of a capacitance matrix that corresponds to the insulated multiconductor structures is vital to achieve a reliable design of the electrical machine under fast switching drive. Afterwards, if the insulation-winding system has N conductors, the ( N , N ) capacitance matrix with N 2 unknown elements is calculated from the stored electrostatic energy, according to the electric scalar potential distribution, obtained while the FE-based electrostatic model (11) is solved N ( N + 1 ) / 2 times.
The electrostatic energy of the ith and jth conductors under the voltage potentials V i and V j , respectively, is expressed as follows:
W i j = 1 2 Ω c ( ε ( x y V ( x , y ) ) 2 ) d Ω ,
W i j = 1 2 i = 1 N c ( C i i V i 2 + C j j V j 2 2 C i j ( V i V j ) ) ,
where C i i is the ith turn capacitance corresponding to the diagonal terms of the capacitance matrix, and C i j is the ith turn-to-jth turn-to-turn capacitance, corresponding to the upper or lower diagonal terms of the capacitance matrix (17).
[ C ] = ( C i j C i 0 + j = 1 , j i N c C i j C j i ) ,

4.3. Turn-to-Ground Capacitances

During the electrostatic (FE) analysis with the Floating Electric Potential process (FEP), an arbitrary voltage ( V ) is sequentially imposed on the conductor’s ( i = 1 , , N n o d e s ) boundary nodes as a Dirichlet condition, and zero voltage ( 0 V ) is assumed for all other conductors. While the electric potentials are known from the electrostatic equation solution, the turn-to-ground electrostatic energy ( W i 0 ) can be obtained as follows:
W i i = 1 2 V 2 C i i = 1 2 V 2 ( C i 0 + ( i j ) = 1 N c C i j ) .

4.4. Turn-to-Turn Capacitances

The same arbitrary voltage ( V ) is imposed on the boundary nodes of conductors i and j as Dirichlet conditions, and zero voltage ( 0 V ) is assumed for all other conductors. From the computed electric potentials, the turn-to-turn electrostatic energy ( W i j ) is obtained as follows:
W i j = 1 2 V 2 ( C i 0 + C j 0 + ( k ( i , j ) ) = 1 N c ( C i k + C j k ) ) .
The Floating Electric Potential process is applied until W ( N c 1 ) N c . Since there are ( N c , N c ) unknown capacitances, N c ( N c 1 ) / 2 equations are needed. The added equations concern the capacitance symmetry conditions, as follows:
( C i j C j i ) i j = 0 .

5. Results and Discussion

5.1. The Studied Winding-EIS

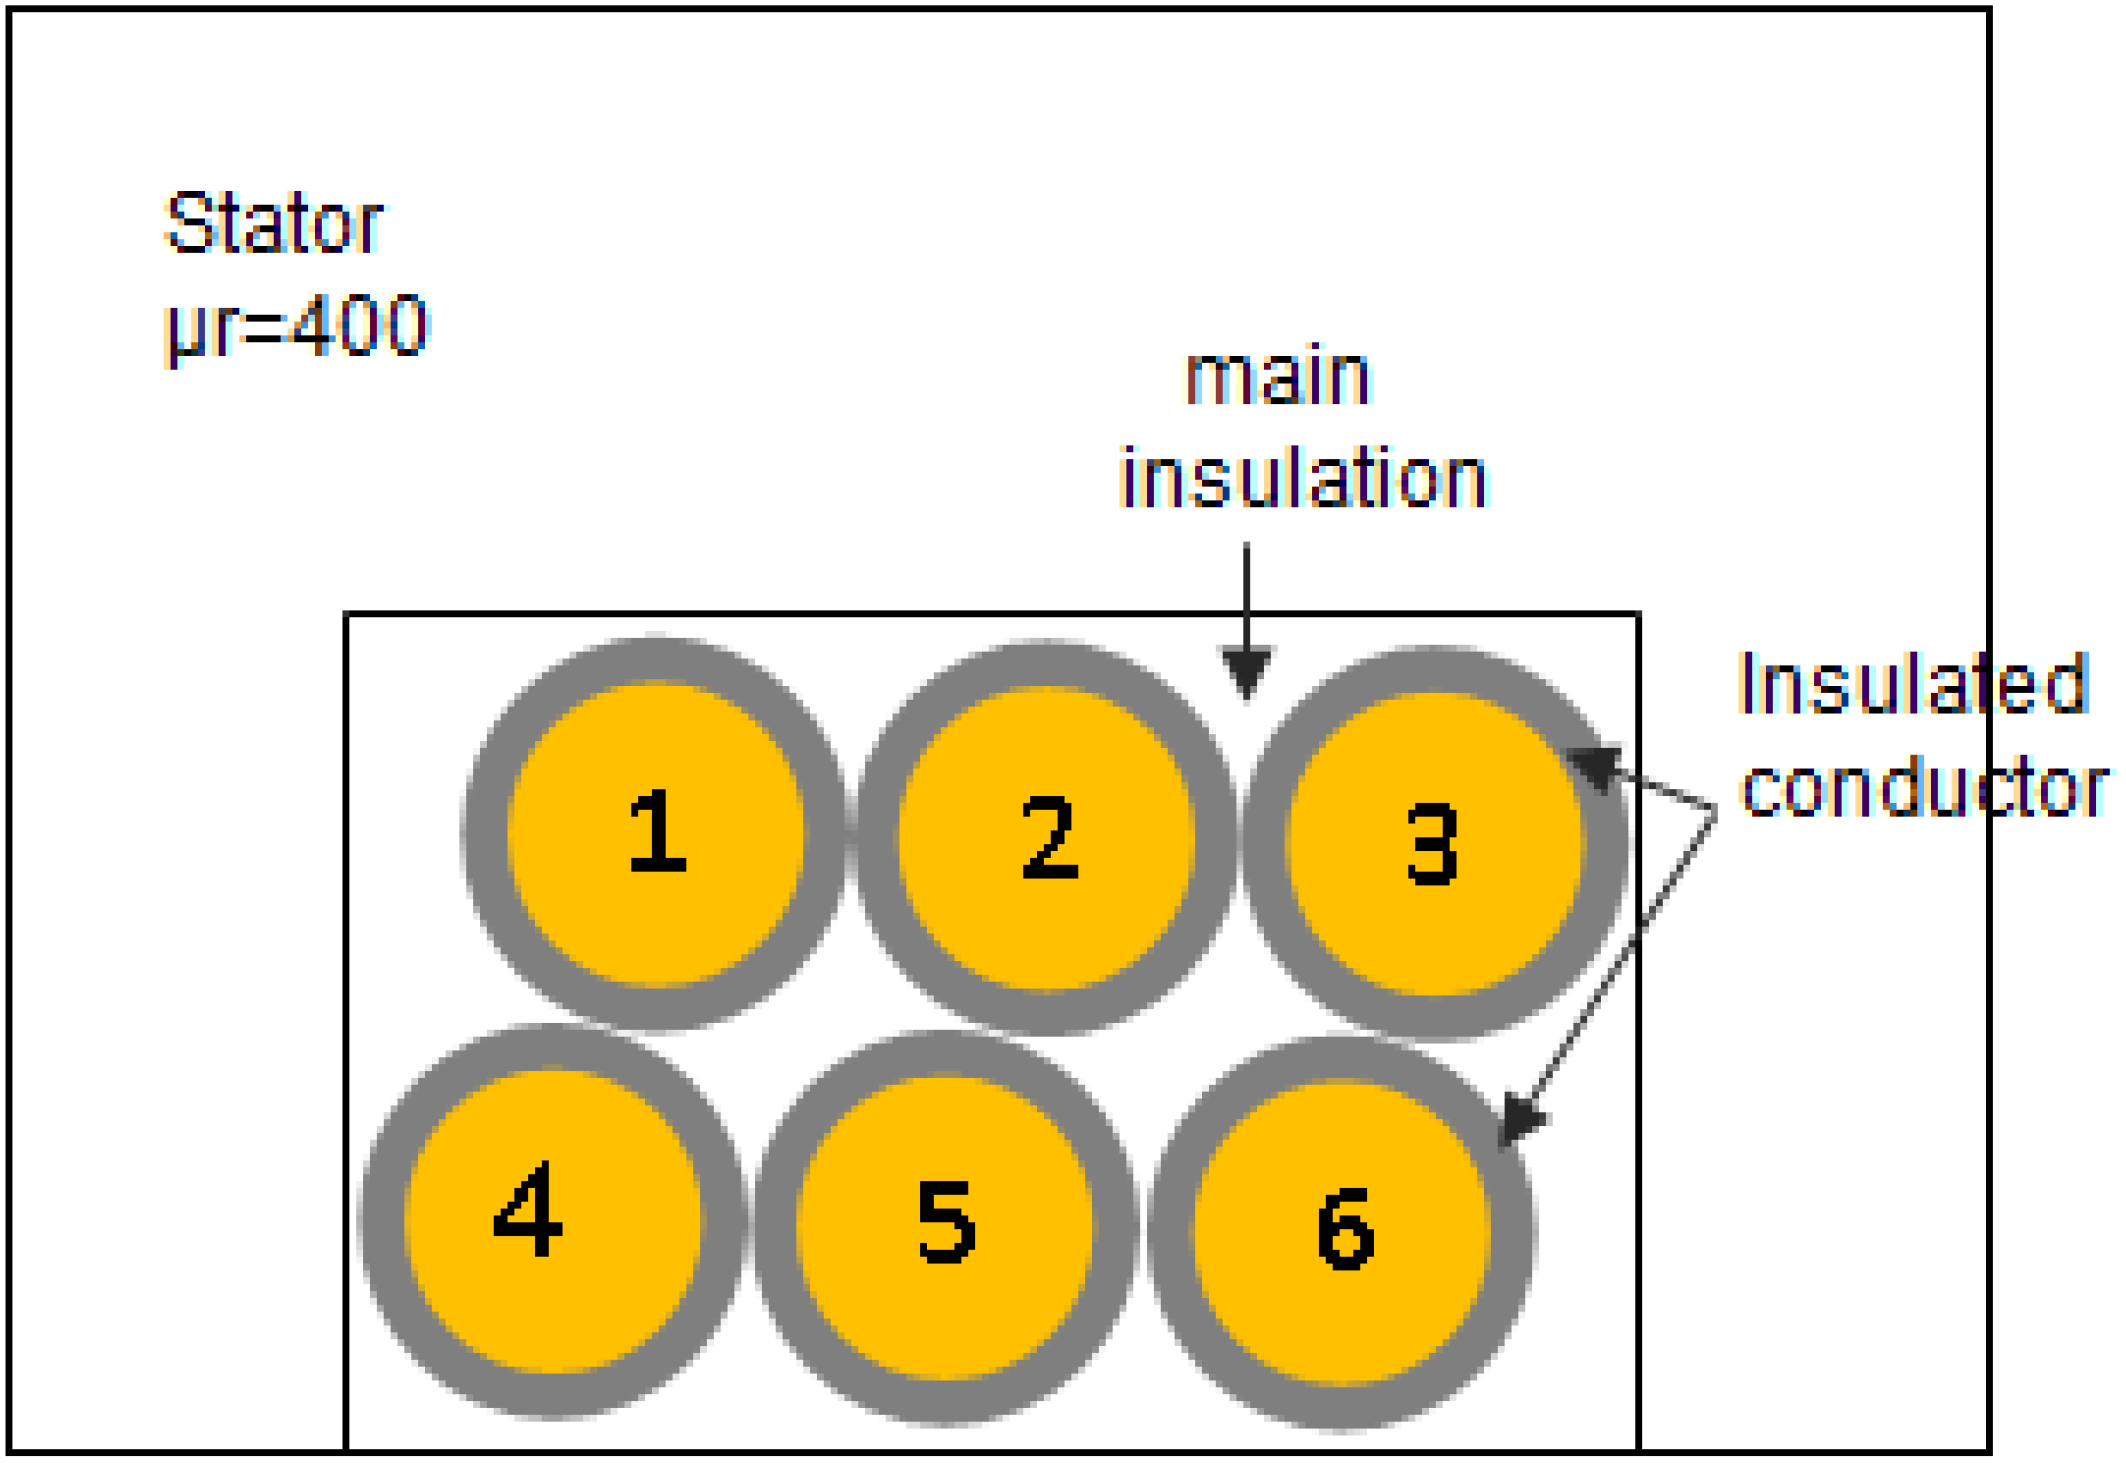
The studied winding-EIS presented in Figure 2 consists of six isolated conductors of 1.25 mm diameter and 0.04 mm insulation thickness. The conductors made of copper are surrounded by an insulation material with an electric permittivity of ε r = 3.4 . The permittivity of the main insulation is ε r = 7 .
The conductors are fed by a steep voltage source magnitude of 300 Volts with an 85 ns rise time which corresponds to an average switching frequency converter of 10 MHz. The emulated ageing/degradation scenarios of the Winding-EIS concerns, firstly, the sensitive changes in the insulation dielectric properties relating to the single turn(1st), two adjacent consecutive turns (1st and 2nd) and complete turns, and secondly, the reduction in insulation thickness associated with the corrosion/oxidation process occurring on the internal insulation coating. Variations of insulated capacitances (IC) are well known as being equivalent to a variation of physical properties and geometrical characteristics associated with various degrees of insulation degradation.

5.2. Frequency-Dependent RLMC-Cicuit Parameter IC Indicators

The self and turn-to-turn capacitance values according to healthy and degraded insulation computed from the electrostatic model are summarized in Table 1.
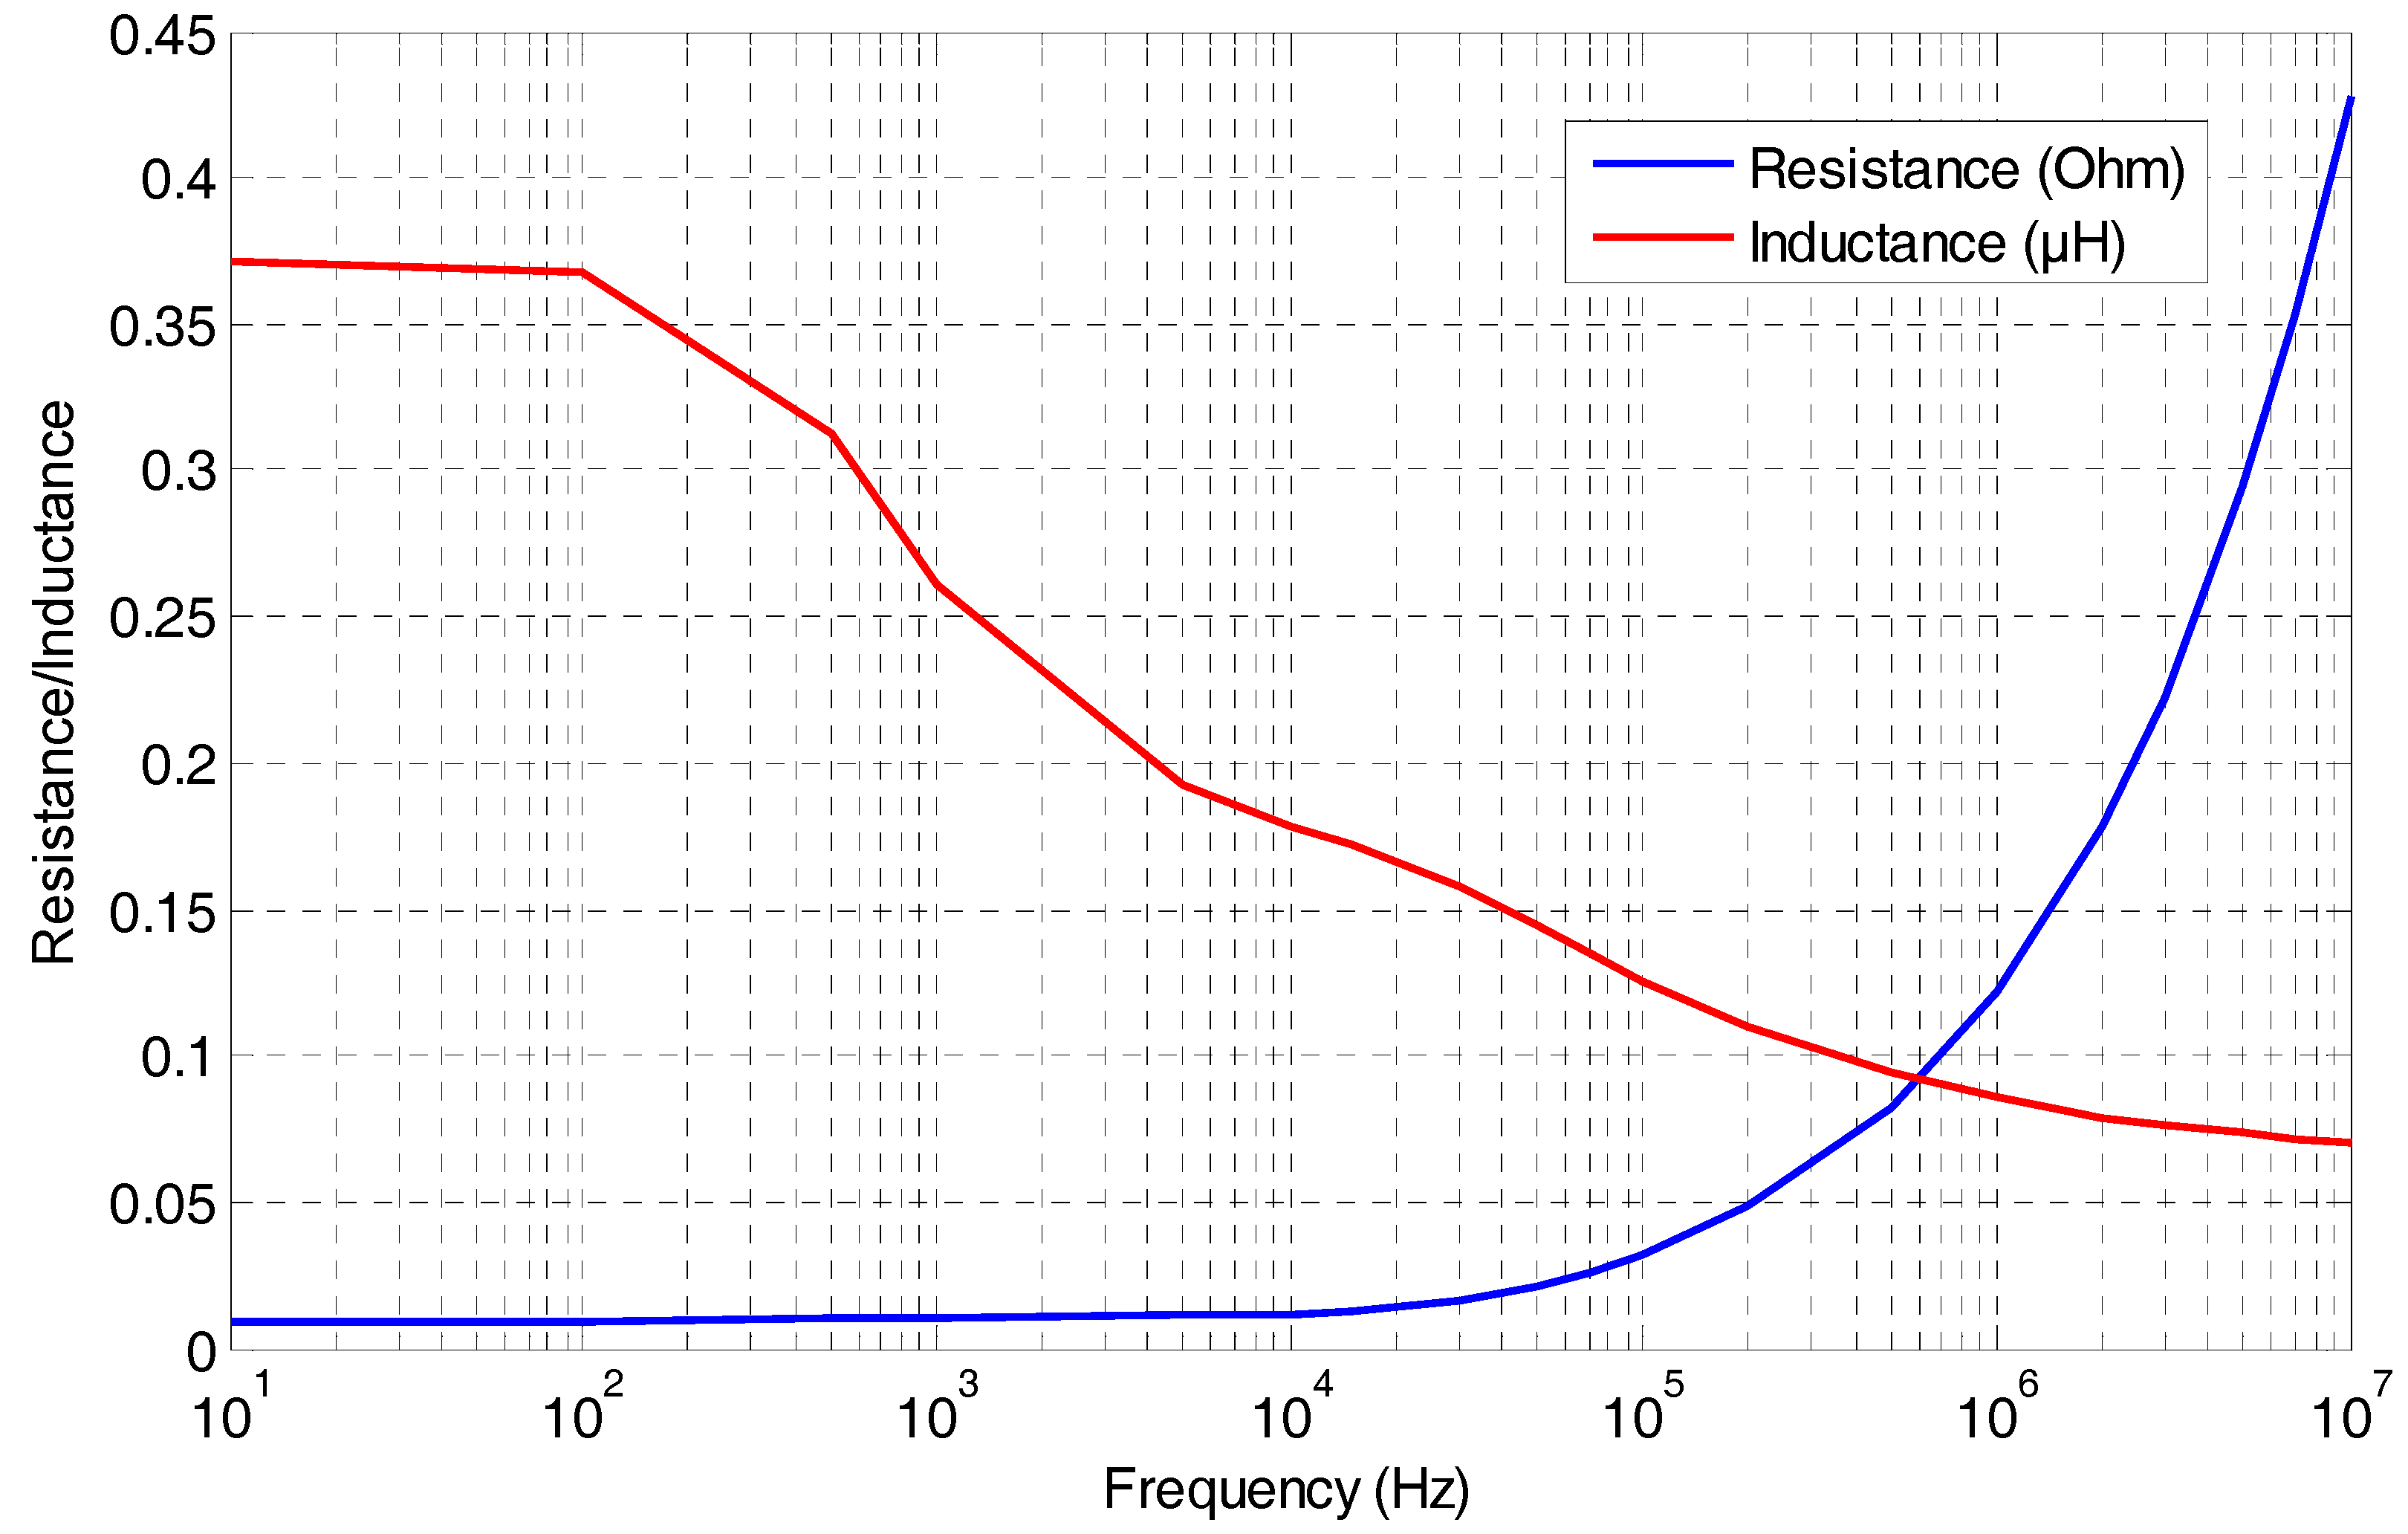
The frequency-dependent resistances and inductance values summarized in Table 2 were determined from the FE formulation of the strongly-coupled magnetodynamic-total current model (A−I) using the Supply Electric Total Current (SETC) process. The average resistance and self inductance trends according to frequency are given in Figure 3.
When high frequencies are used, the induced eddy current density shaped by the skin and proximity effects tends to flow at the conductor surface with an average skin depth. The main cause of the skin effect is the eddy currents inside the conductor, which increase with increasing frequency. The proximity effect originating from inductive coupling between the conductors due to their magnetic fields non-uniformity causes the current density in one conductor to be influenced by surrounding conductors.
According to the frequency ranges, the predominance of the skin or proximity effects leads to an increase in resistance and associated skin losses and decrease in inductance through magnetic energy minimization, as confirmed by Figure 3, which shows a good trend with the referenced results [21,22,23,24].
From the results given in Table 1, we can note that the variation in the relative permittivity and the turn insulation thickness due to degradation of the insulation directly causes an increase in the turn-to-turn capacitance compared with healthy values. Otherwise, a significant amount of dielectric deterioration will result, causing increased capacitances between 1% and 5%, and the insulation thickness reduction will also result in additional capacitance over 5%. Moderate capacitance changes lead to the initiation of degradation or the ageing of the insulation, whereas for a significant capacitance increase due to deterioration or corrosion/oxidation, the insulation quality is considerably affected, and consequently, the initiation of inter-turn short circuits is highly probable.

5.3. Transient Voltage Distribution Results

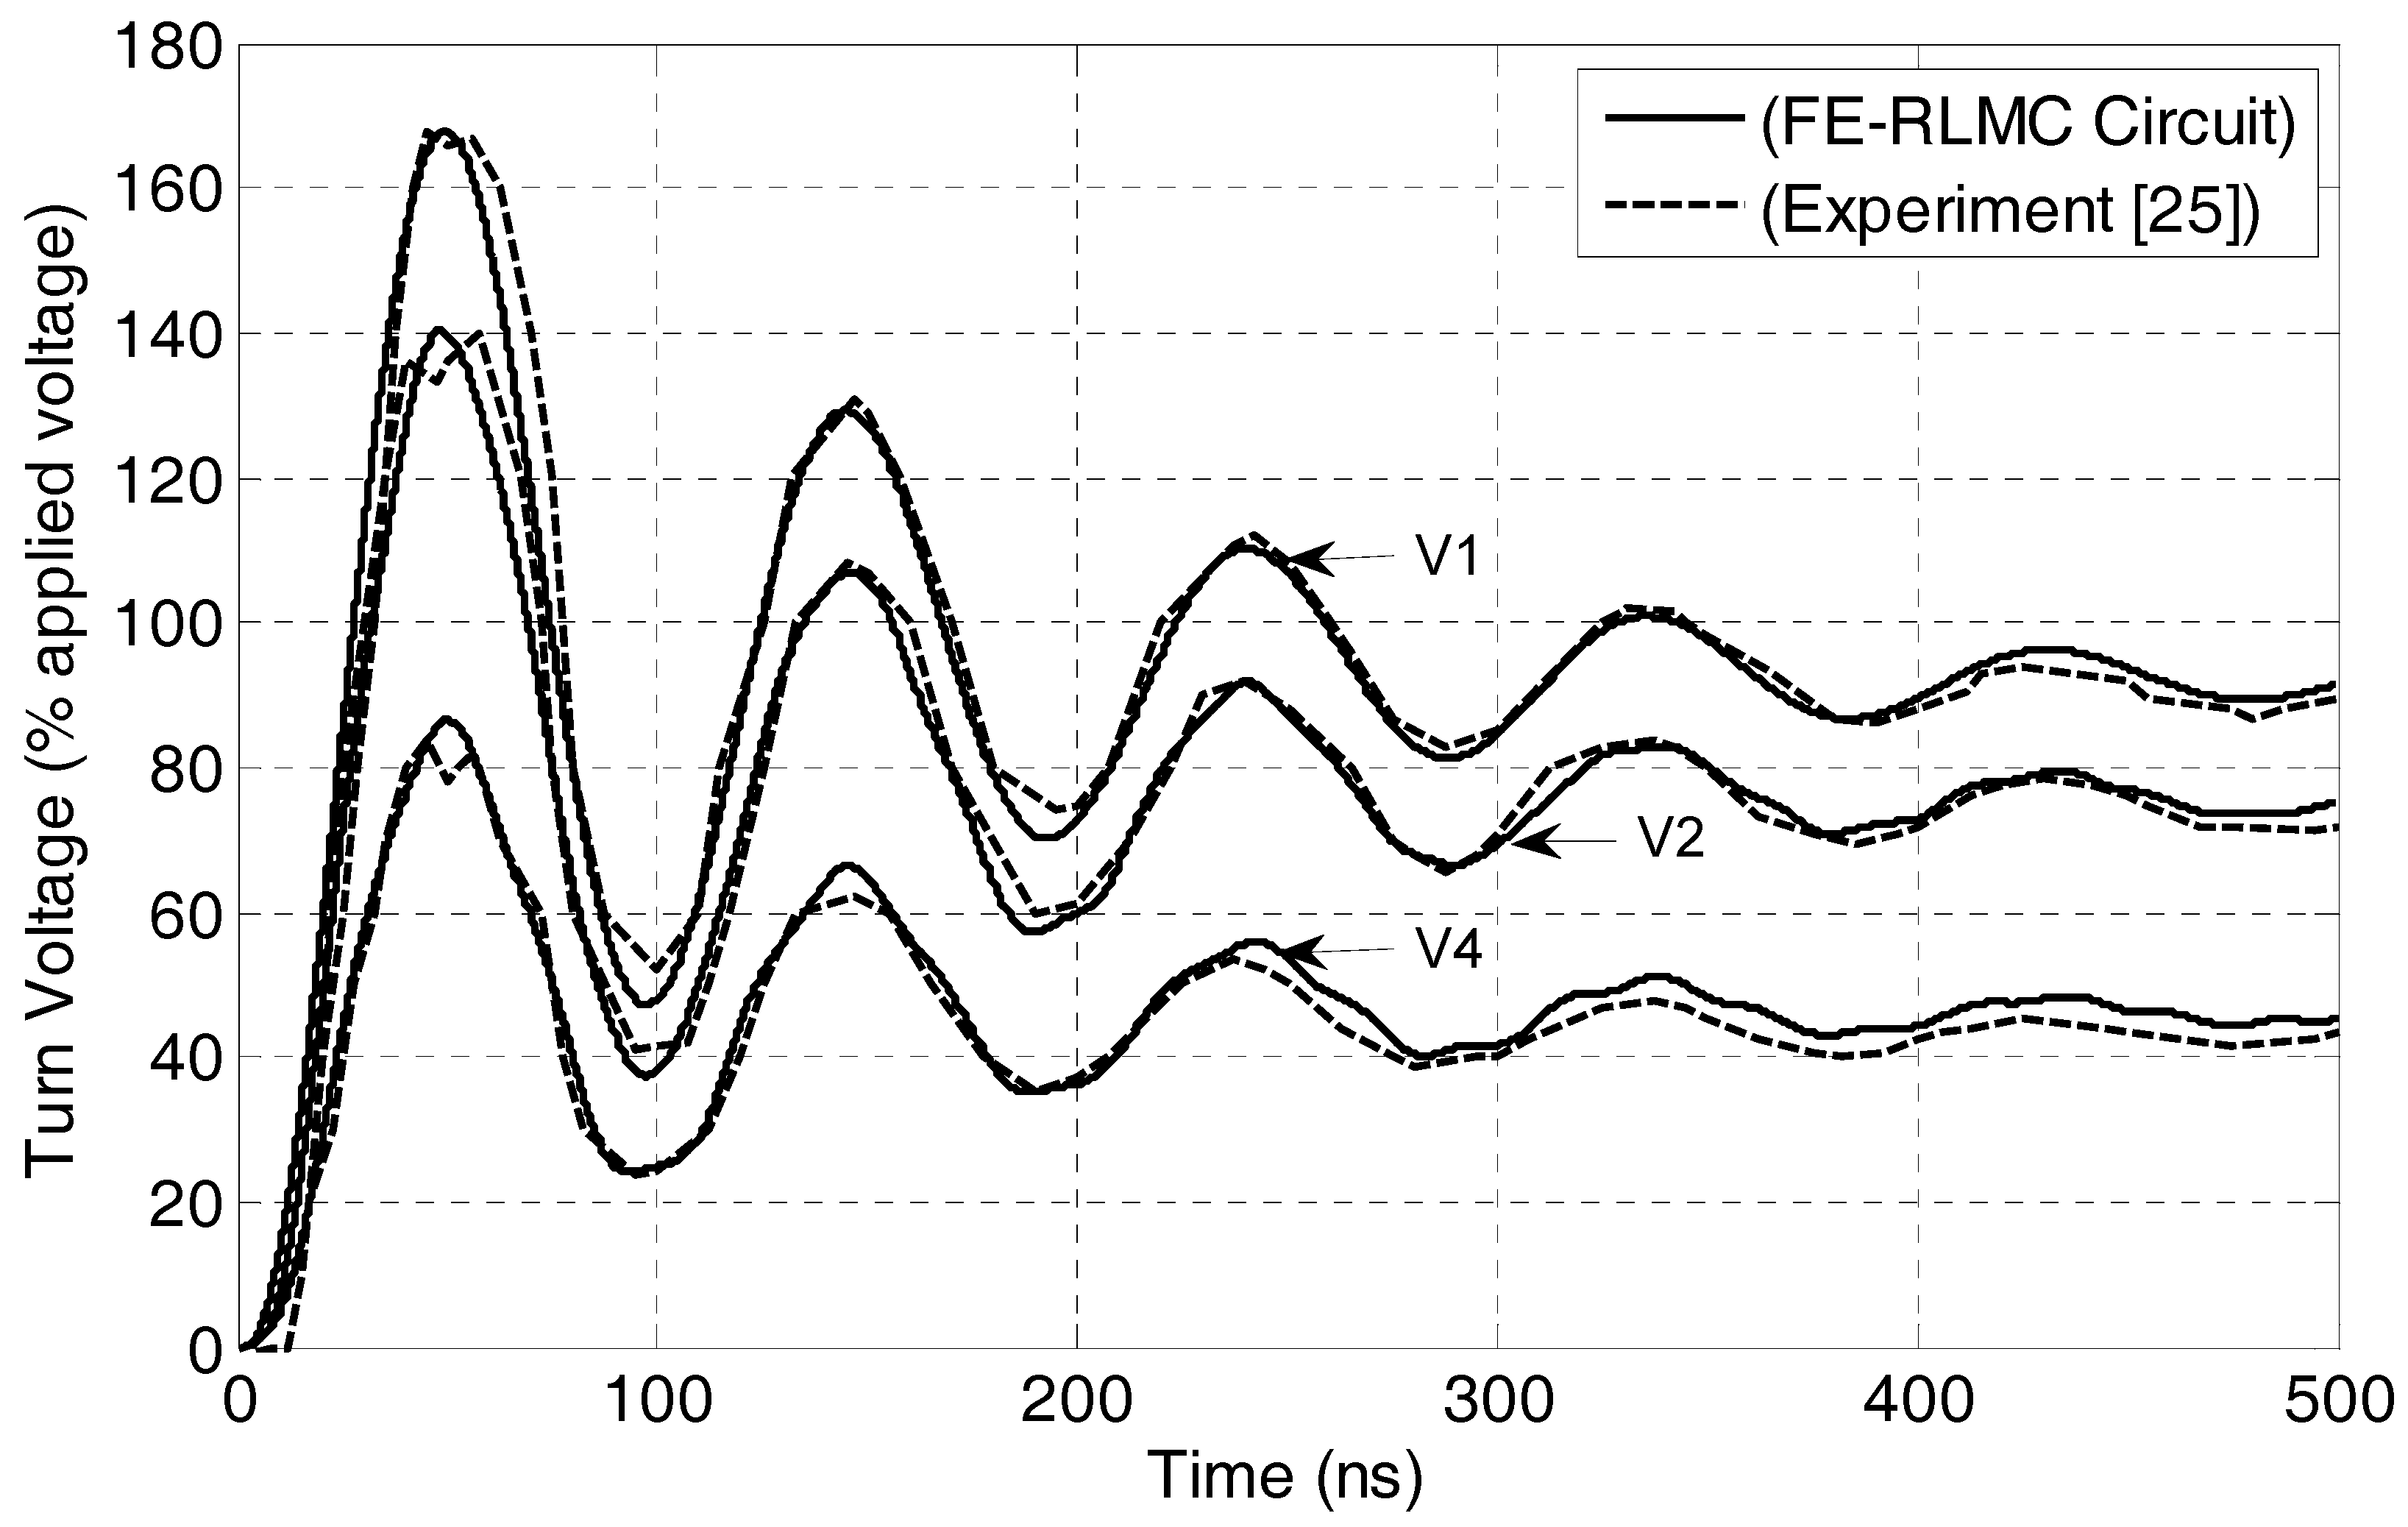
The lumped electric RLMC-circuit simulation block of the insulated winding implemented with Matlab-Simulink software permitted the analysis of the step-fronted voltage response of each turn during healthy operation. The effectiveness of models is established through the comparison between the obtained results related to transient voltage distribution along the winding and the referenced experiment’s results [25]; these are presented in Figure 4 and shows good agreement.

5.4. Model Validation and Discussion

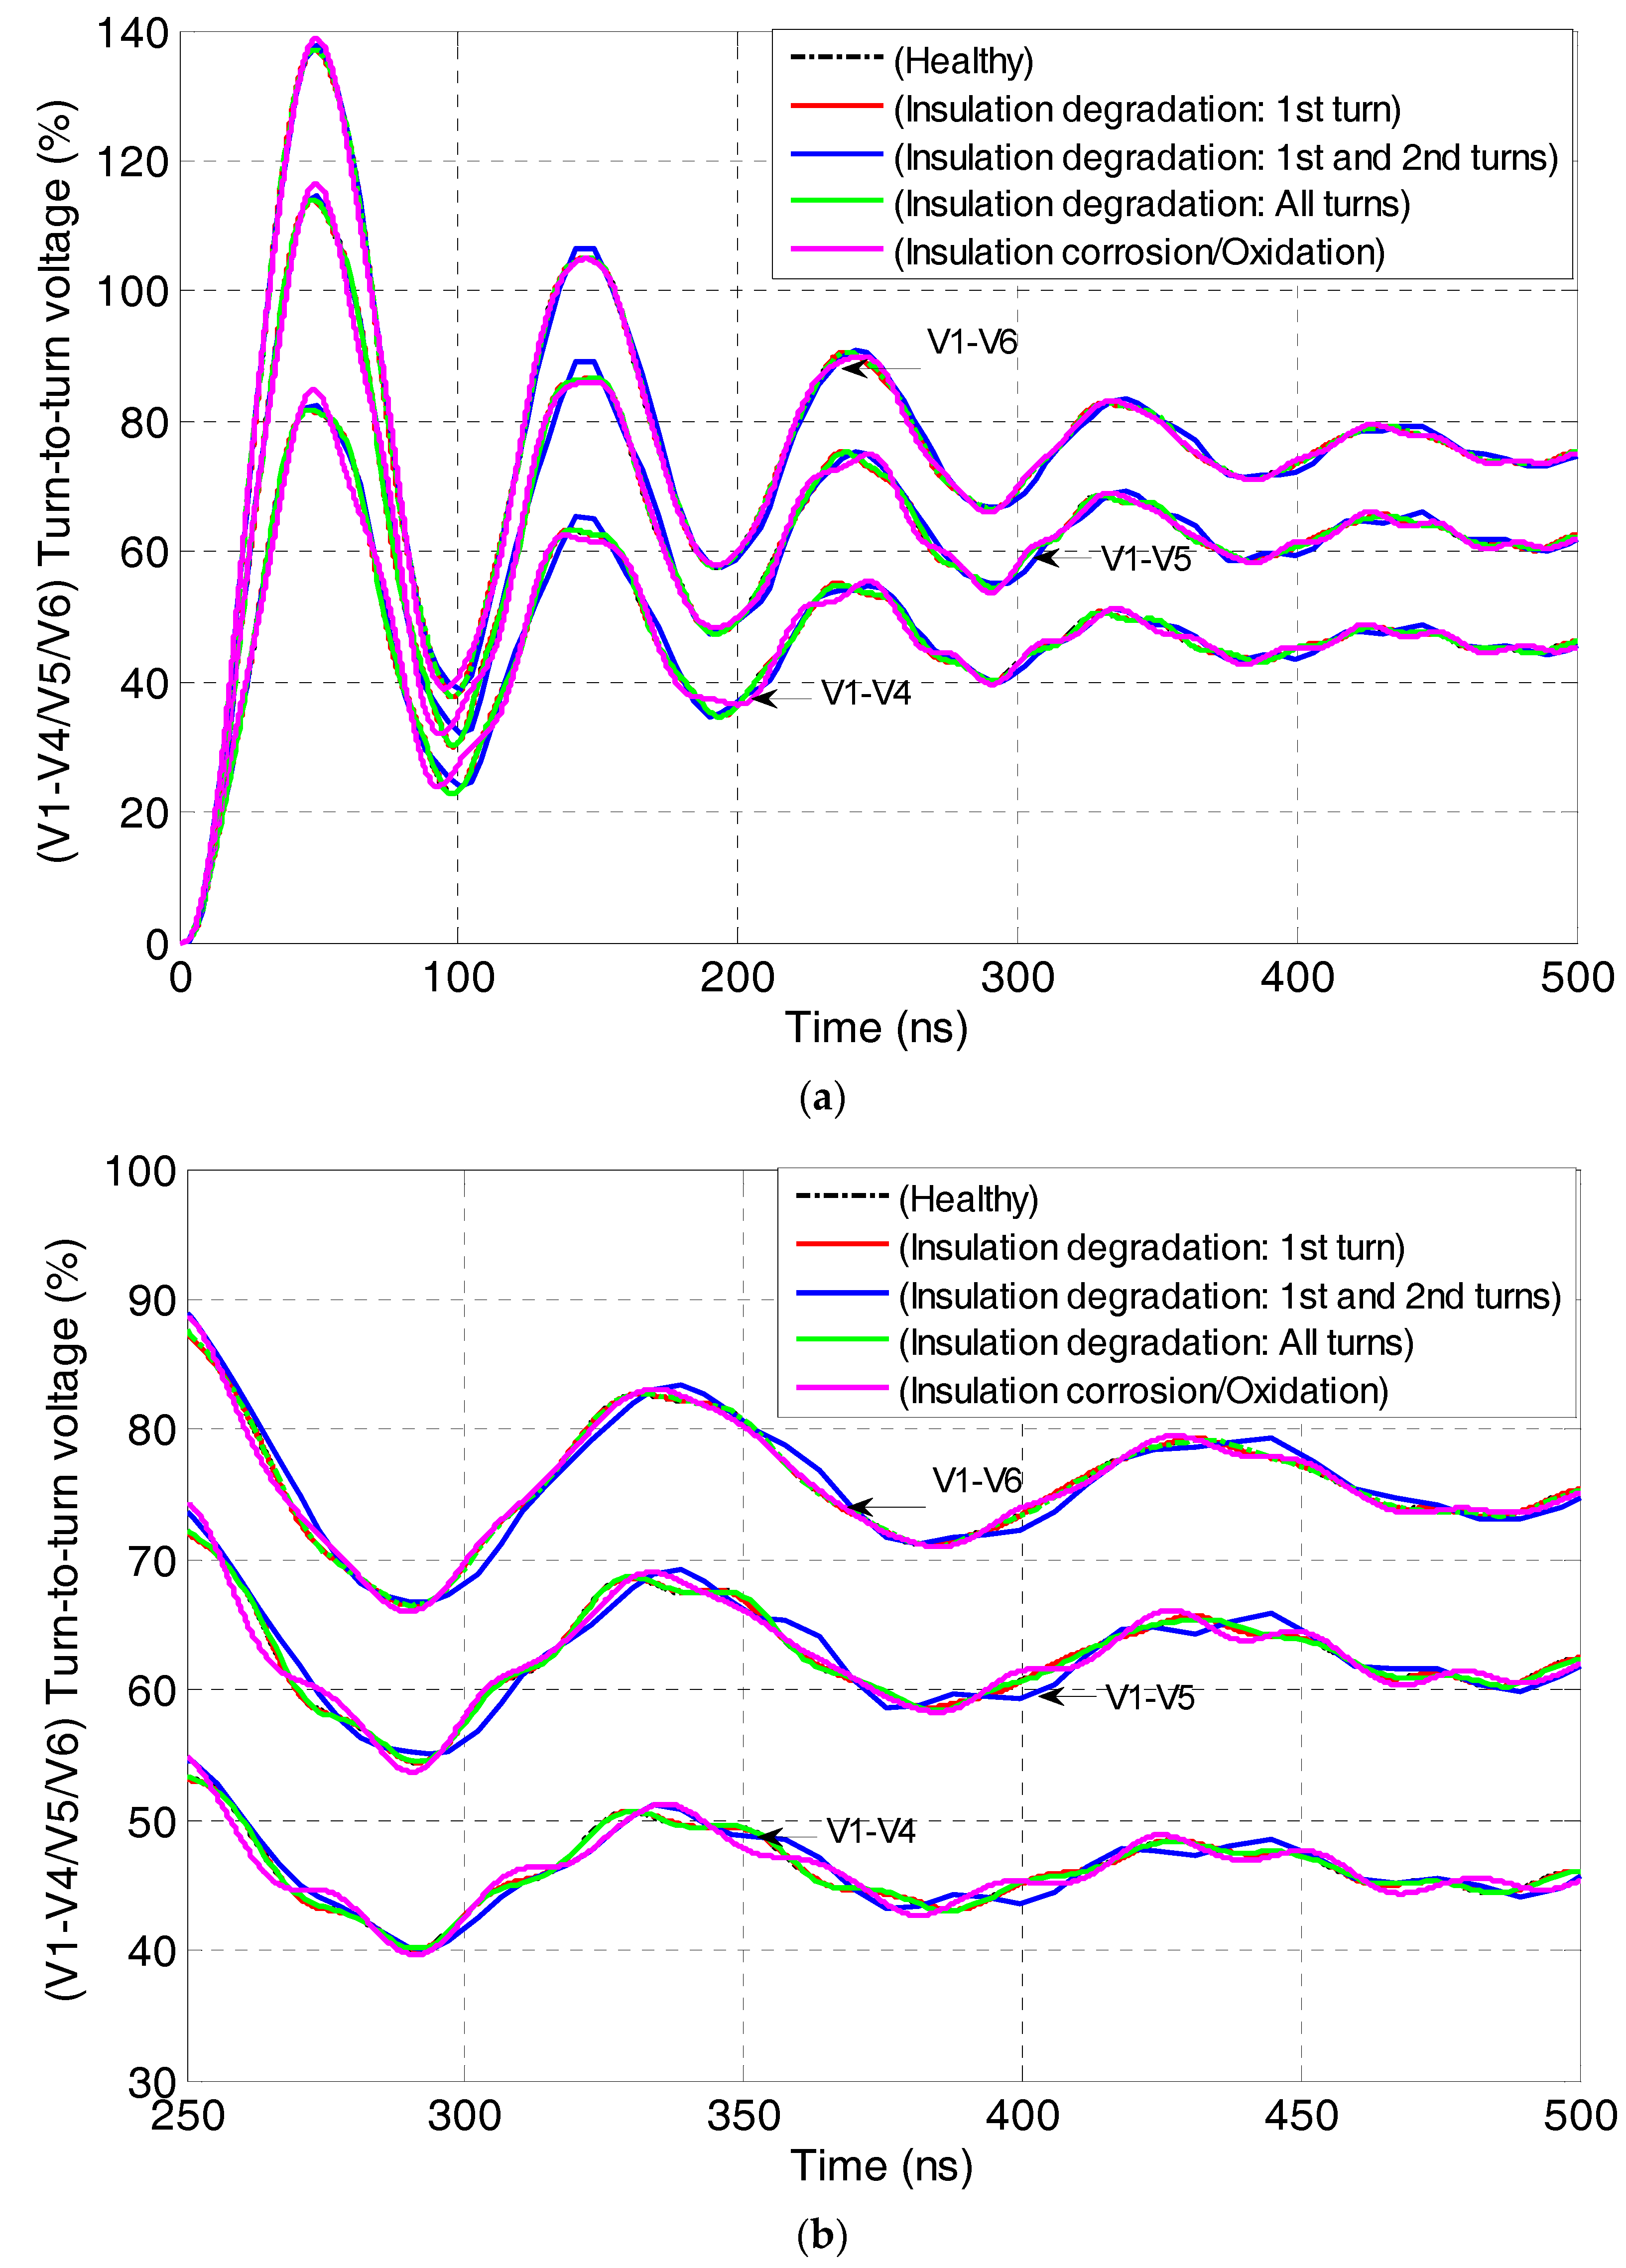
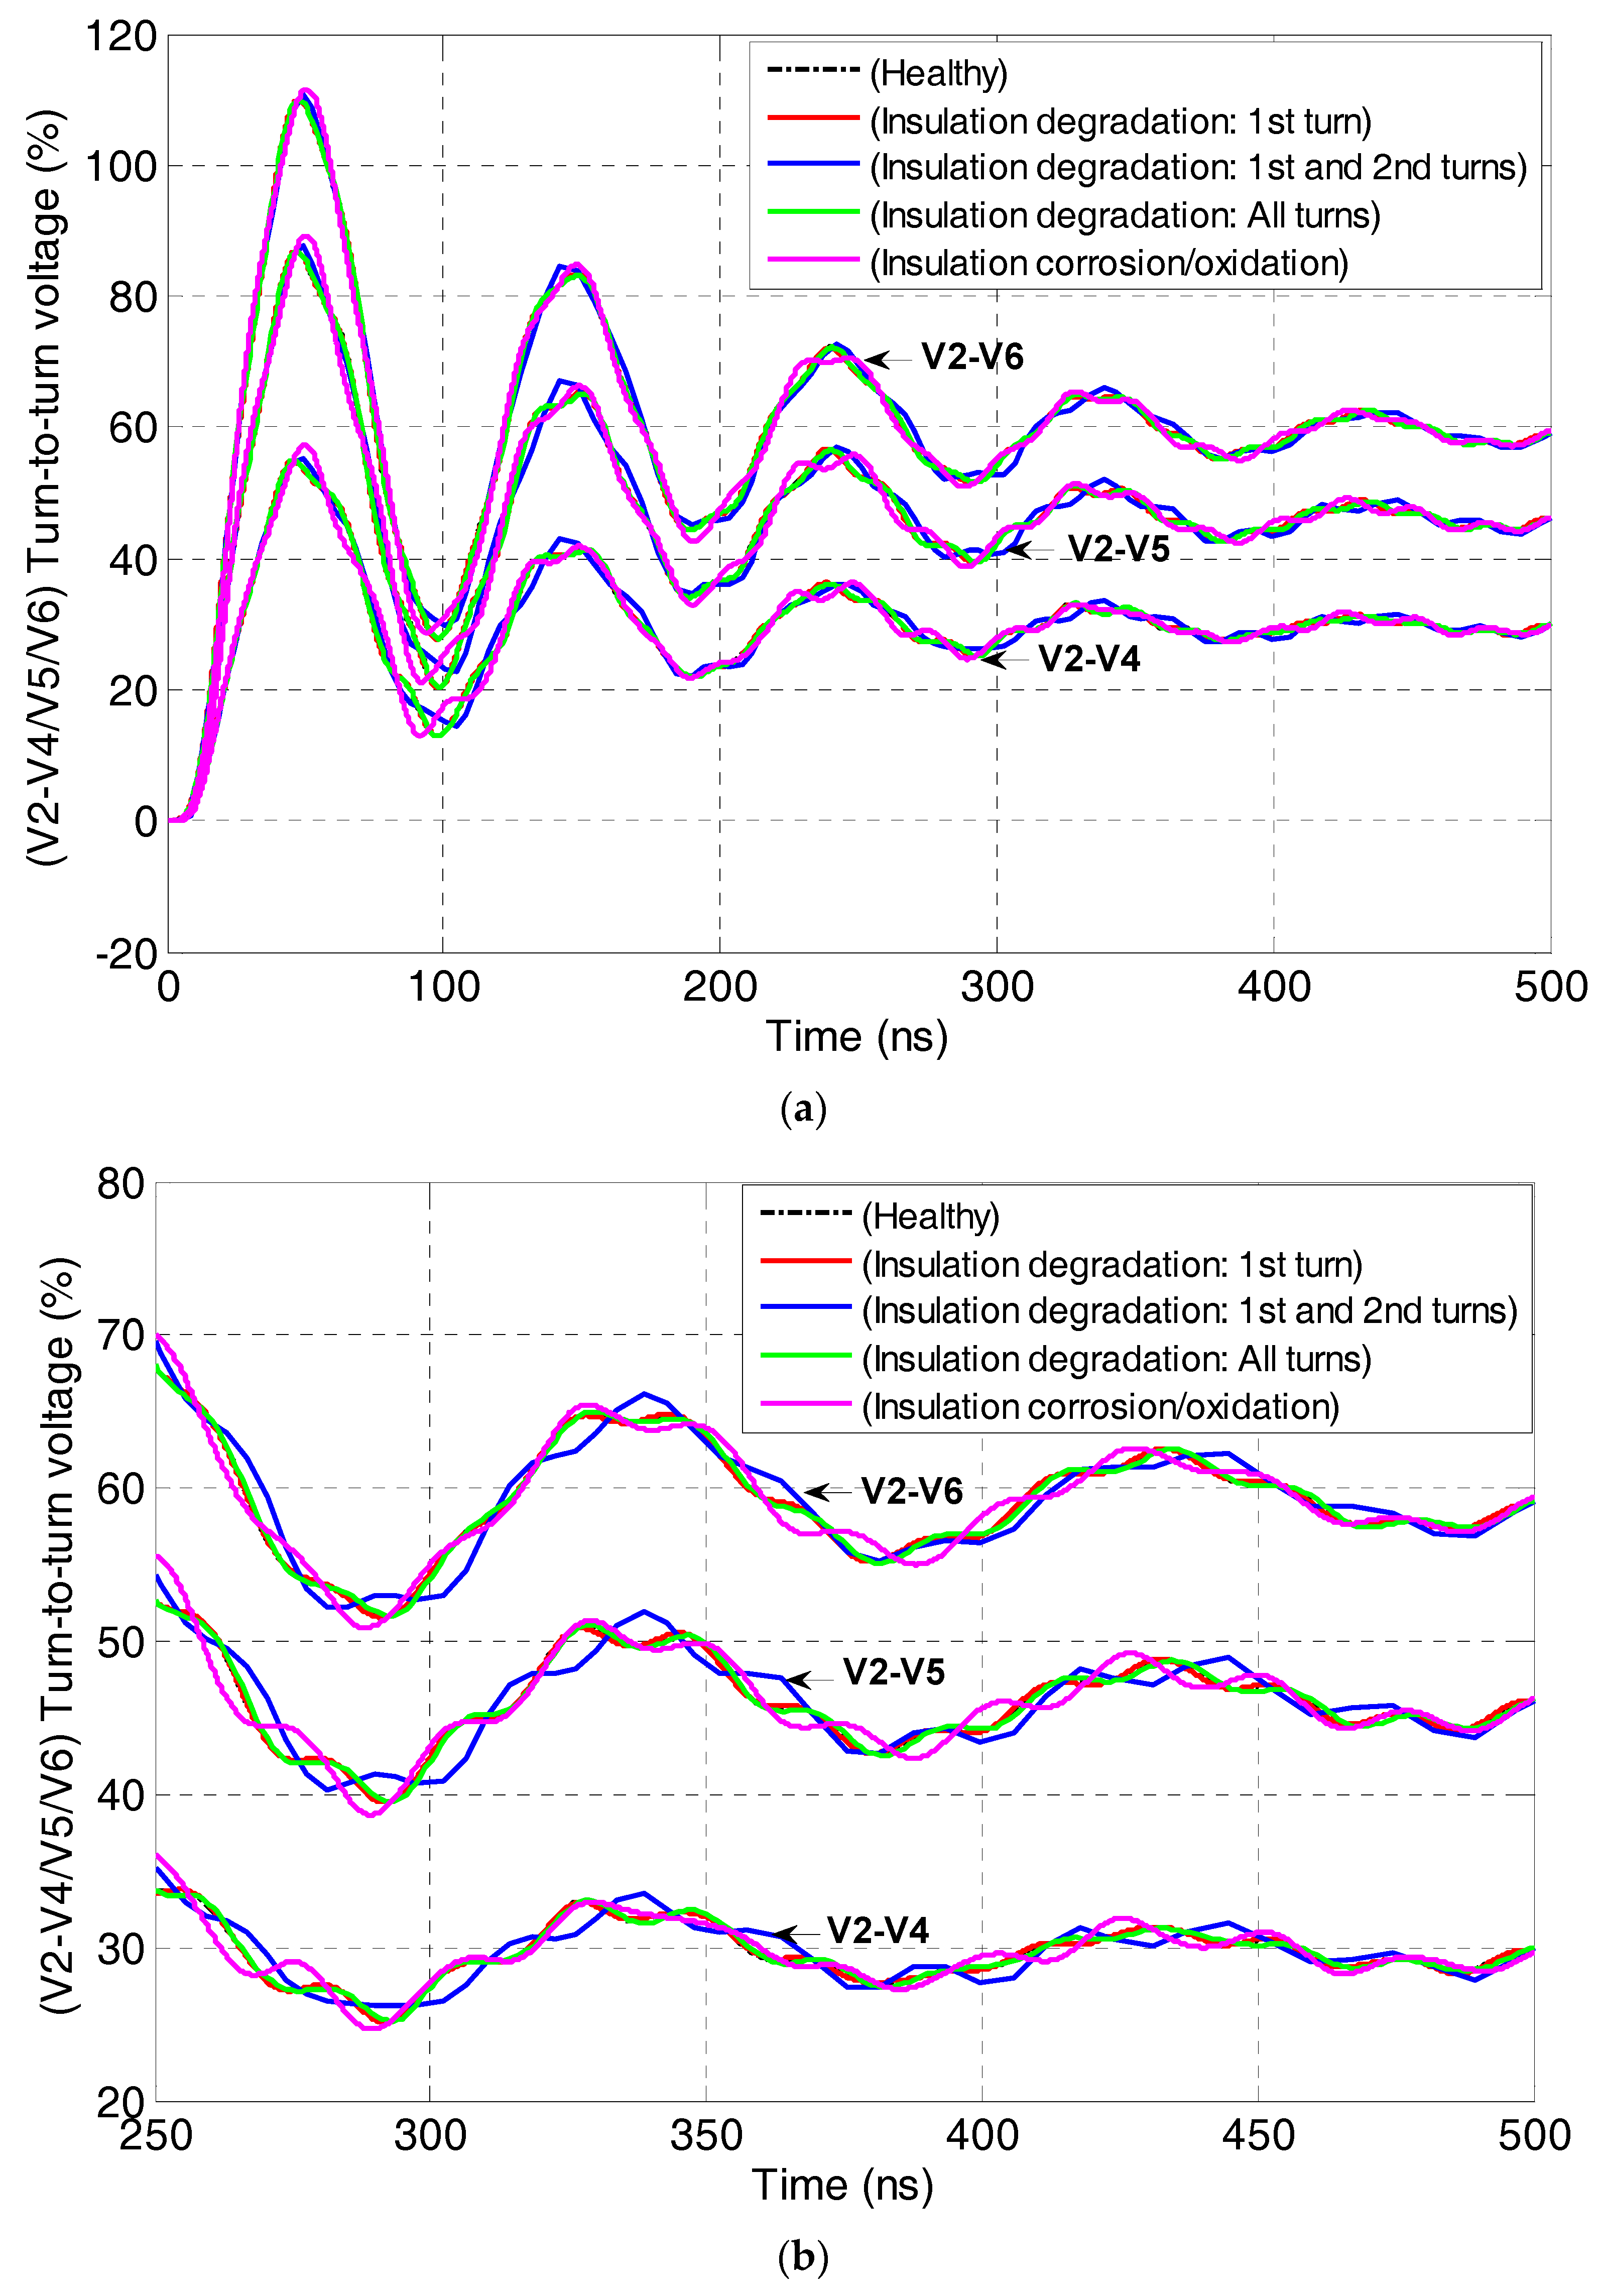
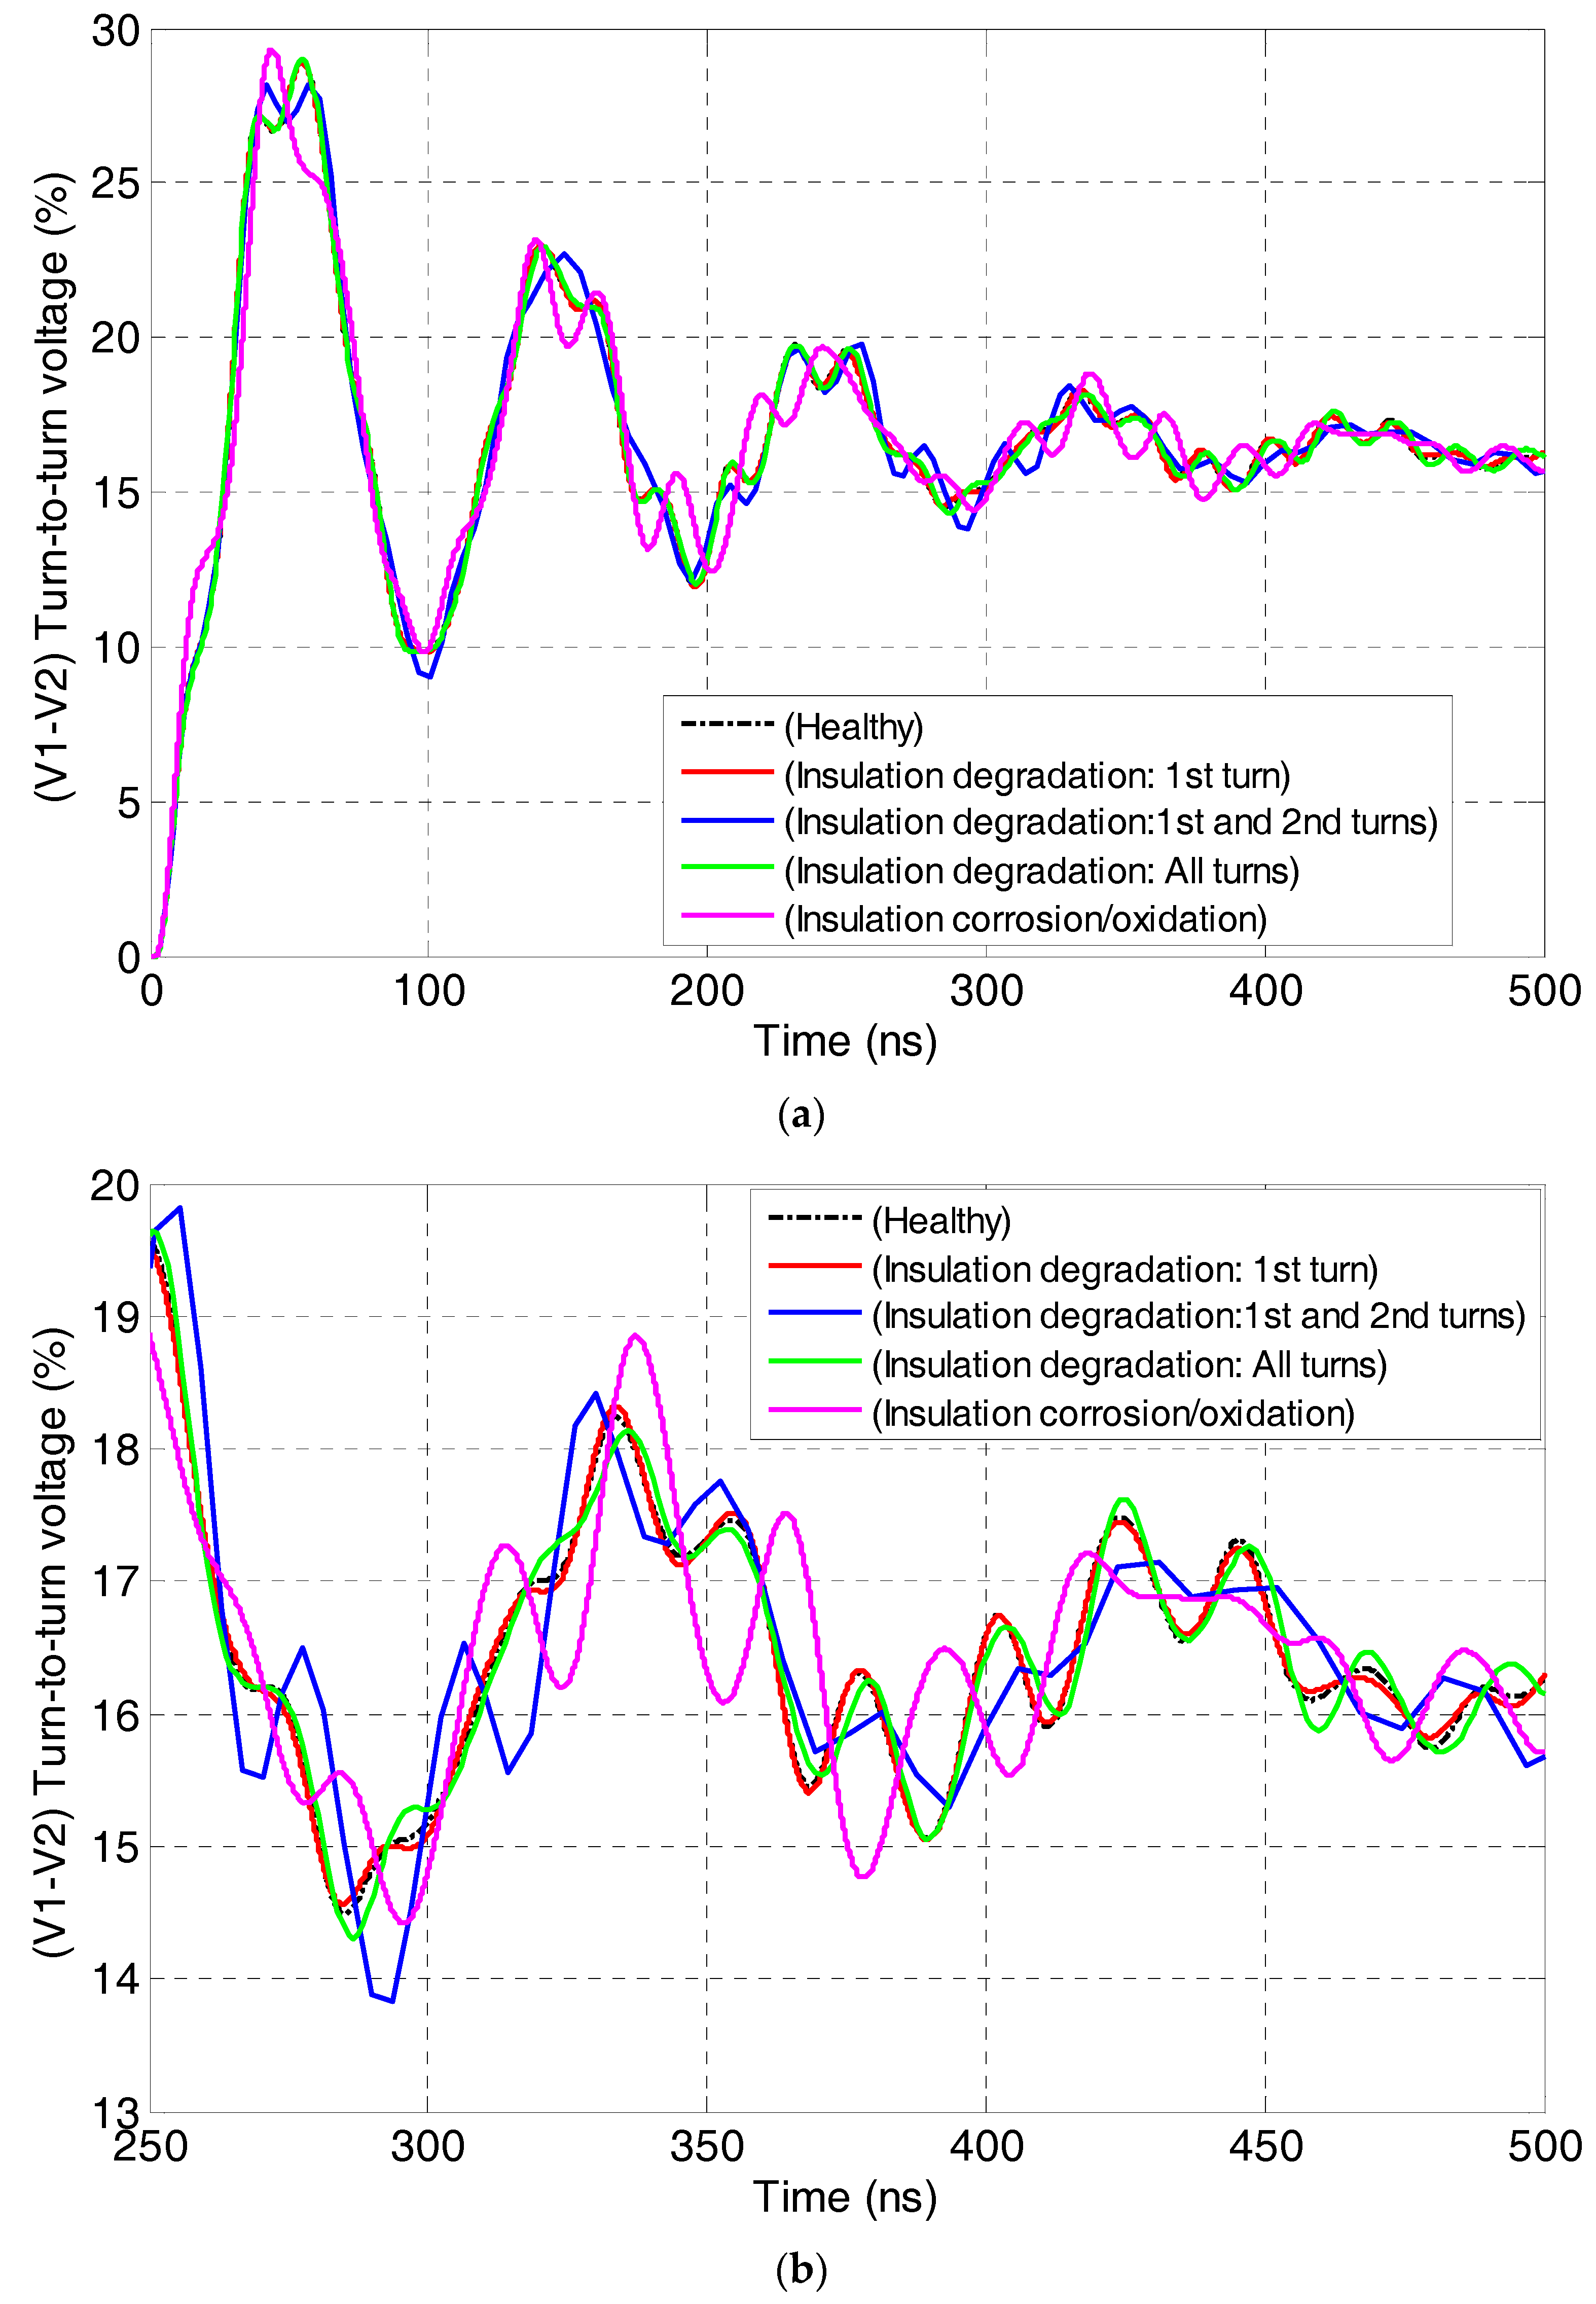
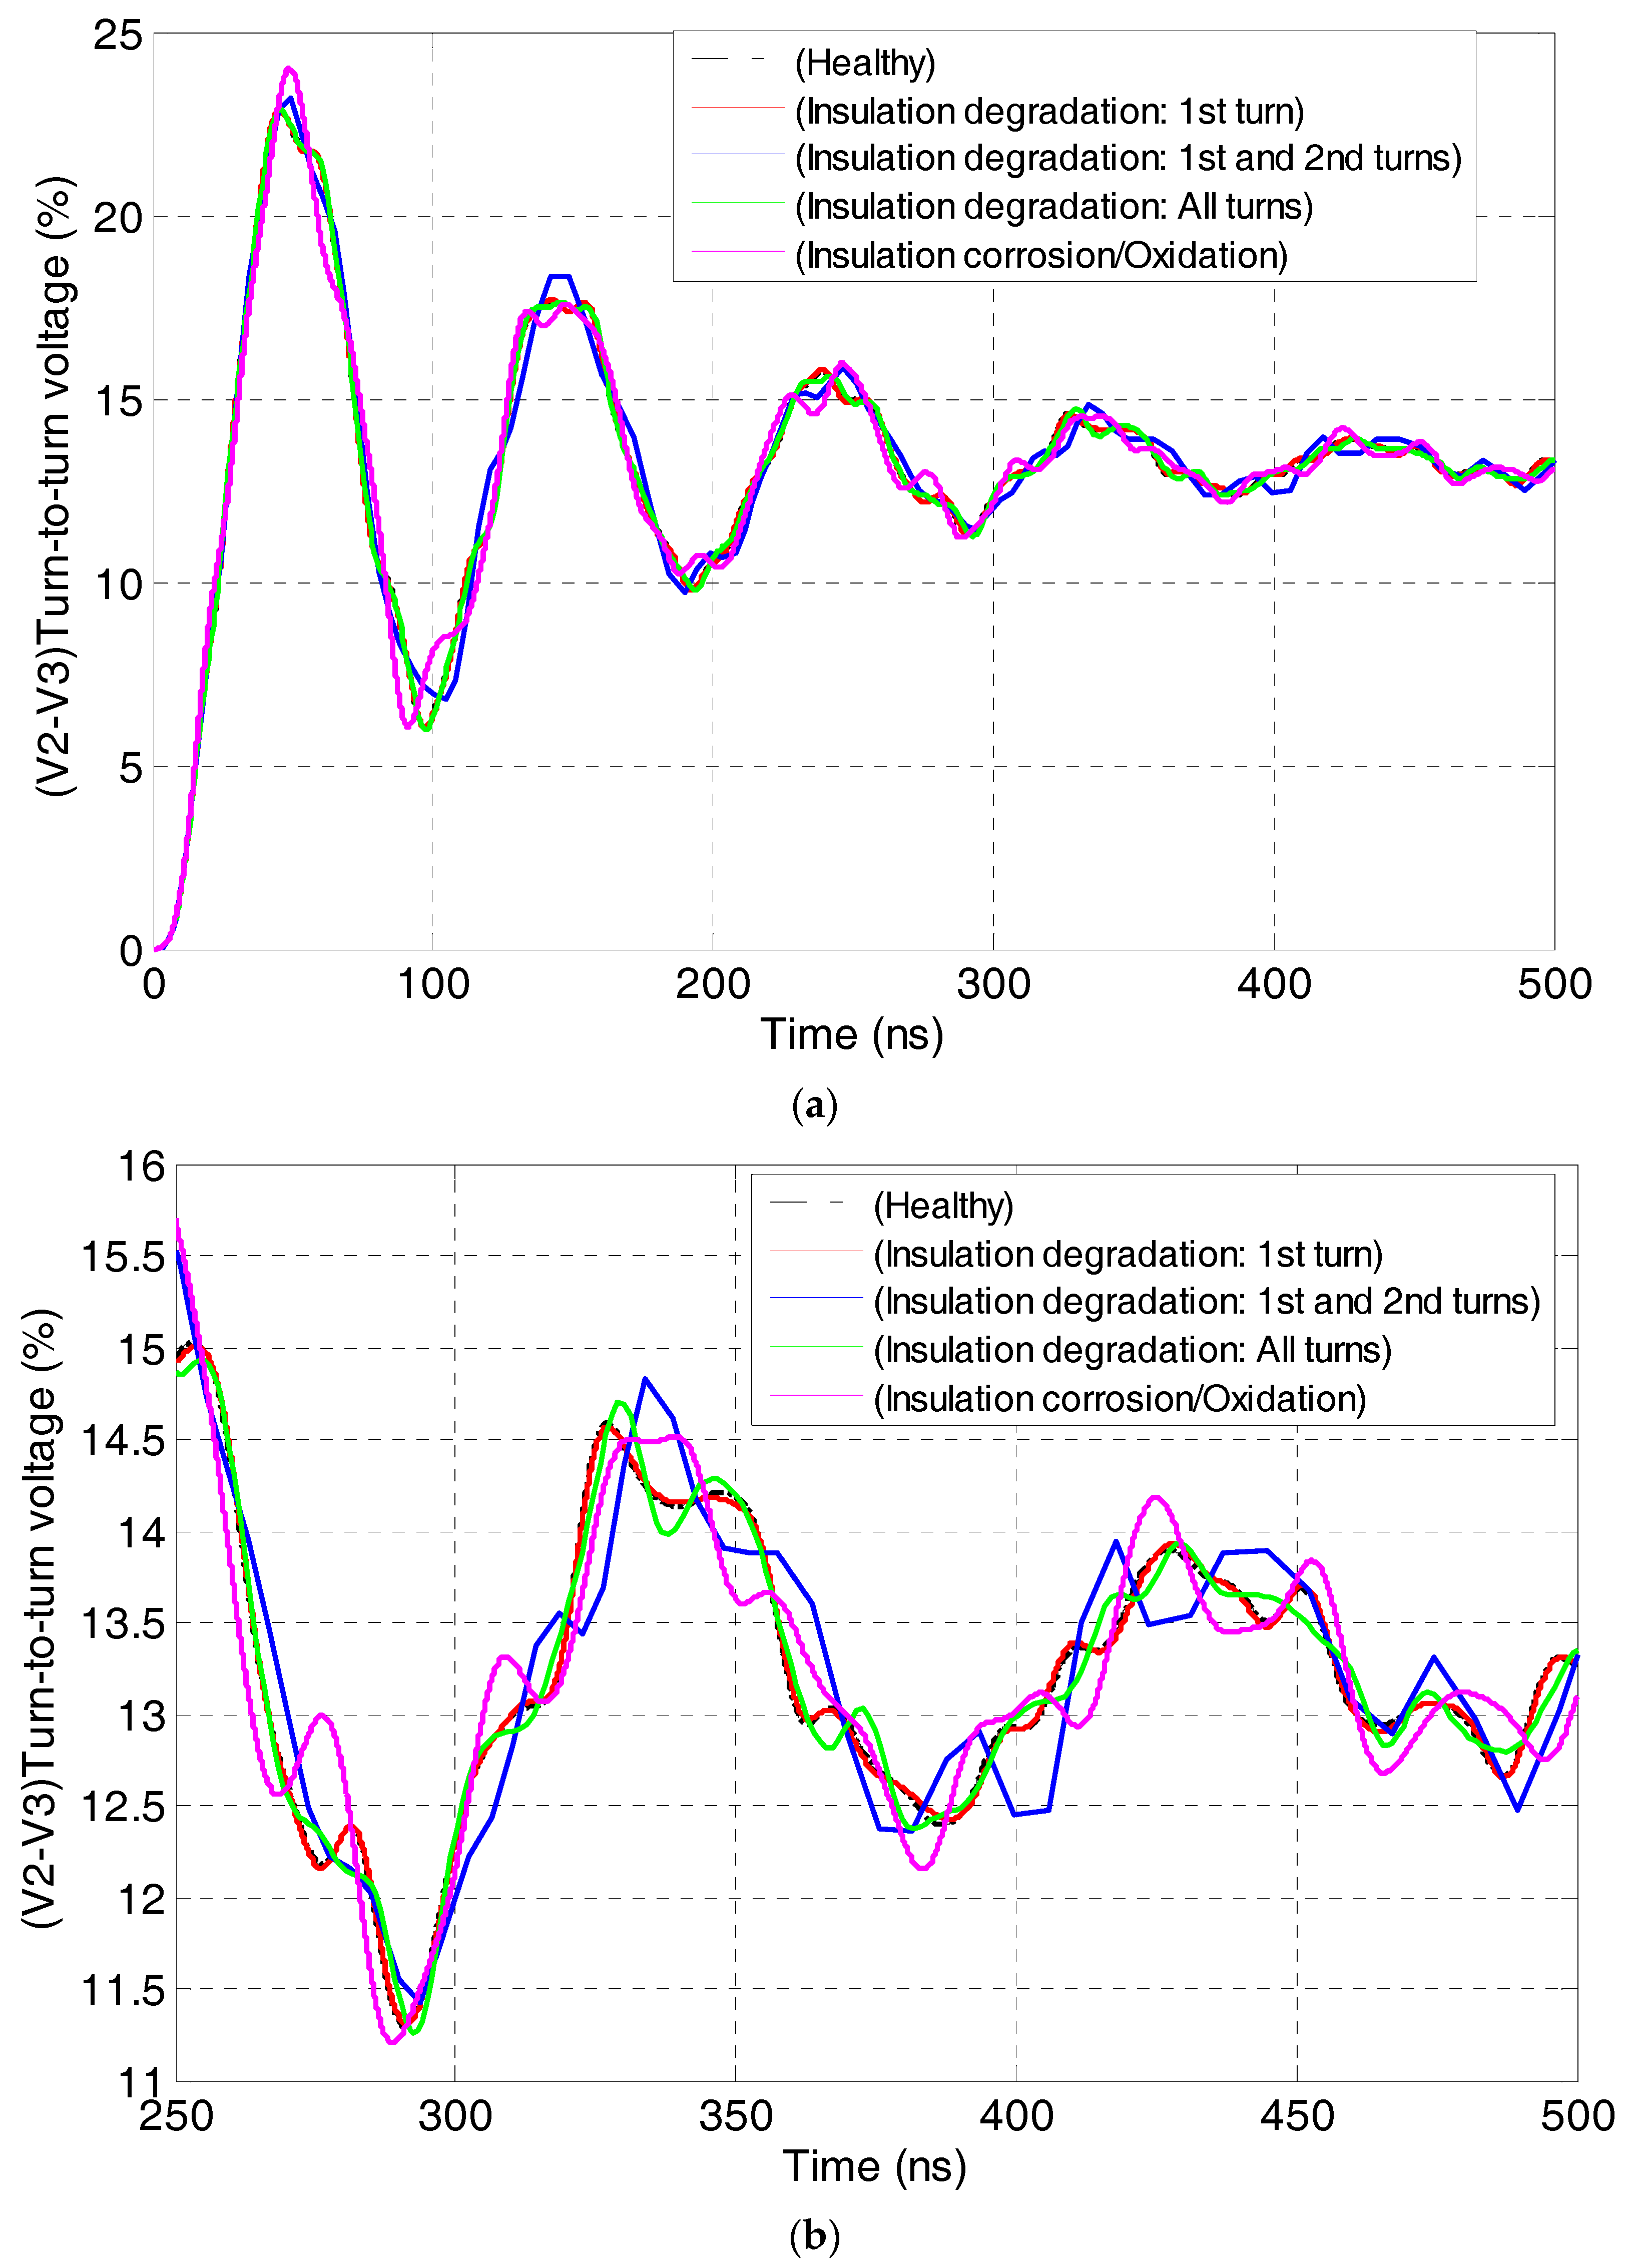
The turn-to-turn transient voltage waveforms (full and zoom curves) for the healthy and degraded insulation are depicted in Figure 5, Figure 6, Figure 7 and Figure 8.
The Winding-EIS status is affected by the rate of change of voltage as well as the magnitude of the overvoltage. The turn-to-turn voltages indicate that the voltage stresses increase from the fist turns to the latest turns. This uneven voltage distribution, which is exacerbated by the conductor’s dimensions and arrangements and correlated to the inter-turn capacitance causes a significant overstress which can lead to turn-to-turn insulation failure.
Accordingly, while the maximum peak turn-to-turn voltage is between adjacent turns, its coupled capacitances plays an important role in preserving the insulation’s integrity and then, attenuating premature insulation degradation. This means that the insulation can be stressed much harder locally than it would be during normal operation. Moreover, the repetitive transients can be harmful to the winding as they can excite its resonances, and then, the magnitude of the transients does not have to be particularly large to cause damage to the insulation of the winding.
From Figure 5, Figure 6, Figure 7 and Figure 8, it can be clearly seen that a deviation occurs between the healthy and emulated insulation degradation of the inter-turn voltage waveform which presents incipient oscillations as well as more distortion at the time domain during steady state operation. These oscillations will be increased when the insulation degradation increases, particularly for corrosion/oxidation insulation degradation, according to the changes of the inter-turn capacitances. In addition, the distortion level is even more important for the incriminated turns as it leads to an increase in the settling time due to increased damped resonance frequency and a decrease in the damping factor. Consequently, the safety margin of the insulation integrity is greatly affected. This leads to the occurrence of partial discharge, accelerating the ageing of the insulation which leads to premature insulation degradation or failure.
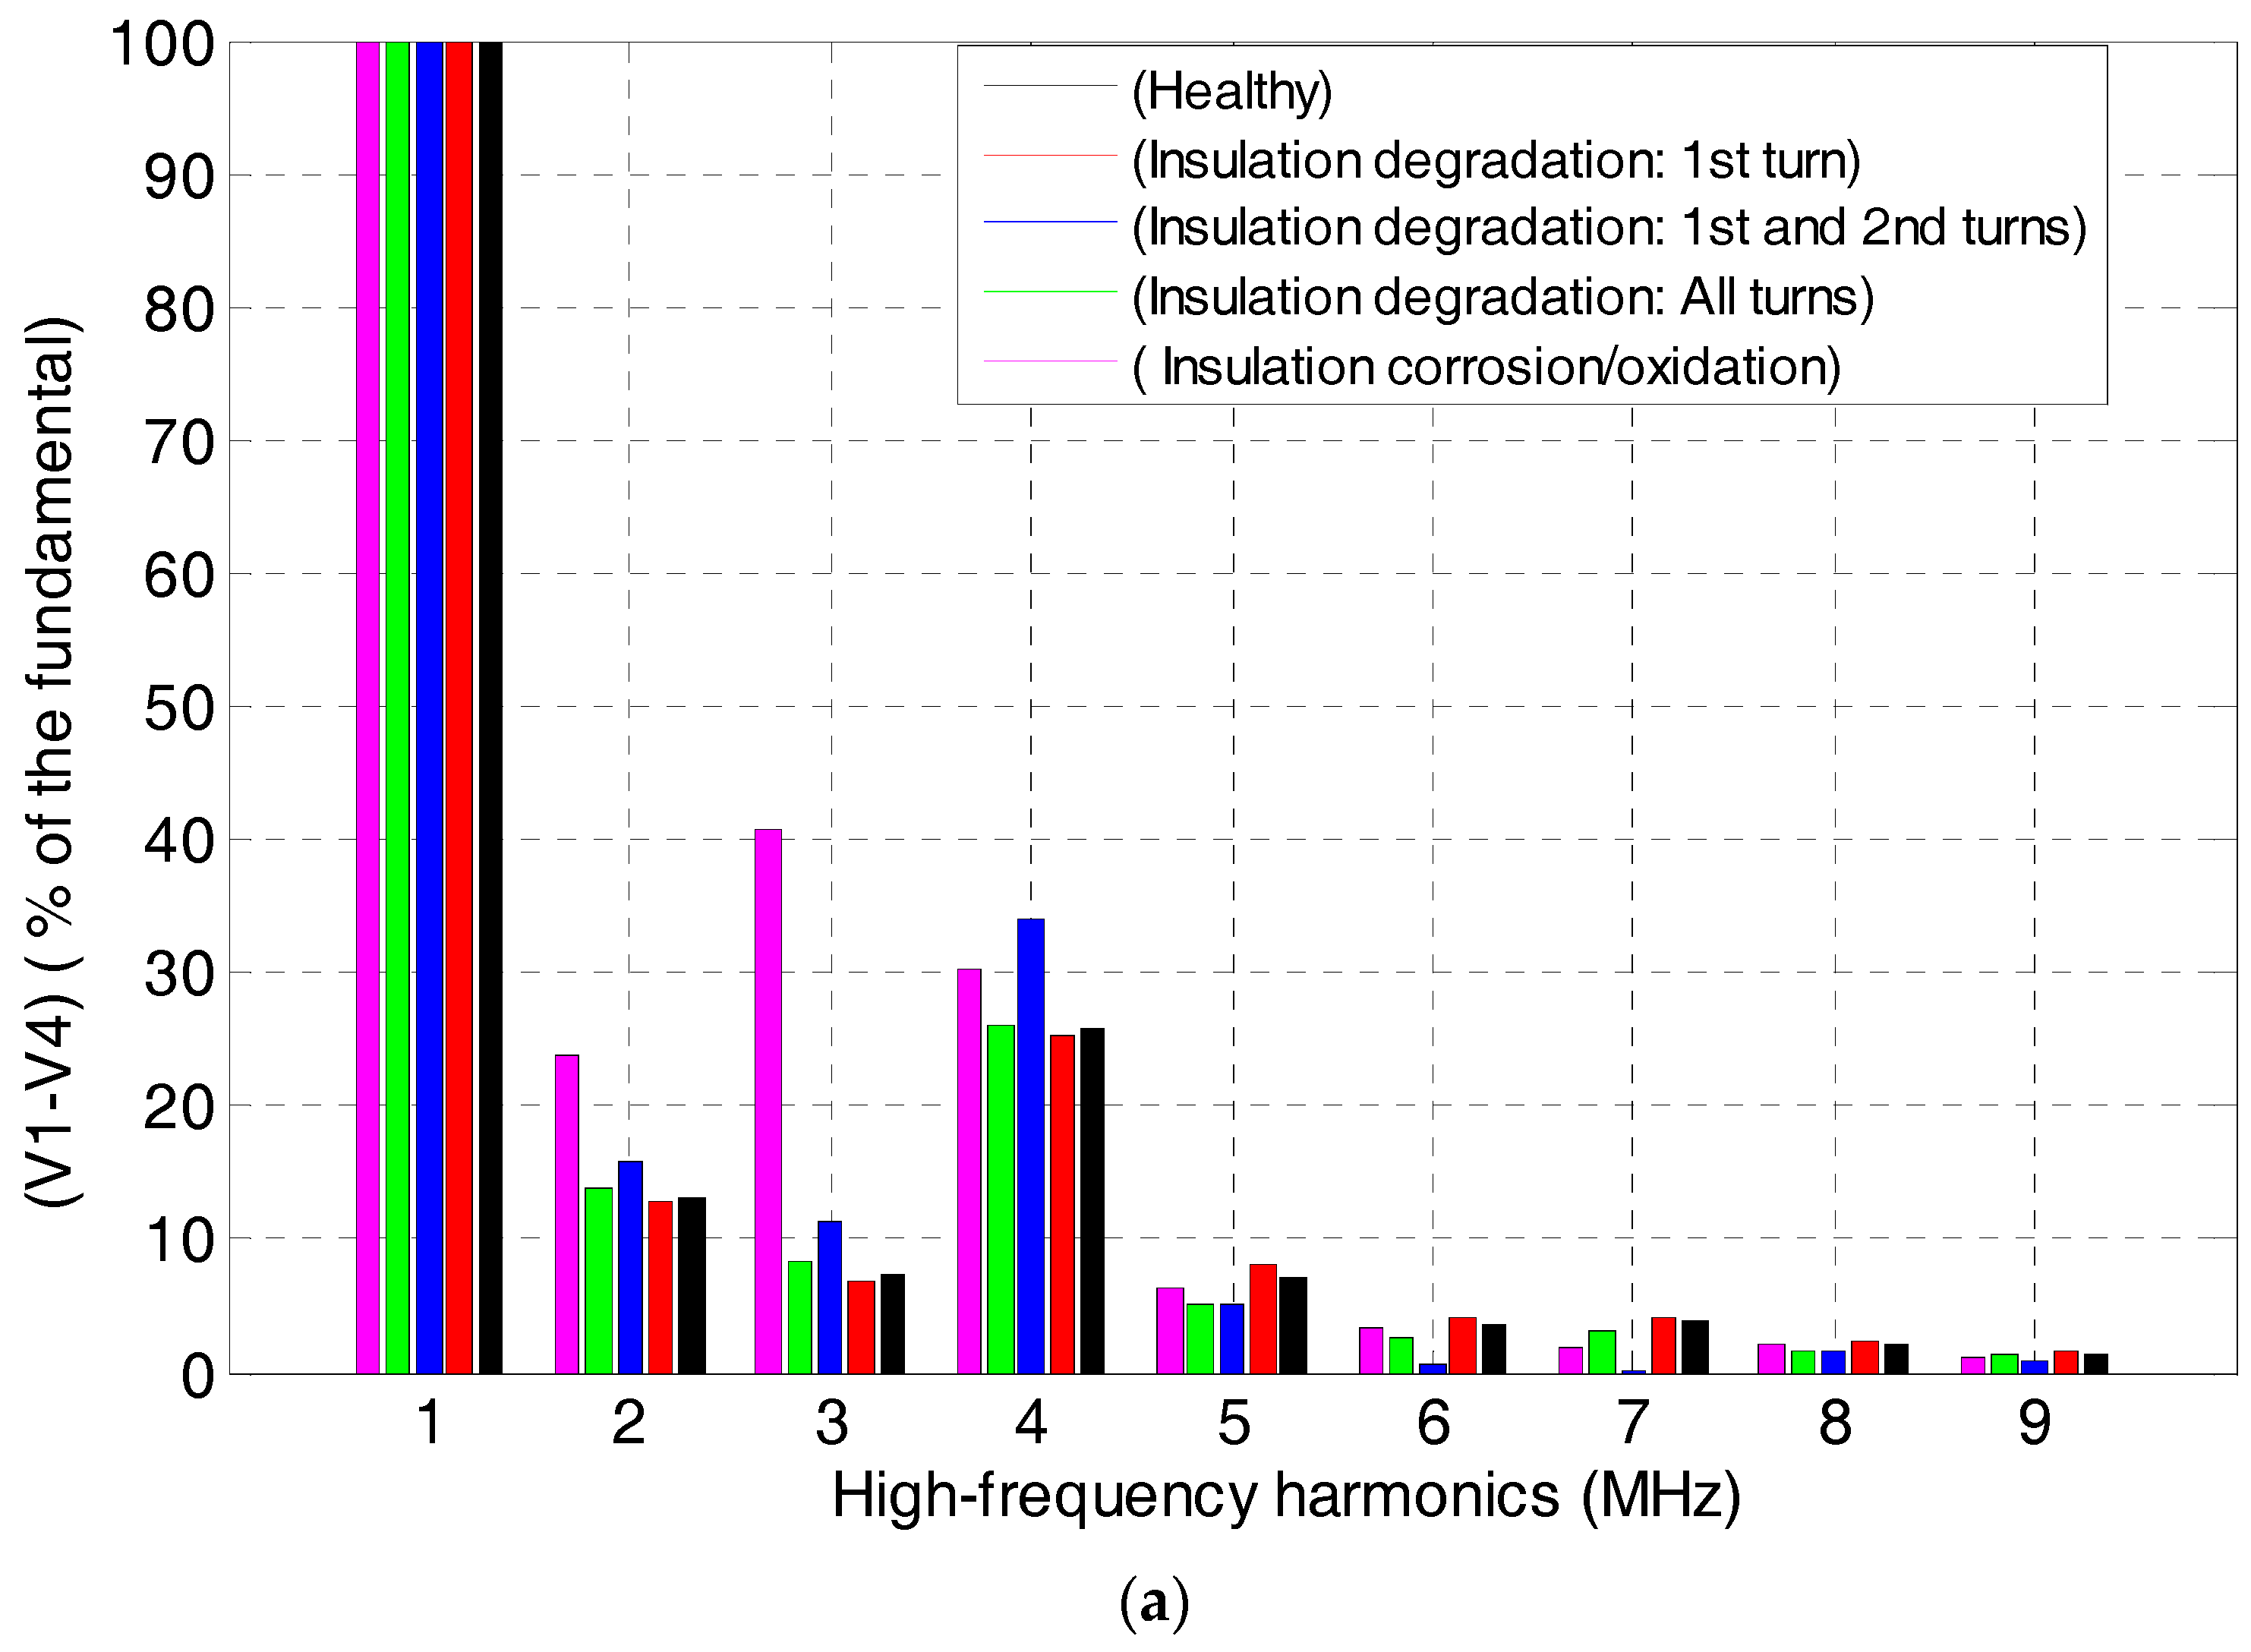
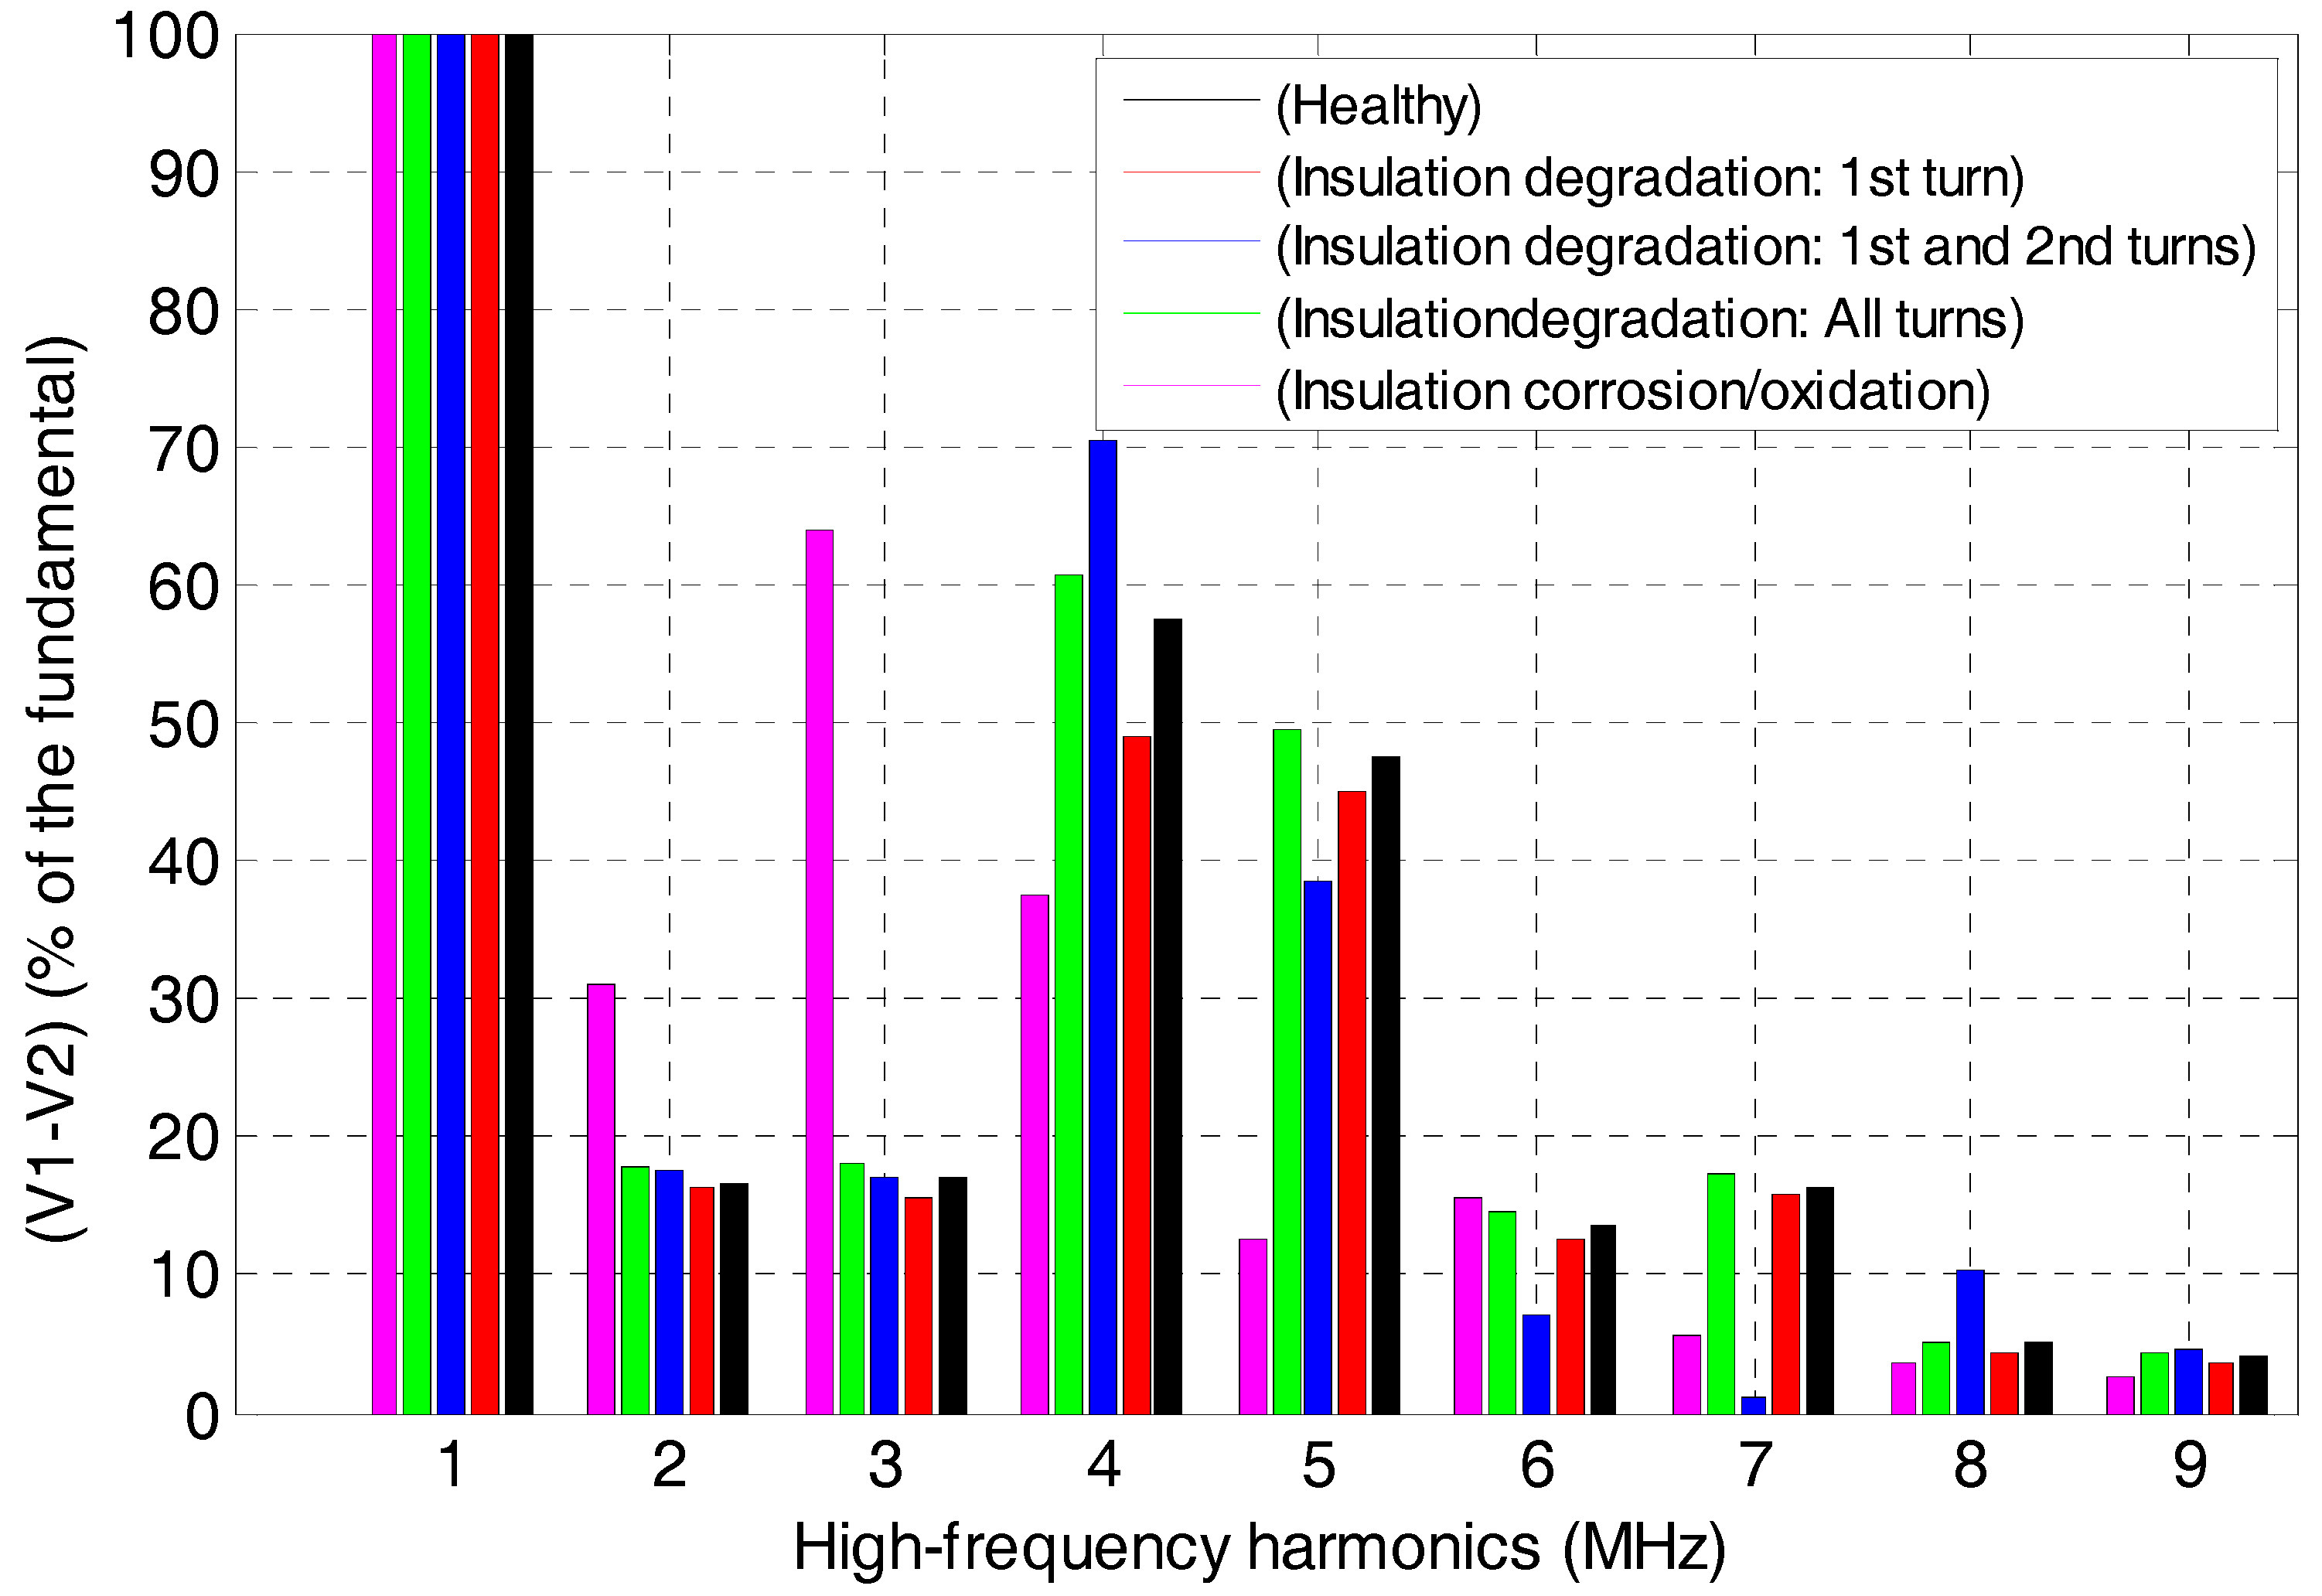
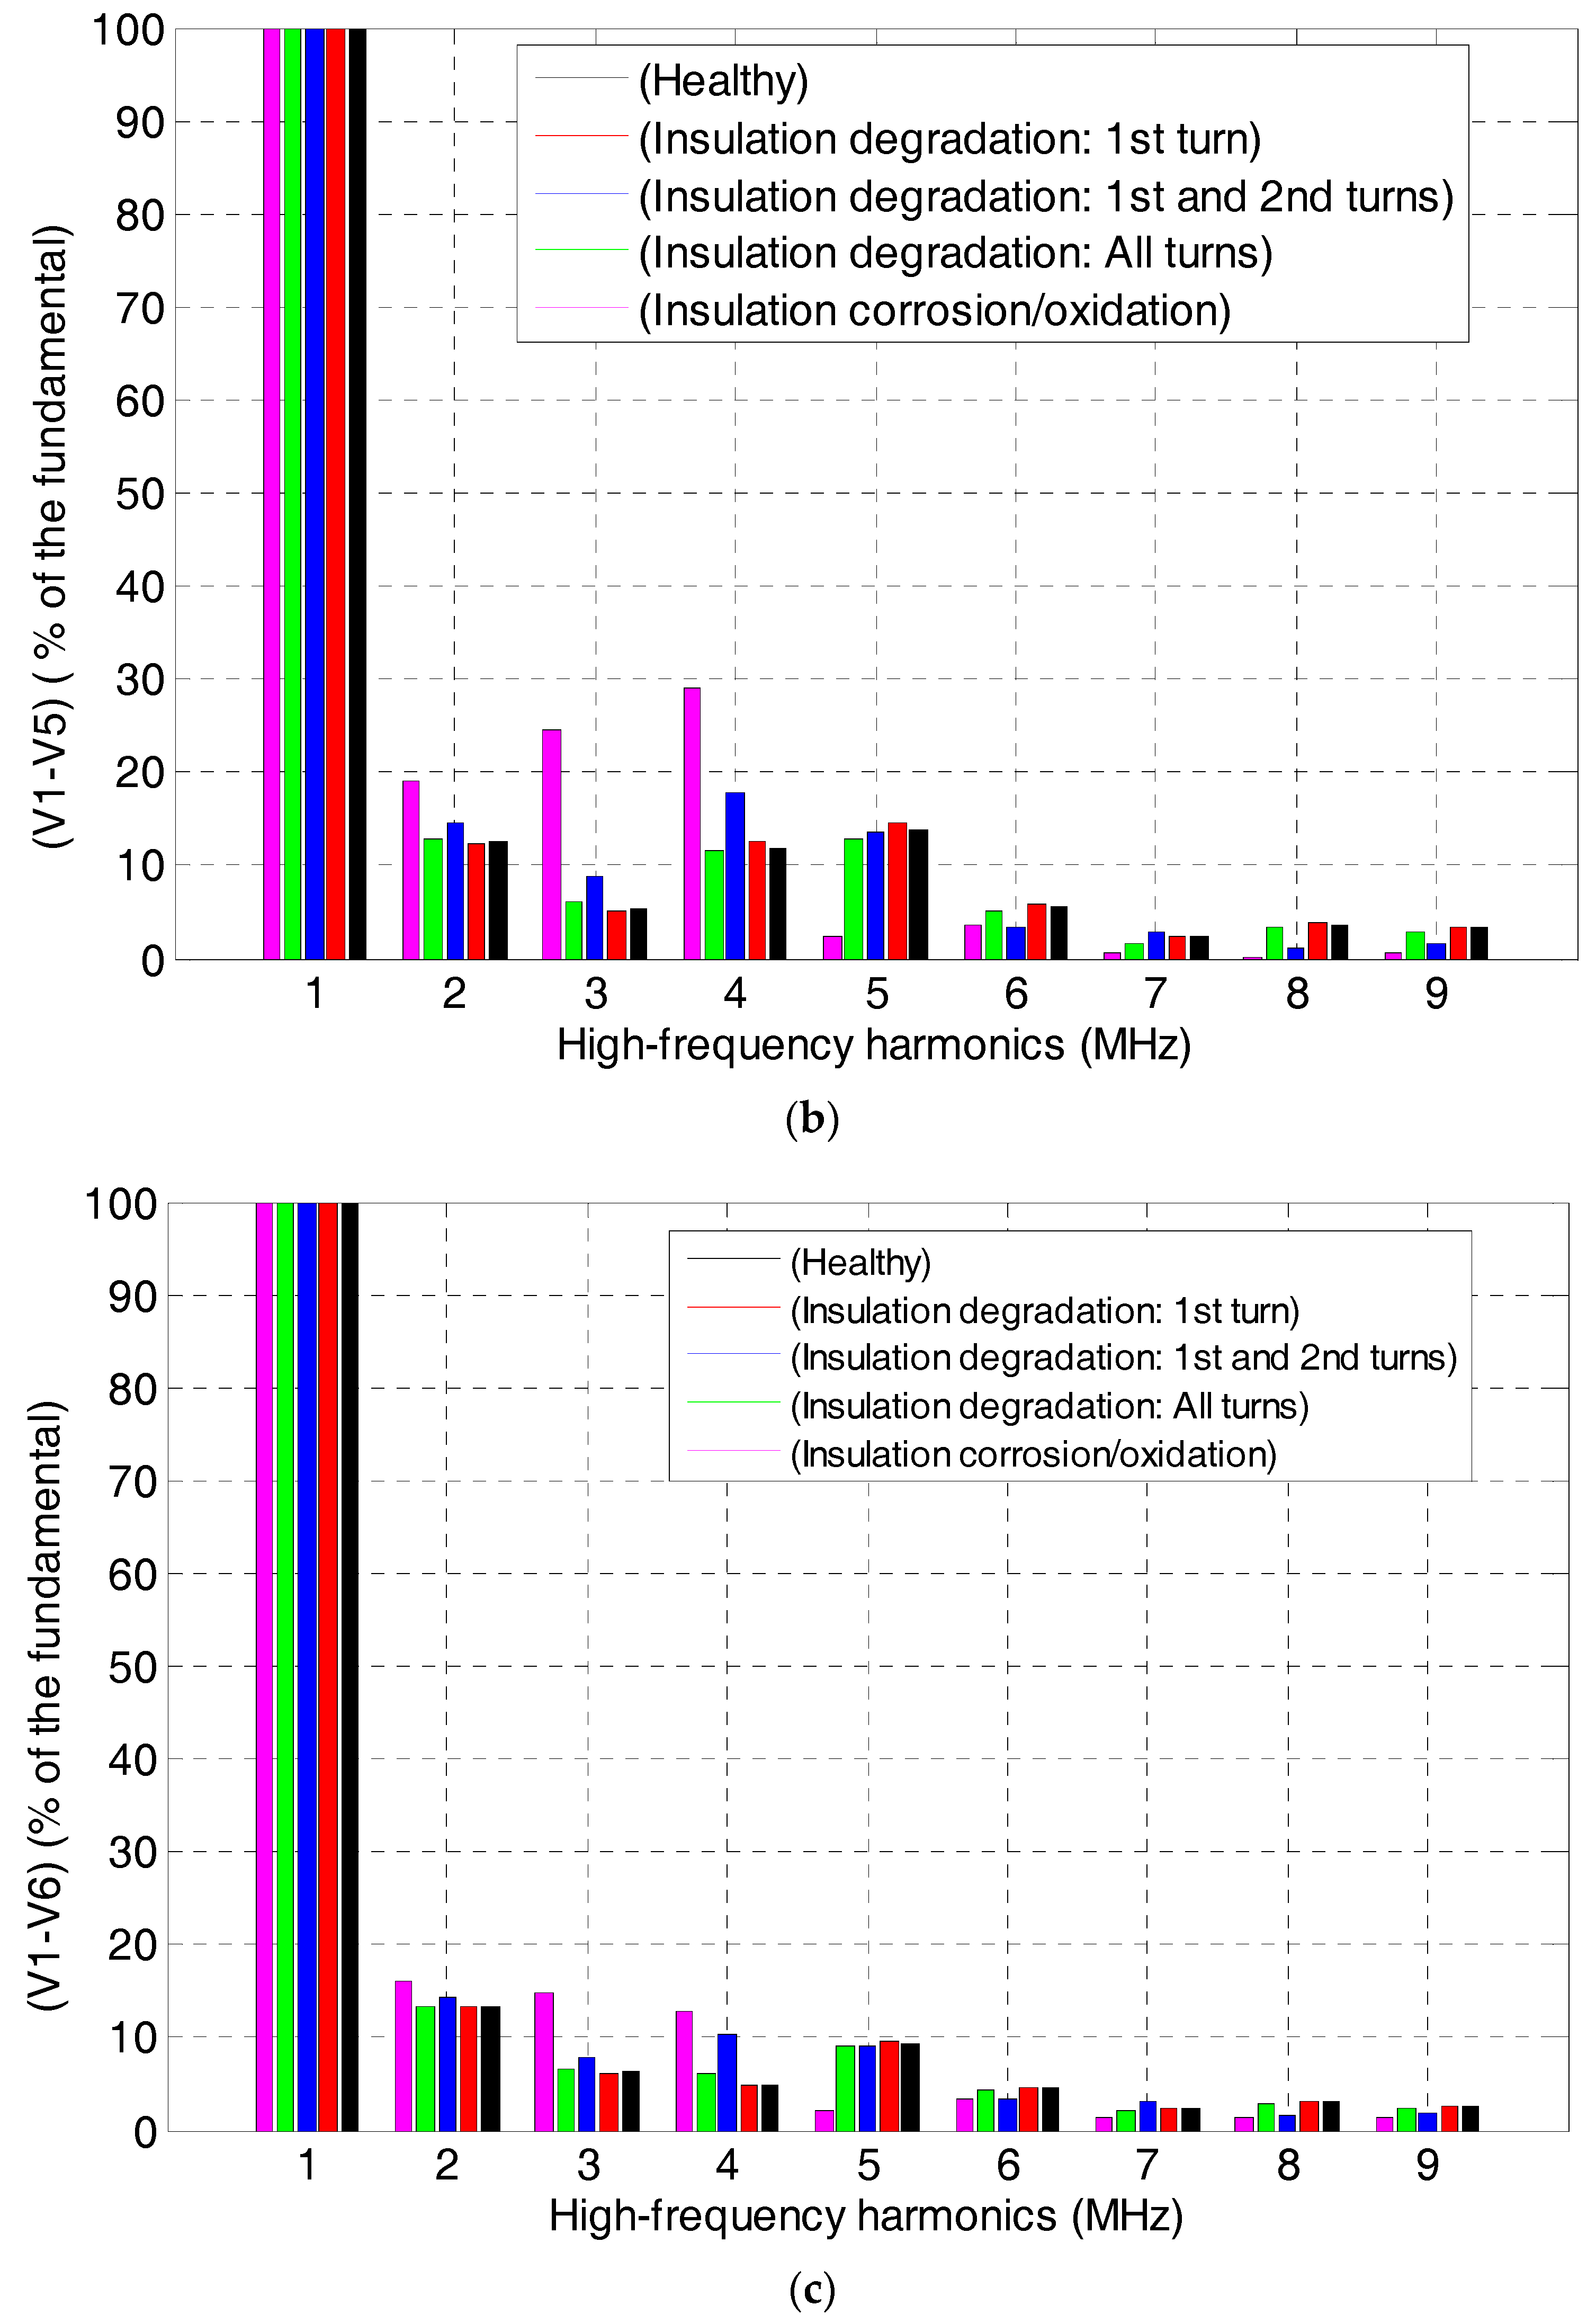
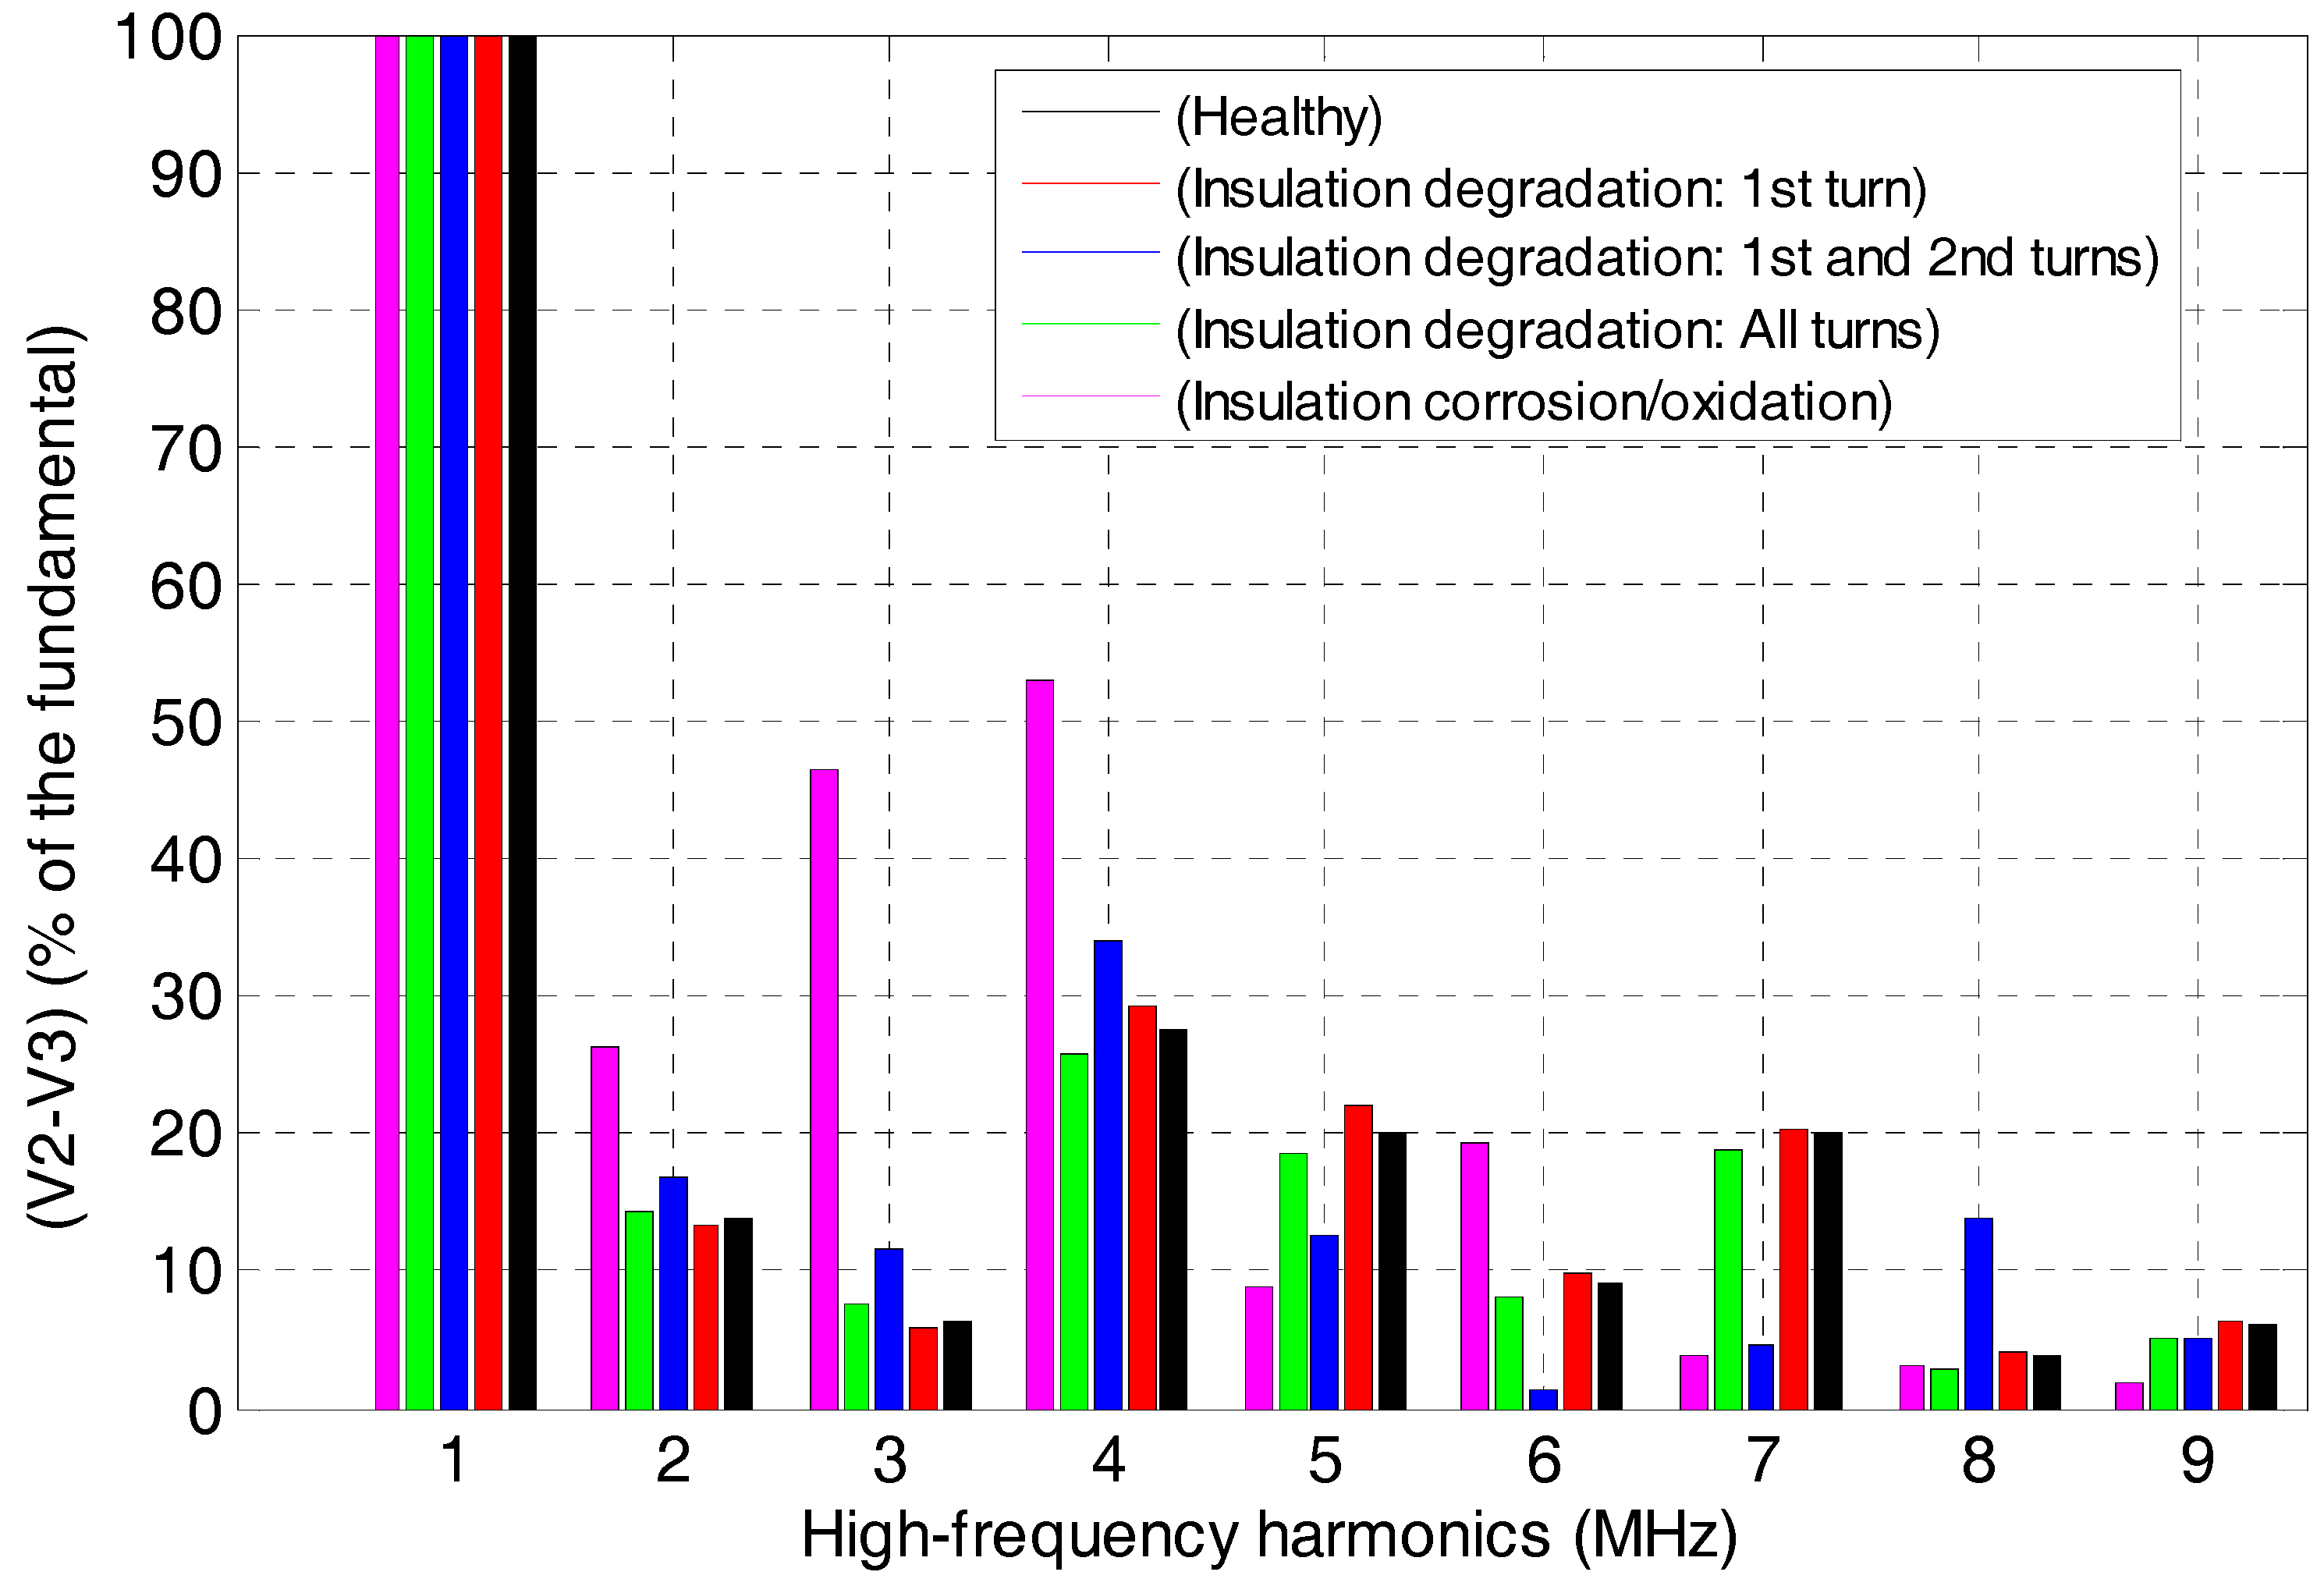
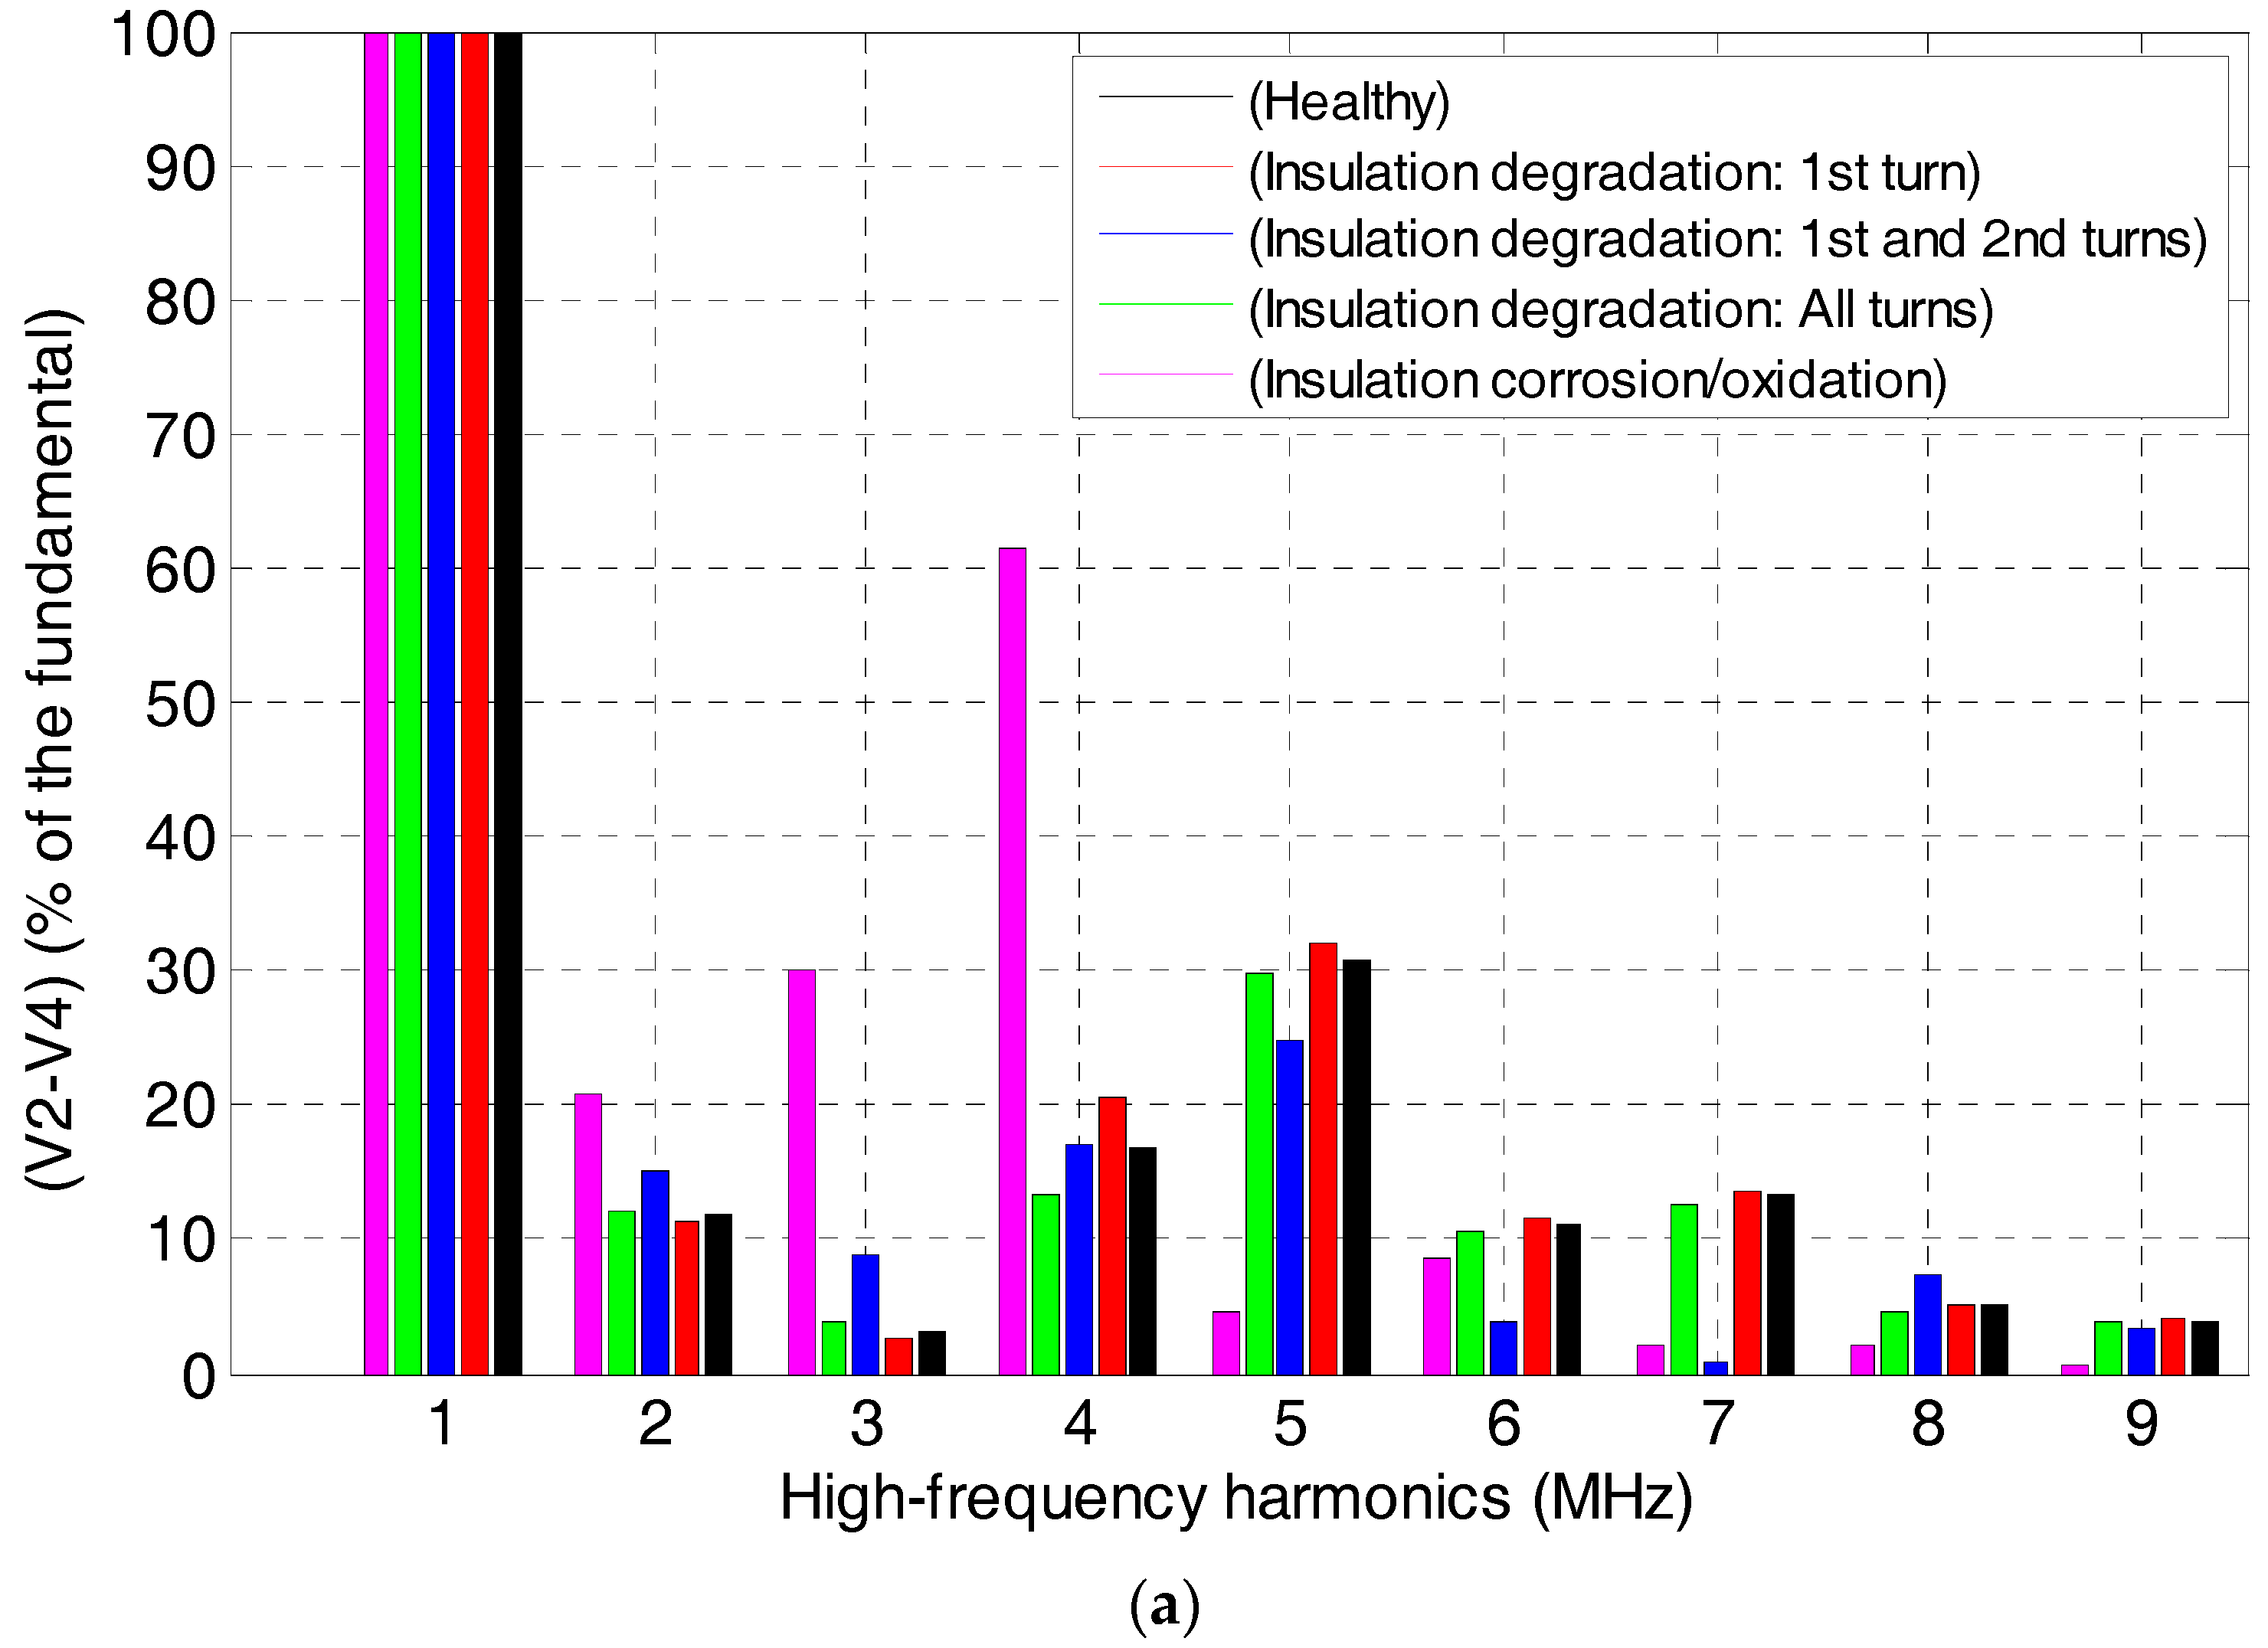
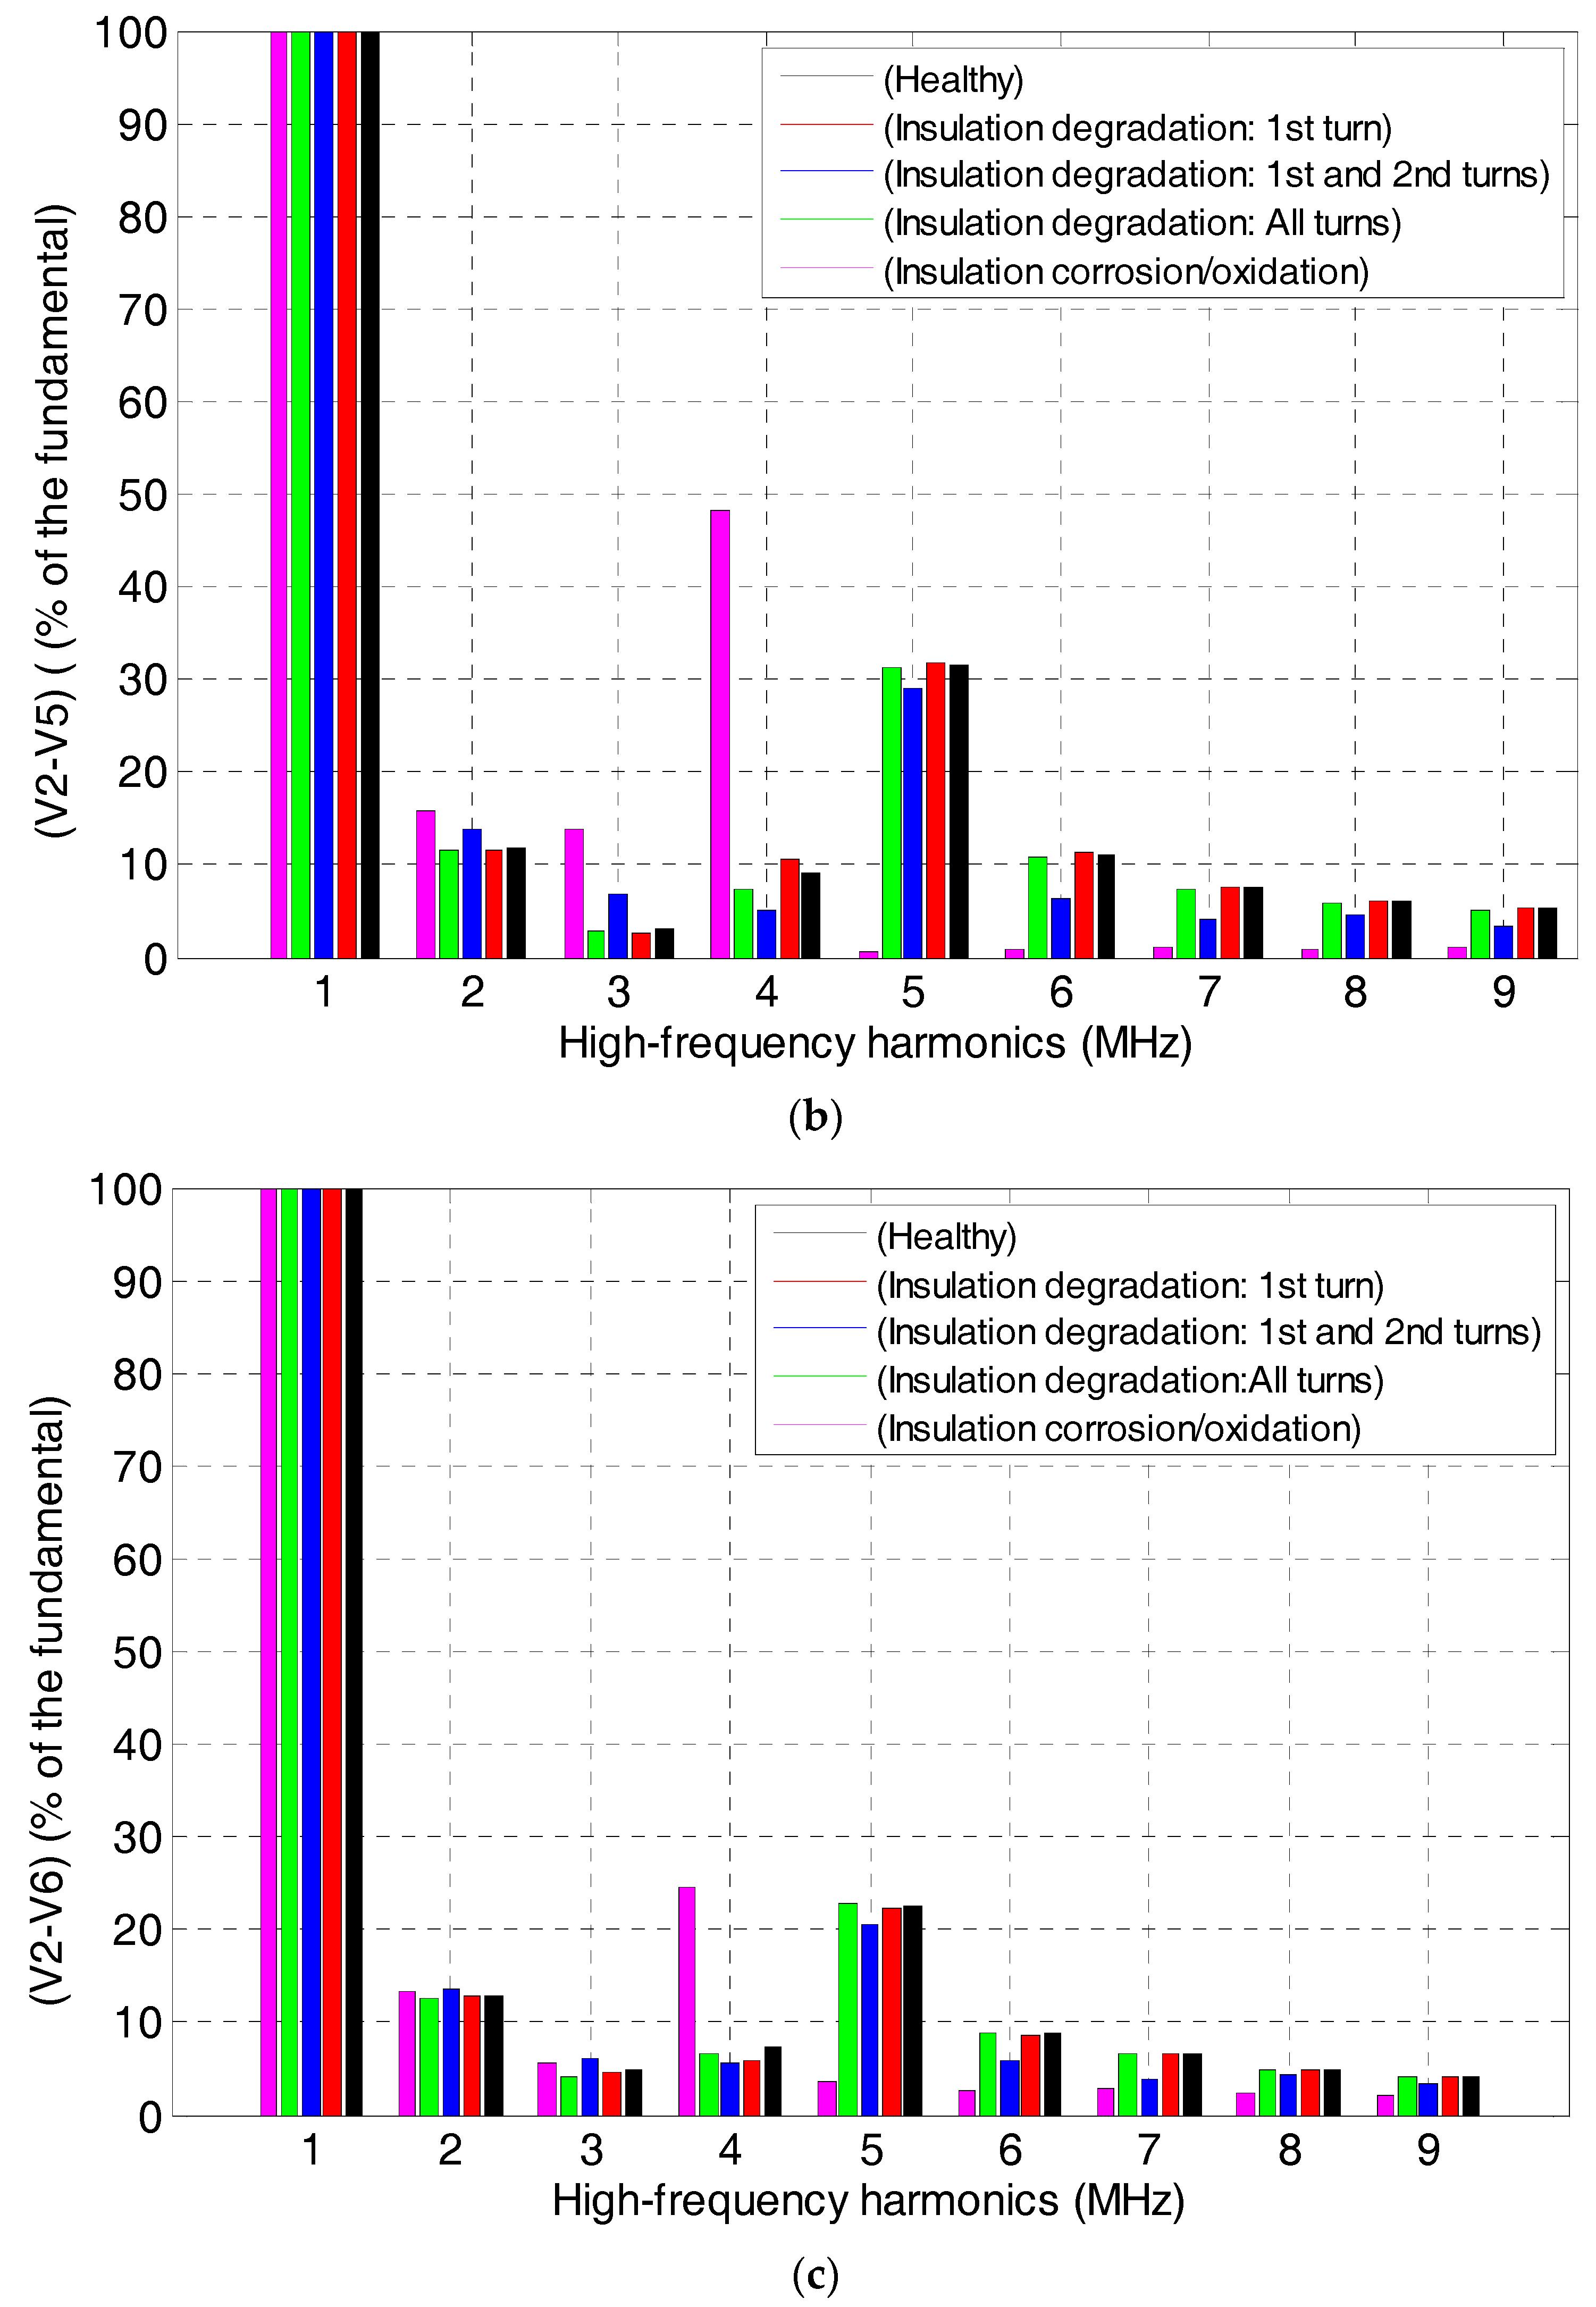
To further analyze the transient voltage signal, the fast Fourier transform (FFT) localized within the frequency band between 1 MHz and 10 MHz was implemented on the signals before and after insulation degradation of the EIS. In order to find more fault indicators, we present the difference between the spectral analysis of the inter-turn transient voltage for a healthy system and one with emulated insulation degradation in Figure 9, Figure 10, Figure 11 and Figure 12.
The key to interpretation is the trend, which makes it clear, through the spectrum analysis (FFT),that there is an increased magnitude of the inter-turn voltages corresponding to the harmonic components, particularly for the frequency band between 1 MHz and 5 MHz. In the cases of locally inhomogeneous insulation degradation of the 1st turn and the 1st and 2nd adjacent consecutive turns, no significant changes were detected in the time domain. On the other hand, for the frequency domain, an increase in magnitude of the voltage harmonic components is observed only for the incriminated adjacent turns. Otherwise, for the homogeneous dielectric degradation of the turns’ insulation material, the most noticeable change in the frequency spectrum occurs in a very narrow range around 1 MHz to 10 MHz. The substantial magnification of the harmonic components’ magnitudes can be clearly considered to be a pertinent indicator of corrosion/oxidation insulation degradation.
In order to prevent the construction of costly prototypes in the winding insulation design phase, modeling of this winding is necessary. The idea of the proposed diagnosis method was based on the calculation of electrical RLC parameters of the winding insulation system using FEM. The diagnostic indicators built with the turn-to-turn or turn-to-ground capacitance estimated values can be used to evaluate the health state of the insulation system. Indeed, it has been shown that the values of these capacitances increase with degradation of the insulation. The turn-to-turn overvoltage peaks indicate that the stresses between conductors are impacted by the coupling capacitances. The increases in the total turn-to-turn series capacitance, according to the total turn-to-ground shunt capacitances, leads to an increase in the linearization curve of the voltage distribution. This method can be improved for the diagnosis of electrical machines.

6. Conclusions

This paper has proposed a novel approach to evaluate the Winding-EIS health state based on the inter-turn Transient Voltage Signature Analysis response to a high frequency voltage source inverter. An improved high frequency computation of the(RLM parameters was proposed from hundreds of Hertz to tens of Mega-Hertz, based on the FE formulation of the strongly-coupled magnetodynamic-total current equations that include the skin and proximity effects as well as the displacement current density. The electrostatic model of the electric scalar potential was solved to get the turn-to-ground and the turn-to-turn capacitances. In addition to the increase in turn-to-turn capacitances, the transient voltage waveform analysis obtained from the RLMC-circuit simulation for healthy and insulation degradation, such as ageing and corrosion/oxidation of the Winding-EIS shows that increases in the propagation frequency, the settling time, the steady state oscillations, and the magnitude of the harmonic components can be used as diagnosis indicators.
The originality of this work is that it provides effective models based on the turn-to-turn Transient Voltage Signature Analysis which can be used to monitor the health status of insulation, and thus, is a very promising tool for early NDT to diagnose the EIS of electrical equipment.

Author Contributions

The work was mainly developed by the first and second authors (N.R. and M.R.). S.N.L. performed the numerical analyses. N.R. carried out a proofreading on the paper and provided suggestions for improvement.

Funding

This research received no external funding.

Acknowledgments

Authors want to thank the Said Guermah Assistant professor in Mouloud Mammeri university for it help during the language correction of the paper, and Mouloud Feliachi for it precious help during the internship of Nadia Radja in the IREENA institute.

Conflicts of Interest

The authors declare no conflict of interest.

References

  1. Fenger, M.; Campbell, R.S.; Pedersen, J. Motor winding problems caused by inverter drives. IEEE Trans. Ind. Appl. Mag. 2003, 9, 22–31. [Google Scholar] [CrossRef]
  2. Stone, G.C.; Boulter, E.A.; Culbert, I.; Dhirani, H. Electrical Insulation for Rotating Machines: Design, Evaluation, Aging, Testing, and Repair; Wiley Interscience: Hoboken, NJ, USA, 2004. [Google Scholar]
  3. Hudon, C.; Amyot, N.; Lebey, T.; Castelan, P.; Kandev, N. Testing of low-voltage motor turn insulation for pulse-width modulated applications. IEEE Trans. Dielectr. Electr. Insul. 2000, 7, 783–789. [Google Scholar] [CrossRef]
  4. Yoshida, H.; Umemoto, K. Insulation diagnosis for rotating machines insulation. IEEE Trans. Electr. Insul. 1986, 21, 1021–1025. [Google Scholar] [CrossRef]
  5. Suresh, G.; Toliyat, A.; Rendusara, A.; Enjeti, N. Predicting the transient effects of PWM voltage waveform on the stator windings of random wound induction motors. IEEE Trans. Power Electron. 1999, 14, 23–30. [Google Scholar] [CrossRef]
  6. Martinez-Tarifa, J.M. Transient Voltage Distribution along LV Motor Winding Fed with PWM Converter, Insulation Ageing Analysis. Ph.D. Thesis, University Carlos III, Madrid, Spain, 2005. [Google Scholar]
  7. Oyegoke, B.S. Transient Voltage Distribution of Stator Winding of Electrical Machine Fed from a Frequency Converters. Ph.D. Thesis, Helsinky University of Technology, Espoo, Finland, 2000. [Google Scholar]
  8. Savin, S.; Ait-Amar, S.; Roger, D. Turn-to-turn capacitance variations correlated to PDIV for AC motors monitorin. IEEE Trans. Dielectr. Electr. Insul. 2013, 20, 34–41. [Google Scholar] [CrossRef]
  9. Billard, T.; Lebey, T.; Fresnet, F. Partial discharge in electric motor fed by a PWM inverter: Off-line and on-line detection. IEEE Trans. Dielectr. Electr. Insul. 2014, 21, 1235–1242. [Google Scholar] [CrossRef]
  10. Taylor, N. Diagnostics of Stator Insulation by Dielectric Response and Variable Frequency Partial Discharge Measurements. Licentiate Thesis, KTH Electrical Engineering, Stockholm, Sweden, 2006. Available online: https://www.diva-portal.org/smash/get/diva2:11239/FULLTEXT01.pdf (accessed on 8 April 2018).
  11. Tallam, R.M.; Lee, S.B.; Stone, G.; Kliman, C.; Yoo, G.C.; Habetler, J.; Harley, R.G. A survey methods for detection of stator-related faults in induction machines. IEEE Trans. Ind. Appl. 2005, 43, 920–933. [Google Scholar] [CrossRef]
  12. Grubic, J.M.; Aller, B.L.; Habetler, T.G. A survey on testing and monitoring methods for stator insulation system of low voltage induction machines focusing on turn insulation problems. IEEE Trans Ind. Electron. 2008, 55, 4127–4136. [Google Scholar] [CrossRef]
  13. Cavalini, A.; Montanari, G.C.; Puletti, F.; Contin, A. A new methodology for the identification of PD in electrical apparatus: Properties and applications. IEEE Trans. Dielectr. Electr. Insul. 2005, 12, 203–215. [Google Scholar] [CrossRef]
  14. Grubic, S. Online Monitoring of Turn Insulation Deterioration in Mains-Fed Induction Machines Using Online Surge Testing. Ph.D. Thesis, Electrical and Computer Engineering, Georgia Institute of Technology, Atlanta, GA, USA, 2011. [Google Scholar]
  15. Billard, T. Off-line and On-line Partial Discharges Detection in Low Voltage Motors of Electric Vehicle fed by a PWM Inverter using Non-Intrusive Sensor. Ph.D. Thesis, University of Toulouse, Toulouse, France, 2014. [Google Scholar]
  16. Wang, L.; Ngaiman, H.C.; Canales, F.; Jatskevich, J. High-frequency modeling of long-cable-fed induction motor drive system using TLM approach for predicting overvoltage transients. IEEE Trans. Power Electron. 2010, 23, 2653–2664. [Google Scholar] [CrossRef]
  17. Clayton, R.P. Analysis of Multiconductor Transmission Line; John Wiley and Sons: Hoboken, NJ, USA, 2008; ISBN 978-0-470-13154-1. [Google Scholar]
  18. Islam, S.; Ledwich, G. An equivalent circuit for calculation of interturn voltage distribution of stator windings in the presence of slot discharges. In Proceedings of the 5th International Conference on Properties and Applications of Dielectric Materials, Seoul, Korea, 20–30 May 1997; pp. 507–510. [Google Scholar]
  19. McLaren, P.G.; Abdel-Rahnam, M.H. Modeling of large AC motor coils for steep-fronted surge studies. IEEE Trans. Ind. Appl. 1988, 24, 422–426. [Google Scholar] [CrossRef]
  20. Zhang, J.; Xu, W.; Gao, C.; Wang, S.; Qiu, J.; Zhu, J.G.; Guo, Y. Analysis of Inter-Turn Insulation of High Voltage Electrical Machine by Using Multi-Conductor Transmission Line Model. IEEE Trans. Magn. 2013, 49, 1905–1908. [Google Scholar] [CrossRef]
  21. Guardado, J.L.; Cornick, K.J. Calculation of machine electrical parameters at high frequencies for switching transient studies. IEEE Trans. Energy Convers. 1996, 11, 33–40. [Google Scholar] [CrossRef]
  22. De Greve, Z.; Deblecker, O.; Lobry, J. An efficient approach for the numerical identification of R and L parameters of high frequency multi-winding transformers. J. Energy Power Eng. 2011, 5, 641–650. [Google Scholar]
  23. Davey, K.R.; Zheng, D. Prediction and Use of Impedance Matrices for Eddy-Current Problems. IEEE Trans. Magn. 1997, 33, 2478–2485. [Google Scholar] [CrossRef]
  24. Boglietti, A.; Cavagnino, A.; Lazzari, M. Experimental High- Frequency Parameter Identification of AC Electrical Motors. IEEE Trans. Ind. Appl. Mag. 2007, 43, 23–29. [Google Scholar] [CrossRef]
  25. Mihaila, V. New Design of Stator Windings of AC Machines for Reducing the Negative Effects of dV/dt. Ph.D. Thesis, University Lille Nord, Lille, France, 2011. [Google Scholar]
Figure 1. Distributed Lumped Electric Circuits (LEC).
Machines 06 00021 g001
Figure 2. Electrical machine geometrical slot-multiconductor system.
Machines 06 00021 g002
Figure 3. Frequency-dependent resistances/inductances of the turn.
Machines 06 00021 g003
Figure 4. Finite Element-High Frequency Transmission Line Lumped Electromagnetic (FE-RLMC) circuit models for turn transient voltage distribution versus results from the experiment.
Machines 06 00021 g004
Figure 5. Turn-to-turn (V1–V2) transient voltages for healthy and insulation degradation as (a) full voltage waveform and (b) zoomed voltage waveform.
Machines 06 00021 g005
Figure 6. Turn-to-turn (V1–V4), (V1–V5) and (V1–V6) transient voltages for healthy and degraded insulation as (a) full voltage waveform and (b) zoomed voltage waveform.
Machines 06 00021 g006
Figure 7. Turn-to-turn (V2–V3) transient voltages for healthy and degraded insulation as (a) full voltage waveform and (b) zoomed voltage waveform.
Machines 06 00021 g007
Figure 8. Turn-to-turn (V2–V4), (V2–V5) and (V2–V6) transient voltages for healthy and degraded insulation as (a) full voltage waveform and (b) zoomed voltage waveform.
Machines 06 00021 g008
Figure 9. Spectral analysis (FFT): horizontal adjacent turn-to-turn (V1–V2) voltages for healthy and degraded insulation.
Machines 06 00021 g009
Figure 10. Spectral analysis (FFT): vertical adjacent turn-to-turn voltages for healthy and degraded insulation; (a) (V1–V4); (b) (V1–V5); (c) (V1–V6).
Machines 06 00021 g010aMachines 06 00021 g010b
Figure 11. Spectral analysis (FFT): horizontal adjacent turn-to-turn (V2–V3) voltages for healthy and degraded insulation.
Machines 06 00021 g011
Figure 12. Spectral analysis (FFT): adjacent turn-to-turn voltages for healthy and degraded insulation; (a) (V2–V4); (b) (V2–V5); (c) (V2–V6).
Machines 06 00021 g012aMachines 06 00021 g012b
Table 1. Insulation capacitances (IC) for insulation with healthy and degradation/corrosion statuses.
C i i ( p F ) HealthyDielectric DegradationCorrosion
1st Turn1st + 2nd TurnAll Turns
C 11 63.93464.83965.97166.3570.966
C 22 91.06491.97493.23994.231107.178
C 33 68.60968.49969.17370.14877.544
C 44 63.56064.29964.36465.39169.733
C 55 81.63681.15581.72283.90790.302
C 66 64.71964.70164.81866.31270.289
C i j ( p F ) Healthy1st Turn1st + 2nd TurnAll TurnsCorrosion
C 12 40.53641.28542.01341.85850.067
C 14 32.33632.97633.32533.56138.445
C 15 4.2394.2863.9023.4998.315
C 23 40.87940.93741.28641.60151.618
C 24 26.72626.99227.25527.17535.476
C 25 40.86440.64640.89341.33350.896
C 35 24.62824.37024.50924.62432.896
C 36 22.76922.72922.68922.99327.292
C 45 28.77328.61228.39928.84133.710
Table 2. Frequency-dependent resistance/inductance values.
FrequenciesResistancesInductances
R i i a v e ( m Ω ) R i j a v e ( μ Ω ) L i i a v e ( n H ) M i j a v e ( n H )
10 Hz9.560.1094373.77199.75
1 kHz10.11570.34250.8867.64
10 kHz11.891627.34167.035.63
50 kHz21.091753.72134.640.253
100 kHz31.341841.05116.400.153
500 kHz77.922002.586.190.0976
1 MHz114.81208678.260.00492
10 MHz427.852132.6764.410.000413

