Article

Fuzzy Pattern Classification Based Detection of Faulty Electronic Fuel Control (EFC) Valves Used in Diesel Engines

1
Cummins, Inc., Columbus, IN 47202, USA
2
Indiana University Purdue University Indianapolis, Indianapolis, IN 46202, USA
*
Author to whom correspondence should be addressed.
Machines 2014, 2(2), 99-119; https://doi.org/10.3390/machines2020099
Submission received: 19 January 2014 / Revised: 30 March 2014 / Accepted: 15 April 2014 / Published: 7 May 2014
(This article belongs to the Special Issue Advances in Control Engineering)

Abstract

:
In this paper, we develop mathematical models of a rotary Electronic Fuel Control (EFC) valve used in a Diesel engine based on dynamic performance test data and system identification methodology in order to detect the faulty EFC valves. The model takes into account the dynamics of the electrical and mechanical portions of the EFC valves. A recursive least squares (RLS) type system identification methodology has been utilized to determine the transfer functions of the different types of EFC valves that were investigated in this study. Both in frequency domain and time domain methods have been utilized for this purpose. Based on the characteristic patterns exhibited by the EFC valves, a fuzzy logic based pattern classification method was utilized to evaluate the residuals and identify faulty EFC valves from good ones. The developed methodology has been shown to provide robust diagnostics for a wide range of EFC valves.

1. Introduction

An Electronic Fuel Control (EFC) valve regulates the fuel flow to the injector fuel supply line in a Pressure-Time (PT) fuel system in many heavy duty Diesel engines. The EFC system controls the fuel flow by means of a variable orifice that is electrically actuated. The valve inspection test results provide a characteristic curve that captures the relationship between pressure and current input to the EFC valve. These frequency response curves document the steady state characteristics of the valve but they do not adequately capture the valve’s dynamic response. To overcome this deficiency, a dynamic test procedure was developed in order to evaluate the performance of the EFC valves. The test itself helps to understand the effects of design modifications on the stability of the overall engine system. Additionally, such a test is expected to provide the ability to evaluate returned/failed EFC valves that have experienced stability issues or severe performance degradations. This test is also aimed at determining whether an EFC valve has failed or not before it is integration in a diesel engine. The characteristics of a good valve and a bad valve can be observed through the dynamic performance tests which can be used to identify the failed valve via a fault detection methodology.
Isermann [1] provides an overview of fault detection applications that uses process and/or signal models. A number of examples were discussed in this paper including the fault detection of a diesel engine using fuzzy inference engine. Venkatasubramanian, et al. [2] discussed fault diagnosis methods that are based on historic process knowledge. They observed that integrating various complementary features in model based detection is one way to develop hybrid systems that could overcome the limitations of individual solution strategies. He and Wang [3] presented a fast pattern recognition based fault detection method, termed principal component-based kNN (PC-kNN), which takes advantage of both principal component analysis (PCA) for dimensionality reduction and FD-kNN for nonlinearity and multimode handling. Two simulation examples and an industrial example are used to demonstrate the performance of the proposed PC-kNN method in fault detection. Lou and Loparo [4] presented a scheme for the diagnosis of localized defects in ball bearings based on wavelet transform and neuro-fuzzy classification. Vibration signals for normal bearings, bearings with inner race faults and ball faults were acquired from a motor-driven experimental system. The wavelet transform was used to process the accelerometer signals and to generate feature vectors. An adaptive neuro-fuzzy inference system (ANFIS) was trained and used as a diagnostic classifier. He, et al. [5] reviewed application of fuzzy pattern recognition in intelligent fault diagnosis systems and provided some results with an illustrative example while Bhushan and Romagnoli [6] discussed a method for unsupervised pattern classification called self-organizing self-clustering network in the context of chemical process plant. Podvin [7] provided a fuzzy-logic-based fault recognition method using phase angles between current symmetrical components in automatic DFR record analysis while Detroja, et al. [8] presented a possibilistic clustering approach to novel fault detection and isolation.
In this work, both frequency domain and time domain system identification methods were explored in order to determine the characteristics of the EFC valves. Bode diagrams and step responses were utilized to identify the EFC valve, and combining the two methods offered an estimate of the order of the system while maintaining the integrity of the results when compared to one another. The two methods mentioned above proved to be efficient with process speed, as well as being robust, where the outcomes do not have significant variations. This led to the development of a pattern classification contributing to the robust fault diagnosis of EFC valves based on the dynamic performance test data.
Recursive Least Squares (RLS) algorithm was used in discrete time domain to estimate the transfer function of the EFC valves. The transfer functions thus obtained shows distinctive features depending on the nature of the EFC valve, i.e., whether it is a failed part, a good part, or a prototype part. This information is later used in the pattern classification algorithm development for fault diagnosis purposes.
As indicated above, this work involves fuzzy pattern classification based fault detection of electronic fuel control valves from data obtained from the proposed dynamic performance tests. The proposed methodology is based on a step response test of the EFC valves. Crisp logic based residual evaluation is prone to less effective diagnosis since the residual error threshold for the faulty EFC valves varies within certain range. Instead a fuzzy logic based residual evaluation methodology was considered that handled the variable error thresholds better in this application.

2. System Identification

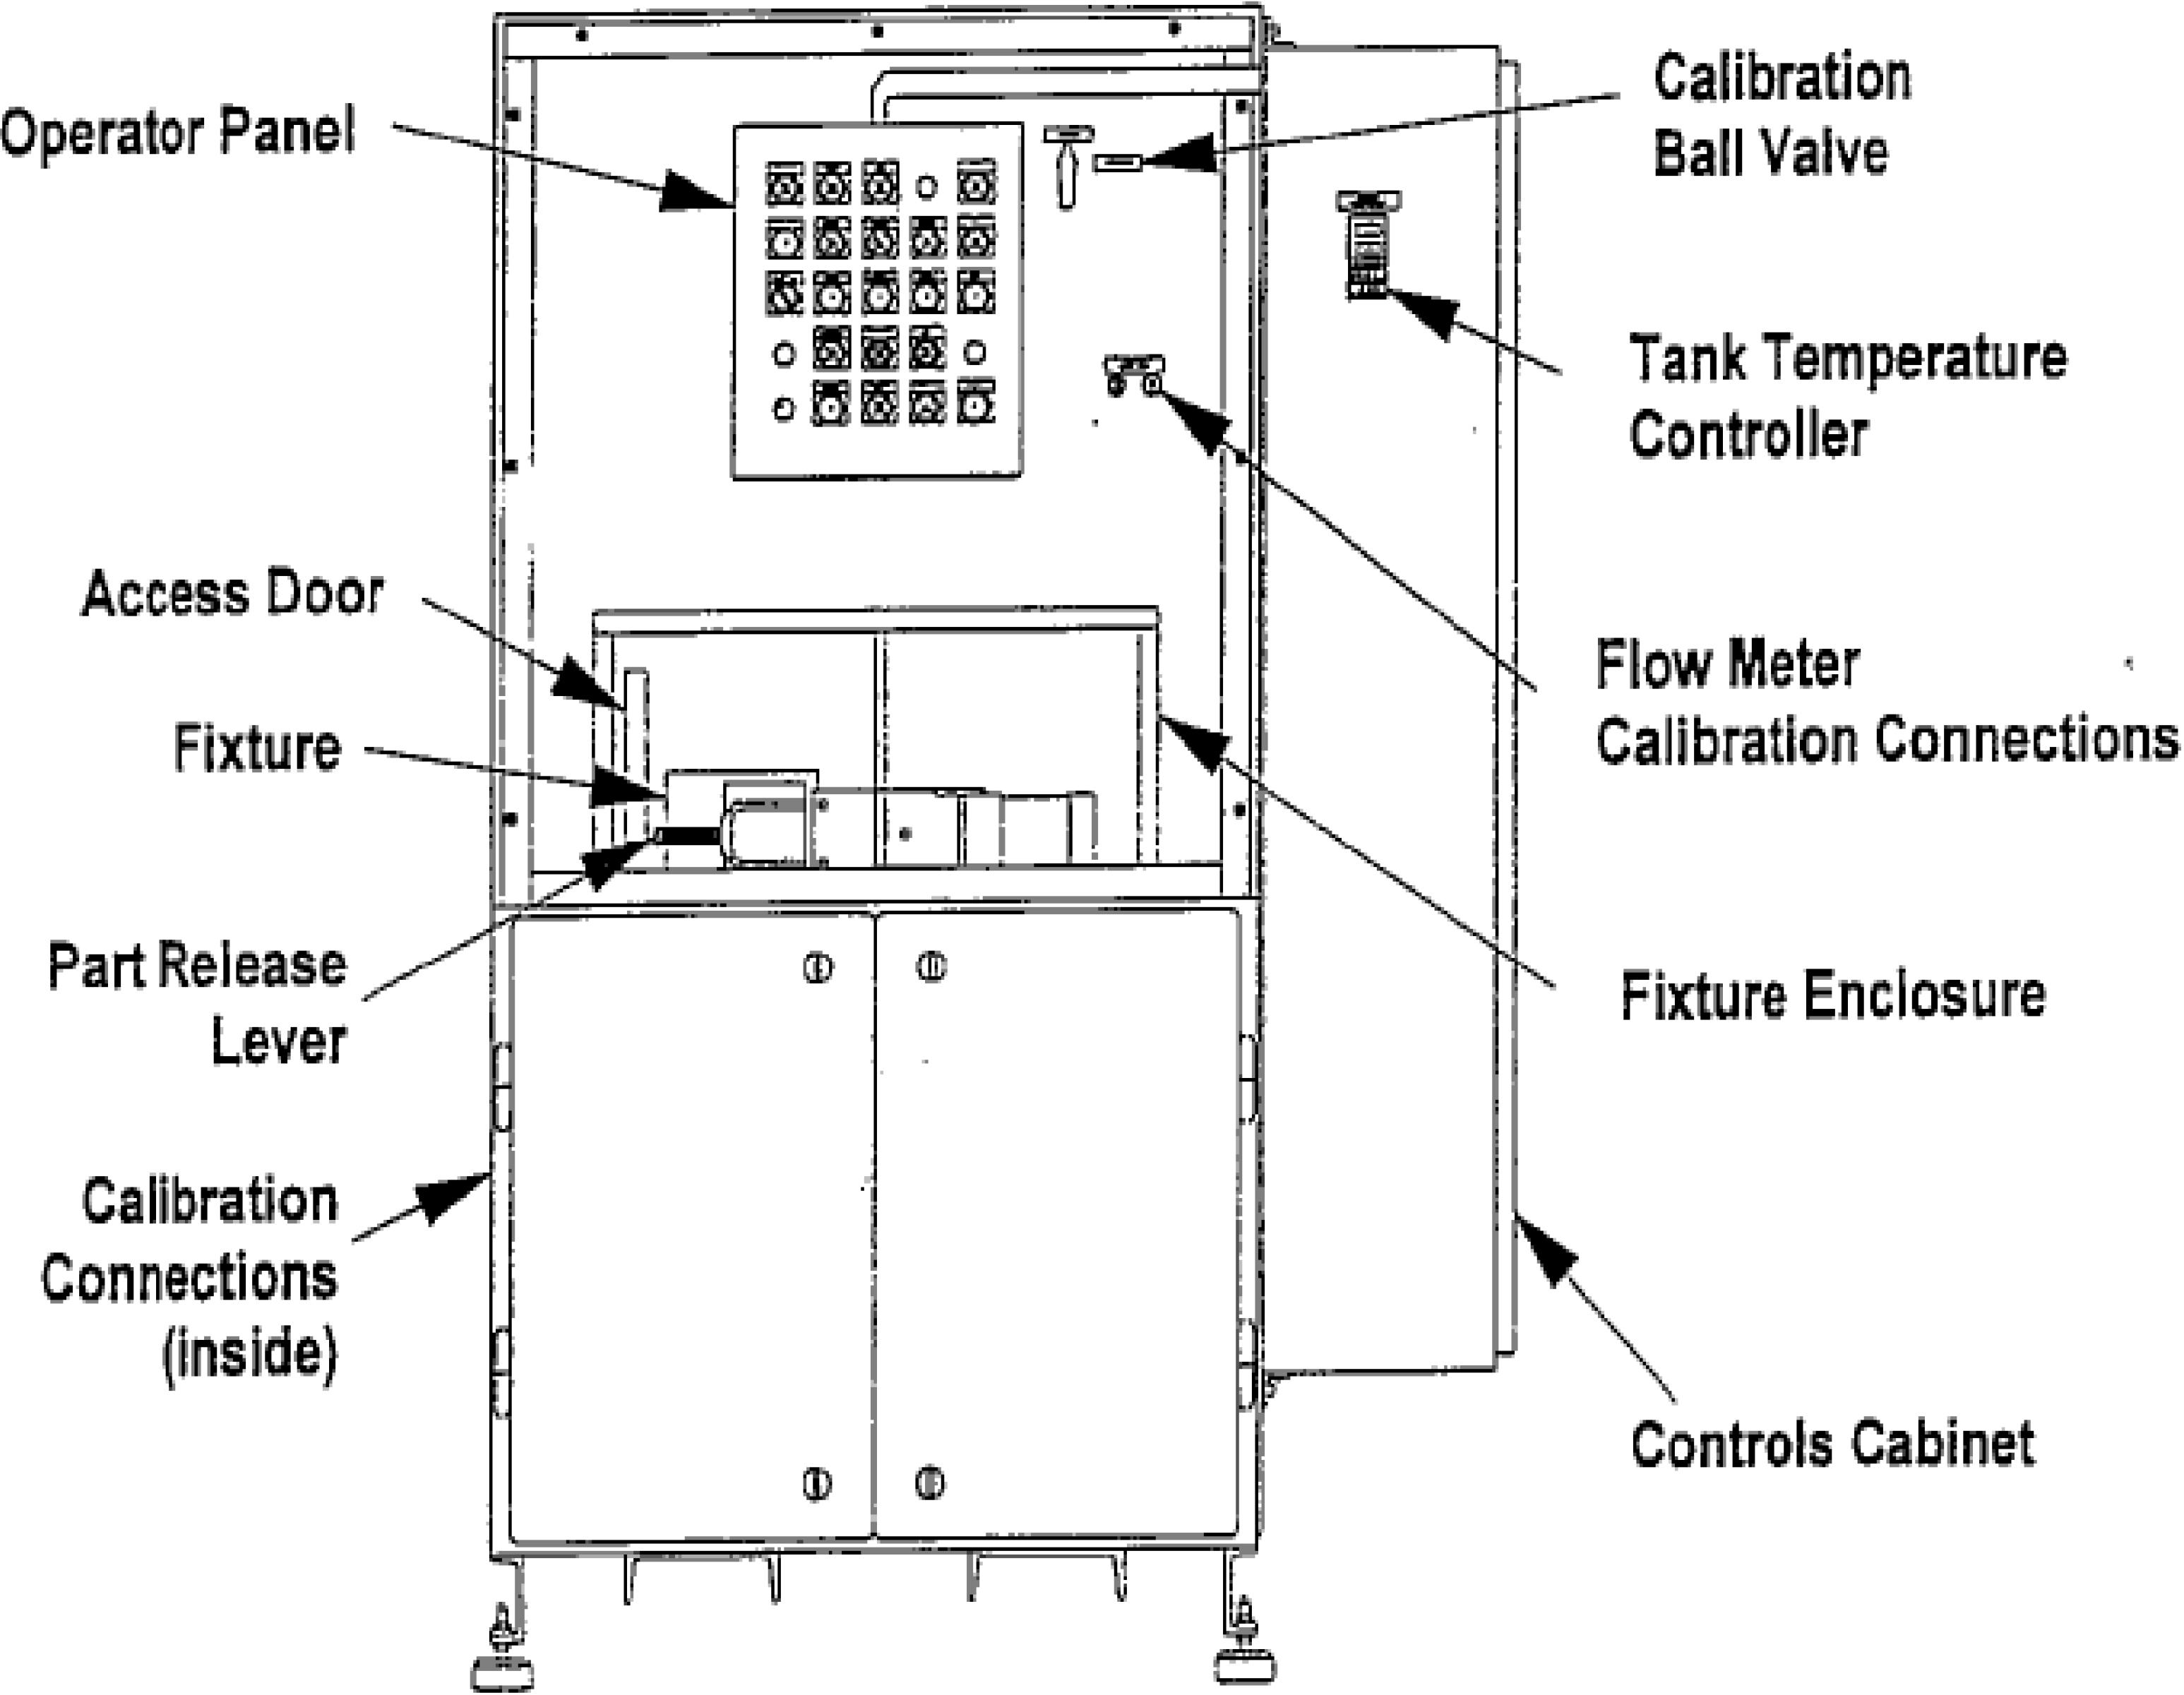
2.1. Experimental Set Up

The EFC Test Stand is used in a production environment to verify the proper operation of EFC valves [9]. It is capable of accommodating a variety of EFC valves with various voltage and normal valve position conditions. Mimicking the placement of the valve onto a pump in an engine, the EFC valve is placed in a housing on the EFC Test Stand that lines up the inlets and outlets so that a continuous stream of fluid can be transferred based on the proportional variation of the orifice size. The EFC valve spool displacement is regulated via the duty cycle of a pulse width modulated (PWM) DC voltage applied to the valve solenoid. The hydraulic fluid that runs through the EFC valve is regulated by a Test Fluid System. The purpose of the Test Fluid System is to maintain the pressure, temperature, and cleanliness of the fluid being tested. Figure 1 shows a frontal view of the typical setup of the Test Stand. A representative EFC valve actuation current profile with respect to desired common rail pressure is shown in Figure 2. This map is utilized to generate valve input current for both frequency response and step response tests [10].
Figure 1. Experimental setup for EFC valve test.
Machines 02 00099 g001
Figure 2. EFC valve actuation current profile with respect to desired rail pressure.
Machines 02 00099 g002

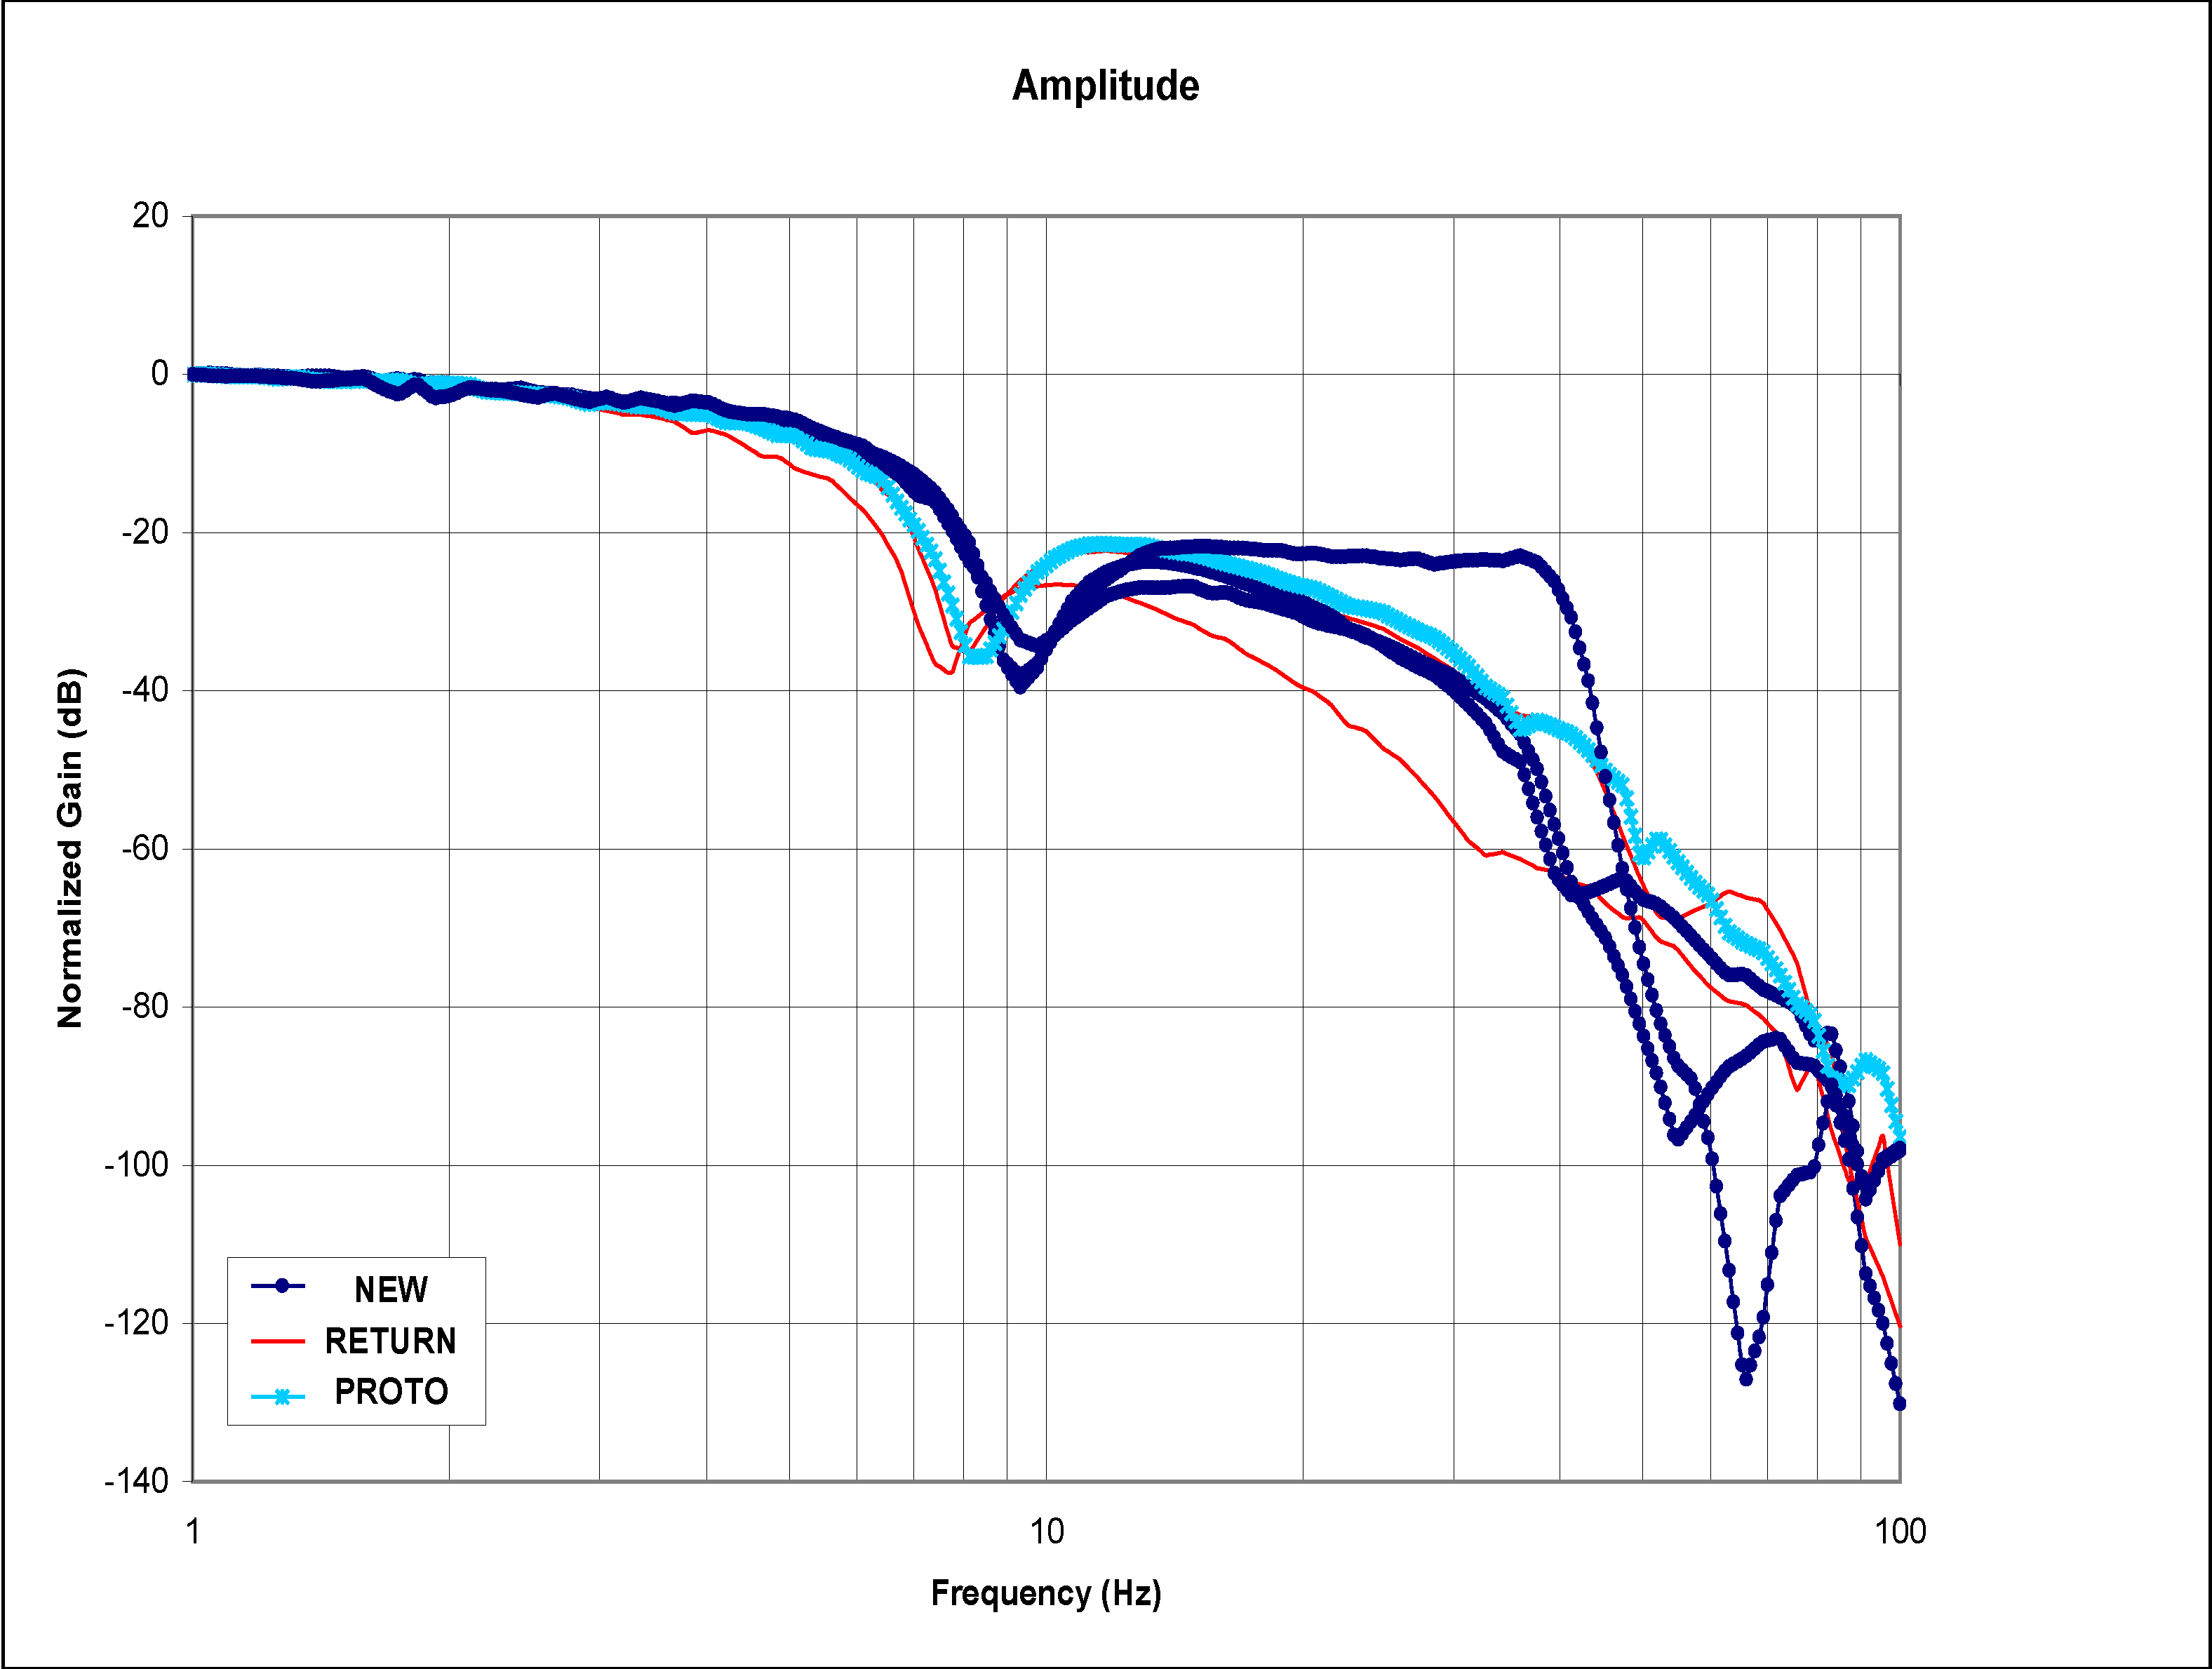
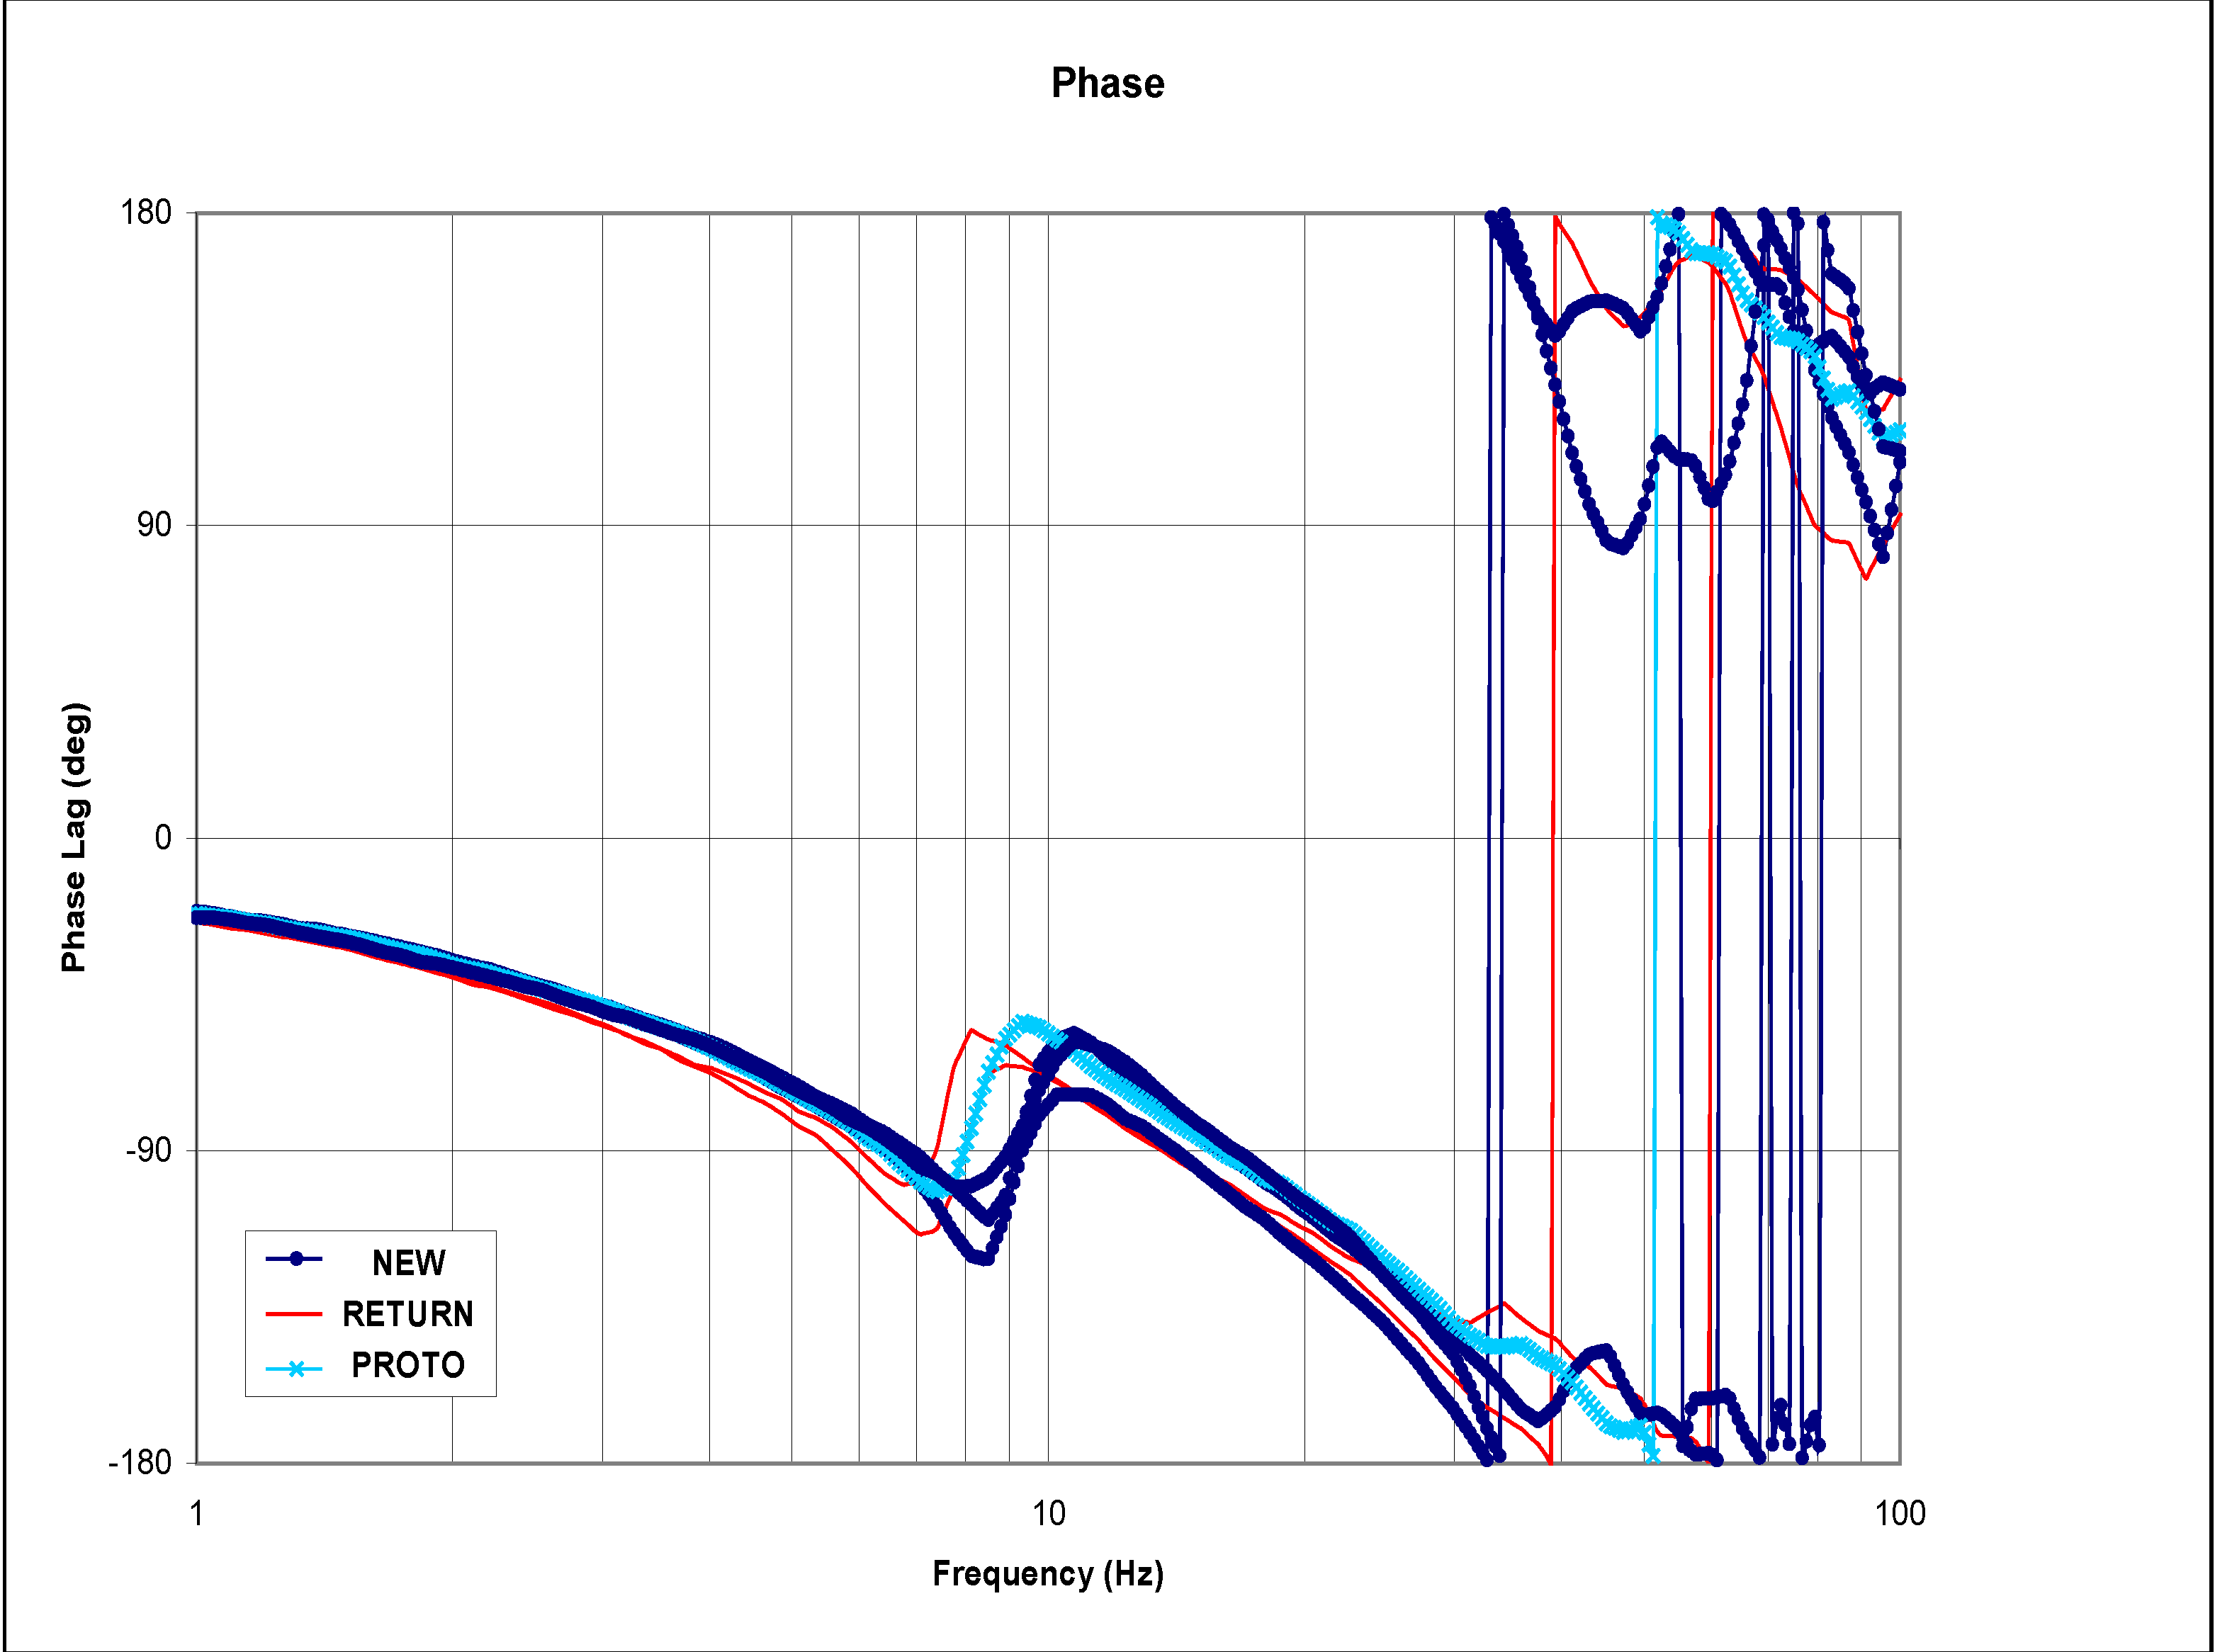
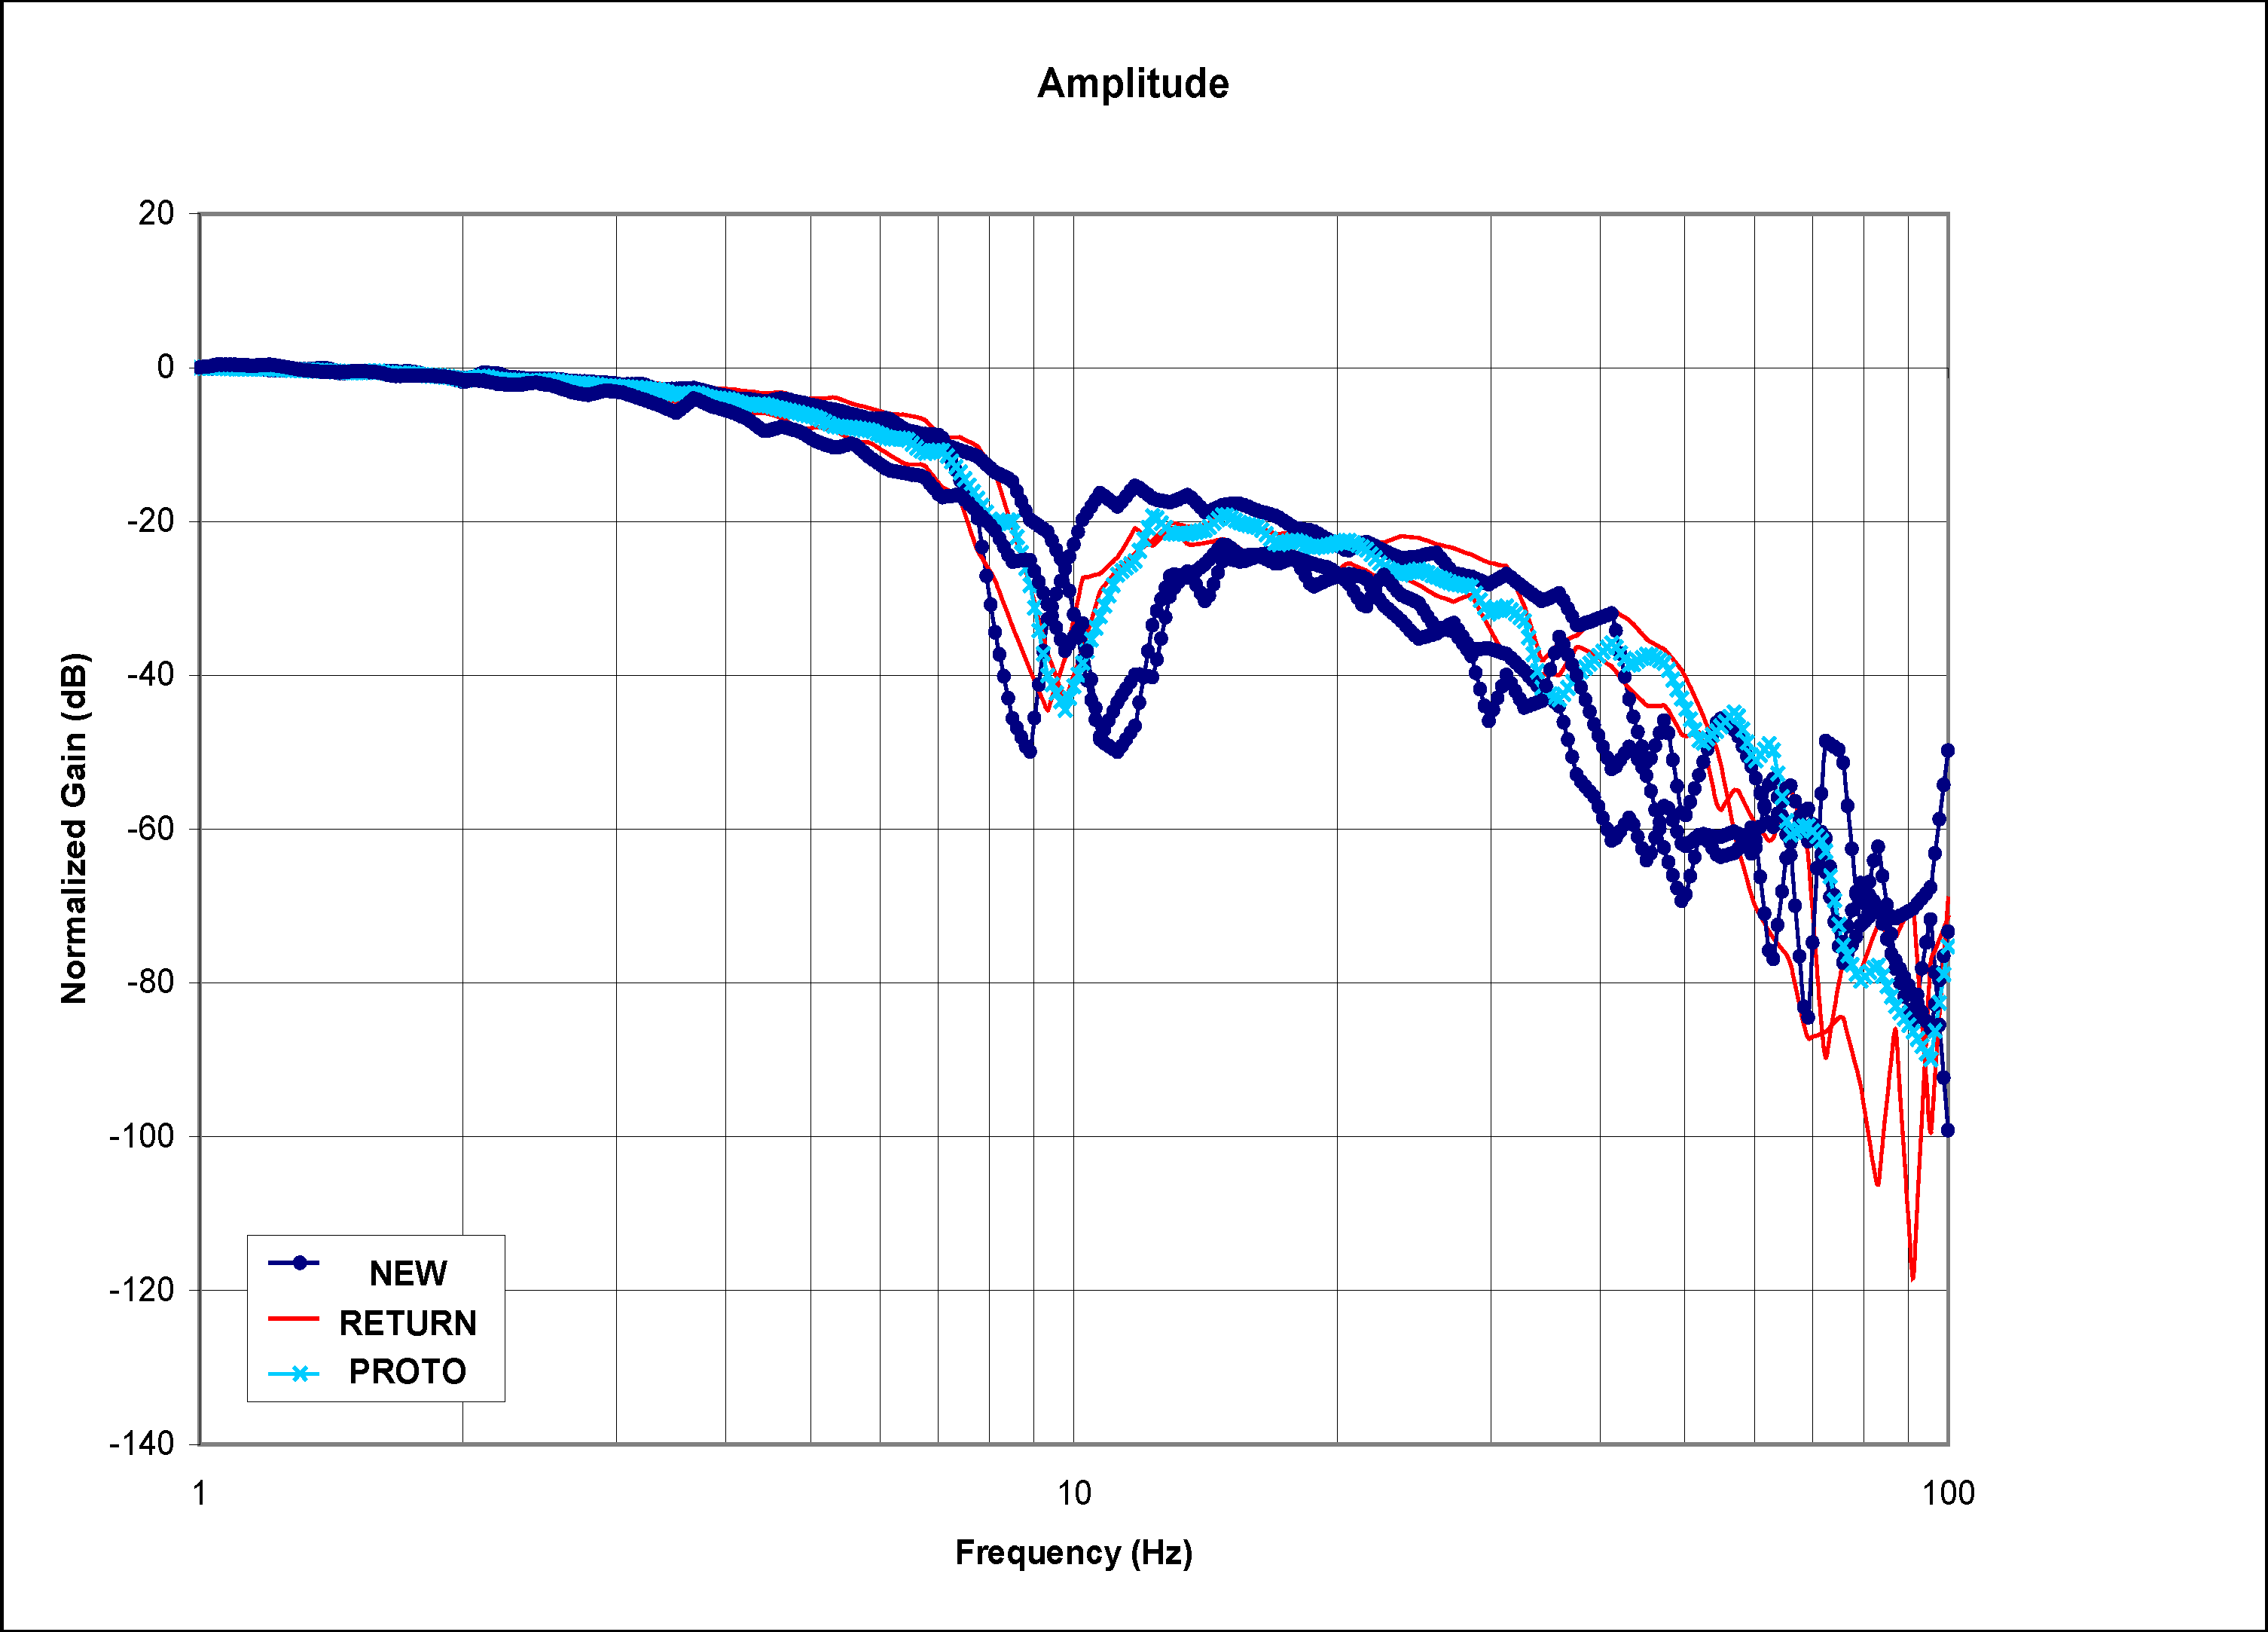
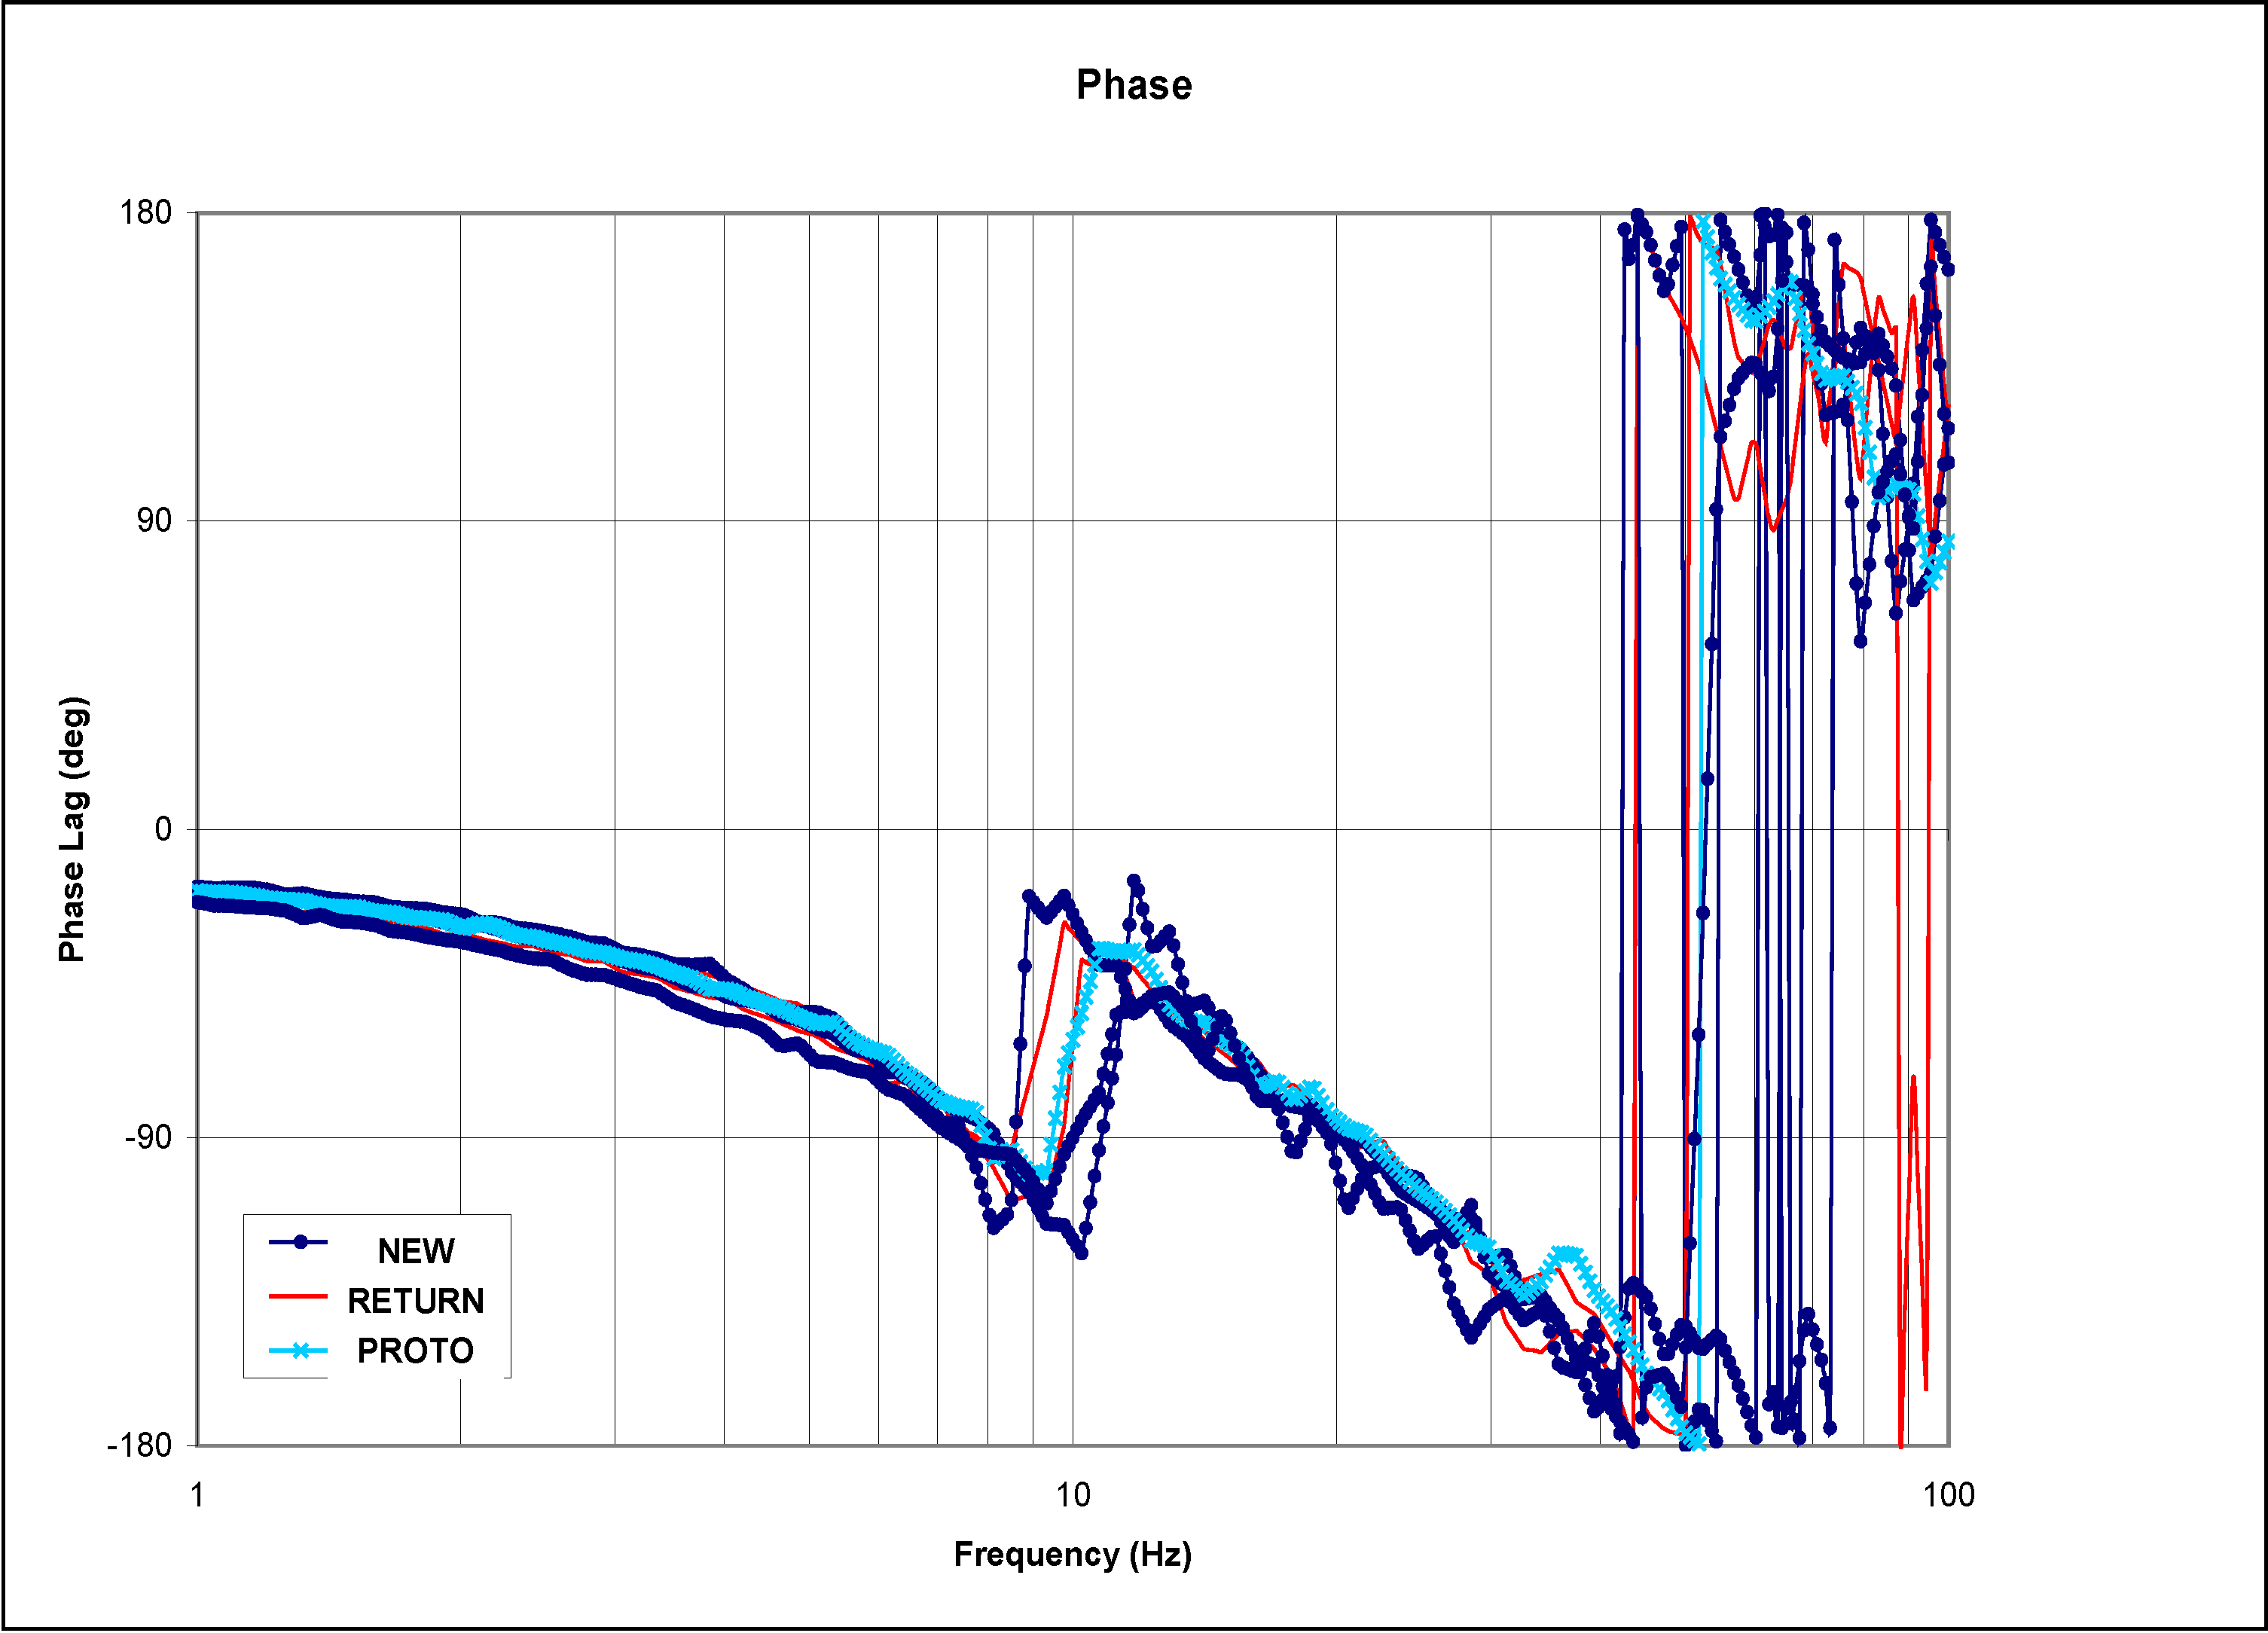
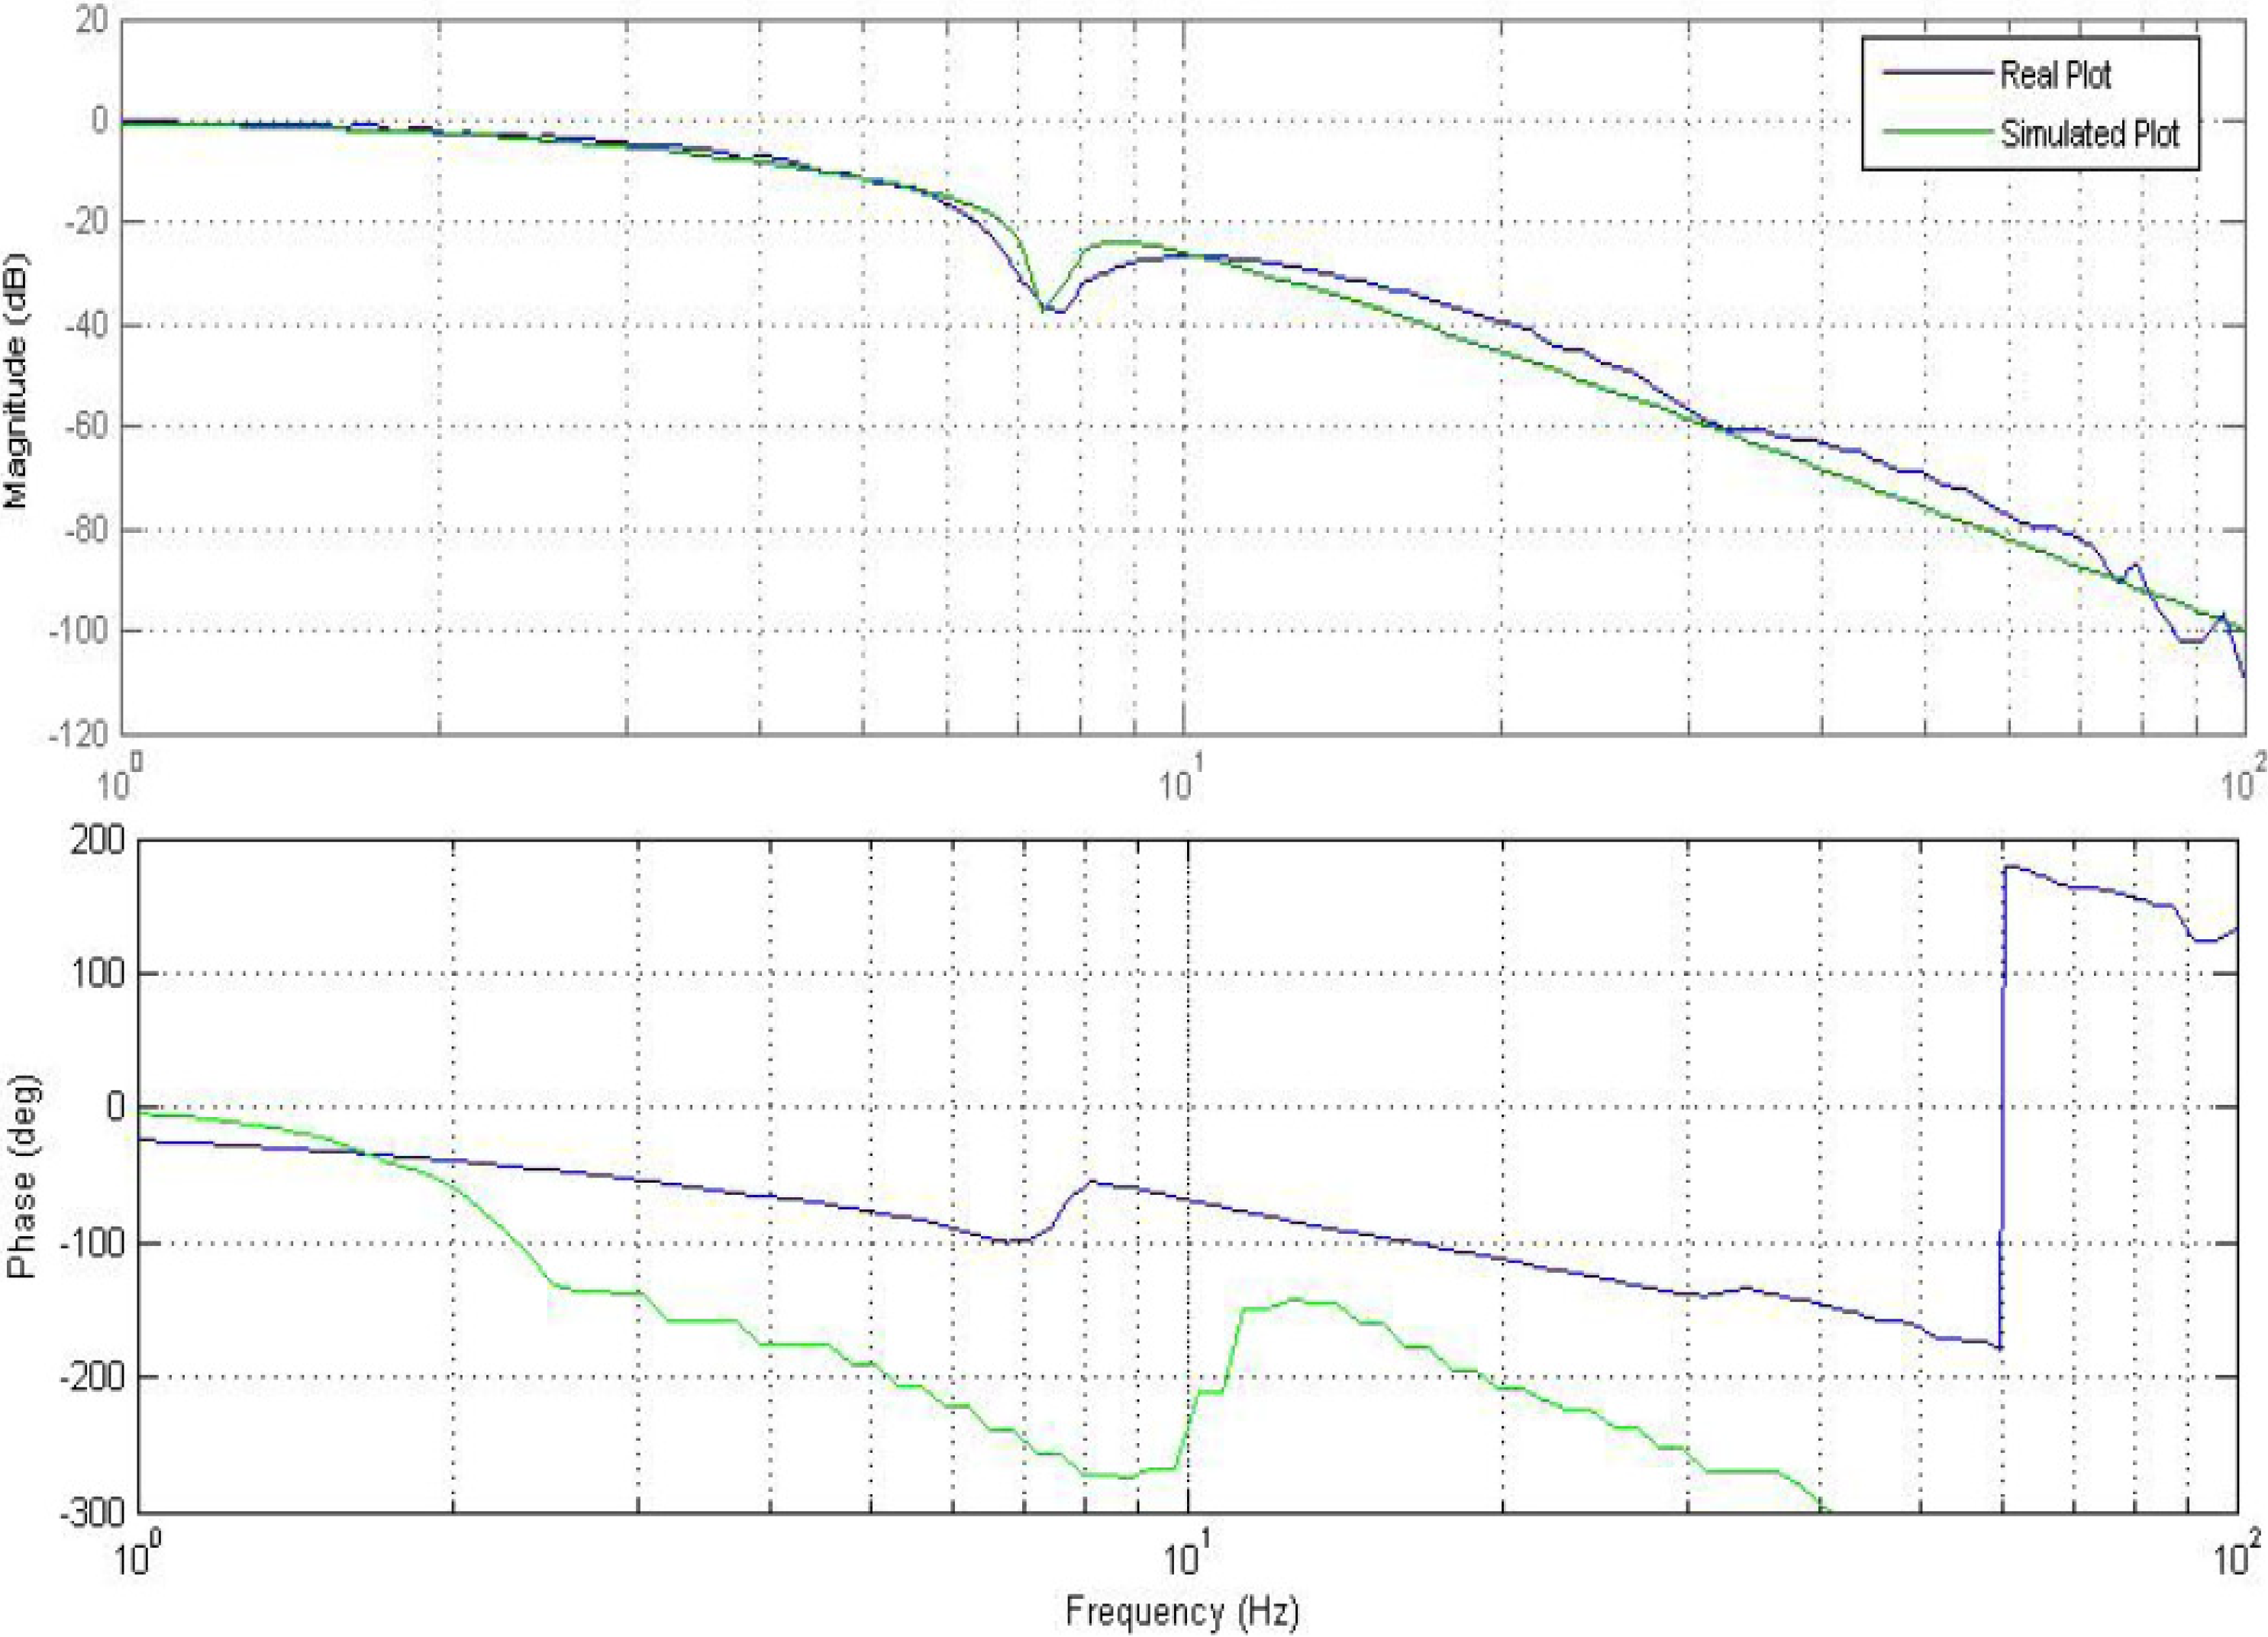
2.2. Frequency Response

Frequency sweep tests were performed on the test stand for different EFC valve types and experimental data was recorded. Figure 3 and Figure 4 show the Bode diagrams that have resulted from medium amplitude sweep using the dynamic performance test bench [11] for various categories of EFC valves. These categories are returned valve, prototype valve, and good valve. Figure 3 shows the experimental results for the normalized gain of the EFC valves, and Figure 4 shows the phase plot of the EFC valves. For both plots, it can be seen that the three types of EFC valves demonstrate clearly distinct signatures on the characteristic curves.
Figure 5 and Figure 6 show the Bode plots (normalized magnitude and phase) for high amplitude frequency sweep of different categories of the EFC valves. These plots are very similar to those for medium amplitude plot with minor variation.
In the normalized gain plots, the valves are categorized as “returned” starts decaying the earliest, followed by the valve categorized as “prototype”, and lastly the valve categorized as “good”. As expected, the same pattern repeats itself for the phases that are associated with the normalized gains.
Frequency domain identification techniques offer the following advantages: the ease of reducing the noise, reduction of the amount of data when compared to time domain data, the ease of removing the DC offset errors found in the input and output signals, no need to initially estimate the states of the system, and the ease of removing the output drift [12,13].
Figure 3. Normalized gains of the EFC valves with medium amplitude.
Machines 02 00099 g003
Figure 4. Phase plot of the EFC valves with medium amplitude.
Machines 02 00099 g004
Figure 5. Normalized gains of the EFC valves with high amplitude.
Machines 02 00099 g005
Figure 6. Phase plot of the EFC valves with high amplitude.
Machines 02 00099 g006
The Bode diagrams of the EFC valves that were constructed as a result of the frequency response give a good indication of the characteristics of the transfer function associated with these EFC valves. An educated estimate of the transfer functions [14] can be made by analyzing the characteristics of these curves, such as the slope of the asymptotes on the normalized gain plots, corner frequencies, and phase conditions. The poles and zeros of a transfer function can be estimated through minimization of estimation error. The order of the system would dictate how many parameters are to be estimated. From observation of the Bode diagrams, the EFC valve system order is approximated to be in a range between five and nine. This magnitude of system order can be attributed to the fluid dynamics within the system, the electro-mechanical system dynamics, as well as nonlinearities in the system. The structure of the model for the EFC valve is thus constructed. The algorithm developed by Santos and Carvalho [14] has been used to estimate the transfer function, where the minimization of error is performed.
Machines 02 00099 i001
here, Machines 02 00099 i00a1, k = 1,…,N denotes the Frequency Response data, and B/A denotes the estimated transfer function.

2.2.1. Model Structure

Let us assume that we will have a transfer function of the following nature [14]:
Machines 02 00099 i002
pjR, i = 1,…,np
zjR, i = 1,…,nz
In the above transfer function, the corresponding Bode plot is proportional to:
Machines 02 00099 i003
x = ln(ω), x1x2,…,xnp+nz
xi = ln|pj| Machines 02 00099 i00a2 tj = 1, j = 1,…,np
xi = ln|zj| Machines 02 00099 i00a2 tj = −1, j = 1,…,nz And the asymptote is given by:
Machines 02 00099 i004
By computing the difference between Equations (3) and (4), the magnitude of error in the normalized gain plots can be estimated.
Machines 02 00099 i005
The error magnitude, which is dependent on the distance (xxi), is the largest when x = xi and approaches zero when (xxi) → ±∞. This is taken into consideration in the transfer function estimation process.

2.2.2. Asymptotic Approximation to the Bode Diagram
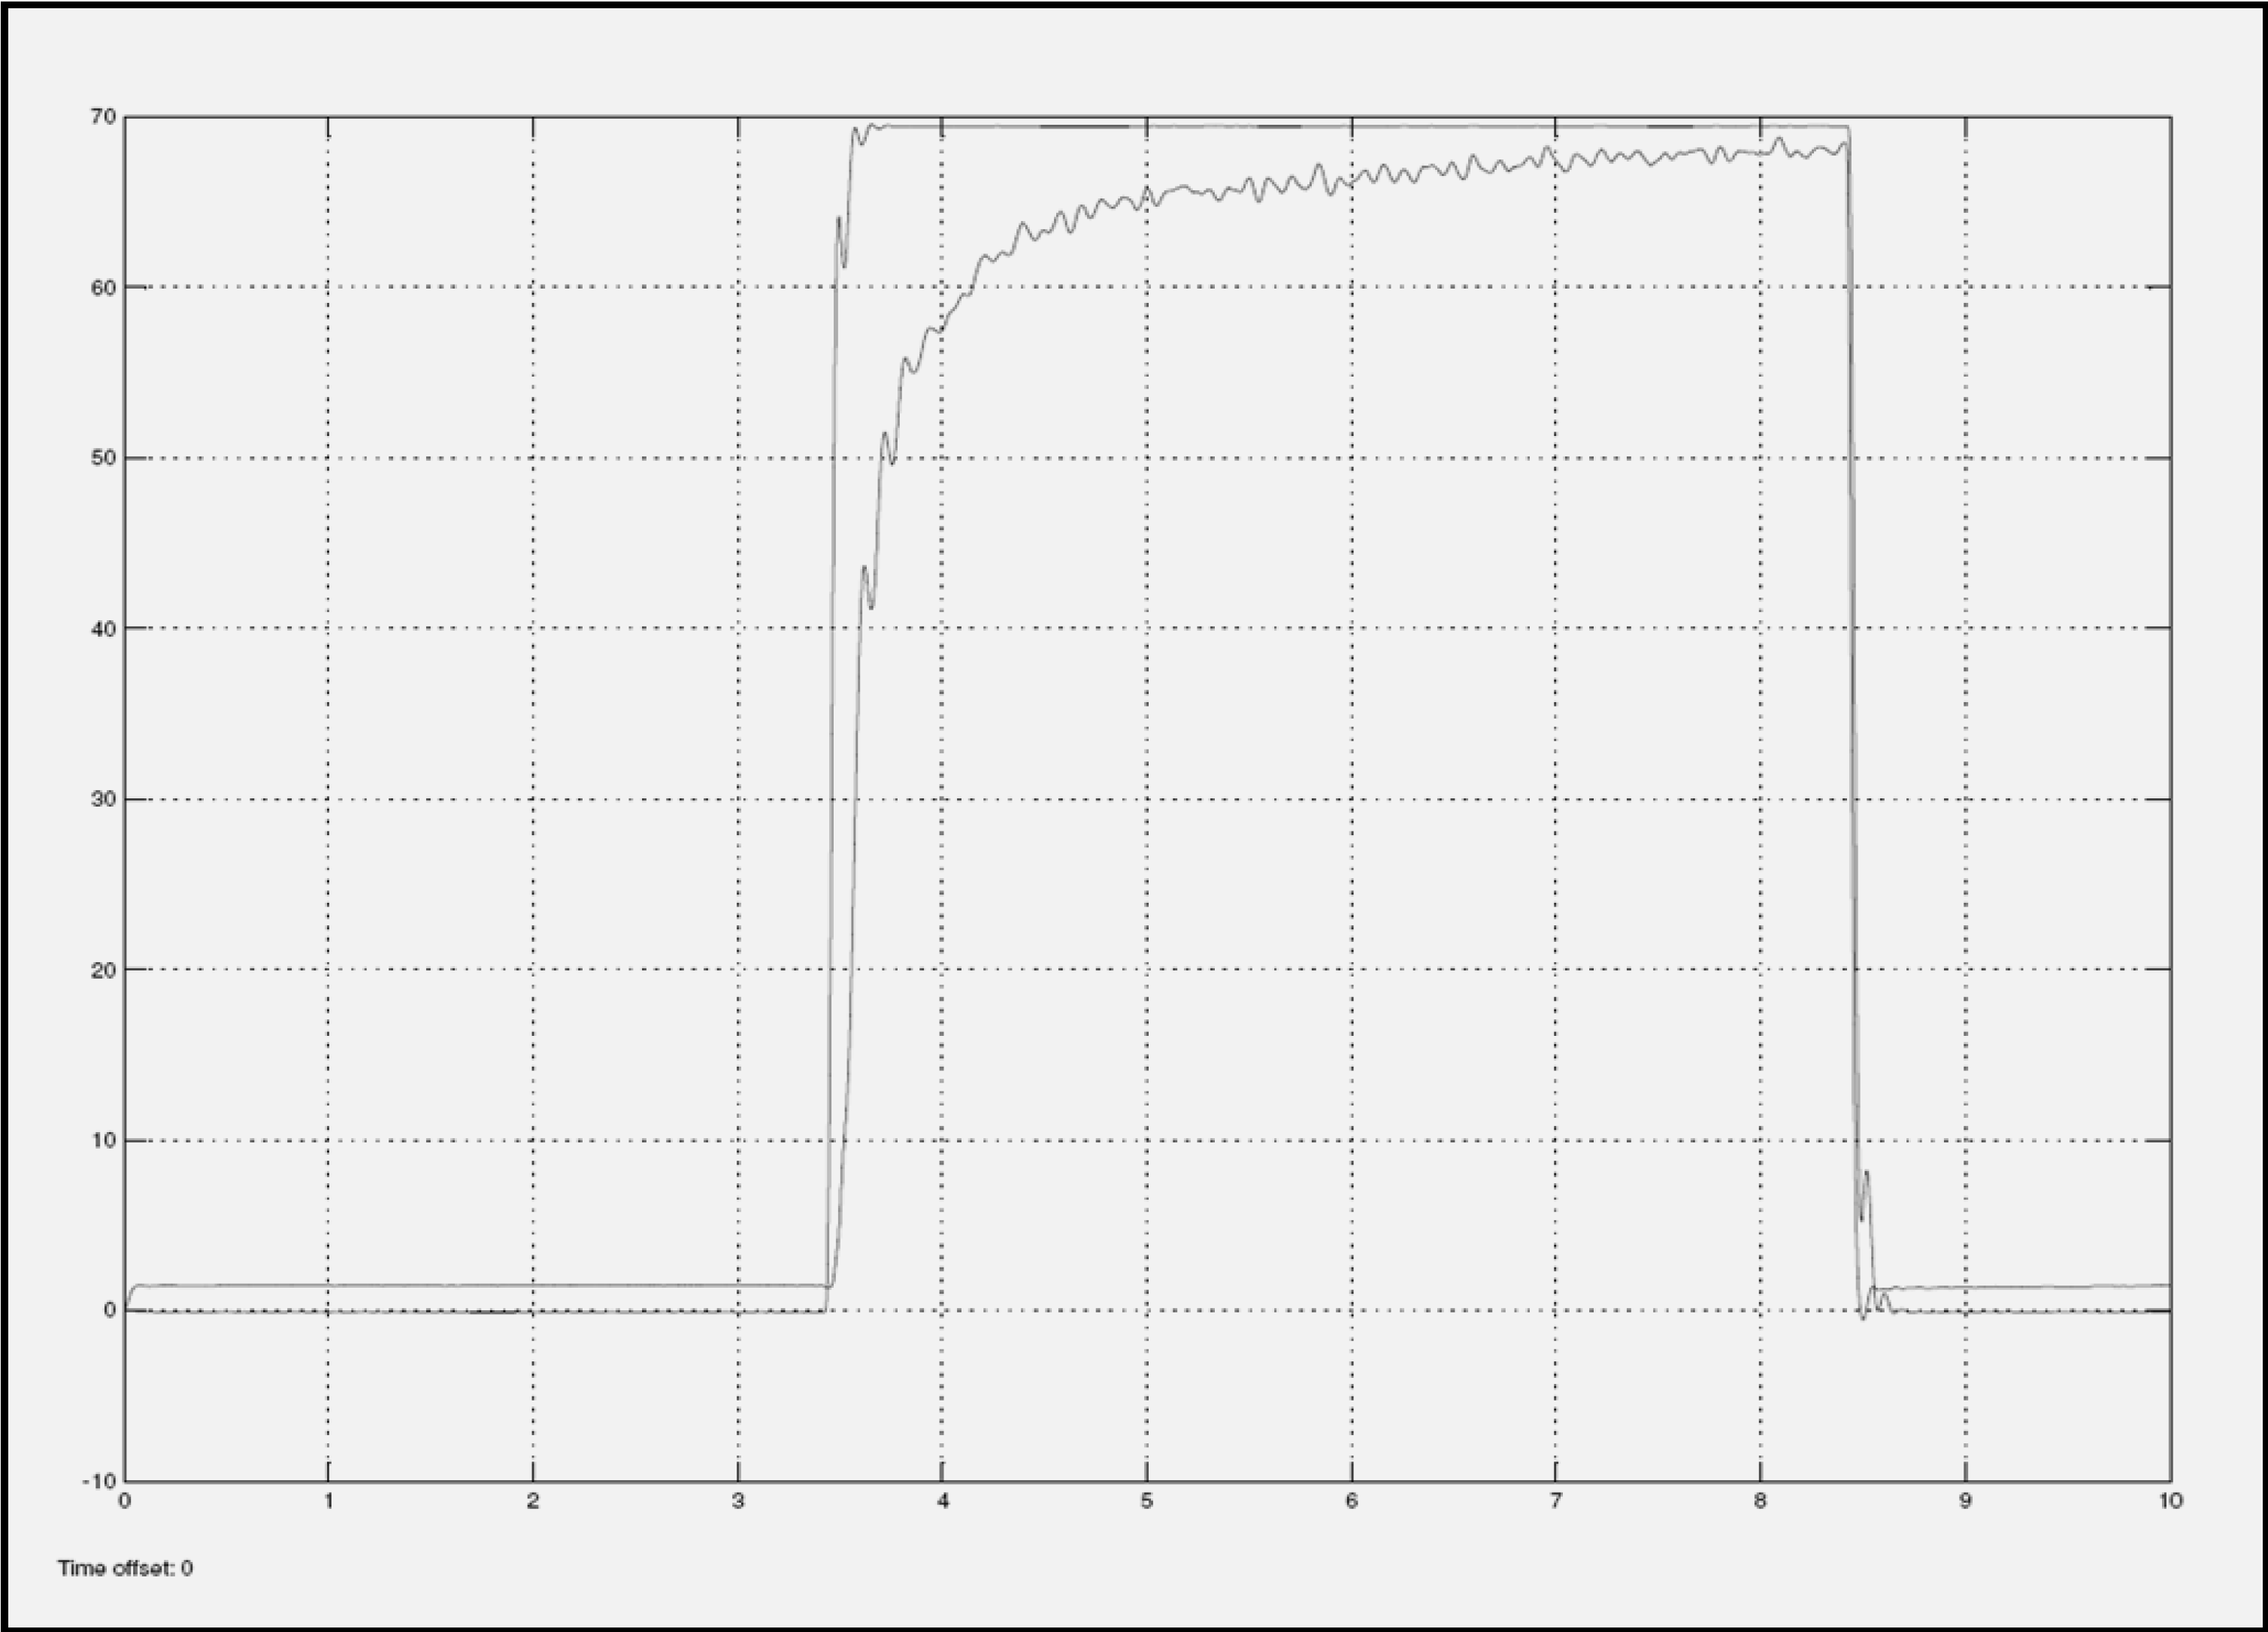
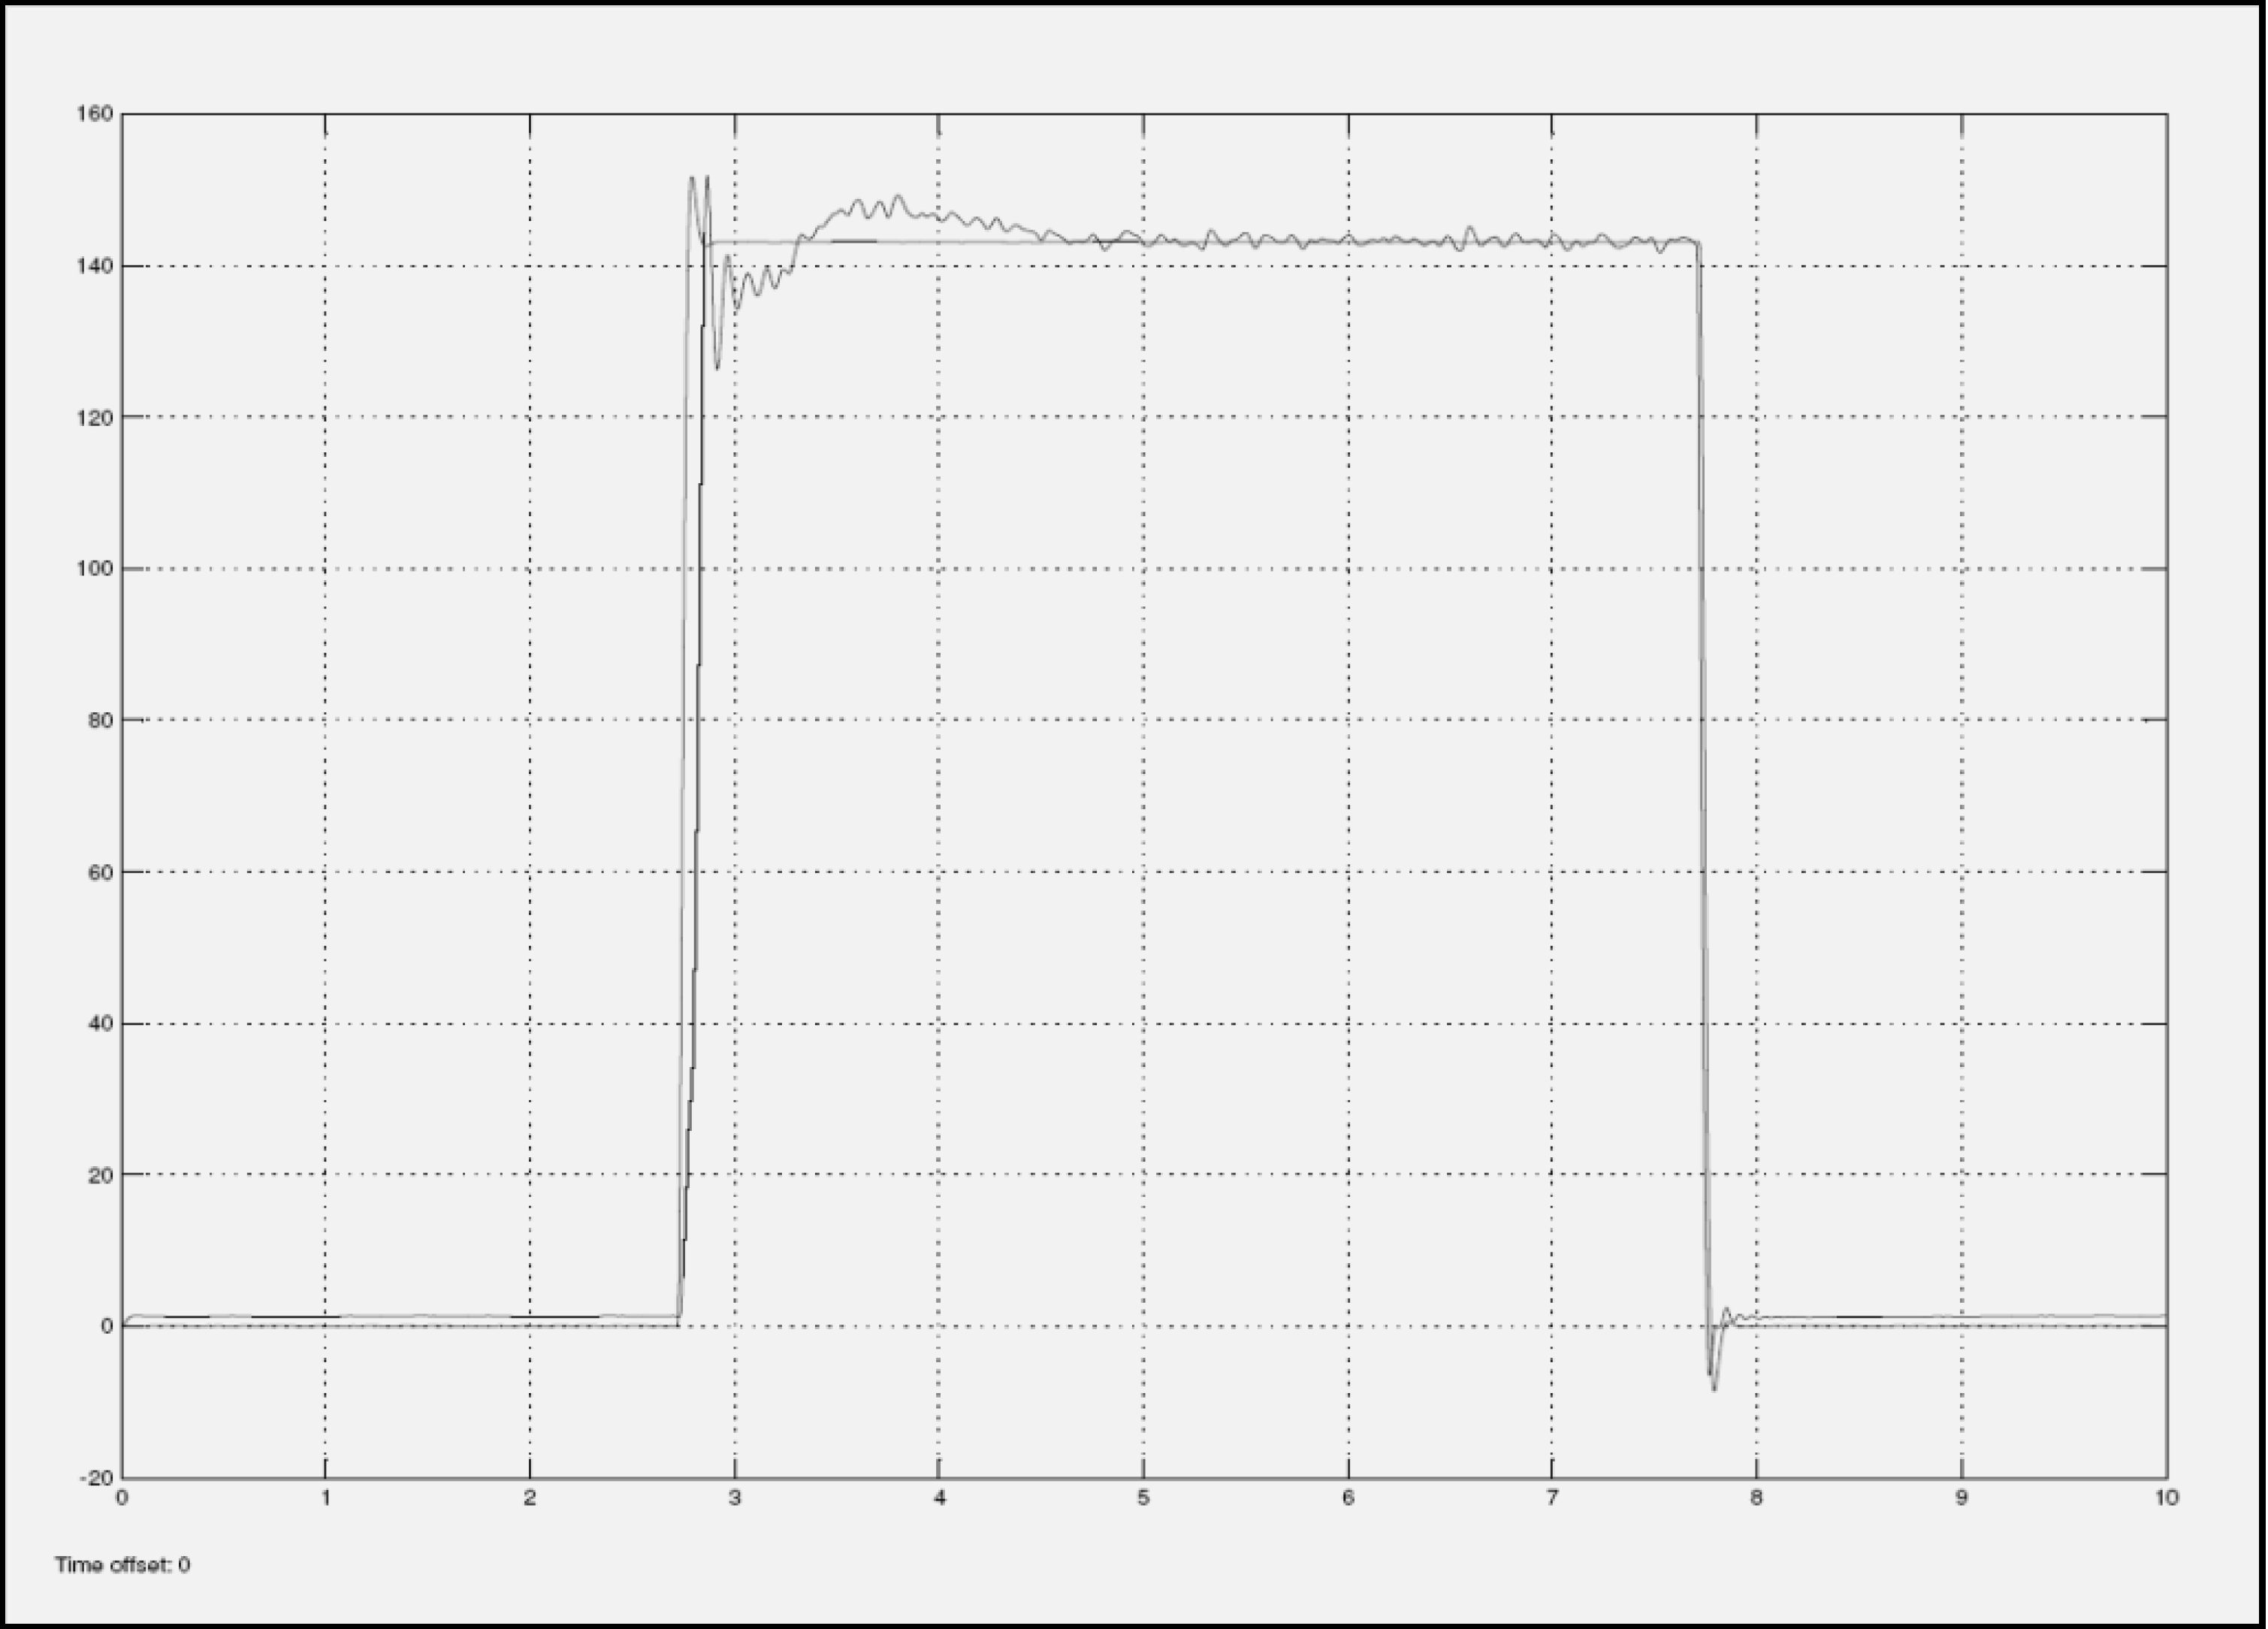
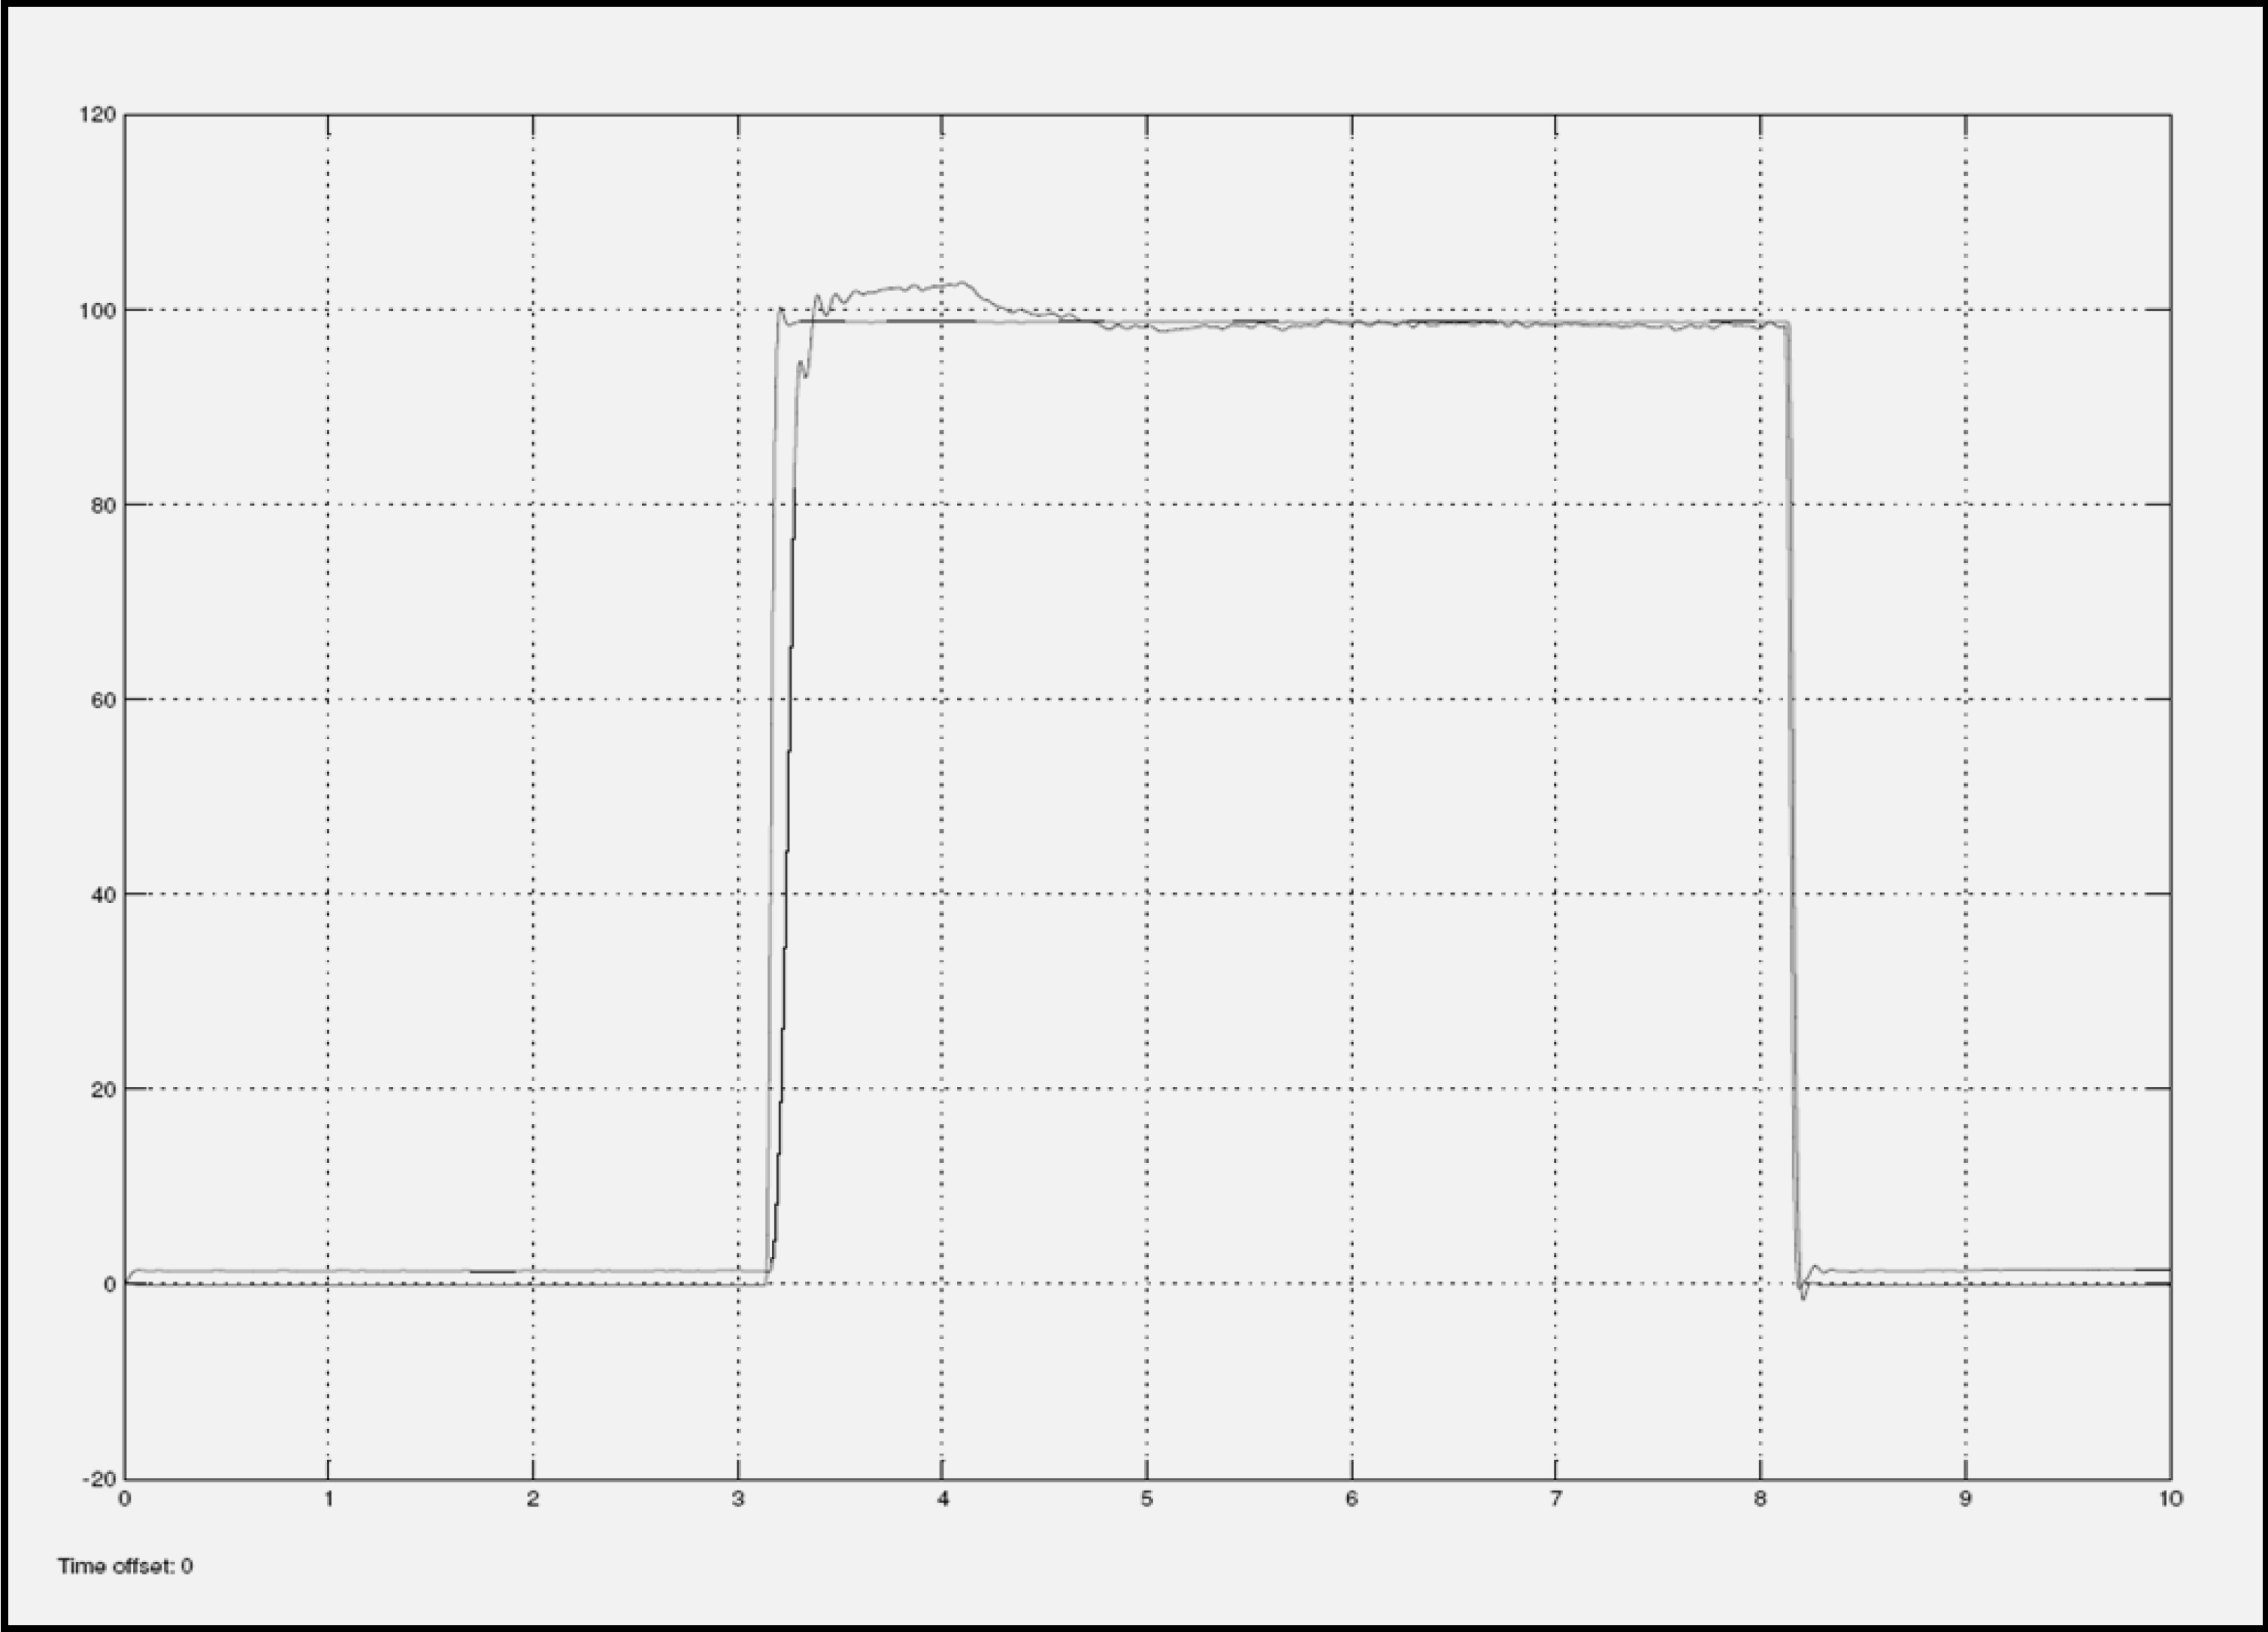
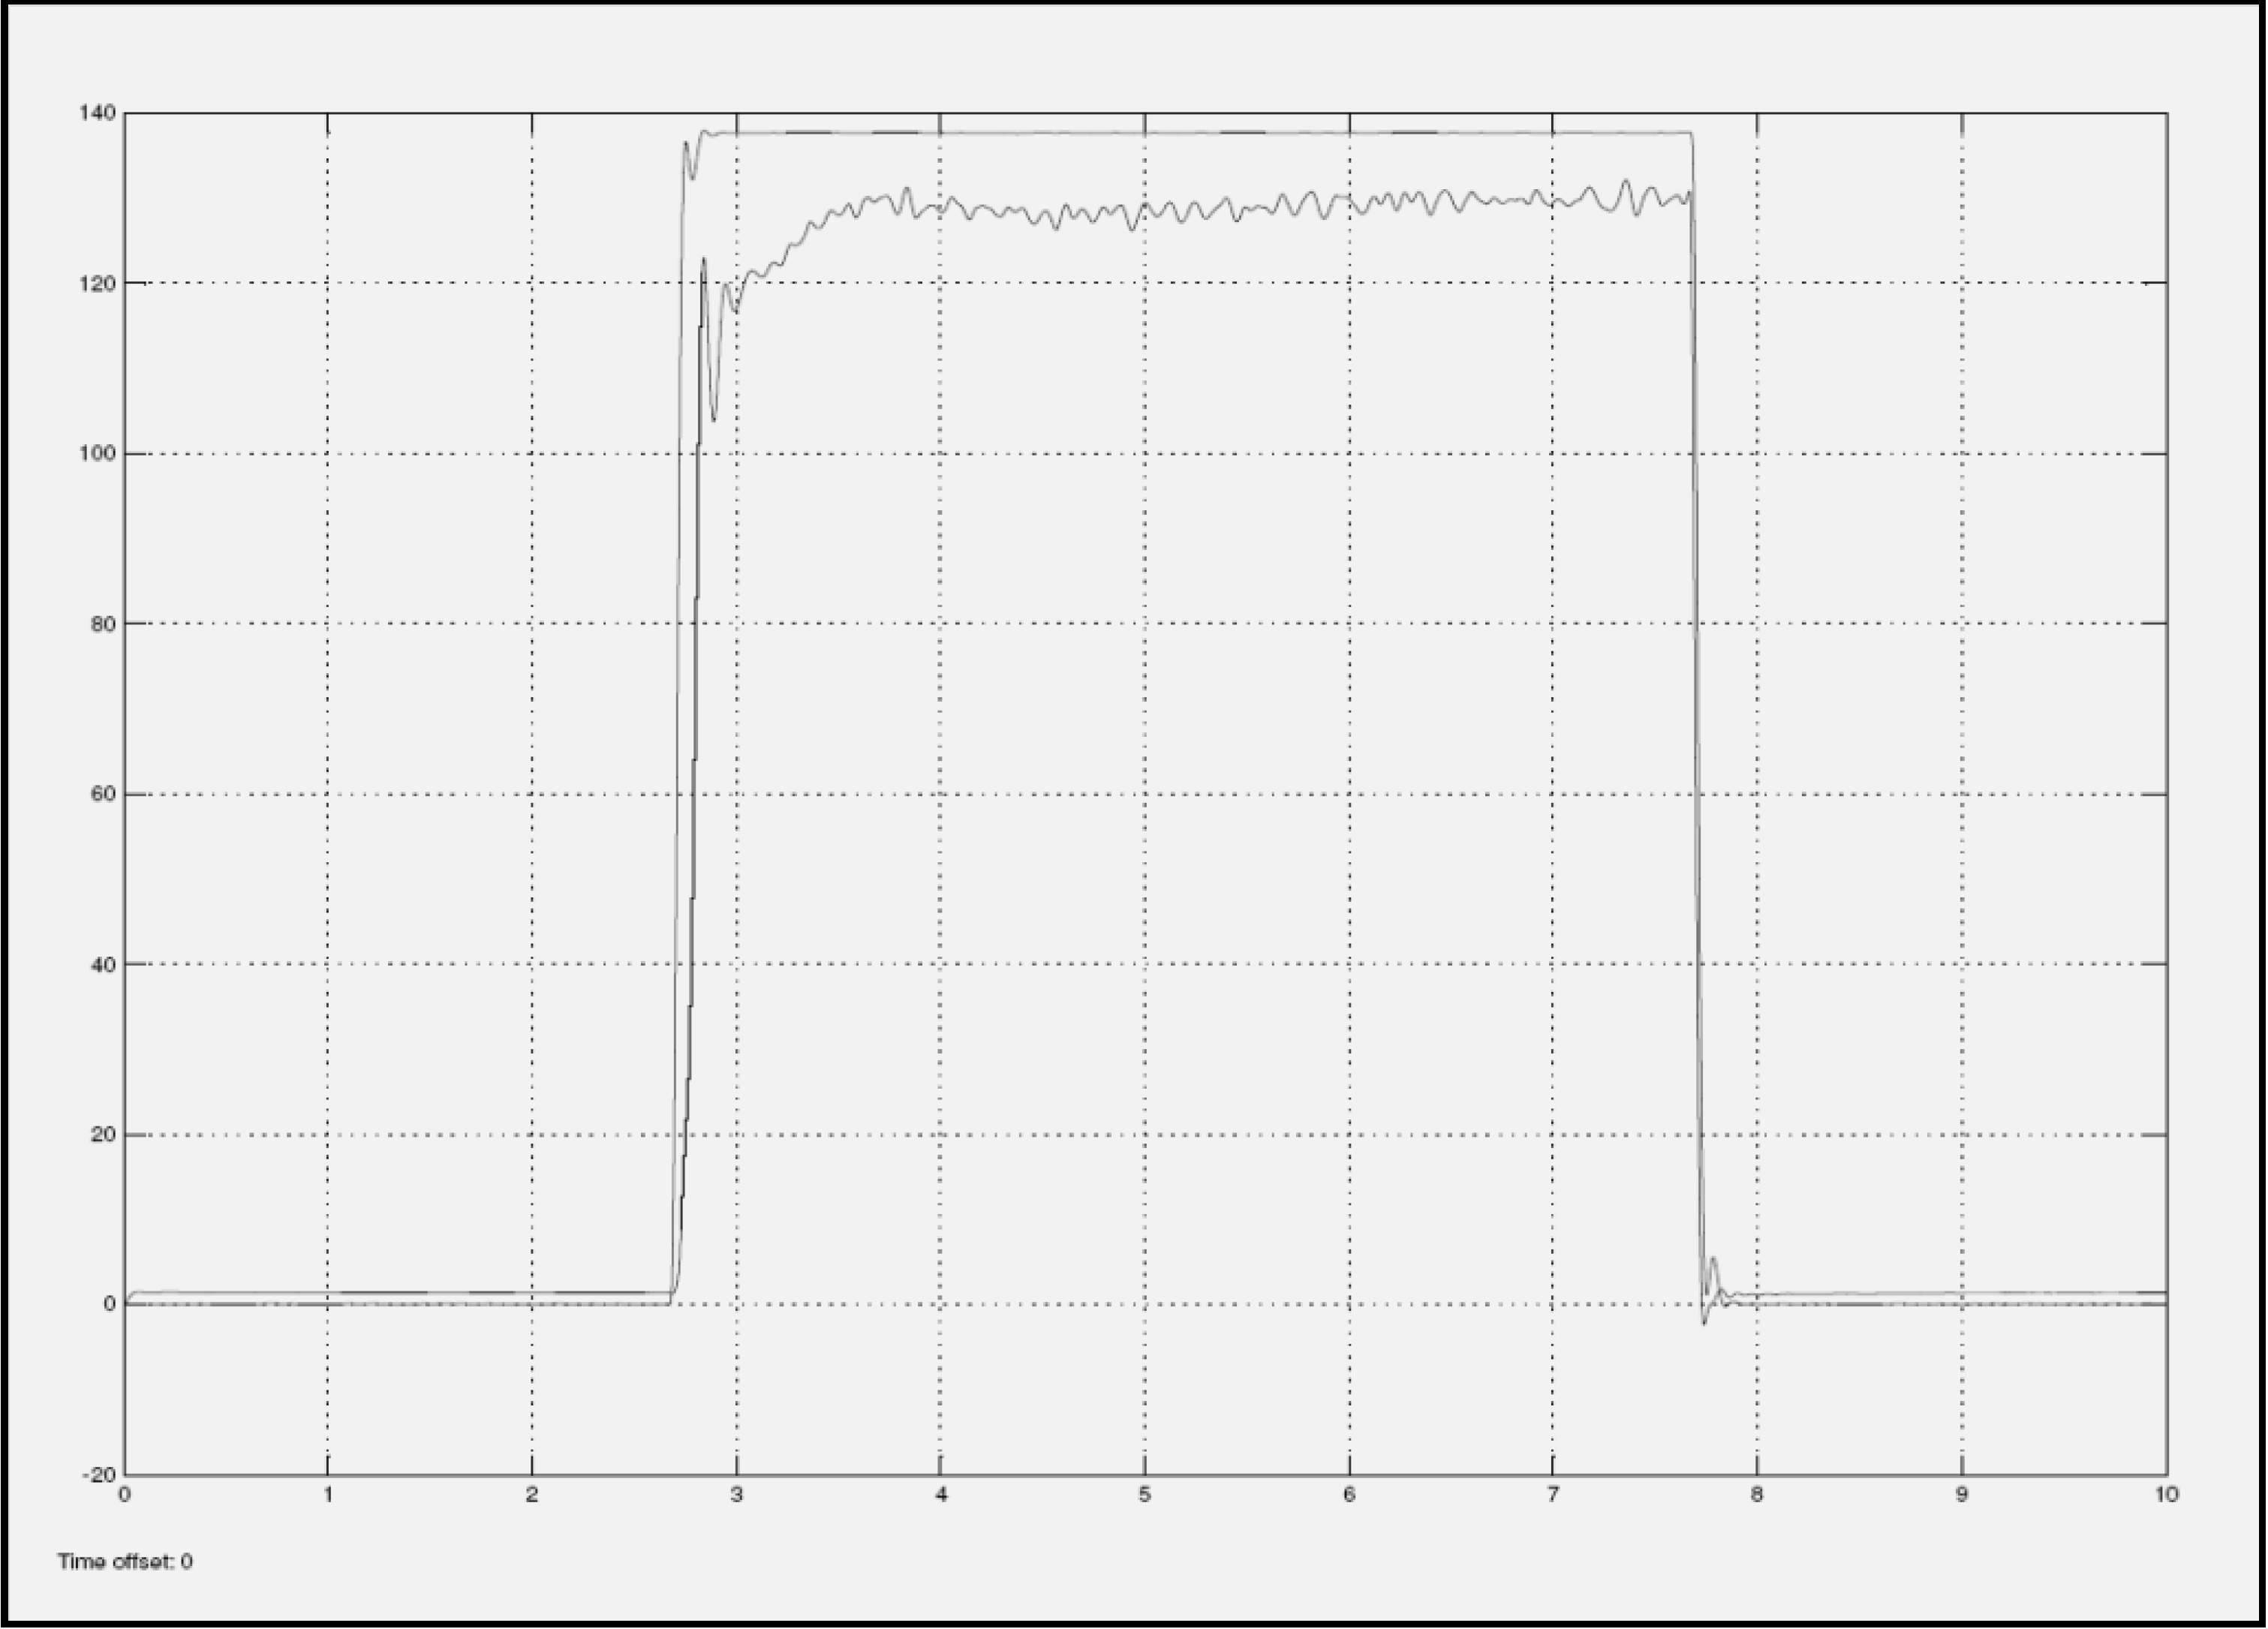
With the assumption of using a continuous set of measurements in the range [xmin, xmax], the estimates can be refined through minimization to the following objective function:
Machines 02 00099 i006
where n = np + nz. For the transfer functions with poles and zeros sufficiently far apart, the minimum of J(θ) will lie in a region where V is convex. Therefore minimization of J would lead to the minimum of V as well.

2.3. Step Response

Time domain identification methods can provide a simple, yet robust approach for identifying complex systems. Such system identification techniques can also utilize the boundary condition data that is already known.
The pressure response curves of the EFC valves that were constructed as a result of the step response already proved effective in capturing the characteristic signatures as indicated earlier. The transfer function of the EFC valves can be estimated by identifying the model parameters using a given set of data with the help of a system identification tool already proven effective in this field. This method could be conducted in an offline manner. However, periodic online identification process would also be effective when the new data points become available. The raw data acquired through the step response tests is analyzed and then utilized for the purposes of estimating the transfer function using the Recursive Least Squares (RLS) algorithm [15,16,17]. A brief description of the RLS algorithm is given below.

2.3.1. Recursive Least Squares (RLS) Algorithm

For the purpose of identifying the model parameters of the EFC valve, the RLS algorithm is based on the following model. [18].
Machines 02 00099 i007
We assume ĉ1 to be zero since it is the coefficient of correlated noise thus Equation (7) becomes:
Machines 02 00099 i008
here ε(t) represents an error that is assumed to be statistically independent of the inputs and outputs. ΨT and Machines 02 00099 i00a3 are the regression vector and parameter vector respectively, and are defined as
Machines 02 00099 i009
Machines 02 00099 i010
where
y(t−1) = y(t−1) − y(t−2), etc
The parameters making up the transfer function are estimated by finding estimates of Machines 02 00099 i00a3 of the unknown parameter vector θ that will minimize the error function:
Machines 02 00099 i012
Here λ is a weighting factor in the range of 0< λ ≤ 1 that weighs new data more heavily than old data.
The Recursive Least Squares algorithm used to estimate the transfer functions of the EFC valves is expressed as follows:
Machines 02 00099 i013
Machines 02 00099 i014
Machines 02 00099 i015
P is the covariance matrix of the estimation error of the parameter estimates, Machines 02 00099 i00a4 follows from Equation (8) for ε(t) = 0, and K(t) is the Kalman filter gain, which multiplies the prediction error in order to portray the correction term for the model parameter vector. Equation (13) requires an initial estimate of the parameter vector Machines 02 00099 i00a3, and Equations (14) and (15) require an initial estimate of P(0).
The step response test was conducted for different levels of mean maximum fluid pressure. The pressure levels reached are as follows: 3.1 psig which was achieved with a current input of 1.2 Amps, 26 psig with a current input of 1.4 Amps, 120 psig with a current input of 1.6 Amps, 160 psig with a current input of 1.8 Amps, and 210 psig with a current input of 2.0 Amps.
The notations XR and XS represent real data and simulated data for output pressure, respectively. The real data is what we have obtained through data acquisition of the step response, and the simulated data was obtained through the procedure of Recursive Least Square (RLS) method [18]. XS is included on the response plots in order to visualize characteristic differences of the EFC valves.
Figure 7 and Figure 8 show the step response diagrams that have resulted from current input signal of 1.6 Amps, for various categories of EFC valves. These categories are returned valve and good valve. Figure 7 shows the experimental result for a good EFC valve, and Figure 8 shows the experimental result for a returned/failed EFC valve. From both plots, it can be seen that the two types of EFC valves demonstrate different signatures on the characteristic curves. In the returned valve plot, the rise time of the response is slower compared to the rise time of the response for the good valve.
Figure 7. Good EFC Valve with 1.6 Amps current input.
Machines 02 00099 g007
Figure 8. Return EFC Valve with 1.6 Amps current input.
Machines 02 00099 g008
Another observation is that when the input current is increased to 1.8 Amps, a distinctive signature can be seen at the settling portion of the response. The settling portion corresponding to the returned valve, lands far away from the simulation, while the settling portion corresponding to the good valve, lands flat on or within close proximity. These variations are seen in Figure 9 and Figure 10.
Figure 9. Good EFC Valve with 1.8 Amps current input.
Machines 02 00099 g009
Figure 10. Return EFC Valve with 1.8 Amps current input.
Machines 02 00099 g010

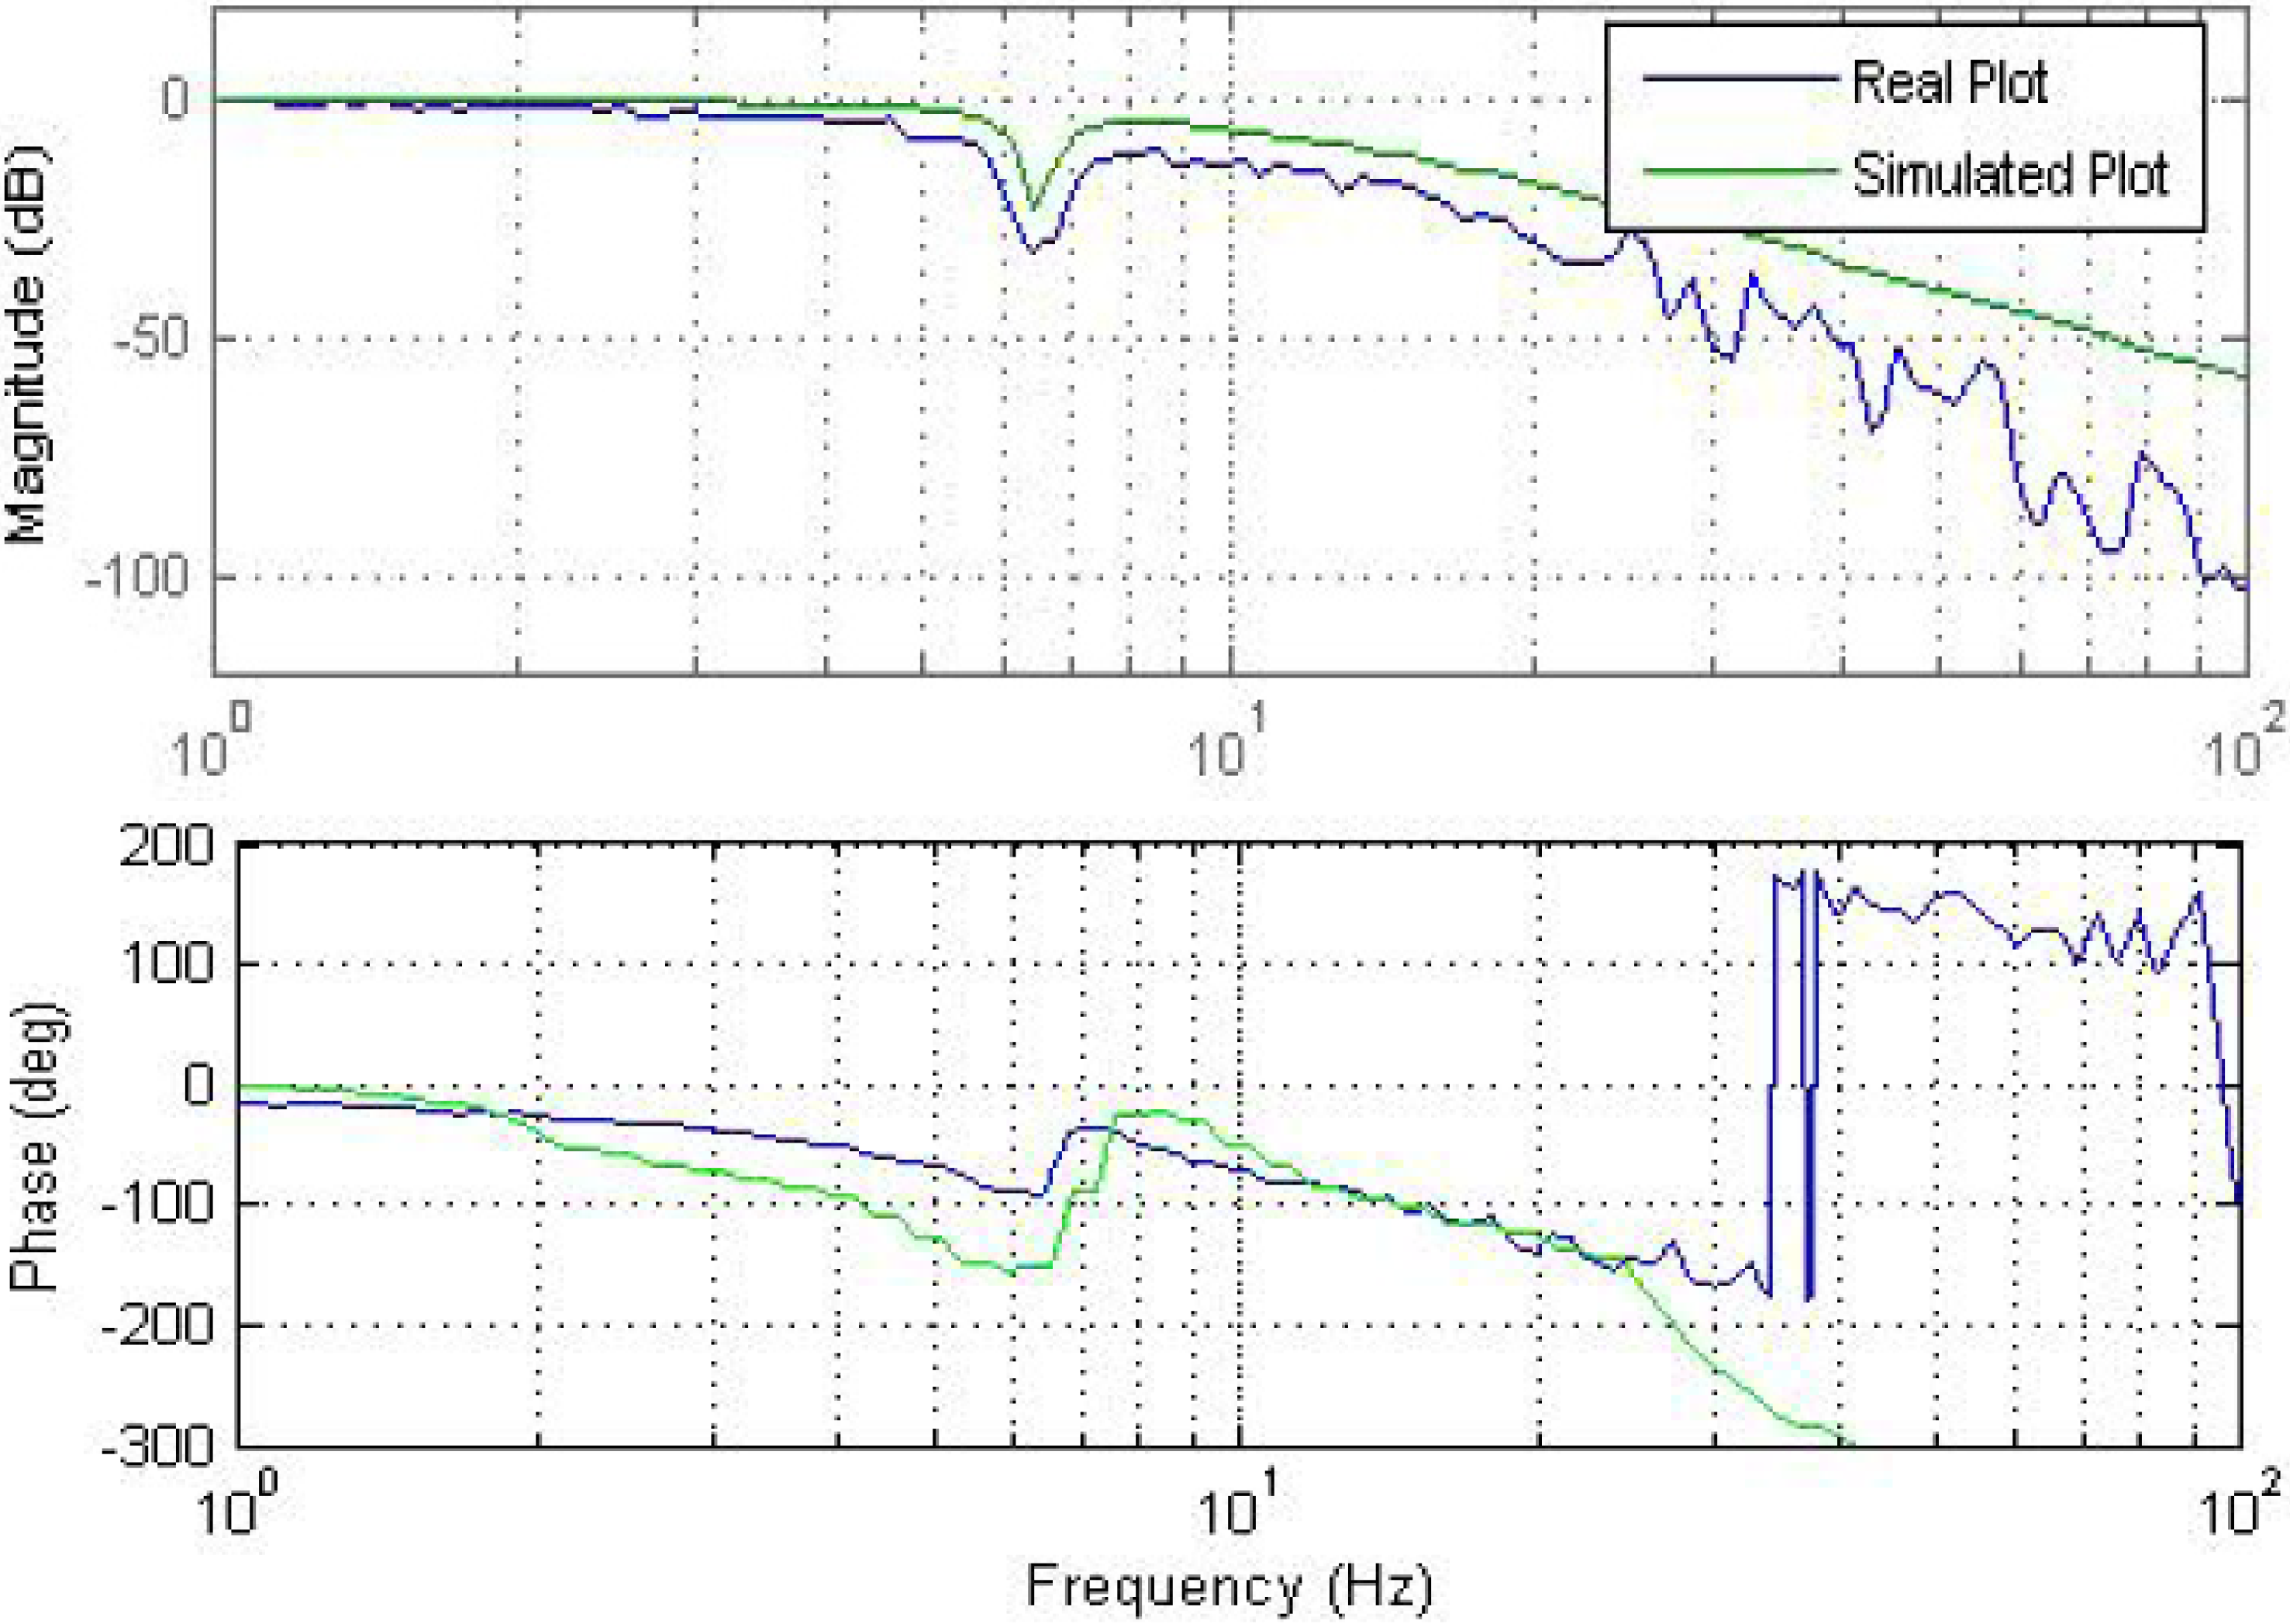
2.4. Transfer Function Estimations

Methods for both frequency domain [12] and time domain were used to estimate the transfer functions of the valves.

2.4.1. Frequency Domain Method

The transfer functions of the EFC valves have been estimated by taking into consideration the contributing factors mentioned earlier. The estimated transfer function is of the ninth order. The following transfer function represents the dynamics of a good EFC valve [11].
Machines 02 00099 i016
The transfer function of a returned / failed EFC valve was estimated as follows [11]:
Machines 02 00099 i017
The results above demonstrate that there are in fact significant differences between a returned/failed EFC valve and a good EFC valve.
Once the transfer function estimation is satisfactory, the Bode plots of the transfer functions are simulated, and then superimposed onto the original Bode plots that were generated earlier for verification purposes. Improvement in the results were obtained after fine tuning the transfer function parameters via a trial and error approach. Figure 11 and Figure 12 represent the Bode plots with the simulated results for both good and returned categories of EFC valves.
Figure 11. Bode plot for good valve simulations.
Machines 02 00099 g011
Figure 12. Bode plot for return valve simulations.
Machines 02 00099 g012

2.4.2. Time Domain Method

The discrete transfer function for a good EFC valve following the time domain system identification resulted in a transfer functions of 7th order, and is shown below [11]:
Machines 02 00099 i018
Similarly, the estimated discrete transfer function of a returned/failed EFC valve is obtained as follows:
Machines 02 00099 i019
While the system identification (both in frequency domain and time domain) of the EFC valves correlated with the test data and exhibited significantly different transfer function coefficients, this did not offer a robust approach because these coefficients did not maintain a clear pattern within each category of the EFC valves. The fluid (fuel) leakage in the EFC valve, which can vary randomly for from one EFC valve to other, may have contributed to the discrepancy between the different types of EFC valves. Additionally, the “stickiness” phenomenon may have caused the valve opening and closing to behave in an unstable manner between the different types of EFC valves that were studied in this work. Due to such variations, failure detection via a crisp logic type residual evaluation is considered to be less effective and less accurate as the error threshold would vary within certain range. A Fuzzy pattern classification of the residuals from the measured data and the identified model outputs is considered to be a better solution since it would handle the variable error thresholds more effectively through fuzzy sets.

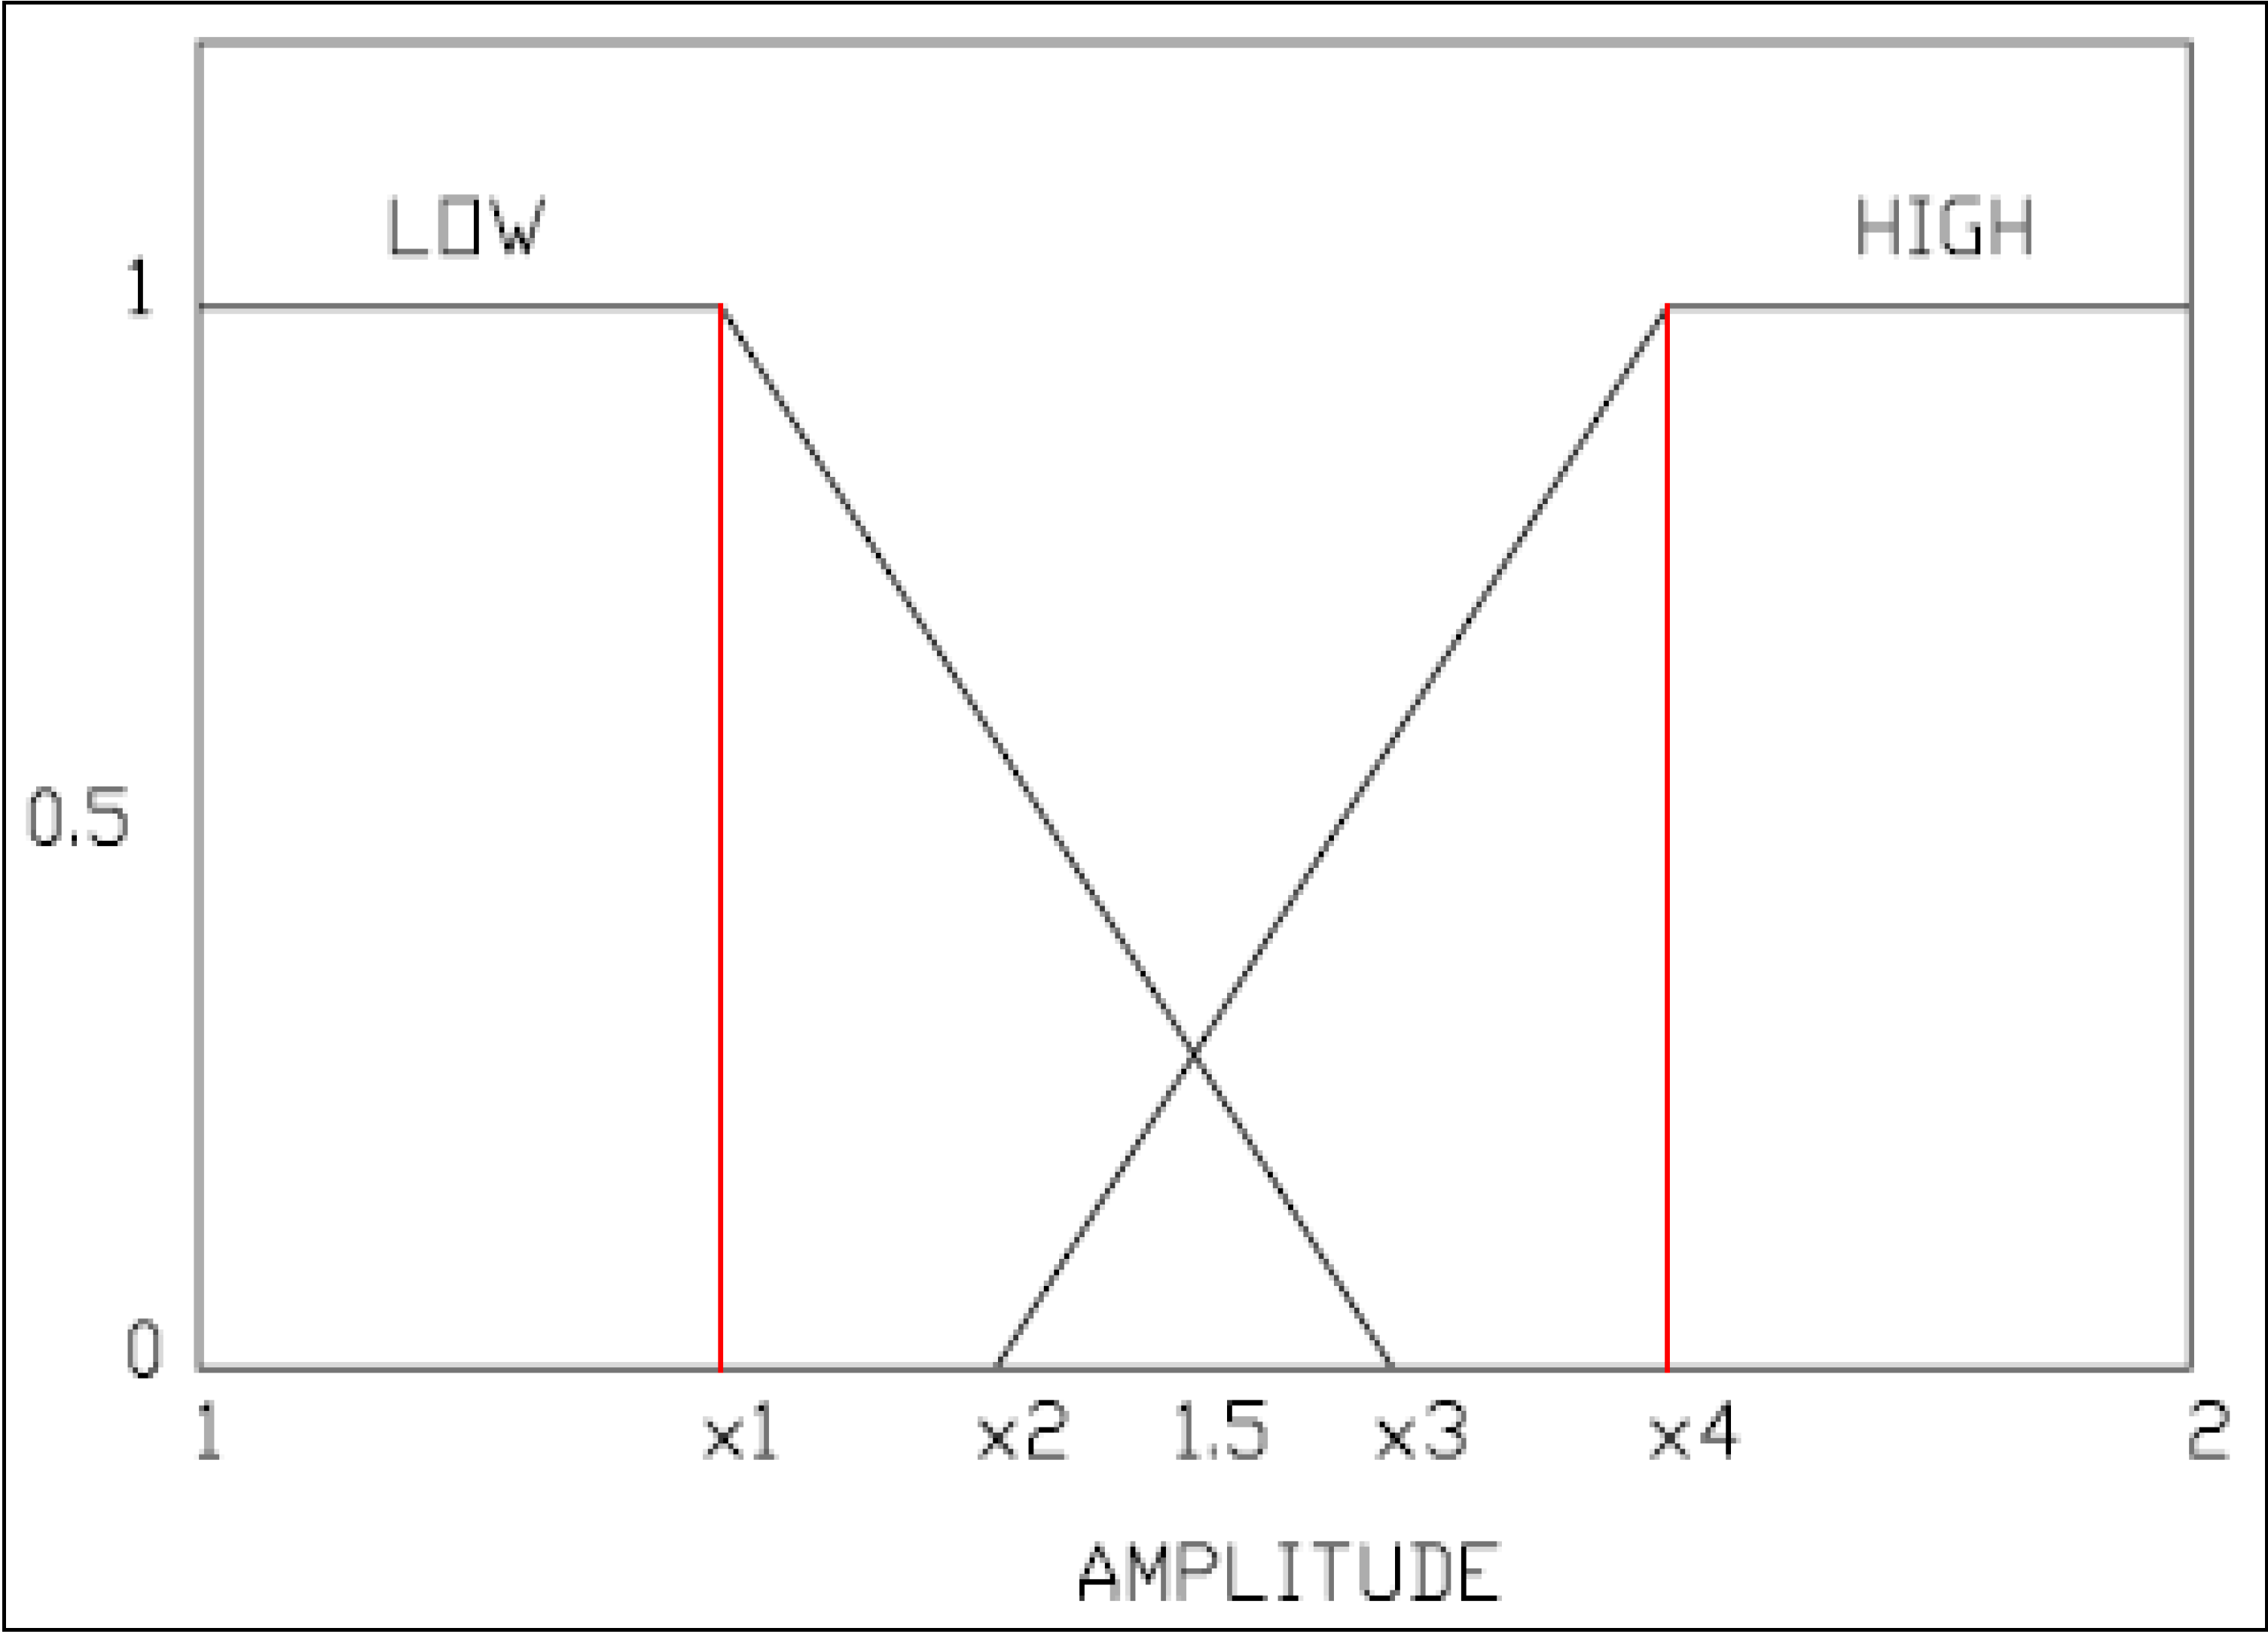
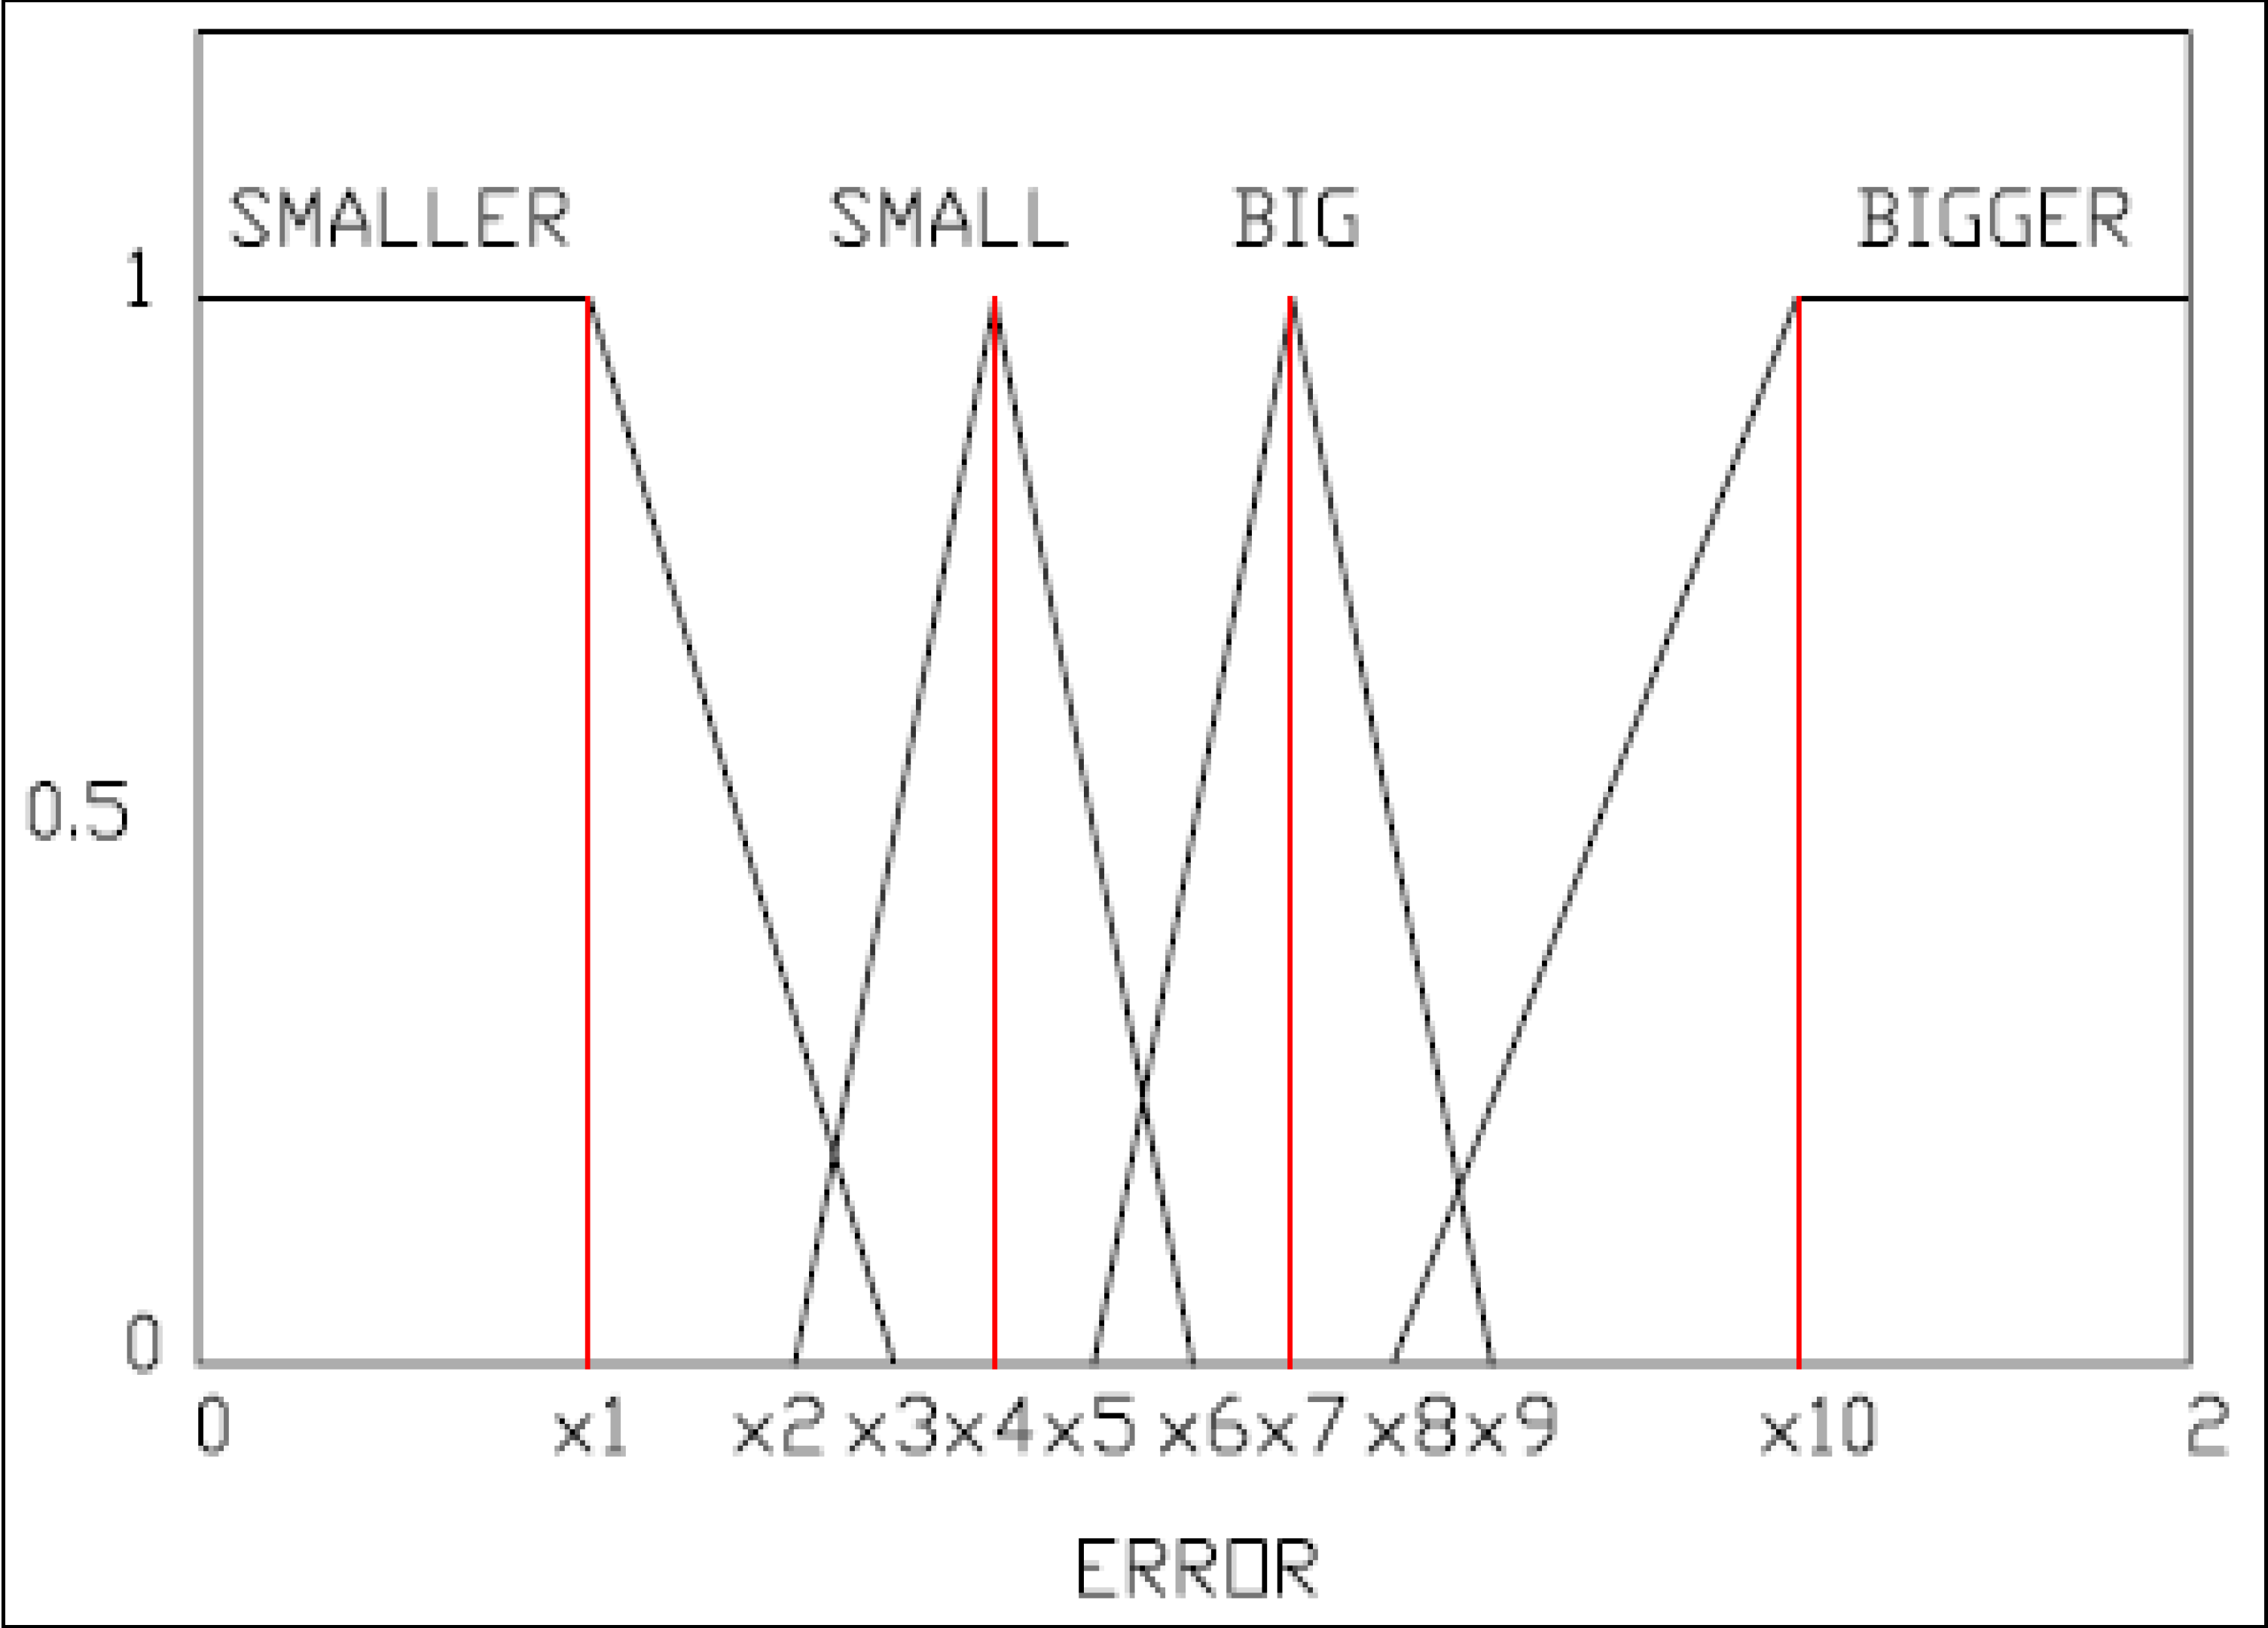
3. Fuzzy Pattern Classification

From the results of the system identification, each valve type demonstrated a distinctive characteristic. These characteristics eventually evolved into certain patterns depending on the type of valve tested. This section discusses how the implementation of fuzzy logic helps classify the different types of valves based on their patterns. Fuzzy pattern classification algorithm starts off by determining the membership values that are going to be processed in the decision system and then converting these crisp set data into a fuzzy set data. Next, the membership rules must be defined fittingly to represent the characteristics of the membership value. Once these values are processed, they get defuzzified and a decision is made accordingly. A representation of the fuzzy pattern classification based fault detection is shown in block diagram form in Figure 13.
Figure 13. Block diagram representation of fuzzy pattern classification based fault diagnosis.
Machines 02 00099 g013

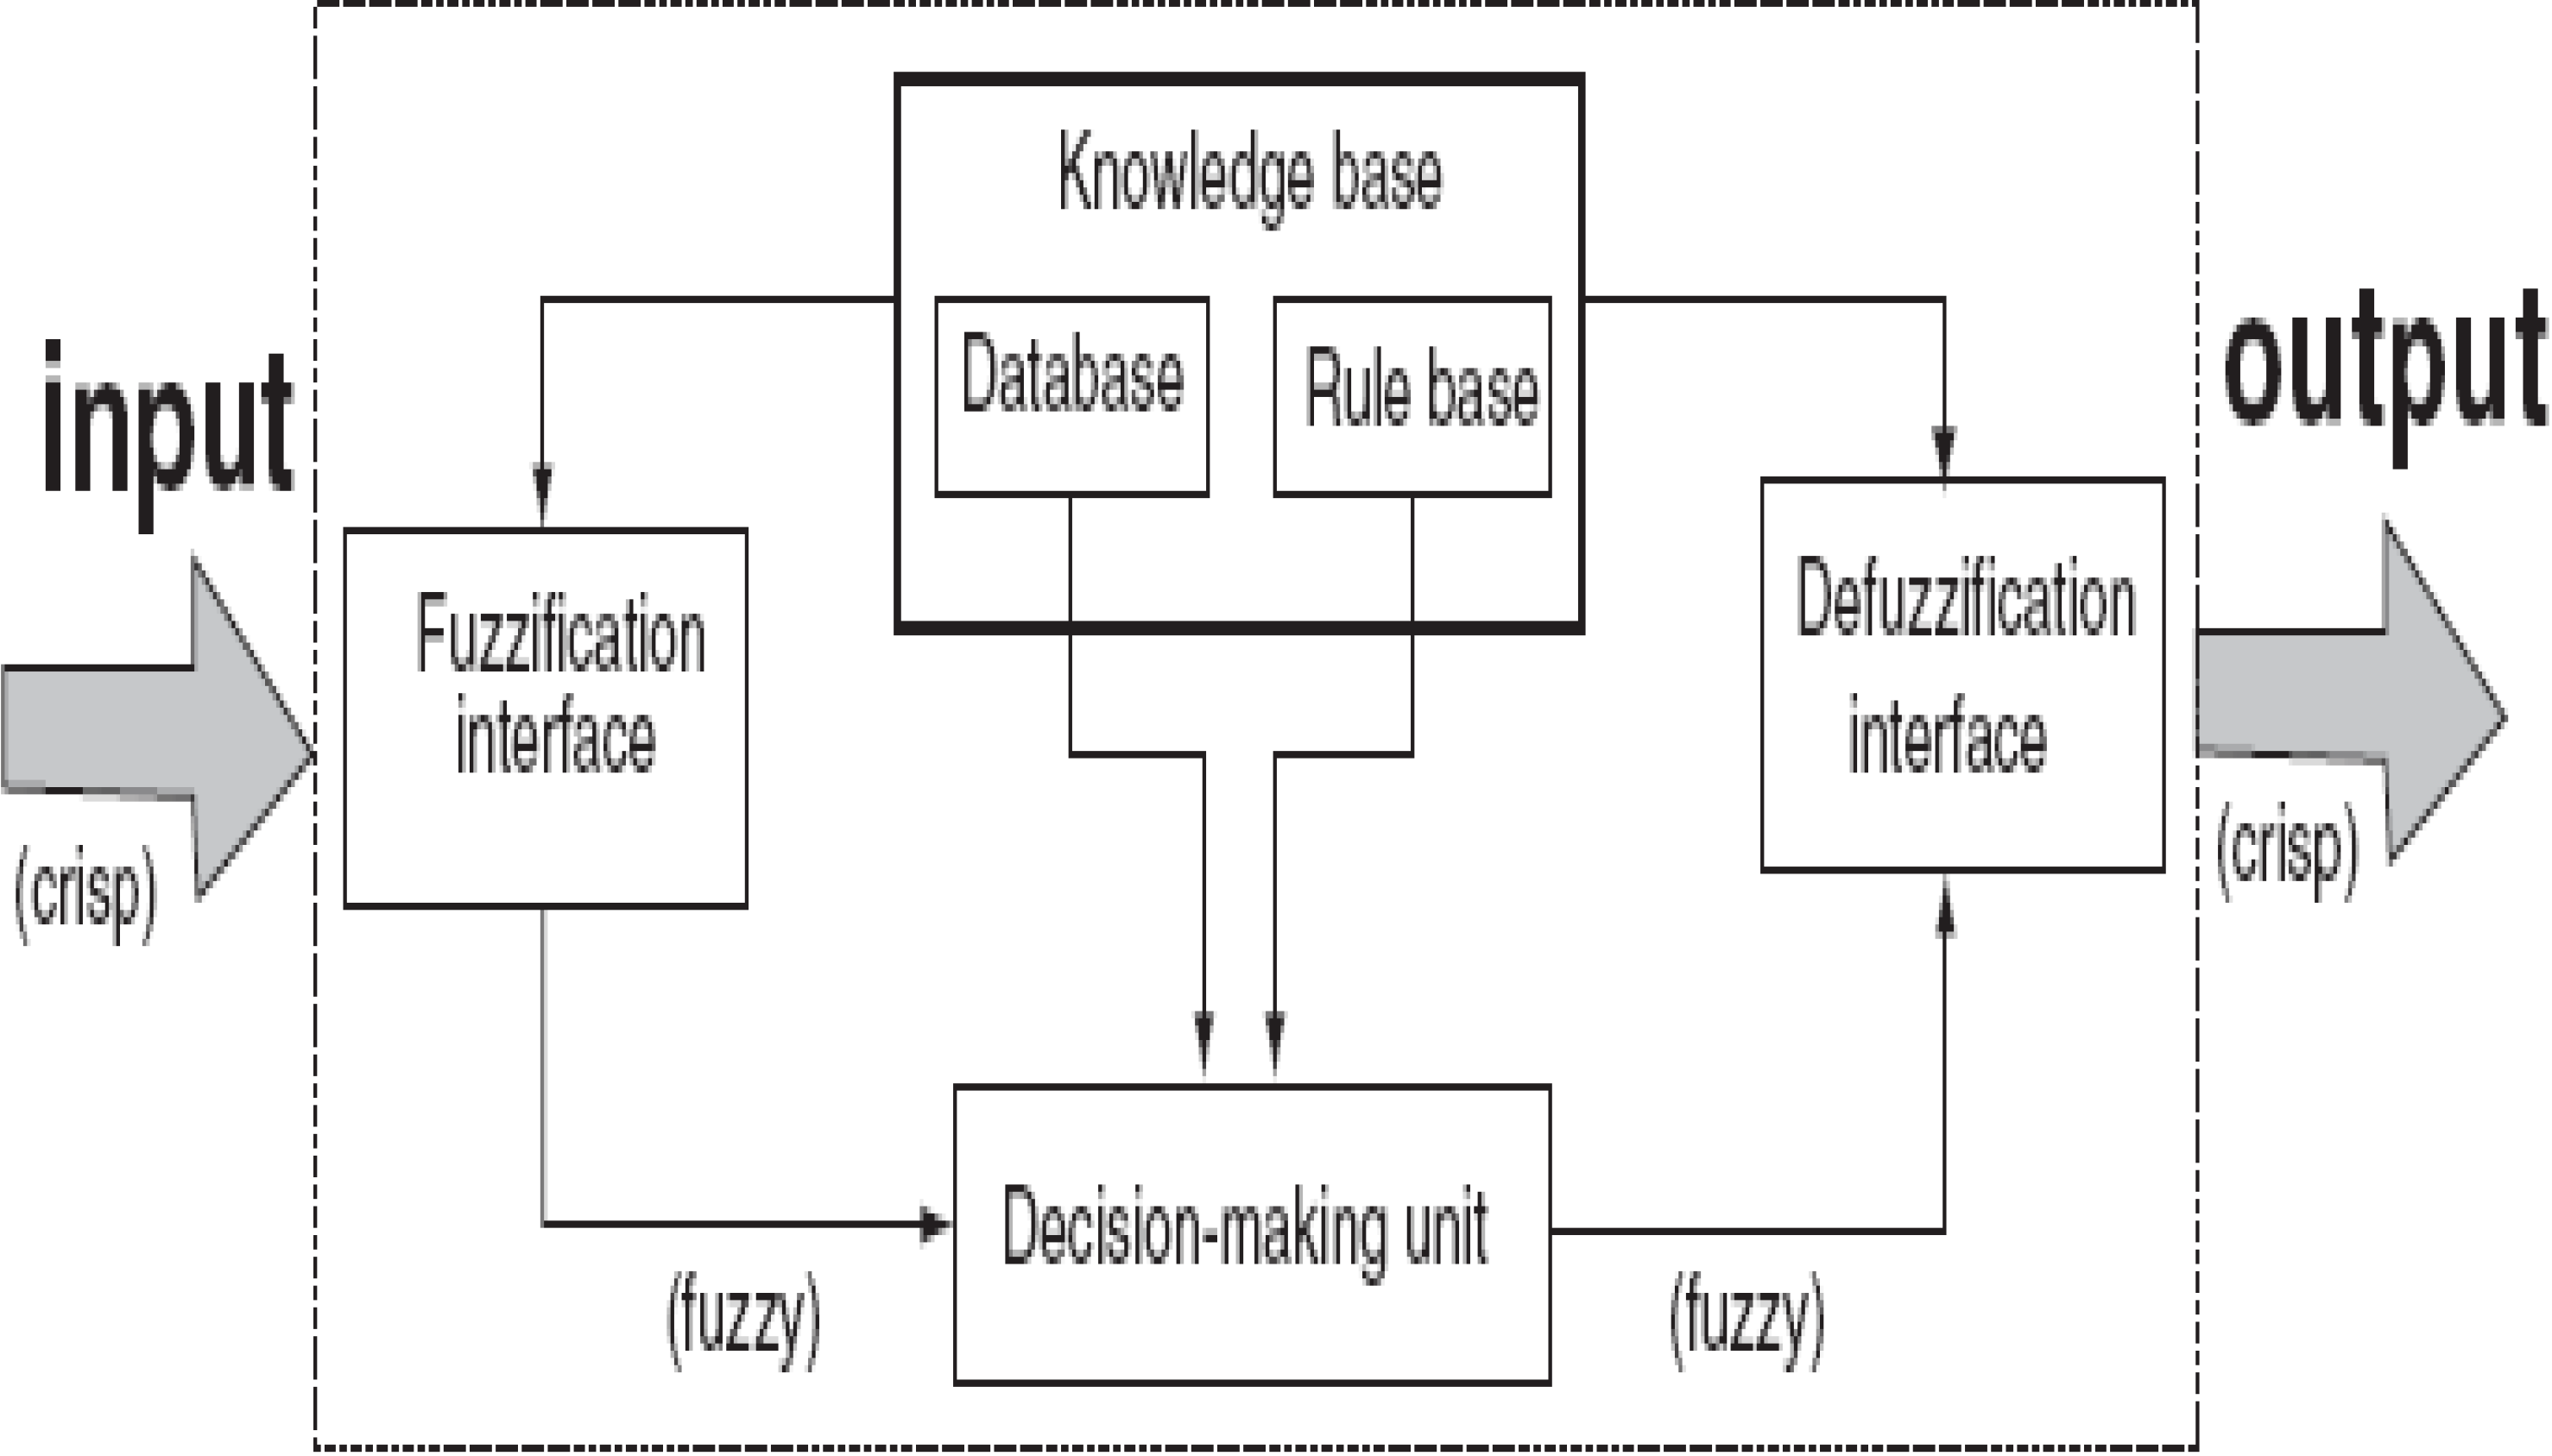
3.1. Initialization of the Fuzzy Decision System

The fuzzy system is made up from a list of fuzzy sets as well as the rule set that they are associated with [19]. The system is made up of two inputs and one output. Each input that the system takes is considered a fuzzy variable. Each of these inputs has their own membership functions, primarily constructed from trapezoidal and triangular functions.
The inputs to the system are used from the data acquired as a result of the step responses that were performed earlier on the EFC valves. One of the inputs is the current amplitude: 1.4A being defined as Low, and the other is 1.6 A being defined as High. The other input was constructed as a result of equating a modified version of the root square mean error between the real response of the EFC valve and the simulated response of the EFC valve. Figure 14 and Figure 15 provide graphical representation of the fuzzy membership function definition for EFC valve inputs/outputs. We can see that there are two responses, one generated as a result of simulated data (XS), and the other generated as a result of the real data (XR). Using these two variables, a residual value that is representative of the modified version of the root mean square error (Equation (20)) within a certain period is defined. This residual value would differ from one type of EFC valve to the other (e.g., good valve vs. returned valve).
Figure 14. Two membership functions used in fuzzy system.
Machines 02 00099 g014
Figure 15. Four membership functions used in fuzzy system.
Machines 02 00099 g015
Machines 02 00099 i020
Where t is the time period, and N represents the number of data points. The output is a conclusion of the fuzzy system where a decision is made in classifying the EFC valves’ type.
The membership functions of the fuzzy system used in this pattern classification procedure are left-trapezoid function, right-trapezoid function, and triangular function. Definitions of the membership functions are as follows,
Machines 02 00099 i021
Where x1 = 1.4 A, x2 = 1.45 A, x3 = 1.55 A, and x4 = 1.6 A.
Machines 02 00099 i022
where x1 = 0.4, x2 = 0.5, x3 = 0.8, x4 = 0.9, x5 = 1.1, x6 = 1.2, x7 = 1.3, x8 = 1.5, x9 = 1.6, and x10 = 1.8.
The fuzzy rules are based on a set of fuzzy if—then rules in order to define the inference engine from the input data set to the output data set based on the knowledge of the characteristics of the EFC valves.
Once all initializations have been performed, the intended tests could be run. A model of the above algorithm of fuzzy pattern classification was built using MATLAB/Fuzzy Logic Toolbox [20]. This model was then simulated in parallel with m-file scripts and SIMULINK models. The results are provided in the next section.

4. Experimental Results

For verification purposes, this pattern classification technique was implemented on EFC valves that were classified previously. Four different types of EFC valves were used; two of them were determined to be returned (bad) valves, and two of them were good valves. Data from the step responses are taken into consideration here are those for both for a low current amplitude (1.4 A) and a high current amplitude (1.6 A). From that data, the membership value (mean square root error) that will be used in the fuzzy system is calculated by using Equation (20). Table I provides the EFC valves with their corresponding membership (error) values. These errors created the pattern classification of the EFC valves into three types: good, malfunctioned, and severely malfunctioned. In real life applications, the EFC valves that are returned to Cummins by their customers are primarily caused by functionality issues. Although an EFC valve characterized as malfunctioned as opposed to an EFC valve characterized as severely malfunctioned both fall under the class “return”, we are able to further distinguish them between each other by using fuzzy logic.
The implementation of the fuzzy system was written in MATLAB [20]. After the EFC test data was preprocessed we were in possession of 80 sets of data. Once the data was processed in the fuzzy system, the EFC valves were classified correctly, even furthering the categories to extreme conditions amongst each other. Basically, what was already determined to be a bad (returned) valve was classified based on its pattern as either a malfunctioned EFC valve or a severely malfunctioned EFC valve.
Table I. Results of Error calculation.
Serial #ConditionError
Low AHigh A
Valve Type 1New1.01560.9048
1.00300.9174
1.03780.9229
1.03960.8740
1.02330.8837
1.06110.8788
1.06340.8328
1.04760.9143
1.05360.8498
1.02490.9128
Valve Type 2New1.00250.8931
0.97420.8553
0.97400.8388
0.98100.8046
0.97460.8814
0.96820.8076
0.97040.8168
0.97040.8321
0.97930.7948
0.96950.8158
Valve Type 1Return1.80481.0689
1.80481.0659
1.62421.0763
1.59821.0706
1.65731.1234
1.62541.0779
1.54851.1019
1.62911.0546
1.76451.0782
1.66711.0934
Valve Type 2Return1.26970.9865
1.21761.0326
1.32671.0139
1.33571.0078
1.24770.9998
1.25071.0061
1.19171.0025
1.25100.9852
1.22681.0106
1.23630.9862
In a few instances, the data acquired from the good EFC valve had overlaps on the parameters making up the membership functions. Although fundamentally they are still classified accurately as good EFC valves, there were unavoidable consequences from the data due to noise and unforeseen responses. The degrees of memberships took over a categorized EFC valves in their respective classes. Table II provides the results after the training data was processed in the fuzzy system. These classes are a result of the defuzzification procedure. In the defuzzification process, which was based on the ranges that the error values fell under, the EFC Valves were classified according to the following rules:
Machines 02 00099 i023
Table II. Classification of EFC Valves after fuzzy logic reasoning.
Serial #ConditionError
Low AHigh A
Valve Type 1 NewGoodGood
GoodGood
GoodGood
GoodGood
GoodGood
GoodGood
GoodGood
GoodGood
GoodGood
GoodGood
Valve Type 2 NewGoodGood
GoodGood
GoodGood
GoodGood
GoodGood
GoodGood
GoodGood
GoodGood
GoodGood
GoodGood
Valve Type 1 ReturnSeverely Malf.Severely Malf.
Severely Malf.Severely Malf.
Valve Type 2 ReturnMalfunctionedMalfunctioned
MalfunctionedMalfunctioned
From the above classification results, it is evident that a pattern exists between good EFC valves and bad (returned) EFC valves. Furthermore, this pattern allows us to distinguish amongst the EFC valves depending on their functionality conditions. The fuzzy system is able to satisfy the pattern classification for both low amplitude inputs, as well as high amplitude inputs. The fuzzy system classified the types of the EFC valves correctly for 80 different sets of data, and it only made 4 “soft” errors for the classifications between the functionality conditions, providing close to 95% accuracy in fault diagnosis.

5. Conclusions

Insight into the mathematical model of the EFC valves relating the input (current) and the output (pressure) of the system was used to estimate the order of the linearized EFC dynamic system. The approach in time domain proved to be more efficient and effective with the use of step response. The signature characteristics of the response curves became evident when using different types of EFC valves that were either good valves or faulty valves. The decision to use inputs of different amplitude levels proved to be fruitful, especially for low current (1.4 A), and high current (1.6 A). Fuzzy logic based methodology was implemented for the purposes of pattern classification of residuals. This method provided robustness in the fault diagnosis over residual evaluation via crisp logic due to variability in the error thresholds. Each type of EFC valve exhibited a certain residual pattern in the form of a modified root mean square error. This, along with current input was used in the fuzzy system to classify the type of EFC valve being tested. This method proved to be very effective, as all the types of EFC valves that were already pre-classified, were verified accurately for their respective types.

Acknowledgment

This work was made possible through a research grant (grant # IND847403) from Cummins, Inc., Columbus, IN, USA. The authors specially thank John D. Lane, Fuel Systems, Cummins, Inc. for sponsoring this research project.

Conflicts of Interest

The authors declare no conflict of interest.

References

  1. Isermann, R. Model-based fault-detection and diagnosis—Status and applications. Annu. Rev. Control 2005, 29, 71–85. [Google Scholar] [CrossRef]
  2. Venkatasubramanian, V.; Rengaswamy, R.; Kavuri, S.N.; Yin, K. A review of process fault detection and diagnosis Part III: Process history based methods. Comput. Chem. Eng. 2003, 27, 327–346. [Google Scholar] [CrossRef]
  3. He, Q.P.; Wang, J. Large-Scale Semiconductor Process Fault Detection Using a Fast Pattern Recognition-Based Method. IEEE Trans. Semicond. Manuf. 2010, 23, 194–200. [Google Scholar] [CrossRef]
  4. Lou, X.; Loparo, K.A. Bearing fault diagnosis based on wavelet transform and fuzzy inference. Mech. Syst. Signal Process. 2004, 18, 1077–1095. [Google Scholar] [CrossRef]
  5. He, H.; Wang, D.; Ma, S. Application of fuzzy pattern recognition in intelligent fault diagnosis systems. Proc. SPIE 2001, 4554, 262–267. [Google Scholar] [CrossRef]
  6. Bhushan, B.; Romagnoli, J.A. Self-organizing self-clustering network: A strategy for unsupervised pattern classification with its application to fault diagnosis. Ind. Eng. Chem. Res. 2008, 47, 4209–4219. [Google Scholar] [CrossRef]
  7. Podvin, H. A fuzzy-logic-based fault recognition method using phase angles between current symmetrical components in automatic DFR record analysis. In Proceedings of the 2005 IEEE Russia Power Tech, St. Petersburg, Russia, 27–30 June 2005.
  8. Detroja, K.P.; Gudi, R.D.; Patwardhan, S.C. A possibilistic clustering approach to novel fault detection and isolation. J. Process Control 2006, 16, 1055–1073. [Google Scholar] [CrossRef]
  9. Operator’s Manual—EFC Test Stand; 38078; Cummins Engine Company, Inc.: Columbus, IN, USA, 1995.
  10. Hand Book on Dynamic Performance Test Method on EFC Valve Test Bench; Cummins, Inc.: Columbus, IN, USA, 2007.
  11. Tugsal, U. Fault Diagnosis of Electronic Fuel Control (EFC) Valves via Dynamic Performance Test Method. M.Sc. Thesis, Purdue School of Engineering and Technology, IUPUI, Indianapolis, IN, USA, December 2009. [Google Scholar]
  12. Pintelon, R.; Schoukens, J. System Identification: A Frequency Domain Approach; Wiley—IEEE Press: Hoboken, NJ, USA, 2012. [Google Scholar]
  13. Pintelon, R.; Guillaume, P.; Rolain, Y.; Schoukens, J.; Hamme, H.V. Parametric Identification of Transfer Functions in the Frequency Domain, a Survey. IEEE Trans. Autom. Control 1994, 39, 2245–2260. [Google Scholar] [CrossRef]
  14. Lopes dos Santos, P.; de Carvalho, J.L.M. Automatic Transfer Function Synthesis from a BodePlot. IEEE Proc. Decis. Control 1990, 2, 1093–1098. [Google Scholar]
  15. Gustavsson, I.; Ljung, L.; Soderstrom, T. Identification of Processes in Closed Loop-Identifiability and Accuracy Aspects. Automatica 1977, 13, 59–75. [Google Scholar] [CrossRef]
  16. Astrom, K.J.; Wittenmark, B. Self Tuning Controllers Based on Pole-Zero Placement. IEEE Proc. D 1980, 127, 120–130. [Google Scholar] [CrossRef]
  17. Young, P. Recursive Estimation and Time Series Analysis—An Introduction; Springer-Verlag: Berlin, Germany, 1984. [Google Scholar]
  18. Ljung, L. System Identification: Theory for the User, 2nd ed.; Prentice-Hall: Upper Saddle River, NJ, USA, 1999. [Google Scholar]
  19. Ross, T.J. Fuzzy Logic with Engineering Applications, 3rd ed.; John Wiley & Sons, Ltd: West Sussex, UK, 2010. [Google Scholar]
  20. MATLAB Fuzzy Logic Toolbox; Mathworks, Inc.: Natick, MA, USA, 2009.

