1. Introduction
Inverted exponential distribution has been popularly used in several sectors such as engineering, biology, medicine, and others. It has an inverted bathtub failure rate, which describes the relative failure rate, which initially increases, comes to a head after some time, and then decreases over time. A new simple two-parameter alpha power-inverted exponential distribution (denoted as Alpha-PIE(
)) has been proposed by Ünal et al. [
1] as an extension of the conventional inverted exponential distribution. They also stated, by making use of two lifetime data sets, that the Alpha-PIE model offers superior fits to some other lifetime models, namely, Lindley, inverted exponential, generalized inverted exponential, and inverted Rayleigh distributions. However, a lifetime random variable
X is said to have the Alpha-PIE
distribution, where
is a vector of the model parameters, if its probability density function (PDF)
; cumulative distribution function, say
(CDF); reliability function, say
(RF); and hazard rate function, say
(HRF), are provided by
and
respectively, where
and
are the shape and scale parameters, respectively. Obviously, when we put
, the alpha-PIE distribution is reduced to the inverted exponential distribution by Keller et al. [
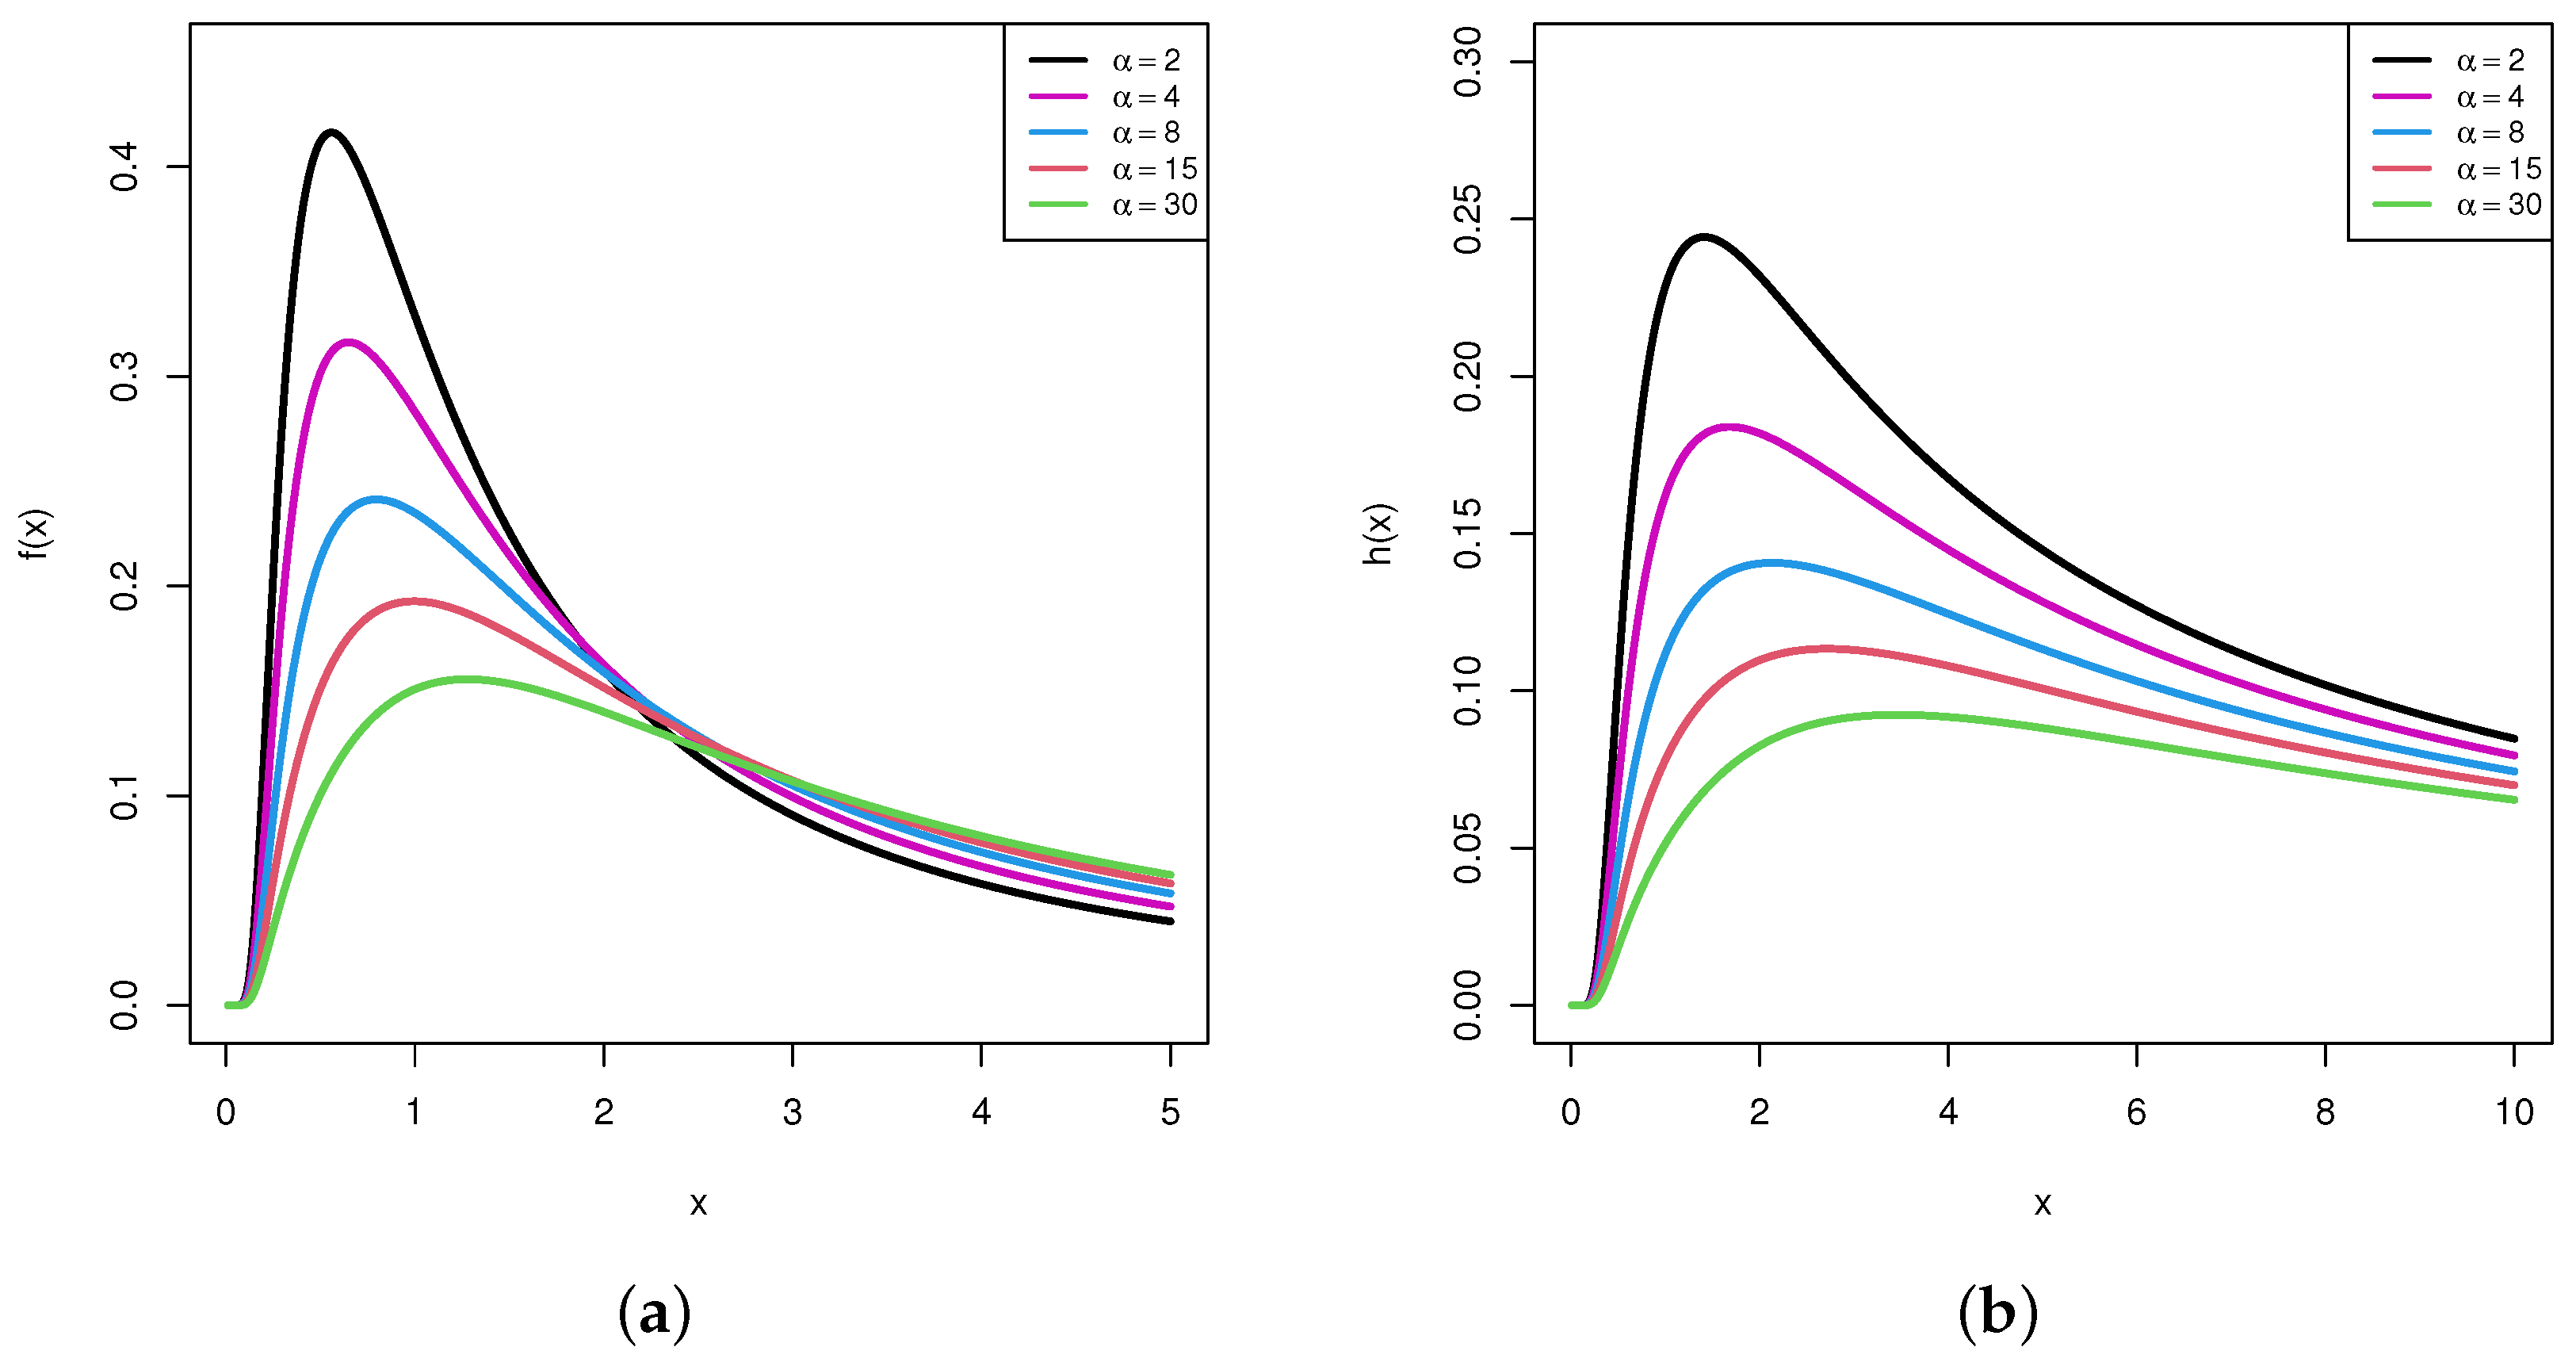
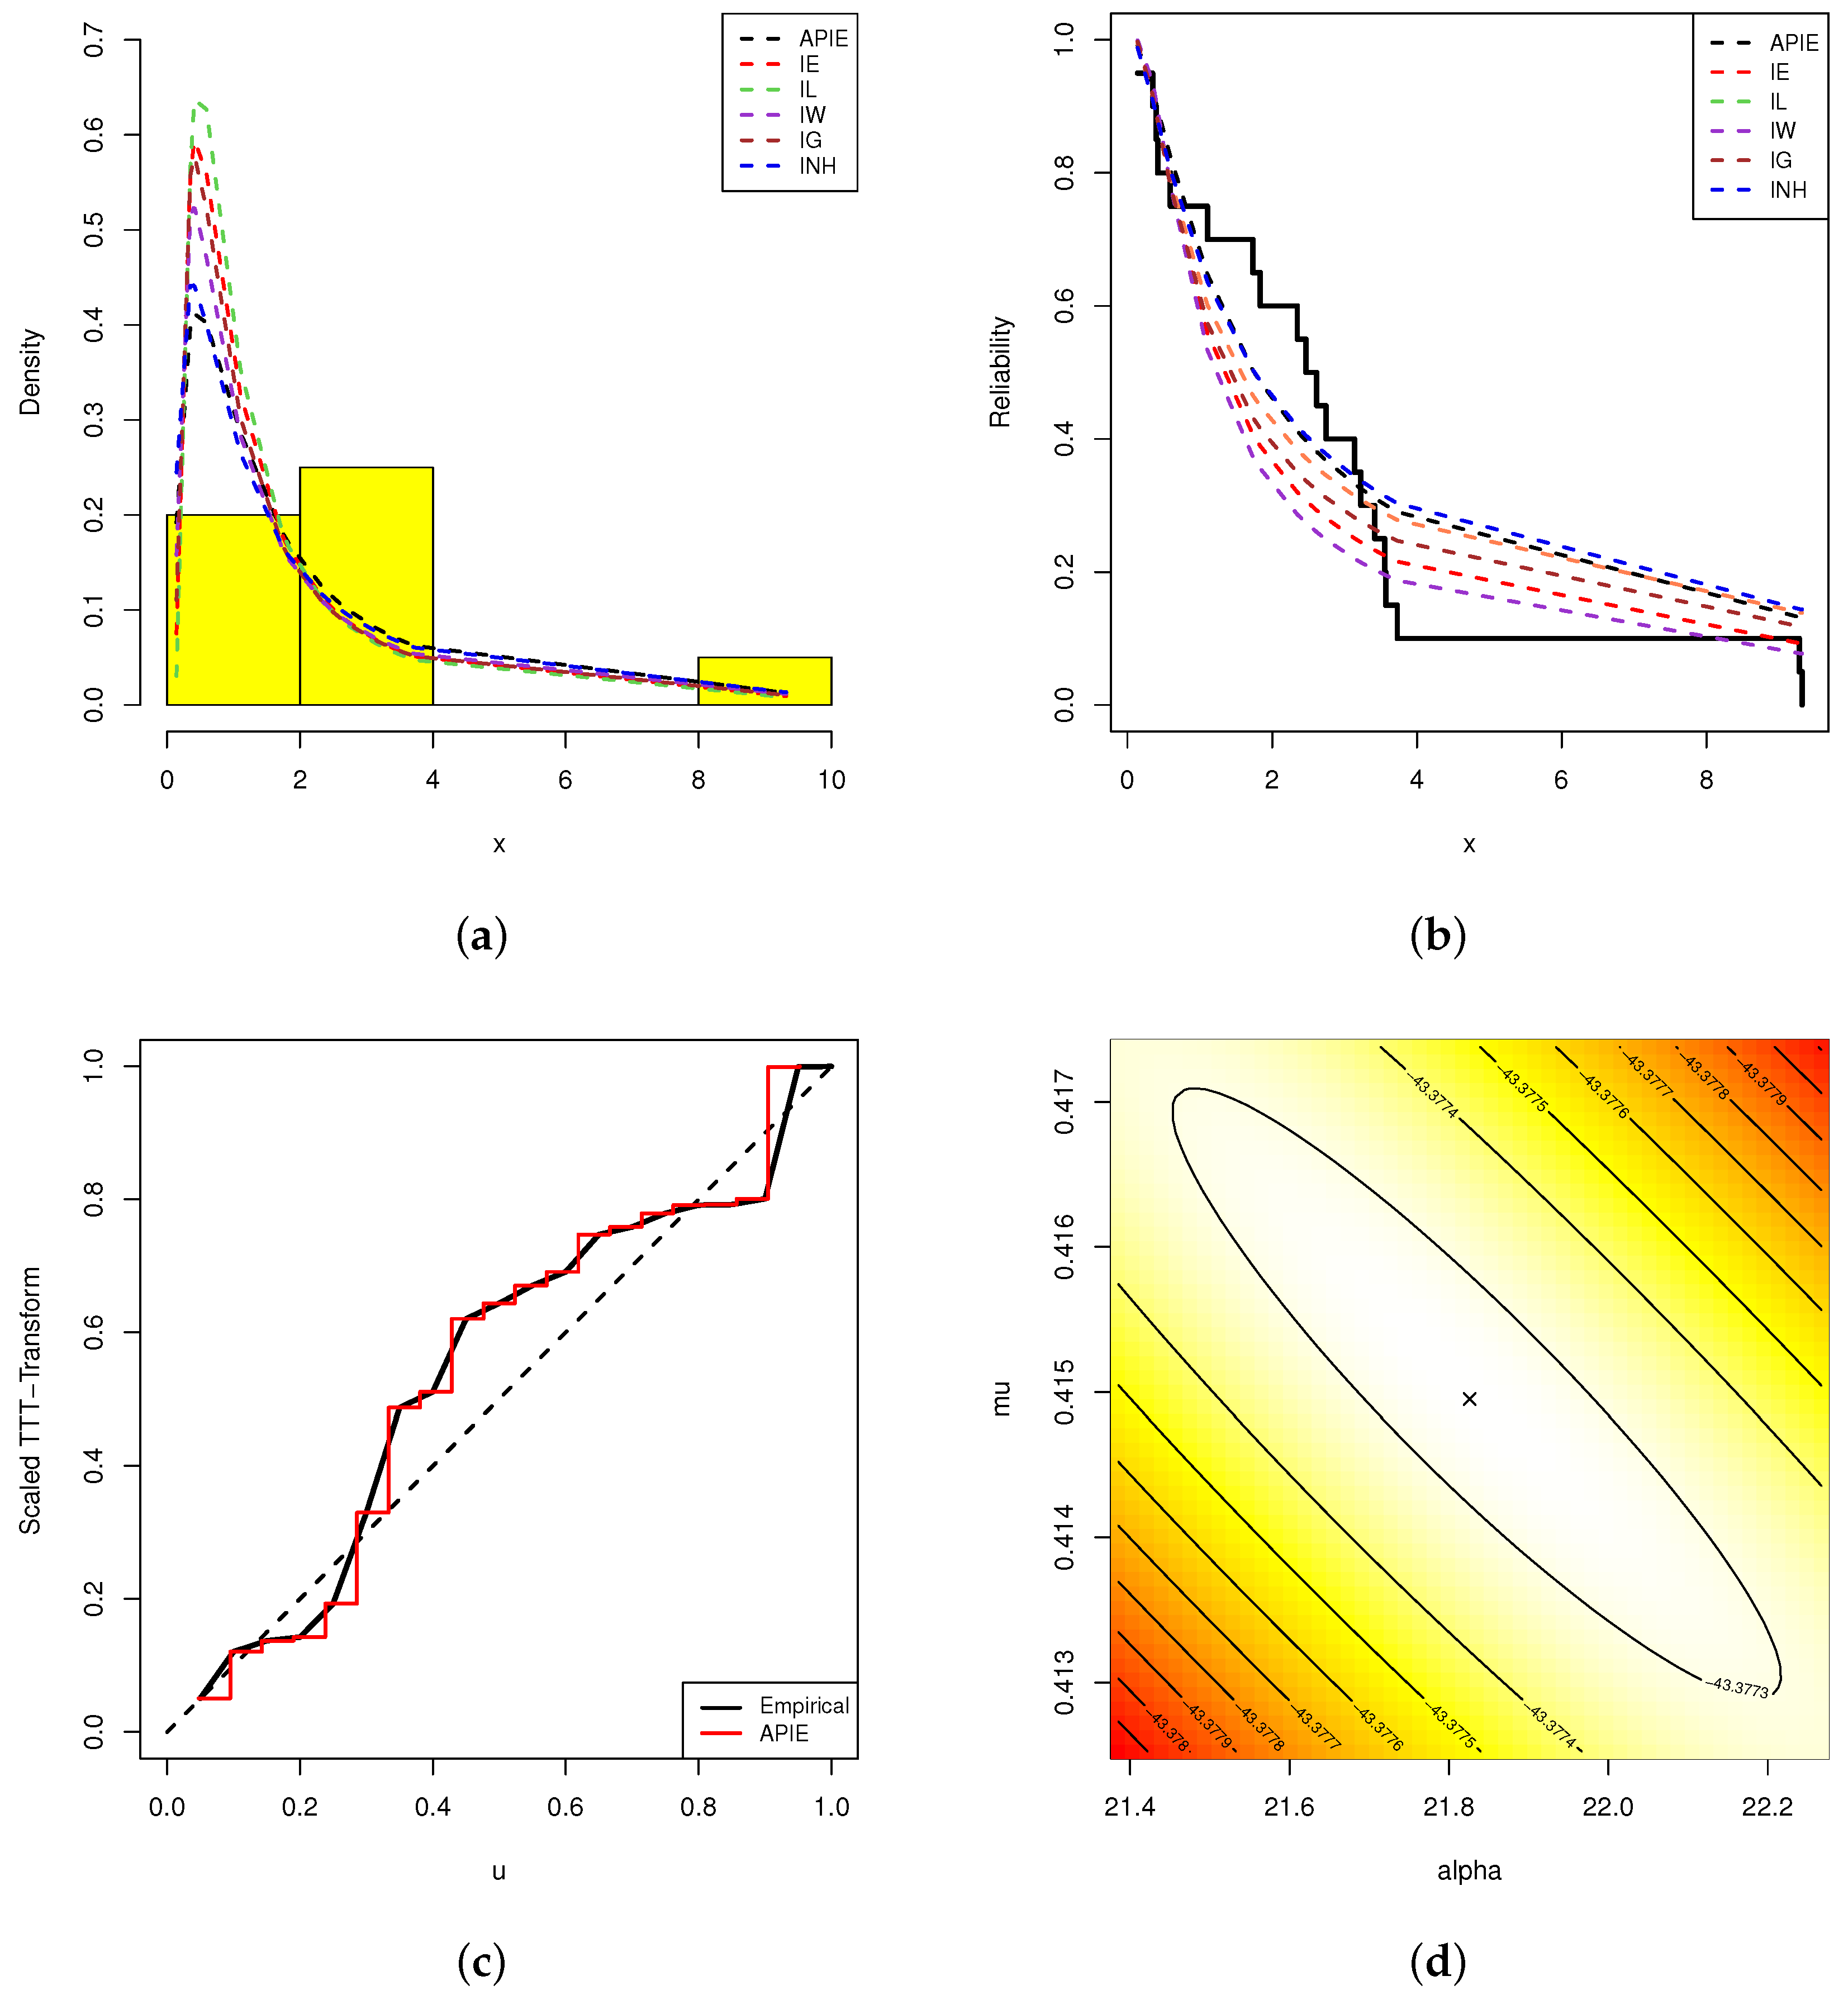
2]. When we fix
and consider different values of
, in
Figure 1, several shapes for the PDF and HRF of the Alpha-PIE distribution are demonstrated. This shows that the density of the alpha-PIE distribution is unimodal, while its HRF is a monotonically increasing function. Recently, in the presence of complete data, Amjad et al. [
3] derived various Bayes estimators of the alpha-PIE parameters and stated that the alpha-PIE model behaved better than the inverted exponential and generalized inverted exponential models.
In a reliability context, the failure time data of the experimental objects are frequently not totally accessible, so minimizing both the expense and duration of the experiment is critical for any researcher. Progressive Type-II censoring (PTIIC) was proposed to allow the experimenter to remove items at times other than the stop time. This technique may be advantageous when some of the live test objects that are removed early on can be used again for future tests or when a balance between observing even some extreme lifetimes and reducing testing duration is desired, one may refer to Balakrishnan and Cramer [
4] for additional details. Recently, if PCS-II is applied, because of the lengthy lifespan of many items, particularly electronics, the total experimental time might be quite long. This is the main drawback of PTIIC sampling. Therefore, to ensure that the experiment is completed at a specified optimal time without losing the ability to collect an effective number of observable failures, a generalized Type-II progressively hybrid censored (GTIIPHC) strategy was introduced by Lee et al. [
5]. This strategy starts with putting
n independent items into a test at time zero, specifying two threshold points of failures,
and the desired number
m, where (
), and designing the progressive censoring
. When the experimenter records the first failure (say
),
items are randomly chosen from
and removed from the test; next, at the second failure (say
),
items are randomly chosen from
and out of the test, and so on. At
, where
, the test is stopped and all remaining survival subjects are removed. Note that (
) represents the size of recorded failures up to (
).
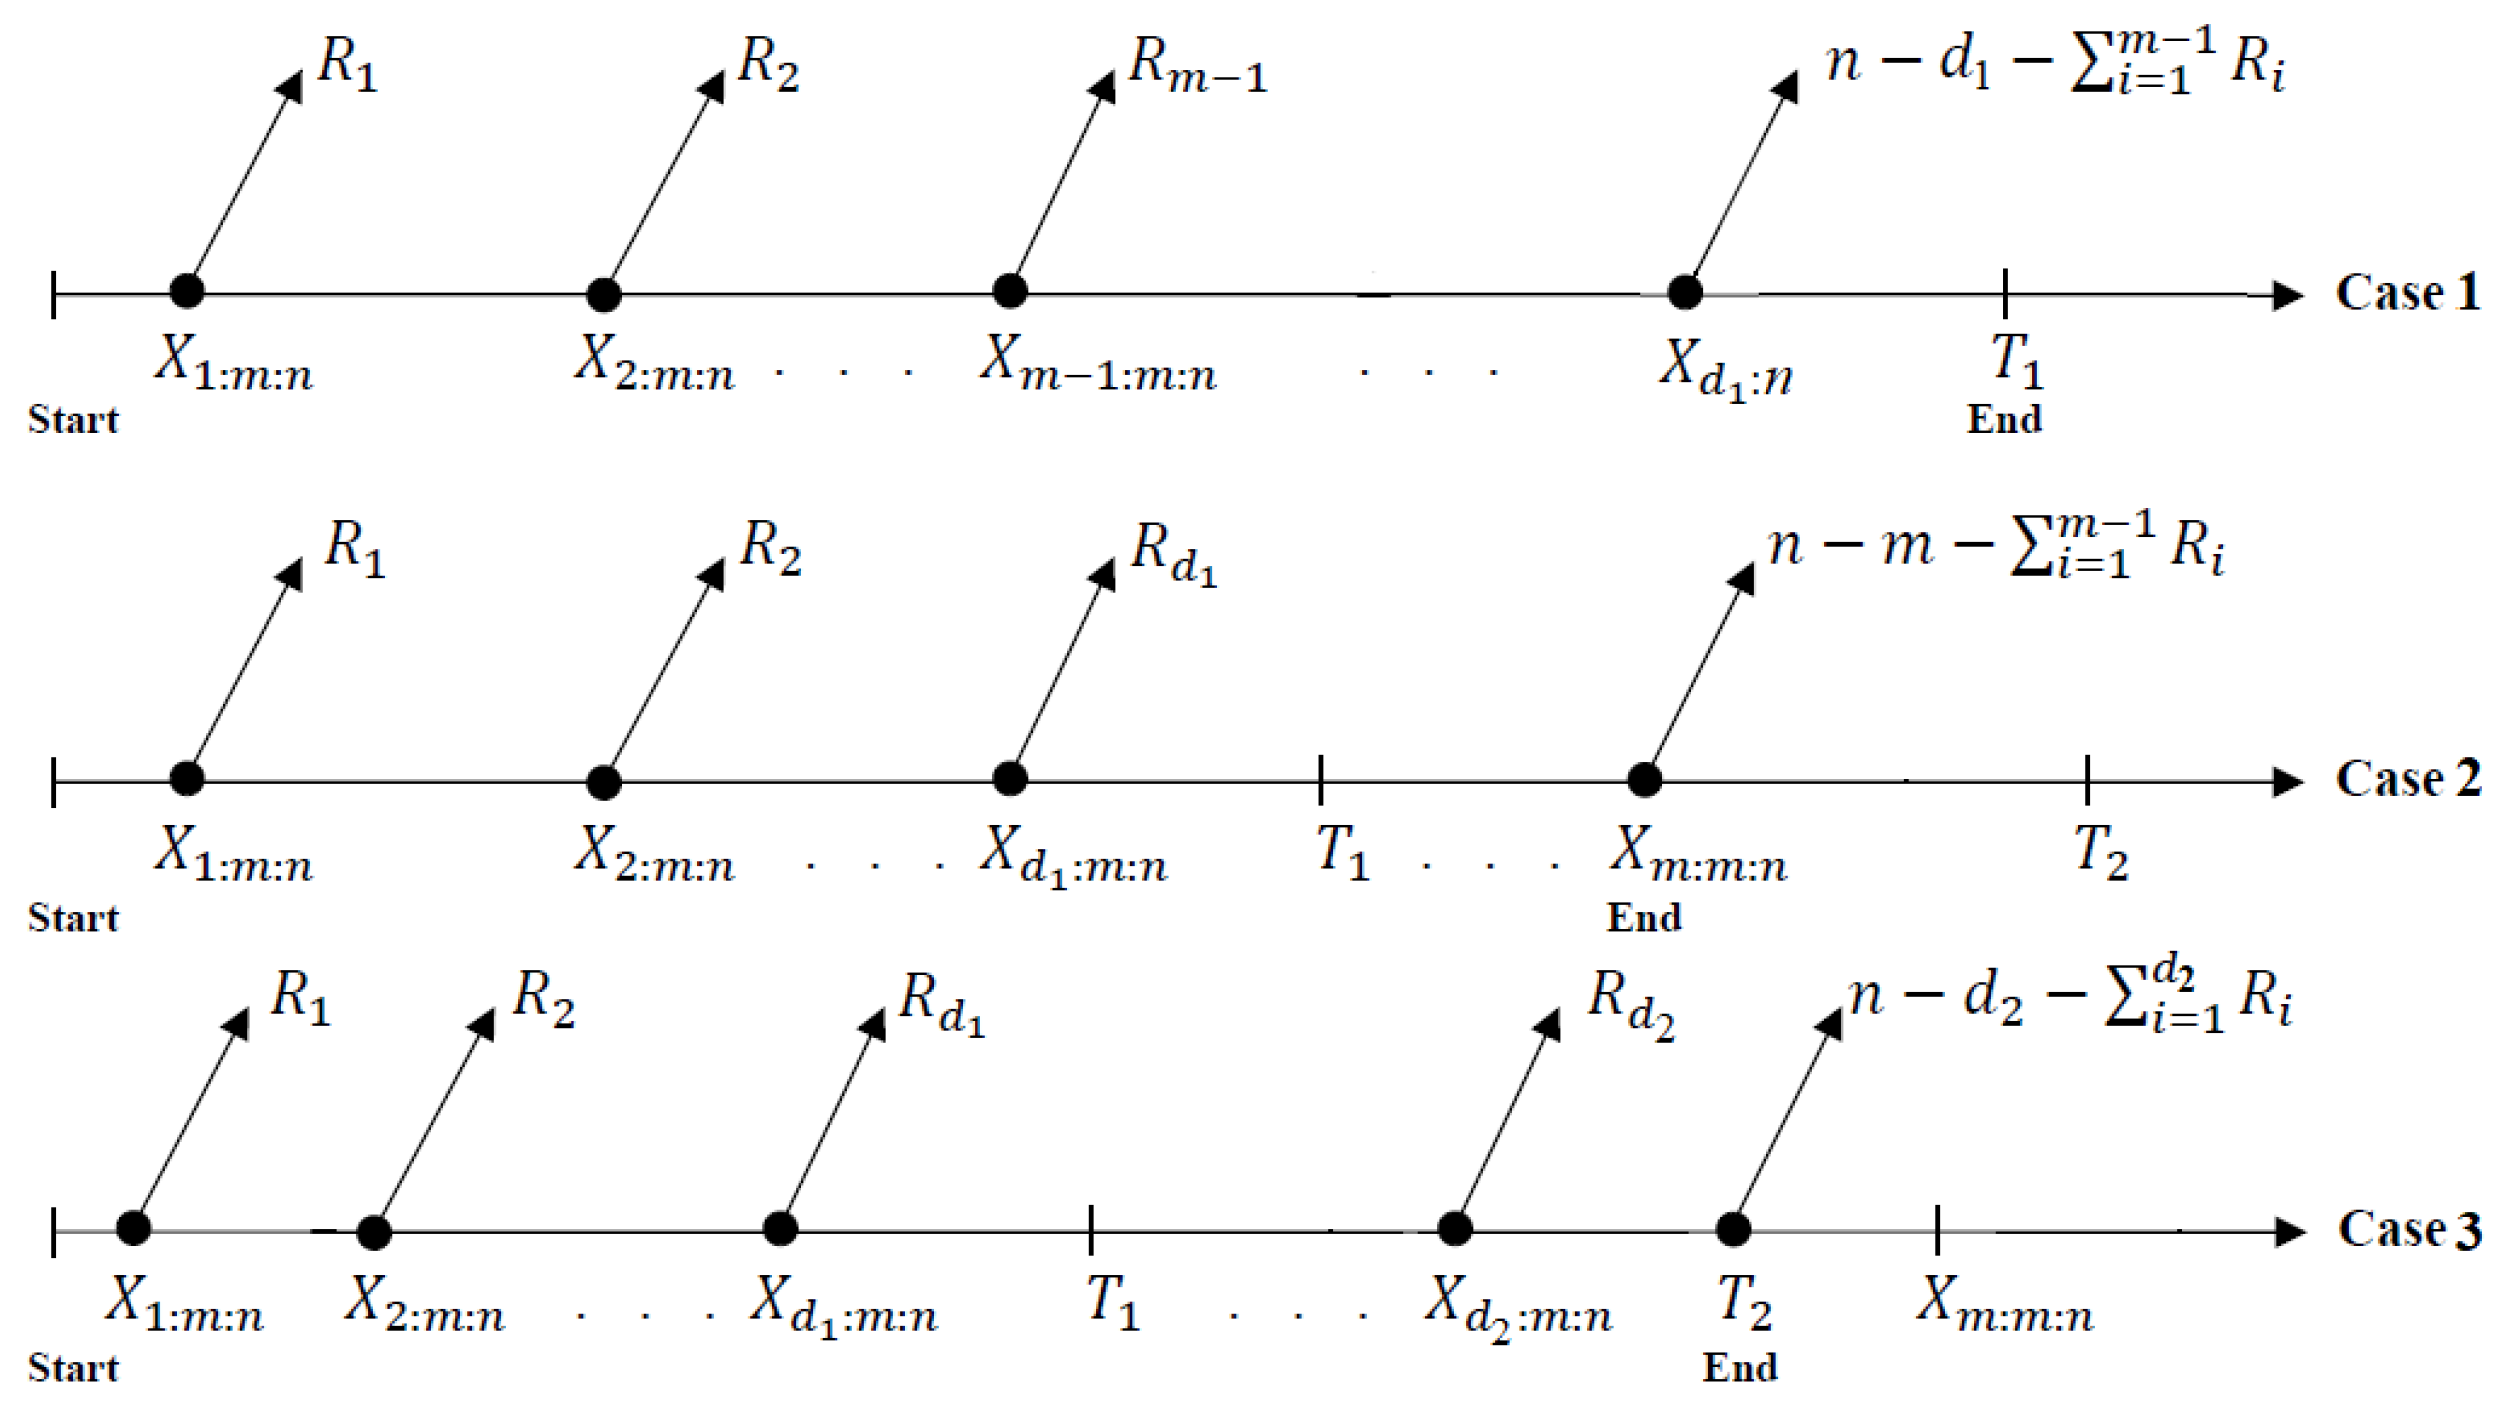
If
, the test is stopped at
(Case 1) without any additional removals. If
, similar to the PTIIC, the test is stopped at
(Case-2); otherwise, the test is stopped at
(Case-3). Thus, the partitioner will collect one of the samples:
Let
be the censoring members of GTIIPHC in a distribution with a PDF and CDF. Therefore, the joint likelihood function, say
, of the proposed censoring mechanism can be expressed as
where
is a composite term of reliability functions and
.
It is critical to note that the GTIIPHC modifies the Type-II progressive hybrid censoring (PHC), proposed by Childs et al. [
6], by guaranteeing that the test is completed at the specified time
. Thus,
is the greatest duration that the examiner is willing to allow the test to continue.
Table 1 lists the GTIIPHC notations. Furthermore, from (
5), six sampling plans can be introduced and provided in
Table 2. A diagrammatic demonstration of GTIIPHC sampling is depicted in
Figure 2.
In the context of GTIIPHC data, several researchers have carried out important research on the statistical estimation of unknown parameter(s) and/or reliability time functions in various lifetime models; for example, Ashour and Elshahhat [
11] studied both frequentist and Bayes estimators of the Weibull parameters; Ateya and Mohammed [
12] studied the prediction issue of the Burr-XII failure times; Seo [
13] discussed the Bayesian inference of Weibull’s model; Cho and Lee [
14] analyzed the competing risks from exponential data; Nagy et al. [
15] pointed out different estimates of the Burr-XII parameters; Wang et al. [
16] derived various estimators of the Kumaraswamy parameters; Elshahhat et al. [
17] addressed the Nadarajah–Haghighi parameters; later, Alotaibi et al. [
18] estimated the Fréchet Parameters.
Although there are many studies that give a mathematical treatment to the proposed distribution, they do not shed light on the application aspects of the alpha-PIE distribution, especially in reliable practice. To our understanding, no study has been performed to evaluate the parameters or reliability features of the alpha-PIE lifetime model when an incomplete dataset is available. Thus, to resolve this issue, our objectives in this work are fourfold:
Derive the maximum likelihood estimators (MLEs) in addition to their two-sided approximate confidence intervals (ACIs), using observed Fisher’s information, of the alpha-PIE parameters and or any associated function such as and .
Derive the Bayes’ estimators in addition to their two-sided highest posterior density (HPD) intervals, under independent gamma priors assumption, of , , , and using the squared error loss (SEL) function.
To select the best progressive censoring patterns among various competing strategies, several criteria of optimality are proposed.
Via extensive Monte Carlo simulations, on the basis of four accuracy criteria, namely, (i) root mean squared-errors, (ii) mean relative absolute biases, (iii) average confidence lengths, and (iv) coverage percentages, the performance of the acquired estimators is examined. Additionally, two real-word applications from the engineering and chemistry sectors, to evaluate how the offered approaches operate in practice and to choose the best censoring strategy, are examined.
The organization of the article is as follows:
Section 2 and
Section 3 provide the point and interval inferences using frequentist and Bayes approaches. Simulation results are obtained and discussed in
Section 4.
Section 5 examines two applications of actual data sets. Optimum criteria of progressive patterns are presented in
Section 6. Lastly,
Section 7 lists the study’s conclusions.
4. Monte Carlo Simulations
This section deals with comparing the behavior of the acquired frequentist and Bayes estimators of
,
,
and
obtained in the proceeding sections via extensive Monte Carlo simulations. This goal is developed based on large 1000 GPHC-T-II samples generated from two different groups of the alpha-PIE parameters, namely Set-1, Alpha-PIE
, and Set-2, Alpha-PIE
. For distinct time
, from Sets 1 and 2, the plausible values of (
,
) are (0.87509, 2.89008) and (0.99453, 0.27545), respectively. Several choices of
(thresholds),
n (total test items),
m (effective test items), and
(progressive pattern) are also used, namely
and (0.4,0.8),
. For each
n, the value of
m is determined as failure percentages (FPs) such as
= (40,80)%. To assess the removal mechanism in GPHC-T-II, for each group
, three patterns of
are considered:
As soon as 1000 GPHC-T-II data are collected, all suggested point (or interval) estimators created by maximum likelihood (or Bayes) inferential approaches of
,
,
and
are evaluated via
4.2.2 programming software. Therefore, we recommend installing two statistical packages in
, namely (i) ’
’ package (by Henningsen and Toomet [
19]) to calculate the maximum likelihood estimates along with their 95% ACI estimates, (ii) ’
’ package (by Plummer et al. [
29]) to evaluate the Bayes MCMC estimates for the same unknown parameters, as well as corresponding HPD interval estimations. Taking the classical estimates of
and
as starting points, to compute the acquired Bayes point/interval estimates of
,
,
or
, we replicated the MCMC sampler 12,000 times and ignored the first 2000 times as burn-in. To demonstrate the performance of the Bayes findings on different gamma priors, following Kundu [
30], two sets of the hyperparameters
are utilized, called
- (a)
For Set-1:
Prior-1:;
Prior-2:.
- (b)
For Set-2:
Prior-1:;
Prior-2:.
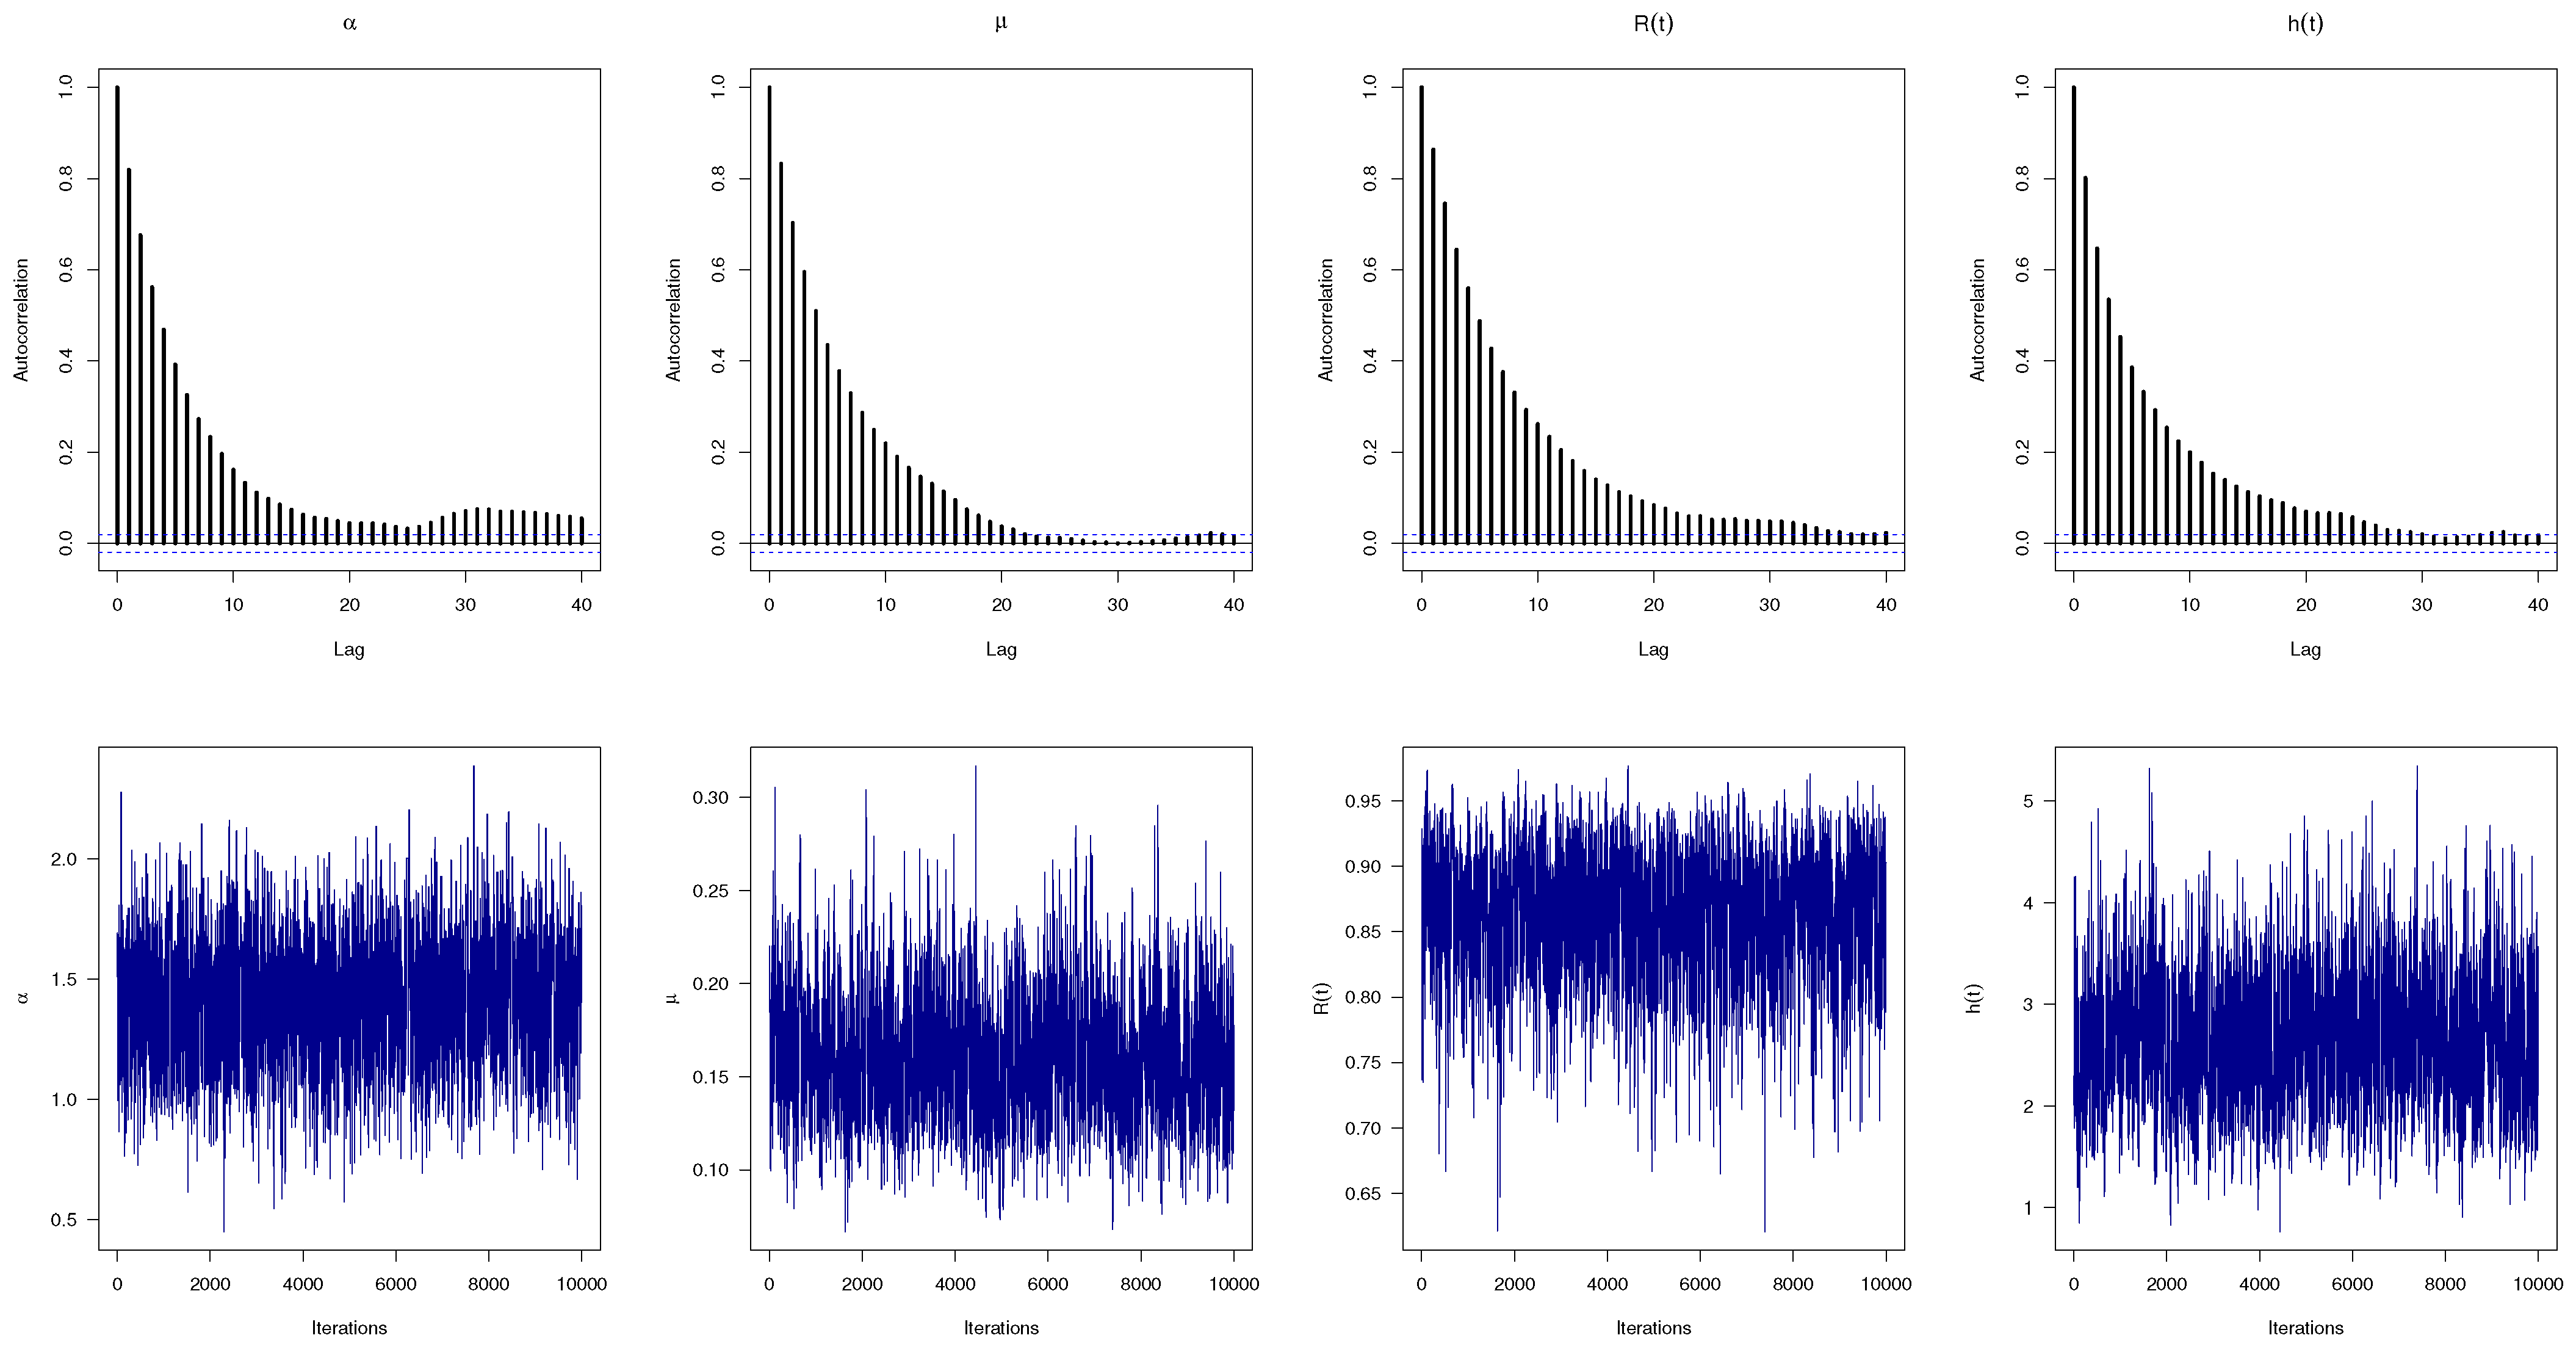
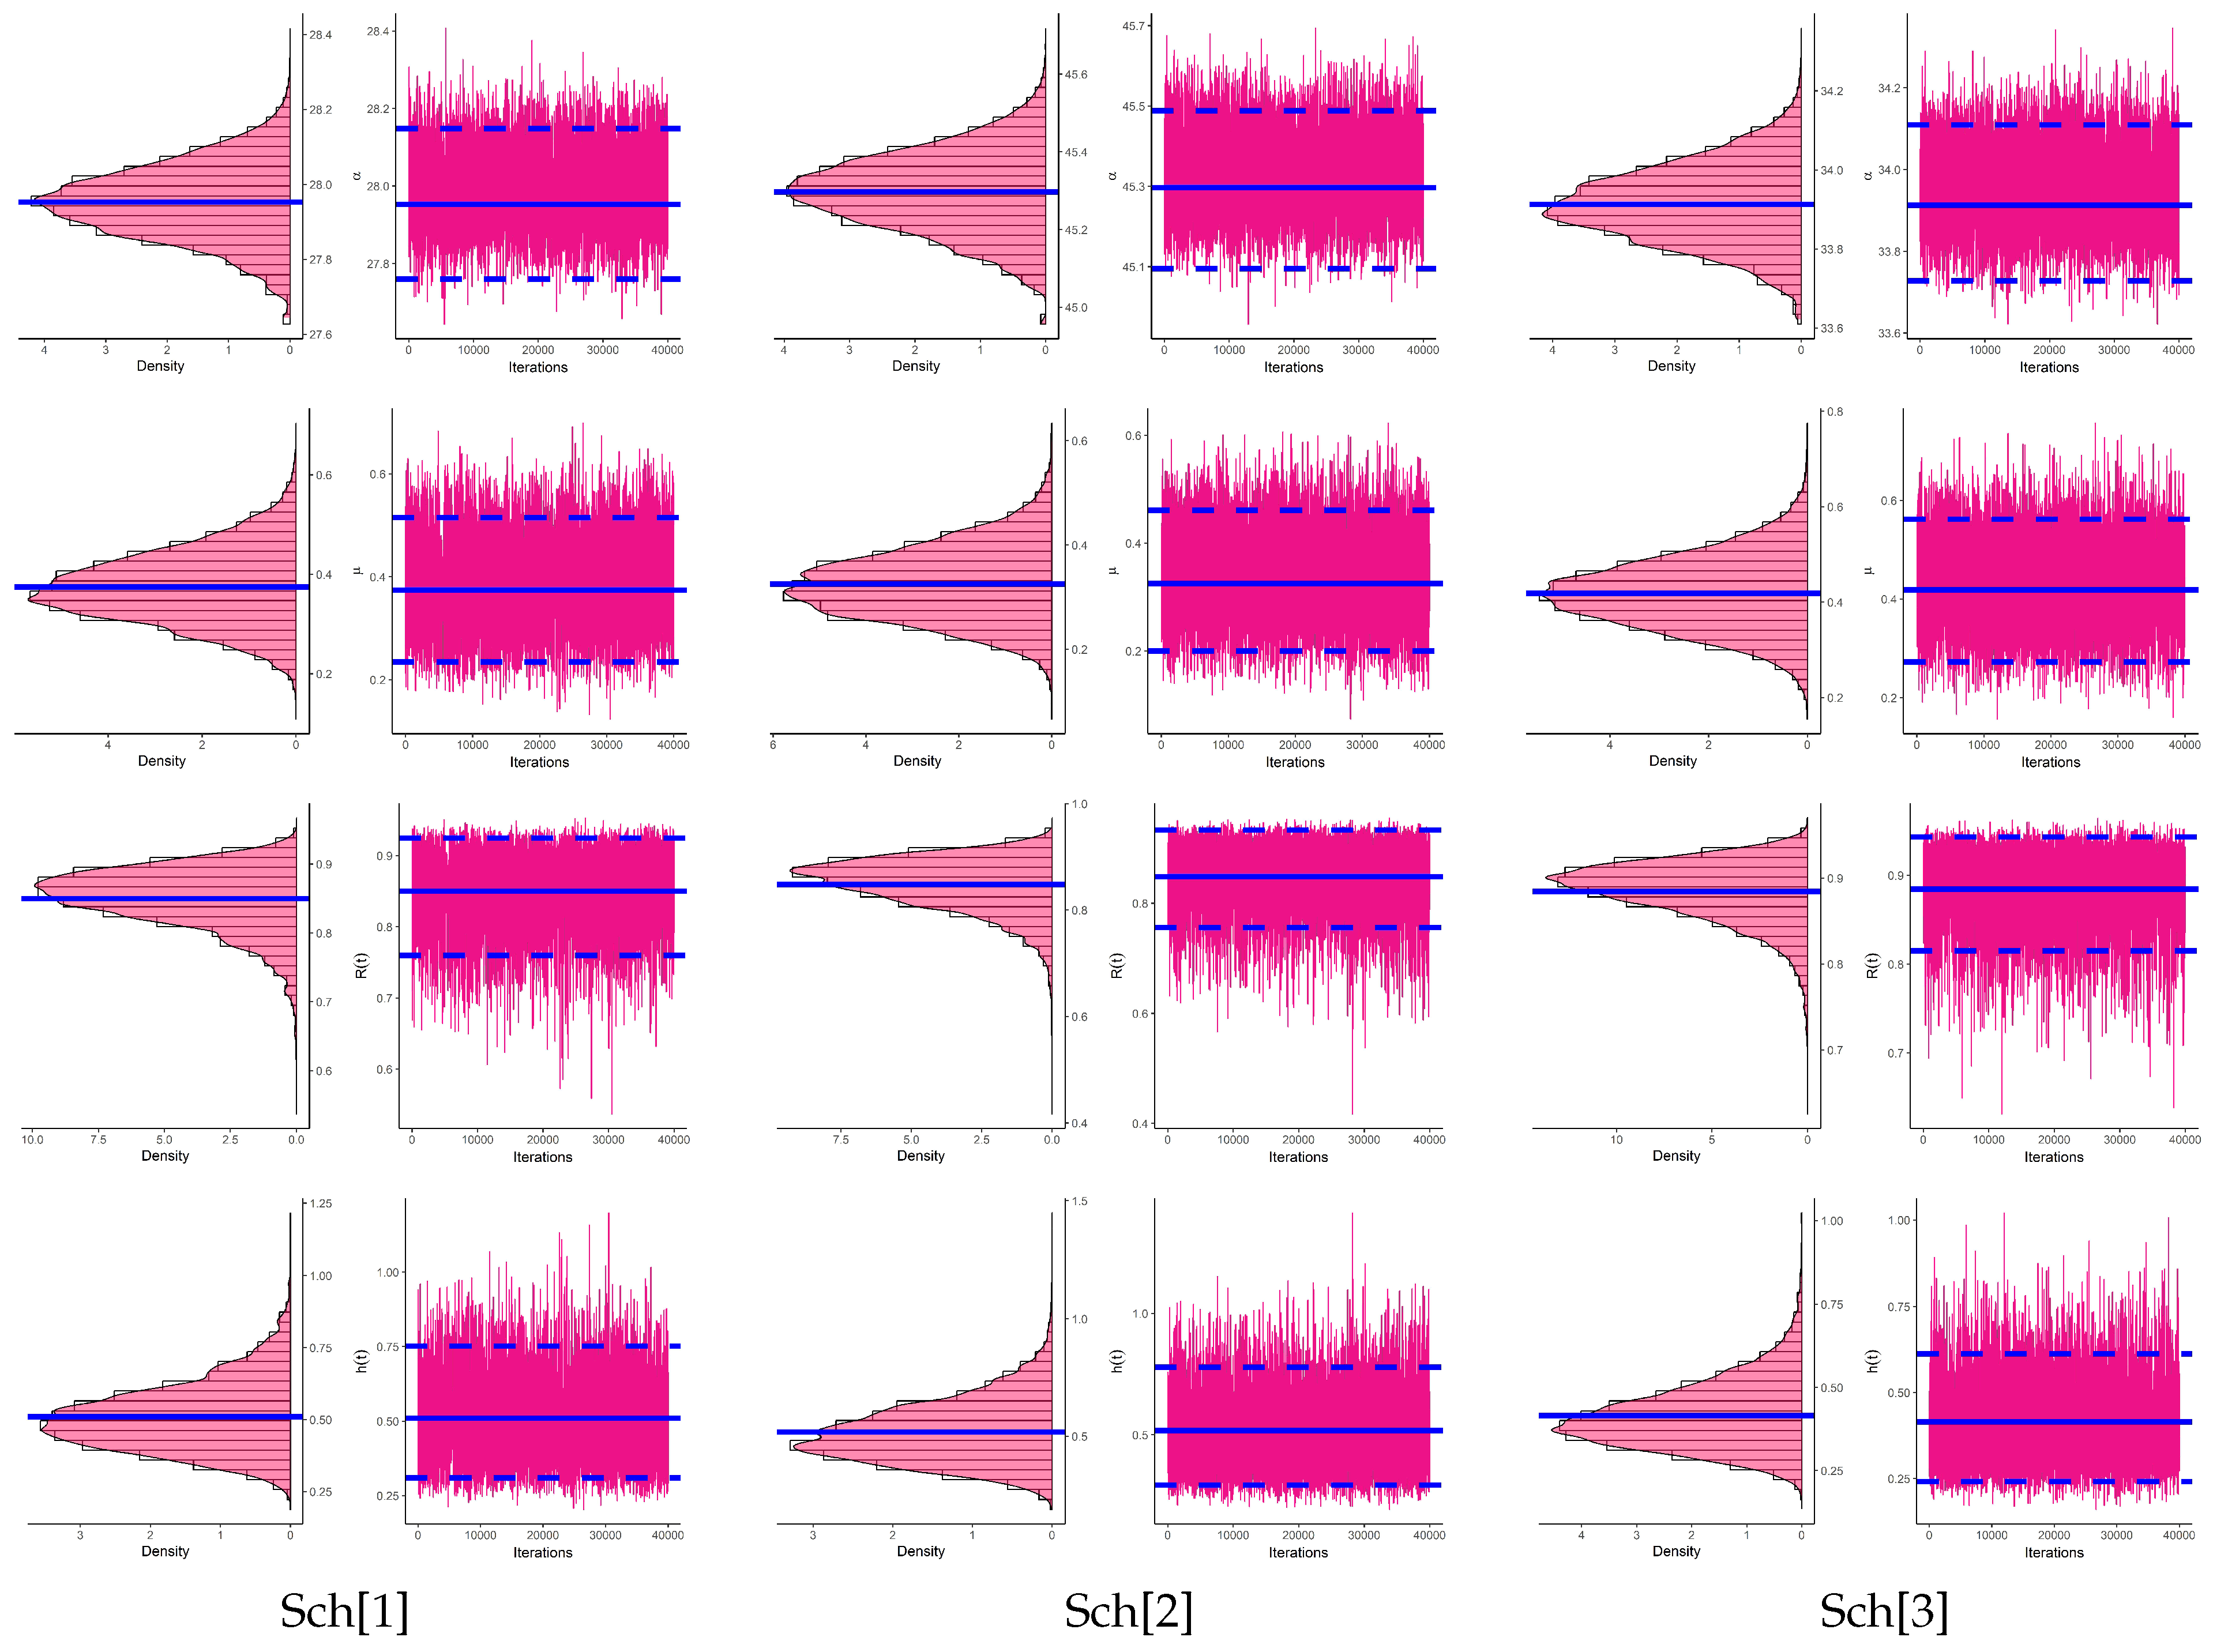
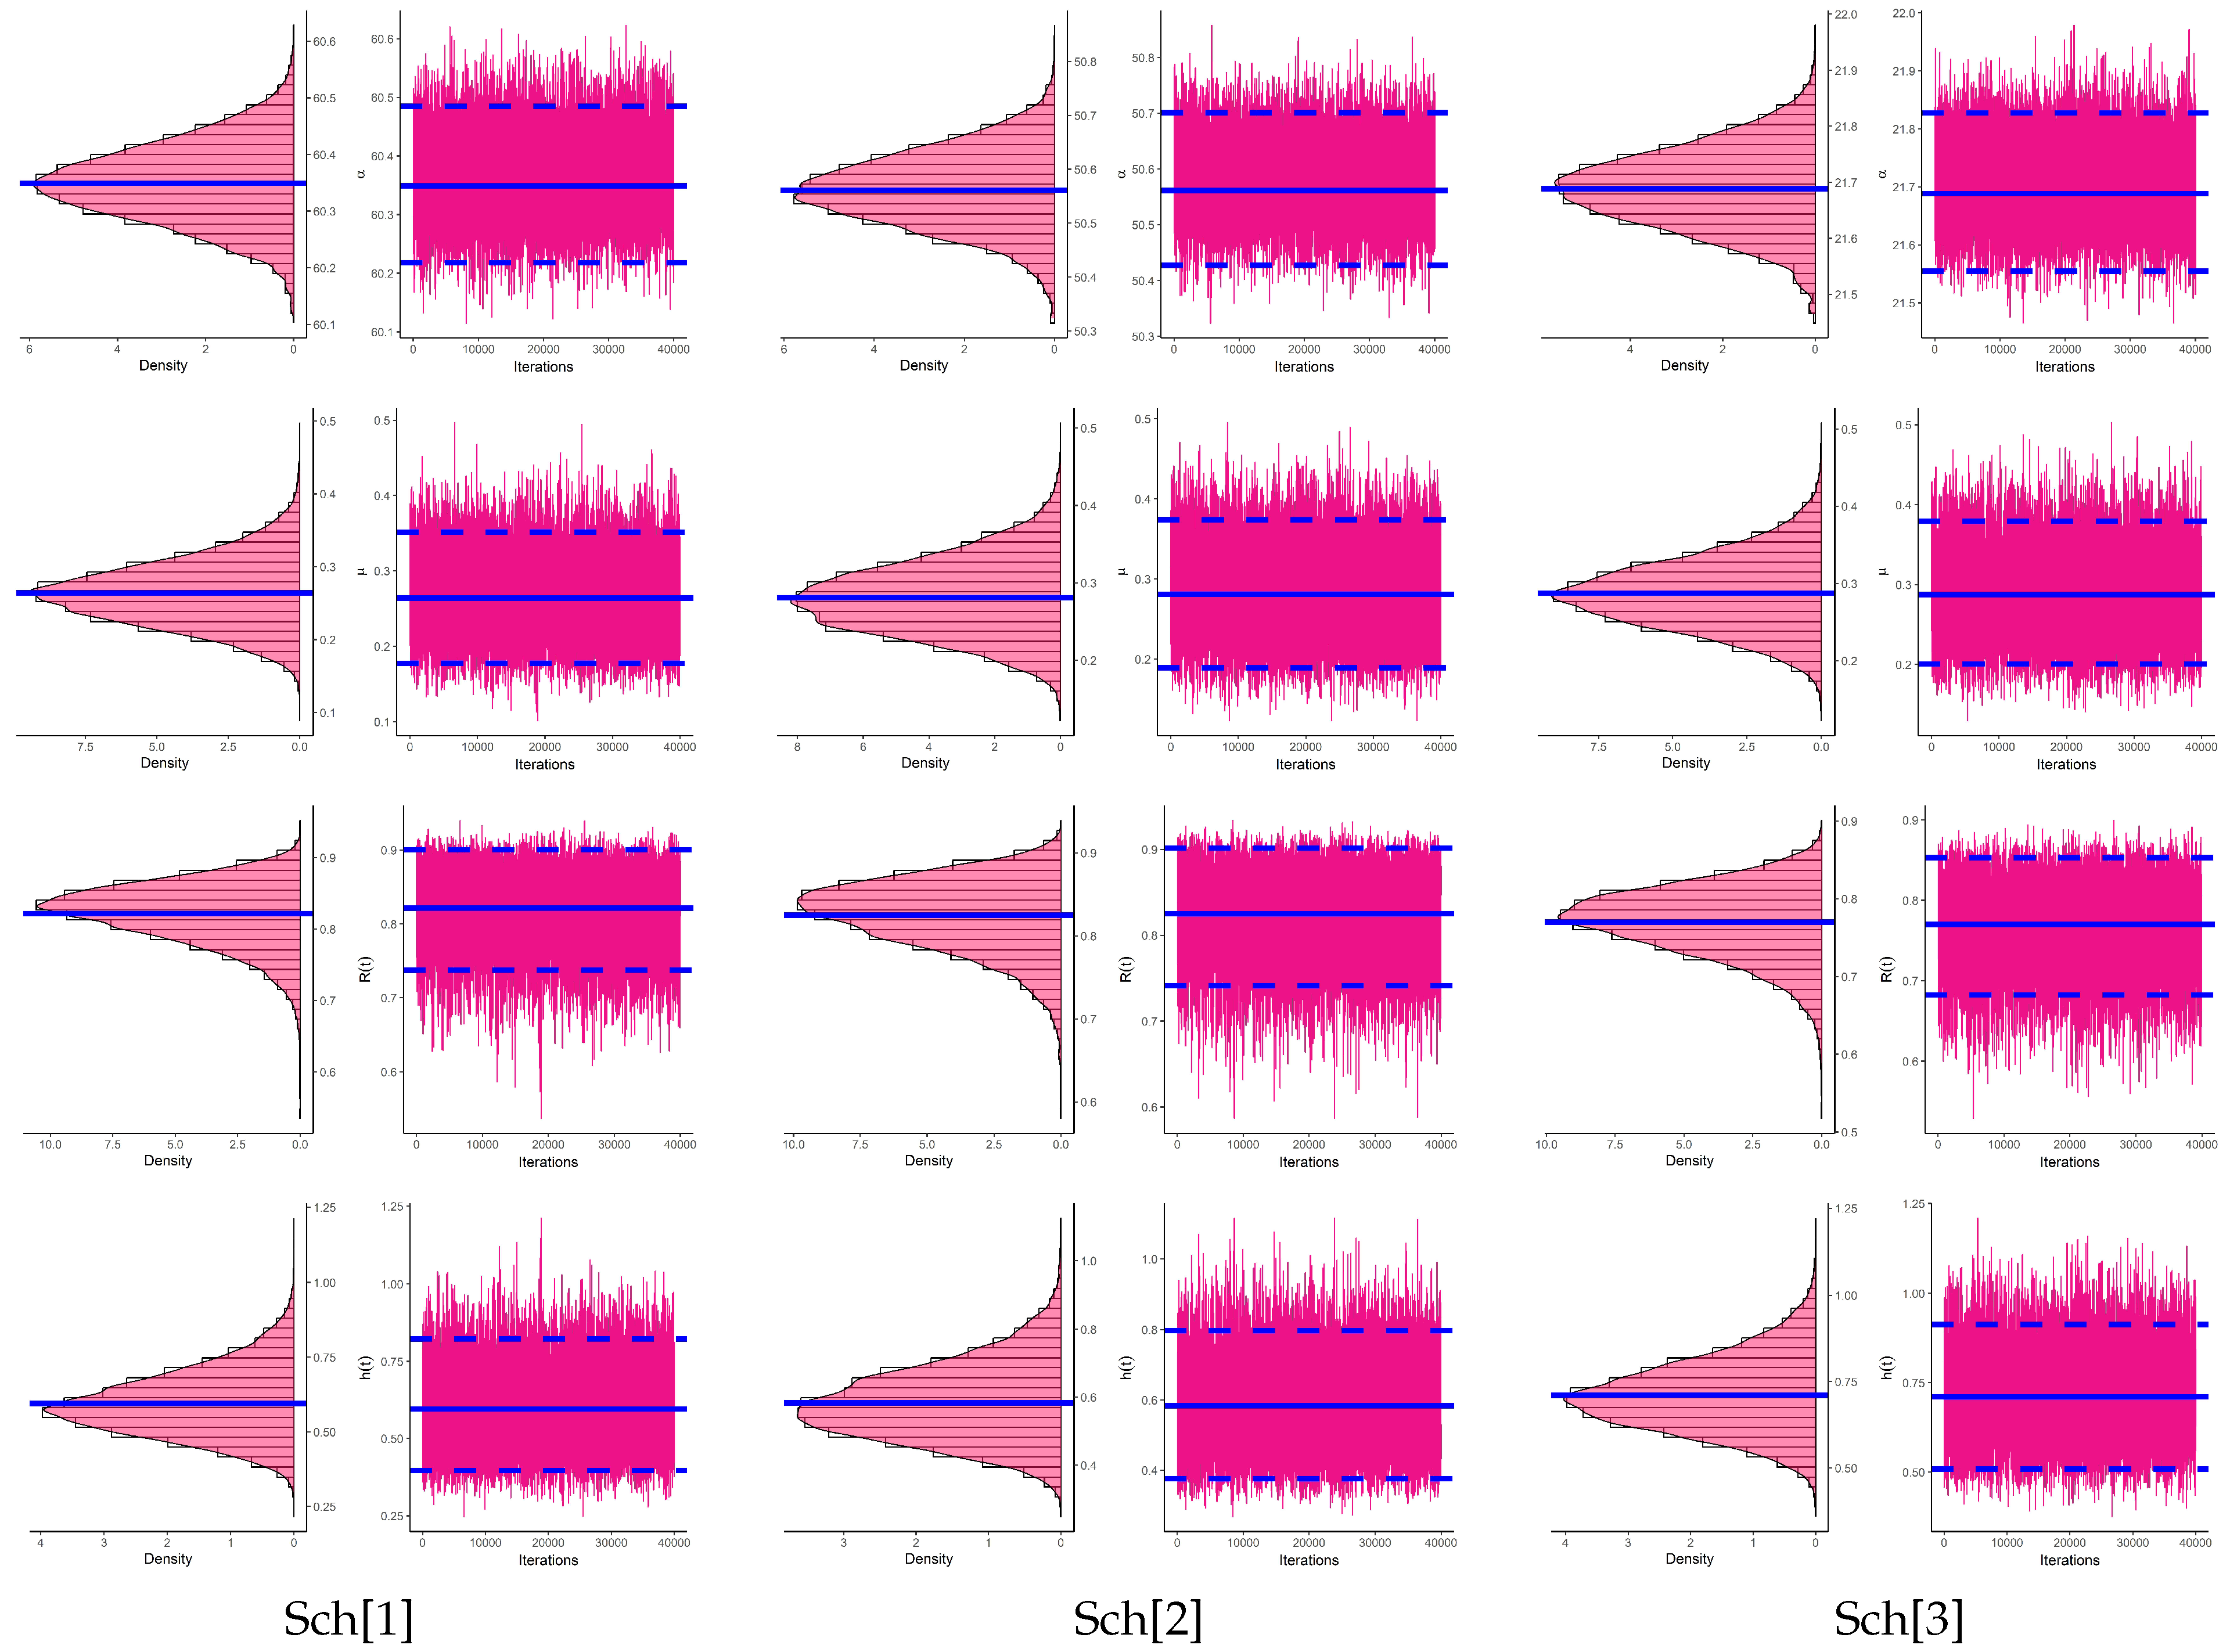
To examine the convergence status of the collected iterations of
,
,
, and
developed from the Bayes MCMC algorithm, for Set-1 along with Prior-1,
and Scheme-1 as an example, the trace and autocorrelation plots are provided in
Figure 3. Obviously, it is evident that the Markovian graphs of
,
,
and
are satisfactorily mixed, and thus, the results of the acquired points (or interval) become more significant.
However, for each test, the average point estimates (Av.Es) of
are given by
where
denotes the calculated estimate of
at the
ith sample.
The acquired point estimates of
are compared based on their root mean squared-errors (RMSEs) and mean relative absolute biases (MRABs) as
and
respectively.
Further, the acquired interval estimates of
are compared with regard to their average confidence lengths (ACLs) and coverage percentages (CPs) as
and
respectively, where
is the indicator function,
denote the (lower,upper) bounds of
ACI (or HPD) interval of
. In a similar way, the Av.E, RMSE, BRAB, ACL, and CP values of
,
, or
can be easily computed.
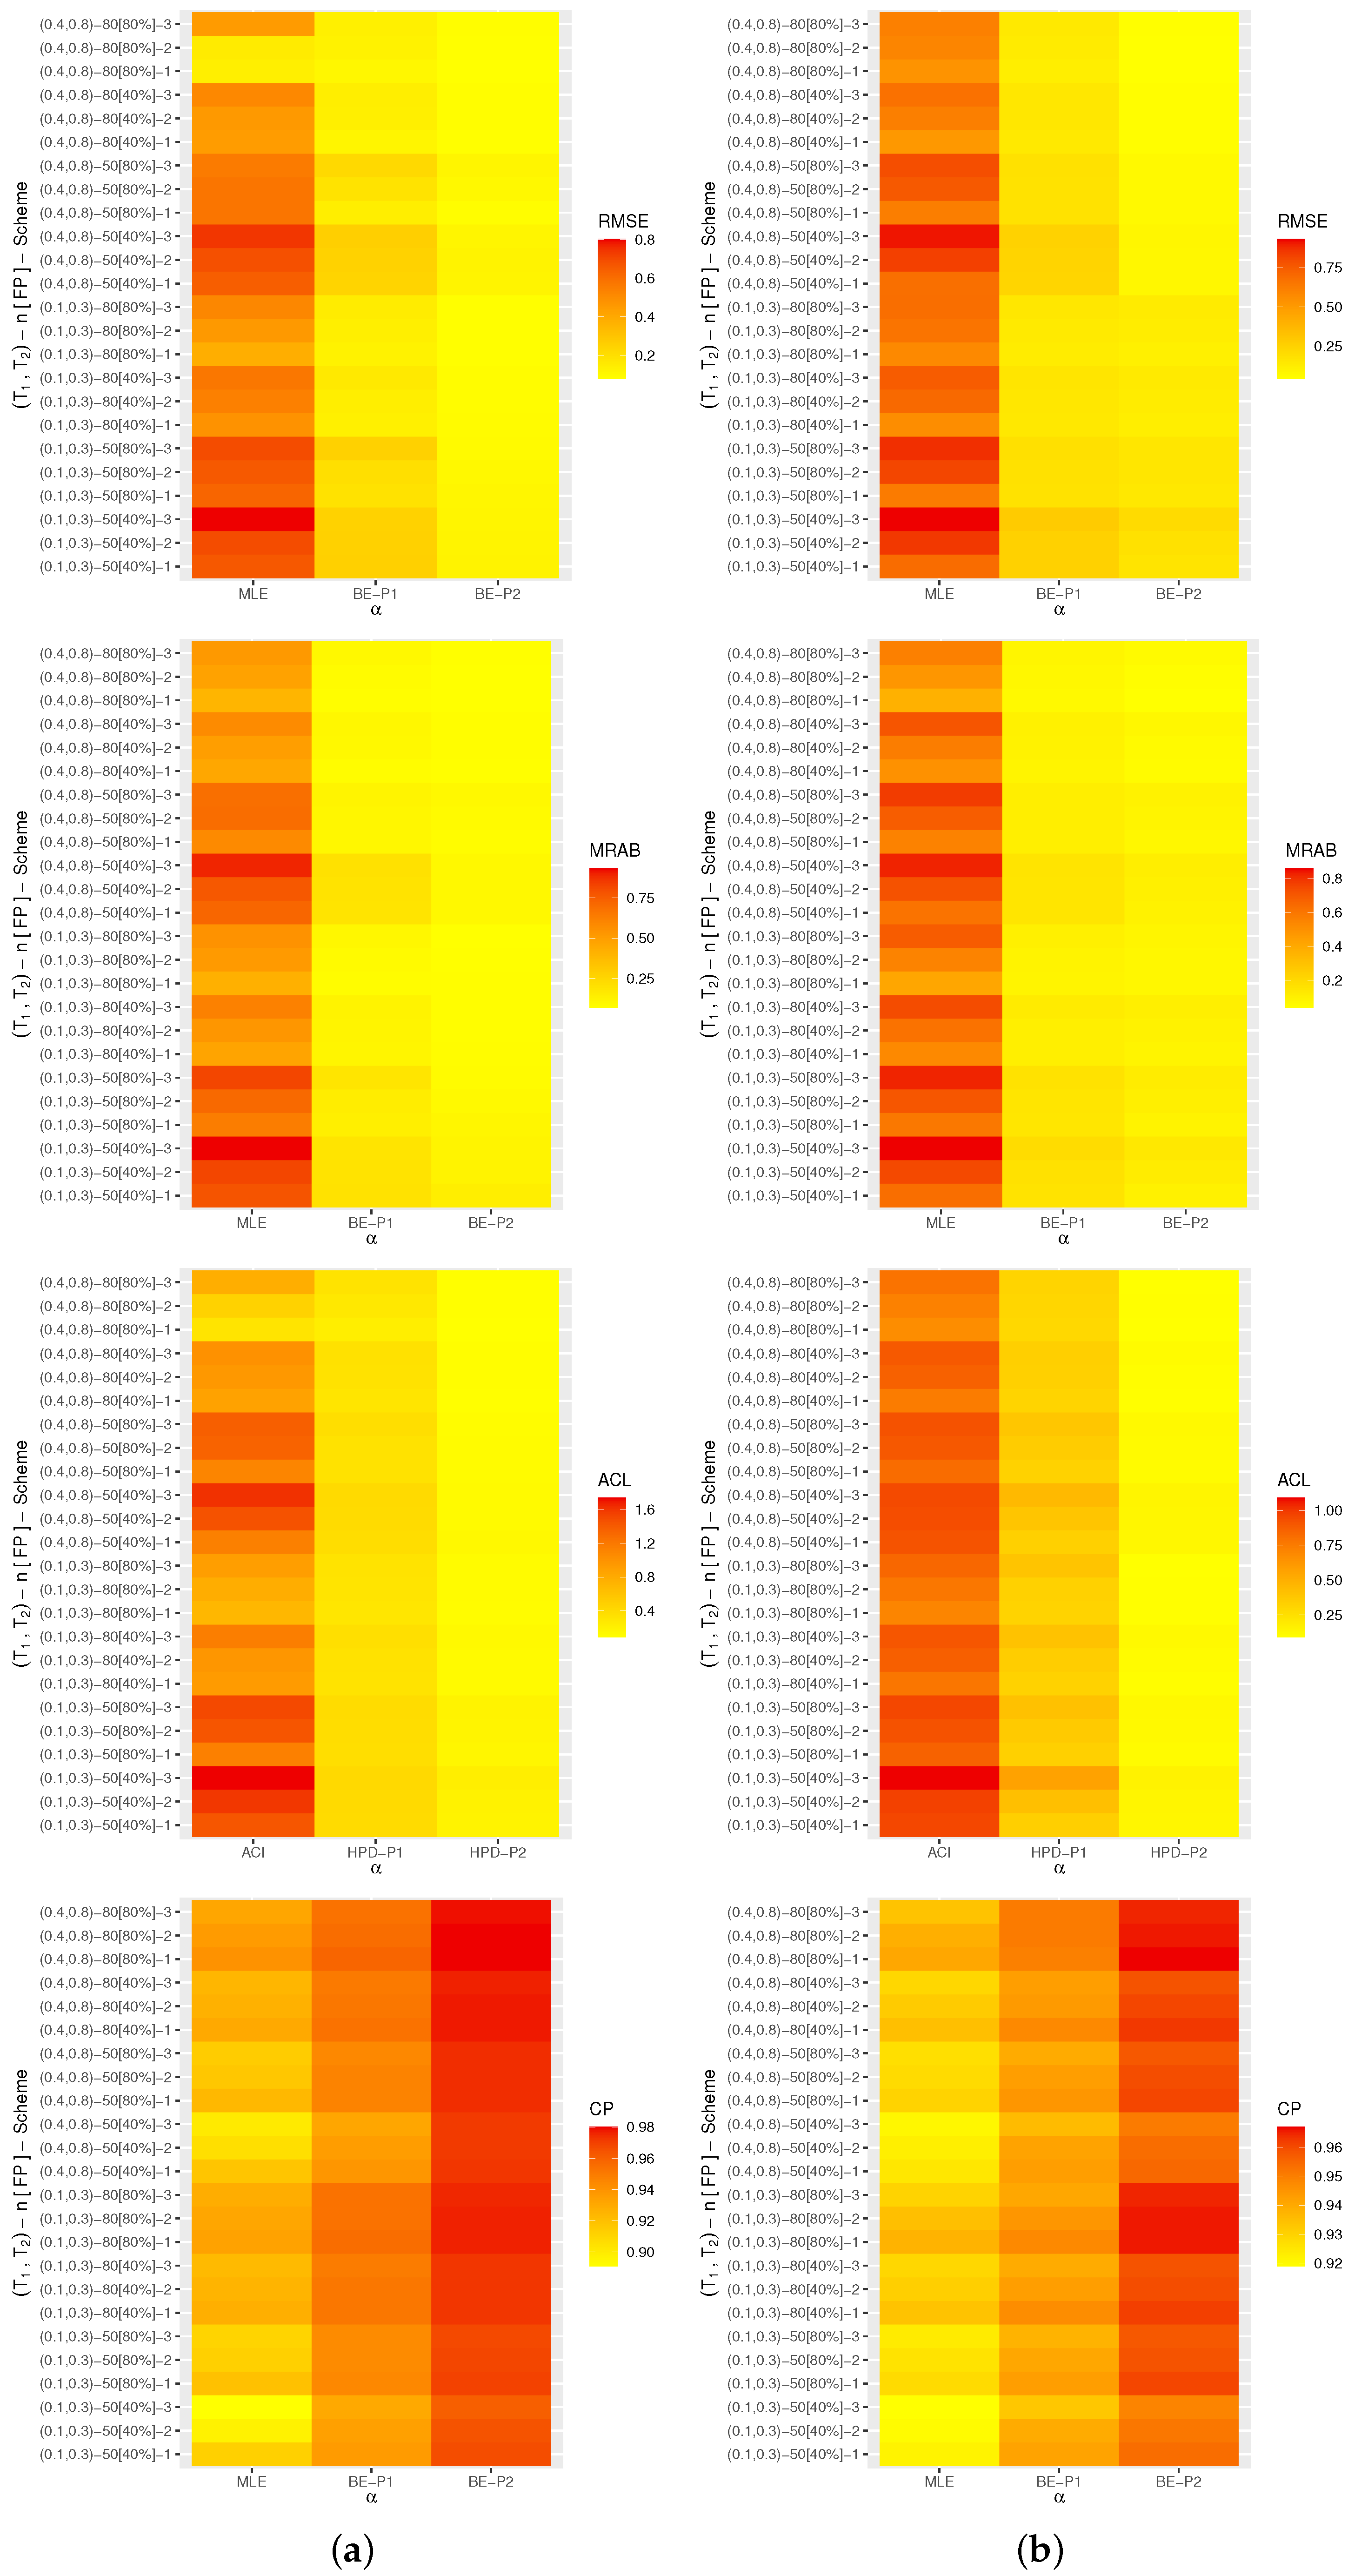
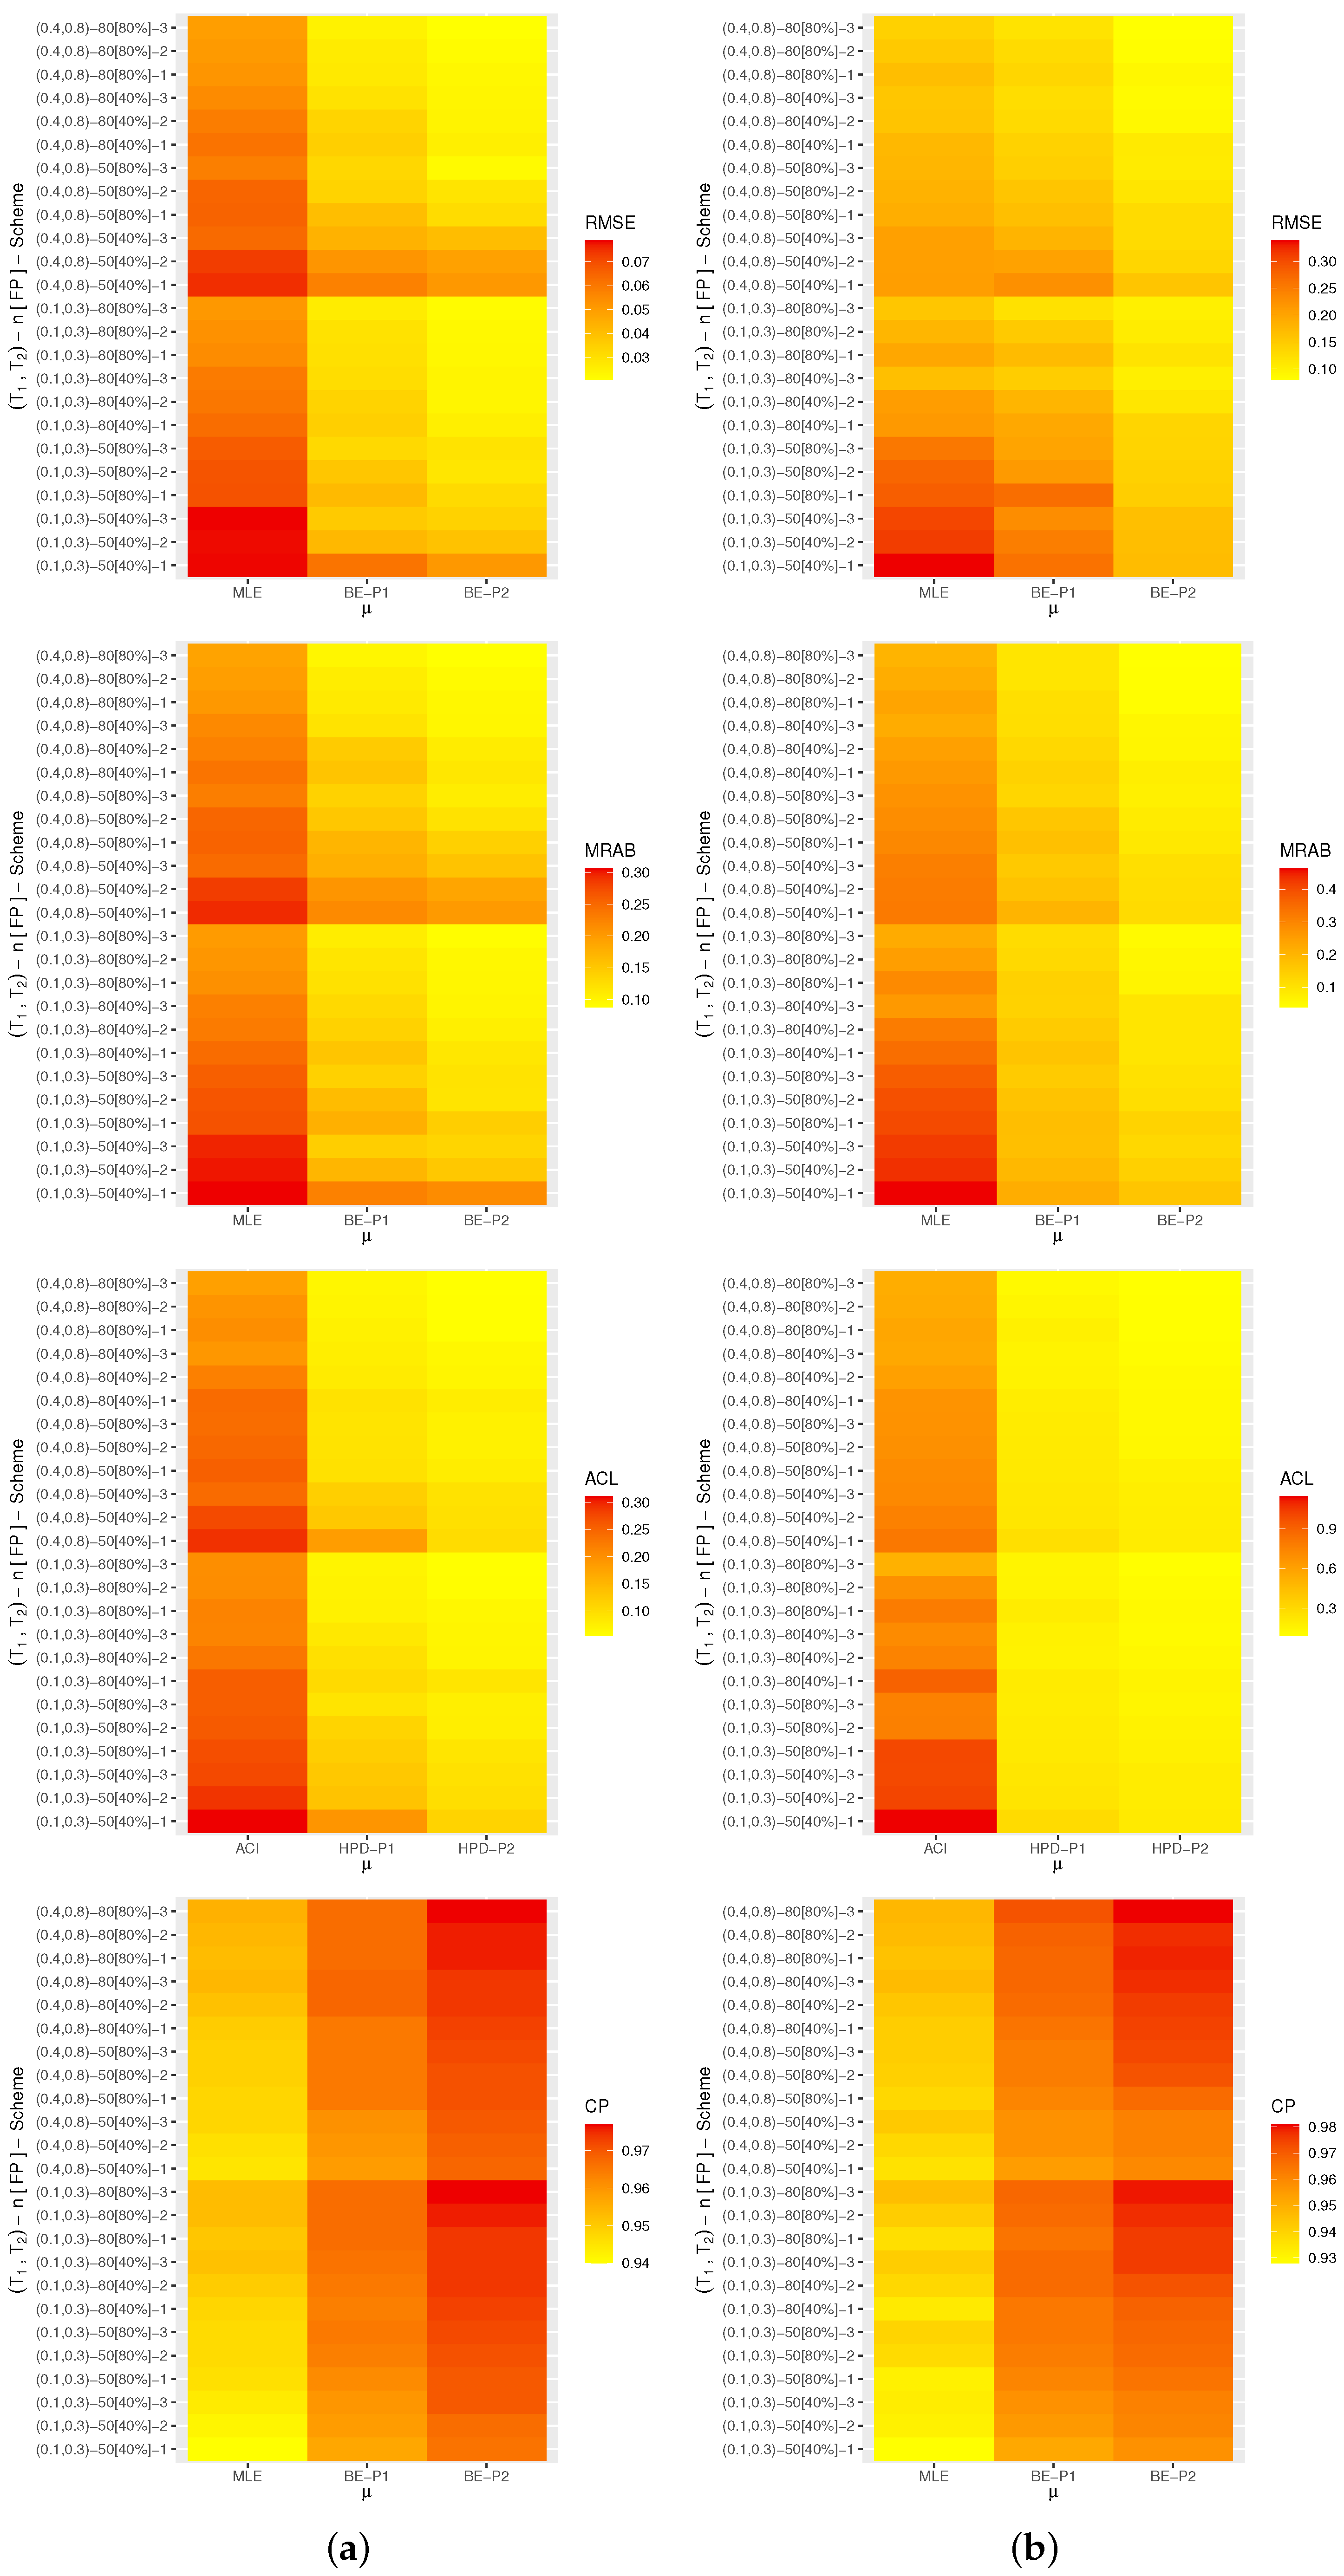
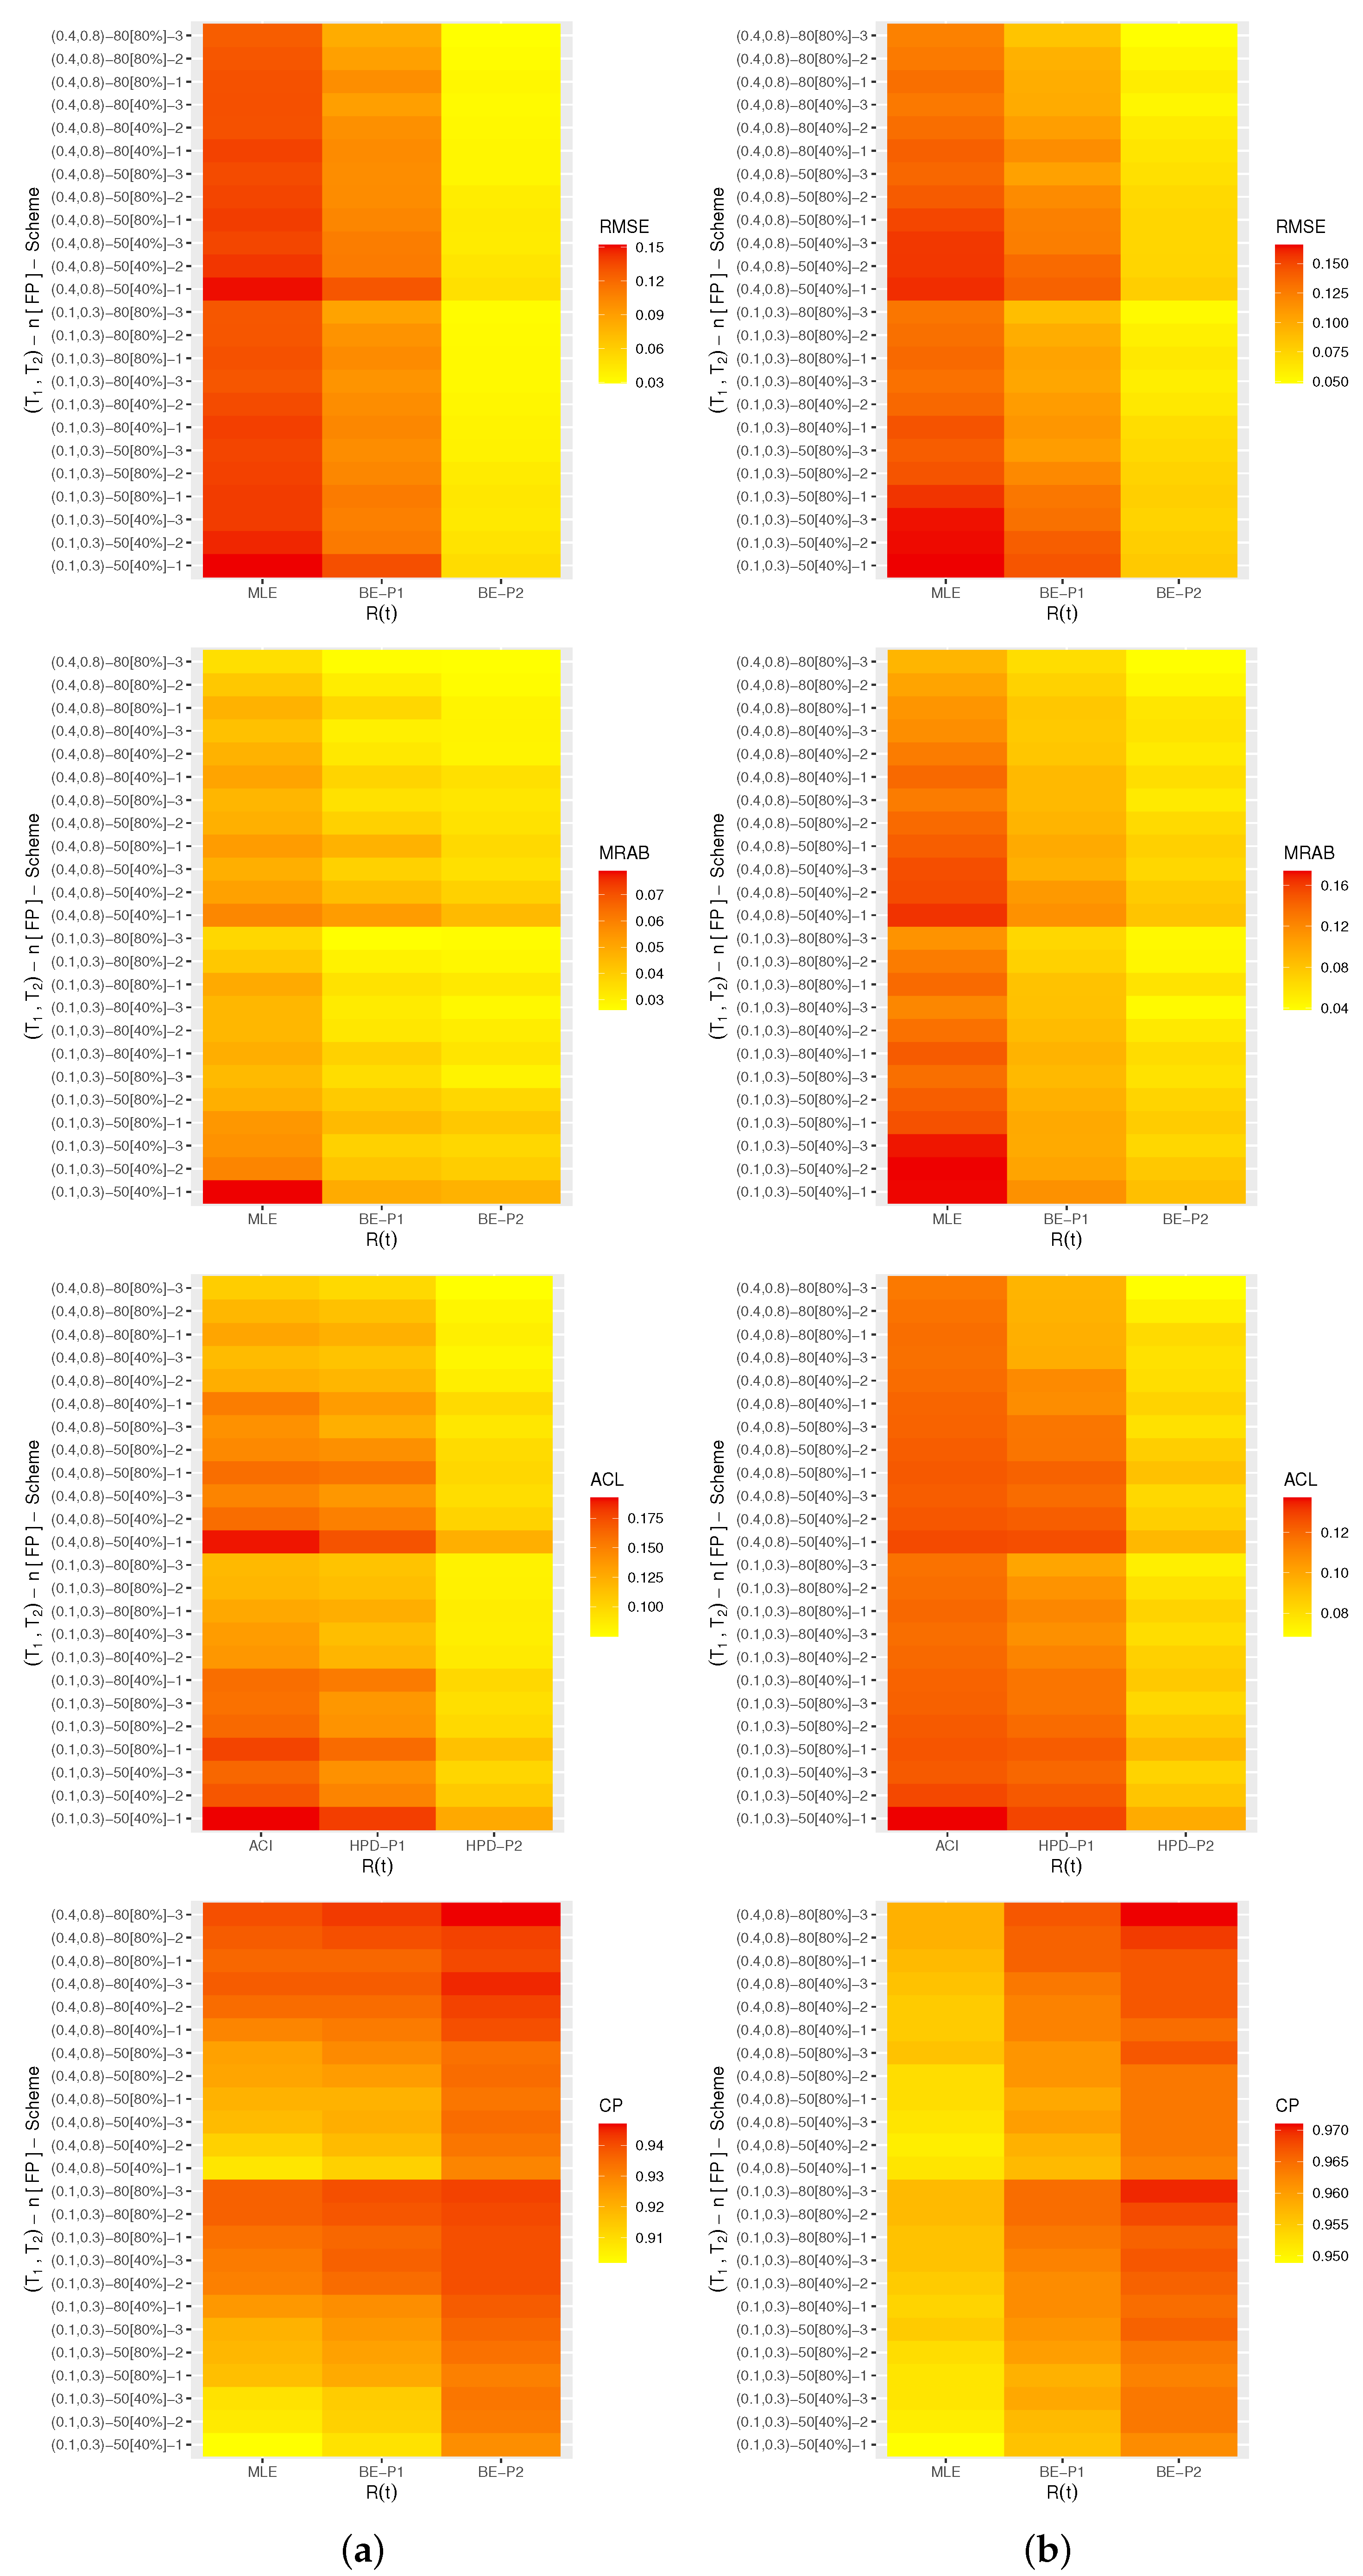
A heat map is a tool for graphically representing numerical data. Via
4.2.2 software with the heat-map programming tool, the calculated criteria (including RMSEs, MRABs, ACLs, and CPs) of
,
,
, and
are represented in
Figure 4,
Figure 5,
Figure 6 and
Figure 7, respectively. As
supplementary materials, all numerical values of
,
,
, or
are reported. To distinguish, for each plot in
Figure 4,
Figure 5,
Figure 6 and
Figure 7, the proposed approaches are displayed on the ‘x-axis’ line, whereas the censoring settings are displayed on the ‘y-axis’. In addition, as notations, the Bayes estimates (for Prior-I (say P1) as an example) are referred to as BE-P1, while the HPD interval is referred to as HPD-P1.
In terms of the smallest RMSE, MRAB, and ACL values as well as the largest CP values, from
Figure 4,
Figure 5,
Figure 6 and
Figure 7, the following comments are made:
All acquired point and interval estimates of , , or have good behavior; this is a general note.
As n(or FP%) increases, all results of all unknown parameters of life perform satisfactorily. A similar point is also true when the spacing between n and m is reduced.
As grow, for both Sets 1 and 2, the RMSEs, MRABs, and ACLs of , , and narrowed down, while their CPs increase.
As anticipated, due to the gamma information, the Bayes point (or HPD interval) estimates of , , , or behave better compared to the others.
All Bayesian computations performed based on Prior-2 provide more accurate results than those obtained based on Prior-1. This finding is due to the fact that the associated variance of Prior-2 is less than the associated variance of Prior-1.
Comparing the suggested schemes 1, 2, and 3, for both Sets 1 and 2, it is seen that the point (or interval) estimates of have good results when all survival items are removed at the first stage (i.e., Scheme-1) and of , , and at the last stage (i.e., Scheme-3).
In summary, it is advised to use MCMC samples to estimate the model parameters and reliability features of the alpha-PIE lifetime model when Type-II generalized progressively hybrid censored data are available.
6. Optimal Progressive Designs
In regard to the context of reliability, the experimenter can decide to select the most effective censoring strategy from a group of all available progressive designs in order to offer as much information as possible about the parameter(s) under investigation. Independently, this issue was first addressed by Balakrishnan and Aggarwala [
42] and Ng et al. [
43]. The ideal censoring fashion
such as
, can be proposed, and the plausible choices of
n,
m and
are predetermined in advance depending on unit capacity, experimentation facilities, and budgetary constraints. In the literature, several criteria, however, have been introduced, and numerous results on the optimum censoring systems have been investigated; for examples, see Pradhan and Kundu [
44]; Sen et al. [
45]; Elshahhat and Rastogi [
46]; Ashour et al. [
47]; and Elshahhat and Abu El Azm [
48]. In
Table 11, a list of commonly used metrics to help us choose the best censoring strategy is presented.
It should be noted that the objective of the studied criteria is to minimize the trace, determinant, and variance of the logarithmic MLE of the th quantile of the estimated variance–covariance matrix, while the objective of criterion is to maximize the observed Fisher information elements.
Obviously, the best censoring pattern must correspond to the largest value of
and the smallest value of
for
. Specifically, from (
2), the logarithmic of the alpha-PIE lifetime distribution
is given by
Again, utilizing the delta method, the approximated variance of
is given by
where
6.1. Optimum from Electronic Tubes
This subsection aims to determine the best progressive censoring based on the generated samples, which are created from the electronic tube data, reported in
Table 5. However, from
Table 5,
Table 6 and
Table 11, the optimum criteria are evaluated; see
Table 12.
Table 12 supports the same recommended censoring schemes considered in
Section 4 and shows that
According to , the design of Sch[2] (in Sample ) and the design of Sch[3] (in Samples and ) are the optimum censoring plans compared to others.
According to , the design of Sch[1] (in Sample ), the design of Sch[3] (in Sample ) and the design of Sch[2] (in Sample ) are the optimum censoring plans compared to others.
6.2. Optimum from Vinyl Chloride
In this subsection, from the vinyl chloride data, we shall propose an optimal progressive censored plan based on the generated samples reported in
Table 9. However, from
Table 9,
Table 10 and
Table 11, the optimum criteria are evaluated and presented in
Table 13.
According to , the design of Sch[1] (in Sample ) and the design of Sch[2] (in Samples ) are the optimum censoring plans compared to others.
According to , the design of Sch[1] (in Samples ) are the optimum censoring plans compared to others.
According to , the designs Sch[3] and Sch[2] (in Sample ), respectively, are the optimum censoring plans compared to others.
According to , the design of Sch[3] (in Samples ) and the design of Sch[2] (in Samples ) are the optimum censoring plans compared to others.
Finally, it is clear that the optimum progressive censoring plans suggested in this section support the same findings reported in
Section 4.
7. Concluding Remarks
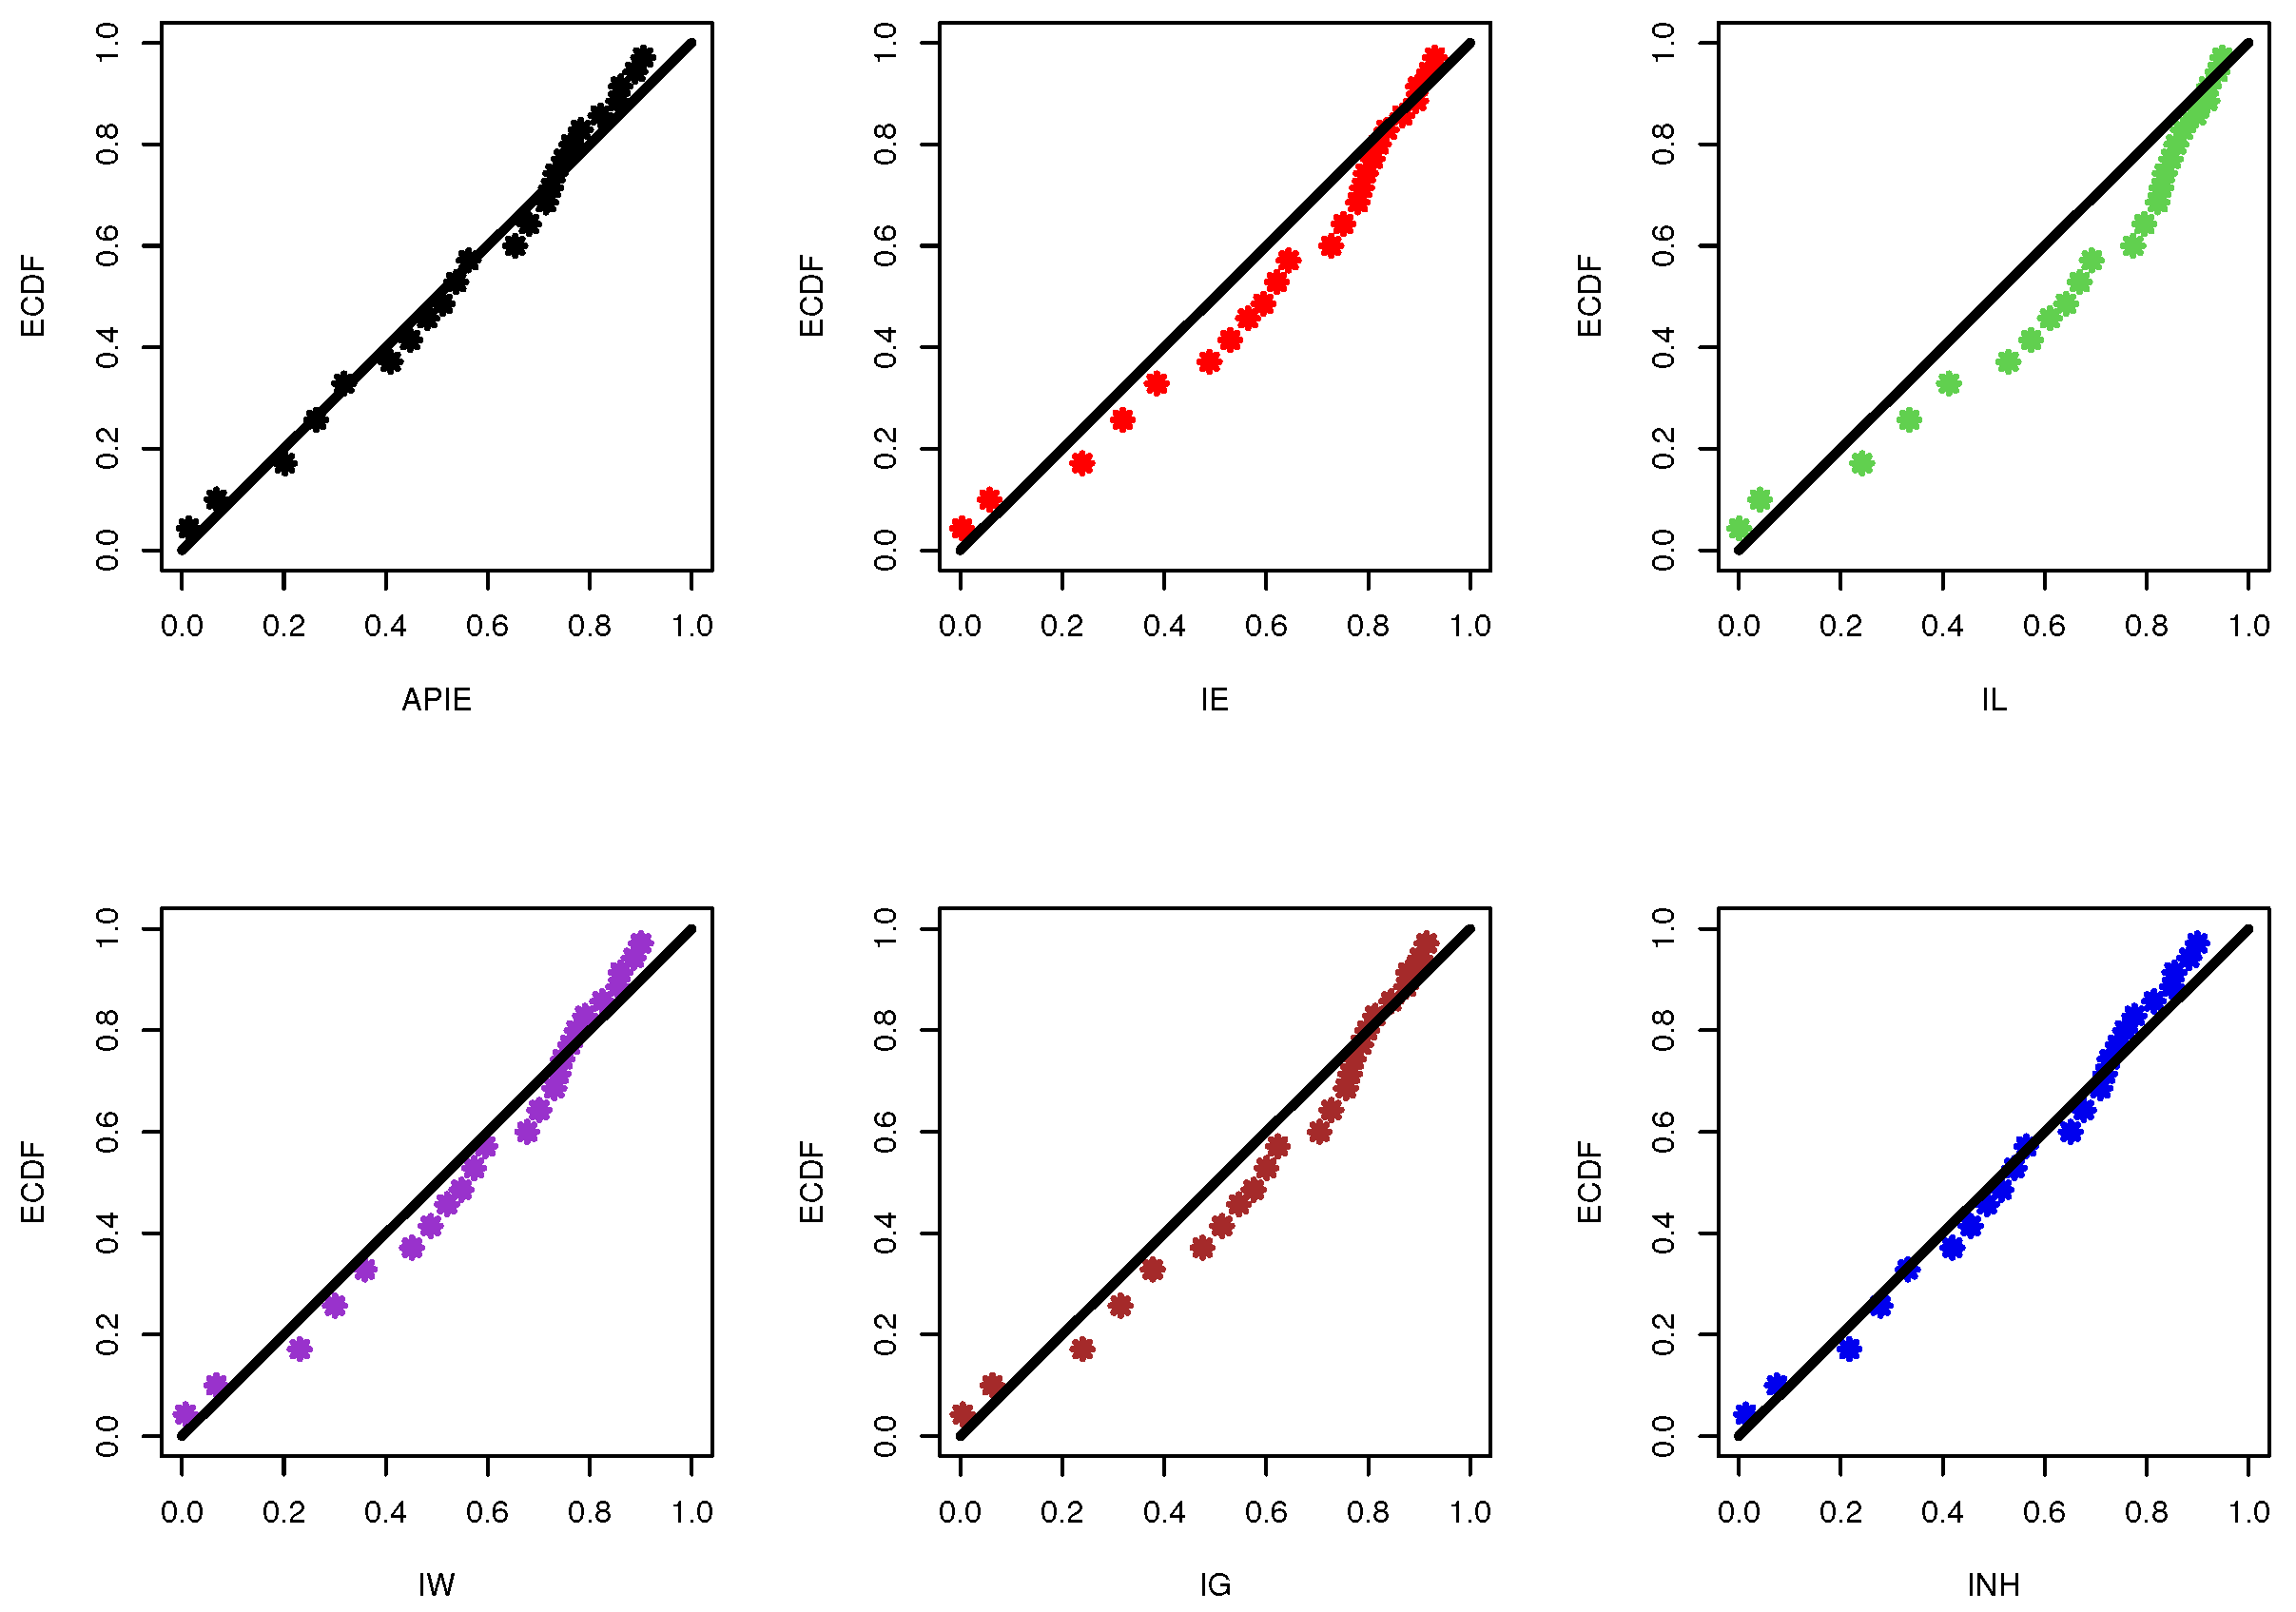
This work considers the problem of statistical inference of new alpha power-inverted exponential parameters of life using generalized Type-II progressively hybrid censored data. Classically, the maximum likelihood and asymptotic confidence interval estimates of the model parameters and any related time function have been derived using Newton–Raphson optimization process via the “” language. The joint posterior density has been derived in a nonlinear form because the formula of the likelihood function has a complex expression. Independent gamma priors, to derive the Bayes and HPD interval estimates, are considered. Metropolis–Hastings sampler via the “” language is also recommended to simulate the MCMC samples of the same unknown parameters. Extensive simulation experiments, based on various options of n, m, , and , have been conducted to judge the behavior of the offered estimates. These studies show that the MCMC methodology performs quite well compared to the maximum likelihood approach. An optimum progressive censoring has also been presented using several optimality criterion measurements. Two scenarios based on real-world data sets from the engineering and chemical sectors are examined to highlight the superiority of the proposed model and how the provided estimates can be performed in practice. These applications show that the derived estimators perform well in practical situations and that the proposed lifetime distribution is a good choice compared to several models in the literature, namely, the inverted exponential, inverted Lindley, inverted Weibull, inverted gamma, and inverted Nadarajah–Haghighi distributions. We also believe that the findings and methodology presented here will be useful to reliability technicians, statisticians, and/or other scientists.


