Fluid Inclusions and S–Pb Isotopes of the Reshui Porphyry Mo Deposit in East Kunlun, Qinghai Province, China


1
Geological Survey Institute, China University of Geosciences (Wuhan), Wuhan 430074, China
2
Key Laboratory for the Study of Focused Magmatism and Giant Ore Deposits, MNR, Xi’an Center of China Geological Survey, Northwest China Center for Geoscience Innovation, Xi’an 710054, China
3
Centre for Ore Deposit and Earth Sciences, University of Tasmania, Private Bag 79, Hobart, TAS 7001, Australia
4
Faculty of Earth Resources, China University of Geosciences (Wuhan), Wuhan 430074, China
*
Authors to whom correspondence should be addressed.
Minerals 2019, 9(9), 547; https://doi.org/10.3390/min9090547
Submission received: 14 July 2019
/
Revised: 4 September 2019
/
Accepted: 5 September 2019
/
Published: 11 September 2019
(This article belongs to the Section Mineral Deposits)
Abstract
:The Reshui porphyry Mo deposit is located in the East Kunlun orogenic belt (EKOB). Molybdenum mineralization is distributed in monzogranite and porphyritic monzogranite rocks, mainly presenting as various types of hydrothermal veinlets in altered wall rocks, and the orebodies are controlled by three groups of fractures. In this paper, we present the results of fluid-inclusion and isotopic (S and Pb) investigations of the Reshui Mo deposit. The ore-forming process of the deposit can be divided into three stages: an early disseminated molybdenite stage (stage 1), a middle quartz–molybdenite stage (stage 2) and a late quartz–polymetallic sulfide stage (stage 3). The alteration was mainly potassic and silicic in stage 1, silicic in stage 2, and sericitic and silicic in stage 3. Five types of fluid inclusions (FIs) can be distinguished in quartz phenocrysts and quartz veins, namely W, PL (pure liquid inclusions), PV (pure gas inclusions), C (CO2 three-phase inclusions), and S (daughter mineral-bearing inclusions). The homogenization temperatures of fluid inclusions belonging to stages 1 to 3 are 282.3–378 °C, 238.7–312.6 °C and 198.3–228 °C, respectively. The fluid salinities at stages 1 to 3 are 4.65–8.14% NaCl eq., 4.34–42.64% NaCl eq., and 3.55–4.65% NaCl eq., respectively. The fluids of this deposit were generally moderate–high temperature and moderate–low salinity and belong to the H2O–NaCl–CO2 ± CH4 system. The temperature and pressure changed considerably between stage 2 (high–medium-temperature) and stage 3 (low-temperature). The evidence for ore-forming fluids containing different types of coexisting inclusions in stage 2 and a decrease in the fluid temperature from stage 2 to stage 3 indicate that fluid boiling and fluid mixing were the main mechanisms of ore precipitation. The sulfide 34SV-CDT values range from 4.90‰ to 5.80‰, which is characteristic of magmatic sulfur. The 206Pb/204Pb, 207Pb/204Pb, and 208Pb/204Pb values of the ore minerals are 18.210–18.786, 15.589–15.723, and 38.298–39.126, respectively. These lead isotopic compositions suggest that the ores were mainly sourced from crustally derived magmas, with minor input from the mantle. The fluid inclusions and S–Pb isotopes provide important information on the genesis of the Reshui porphyry Mo deposit and indicate that the Triassic has high metallogenic porphyry potential in the EKOB.

1. Introduction
The East Kunlun Orogenic Belt (EKOB) is located along the northern margin of the Tibetan Plateau [1,2,3] and is one of the most important magmatic arcs and polymetallic metallogenic belts in China [4,5,6,7,8]. Many porphyry-skarn deposits have been discovered and explored in this area (e.g., the Kaerqueka Cu–Mo porphyry deposit, Hutouya Cu–Pb–Zn skarn deposit, and Galinge Fe skarn deposit [9,10,11,12,13]). Many publications have focused primarily on the geochemistry of the granite [14,15,16,17,18] and on the description of the geological characteristics of typical deposits and their host rocks [19,20,21]. The mineralization age has also been investigated, yielding Re–Os dates of 226.5 ± 5.1 Ma [9] for the Shuangqing Fe deposit and 236.2 ± 2.1 Ma [22] for the Shenduolong Pb–Zn polymetallic deposit. However, few papers have been published regarding the mineral paragenesis and fluid inclusion and isotopic data of porphyry and skarn deposits in the East Kunlun area, and therefore, the fluid characteristics and metal-deposition mechanisms are poorly understood.
The Reshui porphyry Mo deposit is located in Dulan City, Qinghai Province, in the eastern segment of the EKOB. The mineralization of the Reshui deposit has been characterized by several geological studies in terms of ore geology, geochronology [23], petrology, and geochemistry [24,25]. However, an integrated geochemical study of the fluid evolution and the source of the Reshui Mo deposit has not so far been conducted, and the origin of the ore-forming fluids and metals is not yet clear. In this contribution, we report results obtained through ore geology research and fluid inclusion and S–Pb isotopic studies on the Reshui Mo deposit. We discuss the characteristics and evolution of the ore-forming fluids, as well as the Mo ore-forming mechanisms and genesis. This study can provide better insight into the ore-forming processes and guide further exploration for porphyry Mo deposits in the EKOB.
2. Regional Geology
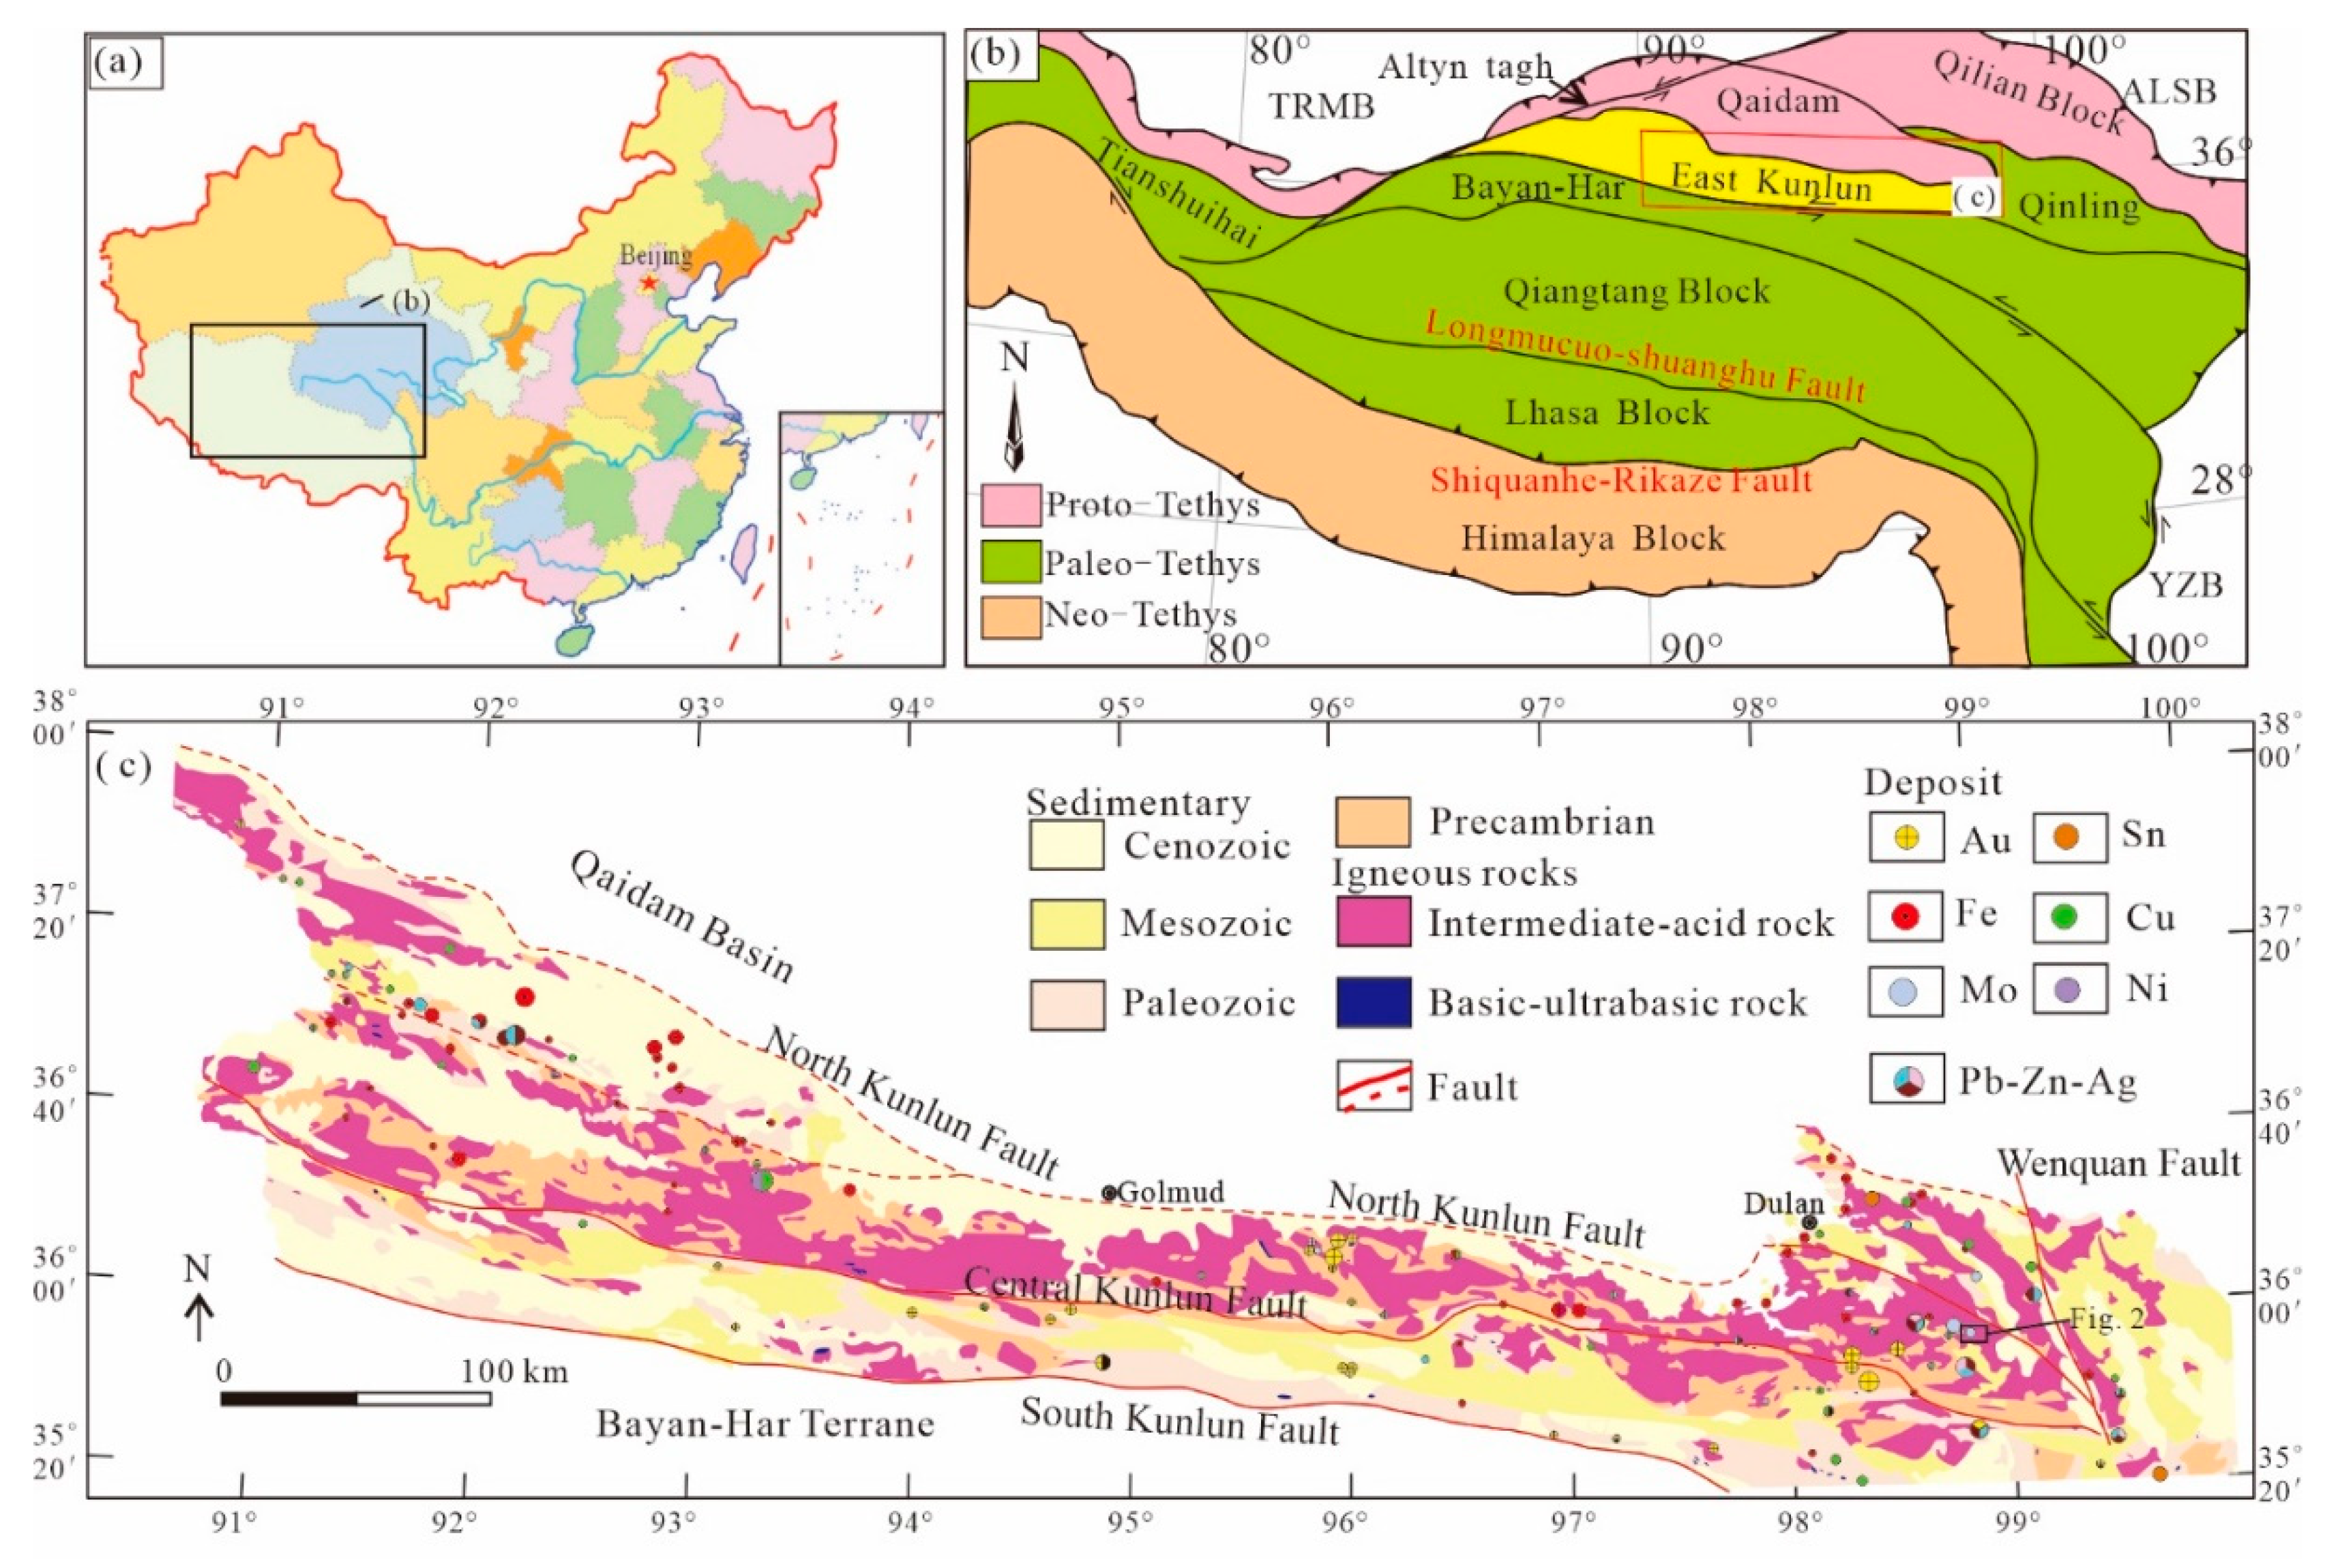
The EKOB is bounded by the NE-trending Altyn Tagh Fault to the west, the West Qinling Orogen to the east, the Qaidam Basin to the north, and the Bayankala terrane to the south (Figure 1a,b). Tectonically, the EKOB can be divided into the North, Middle, and South Kunlun belts, separated by the North Kunlun Fault, the Central Kunlun Fault, and the South Kunlun Fault [6,16,18] (Figure 1c). The development of the EKOB has been mainly controlled by the subduction, collision, and post-collisional evolution of the Proto-Tethys and Paleo-Tethys [6,16,17,19,26]. Voluminous granitoids are widespread in the Middle and North Kunlun belts, and there is a subduction-accretionary mélange in the South Kunlun belt [27]. Lithologies in the EKOB mainly comprise the Paleoproterozoic basement of the Jinshuikou Group and Mesoproterozoic strata of the Xiaomiao Group [28]. The Ordovician to Silurian is clastic sedimentary cover of the Tanjianshan Formation, Late Devonian to Middle Triassic strata are composed of neritic facies clastics, limestones, and sandstones [27], and the Upper Triassic E’lashan Formation consists of pyroclastic intermediate–felsic volcanic rocks [15,29]. The intermediate–acid rocks include granodiorite, monzogranite, granite porphyry, and quartz diorite [6,30,31], and the basic–ultrabasic rocks are gabbro, olivine websterite, and lherzolite. The Ni–Cu mineralization is related to ultramafic rocks [7,8,32,33], and the porphyry, porphyry–skarn, and skarn-type deposits are mostly related to the Triassic granites [17,18,19].
3. Ore Deposit Geology
The Reshui deposit is distributed in the middle East Kunlun belt (Figure 1c). The lithologies of the Reshui area consist of the Paleoproterozoic Jinshuikou Group, the Carboniferous Dagangou Group, the Middle Permian Marzheng Group, and the Triassic volcanic rocks [23].
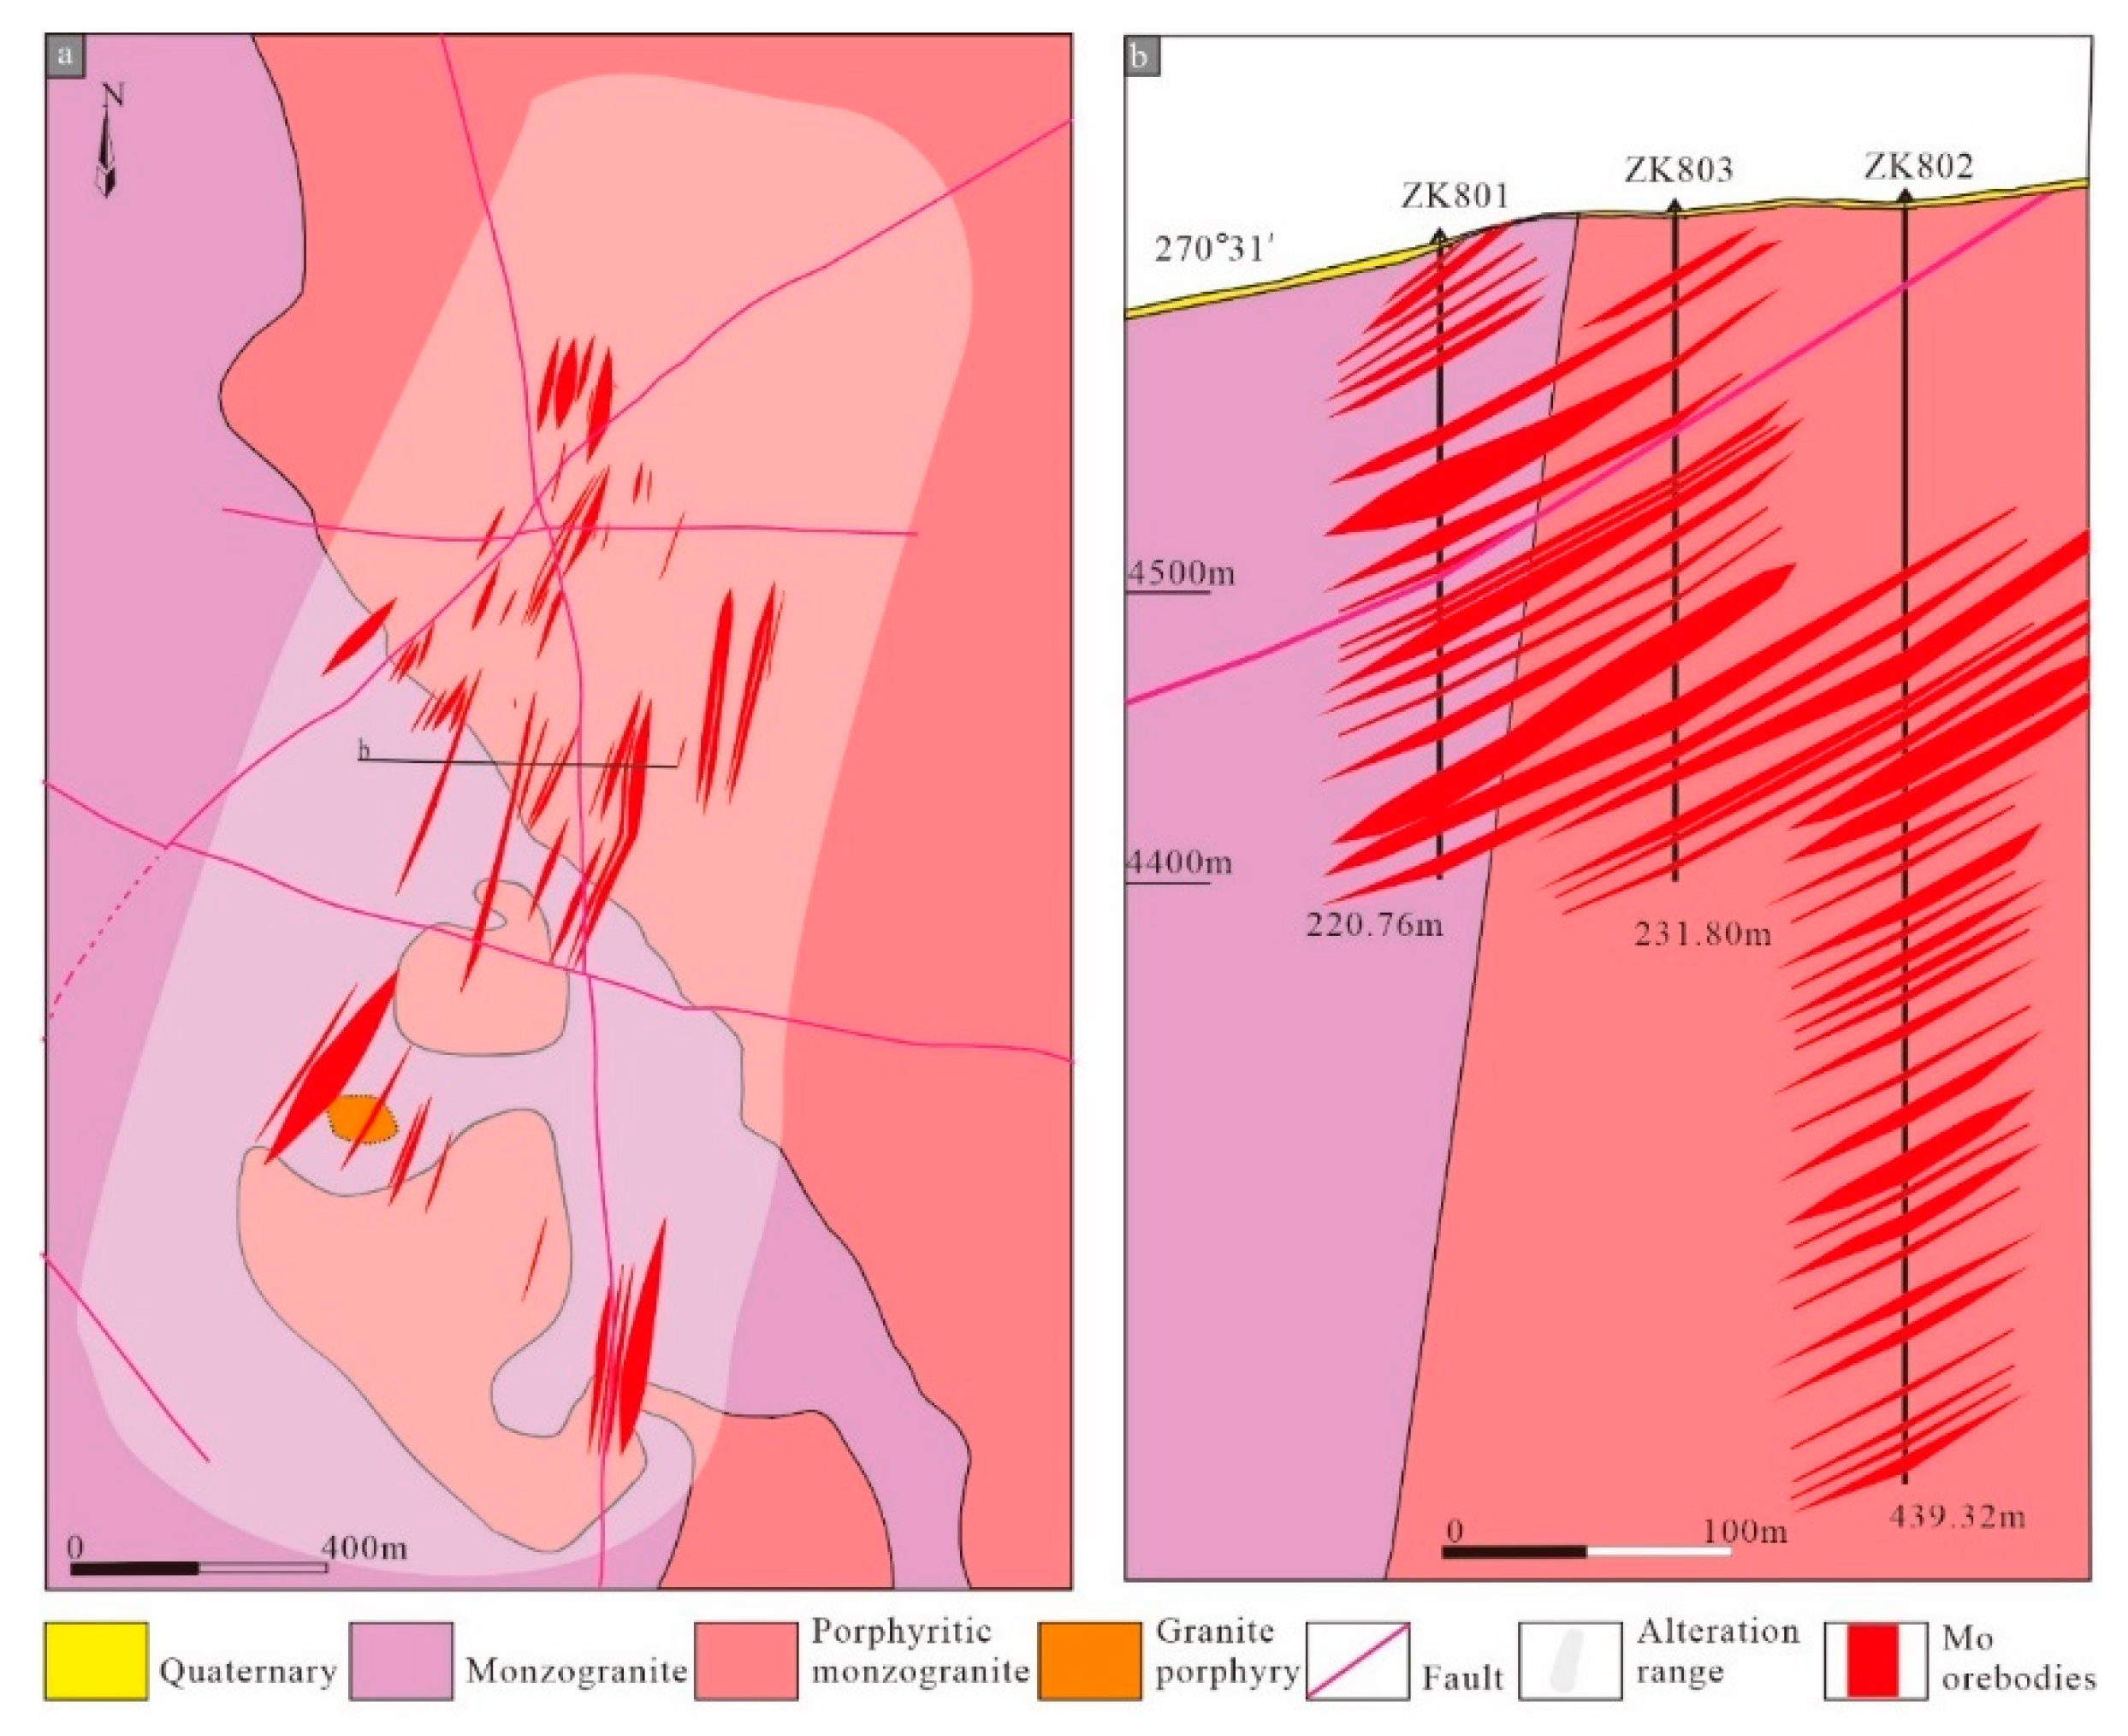
The Reshui ore field comprises mainly intrusive rocks. The fracture structure of the Mo deposit zone is well-developed and comprises three main groups of fractures (Figure 2). A group of N–S-trending faults, which formed earliest, are the main ore-controlling fault structures; another group of NE-trending fractures experienced multiple phases of activity, and the final fracture group, which is NW- or nearly EW-trending, was active relatively late and cross-cuts the orebodies [23]. The magmatic rocks in this region can be divided into monzogranite, granodiorite, porphyritic monzogranite, and granitic porphyry [24,25].
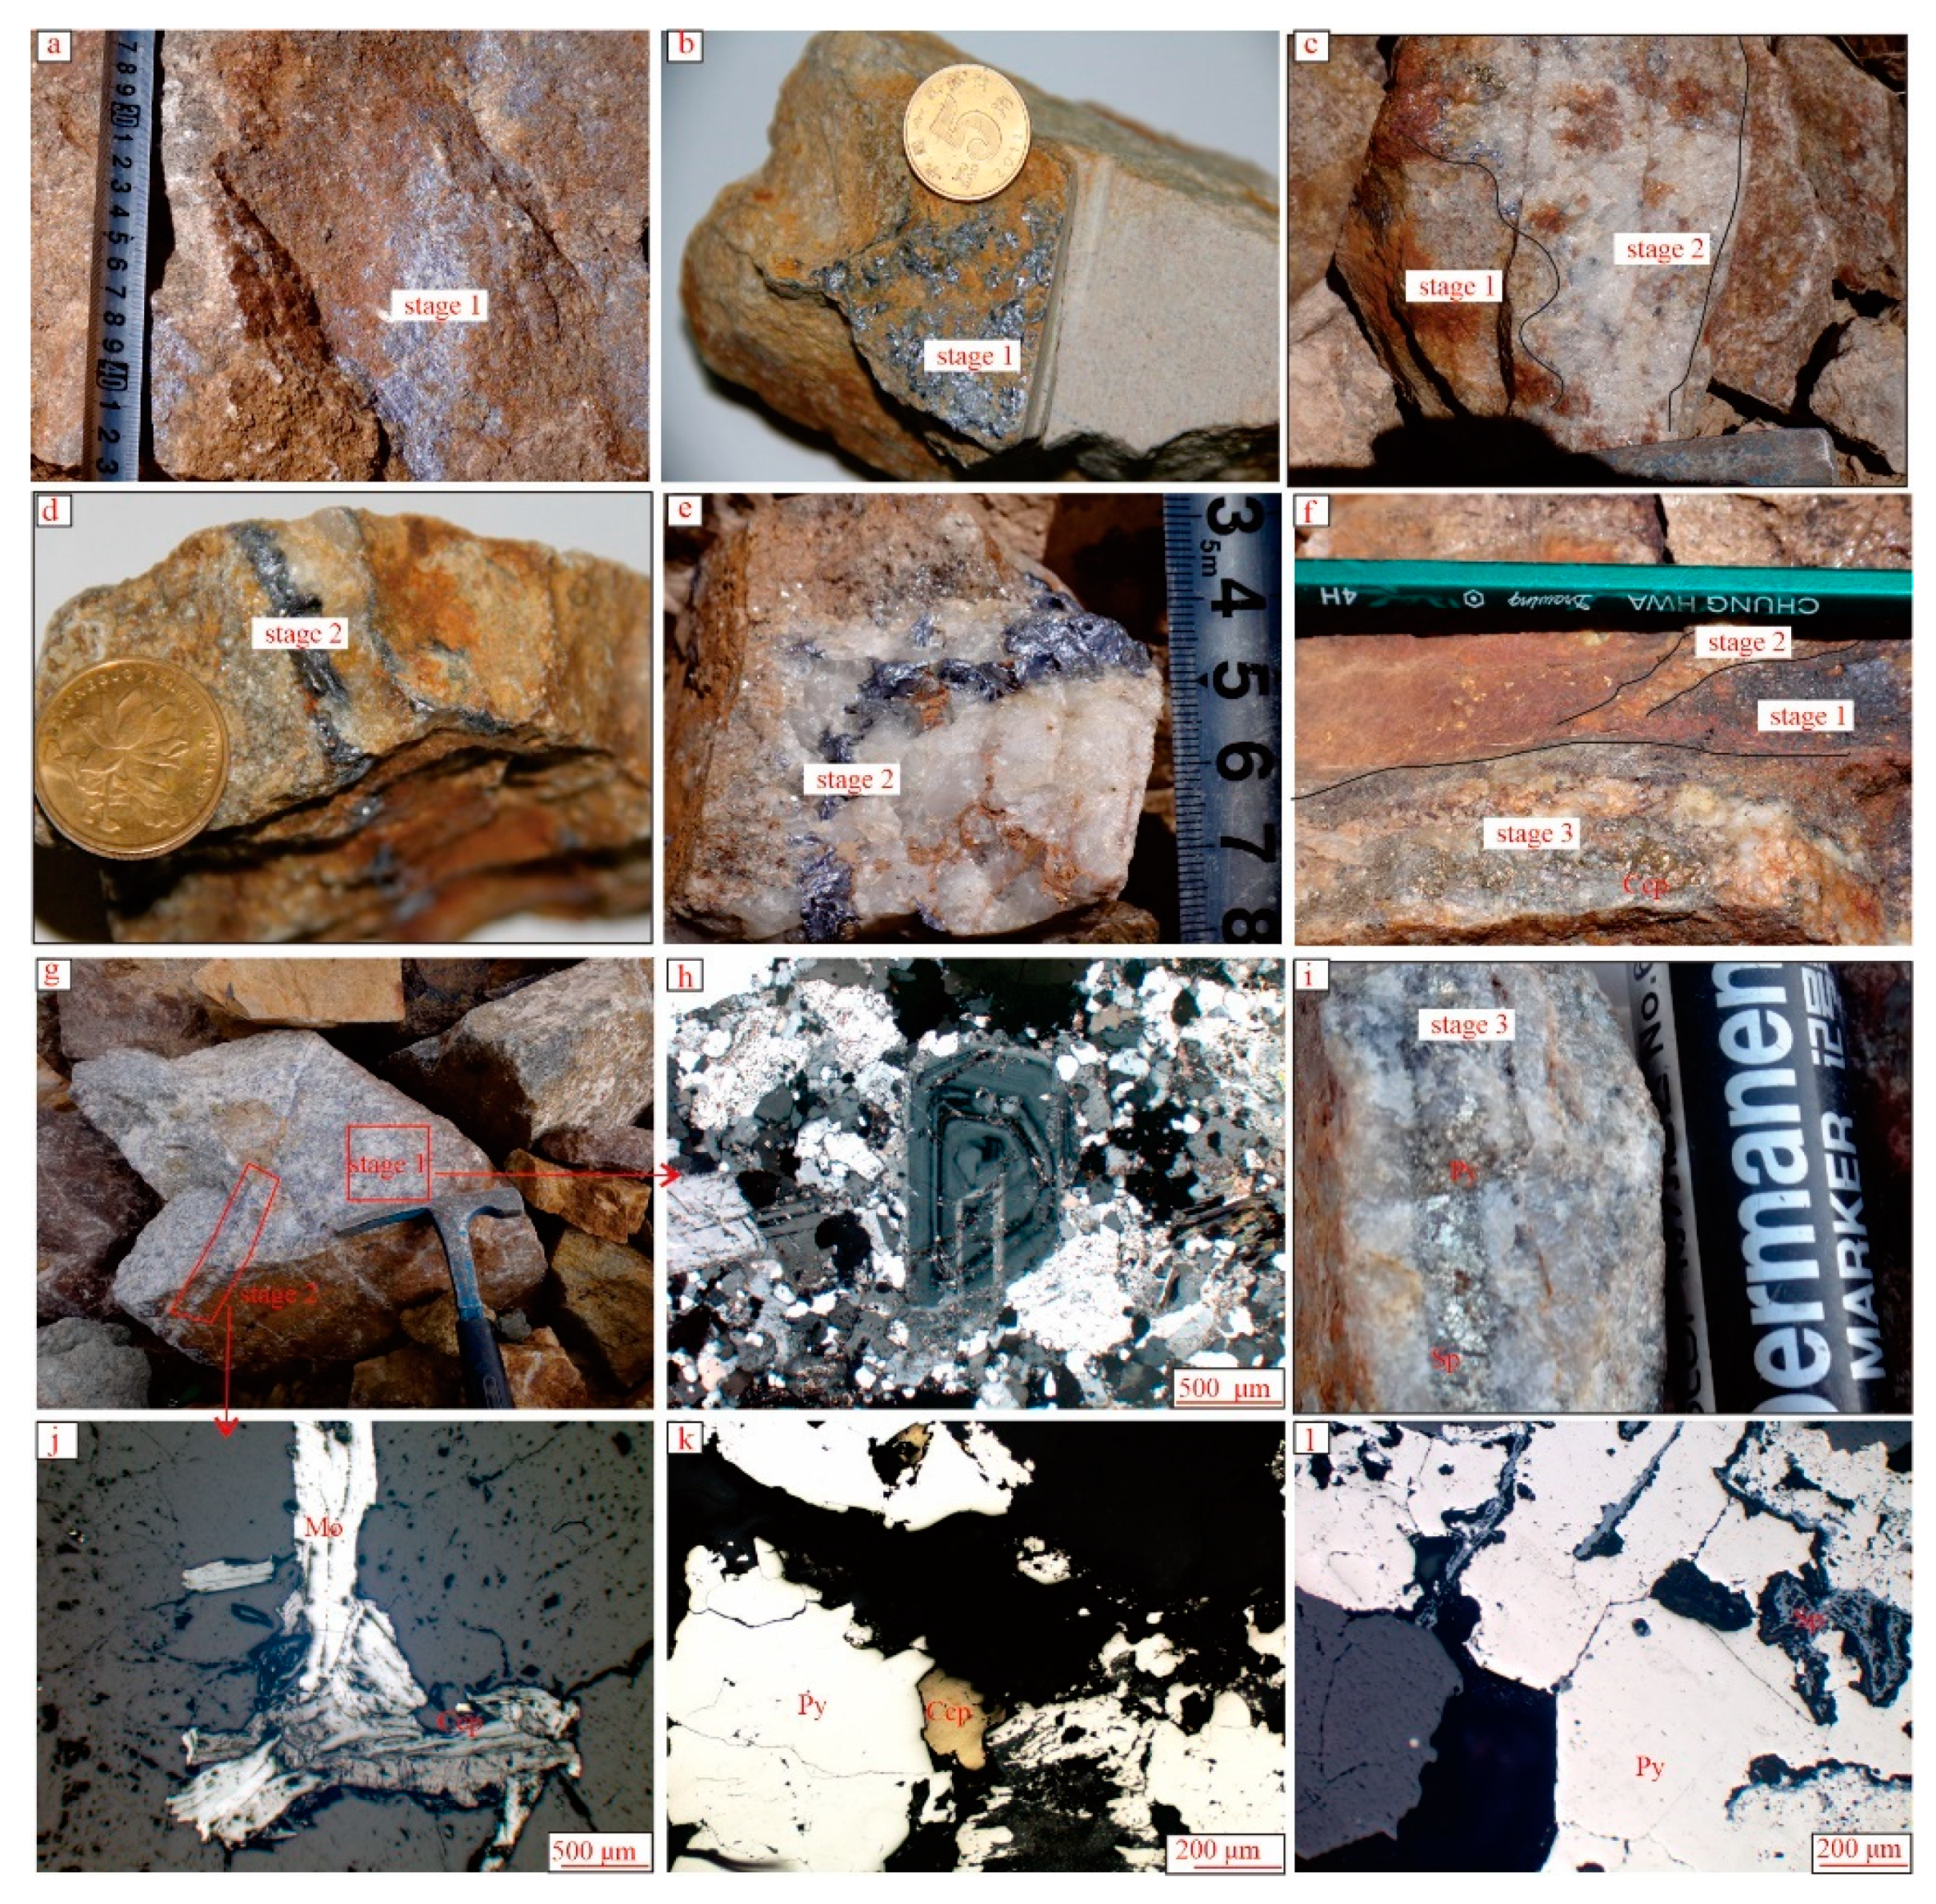
The Reshui Mo deposit was only recently discovered. According to the exploration engineering results of the Baojintianyuan Mining Company, the molybdenum orebodies are complexly disseminated in ribbon shapes, veins, thin veins, and lenticular orebodies (Figure 2). The sizes of these orebodies differ; they range in length from 100 to 600 m. The molybdenum deposit has an average grade of 0.10% and is verified to contain 8419.08 tons of molybdenum metal [34]. Hydrothermal alteration associated with Mo mineralization is dominated by inner-zone potassic alteration, sericitization, and silicic alteration, and there is clear alteration-zonation from the inner to the outer sections of the mineralization bodies. The main ore hosting rocks are porphyritic monzogranite, monzogranite, and granitic porphyry, and the main metallic ore minerals are molybdenite, pyrite, and hematite, with minor chalcopyrite, magnetite, pyrrhotite, galena, and sphalerite. The molybdenite generally has a flaky texture and is unevenly distributed in the ore bodies (Figure 3a–e). Most of the molybdenite has a granular texture in which many grains are clustered together, while some occur in quartz, feldspar, and biotite. The ore type is mainly disseminated, with molybdenite scattered in granites, or in veins, with molybdenite forming in vein structures within fissures and quartz veins. In addition, the ore also exhibits thin film structures, star point-like structures, porphyritic mass structures, banded structures, and complex shapes with extremely clear interfaces.
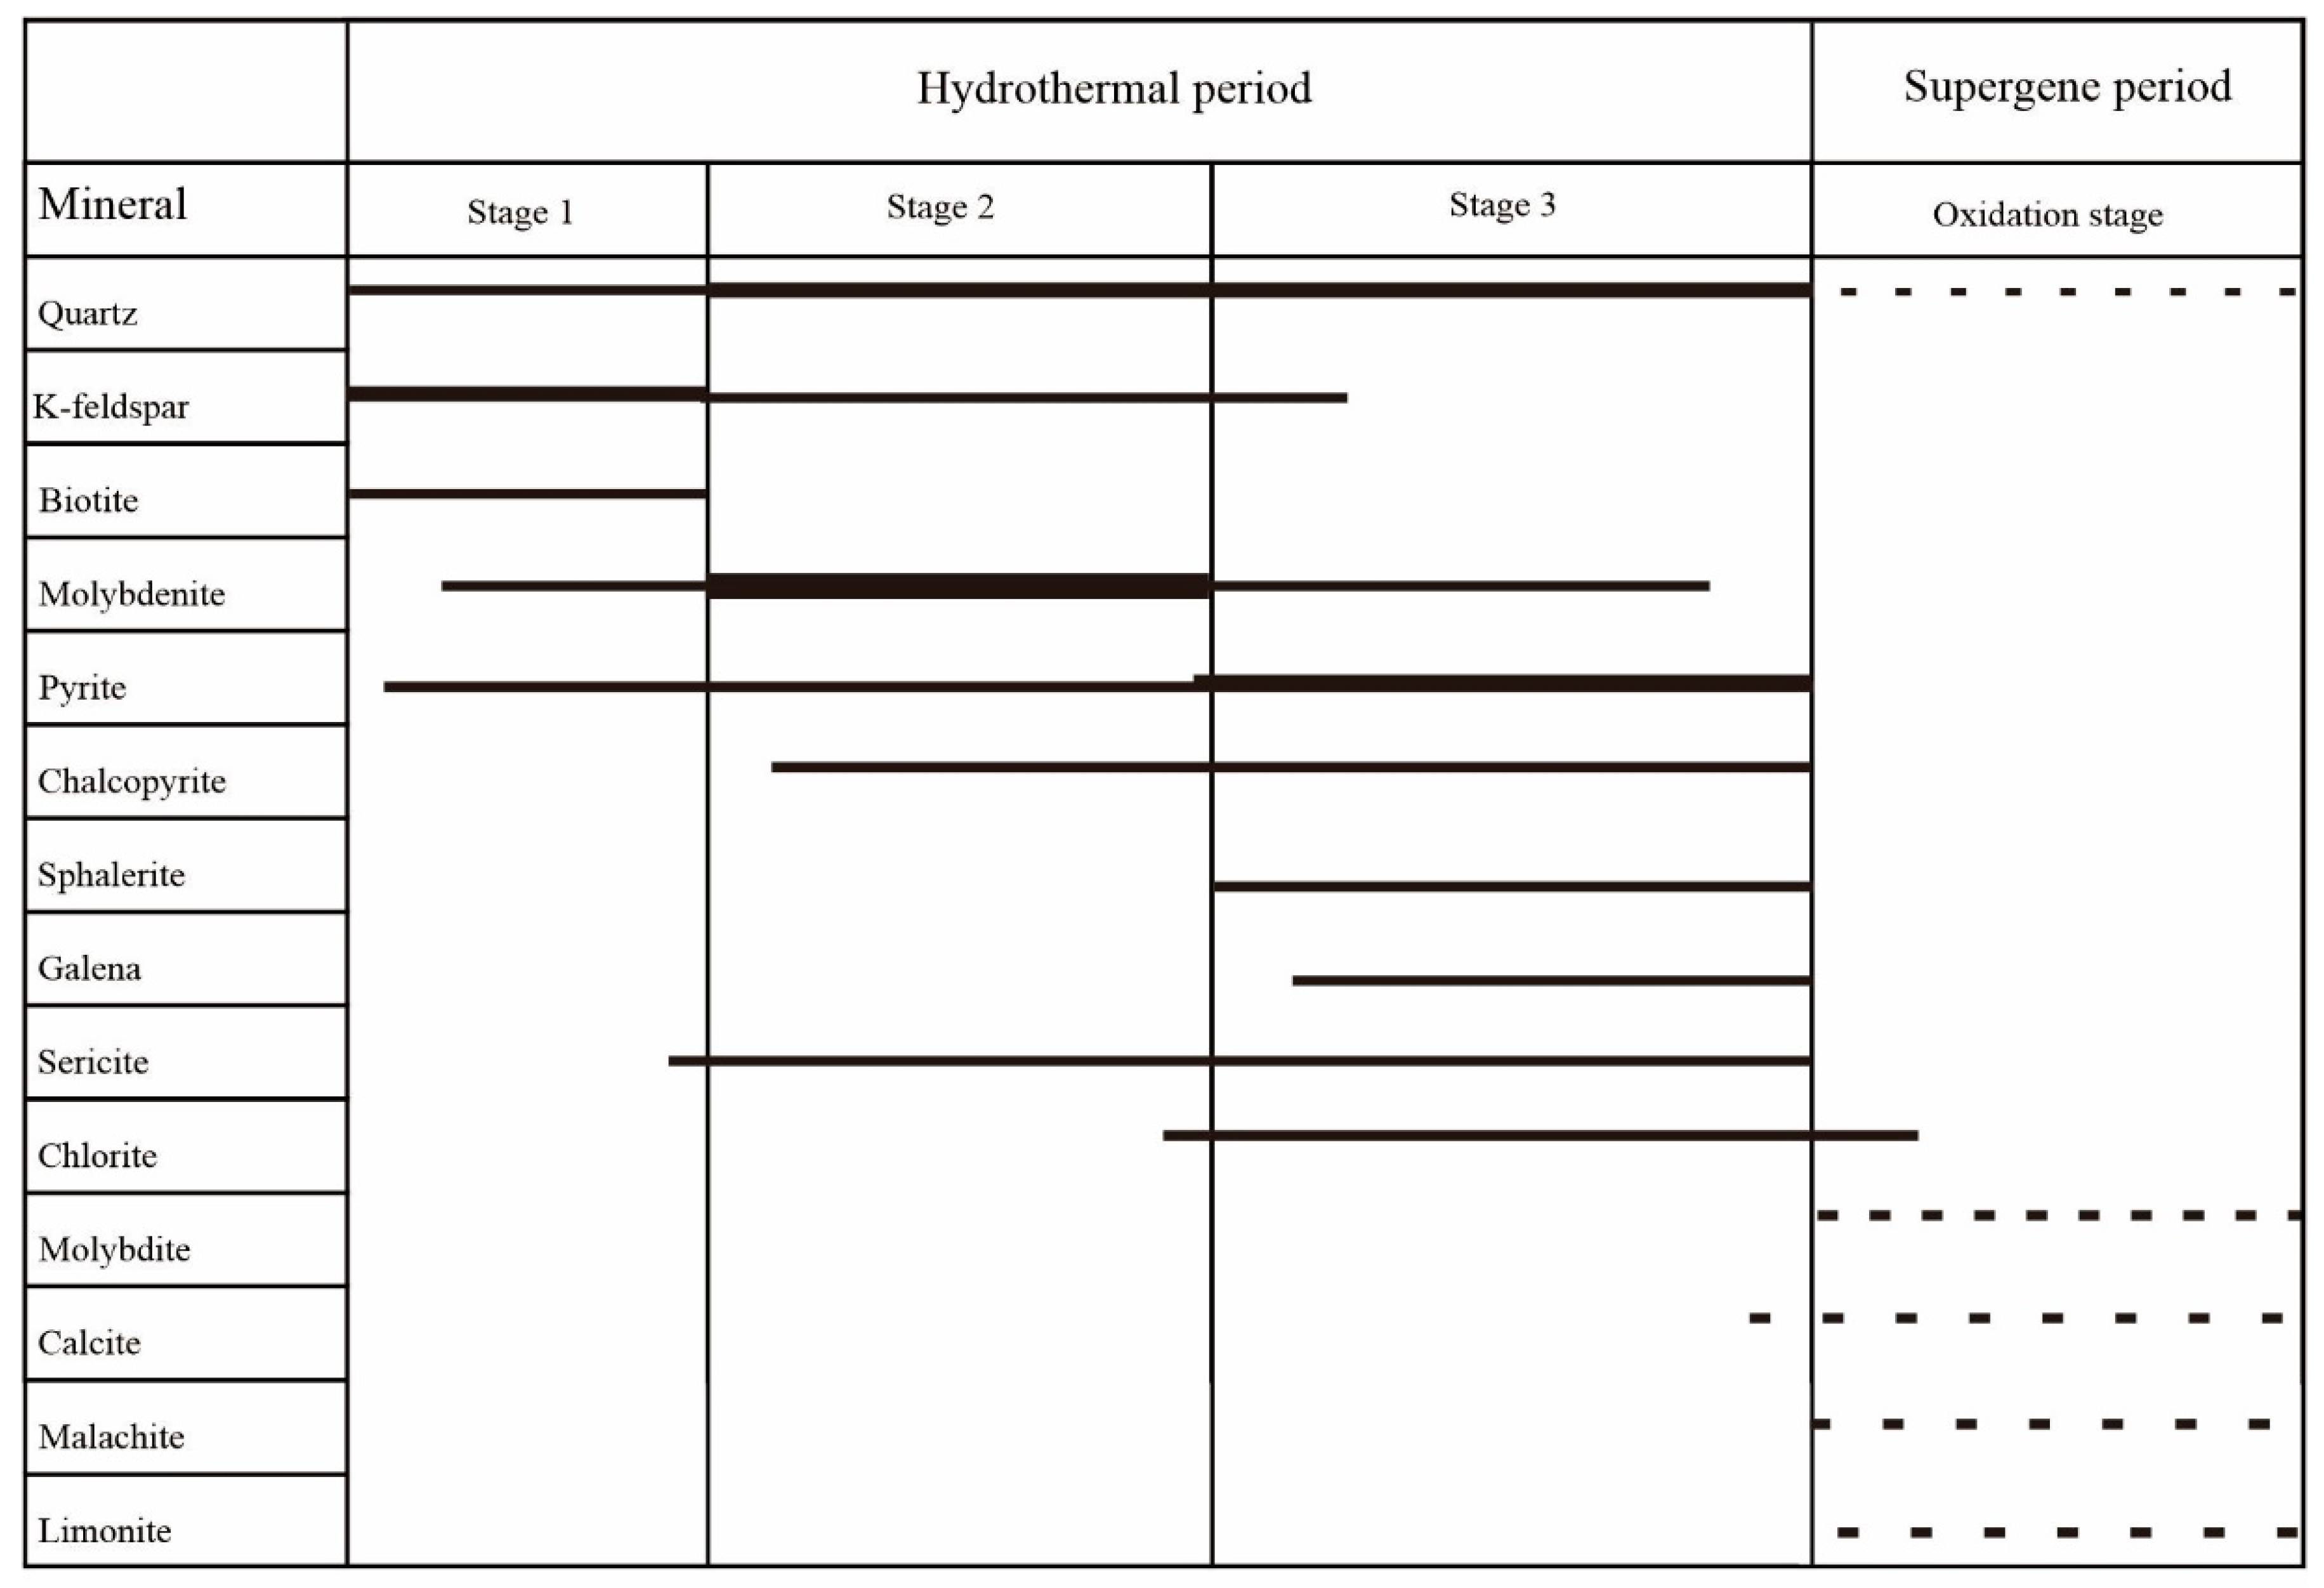
The development of the deposit can be divided into the hydrothermal ore-forming period and a surficial oxidation period, on the basis of the paragenetic mineral associations and vein-body relationships (Figure 4). The hydrothermal period was the main metallogenic epoch and can be subdivided into three stages: (1) the early metallogenic stage (stage 1), in which molybdenite was sparsely disseminated and the main minerals were quartz, feldspar, biotite, and minor molybdenite (Figure 3a,b,h); (2) the quartz-vein–molybdenite stage (stage 2), when clay minerals were formed and the ore minerals were mainly molybdenite with minor chalcopyrite and pyrite (Figure 3c–e,j), whereas the gangue minerals were mainly quartz, K-feldspar, and biotite; (3) the quartz-vein–polymetallic sulfide stage (stage 3), in which molybdenite, pyrite, chalcopyrite, and polymetallic sulfide ore were deposited and various types of alteration occurred (Figure 3f,i,k,l). The supergene period would typically come after the main metallogenic period; all of the types of metal sulfides were oxidized, and the main supergene alteration (weathering) minerals were limonite, malachite and minor jarosite. During this period, the molybdenum orebody experienced a certain degree of modification.
4. Analytical Methods
4.1. Fluid Inclusion Measurements
Fluid inclusion (FI) analyses were performed on samples representing the three stages and various types of quartz that are representative of the spatial and temporal evolution of the magmatic-hydrothermal system of the Reshui deposit. Microthermometric analysis of FIs was performed using a Leitz microscope (Diaplan, Leitz, Wetzlar, Germany) and a Linkam THMS 600 (Linkam Scientific Instruments Ltd, Epsom, UK)), and underwent a programmable heating and freezing stage at the State Key Laboratory of Geological Processes and Mineral Resources, China University of Geosciences (Wuhan). The phase transitions of the FIs were observed at temperatures ranging from −196 °C to +600 °C. The heating and freezing rate was generally set at 5–10 °C/min, but was reduced to less than 0.5–1 °C/min near the temperatures of phase transitions. The salinities of the samples were calculated using the final ice melting temperatures of the aqueous two-phase FIs and the halite dissolution temperatures of daughter mineral-bearing multiphase FIs [35]. The bulk densities of the aqueous two-phase FIs and the daughter mineral-bearing multiphase FIs were estimated using reference formulas [35,36,37].
4.2. Isotopic Analysis
Two molybdenite samples from stage 2 and two molybdenite samples, three pyrites and three chalcopyrites from stage 3 were analyzed for their sulfur and lead isotopic compositions. Owing to the symbiotic co-occurrence of smaller grains of sphalerite and galena with molybdenite in stage 3, it was not possible to extract pure single minerals, and therefore, sphalerite and galena were not analyzed. Sulfur isotopic ratios are reported as δ34S values relative to those of the Canyon Diablo troilite (CDT); the analytical reproducibility was ±0.2‰. The analytical errors for lead isotopic analyses are reported as ±2 σ, and the measurement accuracy of the 208Pb/206Pb and 204Pb/206Pb analyses was better than 0.005‰. Sulfur and lead isotopic analyses were performed at the Analytical Laboratory of the Beijing Research Institute of Uranium Geology.
5. Results
5.1. Fluid Inclusion Analysis
5.1.1. Petrography
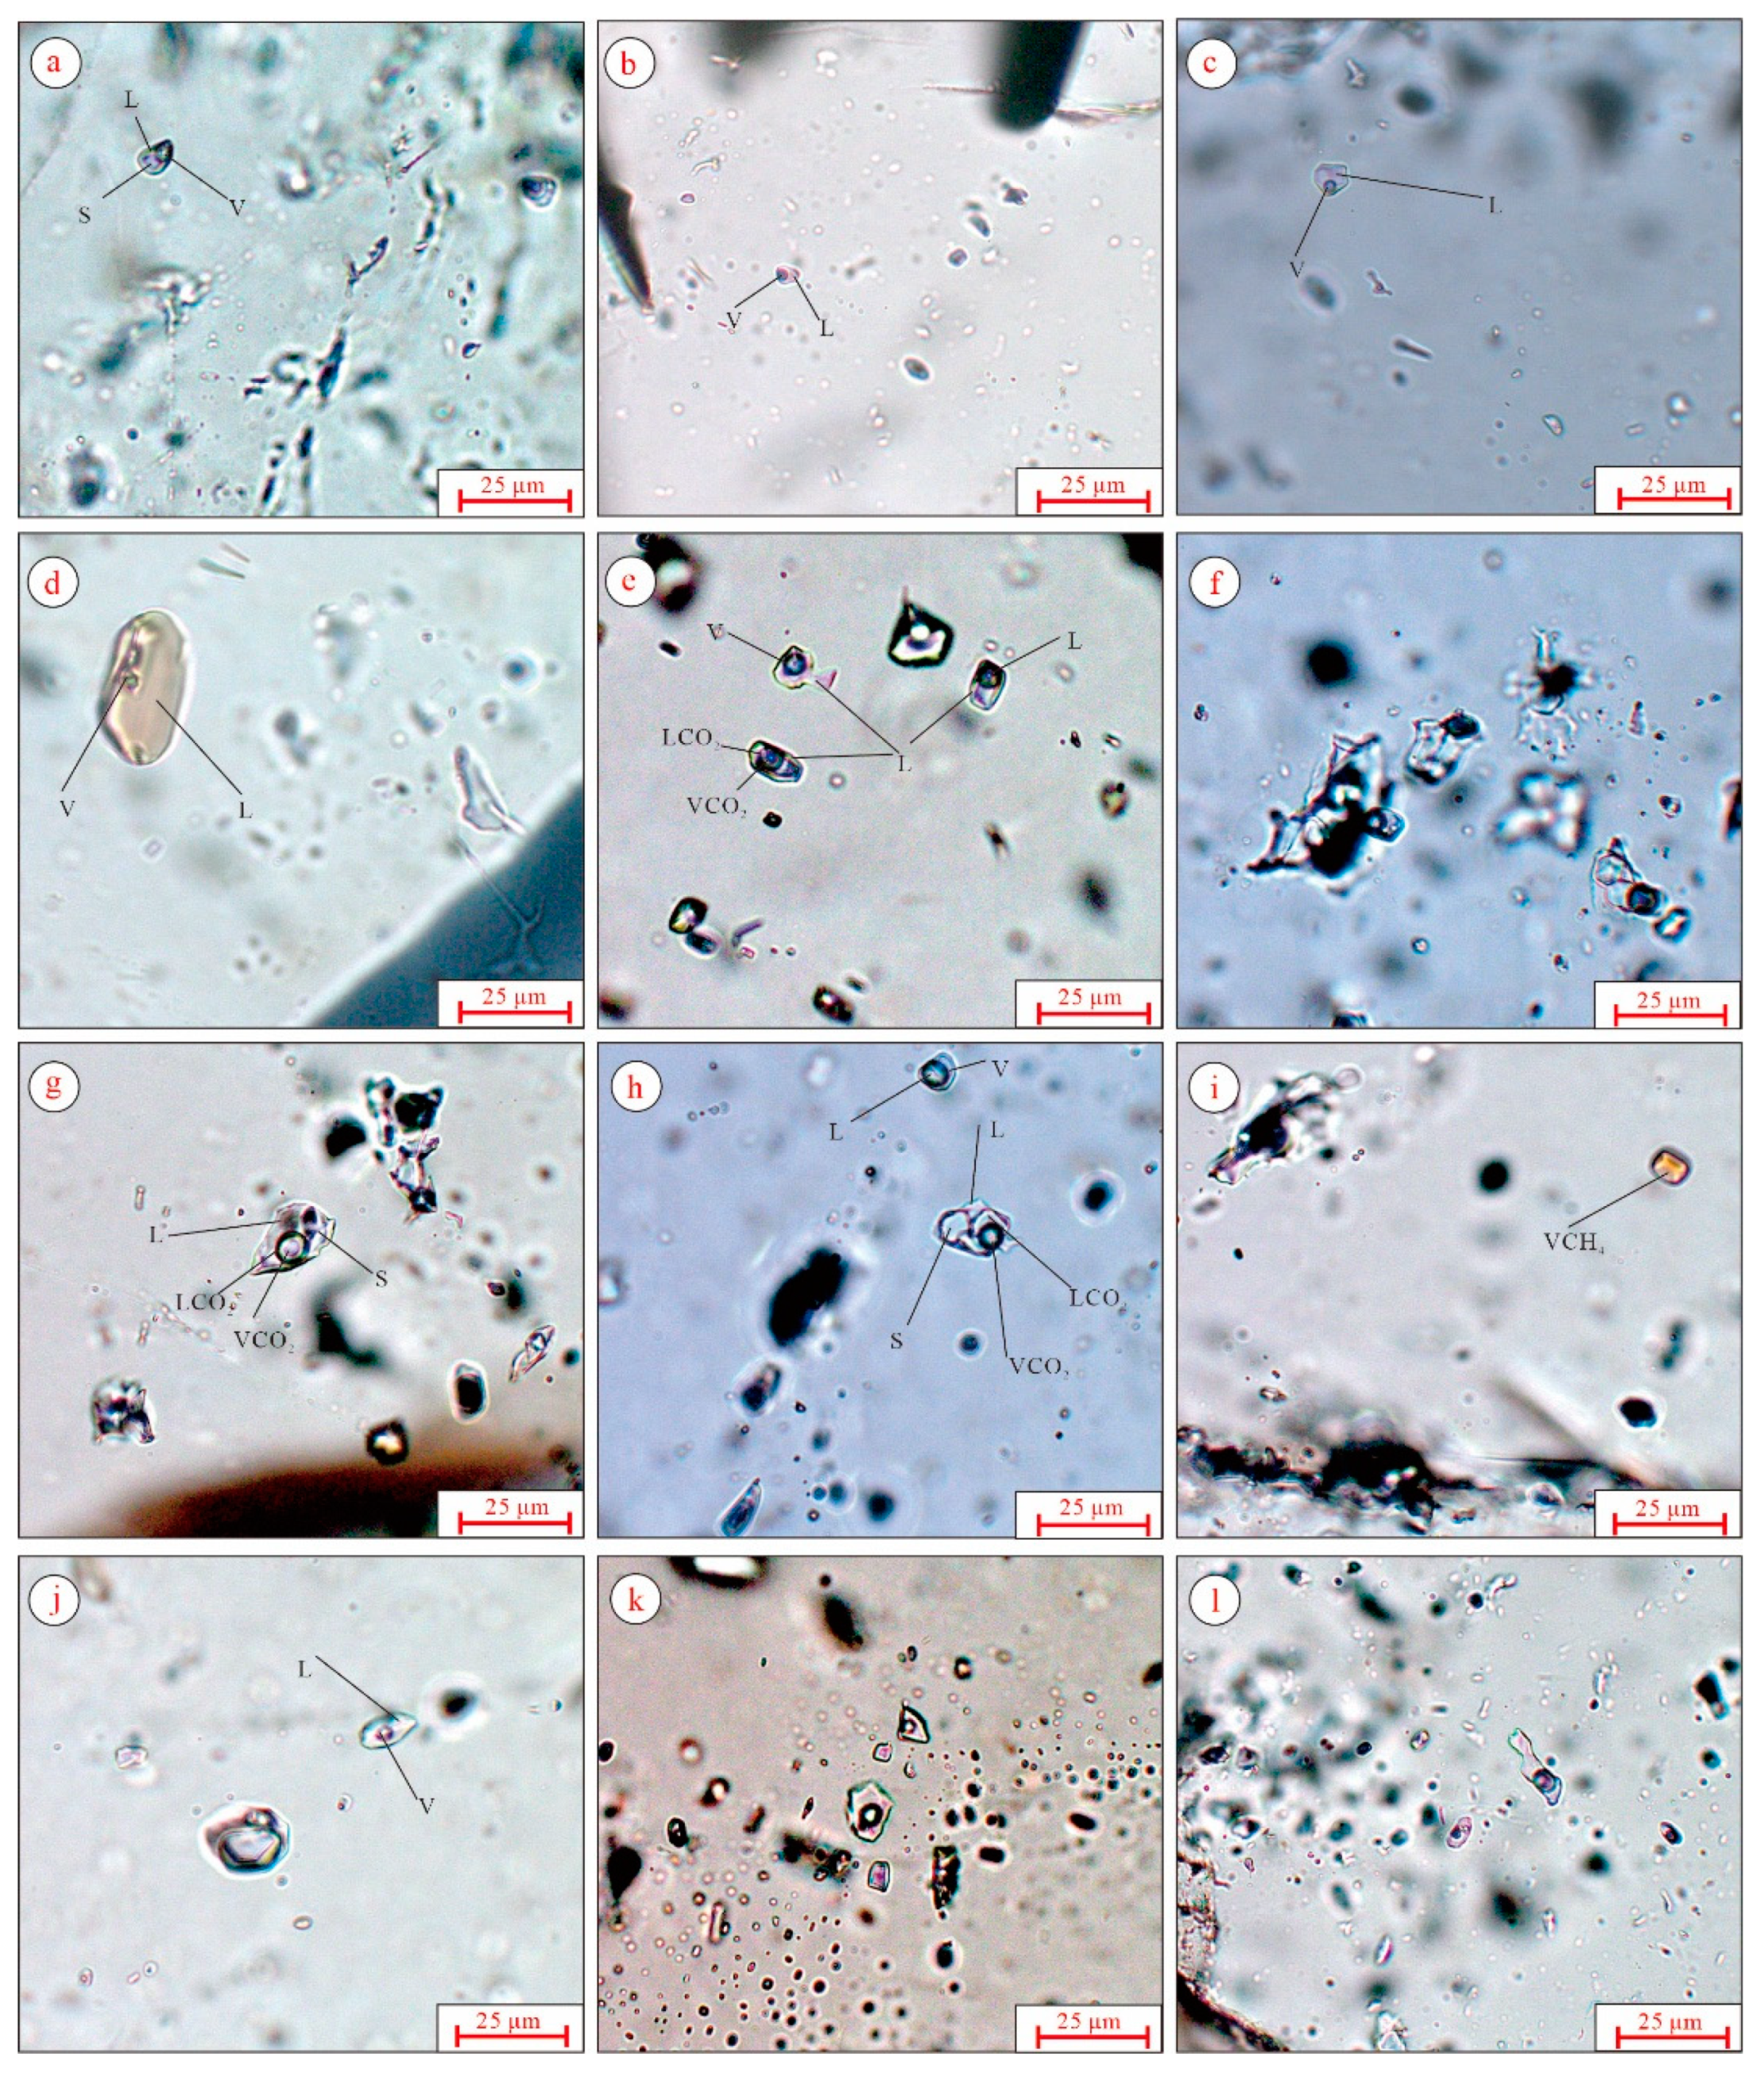
Based on their phase characteristics at room temperature (21 °C) and phase transitions during heating, as well as the results of laser Raman spectroscopy, the FIs in the Reshui deposit were divided into the following five main types (Figure 5): (1) W-type aqueous inclusions, including liquid-rich and gas-rich inclusions. Liquid-rich inclusions are more abundant than gas-rich inclusions; the gas- to liquid-phase ratios range 15–60% (but mainly fall between 25% and 45%). The sizes of these FIs are inconsistent and highly variable, as they range in length and width from 4 × 6 µm to 8 × 12 µm, but are mainly 6 × 10 µm in size. They are oval, round, rectangular or irregular in shape. (2) Pure gas-phase inclusions (PV) ranging in size from 3 to 8 µm occur in isolation and are rectangular and oval in shape. (3) Liquid-phase inclusions (PL) are brightly colored and sometimes grey; they are distributed in isolation or in symbiosis with W-type gas–liquid inclusions. (4) C-type inclusions contain the phases LCO2 + VCO2 + LH2O; they mainly exhibit crystalline shapes and are oval and rectangular. They range in length from 5 to 15 µm and exhibit double-fold eyelid characteristics. (5) S-type inclusions comprise one or more solid phases or minerals. The inclusions are oval, polygonal, and irregular, approximately 5–12 μm in size, and are mainly isolated.
5.1.2. Microthermometry
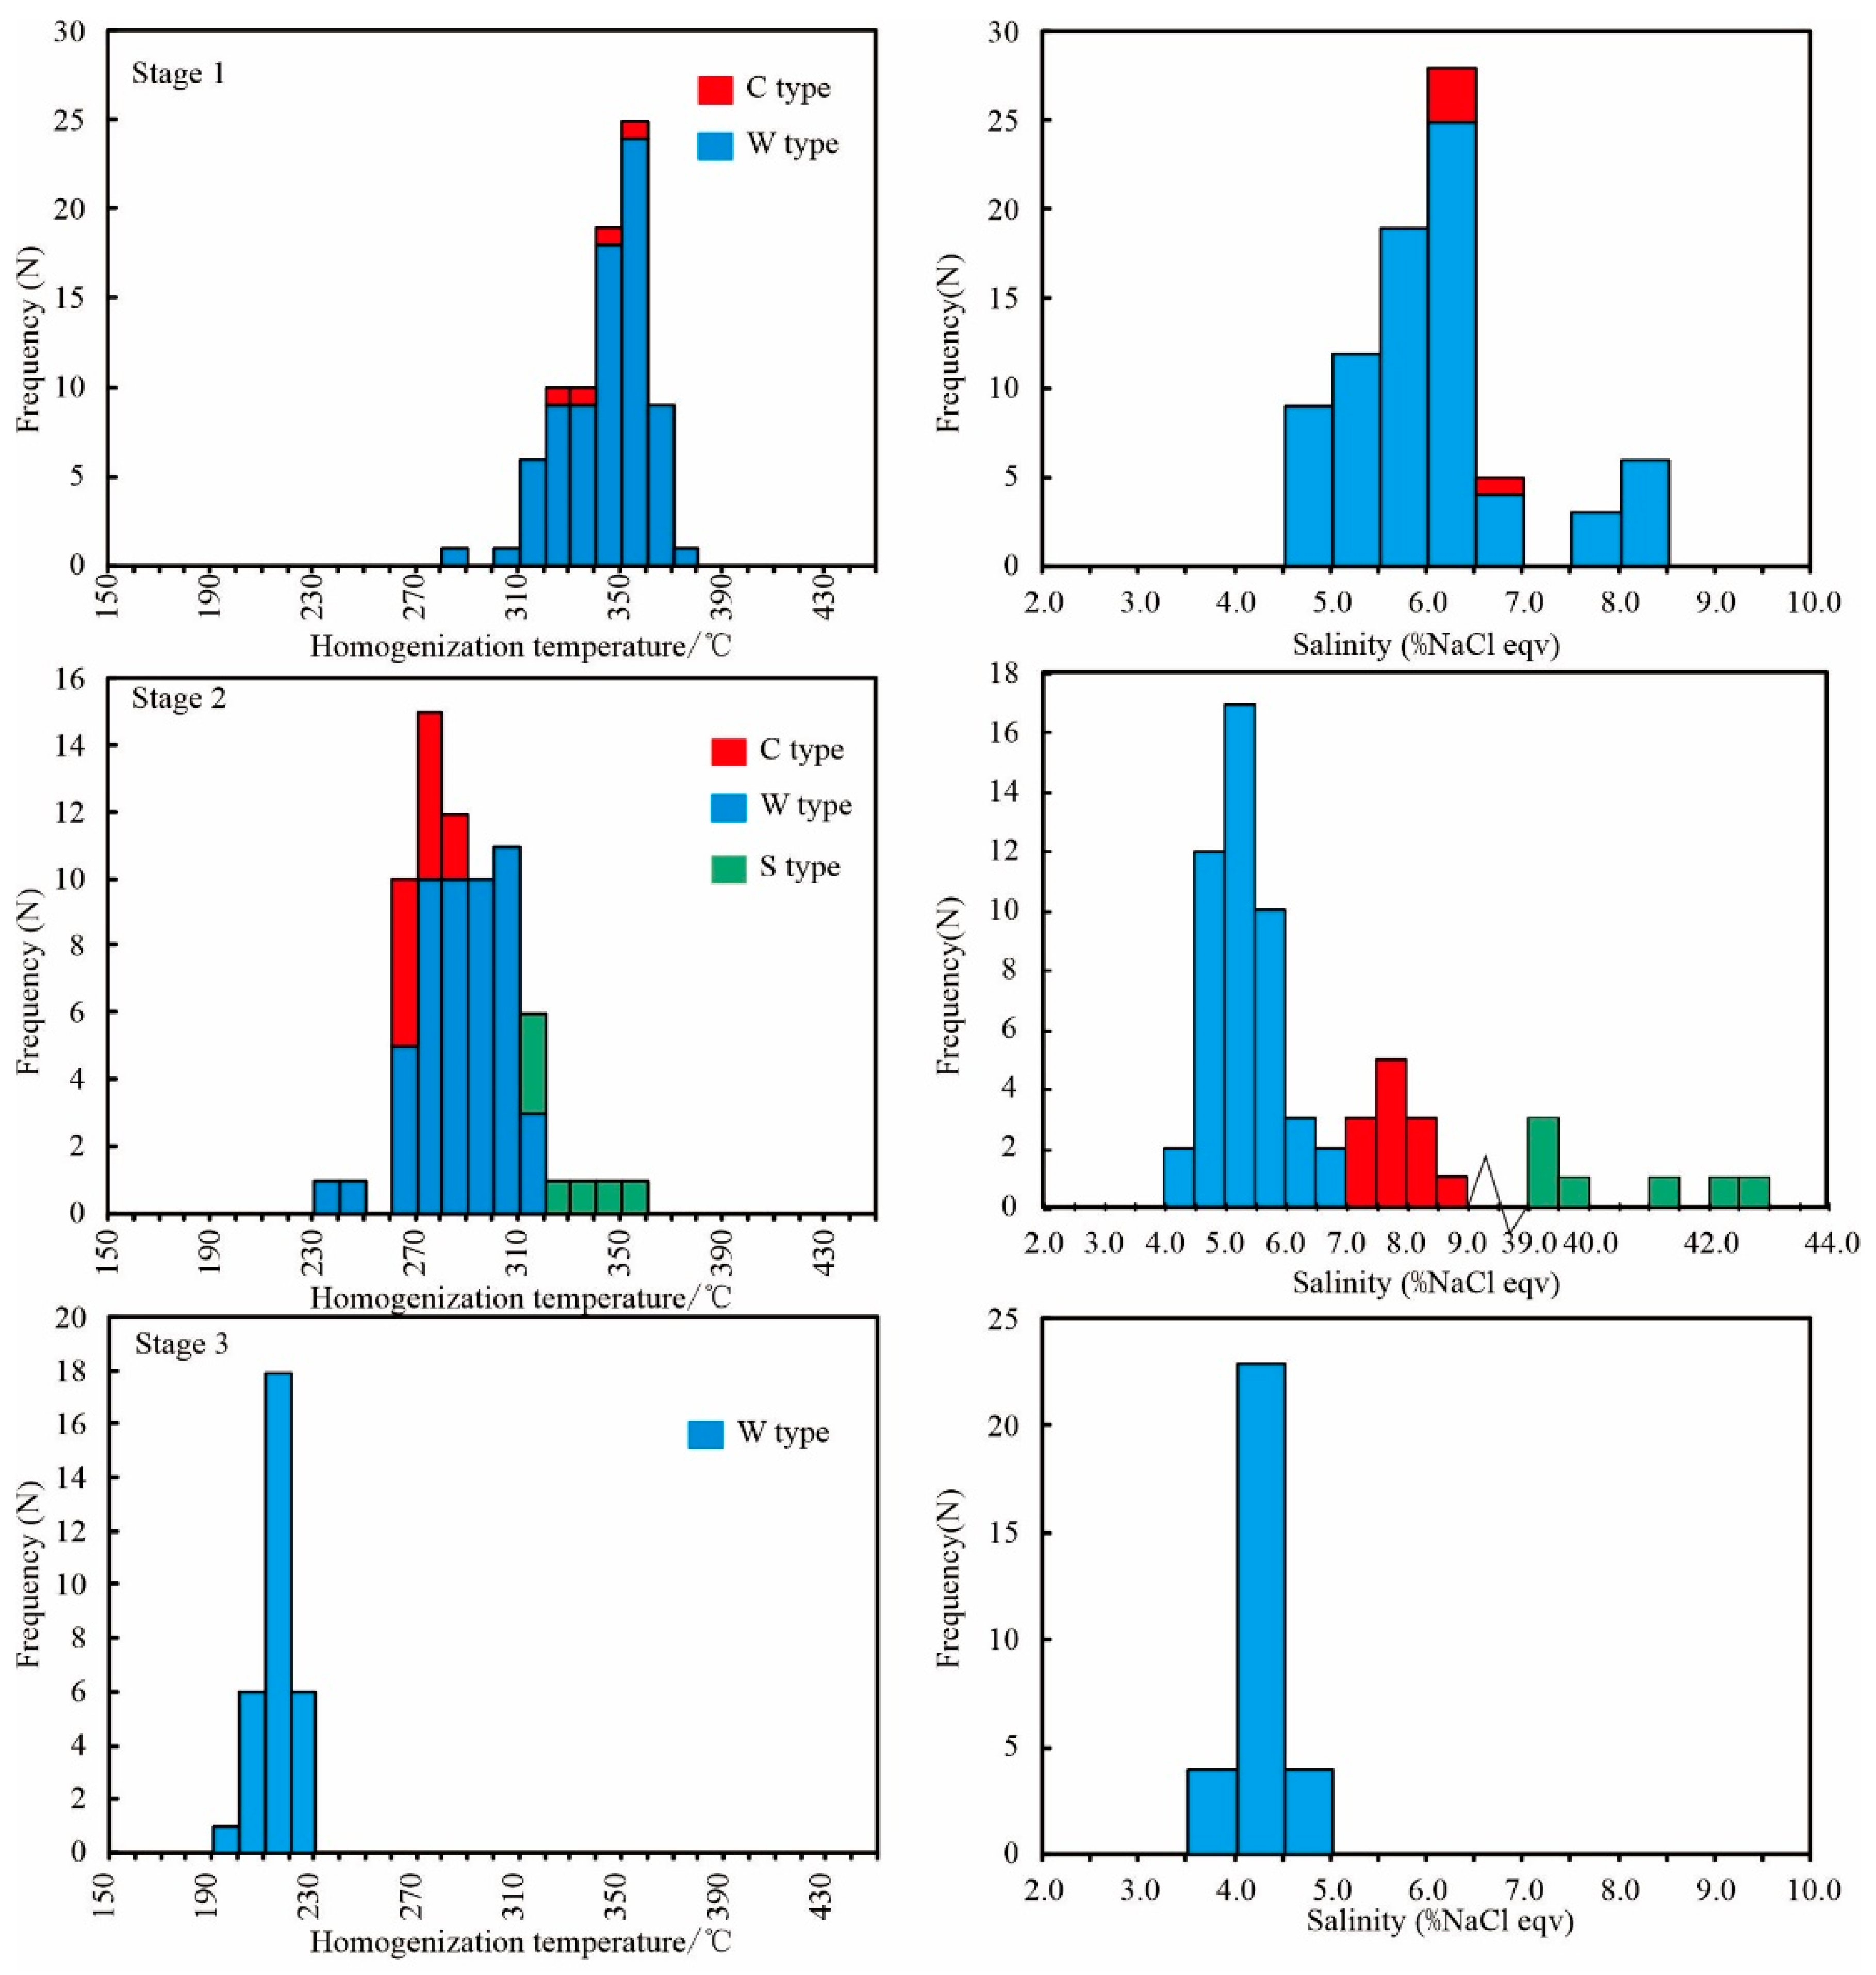
The temperature results for the FIs were measured by considering factors such as the distribution, size, and shape of the inclusion. The parameters of FIs associated with different stages are listed in Table 1. W-type and C-type FIs are present in stage 1. The final ice-melting temperatures of the W-type FIs range from −5.2 to −2.8 °C, and their homogenization temperatures range from 282.3 to 376.8 °C, which correspond to salinities of 4.65–8.14% NaCl eq. and fluid densities of 0.63–0.85 g/cm3. In C-type inclusions, the initial solid-phase melting temperatures range from –58.3 to –57.6 °C, which is under the triple-phase temperature of pure CO2 (–56.6 °C). Laser Raman analyses indicated that these inclusions may contain N2 and CH4. The melting temperatures of the clathrates range from 6.5 to 6.8 °C, whereas the homogenization temperatures of the liquid CO2 phase range from 29.3 to 30.8 °C; the homogenization temperatures of the clathrates range from 327.4 to 352.3 °C, which correspond to salinities of 6.12–6.63% NaCl eq. and fluid densities ranging from 0.68 to 0.73 g/cm3.
The FIs in stage 2 are W-, C-, and S-type. In this stage, the final ice melting temperatures of the W-type FIs range from −4.2 to −2.6 °C, and their homogenization temperatures range from 238.7 to 312.6 °C, which correspond to salinities ranging from 4.34% to 6.74% NaCl eq. and fluid densities of 0.74–0.86 g/cm3. In S-type FIs, the gas-phase disappears before the solid phase, as the gas-phase disappears at temperatures ranging from 258.3 to 287.3 °C, whereas the salt mineral melting temperatures range from 335 to 352.6 °C, which correspond to salinities of 39.04–42.64% NaCl eq. and fluid densities of 1.11–1.13 g/cm3. The initial solid-phase melting temperatures of the C-type FIs range from −59.4 to −56.9 °C, which is under the triple-phase temperature of pure CO2 (−56.6 °C); the melting temperature of clathrate ranges from 5.3 to 6.1 °C, the homogenization temperatures of the liquid CO2 phase range from 28.6 to 31.2 °C, and their homogenization temperatures range from 261.2 to 283.1 °C, which correspond to salinities of 7.31–8.61% NaCl eq. and fluid densities of 0.82–0.85 g/cm3.
The FIs in stage 3 are mainly W-type inclusions, with ice-melting temperatures ranging from −2.1 to 2.8 °C and homogenization temperatures of 198.3–228.9 °C (Figure 6). These temperatures are lower than those for the W-type inclusions of the quartz-vein–molybdenite stage, which suggests that the ore-forming temperatures decreased sharply. The salinities in this stage are 3.55% to 4.65% NaCl eq., and the fluid densities are 0.86–0.90 g/cm3.
5.1.3. Laser Raman Spectroscopy
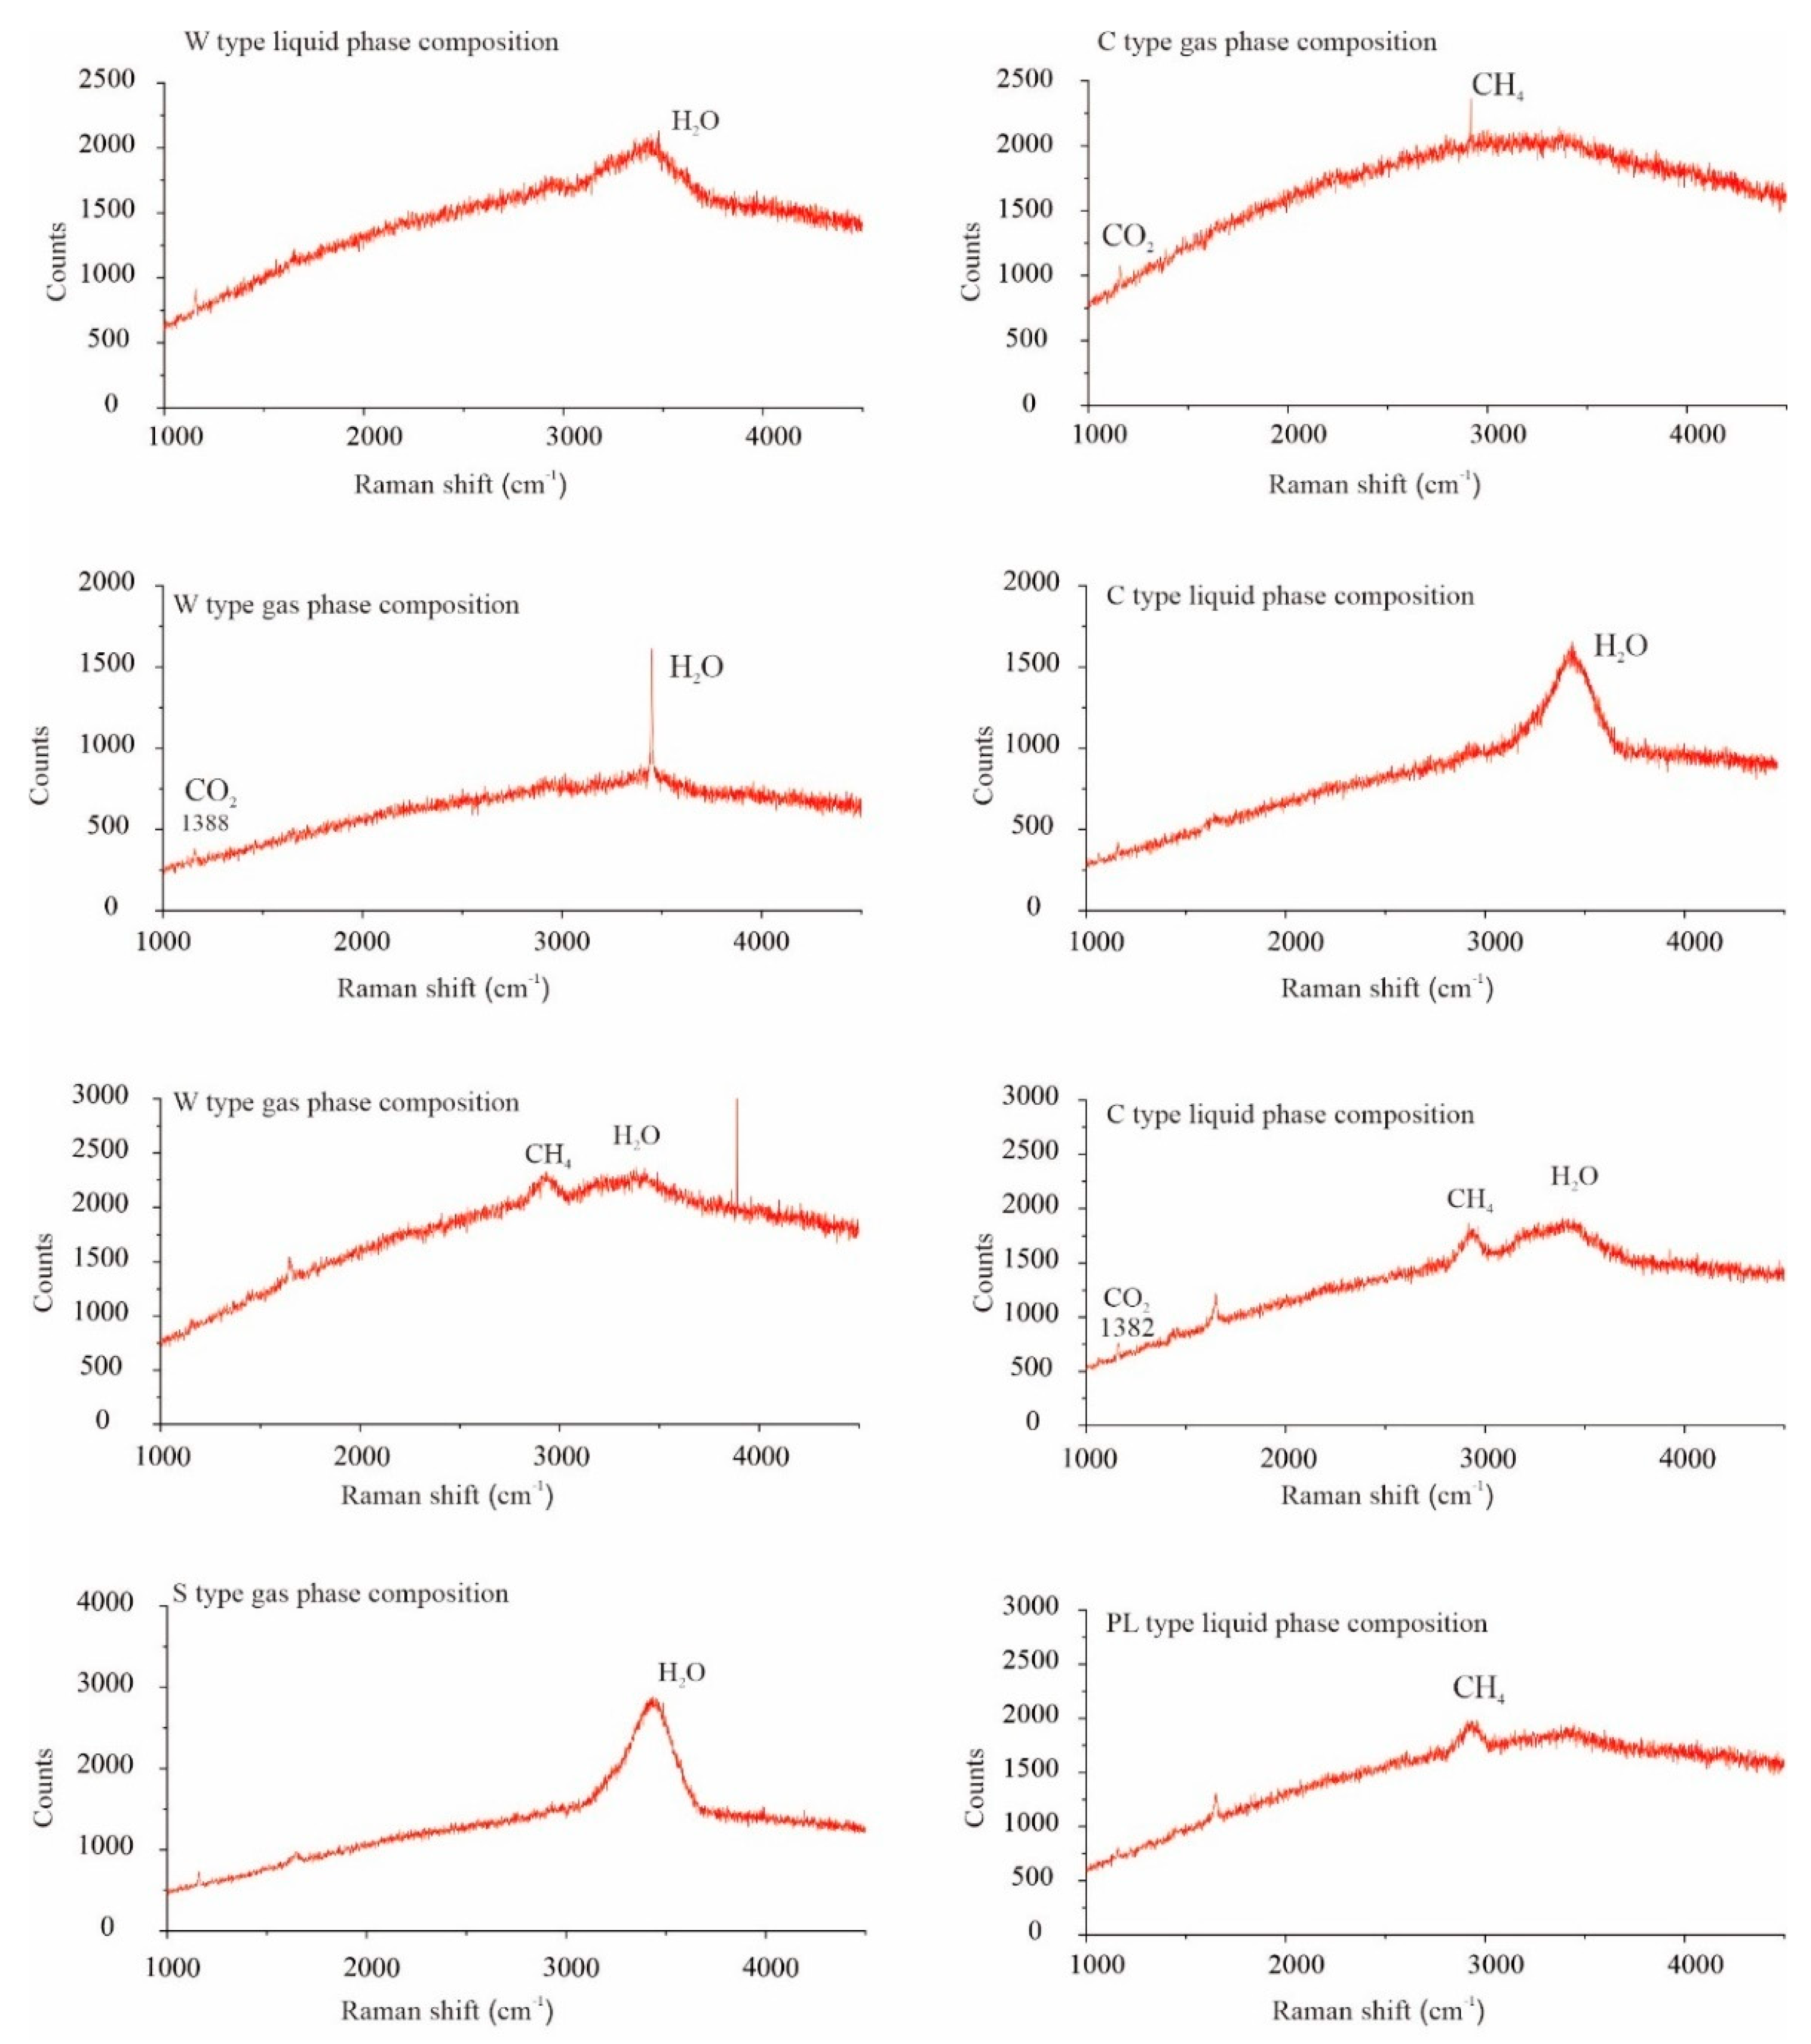
Laser Raman microprobe analysis (Figure 7) demonstrated that the gas-phase composition of the W-type FIs comprises CO2, N2, and CH4, whereas their liquid-phase is mainly H2O. The PV-type inclusions mainly comprise CO2; the PL-type inclusions are mainly H2O, and a small number comprise CH4; the gas-phase C-type inclusions mainly comprise CO2; and the gas-phase composition of the S-type inclusions mainly comprises H2O, CO2, and N2, and daughter minerals are contributed by halite or other minerals (calcite, chalcopyrite).
5.2. S and Pb Isotopes
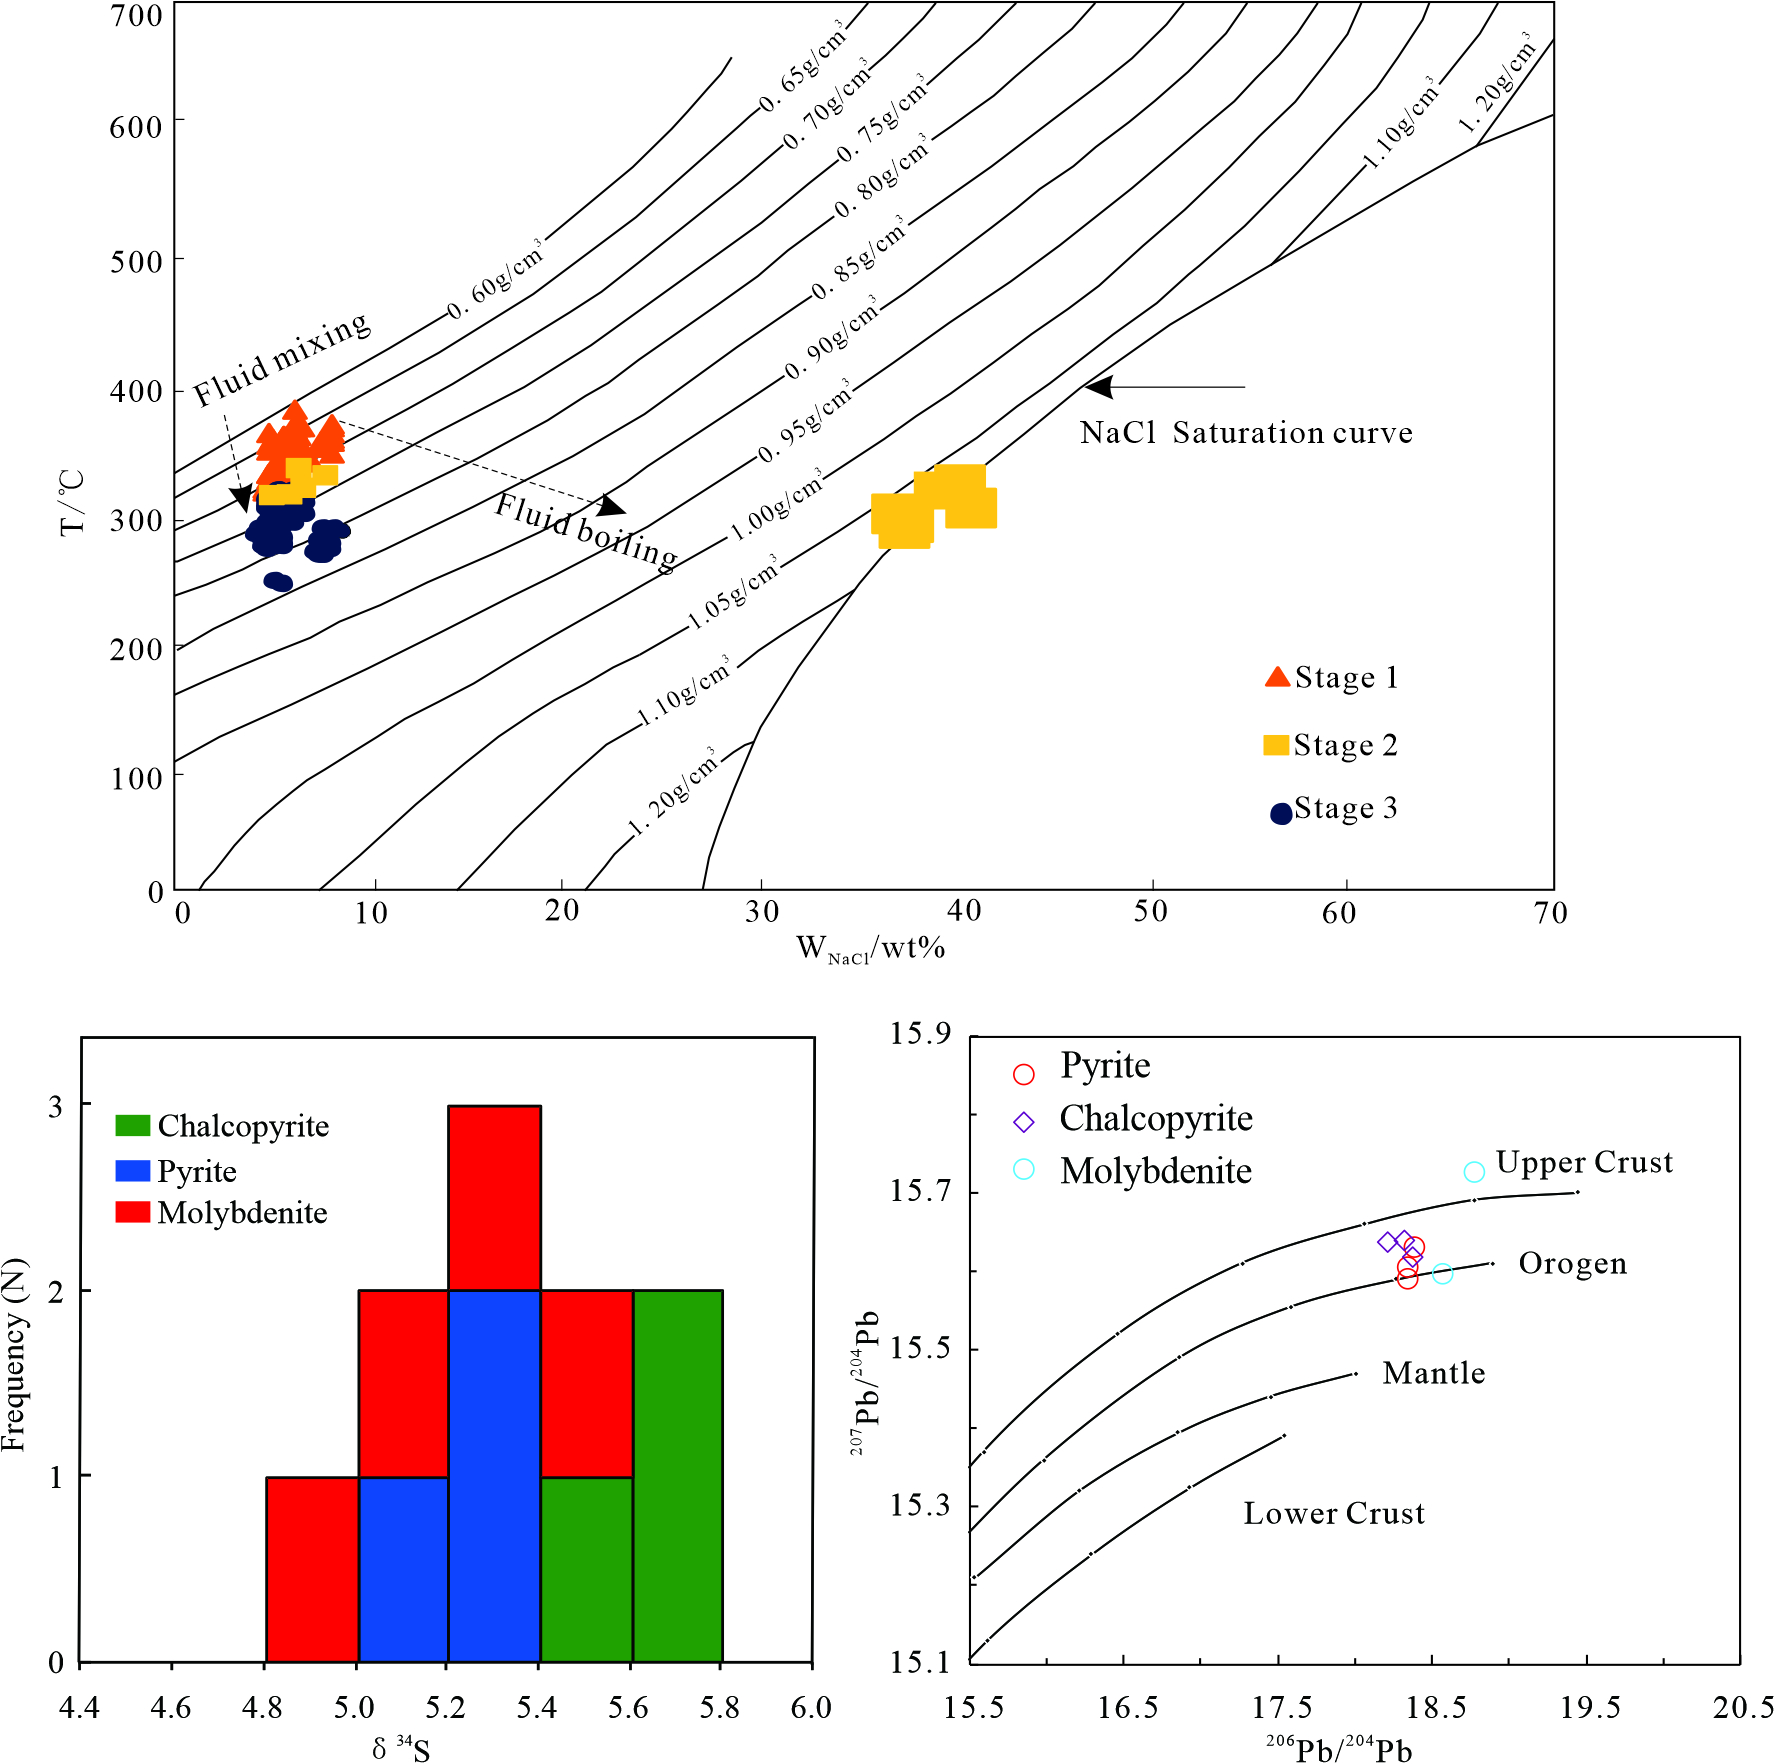
The results for the S and Pb isotopic compositions of the samples from the Reshui deposit are presented in Table 2. The δ34S values of pyrite, chalcopyrite, and molybdenite range from 5.1‰ to 5.4‰, 5.6‰ to 5.8‰, and 4.9‰ to 5.5‰, respectively. Collectively, the δ34S values are relatively homogeneous, ranging from 4.9‰ to 5.8‰, indicating that little or no sulfur isotopic fractionation occurred in sulfides during the evolution of the Reshui deposit. In general, the S isotopic compositions of sulfides in the Reshui deposit are slightly heavier than that of the mantle and are very similar to each other, indicating that the S sources of sulfides in the Reshui deposit were undiversified and mainly deeply sourced felsic magma sulfur [38,39,40].
The lead isotopic compositions of the Reshui deposit are displayed in Table 2. The 206Pb/204Pb, 207Pb/204Pb, and 208Pb/204Pb ratios of all samples range 18.210–18.786‰, 15.589–15.723‰, and 38.298–39.126‰, respectively. The 206Pb/204Pb, 207Pb/204Pb, and 208Pb/204Pb ratios of the three pyrite samples are 18.355–18.401‰, 15.589–15.629‰, and 38.354–38.509‰, respectively, whereas those of the three chalcopyrite samples are 18.21–18.374‰, 15.617–15.640‰, and 38.298–38.460‰, respectively. The lead isotopic values of the pyrite and chalcopyrite vary little between samples, but those of the molybdenite samples vary widely.
6. Discussion
6.1. Timing of Magmatism and Mineralization
The Reshui deposit granite contains porphyritic monzogranite and monzogranite yielding LA-ICP-MS zircon U–Pb ages of 230.9 ± 1.4 Ma and 230.5 ± 1.0 Ma, respectively [24,25]. The molybdenite Re–Os age of 230.2 ± 2.5 Ma is similar to that of the Reshui Granite [23], thus indicating that the ages of mineralization and of the granite in the Reshui deposit are Late Triassic and that the mineralization occurred at the same time as magma emplacement and crystallization.
The East Kunlun metallogenic belt is characterized by porphyry Cu–Mo, Mo, and skarn Fe–Cu–Pb–Zn deposits. The timing and duration of magmatic hydrothermal events are crucial for understanding ore deposit formation [2,51,52,53,54]. The mineralization in the EKOB is spatially and temporally related to Triassic granitoids. The EKOB experienced strong crust–mantle interactions during the Triassic [5,6,18,31], among which magma underplating and mixing were predominant, with abundant porphyry and skarn mineralization [9,10]. In this study, we collected data published in the literature regarding porphyry mineralization ages (Table 3). The formation ages derived for the EKOB range from 214 to 248 Ma, but peak mineralization is dated to ca. 230 Ma. This region experienced subduction and collisional orogeny from the Late Permian to the Early Triassic as the Buqingshan–A’nemaqen Ocean, part of the Paleo-Tethys Ocean, generated northward subduction, which triggered crust–mantle magmatic activity and led to the emplacement of a large number of arc magmatic rocks that are linearly distributed across the region [6,16]. The inferred EKOB tectonic evolution indicates that the Late Triassic granitoids that formed after subduction were related to collisional to post-collisional tectonic processes [4,14,18]. This tectonic movement was related to the formation of porphyry-skarn type Cu–Mo–Au deposits. The subducting slab caused asthenospheric decompression melting and basaltic magma underplating at the bottom of the lower crust, which led to partial melting of the crustal material to produce felsic magma [5,29,31], such as the porphyry granite in Aikengdelisite, which yields a zircon U–Pb age of 248.4 ± 0.83 Ma [50], and the porphyry granodiorite in the Lalingzhaohuo Mo deposit, which yields a zircon U–Pb age of 242.6 ± 3.4 Ma [45]. During the middle–late Triassic, ca. 240–230 Ma, the tectonic setting transformed into one of collision. Xia et al. [18] have suggested that the 240 Ma Nagetan granitoids record the closure of the Paleo-Tethys. Ma et al. [55] showed that post-230 Ma Late Triassic magmatic rocks have high εHf(t) values, and proposed that they formed in a post-collisional extensional tectonic setting in the EKOB. Furthermore, a regional angular unconformity has recently been recognized between the Middle Triassic Xilikete Formation and the Late Triassic Babaoshan Formation in the EKOB [15,27]. Hence, we infer that the Reshui Mo deposit formed during the transformation of the tectonic regime from collision to post-collision in the Late Triassic.
The porphyry deposits have been divided into three types according to their tectonic setting: Climax-types, Endako-types and collision-related [56,57]. The Reshui Mo deposits in the EOKB is different from the Climax- and Endako-type porphyry Mo deposits, because of its tectonic setting and crustal source of the magma. Audétat et al. [56] summarized findings that have been made regarding the economic Climax-type porphyry Mo deposits, showing that they are invariably emplaced in post-subduction extensional settings and that the associated intrusions are commonly evolved A-type granites; the Endako-types, in contrast, are emplaced in a subduction-related environment [56,57]. The Reshui Mo deposit formed in a collision to post-collision tectonic setting, distinguishing it from both the Climax- and Endako-types. The Reshui Mo deposit is associated with a high-K calc-alkaline I-type granite [24,25] that originated from partial melting of crustal materials, unlike the magma of the Endako- and Climax-type deposits, which are generally sourced from crust-mantle mixtures related to oceanic plate subduction and enriched mantle [57,58,59]. Hence, the Reshui deposit is a collision-type porphyry Mo deposit. This is consistent with U–Pb and Re–Os age data (Table 3) related to EKOB porphyry deposits. The metallogenic age of the Reshui porphyry Mo deposit further illustrates that remarkable mineralization occurred in this region during the Triassic, and that magmatic-hydrothermal deposits related to this tectonic stage have great metallogenic potential.
6.2. Evolution of the Ore-Forming Fluid
Studying FIs provides information regarding fluid characteristics and can reveal the original nature of the ore-forming fluid and fluid sources [60,61,62,63,64]. The FIs produced in the Reshui Mo deposit during different stages share some characteristics but also have distinct characteristics that reflect changes in the nature of the ore-forming fluid.
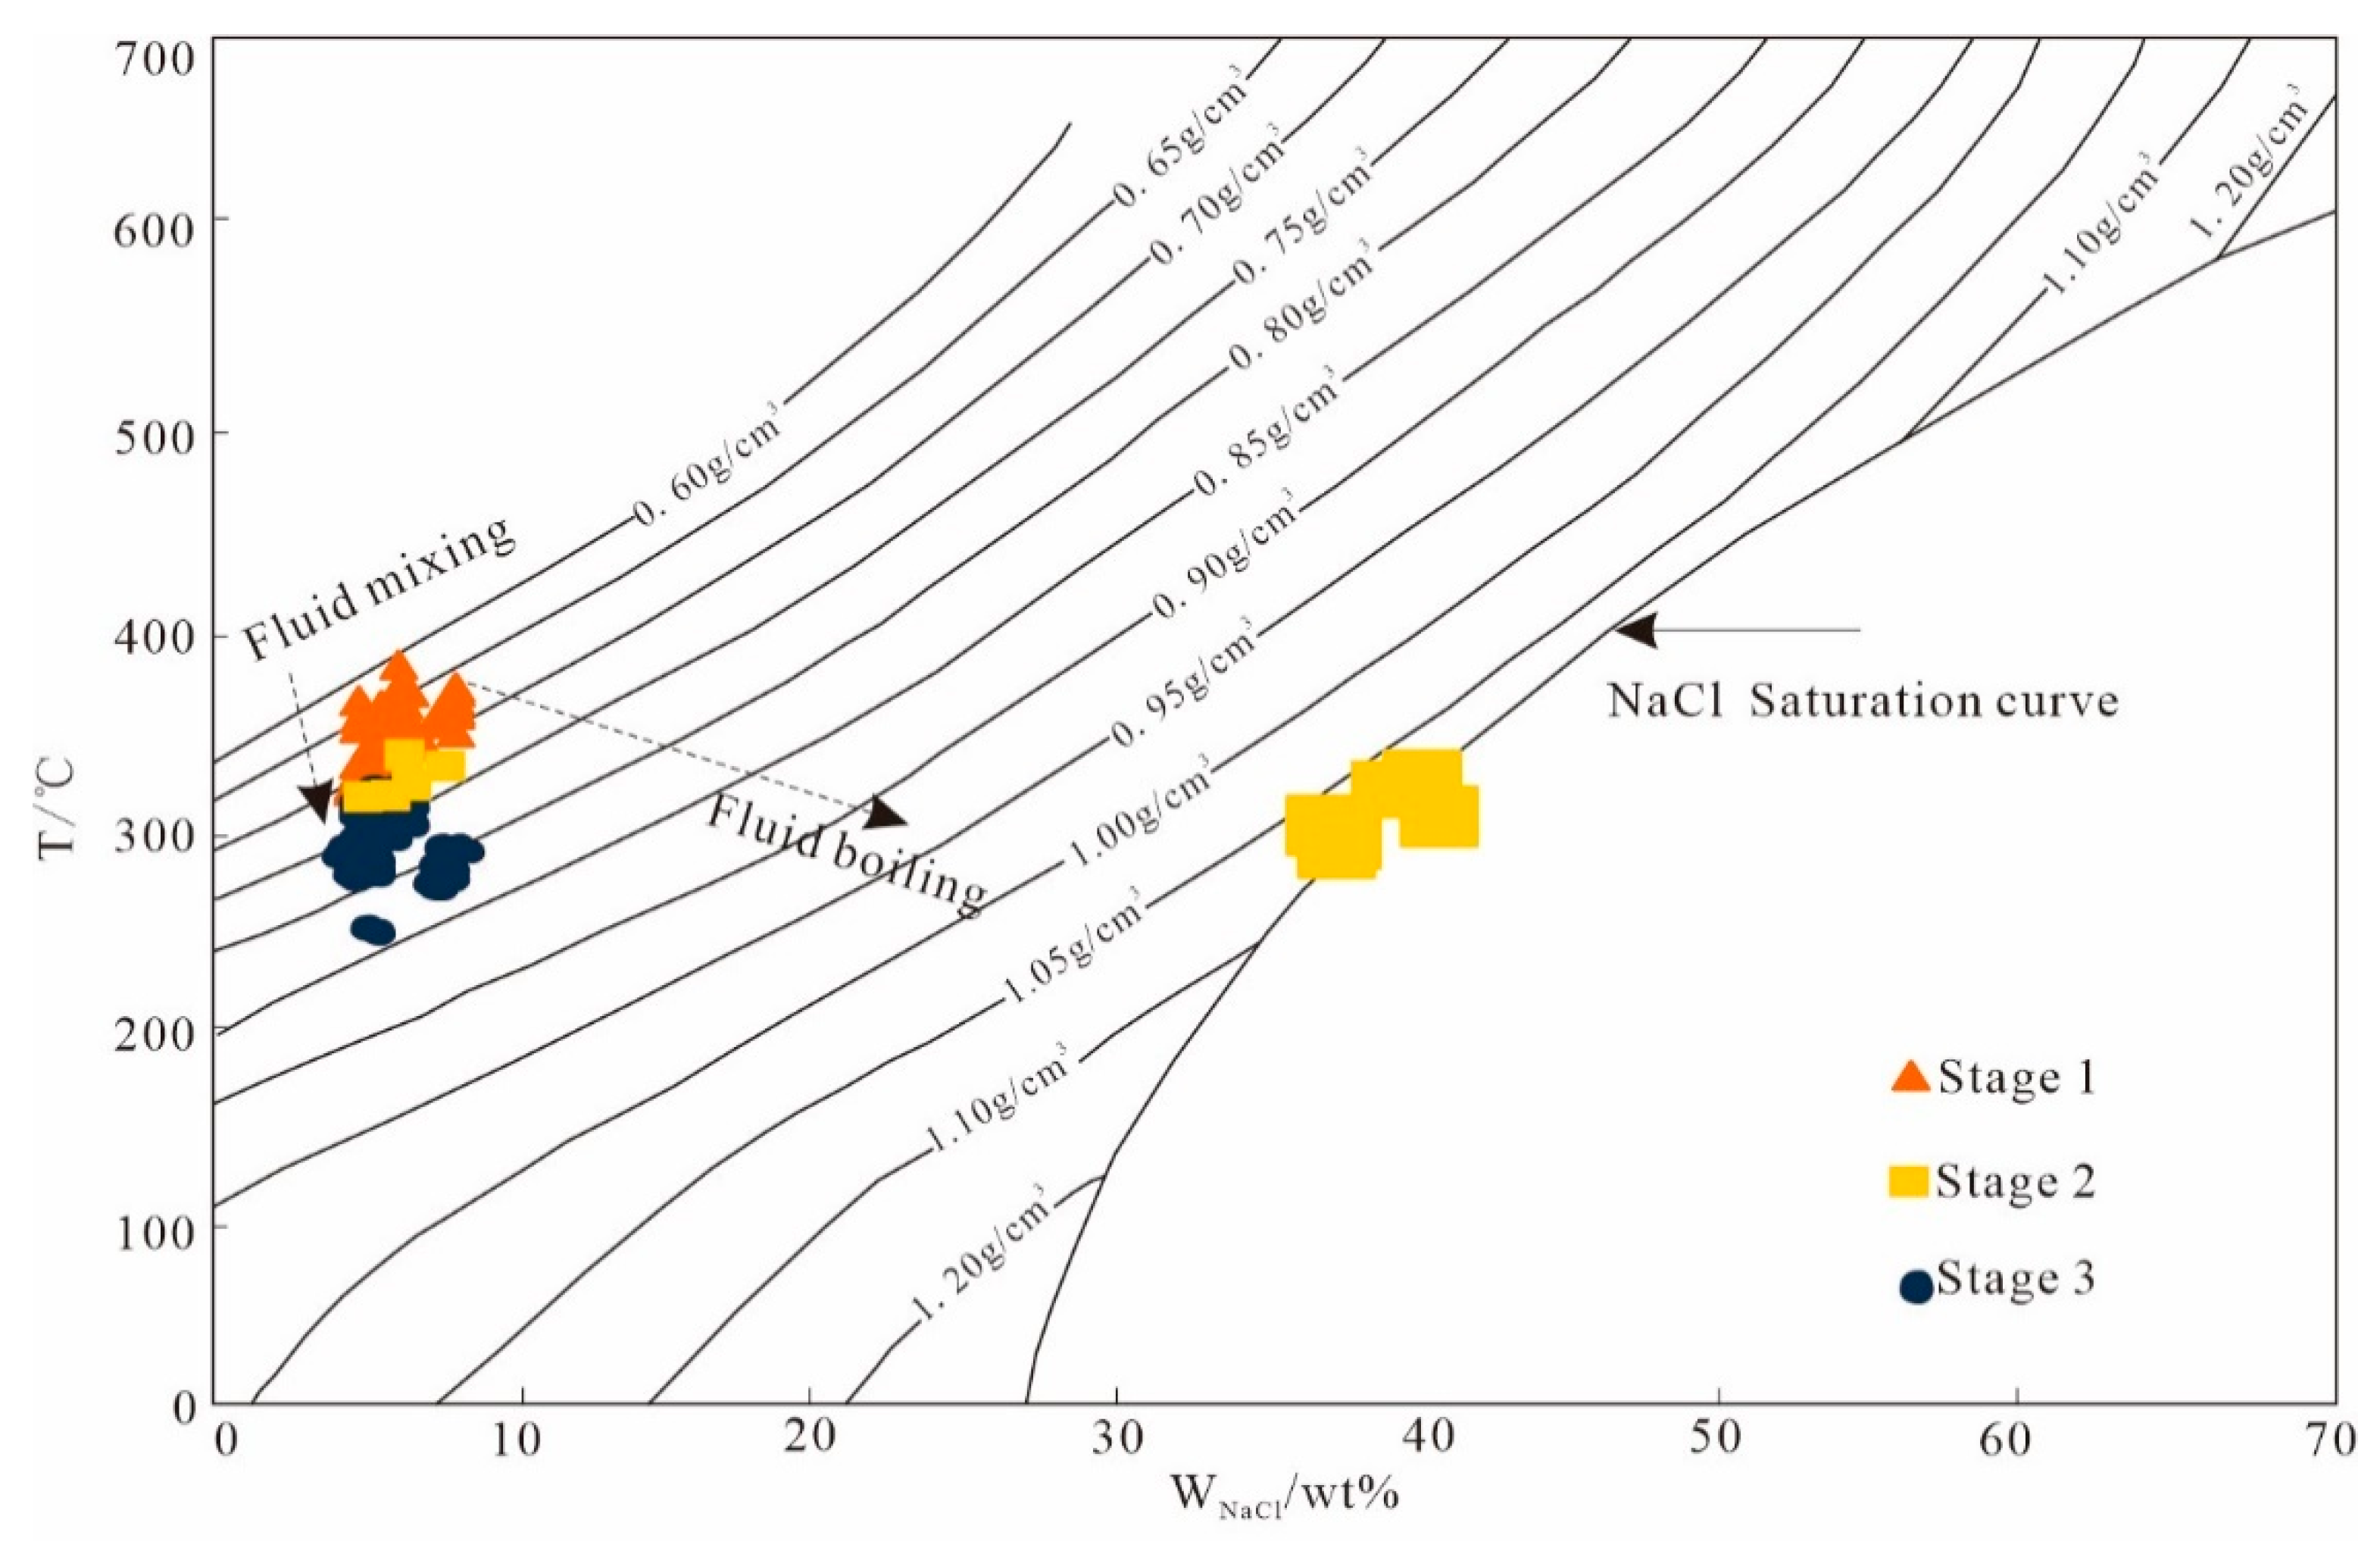
The sparsely disseminated molybdenite produced during the early metallogenic stage 1 of the Reshui Mo deposit contains W-type FIs, which indicates that the fluid belongs to the H2O–CO2–NaCl system [65,66,67,68,69]. The homogenization temperatures of stage 1 FIs range from 282.3 to 376.8 °C, which correspond to salinities of 4.65–8.14% NaCl eq. and fluid densities of 0.63–0.79 g/cm3. The initial ore-forming fluids were thus high-temperature and low-salinity. The FIs in stage 2 comprise a number of liquid-rich gas and liquid two-phase FIs, as well as a few pure gas FIs, many gas-rich H2O–CO2 FIs, and many mineral inclusions. The variable gas and liquid ratios of these inclusions and the coexistence of different types of FIs reflect non-uniform capture and indicate that the fluid boiled or mixed (Figure 8). The laser Raman spectroscopy analyses indicate that a few of these FIs contain minor CO2 and CH4, although a few pure CH4 liquid inclusions were observed. The main processes that can add carbon to ore-forming fluids are magma genesis, where the carbon is directly derived from deep magma reactions with H2O, decomposition of organic matter, oxidation reactions related to graphite, and decarbonization reactions of calcium-silica carbonate rock. No sedimentary strata were exposed in the Reshui Mo deposit, so the presence of CH4 in the inclusions indicates that the ore-forming fluid reacting H2O with reduced carbon in the crust and created CO–CH4 [66,69,70,71]. The homogenization temperatures of the stage 2 FIs range from 238.7 to 312.6 °C, which correspond to salinities of 4.34–42.64% NaCl eq. The ore-forming fluid thus belongs to a high-temperature H2O–NaCl–CO2 ± CH4 system with a wide range in salinity. This is the main metallogenic stage; similar to the high-temperature ore-forming fluid system of the Dabie–Qingling collision-type porphyry Mo deposit, it exhibits a wide range of salinity characteristics [71,72,73,74,75]. In stage 3, homogenization temperatures range from 198.3 to 228.9 °C, which correspond to salinities of 0.7–6.3% NaCl eq. W-type inclusions with different gas and liquid ratios are again found in this stage. There is a lack of C-type inclusions, reflecting a significant reduction in the abundance of CO2. Pressure and temperature decreased with the evolution of the ore-forming fluid from stage 2 to stage 3; during stage 3, the temporal phenomenon in gas–liquid two-phase inclusions indicates that other fluids joined in the mineralization and were immiscible in the fluid. The homogenization temperatures of these inclusions are 198.3–228.9 °C, thus falling within the low-temperature liquid range, and the salinity of the ore-forming fluid is also low (0.7–6.3% NaCl eq.).
The metallogenic fluid of the Reshui Mo deposit is characteristically high–medium temperature and low–medium-salinity, and generally belongs to the H2O–NaCl–CO2 ± CH4 system [76,77,78,79,80]. The initial ore-forming fluids that came into the system during the process of fluid migration were high-temperature, high-pressure, and CO2-rich. The temperature changed slightly from stage 1 to stage 2 and the presence of different types of coexisting inclusions in the ore-forming fluids in stage 2 suggest boiling during stage 2. The stage 3 quartz-vein–polymetallic sulfide phases were most likely affected by other fluids (potentially meteoric water), which caused H2O–NaCl–CO2 ± CH4 fluid phase separation, low-salinity conditions, the generation of inclusions with different gas and liquid ratios, and a lack of development of daughter mineral-bearing inclusions. Combining the evidence for a substantial change in temperature and pressure, we infer fluid mixing (the incorporation of meteoric water) from stage 2 to stage 3. When the ore-forming fluid is at higher temperature and pressure, the molybdenum complex has a relatively high stability. However, the temperature decrease and the decompression boiling of the fluid in stage 2 may have caused a large amount of volatile matter to escape (CO2, H2, H2S, SO2), and when the fluid was exsolved from the crystallizing magma, the movement of CO2 (H2, H2S, SO2) out of the system may have induced a sudden increase in pH [71], thereby, raising the pH and causing Mo6+ to convert Mo4+ and SO42− to convert to S2− to form metal sulfides, depositing sulfides, native metals, and other ore minerals [72]. According to Kim et al. [71], pressure changes that transformed the system to near critical environments or critical H2O conditions have created favorable environments for the fundamental depositional mechanism. The incorporation of meteoric water in stage 3 may have caused the temperature and pressure of the mineralizing fluid to drop sharply, leading to a decrease in the solubility of metal complexes and the precipitation of molybdenum [65,66,72] in the Reshui Mo deposit (Figure 8).
The existence of the boiling fluid inclusion assemblages in stage 2 permits reliable estimation of the pressure conditions of fluid trapping during the ore formation. According to the microthermometric data (such as the clathrate melting temperatures, CO2 phase homogenization temperatures, and total homogenization temperatures; Table 1), we used the software Flincor [35], and the formula of Brown and Lamb [81] for the H2O–CO2–NaCl system, to estimate the trapping pressures of the fluid inclusions in the Reshui Mo deposit. These trapping pressures were estimated to be 236–351 MPa, 173–279 MPa, and 158–187 MPa for stage 1, stage 2, and stage 3, respectively (Figure 9). Assuming that these pressures are lithostatic and taking the density of the crustal rocks as 2.7g/cm3, the calculated pressures for stages 1 to 3 correspond to depths of 8.8–13.0 km, 6.4–10.4 km, and 5.8–6.9 km, respectively. Therefore, the mineralization of the Reshui Mo deposit likely occurred at depths of 5.8–13.0km. In general, the formation of porphyry Mo deposits has been found to have occurred at depths of 1–6 km [82]. However, some publications indicate that some porphyry Mo deposits have deeper depths of emplacement. The East Qinling molybdenum ore belt has a number of porphyry molybdenum deposits, but its metallogenic depth is varied: that of the Jinduicheng molybdenum deposit ranges from 2.2 to 8.1 km [78], that of the Nannihu deposit is about 3 km [75], and that of the Leimengou deposit is 2.7–5.1 km [83]. In this paper, the metallogenic depth of the Reshui Mo deposit is estimated to have been no less than 5.8 km.
6.3. Source of Ore-Forming Materials
The sulfide assemblage in the Reshui deposit is dominated by molybdenite and pyrite with a small amount of chalcopyrite, and no sulfate minerals have been detected. Therefore, the hydrothermal system during the ore-forming process in the Reshui deposit was dominated by H2S; the molybdenite, pyrite, and chalcopyrite formed under low-fO2 and low-pH conditions [84,85,86]. According to Table 2, the average δ34S value for the four molybdenite samples from the Reshui deposit is 5.2‰, and the average δ34S value for the three pyrite samples is 5.3‰. The basic sequence is consistent with the δ34S enrichment condition of δ34SMo and δ34SPy at isotopic equilibrium, indicating that the S isotopes in the minerals had reached equilibrium [87]. This suggests that the S isotopic compositions of the pyrite are similar to the total S isotopic compositions of the hydrothermal system and can be used to trace the S sources [88,89,90]. The overall range of the δ34S values of sulfides in the Reshui deposit is narrow (Figure 10), indicating that the sulfides in the ore-forming hydrothermal fluids had homogeneous S sources. The sulfur in the Reshui deposit is therefore interpreted as being mainly derived from the late Triassic intrusive rocks.
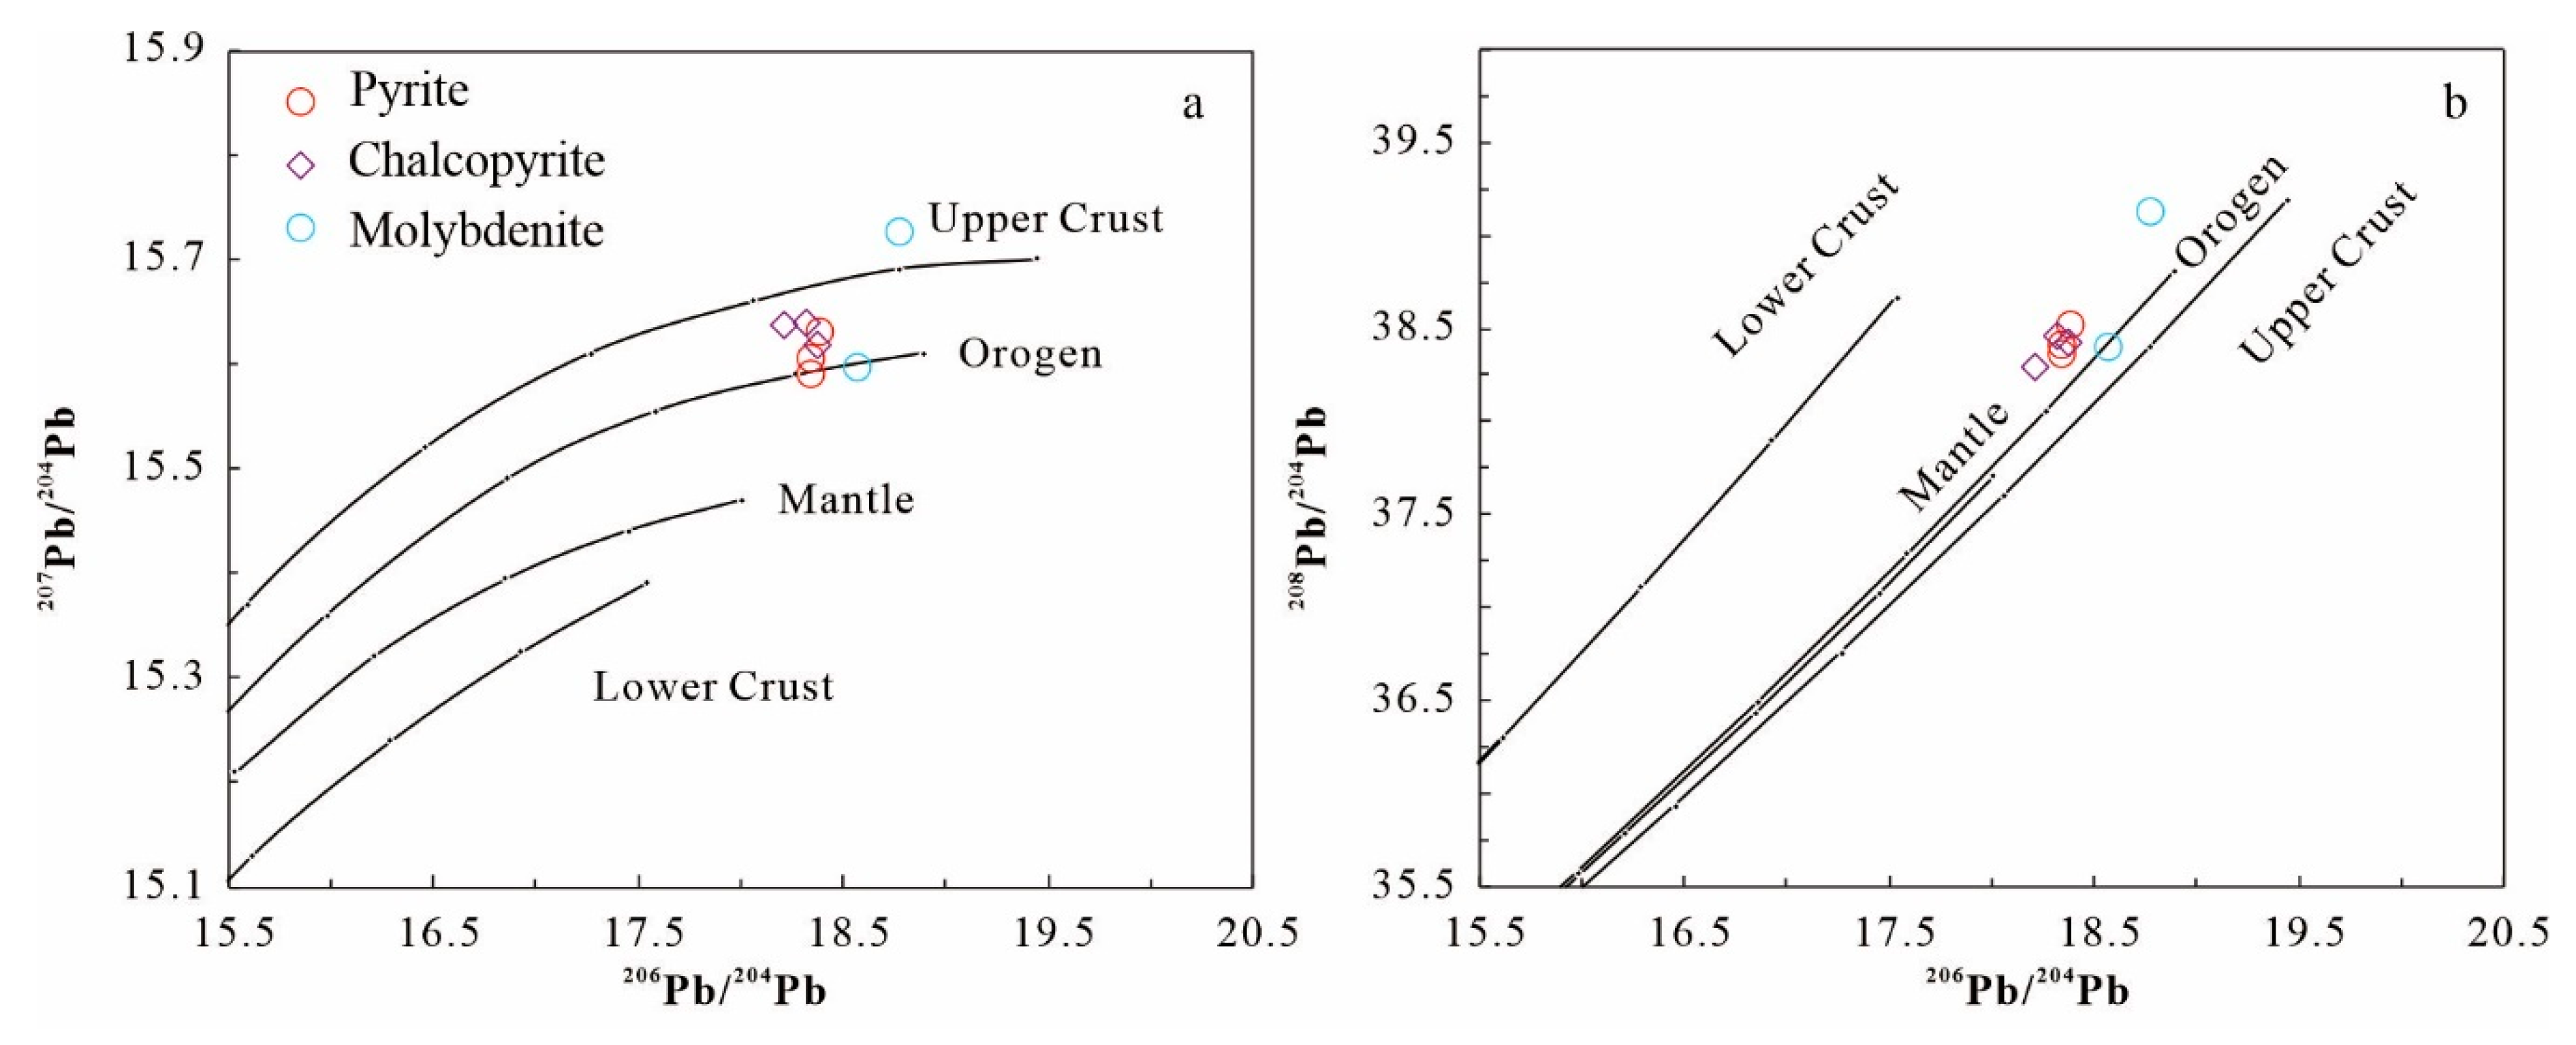
Lead isotopic values can reflect the sources of the lead [91,92,93]. Sulfides from the Reshui Mo deposit yielded relatively uniform Pb isotopic compositions, with mean 206Pb/204Pb, 207Pb/204Pb, and 208Pb/204Pb ratios of 18.422, 15.289, and 38.497, respectively. There is little difference in the Pb isotopic compositions of the different sulfides, indicating a similar lead source. Measured 207Pb/204Pb ratios are lower than those of the mantle (<15.600 [94]), and 206Pb/204Pb ratios and 208Pb/204Pb ratios are higher than those of the mantle (206Pb/204Pb = 18.010, 208Pb/204Pb = 37.700, respectively [95]). In the Reshui Mo deposit lead isotopic diagram (Figure 11), the measured Pb isotopic data cluster between the compositions of the upper crust and orogenic belts, and most of the ore sulfides samples plot near the orogenic line, with two samples even plotting below the line (Figure 11a). The Pb isotope data for the ore sulfides also plot close to the orogenic growth line in Figure 11b. We interpret these data as indicating that the lead was primarily derived from the crust [94,95,96,97].
7. Conclusions
(1) The ore-forming process of the deposit can be divided into three stages: an early disseminated molybdenite stage, a middle-quartz–molybdenite stage, and a late–quartz–polymetallic sulfide stage, respectively.
(2) Fluid inclusion analyses demonstrated that the ore-forming fluids in the Reshui porphyry Mo deposit belong to the H2O–NaCl–CO2 ± CH4 system and exhibit the characteristics of a medium–high-temperature, medium–low-salinity fluid. The pressure is estimated at 158–351 MPa, and the metallogenic depth is estimated to have been no less than 5.8 km.
(3) Fluid boiling changed the pH in stage 2 and temperature and pressure to drop sharply in stage 3, which created favorable environments for the fundamental depositional mechanism, leading to the precipitation of molybdenum.
(4) The S–Pb isotopic compositions of sulfides in the Reshui porphyry Mo deposit suggest that the source of the ore-forming material was derived from the crust.
Author Contributions
Investigation, X.G., Q.J., J.L. and H.K.; data curation, X.G.; formal analysis, X.G.; writing—original draft preparation, X.G.; writing—review and editing, X.G., X.L. and Q.J.; funding acquisition, X.L., Q.J.
Funding
This research was funded by the China Geological Survey Project (DD20160013 and 12120114018001) and the China Scholarship Council (201806410101).
Acknowledgments
We would like to thank Yinmin Yu for her assistance during microthermometric analysis; we are grateful to David R. Cooke and Lejun Zhang for their help at CODES; we would like to thank the reviewers whose comments improved the quality of the paper.
Conflicts of Interest
The authors declare no conflict of interest.
References
- Liou, J.G.; Ernst, W.G.; Song, S.G.; Jahn, B.M. Tectonics and HP–UHP metamorphism of northern Tibet-preface. J. Asian Earth Sci. 2009, 35, 191–198. [Google Scholar] [CrossRef]
- Yang, Y.F.; Wang, P. Geology, geochemistry and tectonic settings of molybdenum deposits in Southwest China: A review. Ore Geol. Rev. 2017, 81, 965–995. [Google Scholar] [CrossRef]
- Mu, D.L.; Li, S.Z.; Wang, Q.; Somerville, I.; Wang, Y.H.; Zhao, S.J.; Li, X.Y.; Yu, S.Y.; Suo, Y.H. Early Paleozoic Orocline in the Central China Orogen. Gondwana Res. 2018, 63, 85–104. [Google Scholar] [CrossRef]
- Chen, J.J.; Wei, J.H.; Fu, L.B.; Li, H.; Zhou, H.Z.; Zhao, X.; Zhan, X.F.; Tan, J. Multiple sources of the Early Mesozoic Gouli batholith, Eastern Kunlun Orogenic Belt, northern Tibetan Plateau: Linking continental crustal growth with oceanic subduction. Lithos 2017, 292–293, 161–178. [Google Scholar] [CrossRef]
- Shao, F.L.; Niu, Y.L.; Liu, Y.; Chen, S.; Kong, J.J.; Duan, M. Petrogenesis of Triassic granitoids in the East Kunlun Orogenic Belt, northern Tibetan Plateau and their tectonic implications. Lithos 2017, 282–283, 33–44. [Google Scholar] [CrossRef]
- Dong, Y.P.; He, D.F.; Sun, S.S.; Liu, X.M.; Zhou, X.H.; Zhang, F.F.; Yang, Z.; Cheng, B.; Zhao, G.C.; Li, J.H. Subduction and accretionary tectonics of the East Kunlun orogen, western segment of the Central China Orogenic System. Earth-Sci. Rev. 2018, 186, 231–261. [Google Scholar] [CrossRef]
- Liu, Y.G.; Li, W.Y.; Jia, Q.Z.; Zhang, Z.W.; Wang, Z.A.; Zhang, Z.B.; Zhang, J.W.; Qian, B. The dynamic sulfide saturation process and a possible slab break-off model for the giant Xiarihamu magmatic nickel ore deposit in the East Kunlun Orogenic Belt, Northern Qinghai-Tibet Plateau, China. Econ. Geol. 2018, 113, 1383–1417. [Google Scholar] [CrossRef]
- Zhang, Z.W.; Wang, Y.L.; Qian, B.; Liu, Y.G.; Zhang, D.Y.; Lü, P.R.; Dong, J. Metallogeny and tectonomagmatic setting of Ni-Cu magmatic sulfide mineralization, number I Shitoukengde mafic-ultramafic complex, East Kunlun Orogenic Belt, NW China. Ore Geol. Rev. 2018, 96, 236–246. [Google Scholar] [CrossRef]
- Xia, R.; Wang, C.M.; Qing, M.; Deng, J.; Carranza, E.J.M.; Li, W.L.; Guo, X.D.; Ge, L.S.; Yu, W.Q. Molybdenite Re–Os, zircon U–Pb dating and Hf isotopic analysis of the Shuangqing Fe–Pb–Zn–Cu skarn deposit, East Kunlun Mountains, Qinghai Province, China. Ore Geol. Rev. 2015, 66, 114–131. [Google Scholar] [CrossRef]
- Wang, H.; Feng, C.Y.; Li, R.X.; Li, D.X. Geological characteristics, metallogenesis, and tectonic setting of porphyry-skarn Cu deposits in East Kunlun Orogen. Geol. J. 2018, 53, 58–76. [Google Scholar] [CrossRef]
- Yao, L.; Lü, Z.C.; Zhao, C.S.; Pang, Z.S.; Yu, X.F.; Yang, T.; Li, Y.S.; Liu, P.; Zhang, M.C. Zircon U–Pb geochronological, trace element, and Hf isotopic constraints on the genesis of the Fe and Cu skarn deposits in the Qiman Tagh area, Qinghai Province, Eastern Kunlun Orogen, China. Ore Geol. Rev. 2017, 91, 387–403. [Google Scholar] [CrossRef]
- He, H.J.; An, L.; Liu, W.; Yang, X.K.; Gao, Y.N.; Yang, L.W. Fractal characteristics of fault systems and their geological significance in the Hutouya poly-metallic orefield of Qimantage, East Kunlun, China. Geol. J. 2017, 52, 419–424. [Google Scholar] [CrossRef]
- Zou, Y.H.; Liu, Y.; Dai, T.G.; Mao, X.C.; Lei, Y.B.; Lai, J.Q.; Tian, H.L. Finite difference modeling of metallogenic processes in the Hutouya Pb–Zn deposit, Qinghai, China: Implications for hydrothermal mineralization. Ore Geol. Rev. 2017, 91, 463–476. [Google Scholar] [CrossRef]
- Xiong, F.H.; Ma, C.Q.; Wu, L.; Jiang, H.A.; Liu, B. Geochemistry, zircon U–Pb ages and Sr–Nd–Hf isotopes of an Ordovician appinitic pluton in the East Kunlun orogen: New evidence for Proto-Tethyan subduction. J. Asian Earth Sci. 2015, 111, 681–697. [Google Scholar] [CrossRef]
- Li, X.W.; Huang, X.F.; Luo, M.F.; Dong, G.C.; Mo, X.X. Petrogenesis and geodynamic implications of the Mid-Triassic lavas from East Kunlun, northern Tibetan Plateau. J. Asian Earth Sci. 2015, 105, 32–47. [Google Scholar] [CrossRef]
- Yu, M.; Feng, C.Y.; Santosh, M.; Mao, J.W.; Zhu, Y.F.; Zhao, Y.M.; Li, D.X.; Li, B. The Qiman Tagh Orogen as a window to the crustal evolution in northern Qinghai-Tibet Plateau. Earth-Sci. Rev. 2017, 167, 103–123. [Google Scholar] [CrossRef]
- Zhang, J.Y.; Ma, C.Q.; Xiong, F.H.; Liu, B. Petrogenesis and tectonic significance of the Late Permian-Middle Triassic calc-alkaline granites in the Balong region, eastern Kunlun Orogen, China. Geol. Mag. 2012, 149, 892–908. [Google Scholar] [CrossRef]
- Xia, R.; Wang, C.M.; Qing, M.; Li, W.L.; Carranza, E.J.M.; Guo, X.D.; Ge, L.S.; Zeng, G.Z. Zircon U–Pb dating, geochemistry and Sr–Nd–Pb–Hf–O isotopes for the Nan’getan granodiorites and mafic microgranular enclaves in the East Kunlun Orogen: Record of closure of the Paleo-Tethys. Lithos 2015, 234–235, 47–60. [Google Scholar] [CrossRef]
- Feng, C.Y.; Wang, S.; Li, G.C.; Ma, S.C.; Li, D.S. Middle to Late Triassic granitoids in the Qimantage area, Qinghai Province, China: Chronology, geochemistry and metallogenic significances. Acta Petrol. Sin. 2012, 28, 665–678. [Google Scholar]
- Liu, Y.G.; Chen, Z.G.; Li, W.Y.; Xu, X.H.; Kou, X.; Jia, Q.Z.; Zhang, Z.W.; Liu, F.; Wang, Y.L.; You, M.X. The Cu–Ni mineralization potential of the Kaimuqi mafic-ultramafic complex and the indicators for the magmatic Cu–Ni sulfide deposit exploration in the East Kunlun Orogenic Belt, Northern Qinghai-Tibet Plateau, China. J. Geochem. Explor. 2019, 198, 41–53. [Google Scholar] [CrossRef]
- Wang, Y.B.; Guo, Y.P.; Zeng, Q.D.; Guo, L.X. Petrogenesis and tectonic setting of the Shiduolong skarn Pb–Zn deposit in the East Kunlun Orogenic Belt: Constraints from whole-rock geochemical, zircon U–Pb and Hf isotope analyses. Geol. J. 2018, 53, 1022–1038. [Google Scholar] [CrossRef]
- Li, W.L.; Xia, R.; Qin, M.; Li, C.; Zhang, D.; Sun, H.; Lu, Y.C.; Liu, P.; Zhou, A.B. Re–Os molybdenite ages of the Shenduolong skarn Mo–Pb–Zn deposit and geodynamic framework, Qinghai Province. Rock Miner. Anal. 2014, 33, 900–907. (In Chinese) [Google Scholar]
- Guo, X.Z.; Jia, Q.Z.; Zheng, Y.Y.; Li, J.C.; Li, Y.Z.; Kong, H.L. Re–Os isotopic dating of molybdenite from Reshui molybdenum polymetallic deposit in the East Kunlun and its geological significance. Acta Geol. Sin. 2016, 90, 2818–2829. (In Chinese) [Google Scholar]
- Guo, X.Z.; Jia, Q.Z.; Li, Y.Z.; Li, J.C.; Kong, H.L.; Yang, T.; Wang, Y. Zircon U–Pb geochronology and geochemical characteristics of the Reshui monzogranite in the Eastern Kunlun and their tectonic significances. Bull. Mineral. Petrol. Geochem. 2016, 35, 1318–1328. (In Chinese) [Google Scholar]
- Guo, X.Z.; Jia, Q.Z.; Li, J.C.; Kong, H.L.; Li, Y.Z.; Xu, R.K.; Nan, K.E.W. Geochemical characteristics and geochronology of porphyroid biotite monzogranite from the Reshui Mo polymetallic deposit, East Kunlun Mountains. Geol. China 2016, 43, 1165–1177. (In Chinese) [Google Scholar]
- Pan, G.T.; Wang, L.S.; Li, R.S.; Yuan, S.; Ji, W.H.; Yin, F.G.; Zhang, W.P.; Wang, B.D. Tectonic evolution of the Qinghai-Tibet plateau. J. Asian Earth Sci. 2012, 53, 3–14. [Google Scholar] [CrossRef]
- Li, R.B.; Pei, X.Z.; Li, Z.C.; Liu, Z.Q.; Chen, G.C.; Chen, Y.X.; Wei, F.H.; Gao, J.M.; Liu, C.J.; Pei, L. Geological characteristics of Late Palaeozoic–Mesozoic unconformities and their response to some significant tectonic events in eastern part of Eastern Kunlun. Earth Sci. Front. 2012, 19, 244–254. [Google Scholar]
- Chen, Y.X.; Pei, X.Z.; Li, R.B.; Liu, Z.Q.; Li, Z.C.; Zhang, X.F.; Chen, G.C.; Liu, Z.G.; Ding, S.P.; Guo, J.F. Zircon U–Pb age of Xiaomiao Formation of Proterozoic in the eastern section of the East Kunlun orogenic belt. Geoscience 2011, 25, 510–521. (In Chinese) [Google Scholar]
- Hu, Y.; Niu, Y.L.; Li, J.Y.; Ye, L.; Kong, J.J.; Chen, S.; Zhang, Y.; Zhang, G.R. Petrogenesis and tectonic significance of the late Triassic mafic dikes and felsic volcanic rocks in the East Kunlun Orogenic Belt, Northern Tibet Plateau. Lithos 2016, 245, 205–222. [Google Scholar] [CrossRef] [Green Version]
- Xiong, F.H.; Ma, C.Q.; Zhang, J.Y.; Liu, B. The origin of mafic microgranular enclaves and their host granodiorites from East Kunlun, Northern Qinghai-Tibet Plateau: Implications for magma mixing during subduction of Paleo-Tethyan lithosphere. Mineral. Petrol. 2012, 104, 211–224. [Google Scholar] [CrossRef]
- Yu, M.; Feng, C.Y.; Zhao, Y.M.; Li, D.X. Genesis of post-collisional calc-alkaline and alkaline granitoids in Qiman Tagh, East Kunlun, China. Lithos 2015, 239, 45–59. [Google Scholar] [CrossRef]
- Li, C.S.; Zhang, Z.W.; Li, W.Y.; Wang, Y.L.; Sun, T.; Ripley, E.M. Geochronology, petrology and Hf–S isotope geochemistry of the newly-discovered Xiarihamu magmatic Ni–Cu sulfide deposit in the Qinghai-Tibet plateau, western China. Lithos 2015, 216, 224–240. [Google Scholar] [CrossRef]
- Peng, B.; Sun, F.Y.; Li, B.L.; Wang, G.; Li, S.J.; Zhao, T.F.; Li, L.; Zhi, Y.B. The geochemistry and geochronology of the Xiarihamu II mafic–ultramafic complex, Eastern Kunlun, Qinghai Province, China: Implications for the genesis of magmatic Ni–Cu sulfide deposits. Ore Geol. Rev. 2016, 73, 13–28. [Google Scholar] [CrossRef]
- Huang, J.J.; Wu, J.Y.; Wang, H.T.; Wu, Z.M.; Zhu, L.S.; Qiu, Y.S.; Qian, S.Y.; Zhu, H.; Ma, Y.G.; Zhu, X.Y. Geological Survey and Exploration Report of Reshui Molybdenum Polymetallic Deposit in Dulan County, Qinghai Province; 5635-Z01; Zhejiang Geology And Mineral Resources Institute: Hangzhou, China, 2012; pp. 1–80. [Google Scholar]
- Bodnar, R.J. A method of calculating fluid inclusion volumes based on vapor bubble diameters and P-V-T-X properties of inclusion fluids. Econ. Geol. 1983, 78, 535–542. [Google Scholar] [CrossRef]
- Liu, B.; Duan, G.X. The density and isochoric formulae for NaCl–H2O fluid inclusions (salinity ≤25 wt %) and their applications. Acta Mineral. Sin. 1987, 7, 345–352. (In Chinese) [Google Scholar]
- Liu, B. Density and isochoric formulae for NaCl–H2O inclusions with medium and high salinity and their applications. Geol. Rev. 2001, 47, 617–622. (In Chinese) [Google Scholar]
- Naldrett, A.J. Secular variation of magmatic sulfide deposits and their source magmas. Econ. Geol. 2010, 105, 669–688. [Google Scholar] [CrossRef]
- Proffett, J.M. High Cu grades in porphyry Cu deposits and their relationship to emplacement depth of magmatic sources. Geology 2009, 37, 675–678. [Google Scholar] [CrossRef]
- De Hoog, J.; Hattori, K.H.; Hoblitt, R.P. Oxidized sulfur-rich mafic magma at Mount Pinatubo, Philippines. In Contributions to Mineralogy and Petrology; Hoefs, J., Ed.; Springer: Berlin, Germany, 2004; Volume 146, pp. 750–761. [Google Scholar]
- Chen, Y.J.; Wang, P.; Li, N.; Yang, Y.F.; Pirajno, F. The collision-type porphyry Mo deposits in Dabie Shan, China. Ore Geol. Rev. 2016, 81, 405–430. [Google Scholar] [CrossRef]
- Richards, S.W.; Holm, R.J. Tectonic preconditioning and the formation of giant porphyry deposits. In Tectonics Metallogeny, and Discovery the North American Cordillera and Similar Accretionary Settings; Colpron, M., Bissig, T., Rusk, B.G., Thompson, J.F.H., Eds.; Society of Economic Geologists: Littleton, CO, USA, 2013; pp. 265–275. [Google Scholar]
- Mao, J.W.; Xie, G.Q.; Duan, C.; Pirajno, F.; Ishiyama, D.; Chen, Y.C. A tectono-genetic model for porphyry-skarn-stratabound Cu–Au–Mo–Fe and magnetite-apatite deposits along the Middle-Lower Yangtze River Valley, Eastern China. Ore Geol. Rev. 2011, 43, 294–314. [Google Scholar] [CrossRef]
- Zhang, Z.W.; Yang, X.Y.; Dong, Y.; Zhu, B.Q.; Chen, D.F. Molybdenum deposits in the eastern Qinling, central China: Constraints on the geodynamics. Int. Geol. Rev. 2011, 53, 261–290. [Google Scholar] [CrossRef]
- Ma, C.Q.; Xiong, F.H.; Yin, S.; Wang, L.X.; Gao, K. Intensity and cyclicity of orogenic magmatism: An example from a Paleo-Tethyan granitoid batholith, Eastern Kunlun, northern Qinghai-Tibetan Plateau. Acta Petrol. Sin. 2015, 31, 3555–3568. (In Chinese) [Google Scholar]
- Feng, C.Y.; Li, D.S.; Wu, Z.S.; Li, J.H.; Zhang, Z.Y.; Zhang, A.K.; Shu, X.F.; Su, S.S. Major types, time-space distribution and metallogeneses of polymetallic deposits in the Qimantage metallogenic belt, Eastern Kunlun Area. Northwestern Geol. 2010, 43, 10–17. (In Chinese) [Google Scholar]
- Xu, Q.L.; Sun, F.Y.; Li, B.L.; Qian, Y.; Li, L.; Yang, Y.Q. Geochronological dating, geochemical characteristics and tectonic setting of the granite-porphyry in the Mohexiala silver polymetallic deposit, Eastern Kunlun Orogenic Belt. Geotecton. Metallog. 2014, 38, 421–433. (In Chinese) [Google Scholar]
- Li, S.J.; Sun, F.Y.; Feng, C.Y.; Liu, Z.H.; Zhao, J.W.; Li, Y.C.; Wang, S. Geochronological study on Yazigou polymetallic deposit in Eastern Kunlun, Qinghai Province. Acta Geol. Sin. 2008, 82, 949–955. (In Chinese) [Google Scholar]
- He, S.Y.; Li, D.S.; Li, L.L.; Qi, L.Y.; He, S.F. Re–Os age of molybdenite from the Yazigou Copper (Molybdenum) mineralized area in Eastern Kunlun of Qinghai Province, and its geological significance. Geotecton. Metallog. 2009, 33, 236–242. (In Chinese) [Google Scholar]
- Chen, J.; Xie, Z.Y.; Li, B.; Li, S.P.; Tan, S.X.; Ren, H.; Zhang, Q.M. Geological and gechemical characteristics of the ore-bearing intrusions from the Lalingzaohuo Mo polymetallic deposit and its metallogenic significance. Geol. Explor. 2013, 49, 813–824. (In Chinese) [Google Scholar]
- Wang, F.C.; Chen, J.; Xie, Z.Y.; Li, S.P.; Tan, S.X.; Zhang, Y.B.; Wang, T. Geological features and Re–Os isotopic dating of the Lalingzaohuo molybdenum polymetallic deposit in East Kunlun. Geol. China 2013, 40, 1209–1217. (In Chinese) [Google Scholar]
- Xu, Q.L. Study on Metallogenesis of porphyry deposits in Eastern Kunlun orogenic Belt, Qinghai Province. Ph.D. Thesis, Jilin University, Changchun, China, 2014. [Google Scholar]
- Xia, R.; Qin, M.; Wang, C.M.; Li, W.L. The genesis of the ore-bearing porphyry of the Tuoketuo porphyry Cu–Au (Mo) deposit in the East Kunlun, Qinghai Province: Constraints from zircon U–Pb geochronological and geochemistry. J. Jilin Univ. (Earth Sci. Ed.) 2014, 44, 1502–1524. (In Chinese) [Google Scholar]
- Liu, J.N.; Feng, C.Y.; Qi, F.; Li, G.C.; Ma, S.S.; Xiao, Y. SIMS zircon U–Pb dating and fluid inclusion studies of Xiadeboli Cu–Mo ore district in Dulan County, Qinghai Province, China. Acta Petrol. Sin. 2012, 28, 679–690. (In Chinese) [Google Scholar]
- Yang, Y.Q.; Li, B.L.; Xu, Q.L.; Zhang, B.S. Zircon U–Pb ages and its geological significance of the monzonitic granite in the Aikengdelesite, Eastern Kunlun. Northwestern Geol. 2013, 46, 56–62. (In Chinese) [Google Scholar]
- Audétat, A.; Li, W. The genesis of Climax-type porphyry Mo deposits: Insights from fluid inclusions and melt inclusions. Ore Geol. Rev. 2017, 88, 436–460. [Google Scholar] [CrossRef]
- Chen, Y.J.; Zhang, C.; Wang, P.; Pirajno, F.; Li, N. The Mo deposits of Northeast China: A powerful indicator of tectonic settings and associated evolutionary trends. Ore Geol. Rev. 2017, 81, 602–640. [Google Scholar] [CrossRef]
- Richards, J.P. Tectono-magmatic precursors for porphyry Cu–(Mo–Au) deposit formation. Econ. Geol. 2003, 98, 1515–1533. [Google Scholar] [CrossRef]
- Pirajno, F. The Geology and Tectonic Settings of China’s Mineral Deposits; Springer Science + Business Media: Dordrecht, The Netherlands, 2013. [Google Scholar]
- Wang, G.R.; Wu, G.; Xu, L.Q.; Li, X.Z.; Zhang, T.; Quan, Z.X.; Wu, H.; Li, T.G.; Liu, J.; Chen, Y.C. Molybdenite Re–Os age, H–O–C–S–Pb isotopes, and fluid inclusion study of the Caosiyao porphyry Mo deposit in Inner Mongolia, China. Ore Geol. Rev. 2017, 81, 728–744. [Google Scholar] [CrossRef]
- Liu, J.; Mao, J.W.; Wu, G.; Wang, F.; Luo, D.F.; Hu, Y.Q.; Li, T.G. Fluid inclusions and H–O–S–Pb isotope systematics of the Chalukou giant porphyry Mo deposit, Heilongjiang Province, China. Ore Geol. Rev. 2014, 59, 83–96. [Google Scholar] [CrossRef]
- Pirajno, F. Hydrothermal Processes and Mineral Systems; Springer Science + Business Media: Dordrecht, The Netherlands, 2009. [Google Scholar]
- Diamond, L.W. Review of the systematics of CO2–H2O fluid inclusions. Lithos 2001, 55, 69–99. [Google Scholar] [CrossRef]
- Ulrich, T.; Günther, D.; Heinrich, C.A. Gold concentrations of magmatic brines and the metal budget of porphyry copper deposits. Nature 1999, 399, 676–679. [Google Scholar] [CrossRef]
- Zhang, D.H.; Audétat, A. What caused the formation of the giant Bingham Canyon porphyry Cu-Mo-Au deposit? Insights from melt inclusions and magmatic sulfides. Econ. Geol. 2017, 112, 221–244. [Google Scholar] [CrossRef]
- Zhang, F.F.; Wang, Y.H.; Liu, J.J. Fluid inclusions and H–O–S–Pb isotope systematics of the Baishan porphyry Mo deposit in Eastern Tianshan, China. Ore Geol. Rev. 2016, 78, 409–423. [Google Scholar] [CrossRef]
- Lopes, A.A.C.; Moura, M.A. The Tocantinzinho Paleoproterozoic porphyry-style gold deposit, Tapajós Mineral Province (Brazil): Geology, petrology and fluid inclusion evidence for ore-forming processes. Minerals 2019, 9, 29. [Google Scholar] [CrossRef]
- Wang, Y.F.; Chen, H.Y.; Baker, M.J.; Han, J.S.; Xiao, B.; Yang, J.T.; Jourdan, F. Multiple mineralization events of the Paleozoic Tuwu porphyry copper deposit, Eastern Tianshan: Evidence from geology, fluid inclusions, sulfur isotopes, and geochronology. In Mineralium Deposita; Hu, R., Ed.; Springer: Berlin, Germany, 2018; pp. 1–24. [Google Scholar]
- Cao, M.J.; Qin, K.Z.; Li, G.M.; Evans, N.J.; Jin, L.Y. Abiogenic Fischer–Tropsch synthesis of methane at the Baogutu reduced porphyry copper deposit, western Junggar, NW-China. Geochim. Cosmochim. Acta 2014, 141, 179–198. [Google Scholar] [CrossRef]
- Zhong, J.; Chen, Y.J.; Pirajno, F.; Chen, J.; Li, J.; Qi, J.P.; Li, N. Geology, geochronology, fluid inclusion and H–O isotope geochemistry of the Luoboling porphyry Cu–Mo deposit, Zijinshan Orefield, Fujian Province, China. Ore Geol. Rev. 2014, 57, 61–77. [Google Scholar] [CrossRef]
- Kim, H.; Yang, K.; Lentz, D.; Jeong, H.; Kil, Y.; Hwang, J.; Park, S. Low-salinity liquid-rich or vapor-like fluids in a porphyry-type Mo deposit, South Korea. Can. Mineral. 2016, 54, 715–736. [Google Scholar] [CrossRef]
- Drummond, S.E.; Ohmoto, H. Chemical evolution and mineral deposition in boiling hydrothermal systems. Econ. Geol. 1985, 80, 126–147. [Google Scholar] [CrossRef]
- Yang, Y.F.; Li, N.; Chen, Y.J. Fluid inclusion study of the Nannihu giant porphyry Mo–W deposit, Henan Province, China: Implications for the nature of porphyry ore-fluid systems formed in a continental collision setting. Ore Geol. Rev. 2012, 46, 83–94. [Google Scholar] [CrossRef]
- Yang, Y.F.; Chen, Y.J.; Li, N.; Mi, M.; Xu, Y.L.; Li, F.L.; Wan, S.Q. Fluid inclusion and isotope geochemistry of the Qian’echong giant porphyry Mo deposit, Dabie Shan, China: A case of NaCl-poor, CO2-rich fluid systems. J. Geochem. Explor. 2013, 124, 1–13. [Google Scholar] [CrossRef]
- Li, N.; Ulrich, T.; Chen, Y.; Thomsen, T.B.; Pease, V.; Pirajno, F. Fluid evolution of the Yuchiling porphyry Mo deposit, East Qinling, China. Ore Geol. Rev. 2012, 48, 442–459. [Google Scholar] [CrossRef]
- Chen, Y.J.; Wang, Y. Fluid inclusion study of the Tangjiaping Mo deposit, Dabie Shan, Henan Province: Implications for the nature of the porphyry systems of post-collisional tectonic settings. Int. Geol. Rev. 2011, 53, 635–655. [Google Scholar] [CrossRef]
- Ni, P.; Wang, G.G.; Yu, W.; Chen, H.; Jiang, L.L.; Wang, B.H.; Zhang, H.D.; Xu, Y.F. Evidence of fluid inclusions for two stages of fluid boiling in the formation of the giant Shapinggou porphyry Mo deposit, Dabie Orogen, Central China. Ore Geol. Rev. 2015, 65, 1078–1094. [Google Scholar] [CrossRef]
- Yang, Y.F.; Chen, Y.J.; Pirajno, F.; Li, N. Evolution of ore fluids in the Donggou giant porphyry Mo system, East Qinling, China, a new type of porphyry Mo deposit: Evidence from fluid inclusion and H–O isotope systematics. Ore Geol. Rev. 2015, 65, 148–164. [Google Scholar] [CrossRef]
- Mao, S.; Duan, Z.; Hu, J.; Zhang, D. A model for single-phase PVTx properties of CO2–CH4–C2H6–N2–H2O–NaCl fluid mixtures from 273 to 1273 K and from 1 to 5000 bar. Chem. Geol. 2010, 275, 148–160. [Google Scholar] [CrossRef]
- Nwe, Y.Y.; Morteani, G. Fluid evolution in the H2O–CH4–CO2–NaCl system during emerald mineralization at Gravelotte, Murchison greenstone belt, Northeast Transvaal, South Africa. Geochim. Cosmochim. Acta 1993, 57, 89–103. [Google Scholar]
- Brown, P.E.; Lamb, W.M. PVT properties of fluids in the system H2O ± CO2 ± NaCl: New graphical presentations and implications for fluid inclusion studies. Geochim. Cosmochim. Acta 1989, 53, 1209–1221. [Google Scholar] [CrossRef]
- Seedorff, E.; Einaudi, M.T. Henderson porphyry molybdenum system, Colorado: II. Decoupling of introduction and deposition of metals during geochemical evolution of hydrothermal fluids. Econ. Geol. 2004, 99, 39–72. [Google Scholar] [CrossRef]
- Chen, X.D.; Ye, H.S.; Mao, J.W.; Wang, H.; Chu, S.T.; Cheng, G.X.; Liu, Y.W. Characteristics of ore-forming fluids of the Leimengou porphyry Mo deposit and its geological significance, West Henan province. Acta Geol. Sin. 2011, 85, 1629–1643. (In Chinese) [Google Scholar]
- Gao, S.; Xu, H.; Quan, S.L.; Zang, Y.Q.; Wang, T. Geology, hydrothermal fluids, H–O–S–Pb isotopes, and Rb–Sr geochronology of the Daxintun orogenic gold deposit in Heilongjiang province, NE China. Ore Geol. Rev. 2018, 92, 569–587. [Google Scholar] [CrossRef]
- Keith, M.; Haase, K.M.; Klemd, R.; Krumm, S.; Strauss, H. Systematic variations of trace element and sulfur isotope compositions in pyrite with stratigraphic depth in the Skouriotissa volcanic-hosted massive sulfide deposit, Troodos ophiolite, Cyprus. Chem. Geol. 2016, 423, 7–18. [Google Scholar] [CrossRef]
- Zhong, R.; Brugger, J.; Chen, Y.; Li, W. Contrasting regimes of Cu, Zn and Pb transport in ore-forming hydrothermal fluids. Chem. Geol. 2015, 395, 154–164. [Google Scholar] [CrossRef]
- Ohmoto, H. Stable isotope geochemistry of ore deposits. Rev. Mineral. Geochem. 1986, 16, 491–559. [Google Scholar]
- Sun, X.; Zheng, Y.Y.; Pirajno, F.; McCuaig, T.C.; Yu, M.; Xia, S.L.; Song, Q.J.; Chang, H.F. Geology, S–Pb isotopes, and 40Ar/39Ar geochronology of the Zhaxikang Sb–Pb–Zn–Ag deposit in Southern Tibet: Implications for multiple mineralization events at Zhaxikang. Miner. Depos. 2018, 53, 435–458. [Google Scholar] [CrossRef]
- Ding, Q.F.; Yan, W.; Zhang, B.L. Sulfur-and lead-isotope geochemistry of the Balugou Cu–Pb–Zn skarn deposit in the Wulonggou area in the eastern Kunlun Orogen, NW China. J. Earth Sci. 2016, 27, 740–750. [Google Scholar] [CrossRef]
- Jiao, Q.Q.; Wang, L.X.; Deng, T.; Xu, D.R.; Chen, G.W.; Yu, D.H.; Ye, T.W.; Gao, Y.W. Origin of the ore-forming fluids and metals of the Hetai goldfield in Guangdong Province of South China: Constraints from C–H–O–S–Pb–He–Ar isotopes. Ore Geol. Rev. 2017, 88, 674–689. [Google Scholar] [CrossRef]
- Wu, K.X.; Hu, R.Z.; Bi, X.W.; Peng, J.T.; Tang, Q.L. Ore lead isotopes as a tracer for ore-forming material sources: A review. Geol. -Geochem. 2002, 30, 73–81. [Google Scholar]
- Schiano, P.; Birck, J.; Allègre, C.J. Osmium-strontium-neodymium-lead isotopic covariations in mid-ocean ridge basalt glasses and the heterogeneity of the upper mantle. Earth Planet. Sci. Lett. 1997, 150, 363–379. [Google Scholar] [CrossRef]
- Goldfarb, R.J.; Groves, D.I. Orogenic gold: Common or evolving fluid and metal sources through time. Lithos 2015, 233, 2–26. [Google Scholar] [CrossRef]
- Zartman, R.E.; Doe, B.R. Plumbotectonics—the model. Tectonophysics 1981, 75, 135–162. [Google Scholar] [CrossRef]
- Barnes, H.L. Geochemistry of Hydrothermal Ore Deposits; Wiley: Hoboken, NJ, USA, 1979; pp. 22–70. [Google Scholar]
- Gao, Y.; Mao, J.W.; Ye, H.S.; Li, Y.F. Origins of ore-forming fluid and material of the quartz–vein type Mo deposits in the East Qinling–Dabie molybdenum belt: A case study of the Qianfanling Mo deposit. J. Geochem. Explor. 2018, 185, 52–63. [Google Scholar] [CrossRef]
- Simon, I.; Jung, S.; Romer, R.L.; Garbe-Schönberg, D.; Berndt, J. Geochemical and Nd–Sr–Pb isotope characteristics of synorogenic lower crust-derived granodiorites (Central Damara orogen, Namibia). Lithos 2017, 274, 397–411. [Google Scholar] [CrossRef]
- Li, H.Y.; Ye, H.S.; Wang, X.X.; Lei, Y.; Wang, X.Y. Geology and ore fluid geochemistry of the Jinduicheng porphyry molybdenum deposit, East Qinling, China. J. Asian Earth Sci. 2014, 79, 641–654. [Google Scholar] [CrossRef]
- Stein, H.J.; Hannah, J.L. Movement and origin of ore fluids in Climax-type systems. Geology 1985, 13, 469–474. [Google Scholar] [CrossRef]
Figure 1.
Regional geological map of the East Kunlun Orogenic Belt (EKOB). (a) The location of EKOB in the China; (b) the geotectonic units of EKOB in the Tibetan Plateau; (c) simplified geological map in EKOB (modified from Xia et al. [9]).
Figure 1.
Regional geological map of the East Kunlun Orogenic Belt (EKOB). (a) The location of EKOB in the China; (b) the geotectonic units of EKOB in the Tibetan Plateau; (c) simplified geological map in EKOB (modified from Xia et al. [9]).

Figure 2.
Geological map of the Reshui Mo deposit, East Kunlun. (a) Geological sketch map of the Reshui Mo deposit (after Guo et al. [23]); (b) cross section along No. 8 exploration lines through the Reshui porphyry Mo deposit (after [34]).

Figure 3.
Representative field photos and photomicrographs of ore rocks. (a,b) Disseminated ore structure in stage 1; (c) quartz–molybdenite in stage 2; (d,e) molybdenite vein structure; (f) banded structures of molybdenite, pyrite and chalcopyrite in stage 3; (g) stage 1 and stage 2 relationship; (h) photomicrograph of mineralization of granite; (i) photos of mineralization of stage 3; (j) photomicrographs of mineralization of stage 2; (k,l) photomicrographs of mineralization of stage 3; Ccp—chalcopyrite; Mo—molybdenite; Py—pyrite.

Figure 4.
Metallogenic stages and mineral paragenesis in the Reshui Mo deposit.

Figure 5.
Photomicrographs of fluid inclusions in Reshui Mo deposit. (a) Solid-phase or mineral inclusions; (b) gas-rich phase inclusion; (c) liquid-rich phase inclusion; (d) W-type and C-type inclusions; (e) S- and W-type inclusions; (f) S-type inclusions together with liquid-rich phase inclusions; (g) liquid-rich phase inclusions; (h) group of irregularly shaped inclusions; (i) inclusions with isolated distribution; (j) pure gas-phase inclusion; (k) irregular and S-type inclusions; (l) phenomenon of bottleneck inclusion; L—liquid water; V—gas-phase water; LCO2—liquid CO2; VCO2 —gas-phase CO2; Op—opaque metal minerals; S—rock salt content.

Figure 6.
Histograms of homogenization temperatures and salinities of fluid inclusions in different stages of quartz in the Reshui Mo deposit.
Figure 6.
Histograms of homogenization temperatures and salinities of fluid inclusions in different stages of quartz in the Reshui Mo deposit.

Figure 7.
Laser Raman spectra of fluid inclusions from the Reshui Mo deposit.

Figure 8.
W(NaCleqv)-T(°C) phase diagram of fluid inclusions in the Reshui Mo deposit.

Figure 9.
The estimated trapping-pressure–temperature diagram of the Reshui Mo deposit. Isochores of the fluid inclusions (FIs) are calculated using the Flincor software.
Figure 9.
The estimated trapping-pressure–temperature diagram of the Reshui Mo deposit. Isochores of the fluid inclusions (FIs) are calculated using the Flincor software.

Figure 10.
Histogram of sulfur isotopic compositions from the Reshui Mo deposit. Data sources: data of the Chalukou deposits in the Tianshan-Xingmeng orogenic belt are from Liu et al. [61]; data of the Qian’echong, Jinduicheng, Tangjiaping, and Nannihu deposits in the Qinling–Dabie Mo belt are from Yang et al. [74]; Li et al. [98] and Zhang et al. [44]; data of the Climax and Henderson deposits in western America are from Stein et al. [99]. (a) Histograms of δ34S values in the Reshui Mo deposit; (b) Comparison of the Reshui Mo deposit with other porphyry Mo deposits.

Figure 11.
Diagram of lead isotopic compositions of the Reshui Mo deposit. The base map is from Zartman et al. [94]. (a) Plots of 207Pb/204Pb vs. 206Pb/204Pb; (b) Plots of 208Pb/204Pb vs. 206Pb/204Pb.
Figure 11.
Diagram of lead isotopic compositions of the Reshui Mo deposit. The base map is from Zartman et al. [94]. (a) Plots of 207Pb/204Pb vs. 206Pb/204Pb; (b) Plots of 208Pb/204Pb vs. 206Pb/204Pb.


Table 1.
Microthermometric data of fluid inclusions from the Reshui Mo deposit.
| Stage | Stage 1 | Stage 2 | Stage 3 | |||
|---|---|---|---|---|---|---|
| Type | W | C | W | S | C | W |
| Number | 78 | 4 | 51 | 7 | 12 | 31 |
| Tm-ice(°C) | −5.2–−2.8 | −4.2–−2.6 | −2.1–−2.8 | |||
| Tm-CO2/°C | −58.3–57.6 | −59.4–−56.9 | ||||
| Tm-cla/°C | 6.5–6.8 | 5.3–6.1 | ||||
| Th-CO2/°C | 29.3–30.8 | 28.6–31.2 | ||||
| Th(°C) | 282.3–376.8 | 327.4–352.3 | 238.7–312.6 | 335–352.6 | 261.2–283.1 | 198.3–228.9 |
| Ts(°C) | 335–352.6 | |||||
| Salinity (%NaCl eq.) | 4.65–8.14 | 6.12–6.63 | 4.34–6.74 | 39.04–42.64 | 7.31–8.61 | 3.55–4.65 |
| Density (g/cm3) | 0.63–0.79 | 0.68–0.73 | 0.74–0.86 | 1.11–1.13 | 0.82–0.85 | 0.86–0.9 |
Abbreviation: Tm-ice: final ice melting temperature; Tm-CO2: melting temperature of solid CO2; Tm-cla: temperature of CO2-clathrate dissociation; Th-CO2: homogenization temperature of CO2; Th: total homogenization temperature; Ts: solid homogenization temperature.
Table 2.
Sulfur and lead isotopic compositions of sulfides from the Reshui Mo deposit.
| Sample Number | Mineral | Mineralization Stage | δ34SV-CDT (‰) | 206Pb/204Pb | 208Pb/204Pb | 207Pb/204Pb | |||
|---|---|---|---|---|---|---|---|---|---|
| 15RSP1-SPb1 | molybdenite | 2 | 4.9 | 18.578 | 0.001 | 38.292 | 0.002 | 15.595 | 0.001 |
| 15RSP2-SPb1 | molybdenite | 2 | 5.3 | - | - | - | - | - | - |
| 14RSTWS01 | chalcopyrite | 3 | 5.3 | 18.356 | 0.003 | 38.406 | 0.007 | 15.602 | 0.003 |
| 14RSTWS02 | chalcopyrite | 3 | 5.1 | 18.355 | 0.003 | 38.354 | 0.006 | 15.589 | 0.002 |
| 14RSTWS05 | chalcopyrite | 3 | 5.4 | 18.401 | 0.004 | 38.509 | 0.011 | 15.629 | 0.004 |
| 14RSTWS07 | pyrite | 3 | 5.6 | 18.374 | 0.005 | 38.431 | 0.011 | 15.617 | 0.005 |
| 14RSTWS08 | pyrite | 3 | 5.7 | 18.316 | 0.002 | 38.460 | 0.003 | 15.640 | 0.001 |
| 14RSTWS09 | pyrite | 3 | 5.8 | 18.210 | 0.002 | 38.298 | 0.004 | 15.636 | 0.002 |
| 15RSP1-SPb2 | molybdenite | 3 | 5.5 | - | - | - | - | - | - |
| 15RSP2-SPb2 | molybdenite | 3 | 5.1 | 18.786 | 0.002 | 39.126 | 0.003 | 15.723 | 0.001 |
Table 3.
Age of porphyry deposits from East Kunlun.
| Deposit | Mineralization System | Samples | Age (Ma) | Analytical Method | Reference |
|---|---|---|---|---|---|
| Changshan | Porphyry Mo | Zircon | 220 ± 1 | SHRIMP U–Pb | [41] |
| Molybdenite | 218,228 | Re–Os | [41] | ||
| Mohexiala | Porphyry Ag–Pb–Zn | Zircon | 222 ± 1 | LA-ICP-MS U–Pb | [42] |
| Yazigou | Porphyry Cu–Mo | Zircon | 224.0 ± 1.6 | SHRIMP U–Pb | [43] |
| Molybdenite | 224.7 ± 3.4 | Re–Os | [44] | ||
| Lalingzaohuo | Porphyry Mo | Zircon | 242.6 ± 3.4 | LA-ICP-MS U–Pb | [45] |
| Zircon | 226 ± 1 | LA-ICP-MS U–Pb | [45] | ||
| Molybdenite | 240.8 ± 4.0 | Re–Os | [46] | ||
| Molybdenite | 214.5 ± 4.9 | Re–Os | [46] | ||
| Halongxiuma | Porphyry W–Mo | Zircon | 230 ± 1 | LA-ICP-MS U–Pb | [47] |
| Tuoketuo | Porphyry Cu–Au(Mo) | Zircon | 232.5 ± 0.9 | LA-ICP-MS U–Pb | [48] |
| Zircon | 232.6 ± 1.2 | LA-ICP-MS U–Pb | [48] | ||
| Reshui | Porphyry Mo | Molybdenite | 230.2 ± 2.5 | Re–Os | [23] |
| Zircon | 231 ± 1 | LA-ICP-MS | [24] | ||
| Zircon | 230.9 ± 1.4 | LA-ICP-MS | [25] | ||
| Xiadeboli | Porphyry Cu–Mo | Zircon | 244.2 ± 2.1 | SIMS U–Pb | [49] |
| Aikengdelisite | Porphyry Mo–Cu | Zircon | 248.4 ± 0.83 | LA-ICPMS U–Pb | [50] |
© 2019 by the authors. Licensee MDPI, Basel, Switzerland. This article is an open access article distributed under the terms and conditions of the Creative Commons Attribution (CC BY) license (http://creativecommons.org/licenses/by/4.0/).
Share and Cite
MDPI and ACS Style
Guo, X.; Lü, X.; Jia, Q.; Li, J.; Kong, H. Fluid Inclusions and S–Pb Isotopes of the Reshui Porphyry Mo Deposit in East Kunlun, Qinghai Province, China. Minerals 2019, 9, 547. https://doi.org/10.3390/min9090547
AMA Style
Guo X, Lü X, Jia Q, Li J, Kong H. Fluid Inclusions and S–Pb Isotopes of the Reshui Porphyry Mo Deposit in East Kunlun, Qinghai Province, China. Minerals. 2019; 9(9):547. https://doi.org/10.3390/min9090547
Chicago/Turabian StyleGuo, Xianzheng, Xinbiao Lü, Qunzi Jia, Jinchao Li, and Huilei Kong. 2019. "Fluid Inclusions and S–Pb Isotopes of the Reshui Porphyry Mo Deposit in East Kunlun, Qinghai Province, China" Minerals 9, no. 9: 547. https://doi.org/10.3390/min9090547
Note that from the first issue of 2016, this journal uses article numbers instead of page numbers. See further details here.