Spatial Distributions and Risk Assessment of the Natural Radionuclides in the Granitic Rocks from the Eastern Desert, Egypt


1
Physics Department, Faculty of Science, Assiut University, Assiut 71516, Egypt
2
Physics Department, Faculty of Science, New Valley University, El-Kharga 72511, Egypt
3
Geology Department, Faculty of Science, Assiut University, Assiut 71516, Egypt
*
Author to whom correspondence should be addressed.
Minerals 2019, 9(7), 386; https://doi.org/10.3390/min9070386
Submission received: 12 May 2019
/
Revised: 15 June 2019
/
Accepted: 23 June 2019
/
Published: 26 June 2019
Abstract
:This paper investigates the distribution of four natural radioisotopes 238U, 226Ra, 232Th and 40K in one hundred twenty-five granitic samples covering sixteen mountainous areas situated at the northern, central and southern parts of the Eastern Desert of Egypt (EDE). The concentrations of the examined radioisotopes in the collected samples were recognized utilizing a HPGe detector based gamma spectrometry. The average concentrations of these radioisotopes were higher when compared with the worldwide reference values. The radiation risk indicators including the radium equivalent activity index (Raeq), external and internal hazard indicators (Hex and Hin), external and internal level indicators (Iα and Iγ), absorbed dose rate (ADR), annual effective dose rate (AEDR), annual gonadal dosage equivalent (AGDE), and excess lifetime cancer risk (ELCR), associated with these radioisotopes have been calculated and compared with their recommended global values and safety limits. These indicators showed that the granites from most studied areas exceeded the universal standards pointing to the difficulty of using them as building materials. This study together with future investigations will serve to develop an essential database for future environmental monitoring surveys.
1. Introduction
All living organisms are exposed every day to natural radiation within the variety of particles and rays from cosmic sources and background radiation from Earth materials. Most of the natural radioactivity in rocks is caused by 238U, 235U, 232Th, and to a lesser extent 40K. Such radiation is a function of the geological conditions [1], such as rock type. The former has been estimated in numerous parts of the world using variety of techniques assessing the absorbed dosage rates.
Granitic rocks and their derived industrial products usually contain a particular amount of terrestrial radioisotopes at different concentrations based on their origin. Since granites are utilized in dwellings as decorative and building materials, it is important to measure the concentration levels of natural occurring radionuclides (e.g., 238U, 232Th and their progenies in addition to 40K) in these rocks for evaluating the radiological risks to the population. Furthermore, the concentration level distribution measurements of radionuclides will be useful in establishing standards for management and usage of these rocks [2]. Some studies were performed to consider the natural radioactivity levels (238U, 226Ra, 232Th, and 40K) and the radiological risks parameters in the granitic rocks from the Eastern Desert of Egypt [3,4,5,6].
The natural radionuclide concentrations in the granitic rocks collected from Gebel G. Gattar (North Eastern Desert) were reported by El-Dine [7]. El-Taher [8] studied the granitic rocks used as building stone from Wadi El Allaqi and found that the activity concentrations of 226Ra, 232Th and 40K, were below the worldwide reference values. Uosif and Abdel-Salam [9] have assessed the external radiological impact in the granites of G. Ras Barud (Central Eastern Desert). The concentrations of the major, minor and rare earth elements measurements, besides the natural radionuclides of uranium and thorium in granites collected from four localities in Aswan area (Wadi El-Allaqi, G. Ibrahim Pacha, El-Shalal and Seyhel Island) were documented by El-Taher [10] using neutron activation analysis (NAA). Issa et al. [11] investigated the petrographic and geochemical characteristics in addition to evaluating the natural radionuclide concentrations of the granitic rocks gathered from five areas, namely: Abu Ziran (Central ED), G. El Maesala (Aswan), Wadi Allaqi, (G. Abu Marw), G. Haymur and G. Um Shelman (South ED).
In this paper, we attempt to add new radiometric data on granitic rocks from several mountainous areas not previously investigated, in order to develop a reference scheme for the level of environmental radioactivity of the Eastern Desert of Egypt. Likewise including, a) the perspective for using these rocks as building materials, b) the possibility to establish granite quarries in these areas, and c) the potential radiological hazard to individuals’ health according to United Nations Scientific Committee on the Effects of Atomic Radiation (UNSCEAR) data.
2. Study Area
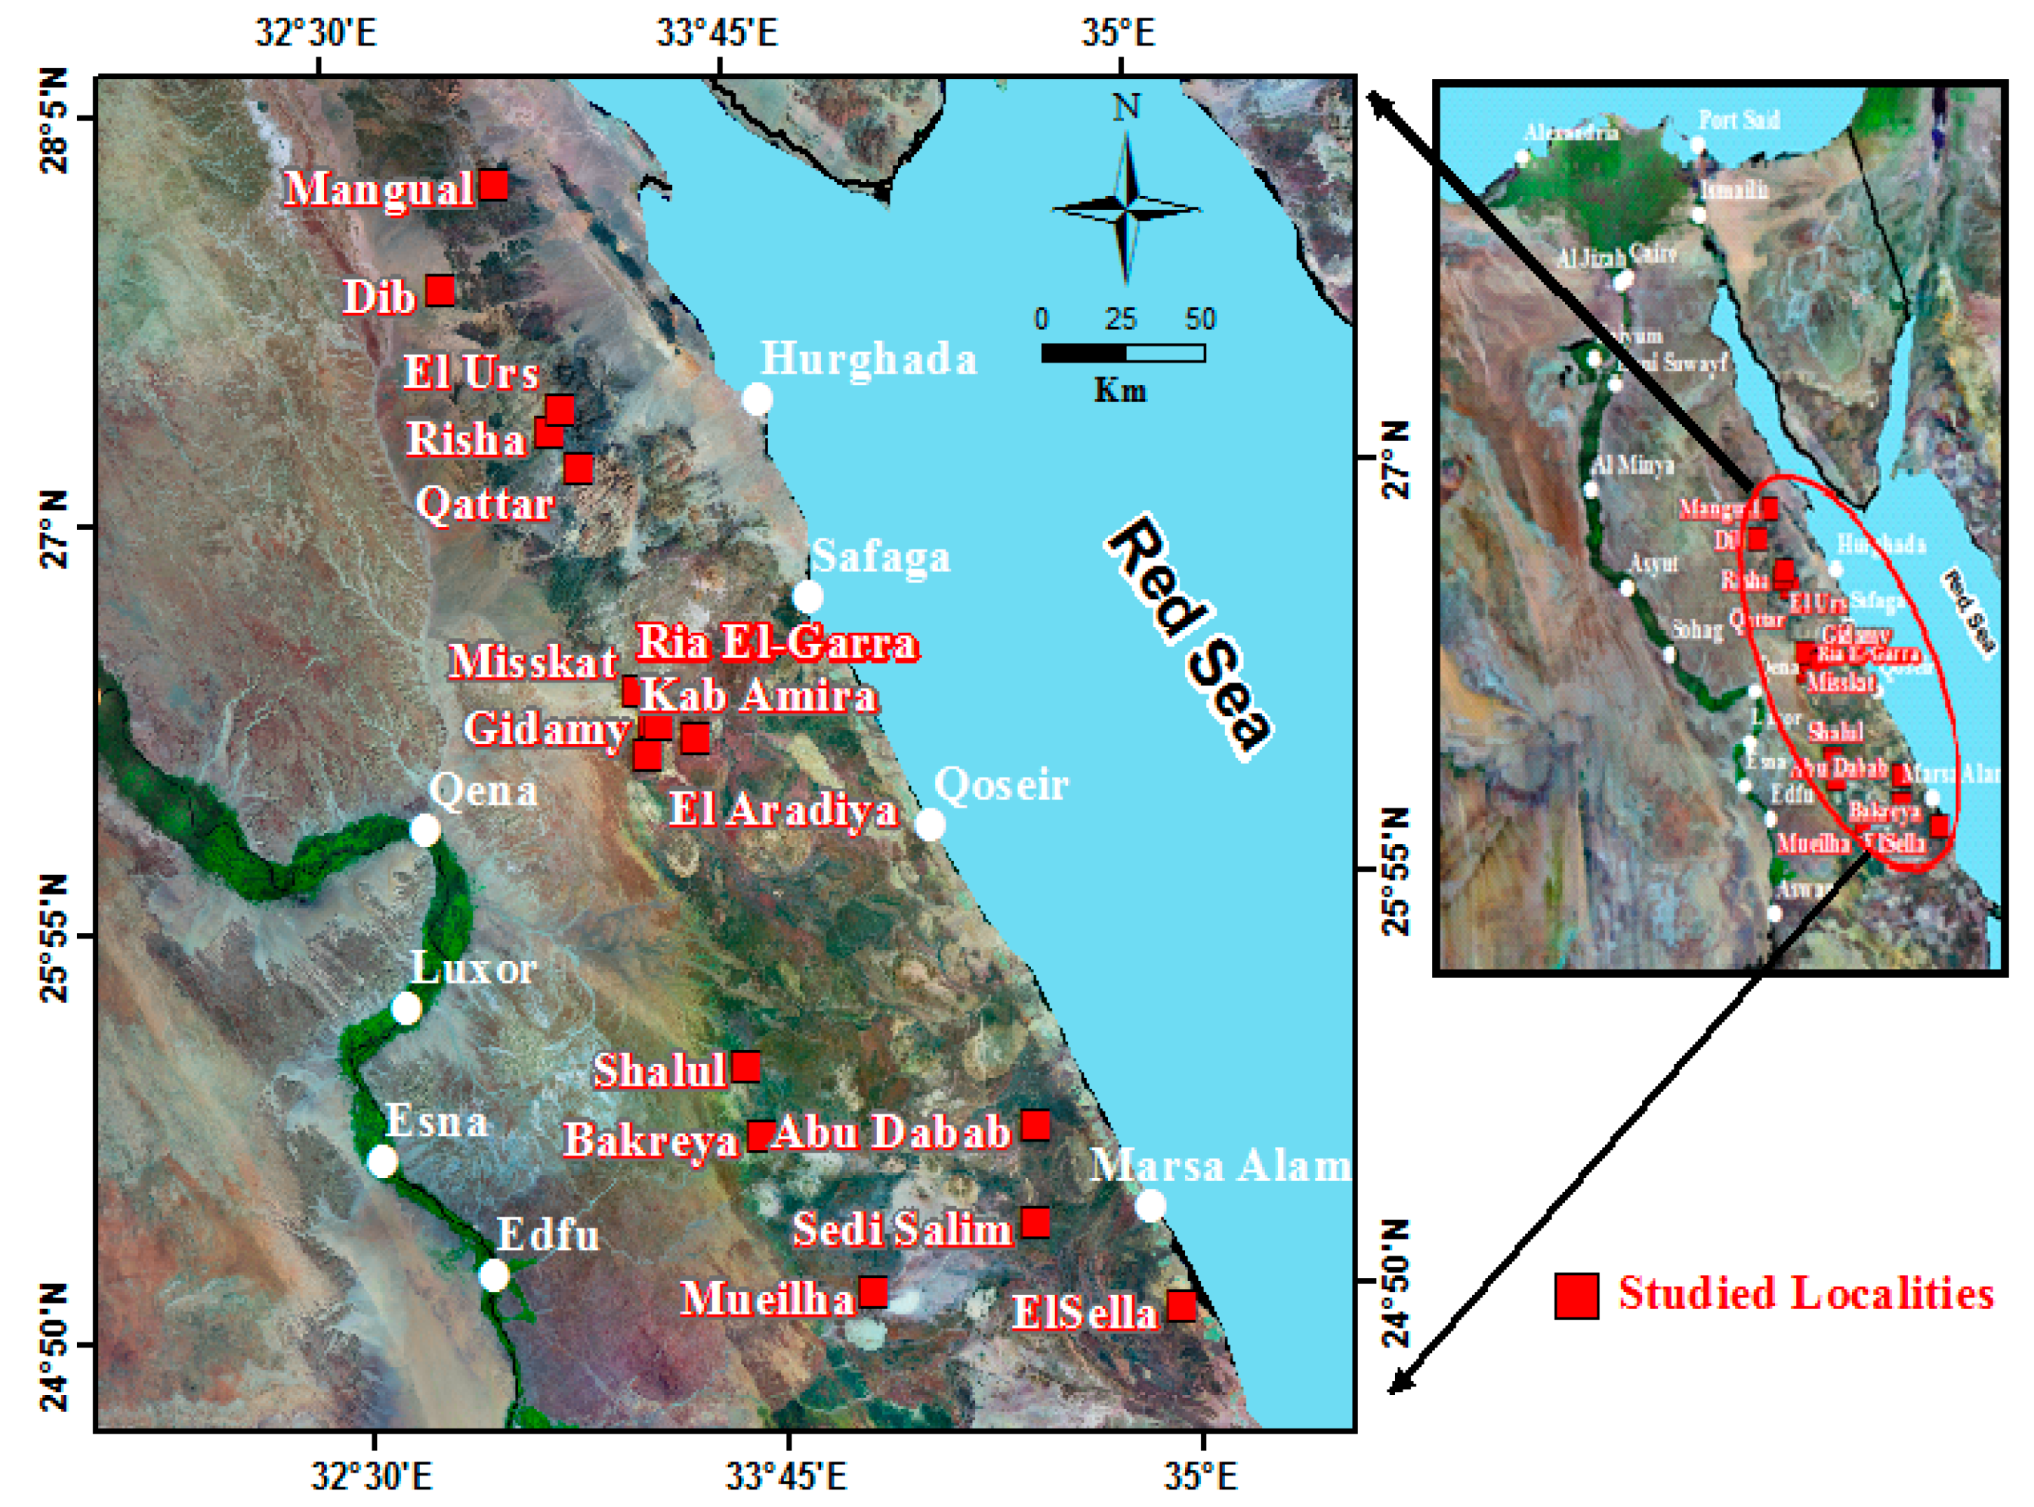
The Eastern Desert of Egypt (EDE) constitutes the northern tip of the Arabo-Nubian Shield (ANS), accumulated following the collision of East and West Gondwana [12,13]. The basement rocks of Egypt cover about 100,000 km2 (~10% of the total area of Egypt), including most of the EDE and Southern Sinai. It is divided into northern, central and southern domains [14,15]. The EDE is roofed fundamentally by ophiolites and gneisses in the Southern part (SED), ophiolitic mélange and island arc volcano-sedimentary succession in the Central part (CED), and granitoids in the Northern part (NED). The selected study locations (Figure 1) represent an area of about 25,000 km2.
The northern part of the study area (NPSA) is located between latitudes 26°52′52.8″‒27°54′39.11″ N and longitudes 32°46′37.3″‒33°44′25.4″ E encompassing an area of about 5700 km2 in the Northern part of EDE. It includes five locations (Gebel G. El-Qattar, G. El-Risha, G. El-Urs, G. El-Dib and G. Um Mongul).
The central part of the study area (CPSA) includes five areas; El- Missikat mountain (G. El-Missikat), G. El-Gidamy, G. Rie El-Garra, G. El-Aradiya, G. Kab Amira.
The southern part of the study area (SPSA) occupied latitudes 24°40′25.95″‒25°40′25.76″ N and longitudes 33°39′23.36″‒35°2′31.17″ E encompassing an area of about 8718 km2. It includes six localities (G. Mueilha, G. El-Sella, G. Sheikh Salem, G. Abu Dabbab, G. El Bakreya and G. El Shalul).
3. Geological Setting of the Study Area
3.1. Geological Setting of the Northern Part of the Study Area (NPSA)
The NPSA is characterized by a granitic terrain, various gneissic rocks, a sequence of younger intracratonic rocks of the Dokhan-type volcanics with Hammamat-molasse sediments besides rare outcrops of ultramafics [14]. The NPSA involves five locations (G. El-Qattar, G. El-Risha, G. El-Urs, G. El-Dib and G. Um Mongul).
G. El-Qattar is composed mainly of younger granite, metavolcanics, Hammamat sediments, and grey granites. The geology of the area was described in previous investigations [16,17,18,19,20]. The youngest granite cuts all the older cited units. Mineralogically, it consists of orthoclase, quartz, plagioclase together with minor biotite. The accessory minerals are zircon, monazite, xenotime, fluorite, apatite, allanite and sphene. Magnetite, ilmenite, pyrite, chalcopyrite and pyrrohtite are the opaque minerals [16,21]. Uraninite, uranophane and geothite are the associated secondary minerals.
G. Khashm El-Risha (Risha) and El-Urs are situated at about 70 km west of Hurghada city. The Risha area is wrapped by granophyres comprising quartz and alkali feldspar in characteristic angular intergrowths. The granophyres outcrops exhibit moderate relief [12]. In contrast, the granites cover vast areas of El-Urs, forming moderate to high relief, presented by biotite and alkali-feldspar.
G. EL Dib forms a circular ring of 2 km diameter, intruding Dokhan Volcanics and granites. It consists of trachyte, quartz syenite and granite. Aegirine, albite, arfvedsonite, calcite, fluorite, riebeckite are the dominant minerals. The volcanic rocks are intruded by the syenites, representing the deeply eroded remnants of a volcanic cone [22,23]. The syenites have been dated at 551 ± 11 to 558 ± 11 and 578 ± 8 Ma [24].
G. Um Mongul is composed of monzogranite, hornblende gabbro, and dacite. It is intruded by dykes of variable composition. The monzogranite is fresh containing xenoliths of the Dokhan Volcanics [25].
3.2. Geological Setting of the Central Part of the Study Area (CPSA)
The CPSA contains younger granites; amphibolite and older granite distributed along five various areas (G. El-Missikat, G. El-Gidamy, G. El-Aradiya, G. Rie El-Garra and G. Kab Amira). The detailed geological setting was considered by El-Gamal et al. [26].
3.3. Geological Setting of the Southern Part of the Study Area (SPSA)
The SPSA contains six locations (G. Mueilha, G. El-Sella, G. Sheikh Salem, G. Abu Dabbab, G. El Bakreya and G. El Shalul).
G. El Mueilha is medium to coarse grained granite. It is commonly pink, turns whitish towards the external parts and along fault planes [27,28,29].
G. El-Sella comprises tonalite, two-mica monzogranite and muscovite monzogranite. The geochemical signatures of the two-mica monzogranites resemble those of continental-collision granitoids, emplaced during a syn-collision regime, whereas those for the tonalites resemble island-arc granitoids. Ibrahim et al. [30], Gawad et al. [31] and Ali [32] noted argillization, fluoritization, hematitization, silicification, carbonization, and sulphidization processes in the area.
G. Sheikh Salem hosts younger granite, volcaniclastic metasediments, metagabbro-diorite, metavolcanics, and syenogranite. The area around Sheikh Salem is traversed by many NE trending dykes extending for hundreds of meters to a few kilometers. These dykes cut the island arc metavolcanics and metagabbros, and are older than Sheikh Salem younger granite. Most of these dykes are basalts, basaltic andesites, andesites, dacites, and rhyolites [33,34,35].
G. Abu Dabbab is 0.4 km2, composed of albite granite intruding the ophiolitic mélange (exotic blocks of serpentinites, metavolcanics and metasediments) [36]. The area is cross-cut by faults and shear zones trending N-NE to S-SW, and dissected by quartz, amazonite veins and basic dykes. The granites under investigation have been collected from different surface outcrops, and across shear zones.
G. El Bakreya rises 553 m above sea level, flanked by low hills of older gabbroid rocks. The late orogenic plutonites at El Bakriya are represented by alkali granite, pegmatites, aplites, felsites, and quartz veins. The granite shows sharp intrusive contacts, frequently contains xenoliths and roof pendants of the country rocks. Mineralogically, the granites are characterized by the predominance of microcline-orthoclase over plagioclase and rare biotite. Accessory minerals are zircon and apatite.
G. El Shalul represents one of the most deformed plutons in the Eastern Desert forming a NW-SE trending antiform. The core is dominated by monzogranite, and granitic gneisses. The deformed granites show enclaves of monzogranite [37,38]. El Shalul granite consists of two large plutons (El Shalul and El Hassanawia plutons) contains quartz, perthitic K-feldspar, plagioclase, and biotite. The border and age relationship between the two plutons is vague [37,39].
4. Experimental Techniques
4.1. Sample Preparation
A total of 125 granitic rock samples were sampled from the investigated areas (41 samples from NPSA, 44 samples from CPSA and 40 samples from SPSA). The samples were crushed by a jaw crusher to a downy powder, sifted through 200 μm mesh and dehydrated at 110 °C for at least 3h to expel moisture. Each sample was weighted and placed into a hermetically sealed cylindrical plastic canister of 82 mm height, 95.2 mm diameter, and 0.51mm thickness. Each canister was closed tightly with vinyl tape around its neck to prevent the escape of the radon gas. The samples were stored for at least 30 d to achieve secular equilibrium between 226Ra, 222Rn and the short-lived progeny.
4.2. Radioactivity Measurement
All samples were investigated in the Nuclear Physics Laboratory of the Physics Department, Faculty of Sciences, Assiut University (Assiut, Egypt), using a gamma-ray spectrometer with an HPGe GR4020 model and a multichannel analyzer containing 16,384 channels. The identifier had closed coaxial gamma-ray detectors (type p) made out of high purity germanium (HPGe) in a vertical arrangement cooled by liquid nitrogen. The detector had a relative efficiency of 40%, and an energy resolution of 2 keV (FWHM) for the 1.332 MeV gamma-ray transition of 60Co. The germanium detector was placed inside a lead shield (Model 747E, Canberra) to minimize the environmental background with the accompanying details: 9.5 mm (3/8 in) external jacket, thick, coarse carbon steel guard of 10 cm (4 in), low thickness background, slow coating of 1 mm (0.040 inches) of tin and 1.6 mm (0.062 inches) of copper.
The system was calibrated for both energy and efficiency. The energy calibration for the measuring system was performed by point sources of (133Ba, 60Co, 137Cs, 54Mn, 22Na, and 65Zn) using LabSOCS (Laboratory Sourceless Calibration Software) mathematical calibration software based on Monte Carlo simulation. Primary calibration measurements were carried out at the factory where results were utilized to build the detector’s characterization file. For the calibration of the efficiency, calibration files were created by Geometry Composer Tool in the software for each sample. For the latter, all variables linked to the measurements such as dimensions of the counting geometry, container properties, the density of each sample, physical and chemical compositions; in addition to the distance between the radioactive source and detector end-cap, attenuation and absorption were taken into consideration.
The efficiency data obtained by LabSOCS was validated and verified through the measurements performed in our laboratory using a set of calibrated point sources (133Ba, 60Co and 137Cs) put at a distance that ranged from 0 to 15 cm from the detector end-cap. The computed results gave a great agreement between mathematical and empirical peak efficiencies with differences of less than 10%, (Figure 2 and Figure 3).
The concentration of any radioisotope of interest in samples was determined in Bq kg−1 using the count spectrum obtained for each sample. This count spectrum was obtained using the PC program Canberra’s Genie 2000 [40] utilized for the acquisition of the detector signals. The measuring time was between 8 to 24 h for samples and 48 h for background.
The 238U activity of the samples was resolved via its daughter 234mPa using the γ-ray line (photopeak) with an energy of 1001.03 keV. The radioactivity concentration of 226Ra was determined from the photopeaks of 214Pb (295.22, 351.93 keV) and 214Bi (609.31, 1120.29, 1764.49 keV). The 232Th concentration was calculated from the photopeaks of 228Ac (911.2, 968.97 keV), 212Pb (238.63 keV) and 208Tl (583.19, 2614 keV), while 40K was resolved from the 1460.8 keV photopeak.
The activity concentrations, computed from the intensity of gamma rays resulting from the radioactive nuclides of the samples, were calculated to give an average activity per radioisotope.
The activity concentration (AC) is the activity in Bq kg−1 for the granitic samples and was obtained as follows:
where Ncps is the net count per second, equal to (Ncps) Sample minus (Ncps) background, I is the gamma decay transition probability in a radioisotope, ε is the absolute efficiency for each gamma-line and ms is the sample mass in kg.
The uncertainty of activity, UAC, was computed in terms of component uncertainties in Ncps, I, ε and ms using the following Equation:
where UNcps, Uε, UI and Ums are respective uncertainties for the net count per second, the detector efficiency, the gamma decay transition probability and the sample mass.
4.3. Radiological Hazard Indices and Dose Parameters
Many indicators were utilized to evaluate the gamma radiation hazards emitted from the natural radioisotopes of the granitic rocks. These include: the radium equivalent activity indicator (Raeq), proposed for evaluating the radiation risks emitted from the examined radionuclides and estimating their actual activity levels in the granite products; external and internal hazard indicators (Hex and Hin) (it is essential that Hex should not go beyond unity which is equivalent to 370 Bq kg−1 (the upper limit of Raeq criterion)), while Hin was used to quantify the internal exposure due to radon and its progeny); alpha and gamma indicators (Iα and Iγ) are used only as screening mechanisms to identify building materials of concern; absorbed dose and annual effective dosage rates (ADR and AEDR); annual gonadal dosage equivalent (AGDE); and excess lifetime cancer risk (ELCR). These parameters can be determined using the following Equations:
where, ACRa, ACTh and ACK are the specific activity concentrations of 226Ra, 232Th and 40K in Bq kg−1, respectively.
Finally, the excess lifetime cancer risk can be calculated using the Equation presented by Agbalagba et al. [1].
where (DL) is life expectancy, considered to be 70 years, and (RF) is the risk factor referred to as cancer risk per sievert (for stochastic effects, RF value is 0.05 for the public (ICRP [41])). All of these parameters were discussed in detail by El-Gamal et al. [26,27].
5. Results and Discussion
5.1. Activity Concentration
Table 1 summarizes ranges and mean values of the specific activity concentrations of 238U, 226Ra, 232Th, and 40K in the studied rocks. Figure 4 compares the average estimates for radionuclide concentrations in the studied areas with the corresponding worldwide average.
It is clear that the calculated concentrations and radioactive mineral content for each area are different and function of their respective geological, geochemical, and tectonic characteristics. The average estimates of the activity concentrations of 238U, 226Ra, 232Th and 40K in the granite of the NPSA were 117.9, 109.1, 92.6 and 1005.8 Bq kg−1, respectively. The central part granites had concentrations of 282.5, 284.6, 105.1 and 881.1 Bq kg−1, respectively, while the southern part granites were recorded as 72.6, 68.1, 59.1 and 850.6 Bq kg−1, respectively.
It is clear from Table 1 and Figure 4 that the average activity concentrations of 238U, 226Ra, 232Th and 40K in all areas were higher than the overall typical values for these radioisotopes in standard soil, (35, 35, 30 and 400 Bq kg−1 for 238U, 226Ra, 232Th and 40K, respectively [42]). They were above the allowable values in building materials, (50, 50, 50 and 500 Bq kg−1 for 238U, 226Ra, 232Th and 40K, respectively [43]). Furthermore, it can be seen from Table 1 and Figure 4 that the highest average values for 238U, 226Ra and 232Th were in granites of the CPSA, whereas 40K recorded the highest average values in the NPSA.
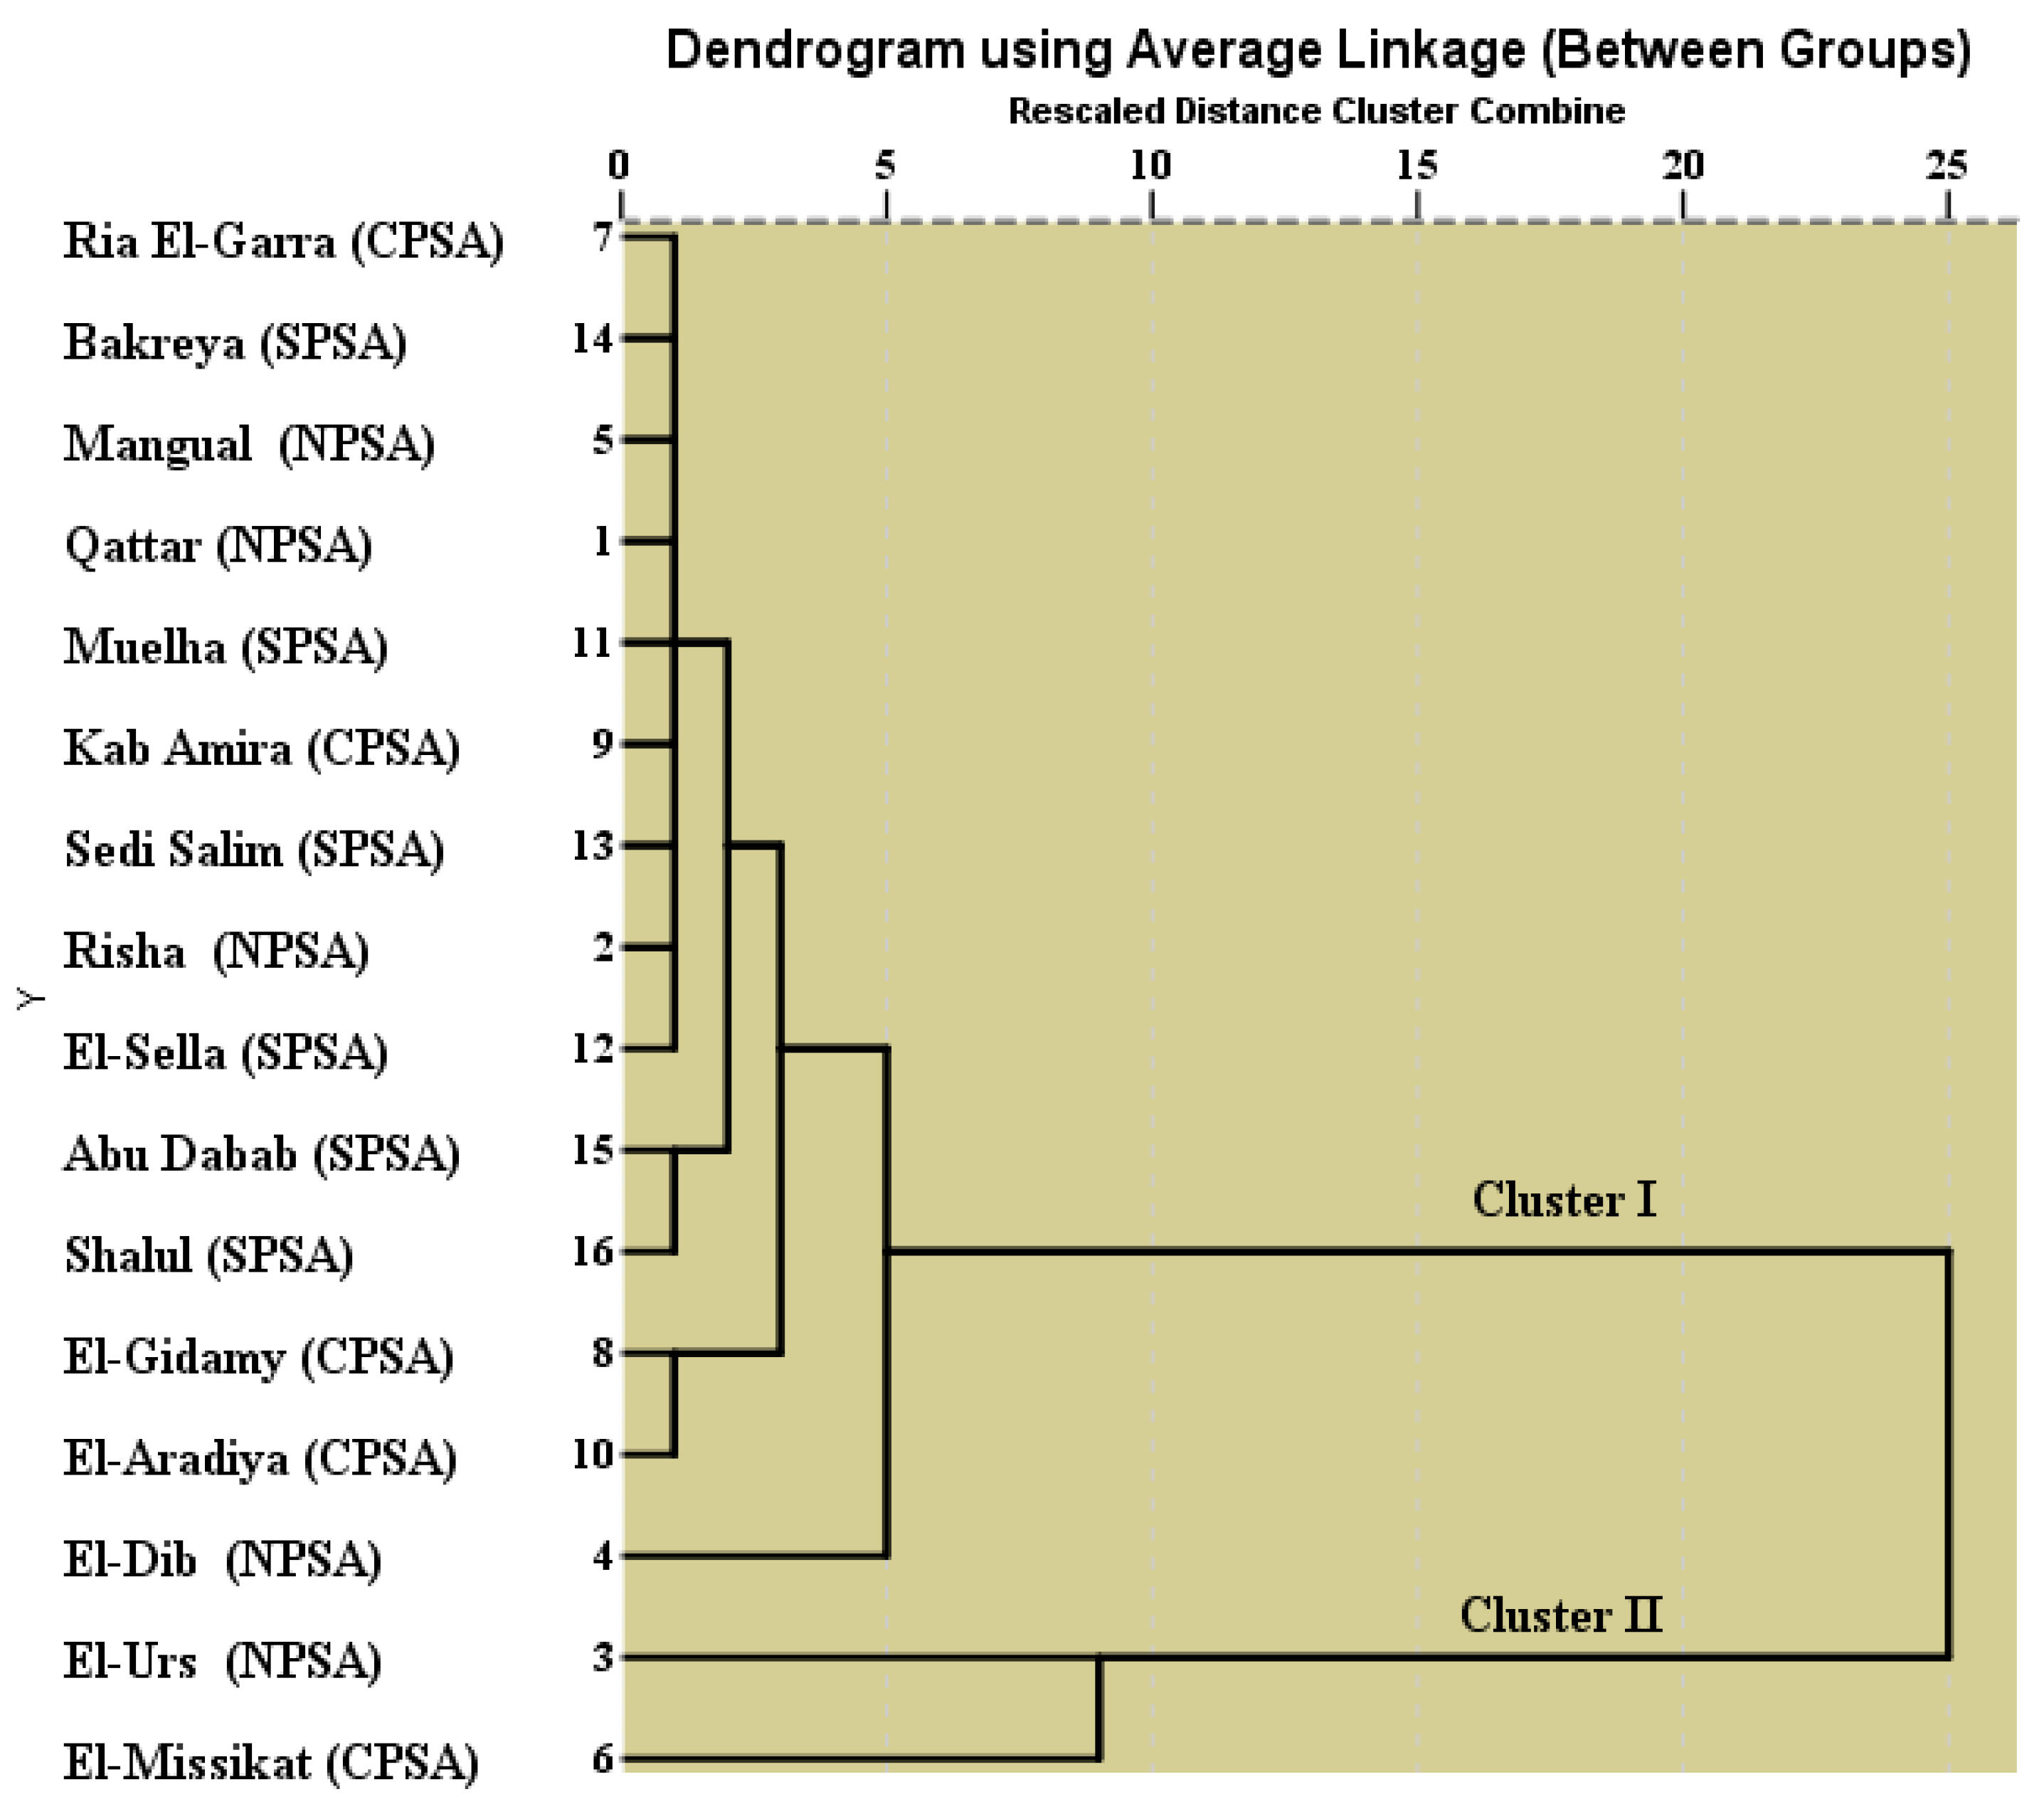
Hierarchical cluster analysis illustrates the similarity between the locations from the three regions in relation to their radionuclide concentrations. The results of the hierarchical cluster analysis are illustrated as a dendrogram in Figure 5; 16 locations from the three regions can be divided into six, five, four, three, and two groups (clusters) depending on the mean concentrations of 238U, 226Ra, 232Th and 40K. In this analysis, we see that the locations having the same mean values of radionuclide concentrations are within a homogeneous group. As shown from the dendrogram (Figure 5), the number of clusters is eventually reduced from six to two statistically significant different clusters (Cluster I and Cluster II). Cluster I contains 14 locations (Rie El Garra, EL Bakreya, Um Mongul, Qattar, Mueilha, Kab Amira, Sheikh Salem, Risha, El Sella, Abu Dabbab, Shalul, Gidamy, Aradiya and ElDib areas) with high similarity. Cluster II contains the two remaining locations (El Urs and Missikat areas) with less similarity.
5.2. Radiological Hazard Indicators
The mean values of radiation hazards parameters are plotted on Figure 6 and Figure 7. Table 2 lists the average values of Raeq, ADR, AEDR, Hex, Hin, AGDE, ELCR, Iα and Iγ for the granites of the NPSA, CPSA and SPSA. It is quite evident (Table 2 and Figure 6) that the highest average values for these parameters are in the granites of CPSA, whereas the lowest e values in the SPSA. This is a reflection for the highest average values of 238U, 226Ra and 232Th concentrations for the granites from the two parts.
The highest average values of Raeq, ADR, AEDR, Hex, Hin, AGDE, ELCR, Iα and Iγ (669.73 Bq Kg−1, 305.44 nGy h−1, 0.37 mSv y−1, 1.81, 2.76, 2097.23 μSv y−1, 1.31, 1.76 and 2.34, respectively) are from El-Urs, whereas the lowest values (203.87 Bq Kg−1, 97.17 nGy h−1, 0.12 mSv y−1, 0.55, 0.69,689.5 μSv y−1, 0.42, 0.25 and 0.77, respectively) were observed within El-Risha from the northern part. Within the areas of the CPSA, the highest average values of Raeq, ADR, AEDR, Hex, Hin, AGDE, ELCR, Iα and Iγ (794.93 Bq Kg−1, 365.68 nGy h−1, 0.45 mSv y−1, 2.15, 3.69, 2487.12 μSv y−1, 1.57, 2.86 and 2.74, respectively) were at El-Missikat, and the lowest values (250.05 Bq Kg−1, 116.88 nGy h−1, 0.14 mSv y−1, 0.68, 0.88,820.78 μSv y−1, 0.5, 0.39 and 0.92, respectively) were observed at Rie El-Garra. As for the areas of the SPSA, the highest average values of Raeq, ADR, AEDR, Hex, Hin, AGDE, ELCR, Iα and Iγ (303.49 Bqkg−1, 140.96 nGy h−1, 0.17 mSv y−1, 0.82, 1.15, 982.07 μSv y−1, 0.61, 0.61 and 1.1, respectively) were at Mueilha, and the lowest values (138.1 Bqkg−1, 66.86 nGy h−1, 0.08 mSv y−1, 0.37, 0.45, 477.66 μSv y−1, 0.29, 0.15 and 0.53, respectively) were observed at Abu Dabbab. It can be concluded that El-Missikat area located in the Central part is characterized by the highest values for all radiological hazards. It is clear that the calculated parameters for the granites from the NPSA and CPSA exceeded the recommended referenced values for radiological hazards (Table 2, Figure 6 and Figure 7). In contrast, the granites from the SPSA did not exceed the recommended referenced values for most of these parameters (Table 2, Figure 6 and Figure 7). These variations demonstrate the difficulty of utilizing the majority of these granitic rocks as decorative stone in bulk amount. Nonetheless, they point to the probability of utilizing these rocks as superficial building materials or building materials with limited use.
6. Conclusions
The natural radioactivity of the granitic rocks in a vast mountainous region from the northern, central and southern parts of the Eastern Desert of Egypt (EDE) has been measured. The measured activity concentrations of the examined radioisotopes (238U, 226Ra, 232Th and 40K) in the granitic samples are highly variable and depend upon their radioactive mineral content. The average activity concentrations for 238U, 226Ra, 232Th, and 40K in all studied localities are above the worldwide reference for standard soil and building materials except for G. El-Shalul and G. Abu Dabbab, which are slightly less than the worldwide average in 238U and 232Th content.
The radiological risk parameters (radium equivalent (Raeq), external hazard index (Hex), internal hazard index (Hin), absorbed dose rate outdoors (ADR), annual effective dose rate outdoors (AEDR), annual gonadal dosage equivalent (AGDE), excess lifetime cancer risks (ELCR), alpha index (Iα) and gamma index (Iγ) all indicate that these granitic rocks can be used as solely superficial building materials or as ornamental materials with limited use. Most of the granites from the northern and central parts have radiological parameters exceeding the recommended reference values.
Author Contributions
Conceptualization, E.S. and H.E.-G.; methodology, E.S.; software, E.S.; validation, H.E.-G. and M.E.-H.; formal analysis, E.S.; investigation, E.S.; resources, M.E.-H.; data curation, H.E.-G.; writing—original draft preparation, E.S.; writing—review and editing, M.E.-H., visualization, E.S.; supervision, H.E.-G.; project administration, M.E.-H.; funding acquisition, M.E.-H.
Funding
This research was funded by the Ministry of Higher Education, grant number ASP-015 and the APC was funded by Hany El-Gamal.
Acknowledgments
The authors acknowledge the support of the Physics and Geology Departments, Assiut University, Egypt, for using all the possible facilities when completing this research. We acknowledge the helpful and useful reviews from anonymous reviewers for editing the final text.
Conflicts of Interest
The authors declare no conflict of interest.
References
- Agbalagba, E.; Osakwe, R.; Olarinoye, I. Comparative assessment of natural radionuclide content of cement brands used within Nigeria and some countries in the world. J. Geochem. Explor. 2014, 142, 21–28. [Google Scholar] [CrossRef]
- Xinwei, L.; Lingqing, W.; Xiaodan, J.; Leipeng, Y.; Gelian, D. Specific activity and hazards of Archeozoic-Cambrian rock samples collected from the Weibei area of Shaanxi, China. Radiat. Prot. Dosim. 2005, 118, 352–359. [Google Scholar] [CrossRef] [PubMed]
- Saied, M.; Abbady, A.; El-Kamel, A.; El-Arabi, A. Natural radioactivity of granite rocks in Wadi Qena. Radiat. Phys. Chem. 1994, 44, 95–98. [Google Scholar] [CrossRef]
- El-Dine, N.W.; El-Shershaby, A.; Ahmed, F.; Abdel-Haleem, A. Measurement of radioactivity and radon exhalation rate in different kinds of marbles and granites. Appl. Radiat. Isot. 2001, 55, 853–860. [Google Scholar] [CrossRef]
- El-Shershaby, A. Study of radioactivity levels in granite of Gable Gattar II in the north eastern desert of Egypt. Appl. Radiat. Isot. 2002, 57, 131–135. [Google Scholar] [CrossRef]
- El-Arabi, A.M. 226 Ra, 232 Th and 40 K concentrations in igneous rocks from eastern desert, Egypt and its radiological implications. Radiat. Meas. 2007, 42, 94–100. [Google Scholar] [CrossRef]
- El-Dine, N.W. Study of natural radioactivity and the state of radioactive disequilibrium in U-series for rock samples, North Eastern Desert, Egypt. Appl. Radiat. Isot. 2008, 66, 80–85. [Google Scholar] [CrossRef] [PubMed]
- El-Taher, A. Gamma spectroscopic analysis and associated radiation hazards of building materials used in Egypt. Radiat. Prot. Dosim. 2009, 138, 166–173. [Google Scholar] [CrossRef]
- Uosif, M.; Abdel-Salam, L. An assessment of the external radiological impact in granites and pegmatite in central Eastern Desert in Egypt with elevated natural radioactivity. Radiat. Prot. Dosim. 2010, 147, 467–473. [Google Scholar] [CrossRef]
- El-Taher, A. Elemental analysis of granite by instrumental neutron activation analysis (INAA) and X-ray fluorescence analysis (XRF). Appl. Radiat. Isot. 2012, 70, 350–354. [Google Scholar] [CrossRef]
- Issa, S.; Uosif, M.; Abd El-Salam, L. Natural radionuclide concentrations in granite rocks in Aswan and Central-Southern Eastern Desert, Egypt and their radiological implications. Radiat. Prot. Dosim. 2011, 150, 488–495. [Google Scholar] [CrossRef] [PubMed]
- Mohy, H.; Basta, F.F.; Saber, S.G.; El Sobky, A.F.A. Using Landsat 8 and ASTER Data for lithological Discrimination and Mapping in Wadi Hamad area, North Eastern Desert, Egypt. J. Am. Sci. 2017, 13, 1–13. [Google Scholar]
- Stern, R.J. Arc assembly and continental collision in the Neoproterozoic East African Orogen: Implications for the consolidation of Gondwanaland. Annu. Rev. Earth Planet. Sci. 1994, 2, 319–351. [Google Scholar] [CrossRef]
- Abdel-Meguid, A. Late Proterozoic Pan African Tectonic Evolution of the Egyptian Part of the Arabian-Nubian Shield; Middle East Research Center (MERC): Erbil, Iraq, 1992; Chapter 6; pp. 13–28. [Google Scholar]
- Stern, R.J.; Hedge, C.E. Geochronologic and isotopic constraints on late Precambrian crustal evolution in the Eastern Desert of Egypt. Am. J. Sci. 1985, 285, 97–127. [Google Scholar] [CrossRef]
- Ali, A.; Zoheir, B.A.; Stern, R.J.; Andresen, A.; Whitehouse, M.J.; Bishara, W.W.; Lu, H.O. isotopic compositions on single zircons from the North Eastern Desert of Egypt, Arabian–Nubian Shield: Implications for crustal evolution. Gondwana Res. 2016, 32, 181–192. [Google Scholar] [CrossRef]
- Roz, M. Geology and Uranium Mineralization of Gabal Gattar Area, North Eastern Desert, Egypt. Master’s Thesis, Al Azhar University, Cairo, Egypt, 1994. Unpublished. [Google Scholar]
- Mahdy, N.M.; Shalaby, M.H.; Helmy, H.M.; Osman, A.F.; El Sayed, H.; Zeid, E.K.A. Trace and REE element geochemistry of fluorite and its relation to uranium mineralizations, Gabal Gattar Area, Northern Eastern Desert, Egypt. Arab. J. Geosci. 2014, 7, 2573–2589. [Google Scholar] [CrossRef]
- Shalaby, M. New occurrence of uranium mineralizations G-VII, Gabal Qattar uranium prospect, north Eastern Desert. Egypt. Bull. Fac. Sci. Alex. Univ. 1995, 35, 447–460. [Google Scholar]
- Moharem, A. Geological and Geochemical Studies on the Uranium Bearing Granites in the Northern Part of Gabal Gattar, North Eastern Desert, Egypt. Master’s thesis, Faculty of Science, Ain Shams University, Cairo, Egypt, 1997. [Google Scholar]
- El-Feky, M. Mineralogical, REE-geochemical and fluid inclusion studies on some uranium occurrences, Gabal Gattar, Northeastern Desert, Egypt. Chin. J. Geochem. 2011, 30, 430. [Google Scholar] [CrossRef]
- El-Ramly, M.; Hussein, A.; Francis, M. The ring complex of Wadi Dib, north Eastern Desert, Egypt. Ann. Geol. Surv. Egypt. 1982, 12, 77–82. [Google Scholar]
- Woolley, A. Alkaline Rocks and Carbonatites of the World. Part 3: Africa. Geological Society; Natural History Museum: London, UK, 2001. [Google Scholar]
- Frisch, W. The Wadi Dib ring complex, Nubian Desert (Egypt) and its importance for the upper limit of the Pan-African orogeny. Precambrian Res. 1982, 16, A20. [Google Scholar] [CrossRef]
- El-Rahman, Y.A.; Seifert, T.; Gutzmer, J.; Said, A.; Hofmann, M.; Gärtner, A.; Linnemann, U. The South Um Mongul Cu-Mo-Au prospect in the Eastern Desert of Egypt: From a mid-Cryogenian continental arc to Ediacaran post-collisional appinite-high Ba-Sr monzogranite. Ore Geol. Rev. 2017, 80, 250–266. [Google Scholar] [CrossRef]
- El-Gamal, H.; Sidique, E.; El-Azab, F.M. Considerable radioactivity levels in the granitic rocks of the central areas of the Eastern Desert, Egypt. Environ. Sci. Pollut. Res. 2018, 25, 29541–29555. [Google Scholar] [CrossRef]
- El-Gamal, H.; Sidique, E.; El-Haddad, M.; El-Azab, F.M. Assessment of the natural radioactivity and radiological hazards in granites of Mueilha area (South Eastern Desert, Egypt). Environ. Earth Sci. 2018, 77, 691. [Google Scholar] [CrossRef]
- Abu El-Rus, M.A.; Mohamed, M.A.; Lindh, A. Mueilha rare metals granite, Eastern Desert of Egypt: An example of a magmatic-hydrothermal system in the Arabian-Nubian Shield. Lithos 2017, 294, 362–382. [Google Scholar] [CrossRef]
- Kamel, A.F. Relationship between photolineaments and radioactivity in Gebel El Mueilha, Central Eastern Desert, Egypt. J. Afr. Earth Sci. 1983, 1, 343–347. [Google Scholar] [CrossRef]
- Ibrahim, M.; Zalata, A.; Assaf, H.; Ibrahim, I.; Rashed, M. El Sella Shear Zone, South Eastern Desert, Egypt. Example of vein type uranium deposit. In Proceedings of the 9th International Mining, Petroleum, and Metallurgical Engering Conference, Cairo, Egypt, 21–24 Feburery 2005; pp. 41–55. [Google Scholar]
- Gawad, A.E.A.; Orabi, A.H.; Bayoumi, M.M. Uranium evaluation and its recovery from microgranite dike at G. El Sela area, South Eastern Desert, Egypt. Arab. J. Geosci. 2015, 8, 4565–4580. [Google Scholar] [CrossRef]
- Ali, K.G. Structural control of El Sela granites and associated uranium deposits, Southern Eastern Desert, Egypt. Arab. J. Geosci. 2013, 6, 1753–1767. [Google Scholar] [CrossRef]
- Khaleal, F. Geological and Geochemical Study on Some Dykes and Hosting Stone-grey in Sheikh Salem Area, South Eastern Desert, Egypt. Nucl. Sci. Sci. J. 2013, 2, 69–81. [Google Scholar]
- Mashaly, A.O.; Shalaby, B.N.; Salem, A.K.A. Geochemical Characteristics of Some Dykes around Sheikh Salem, Central Eastern Desert, Egypt. Curr. Sci. Int. 2015, 4, 633–645. [Google Scholar]
- Sakran, S.; Said, A.; El Alfy, Z.; El Sharkawi, M. Hammash releasing bend and its control of gold mineralization, Hammash gold mine area, South Eastern desert, Egypt. Egypt. J. Geol. 2009, 53, 87–99. [Google Scholar]
- Heikal, M.T.S.; Gomaa, S.; Abd El Monsef, M.; Taha, A.A.; Top, G.; Mahmoud, K.; El- Mansi, M. Insight on Radiological Risk Assessment and its Statistical Evaluations for Abu Dabbab Albite Granite Mining area, Central Nubian Shield, Egypt. Arab J. Nucl. Sci. Appl. 2018, 51, 143–167. [Google Scholar] [Green Version]
- Ali, K.; Andresen, A.; Manton, W.; Stern, R.; Omar, S.; Maurice, A. U–Pb zircon dating and Sr–Nd–Hf isotopic evidence to support a juvenile origin of the~ 634 Ma El Shalul granitic gneiss dome, Arabian–Nubian Shield. Geol. Mag. 2012, 149, 783–797. [Google Scholar] [CrossRef]
- Hamimi, Z.; El Amawy, M.; Wetait, M. Geology and structural evolution of El Shalul Dome and environs, Central Eastern Desert, Egypt. Egypt. J. Geol. 1994, 38, 575–959. [Google Scholar]
- Osman, A.F.S.; Naim, G.M. Structural Geological and Geochemical Studies on the Pan-African Basement Rocks, Wadi Zeidun, Central Eastern Desert, Egypt: German-Egyptian Cooperation in Research and Technological Development; Forschungszentrum: Pully, Switzerland, 1996. [Google Scholar]
- Genie-2000. The Genie-2000 Operations Manual, Including the S501 Gamma Analysis Option; Genie-2000: Canberra, Australia, 2013. [Google Scholar]
- Mountford, P.J.; Temperton, D.H. Recommendations of the international commission on radiological protection (ICRP) 1990. Eur. J. Nucl. Med. Mol. Imaging 1992, 19, 77–79. [Google Scholar] [CrossRef]
- Unscear. Sources and Effects of Ionizing Radiation: Sources; United Nations Publications: New York, NY, USA, 2000. [Google Scholar]
- Unscear. Sources and Effects of Ionizing Radiation. UNSCEAR 1993 Report to the General Assembly, with Scientific Annexes; United Nations Publications: New York, NY, USA, 1993. [Google Scholar]
Figure 1.
Map of total studied locations.

Figure 2.
Efficiency validation.

Figure 3.
The correlation between efficiency obtained by Laboratory Sourceless Calibration Software (LABSOCS) and our experiment.
Figure 3.
The correlation between efficiency obtained by Laboratory Sourceless Calibration Software (LABSOCS) and our experiment.

Figure 4.
The average activity concentrations of radioisotopes in the three parts of the study area (compared to the worldwide averages).
Figure 4.
The average activity concentrations of radioisotopes in the three parts of the study area (compared to the worldwide averages).

Figure 5.
Similarity among the locations of the three parts depending on the radionuclide concentrations in term of cluster analysis.
Figure 5.
Similarity among the locations of the three parts depending on the radionuclide concentrations in term of cluster analysis.

Figure 6.
Average values of Hex, Hin, Iα, Iγ and Raeq in the three parts of the study area (compared to the worldwide averages).
Figure 6.
Average values of Hex, Hin, Iα, Iγ and Raeq in the three parts of the study area (compared to the worldwide averages).

Figure 7.
The average absorbed dose rate (ADR), annual effective dose rate (AEDR), annual gonadal dosage equivalent (AGDE) and excess lifetime cancer risk (ELCR) in the three parts of the study area (compared to the worldwide average).
Figure 7.
The average absorbed dose rate (ADR), annual effective dose rate (AEDR), annual gonadal dosage equivalent (AGDE) and excess lifetime cancer risk (ELCR) in the three parts of the study area (compared to the worldwide average).


Table 1.
Of the activity concentrations among the studied localities (activities (Bq kg−1) of 226Ra, 232Th, and 40K, range and average values) and with worldwide average.
Table 1.
Of the activity concentrations among the studied localities (activities (Bq kg−1) of 226Ra, 232Th, and 40K, range and average values) and with worldwide average.
| Location of the Study Area | Localities | Sample Size | Activity Concentration in (Bq kg−1) | |||
|---|---|---|---|---|---|---|
| U-238 | Ra-226 | Th-232 | K-40 | |||
| NPSA | El-Qattar | 13 | (24.9 ± 11.9 to 673.5 ± 109.5) | (38.1 ± 3.7 to 459.4 ± 42.1) | (28.9 ± 3.1 to 122.7 ± 12.6) | (777.9 ± 43.6 to 963.1 ± 53.8) |
| 131.5 ± 50.6 | 104.4 ± 30.6 | 78.8 ± 5.9 | 892.9 ± 16.3 | |||
| El-Risha | 4 | (30 ± 14.2 to 68.7 ± 24.4) | (35 ± 3.5 to 63.1 ± 5.9) | (43.2 ± 4.5 to 77.2 ± 7.9) | (926.9 ± 52.2 to 990.1 ± 55.7) | |
| 53.4 ± 8.5 | 49.8 ± 7.4 | 56.1 ± 8.2 | 958.8 ± 13.9 | |||
| El-Urs | 4 | (37.2 ± 19.3 to 1114.2 ± 170.9) | (46 ± 4.4 to 1083.7 ± 98.6) | (65.8 ± 6.9 to 274.5 ± 28) | (820.9 ± 46.3 to 980.9 ± 55.5) | |
| 373.6 ± 250.6 | 352.1 ± 247.4 | 173.2 ± 53.6 | 908.4 ± 33.9 | |||
| El-Dib | 17 | (5 ± 2.4 to 374.6 ± 71.9) | (18.5 ± 1.8 to 304.2 ± 32.2) | (23.8 ± 2.5 to 281.2 ± 30.3) | (696.8 ± 46 to 1512.9 ± 84) | |
| 76.9 ± 23.4 | 74.9 ± 18.6 | 94.3 ± 20.6 | 1144.1 ± 45.5 | |||
| Mongul | 3 | (21.5 ± 11.2 to 158.4 ± 52.5) | (42.5 ± 4 to 134.7 ± 12.7) | (55.7 ± 5.7 to 114.4 ± 11.8) | (789.64 ± 44.19to969.51 ± 54.68) | |
| 80.9 ± 40.6 | 78.4 ± 28.5 | 84.4 ± 16.9 | 903 ± 57 | |||
| AV. | 117.9 | 109.1 | 92.6 | 1005.8 | ||
| CPSA | El-Missikat | 16 | (99.7 ± 33.5 to 4513.7 ± 2911.2) | (104.2 ± 12 to 4536.9 ± 542.3) | (71 ± 12.4 to 163.05 ± 28) | (17.5 ± 3.3 to 1039.7 ± 70.2) |
| 567.8 ± 280.6 | 572.3 ± 279.4 | 114.5 ± 6.5 | 764.1 ± 78.8 | |||
| Rie El-Garra | 6 | (49 ± 21.1 to 79.1 ± 27.3) | (64.7 ± 7.4 to 99.8 ± 11.5) | (56.9 ± 9.7 to 93.2 ± 16.1) | (73.1 ± 5.4 to 1110.4 ± 74) | |
| 67.8 ± 4.7 | 77.5 ± 5.2 | 74.1 ± 6.4 | 865.27 ± 160.1 | |||
| El-Gidamy | 7 | (102.3 ± 33.5 to 333.8 ± 88.3) | (77.7 ± 8.9 to 254.6 ± 29) | (80.1 ± 13.8 to 170.8 ± 29.8) | (902.6 ± 60.7 to 1021.2 ± 68.7) | |
| 197 ± 32.3 | 169.3 ± 24.5 | 134.1 ± 14.1 | 951.5 ± 15.9 | |||
| Kab Amira | 10 | (11.9 ± 8.3 to 211.9 ± 53.7 | (22.7 ± 2.7 to 188.1 ± 21.4 | (36.1 ± 6.3 to 264.9 ± 45.4 | (877.4 ± 58.5 to 1066.5 ± 71.4 | |
| 62.1 ± 21.5 | 82 ± 18 | 94.2 ± 21.6 | 974.7 ± 16.7 | |||
| El-Aradiya | 5 | (68.7 ± 21.7 to 374.8 ± 92.5) | (65 ± 7.3 to 397.3 ± 47.2) | (50 ± 9.1 to 125.4 ± 21.6) | (761.9 ± 54.1 to 1110.3 ± 71.1) | |
| 187.6 ± 53.2 | 178.6 ± 58.9 | 93.2 ± 14.2 | 988.7 ± 62 | |||
| AV. | 282.5 | 284.6 | 105.1 | 881.1 | ||
| SPSA | Mueilha | 13 | (40 ± 8.4 to 216.7 ± 38.9) | (44.8 ± 4.7 to 175.4 ± 17.8) | (29.4 ± 4.2 to 111.4 ± 14) | (525.2 ± 32.1 to 1045.2 ± 66) |
| 127.1 ± 14.1 | 121.3 ± 11.7 | 82.2 ± 7.4 | 840 ± 41.2 | |||
| El-Sella | 4 | (8 ± 5 to 100.8 ± 34.4) | (15 ± 1.6 to 93.1 ± 8.8) | (24.1 ± 2.6 to 79.5 ± 8.1) | (824.4 ± 46.9 to 1000.8 ± 56) | |
| 40.5 ± 16.5 | 42.5 ± 13.3 | 60.1 ± 9.5 | 918.2 ± 29.8 | |||
| Sheikh Salem | 4 | (42.5 ± 23.3 to 135.1 ± 50.1) | (45.1 ± 4.6 to 74.8 ± 7.2) | (65 ± 8.2 to 95.5 ± 11.9) | (959.8 ± 54.4 to 1032.7 ± 58.3) | |
| 76.7 ± 20.3 | 58.6 ± 6.8 | 76.8 ± 6.8 | 982.5 ± 16.9 | |||
| Bakreya | 4 | (14.2 ± 7.9 to 114.3 ± 36.3) | (41.2 ± 3.9 to 126.3 ± 11.7) | (40 ± 4.4 to 112.9 ± 11.4) | (752.3 ± 42.1 to 909.9 ± 50.9) | |
| 86.8 ± 24.3 | 75 ± 19.5 | 64.4 ± 16.8 | 860.8 ± 36.5 | |||
| Abu Dabbab | 10 | (7.6 ± 3.3 to 111.6 ± 29.4) | (11.1 ± 1.1 to 110.8 ± 10.3) | (8.5 ± 0.9 to 128.4 ± 13) | (532.5 ± 30 to 967.2 ± 54.7) | |
| 38.1 ± 13 | 29.3 ± 9.3 | 34.3 ± 10.9 | 776.9 ± 43.7 | |||
| Shalul | 4 | 14.9 ± 7.8 to 39.7 ± 14.1 | 24.5 ± 2.3 to 44.8 ± 4.2 | 22.4 ± 2.3 to 37 ± 3.8 | 748.8 ± 42 to 903.5 ± 50.5 | |
| 31.8 ± 5.8 | 31.9 ± 4.5 | 29 ± 3.2 | 842.3 ± 35.8 | |||
| AV. | 72.6 | 68.6 | 59.8 | 850.6 | ||
| Worldwide AV. (Regular Soil (UNSCEAR 2000)) | 35 | 35 | 30 | 400 | ||
| Worldwide AV. (Building Materials (UNSCEAR 1993)) | 50 | 50 | 50 | 500 | ||
Table 2.
Range and mean values for the radiological parameters of the studied granitic samples from the 3 parts of the Eastern Desert.
Table 2.
Range and mean values for the radiological parameters of the studied granitic samples from the 3 parts of the Eastern Desert.
| Locations | Ra(eq) (Bq Kg−1) | ADR (nGy h−1) | AEDR [mSv y-1] | Hex | Hin | AGDE (μSv y−1) | ELCR × 10−3 | Iα | Iγ | |
|---|---|---|---|---|---|---|---|---|---|---|
| NPSA | El-Qattar | 147.17–663.12 | 72–307.36 | 0.09–0.38 | 0.4–1.79 | 0.5–3.03 | 514.72–2100.15 | 0.31–1.32 | 0.19–2.3 | 0.56–2.3 |
| 285.85 | 133.34 | 0.16 | 0.77 | 1.05 | 932.38 | 0.57 | 0.52 | 1.04 | ||
| El-Risha | 168.1–249.65 | 81.17–117.33 | 0.1–0.14 | 0.45–0.67 | 0.55–0.84 | 579.64–828.33 | 0.35–0.5 | 0.17–0.32 | 0.64–0.93 | |
| 203.87 | 97.17 | 0.12 | 0.55 | 0.69 | 689.5 | 0.42 | 0.25 | 0.77 | ||
| El-Urs | 203.23–1521.47 | 95.44–694.44 | 0.12–0.85 | 0.55–4.11 | 0.67–7.04 | 674.73–4711.46 | 0.41–2.98 | 0.23–5.42 | 0.76–5.2 | |
| 669.73 | 305.44 | 0.37 | 1.81 | 2.76 | 2097.23 | 1.31 | 1.76 | 2.34 | ||
| El-Dib | 146.06–747.27 | 72.51–335.63 | 0.09–0.41 | 0.39–2.02 | 0.45–2.84 | 523.71–2309.66 | 0.31–1.44 | 0.09–1.52 | 0.57–2.62 | |
| 297.9 | 139.64 | 0.17 | 0.8 | 1.01 | 985.03 | 0.6 | 0.37 | 1.1 | ||
| Um Mongul | 182.94–371.41 | 86.43–171.22 | 0.11–0.21 | 0.49–1 | 0.61–1.37 | 612.05–1192.61 | 0.37–0.74 | 0.21–0.67 | 0.68–1.34 | |
| 268.59 | 125.11 | 0.15 | 0.73 | 0.94 | 878.49 | 0.54 | 0.39 | 0.98 | ||
| AV | 319.03 | 148.61 | 0.18 | 0.86 | 1.16 | 1040.22 | 0.64 | 0.55 | 1.16 | |
| CPSA | El-Missikat | 308.93–4758.54 | 142.34–2196.25 | 0.17–2.7 | 0.83–12.86 | 1.12–25.12 | 968.68–14728.72 | 0.61–9.43 | 0.52–22.68 | 1.1–15.94 |
| 794.93 | 365.68 | 0.45 | 2.15 | 3.69 | 2487.12 | 1.57 | 2.86 | 2.74 | ||
| El-Gidamy | 266.26–559.15 | 124.64–255.26 | 0.15–0.31 | 0.72–1.51 | 0.93–2.2 | 876.7–1761.4 | 0.54–1.1 | 0.39–1.27 | 0.98–1.97 | |
| 434.36 | 199.19 | 0.24 | 1.17 | 1.63 | 1382.55 | 0.86 | 0.85 | 1.55 | ||
| Ria El-Garra | 154.05–312.06 | 68.32–145.48 | 0.08–0.18 | 0.42–0.84 | 0.59–1.11 | 467.59–1020.01 | 0.29–0.62 | 0.32–0.5 | 0.53–1.14 | |
| 250.05 | 116.88 | 0.14 | 0.68 | 0.88 | 820.78 | 0.5 | 0.39 | 0.92 | ||
| El-Aradiya | 241.14–527.46 | 113.56–245.75 | 0.14–0.3 | 0.65–1.43 | 0.83–2.5 | 801.41–1675.87 | 0.49–1.06 | 0.32–1.99 | 0.89–1.83 | |
| 387.9 | 180.29 | 0.22 | 1.05 | 1.53 | 1251.59 | 0.77 | 0.89 | 1.39 | ||
| Kab Amira | 141.93–641.68 | 69.16–287.69 | 0.08–0.35 | 0.38–1.73 | 0.44–2.24 | 496.69–1993.4 | 0.3–1.24 | 0.11–0.94 | 0.55–2.28 | |
| 291.7 | 135.7 | 0.17 | 0.79 | 1.01 | 953.03 | 0.58 | 0.41 | 1.07 | ||
| Av | 502.64 | 231.93 | 0.28 | 1.36 | 2.13 | 1595.11 | 1 | 1.42 | 1.77 | |
| SPSA | Mueilha | 128.08–390.44 | 60.96–179.89 | 0.07–0.22 | 0.35–1.05 | 0.47–1.53 | 429.56–1245.88 | 0.26–0.77 | 0.22–0.88 | 0.47–1.39 |
| 303.49 | 140.96 | 0.17 | 0.82 | 1.15 | 982.07 | 0.61 | 0.61 | 1.1 | ||
| El-Sella | 112.97–275.39 | 56.12–128.45 | 0.07–0.16 | 0.31–0.74 | 0.35–1 | 406.03–899.77 | 0.24–0.55 | 0.08–0.47 | 0.45–1 | |
| 199.19 | 94.52 | 0.12 | 0.54 | 0.65 | 670.99 | 0.41 | 0.21 | 0.75 | ||
| Sheikh Salem | 211.95–290.89 | 100.4–135.62 | 0.12–0.17 | 0.57–0.79 | 0.69–0.99 | 712.4–954.61 | 0.43–0.58 | 0.23–0.37 | 0.8–1.07 | |
| 244.11 | 114.74 | 0.14 | 0.66 | 0.82 | 810.71 | 0.49 | 0.29 | 0.91 | ||
| El Bakreya | 173.77–345.69 | 83.65–158.14 | 0.1–0.19 | 0.47–0.93 | 0.58–1.27 | 595.73–1098.45 | 0.36–0.68 | 0.21–0.63 | 0.66–1.24 | |
| 233.35 | 109.69 | 0.13 | 0.63 | 0.83 | 771.16 | 0.47 | 0.37 | 0.86 | ||
| Abu Dabbab | 80.39–342.39 | 41.42–154.92 | 0.05–0.19 | 0.22–0.92 | 0.25–1.22 | 302.79–1074.81 | 0.18–0.67 | 0.06–0.55 | 0.33–1.22 | |
| 138.1 | 66.86 | 0.08 | 0.37 | 0.45 | 477.66 | 0.29 | 0.15 | 0.53 | ||
| El Shalul | 114.21–167.35 | 56.31–81.02 | 0.07–0.1 | 0.31–0.45 | 0.37–0.57 | 404.53–577 | 0.24–0.35 | 0.12–0.22 | 0.44–0.64 | |
| 138.18 | 67.61 | 0.08 | 0.37 | 0.46 | 484.15 | 0.29 | 0.16 | 0.53 | ||
| Av | 219.62 | 103.54 | 0.13 | 0.59 | 0.78 | 729.06 | 0.44 | 0.34 | 0.81 | |
| Recommended values | 370 | 59 | 0.07 | 1 | 1 | 300 | 0.29 | ≤1 | ≤2 | |
© 2019 by the authors. Licensee MDPI, Basel, Switzerland. This article is an open access article distributed under the terms and conditions of the Creative Commons Attribution (CC BY) license (http://creativecommons.org/licenses/by/4.0/).
Share and Cite
MDPI and ACS Style
El-Gamal, H.; Sidique, E.; El-Haddad, M. Spatial Distributions and Risk Assessment of the Natural Radionuclides in the Granitic Rocks from the Eastern Desert, Egypt. Minerals 2019, 9, 386. https://doi.org/10.3390/min9070386
AMA Style
El-Gamal H, Sidique E, El-Haddad M. Spatial Distributions and Risk Assessment of the Natural Radionuclides in the Granitic Rocks from the Eastern Desert, Egypt. Minerals. 2019; 9(7):386. https://doi.org/10.3390/min9070386
Chicago/Turabian StyleEl-Gamal, Hany, Essam Sidique, and Mervat El-Haddad. 2019. "Spatial Distributions and Risk Assessment of the Natural Radionuclides in the Granitic Rocks from the Eastern Desert, Egypt" Minerals 9, no. 7: 386. https://doi.org/10.3390/min9070386
Note that from the first issue of 2016, this journal uses article numbers instead of page numbers. See further details here.