Article

Biomineral Reactivity: The Kinetics of the Replacement Reaction of Biological Aragonite to Apatite

by
Martina Greiner
1,*,
Lurdes Férnandez-Díaz
2,3,
Erika Griesshaber
1,
Moritz N. Zenkert
1,
Xiaofei Yin
1,
Andreas Ziegler
4,
Sabino Veintemillas-Verdaguer
5 and
Wolfgang W. Schmahl
1
1
Department für Geo-und Umweltwissenschaften, Ludwig-Maximilians-Universität, 80333 Munich, Germany
2
Departamento de Mineralogía y Petrología, Universidad Complutense de Madrid, 28040 Madrid, Spain
3
Instituto de Geociencias (IGEO), (UCM, CSIC), Ciudad Universitaria, 28040 Madrid, Spain
4
Central Facility for Electron Microscopy, University of Ulm, Albert-Einstein-Allee 11, 89069 Ulm, Germany
5
Instituto de Ciencia de Materiales de Madrid (ICMM, CSIC), Cantoblanco, 28049 Madrid, Spain
*
Author to whom correspondence should be addressed.
Minerals 2018, 8(8), 315; https://doi.org/10.3390/min8080315
Submission received: 18 June 2018 / Revised: 16 July 2018 / Accepted: 20 July 2018 / Published: 26 July 2018
(This article belongs to the Special Issue Mineral Surface Reactions at the Nanoscale)

Abstract

:
We present results of bioaragonite to apatite conversion in bivalve, coral and cuttlebone skeletons, biological hard materials distinguished by specific microstructures, skeletal densities, original porosities and biopolymer contents. The most profound conversion occurs in the cuttlebone of the cephalopod Sepia officinalis, the least effect is observed for the nacreous shell portion of the bivalve Hyriopsis cumingii. The shell of the bivalve Arctica islandica consists of cross-lamellar aragonite, is dense at its innermost and porous at the seaward pointing shell layers. Increased porosity facilitates infiltration of the reaction fluid and renders large surface areas for the dissolution of aragonite and conversion to apatite. Skeletal microstructures of the coral Porites sp. and prismatic H. cumingii allow considerable conversion to apatite. Even though the surface area in Porites sp. is significantly larger in comparison to that of prismatic H. cumingii, the coral skeleton consists of clusters of dense, acicular aragonite. Conversion in the latter is sluggish at first as most apatite precipitates only onto its surface area. However, the process is accelerated when, in addition, fluids enter the hard tissue at centers of calcification. The prismatic shell portion of H. cumingii is readily transformed to apatite as we find here an increased porosity between prisms as well as within the membranes encasing the prisms. In conclusion, we observe distinct differences in bioaragonite to apatite conversion rates and kinetics depending on the feasibility of the reaction fluid to access aragonite crystallites. The latter is dependent on the content of biopolymers within the hard tissue, their feasibility to be decomposed, the extent of newly formed mineral surface area and the specific biogenic ultra- and microstructures.

1. Introduction

Research of the last decades has shown that carbonate biological hard tissues of marine and terrestrial organisms are highly valuable for their use in medical applications (e.g., [1,2,3,4,5,6]) e.g., as bone implant and bone graft materials. This is called forth not only by their biocompatibility, biodegradability and osteoconductive capabilities but also by their unique architectures: their specific shapes, varying porosities and thus compactness as well as pore size distributions. Many carbonate biological hard tissues were tested for their applicability for medical tasks (e.g., sponges, corals, coralline algae, cuttlefish bone, echinoderms, marine and terrestrial bivalves (e.g., [5]). Two of these emerged as being highly valuable: bivalve shell nacreous and coral skeleton aragonite [5,7,8,9,10,11,12,13,14,15].
The ideal material for bone tissue engineering has to provide initial mechanical strength for support as well as the ability of gradual resorption for the replacement with newly synthesized tissue. The first materials that were used for bone graft substitutes were dense materials in granule or particulate form (e.g., [5]). However, as these were only partially resorbable, replacement by new bone was often incomplete. The desire to mimic the natural structure of bone more closely led to the use of porous biological and biomimetic hard tissues, as these allow an improved interdigitation with the host bone and promote fluid exchange. This led to the search of naturally occurring scaffolds with bone like structures, e.g., coral skeletons. For this purpose, several colonial coral species were studied (e.g., Porites sp., Goniopora sp., Acropora sp., Lophelia sp., Madropora sp. [5], some having skeletal architectures (e.g., that of Porites sp.) resembling spongy cancellous bone and, others with a dense skeleton (e.g., Acropora sp., Madropora sp.), mimicking cortical bone. However, clinical tests showed that when too much stimulus is applied, pure coral scaffolds resorb too rapidly during the process of new bone formation. Hence, for use in medical applications, coral aragonite had to be functionalized into a, for the medical task, more appropriate material. Prior to use as a bone graft material, coral aragonite has to be transformed hydrothermally to apatite (AP). The conversion is performed only partially, such that an inner bioaragonite core is covered with an outer AP-coating. As aragonite is more soluble than apatite, the controlled conversion of bioaragonite to AP ensures a guided biodegradation rate that, if necessary, can be modified and tuned to local medical requirements [4,13]. The partial conversion of coral aragonite into AP ensures that the obtained bone graft material retains its porous structure and remains biocompatible, but has also improved biodegradation properties that suit better bone remodeling and turnover.
Conditioning of sepia cuttlebone and coral aragonite, echinoderm carapace and sea urchin spine calcite via hydrothermal conversion to AP has shown that in all cases porosity characteristics (pore abundance, size and distribution) of the apatite product were ideal for their use in medical applications. However, conversion times to AP were highly variable and depended on both, the chosen experimental conditions and the specific biological hard tissue. In the present manuscript we investigate the impact of different biocarbonate hard materials on the rate and kinetics of bioaragonite to apatite (AP) conversion. We use an open system set up, thus we allow under boiling conditions the continuous re-equilibration with atmosphere (see also [16]). We discuss major factors that lead to the differential reactivity of the biocarbonate hard tissue when transformed to AP, with the main focus being centered around the impact of distinct bioaragonite microstructures: that being present in the shell of the fresh water bivalve Hyriopsis cumingii, in the shell of the deep water, marine bivalve Arctica islandica, the microstructure that forms the skeleton of the warm water scleractinian coral Porites sp. and that, that comprises the lightweight structure of the cuttlebone of the cephalopod Sepia officinalis. We discuss results of conversion experiments that lasted up to 14 days and explore the role and effect of mineral organization, skeleton density, skeletal primary porosity and biopolymer content, fabric and distribution in the hard tissue for the kinetics of bioaragonite to AP conversion.

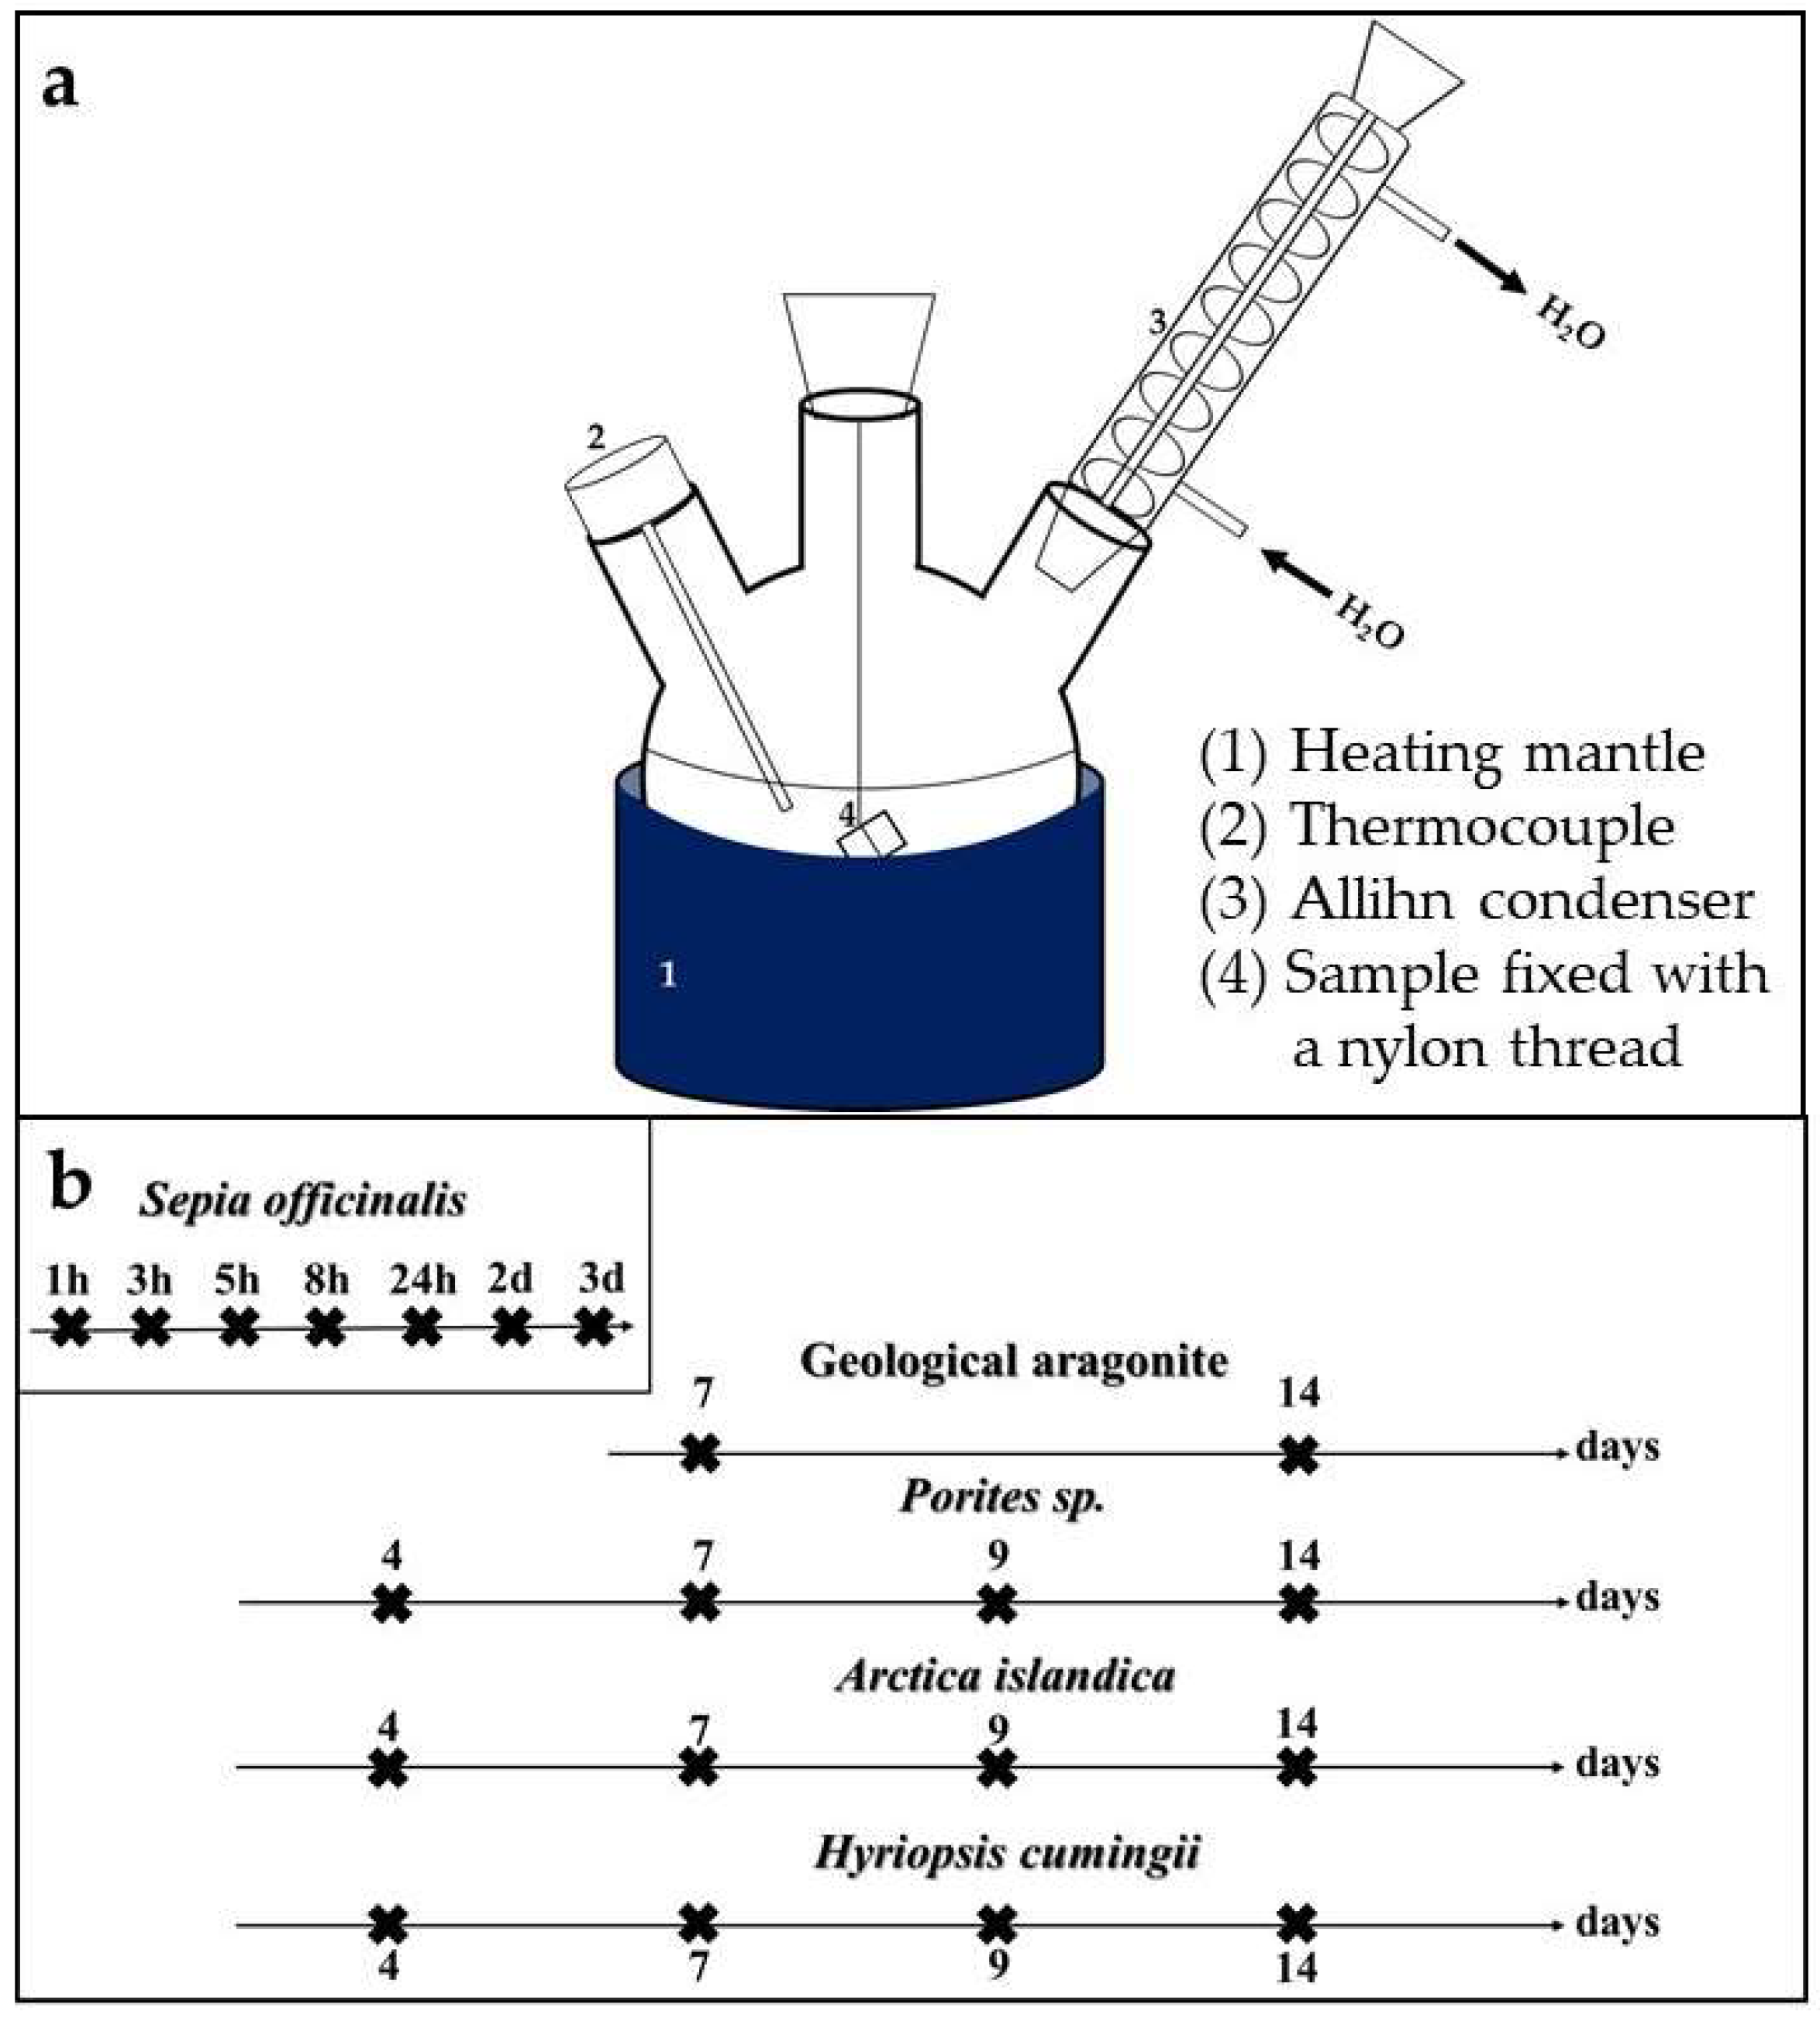
2. Materials and Methods

2.1. Test Materials

The warm-water coral Porites sp. was collected in Moorea, French Polynesia. Arctica islandica shell samples were collected in Loch Etive waters in Scotland. Hyriopsis cumingii samples were collected from Gaobao lake in China. Sepia officinalis cuttlebone was collected close to Elba in the Mediterranean Sea. The geological aragonite comes from Molina de Aragon in Spain.

2.2. Experimental Setup

Mineral conversion reactions were performed in a 2000 mL round flask filled with 1500 mL 1 M (NH4)2HPO4 solution (Figure A1a). The diammonium hydrogen phosphate (Sigma-Aldrich, St. Louis, MO, USA) solution was prepared with high purity deionized water (18.2 MΩ). The system was heated with a heating mantle and kept at a constant temperature of about 99 °C that guaranteed that the aqueous solution was permanently boiling. A reflux condenser with constant flow of cold water was used to avoid water evaporation during the experiments. However, this reflux condenser did not prevent the escape of gases (e.g., CO2) to the atmosphere.
Similarly sized fragments of the hard tissues were immersed in the boiling solution. In the case of Sepia officinalis cuttlebone the investigated samples were 15 mm sided cubes, while in the case of Porites sp. we used cylindrically shaped sample pieces (12 × 8 mm). 20 × 10 mm thick fragments were used for Arctica islandica and Hyriopsis cumingii. Initial sample weights ranged between 0.3 and 1.2 g. As the aqueous solution volume to biomineral weight was very high, the small initial differences in sample weights are irrelevant. The samples were recovered from the solution after specific conversion reaction times (Figure A1b), were washed with distilled water and were stored in isopropanol. CaCO3 biominerals interacted with the phosphate-bearing boiling solution in an open system. Hence, our experimental setup, shown in Figure A1a, allowed for a continuous re-equilibration with atmosphere.

2.3. Organic Matrix Preparation by Selective Etching

In order to image the organic matrix, sample pieces were mounted on 3 mm thick cylindrical aluminium rods using super glue. The samples were first cut using a Leica Ultracut ultramicrotome with glass knifes to obtain plane surfaces. The cut pieces were then polished with a diamond knife by stepwise removal of material in a series of 20 sections with successively decreasing thicknesses (90 nm, 70 nm, 50 nm). The polished samples were etched for 180 s using 0.1 M HEPES (pH = 6.5) containing 2.5% glutaraldehyde as a fixation solution. The etching procedure was followed by dehydration in 100% isopropanol three times for 10 min each, before specimens were critical point dried. The dried samples were rotary coated with 4 nm platinum and imaged using a Hitachi S5200 Field Emission-Scanning Electron Microscope (FE-SEM) at 4 kV.

2.4. Characterization Methods
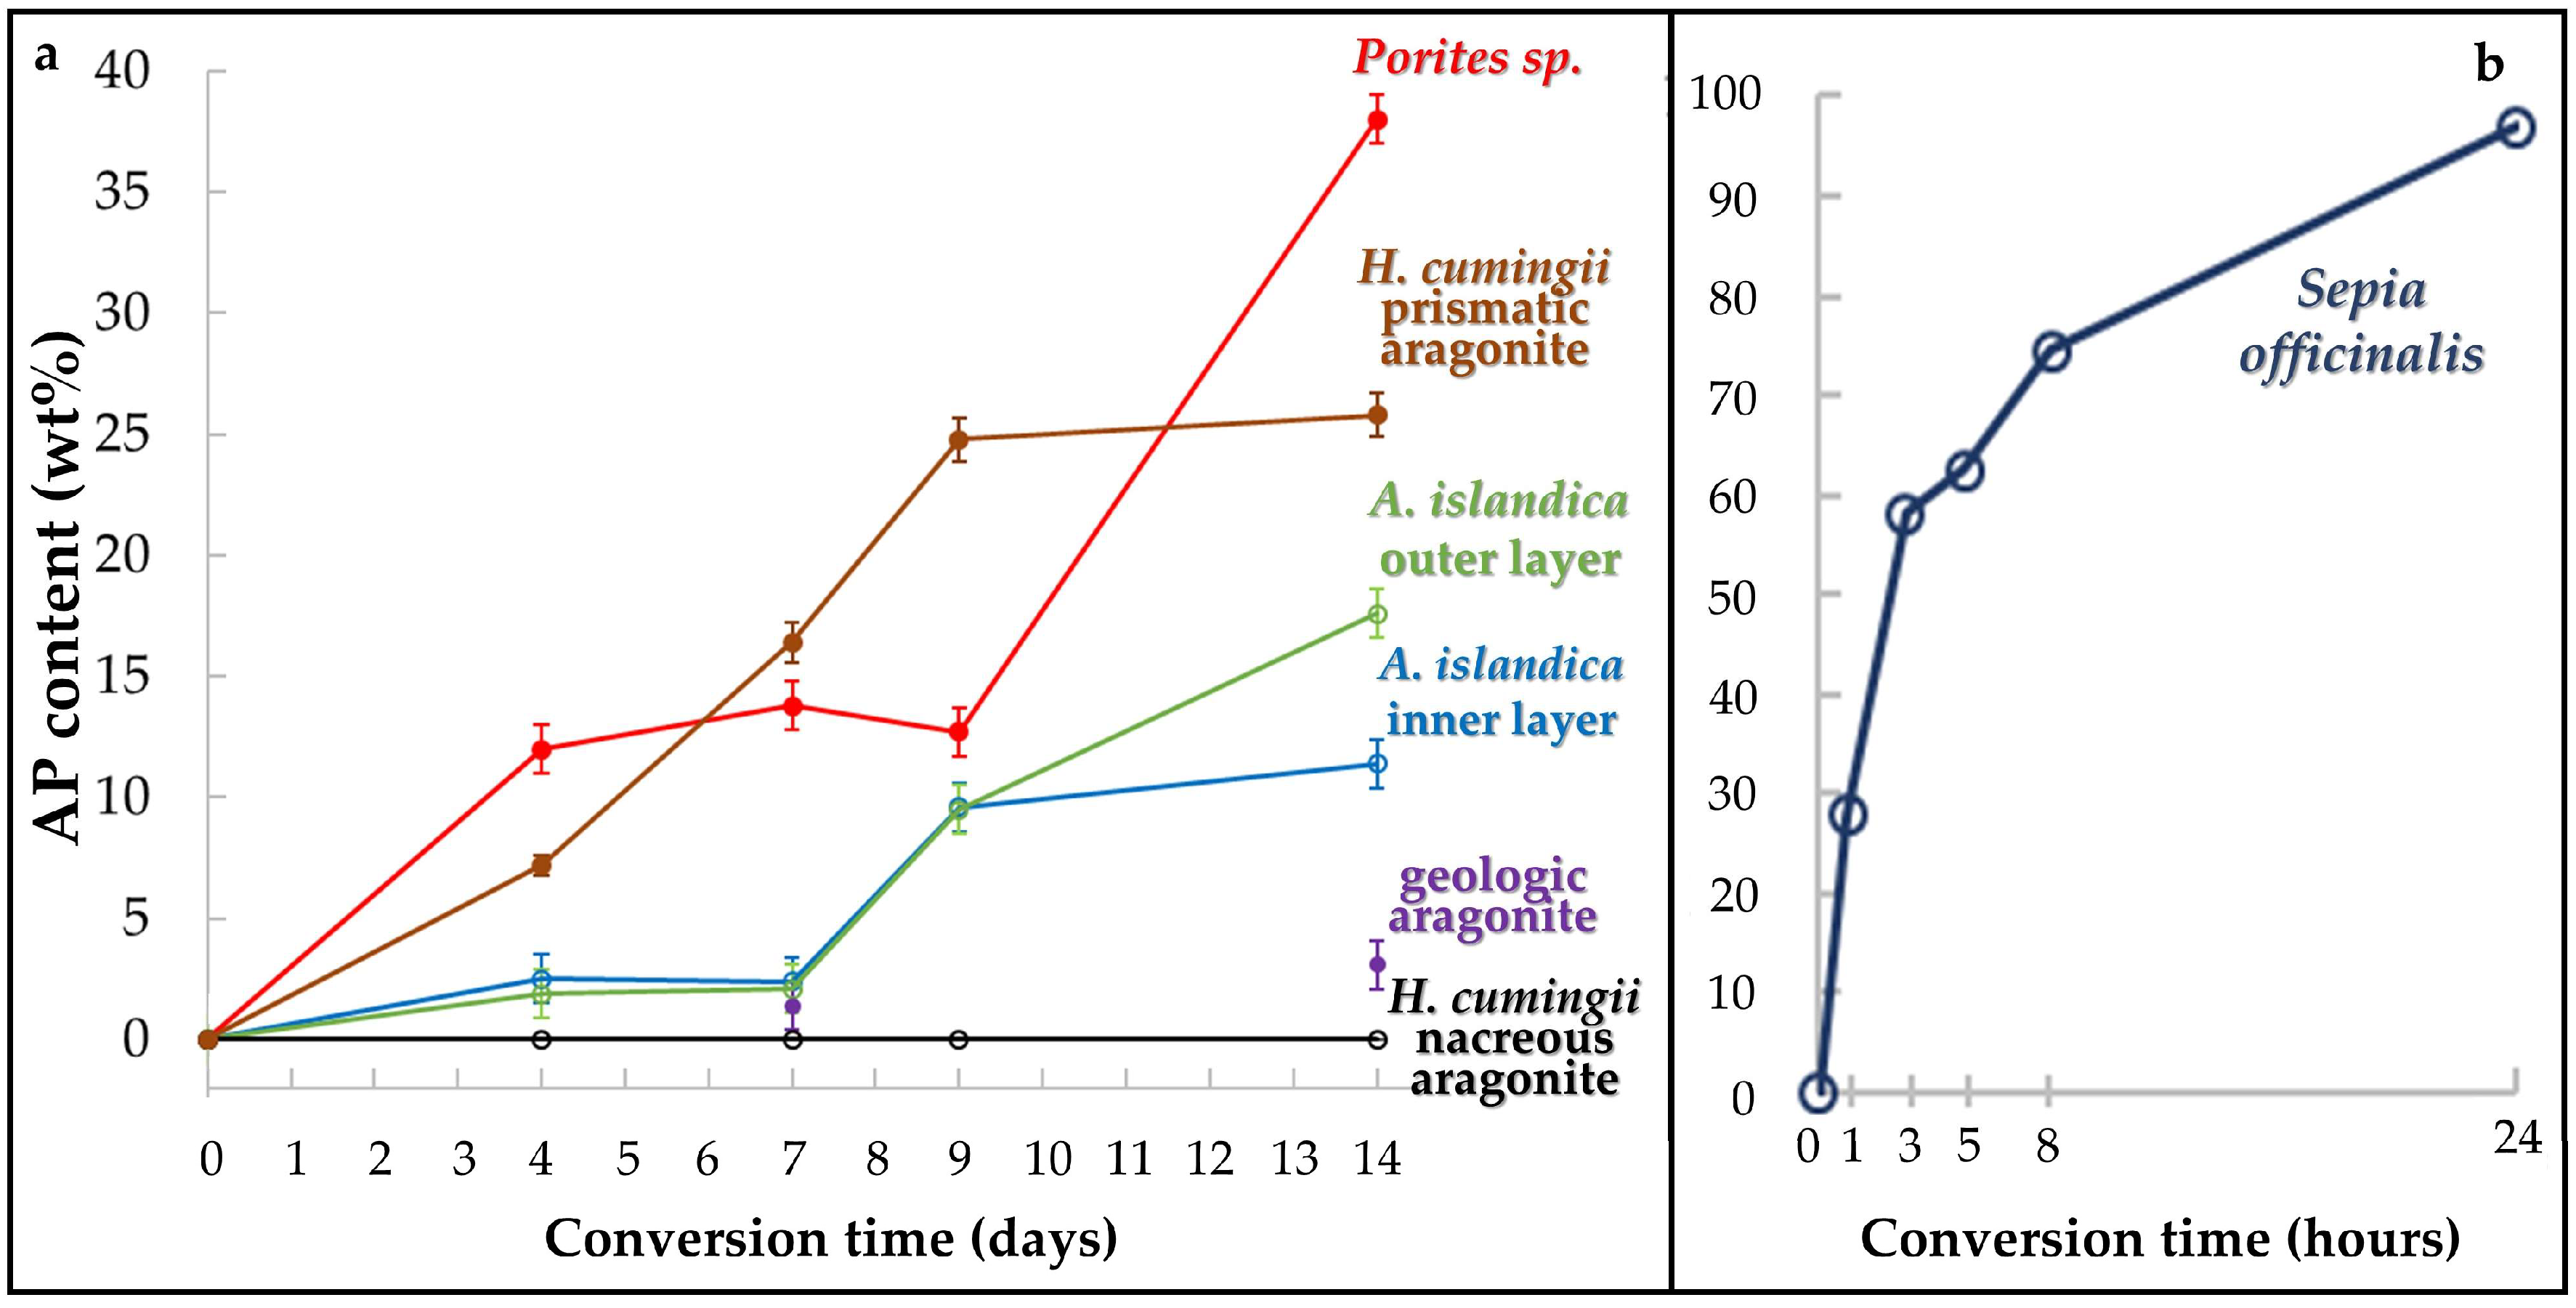
X-ray patterns of all samples were collected on a Bragg-Brentano type X-ray diffractometer (XRD 3003 TT, GE Sensing & Inspection Technologies, Hürth, Germany) with Cu-Kα1-radiation and a 2θ angle from 10°–110° with a step size of 0.013°. Rietveld refinement was performed with the program FullProf [17] on all samples containing more than 5 wt % AP. Refinements were conducted using the structural model of aragonite published by Jarosch and Heger [18] and the model of AP published by Kay et al. [19]. For samples with an AP content lower than 5 wt % a semi-quantitative percentage estimation was performed using the Reference Intensity (RIR) method [20] using the structural phase models mentioned before.
For the calculation of crystallite sizes, the pristine aragonitic sample was mixed with an internal standard (LaB6, 10 wt %) to determine the instrumental resolution function. Thereafter the Thompson-Cox-Hastings method [21] for convolution of instrumental resolution and isotropic microstrain broadening was applied on the XRD pattern of the pristine sample.
Infrared spectra were measured on a Perkin–Elmer (Waltham, MA, USA) ATR-FTIR Spectrum two instrument with a resolution of 4 cm−1 with 128 scans.
The samples were rotary-coated with 5 nm of platinum-palladium and imaged using a Hitachi SU5000 field emission-scanning electron microscope (Tokyo, Japan).

3. Results

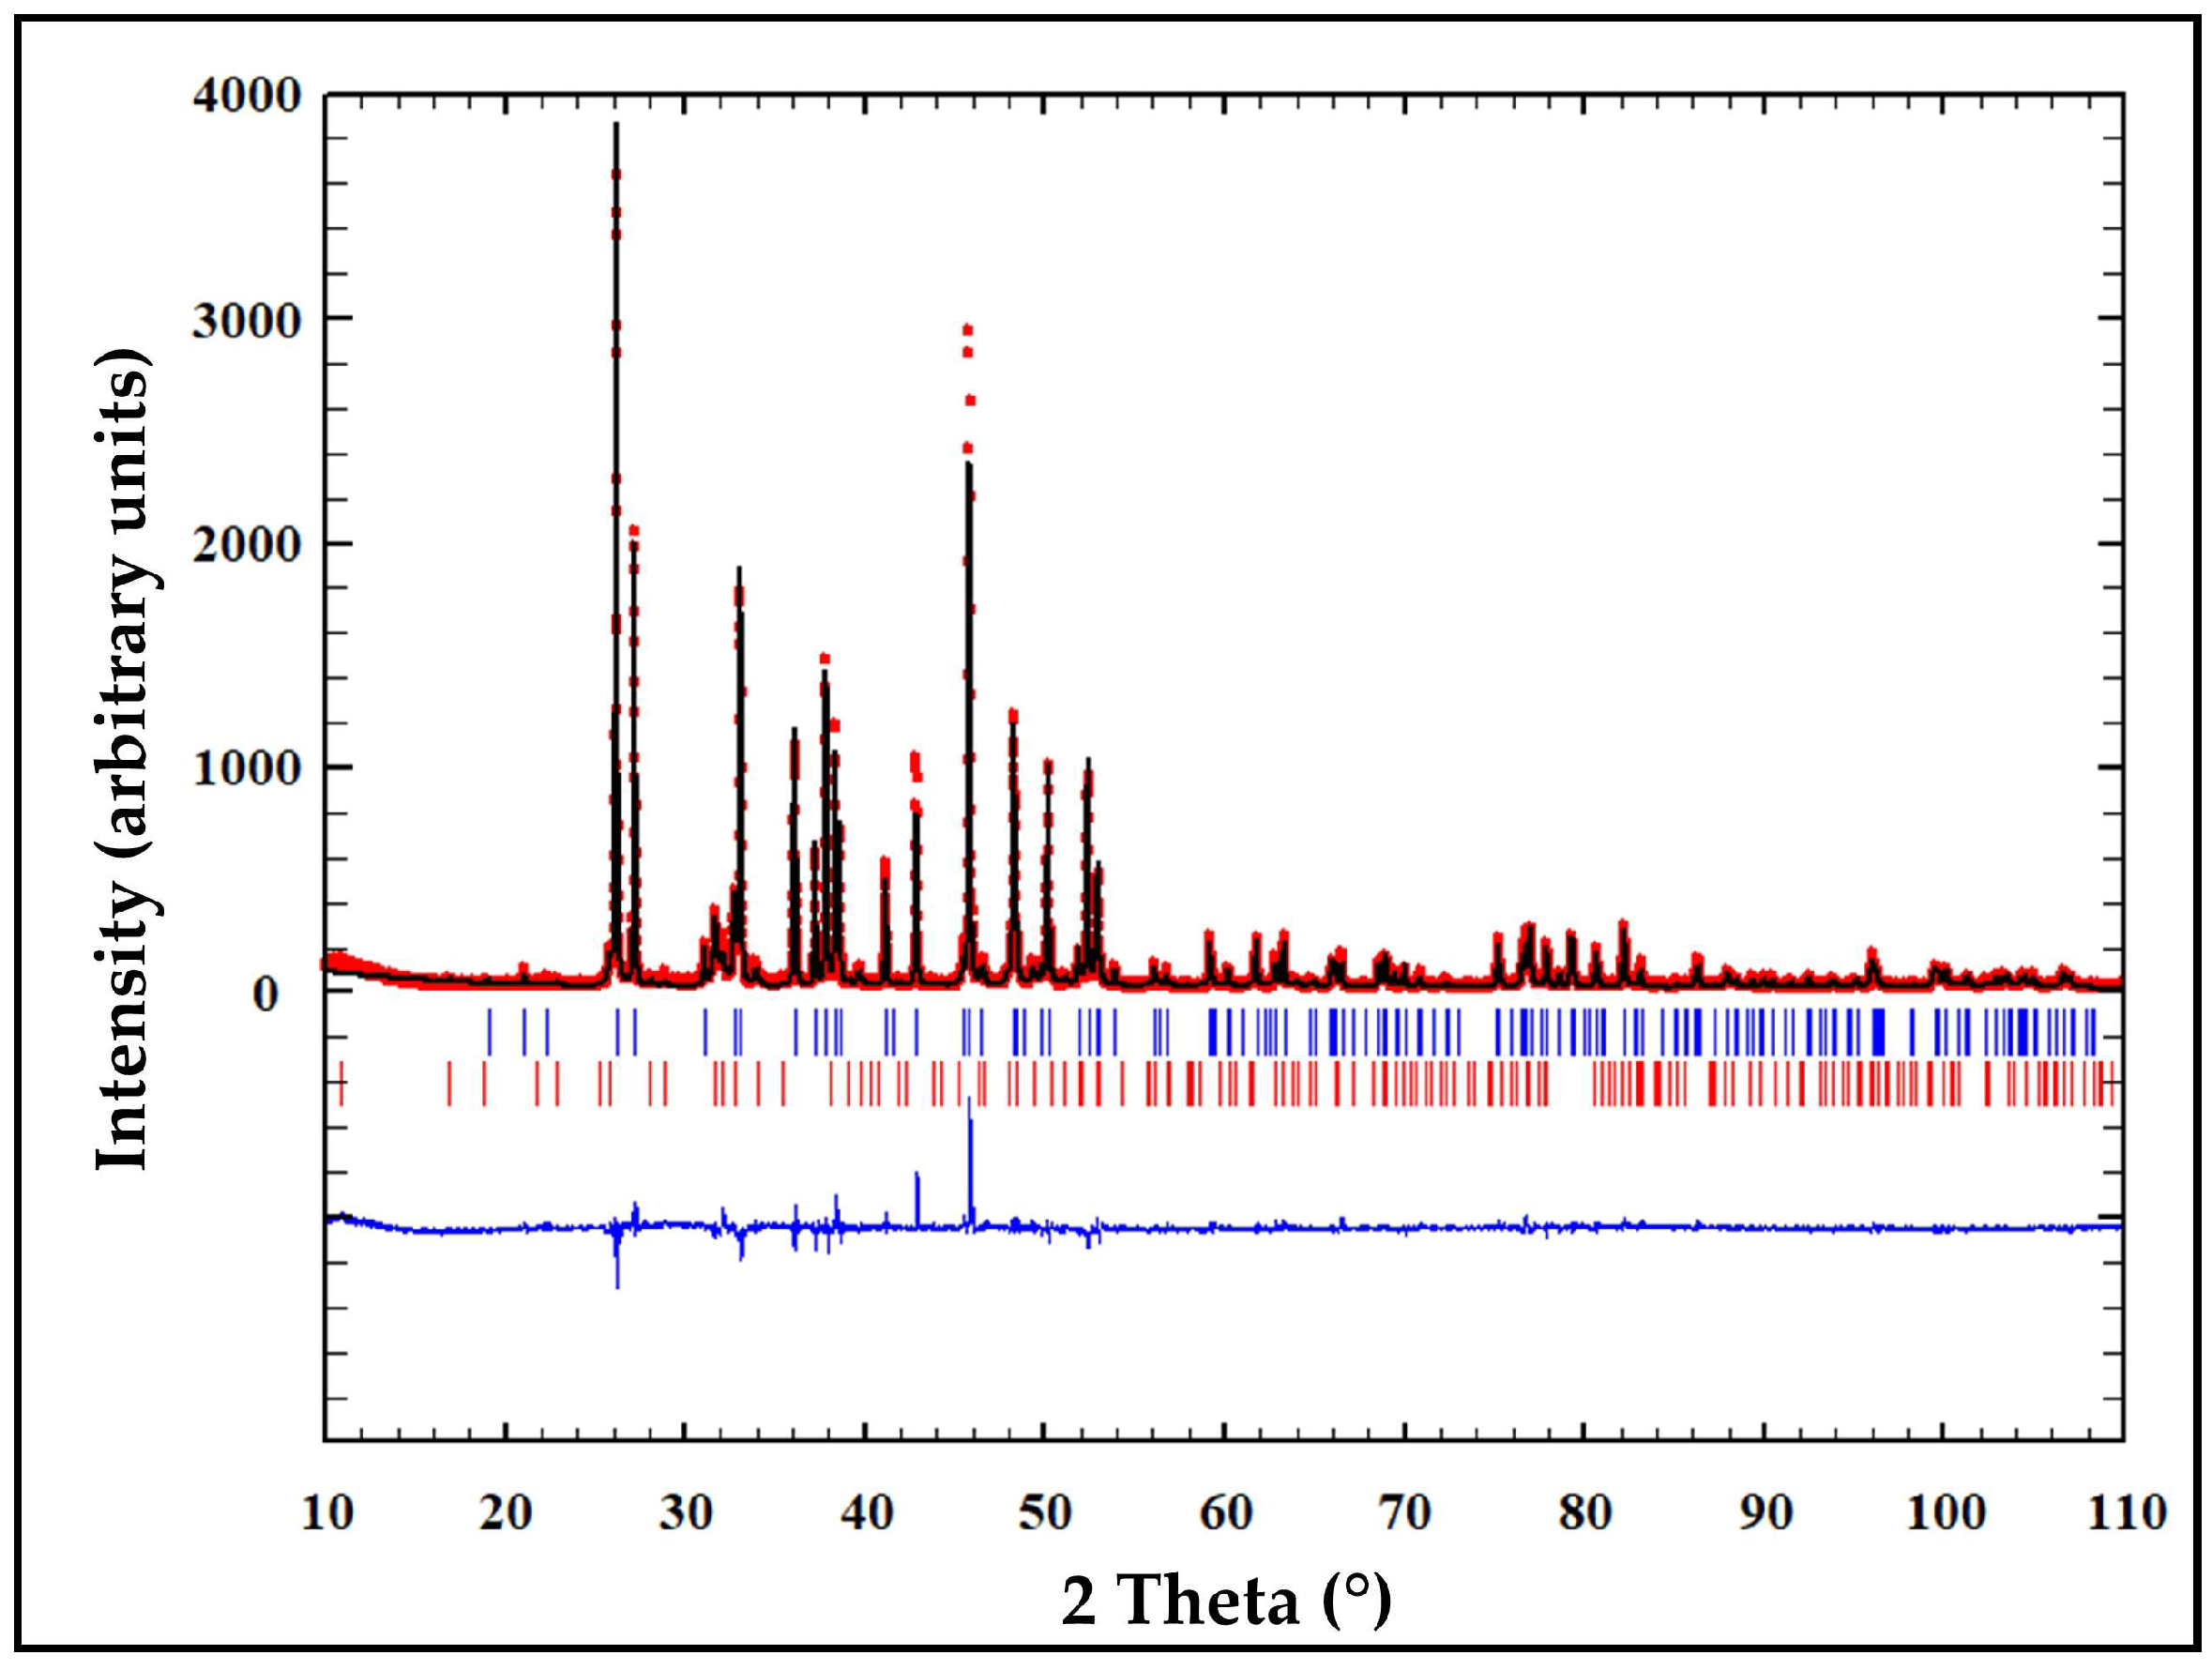
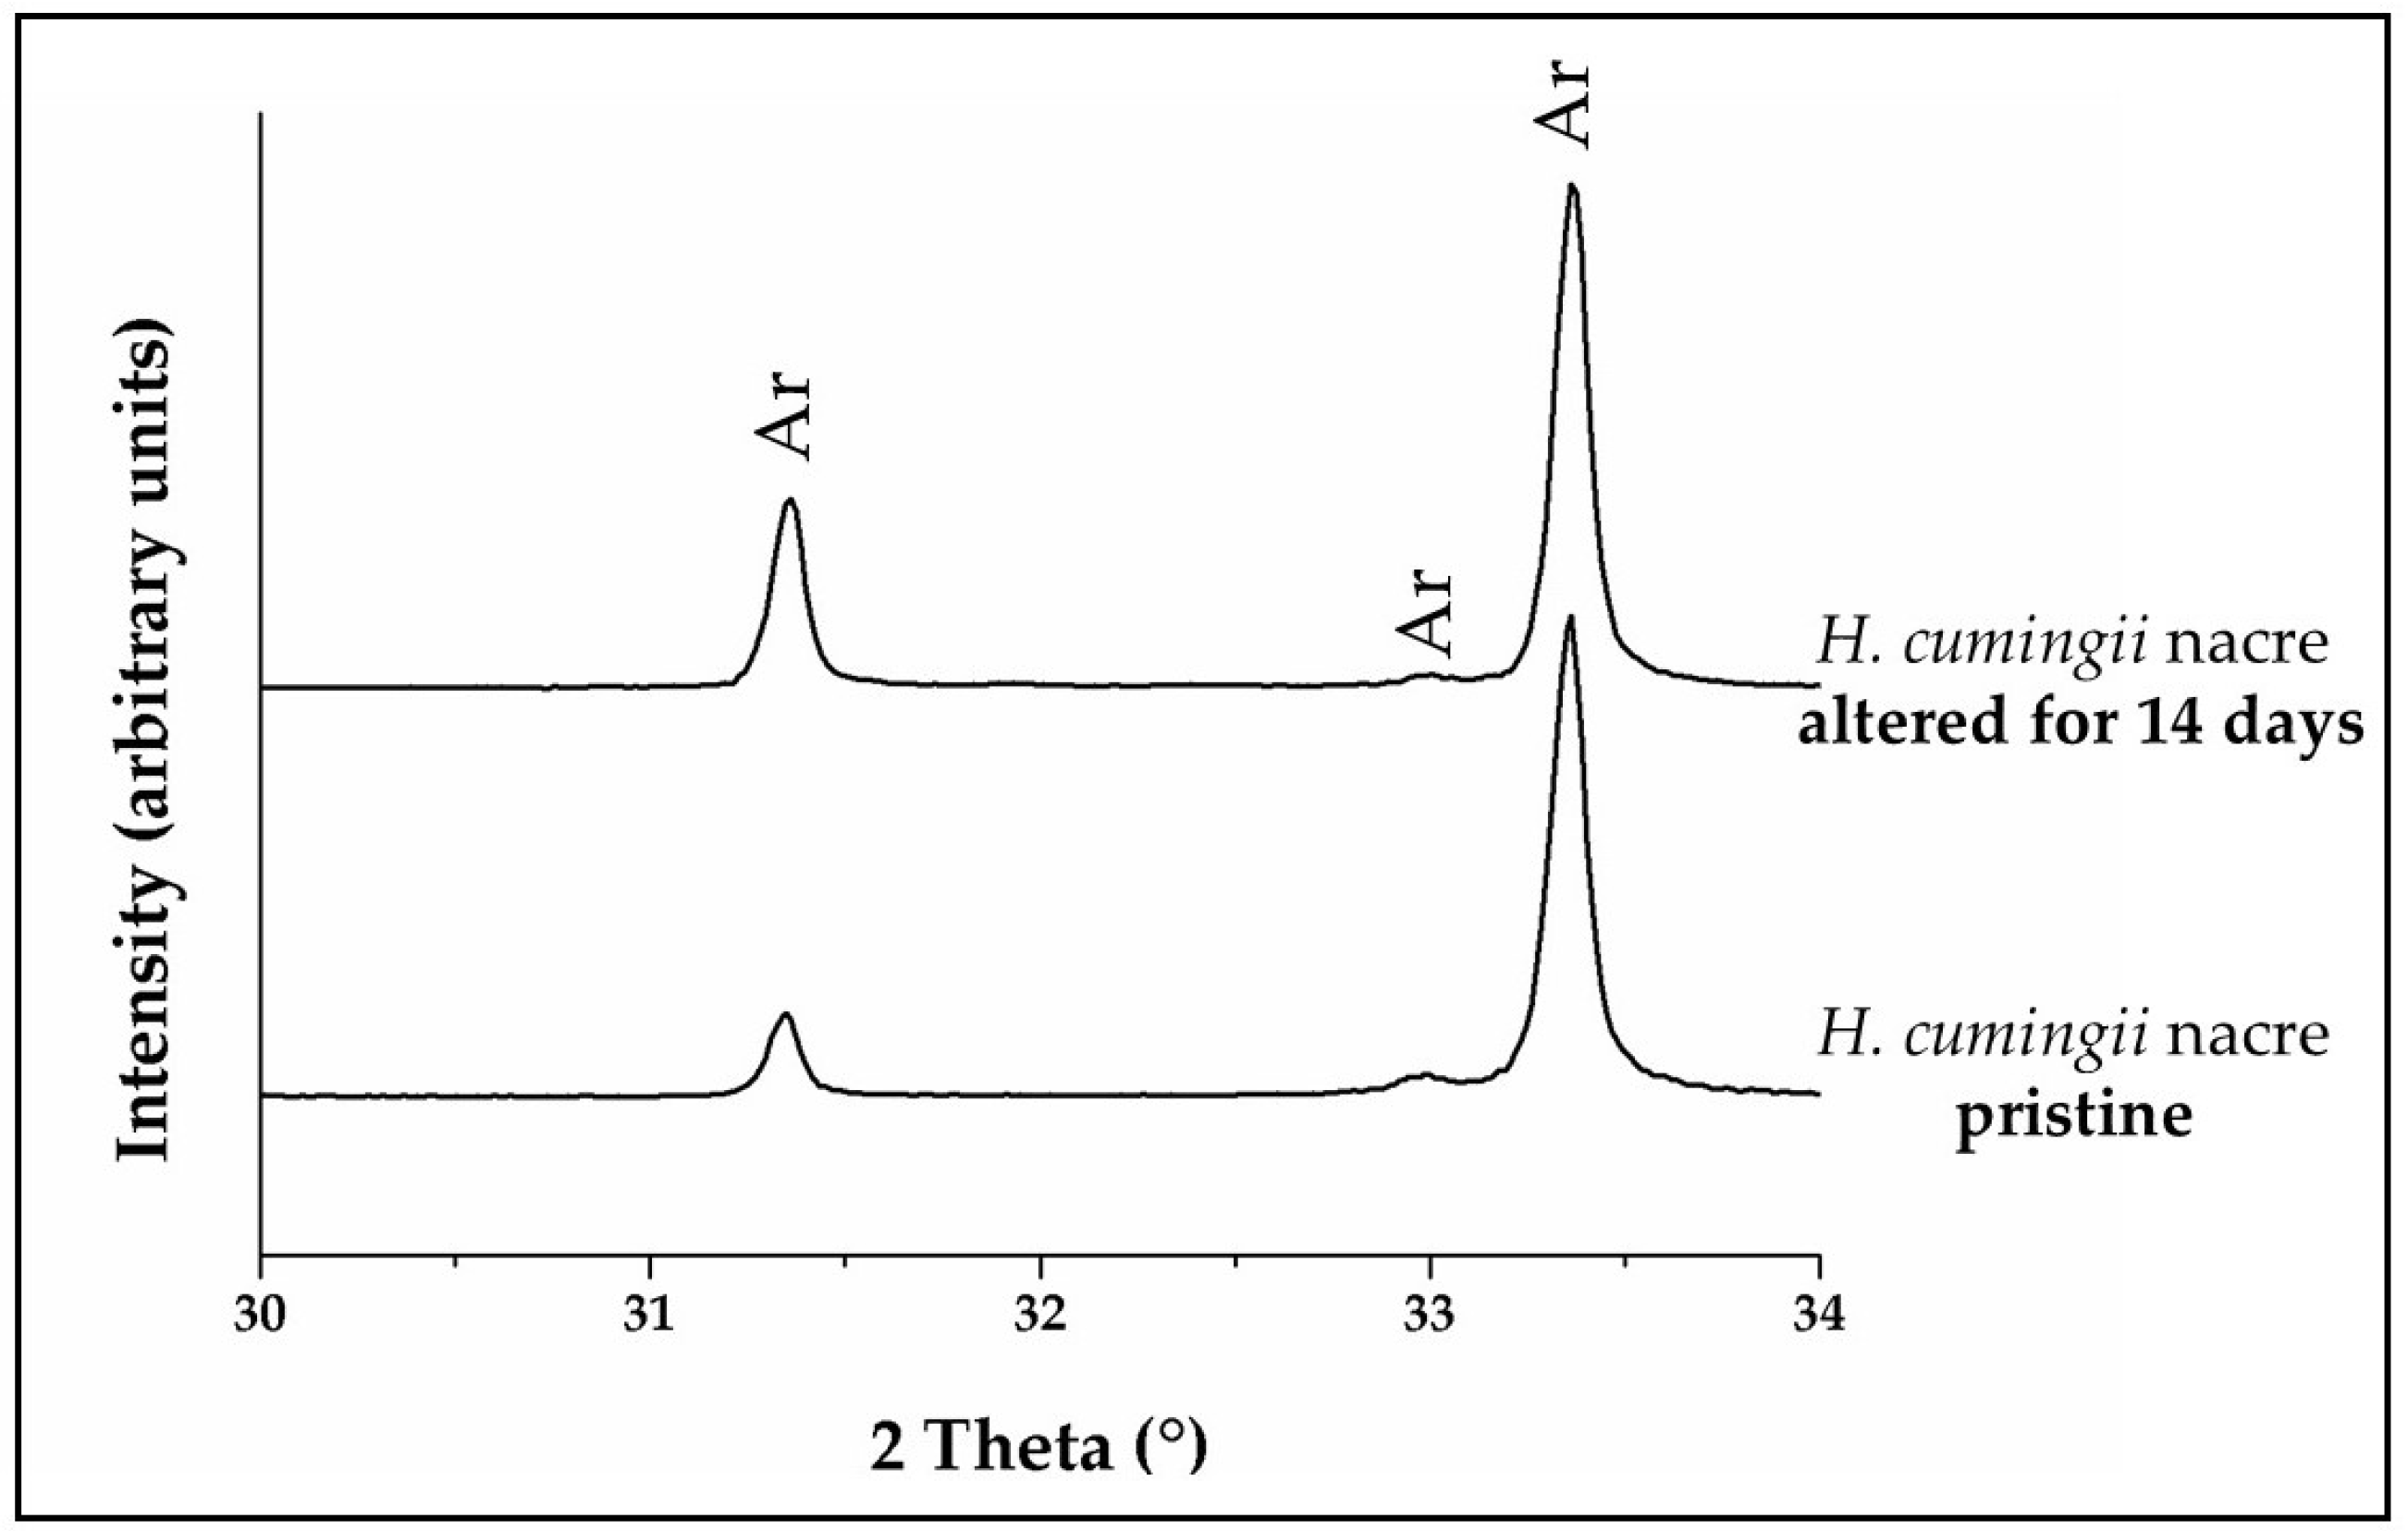
3.1. X-Ray Diffraction Analysis

XRD measurements confirm that all investigated hard tissues consist of aragonite and evidence that their conversion into AP does not involve any intermediate calcium phosphate. All refinements give a good agreement between observed and calculated profile (Chi2 < 2.8, an exemplary Rietveld fit is shown in Figure A2). All obtained XRD patterns are shown in the Supplementary section of this manuscript. Table 1 and Figure 1 provide the percentage of aragonite to AP conversion as a function of conversion time, calculated from Rietveld analyses. We find a significant difference in newly formed AP between the studied biological hard tissues, not only between themselves but also between the biogenic samples and geological aragonite. The latter appears to be highly unreactive compared to most biogenic aragonites (Table 1).
Results of Rietveld refinements of XRD patterns of the aragonitic biogenic precursors versus time are shown in Figure 1. These as well highlight the striking differences in reactivity between the investigated samples. The highest reactivity is observed in Sepia officinalis cuttlebone, which consists of more than 60 wt % AP after only 5 h of conversion with the phosphate-bearing boiling solution. After 24 h, the conversion of the bioaragonite into AP is almost complete (Figure 1, Table 1). These results are in good agreement with those reported by Reinares-Fisac et al., 2017 [16]. All other investigated biological hard tissues transform at a much slower rate. Out of these we find the fastest conversion kinetics for the skeleton of Porites sp. The conversion trend is characterized by an initial rapid conversion speed, reaching 12 wt % AP after 4 days of reaction. With proceeding time, conversion does not progress further for the following 5 days. However, subsequently conversion kinetics accelerates again such that at 14 days of conversion 38 wt % AP is formed in the skeleton of Porites sp. (Figure 1). The shells of the bivalves, Arctica islandica and Hyriopsis cumingii react differently to conversion. Rietveld refinements of the XRD patterns of the shell of Arctica islandica show a similar conversion trend for both, the inner (shell portion next to the soft tissue of the animal) and the outer (seaward pointing) shell layer. Conversion starts first at a slow rate (~2 wt % of newly formed AP after 7 days of reaction), while after 9 days of reaction (~9.5 wt % of newly formed AP) it speeds up. Alteration for the last five days is differently realized in the different shell portions of Arctica islandica. A fairly high conversion rate is observed for the seaward pointing shell part, while aragonite forming inner shell portions next to the soft tissue of the animal appears to be almost resistant to dissolution of aragonite and, hence, conversion to AP (Figure 1, Table 1).
Most striking is the very different conversion behavior of nacreous aragonite (next to the soft tissue of the animal) and the prismatic shell portion (seawater pointing shell layer) of Hyriopsis cumingii (Figure 1, Table 1). All diffraction peaks in XRD patterns of the nacre sample can be assigned to aragonite, regardless the time of interaction with the phosphate-bearing aqueous solution. This evidences that the nacre did not undergo any conversion to AP during the time span of our experiments (Figure A3). In contrast, the prismatic shell portion of Hyriopsis cumingii is readily transformed to apatite. We see a steady increase in conversion rate up to 9 days of alteration (Figure 1); about 25 wt % AP was found in the prismatic hard tissue of Hyriopsis cumingii after this alteration time. However, for the subsequent 5 days only minute amounts of bioaragonite transformed to AP in the prismatic shell portion of Hyriopsis cumingii (Figure 1, Table 1). In order to investigate the influence of the aragonite crystallite sizes on the reactivity, we calculated the crystallite size of Sepia officinalis cuttlebone and Hyriopsis cumingii nacreous aragonite by Rietveld refinement. The average size of nacreous aragonite crystals in H. cumingii is 504 Å; for Sepia officinalis the average granular aragonite crystallite size is 486 Å.

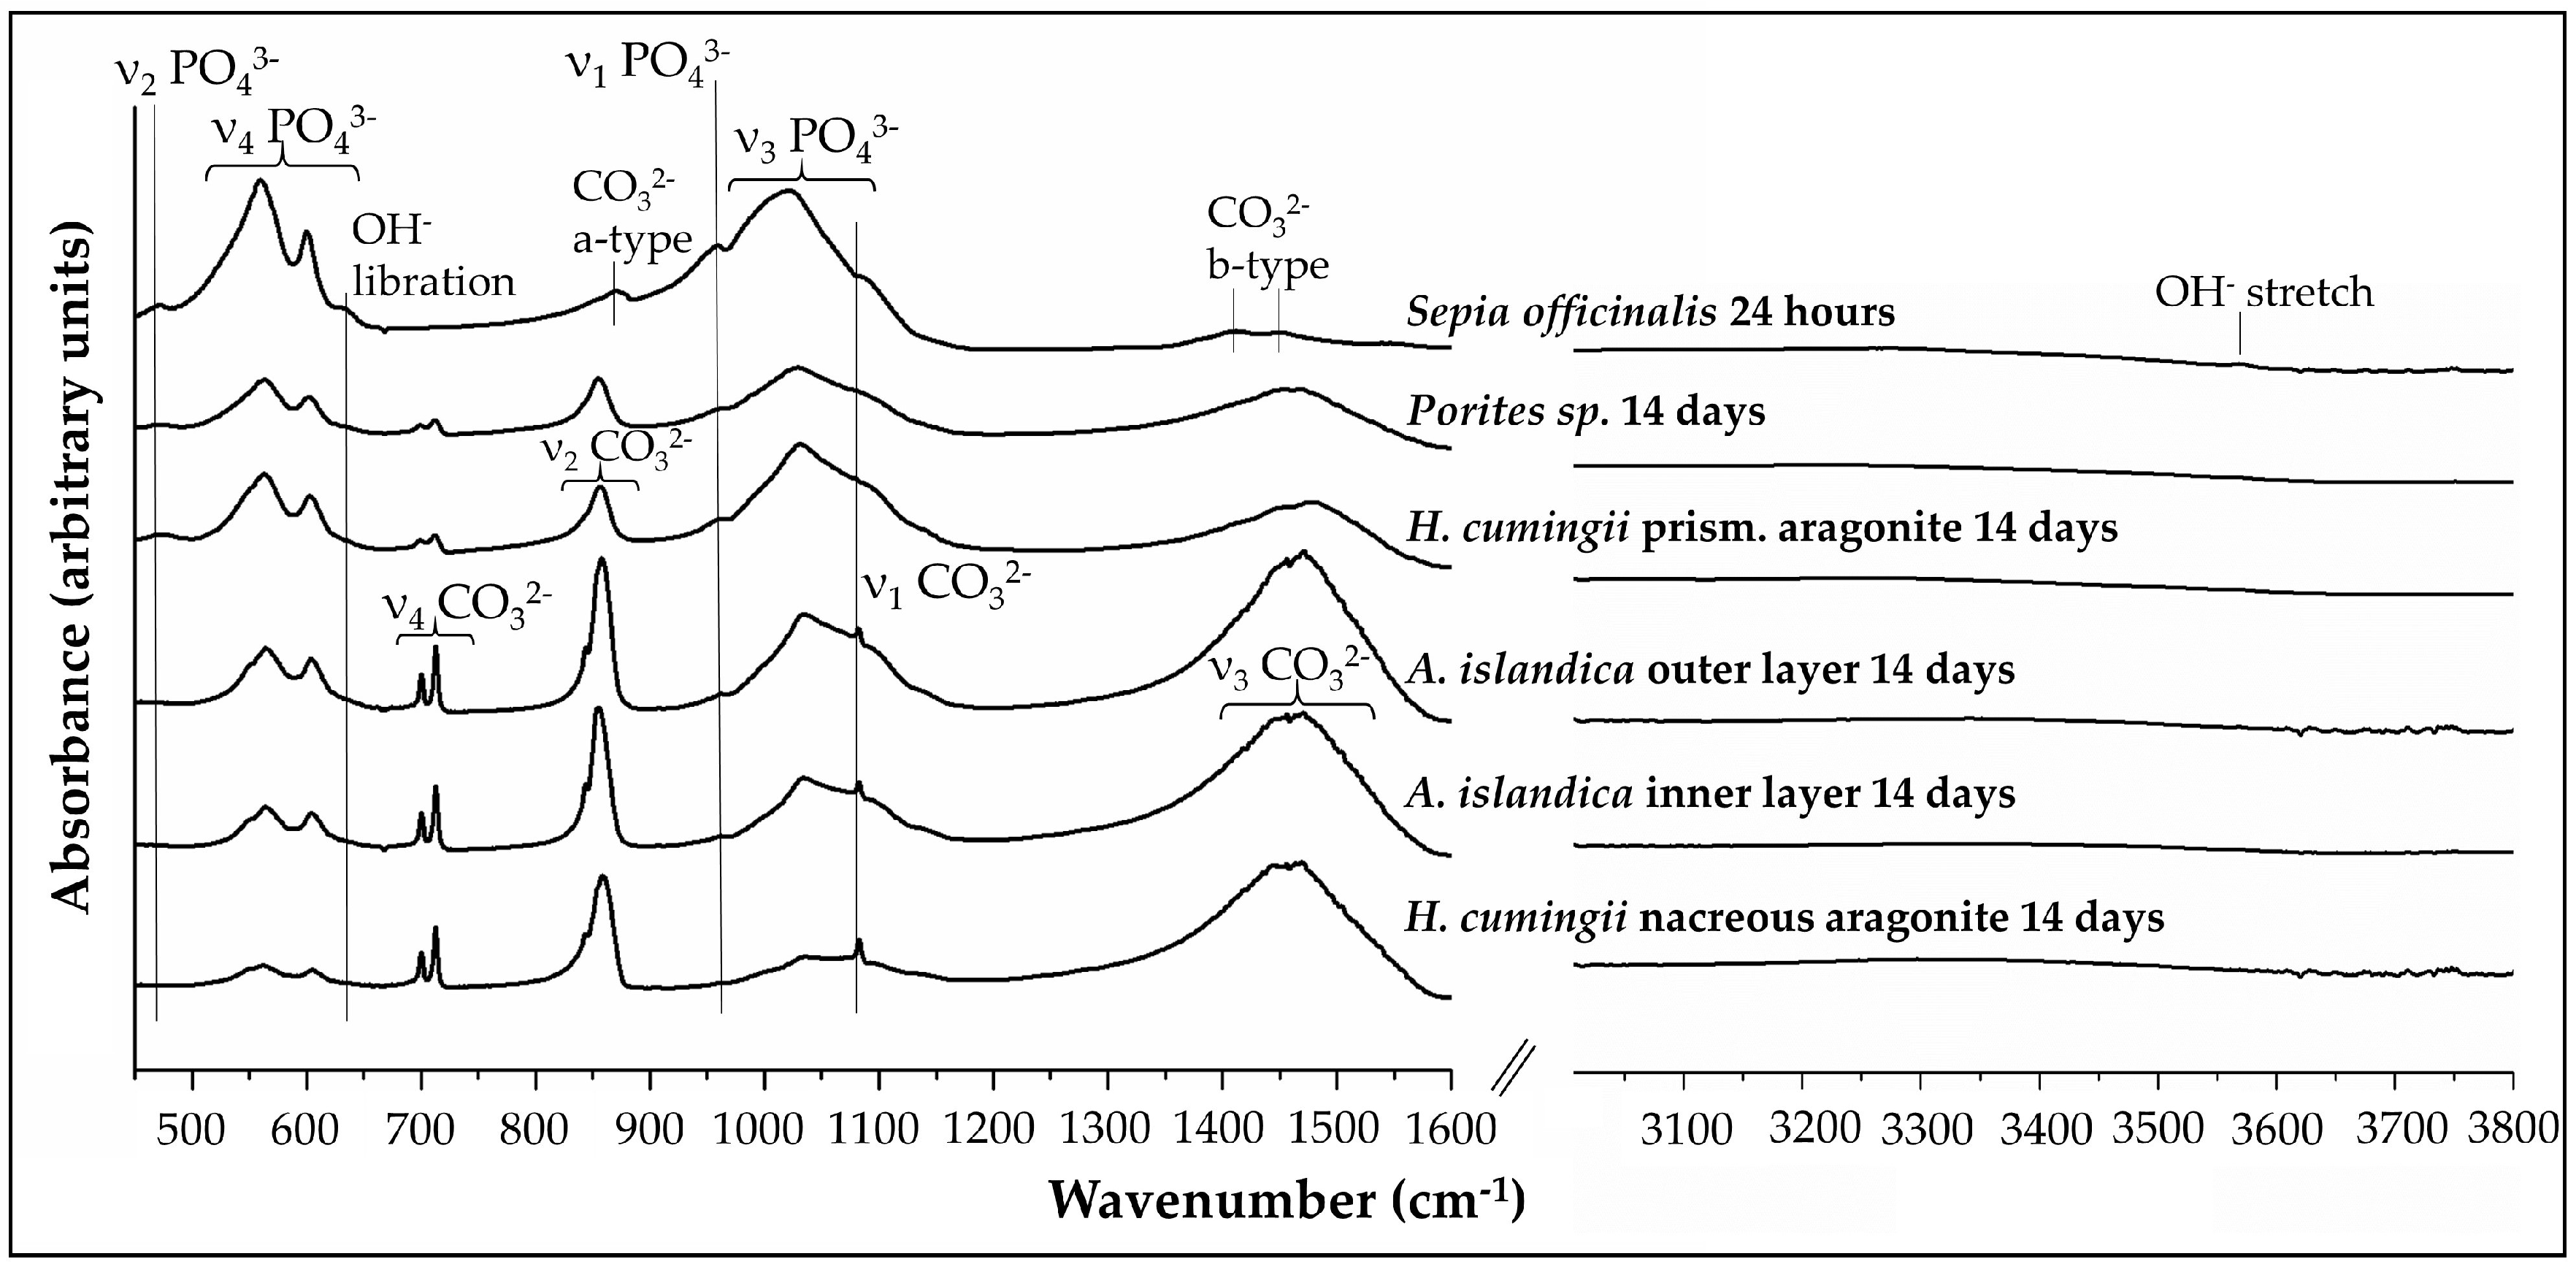
3.2. FTIR-Spectroscopy

IR-spectra of the four biological hard tissues being in contact with the phosphate-bearing solution for 14 days are shown in Figure 2.
Absorption bands that can be assigned to the carbonate group vibrations in the structure of aragonite are present in all samples, with the exception of the completely reacted Sepia officinalis cuttlebone. The bands appear at 700 and 713 cm−14CO32−), 855–858 cm−12CO32−), 1083 (ν1CO32−) and 1450–1475 cm−13CO32−) [22,23,24] and show variable intensities depending on the specific hard tissue. They are sharp in the spectrum of Hyriopsis cumingii nacre, are intense and clearly visible in the spectra of both, the outer and inner shell layers of Arctica islandica, are weaker and broader in the spectra gained from the skeleton of Porites sp. and for prismatic aragonite in the shell of the bivalve H. cumingii.
Absorption bands that can be assigned to vibrations of the phosphate group in the structure of AP are clearly distinguishable at ~470 cm−12PO43−), 560–602 cm−14PO43−), ~960 cm−11PO43−) and at 1020–1100 cm−13PO43−) in the spectra of Sepia officinalis cuttlebone, Porites sp. skeleton, outer and inner shell layers of Arctica islandica and in prismatic aragonite in the shell of H. cumingii [25,26,27]. The intensity and definition of these bands is highly variable depending on the hard tissue. Thus, the ν2 phosphate vibration is visible as a broad, weak band in the spectra of H. cumingii prismatic aragonite and the skeleton of Porites sp. This band is sharp and appears well-defined in the spectrum of Sepia officinalis cuttlebone. The Sepia officinalis spectrum also shows well-defined ν4 and ν1 phosphate bands. In contrast, the bands are broad and weak in the spectra of the Porites sp. skeleton, outer and inner shell layers of Arctica islandica and these prismatic aragonite of H. cumingii. Finally, a broad ν3 phosphate band is detectable in all spectra shown in Figure 2, including H. cumingii nacre.
The observed variation in intensity and definition of the absorption bands assigned to the carbonate and phosphate groups is in good agreement with the different degrees of conversion of the studied hard tissues as deduced from Rietveld refinements of XRD patterns. H. cumingii nacre constitutes an exception. According to XRD analysis H. cumingii nacre does not undergo any conversion to AP, even after 14 days of interaction with the phosphate-bearing solution. However, the presence of very weak and broad phosphate-bands (ν3 and ν4) in the IR spectrum of H. cumingii nacre that was altered for 14 days supports that a minor amount of conversion to AP has taken place.
It is worthwhile to note that the IR spectrum of Sepia officinalis aragonite altered for 24 h shows bands that are not found in the spectra of the other altered samples. One of these bands appears at 873 cm−1 and can be assigned to vibrational frequencies of carbonate ions that substitute into OH sites in the apatite structure (a-type substitution). Further two bands, those that appear at 1405 and 1450 cm−1, can be interpreted as corresponding to carbonate ions substituted into the phosphate site in apatite structure (b-type substitution) [24,28]. Moreover, the spectrum of Sepia officinalis hard tissue transformed for 24 h also shows a broad band at ~633 cm−1 which can be interpreted as the OH libration band [26], and a poorly developed shoulder appears at 3570 cm−1. This can be attributed to the OH stretching mode [29,30,31].

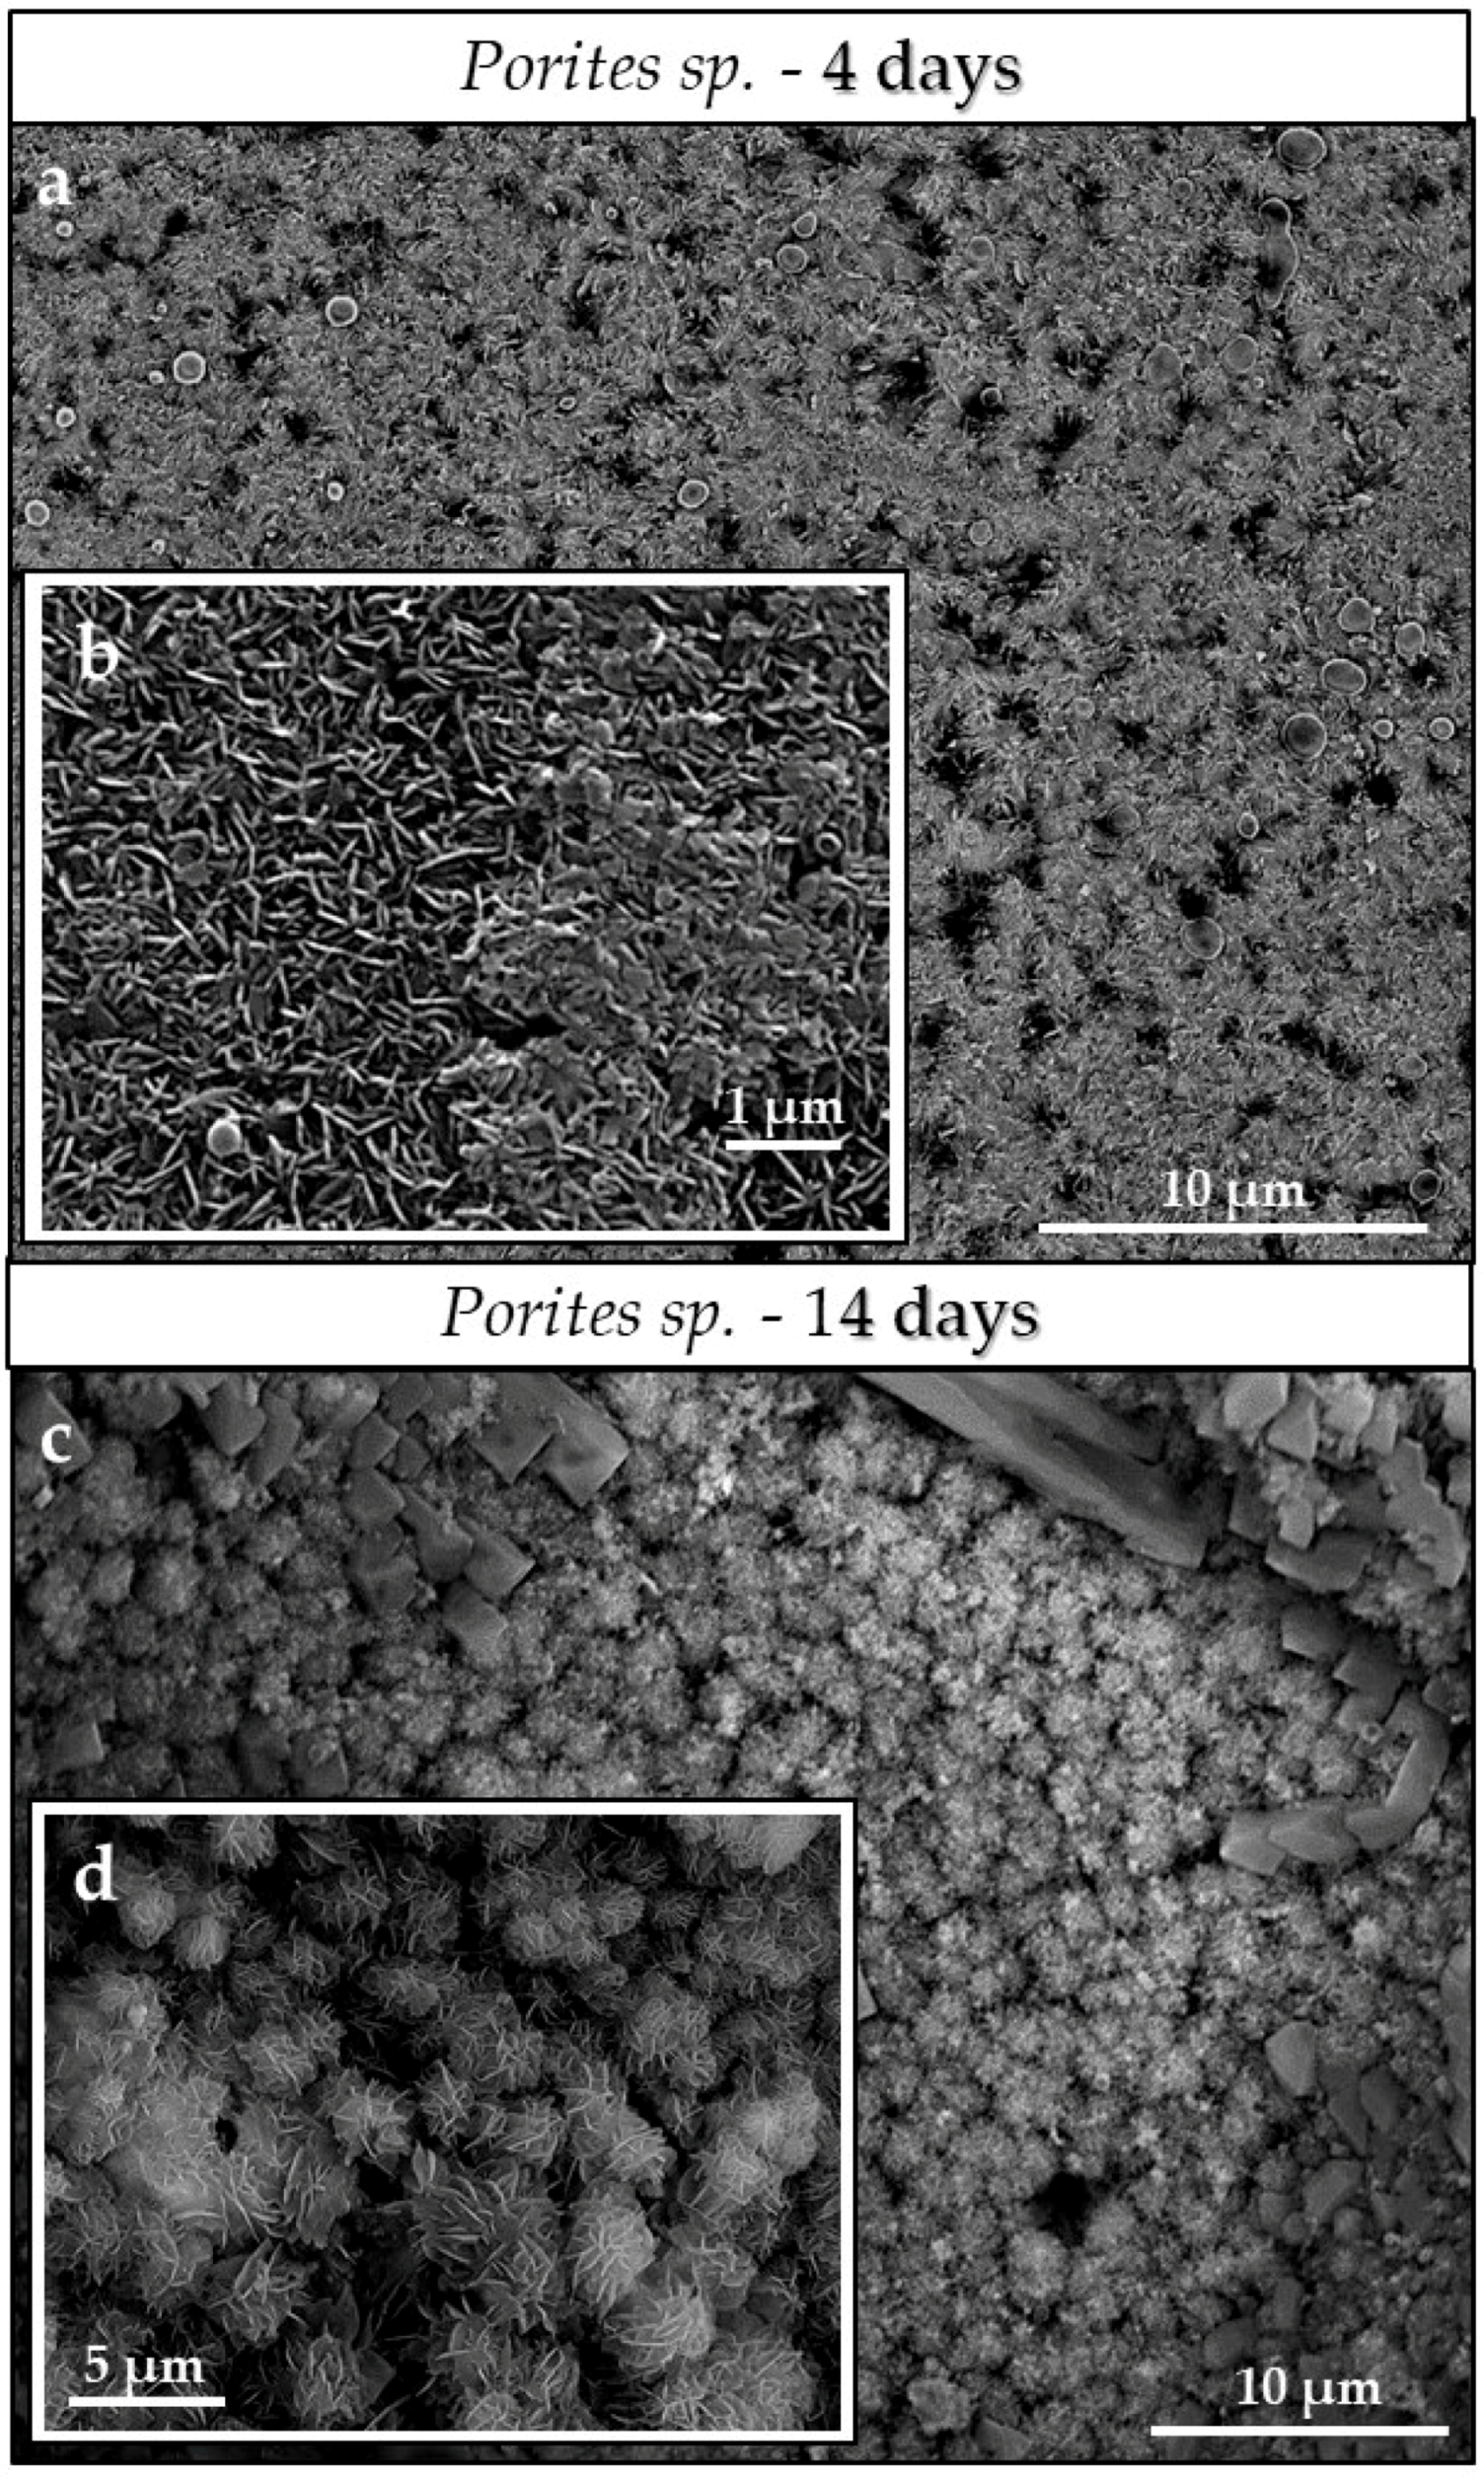
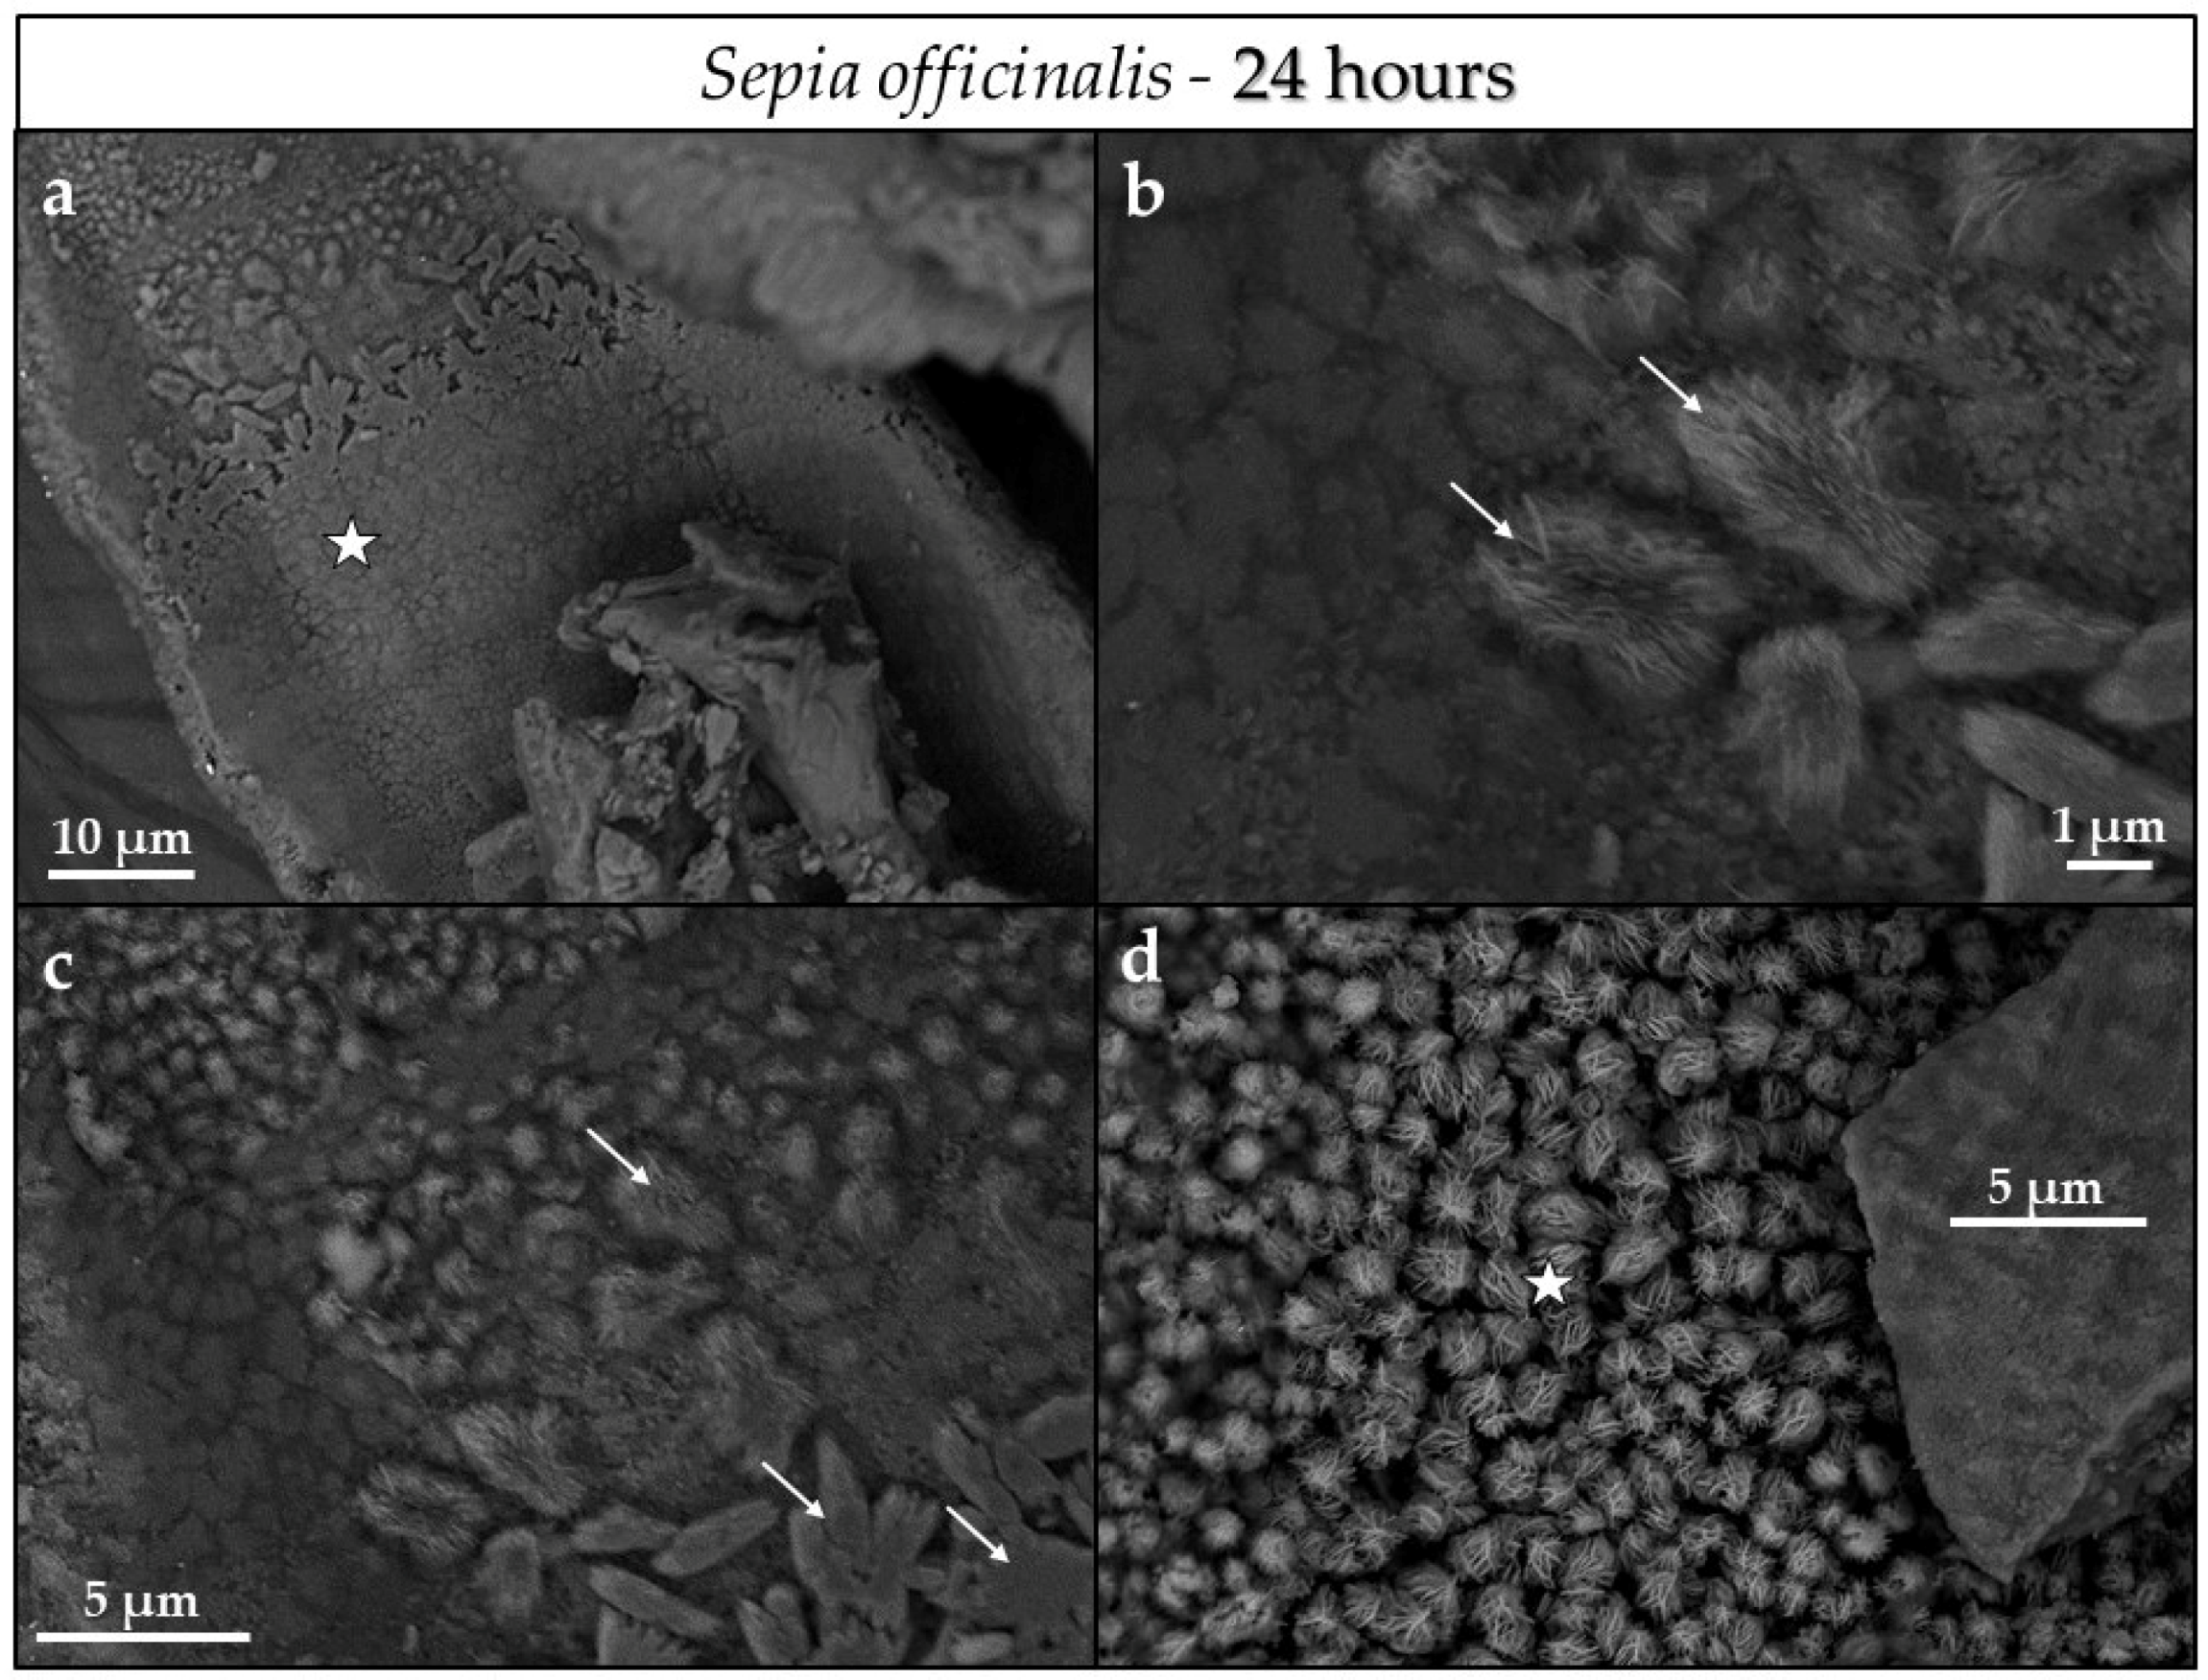
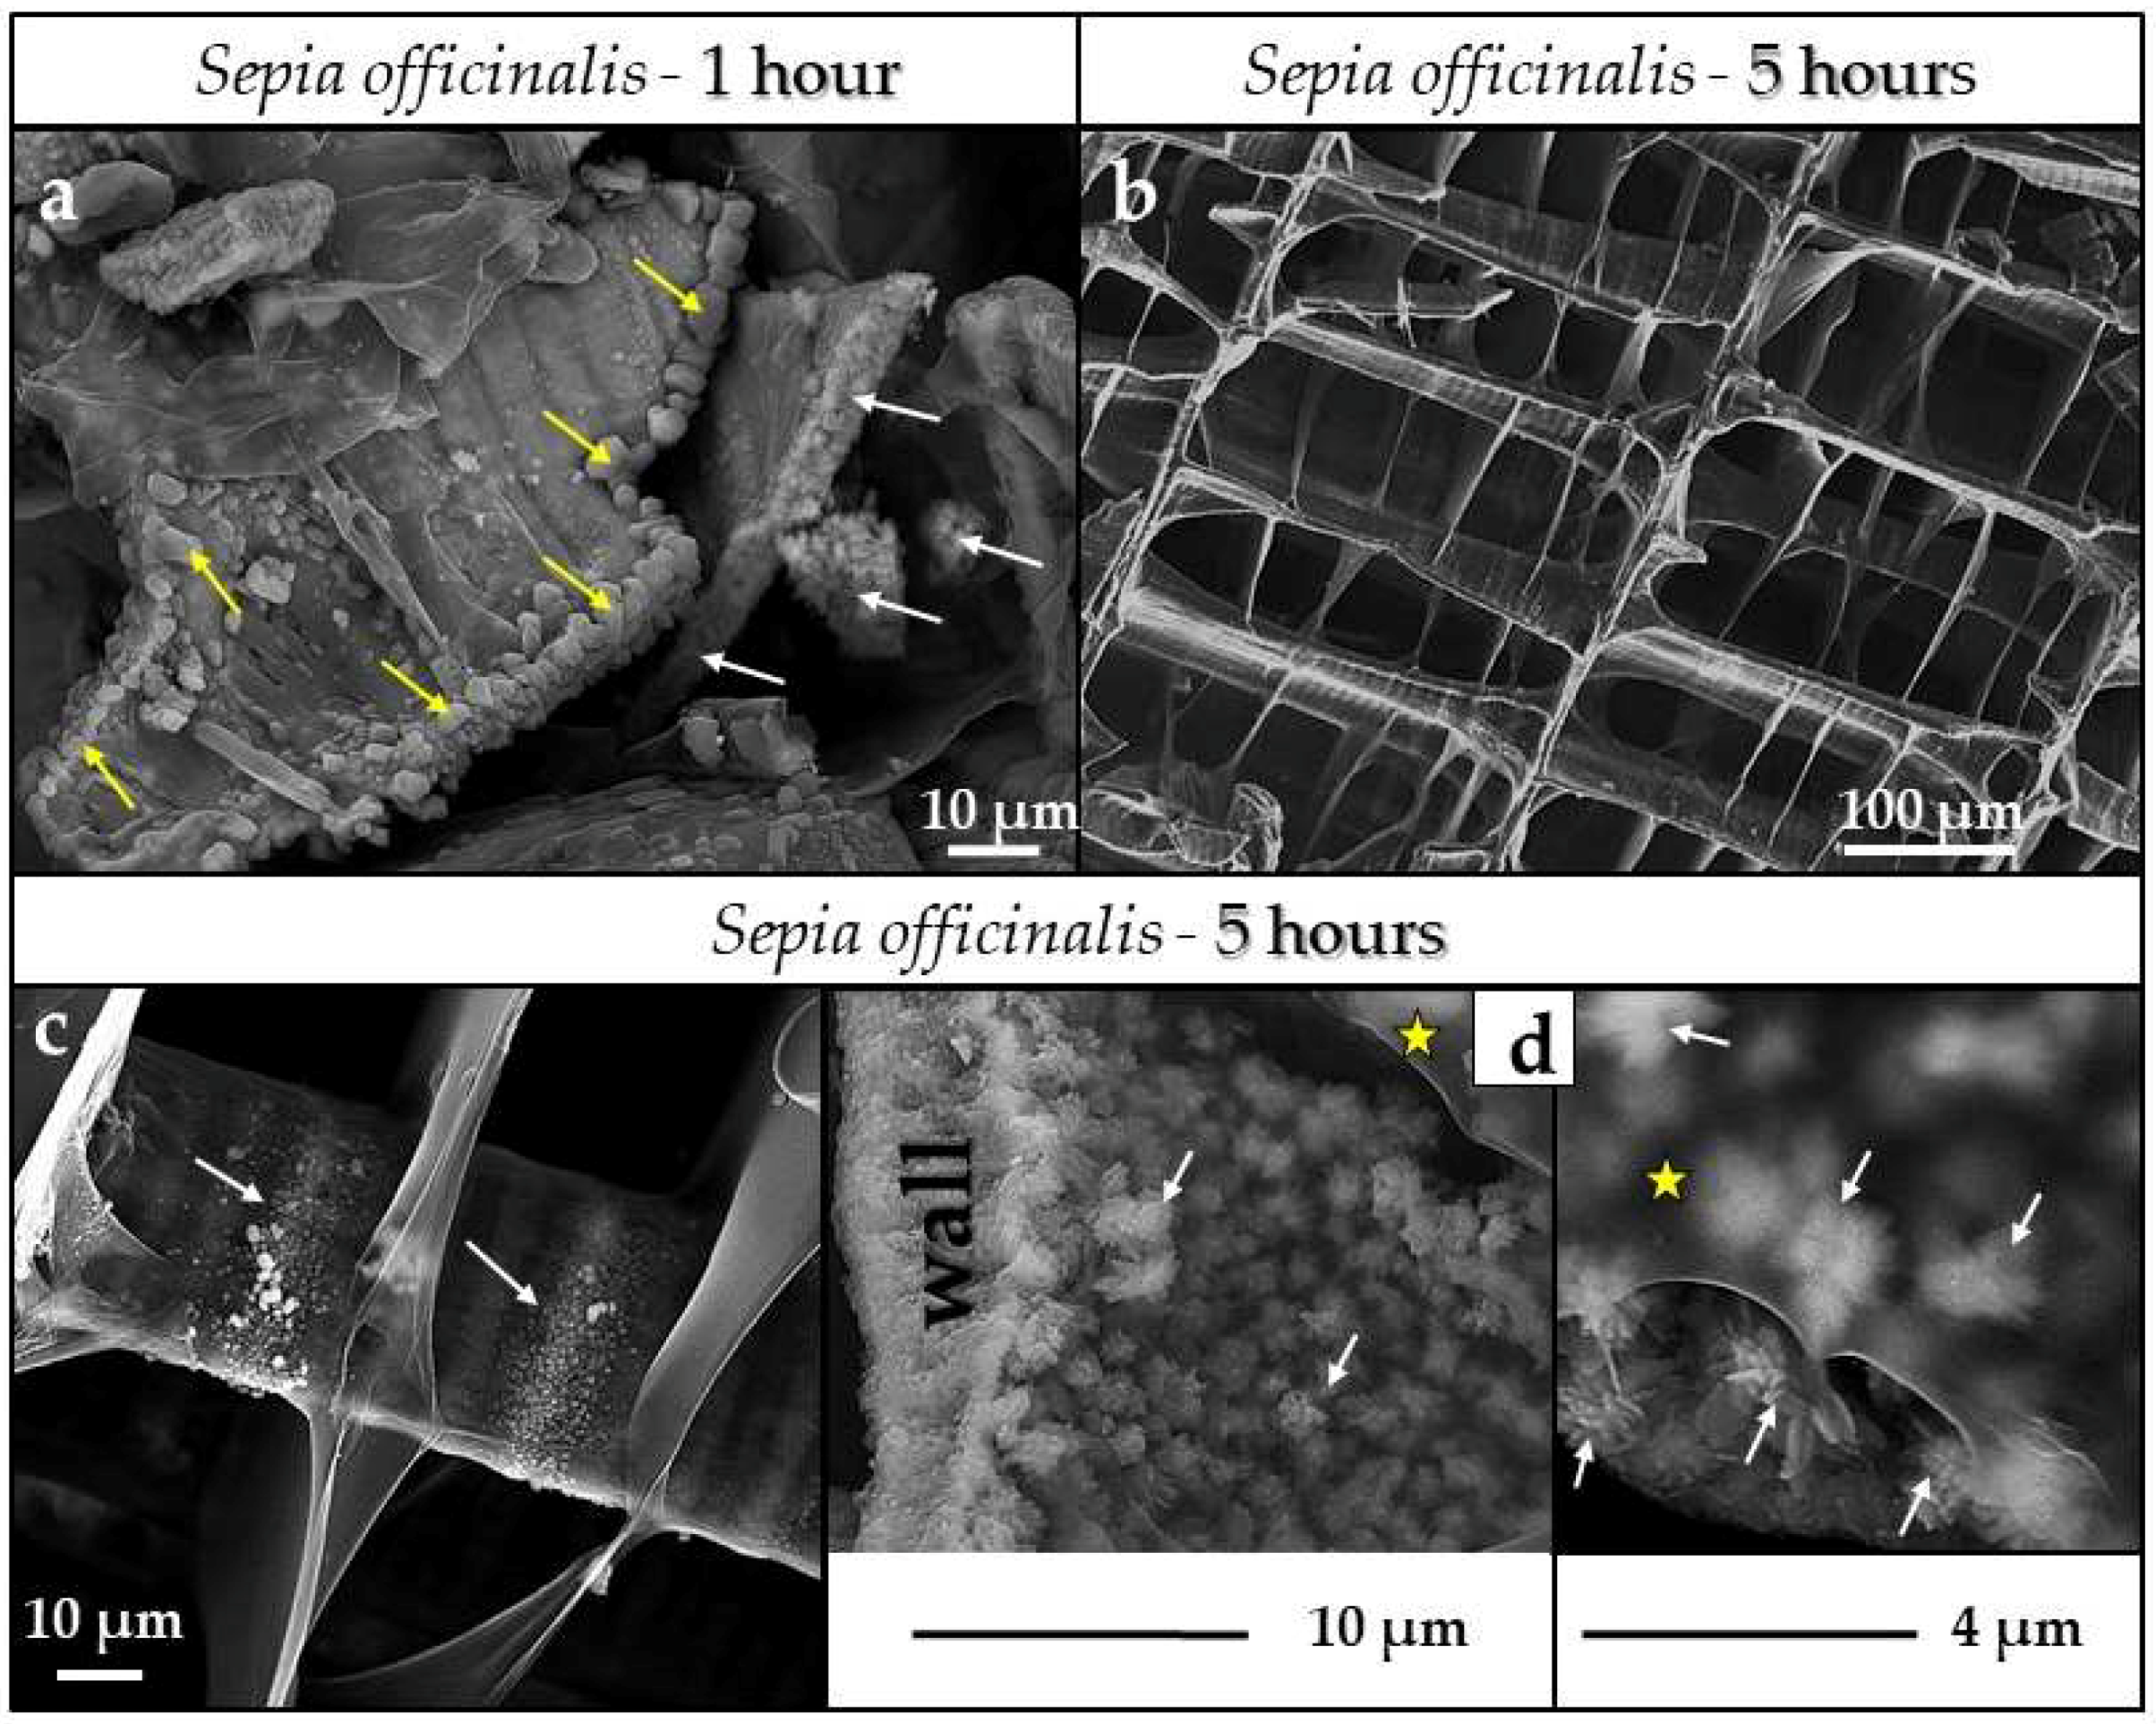
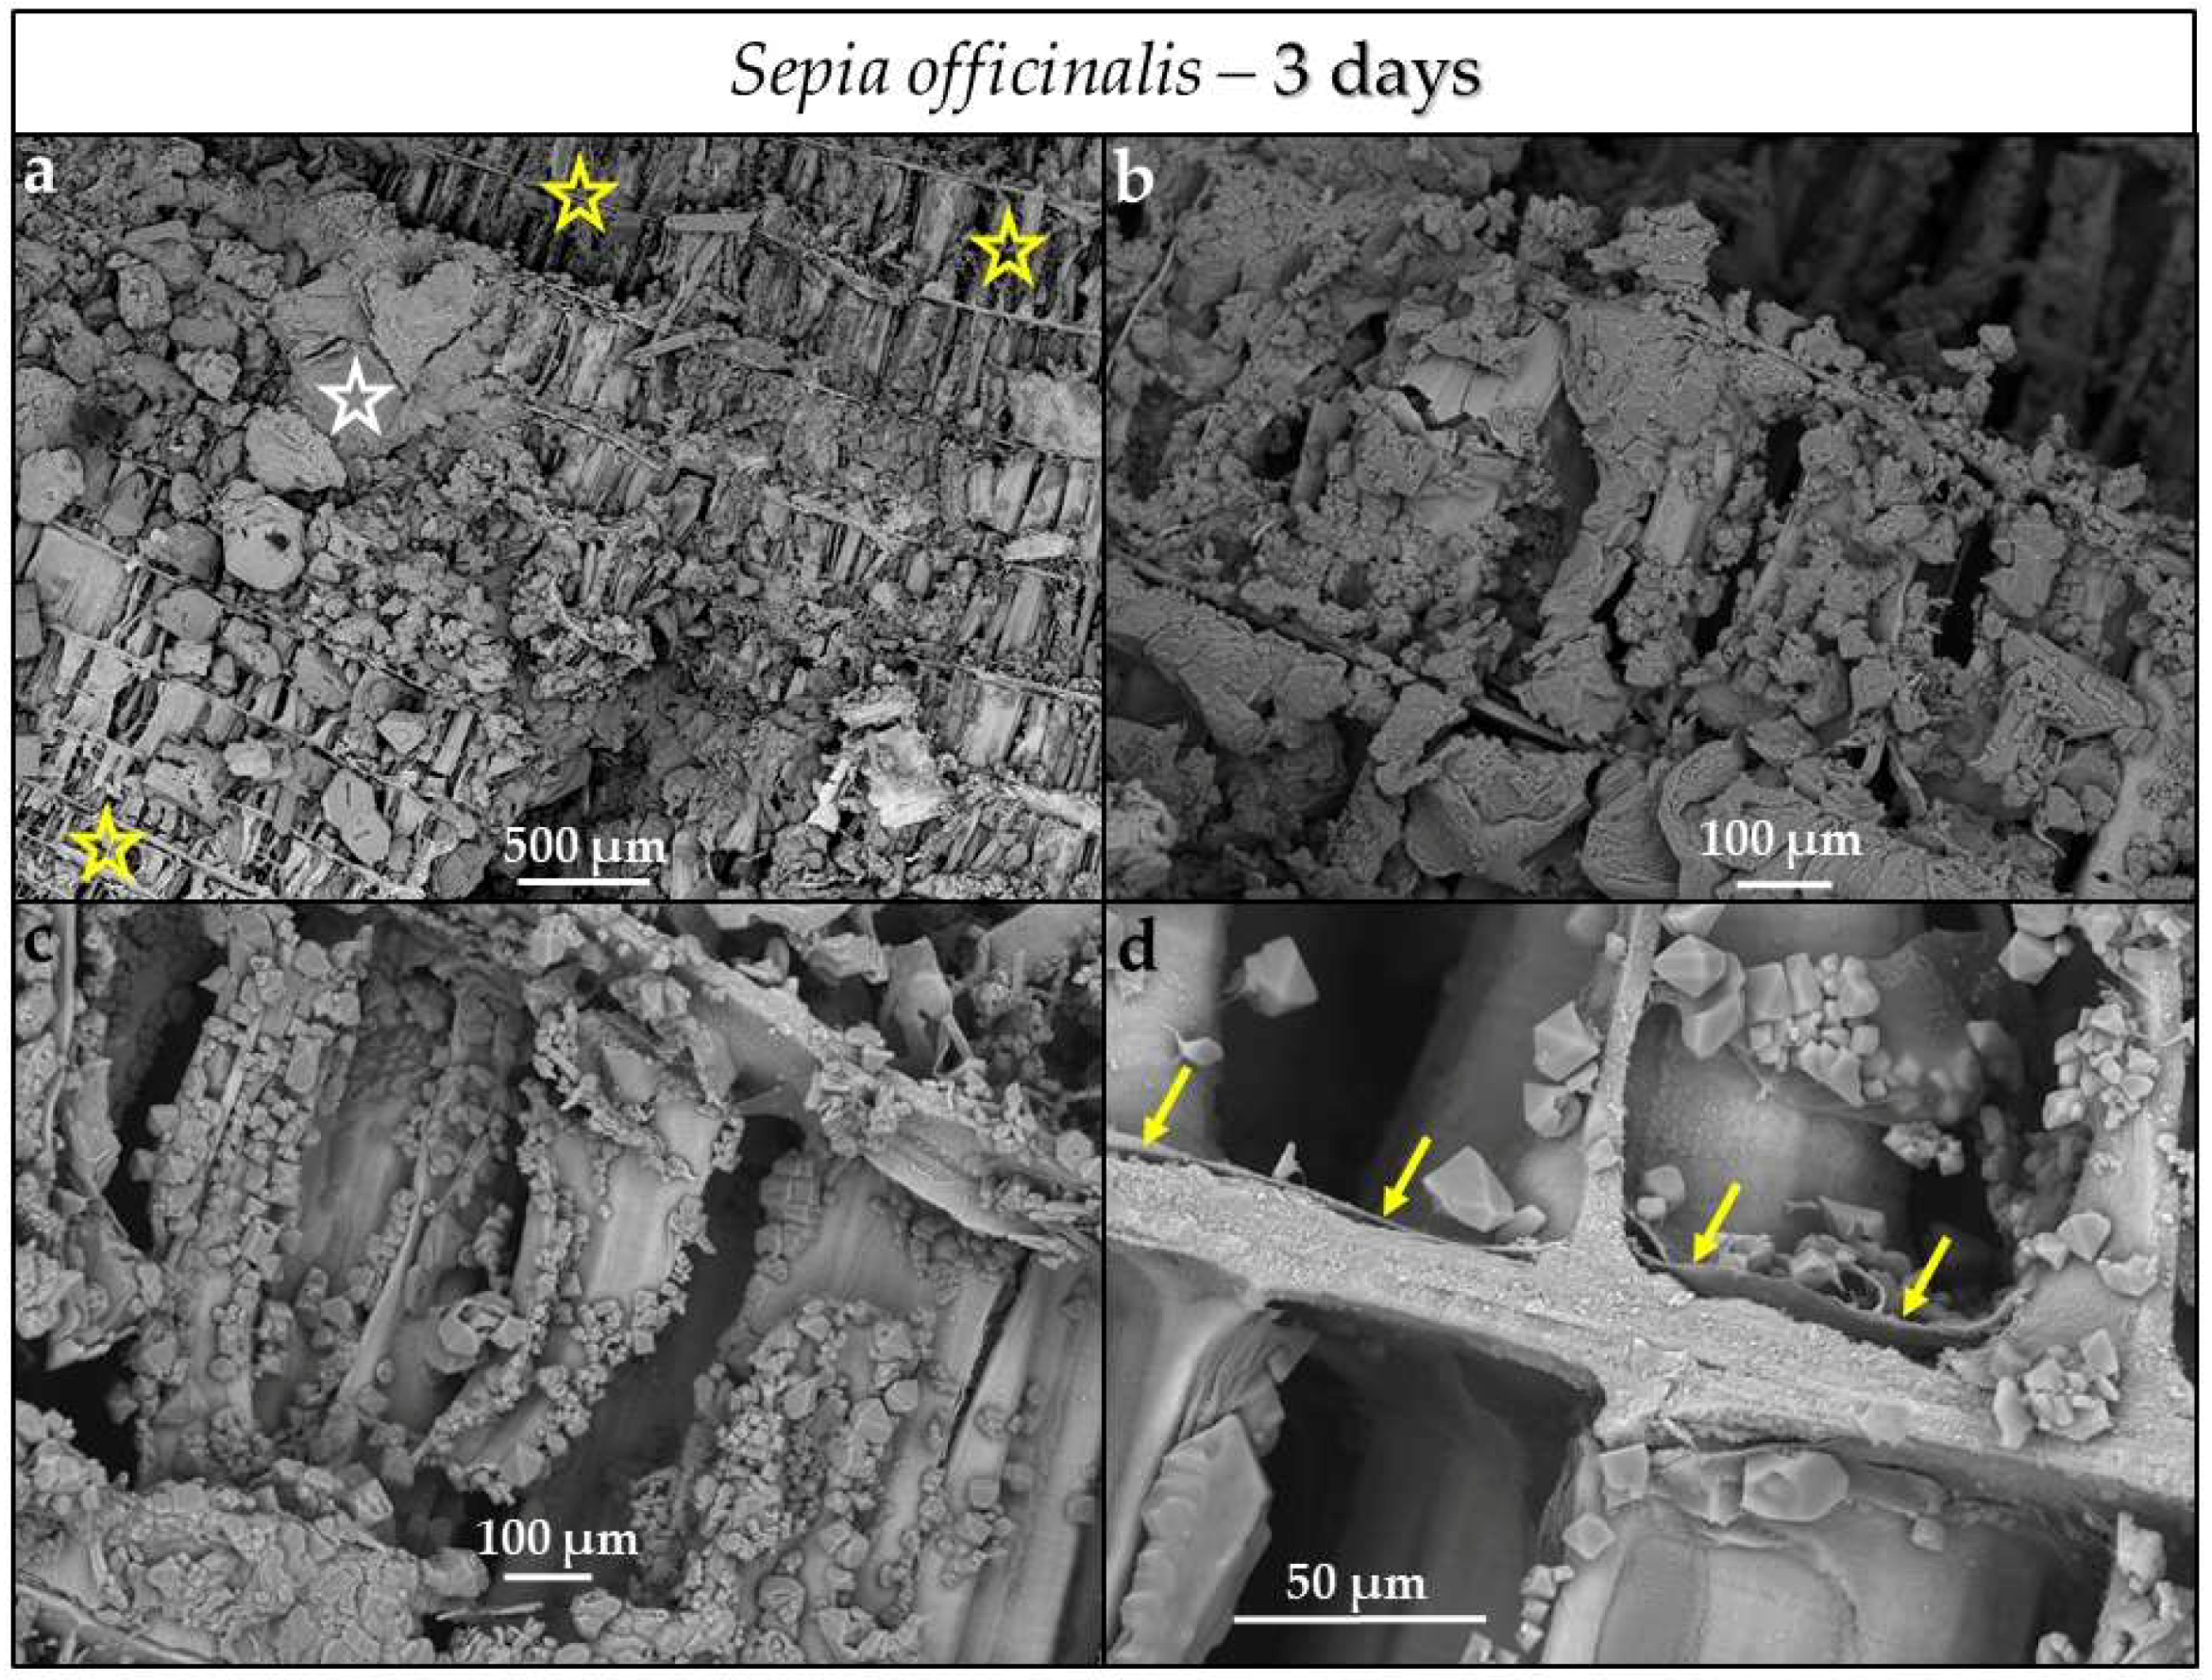
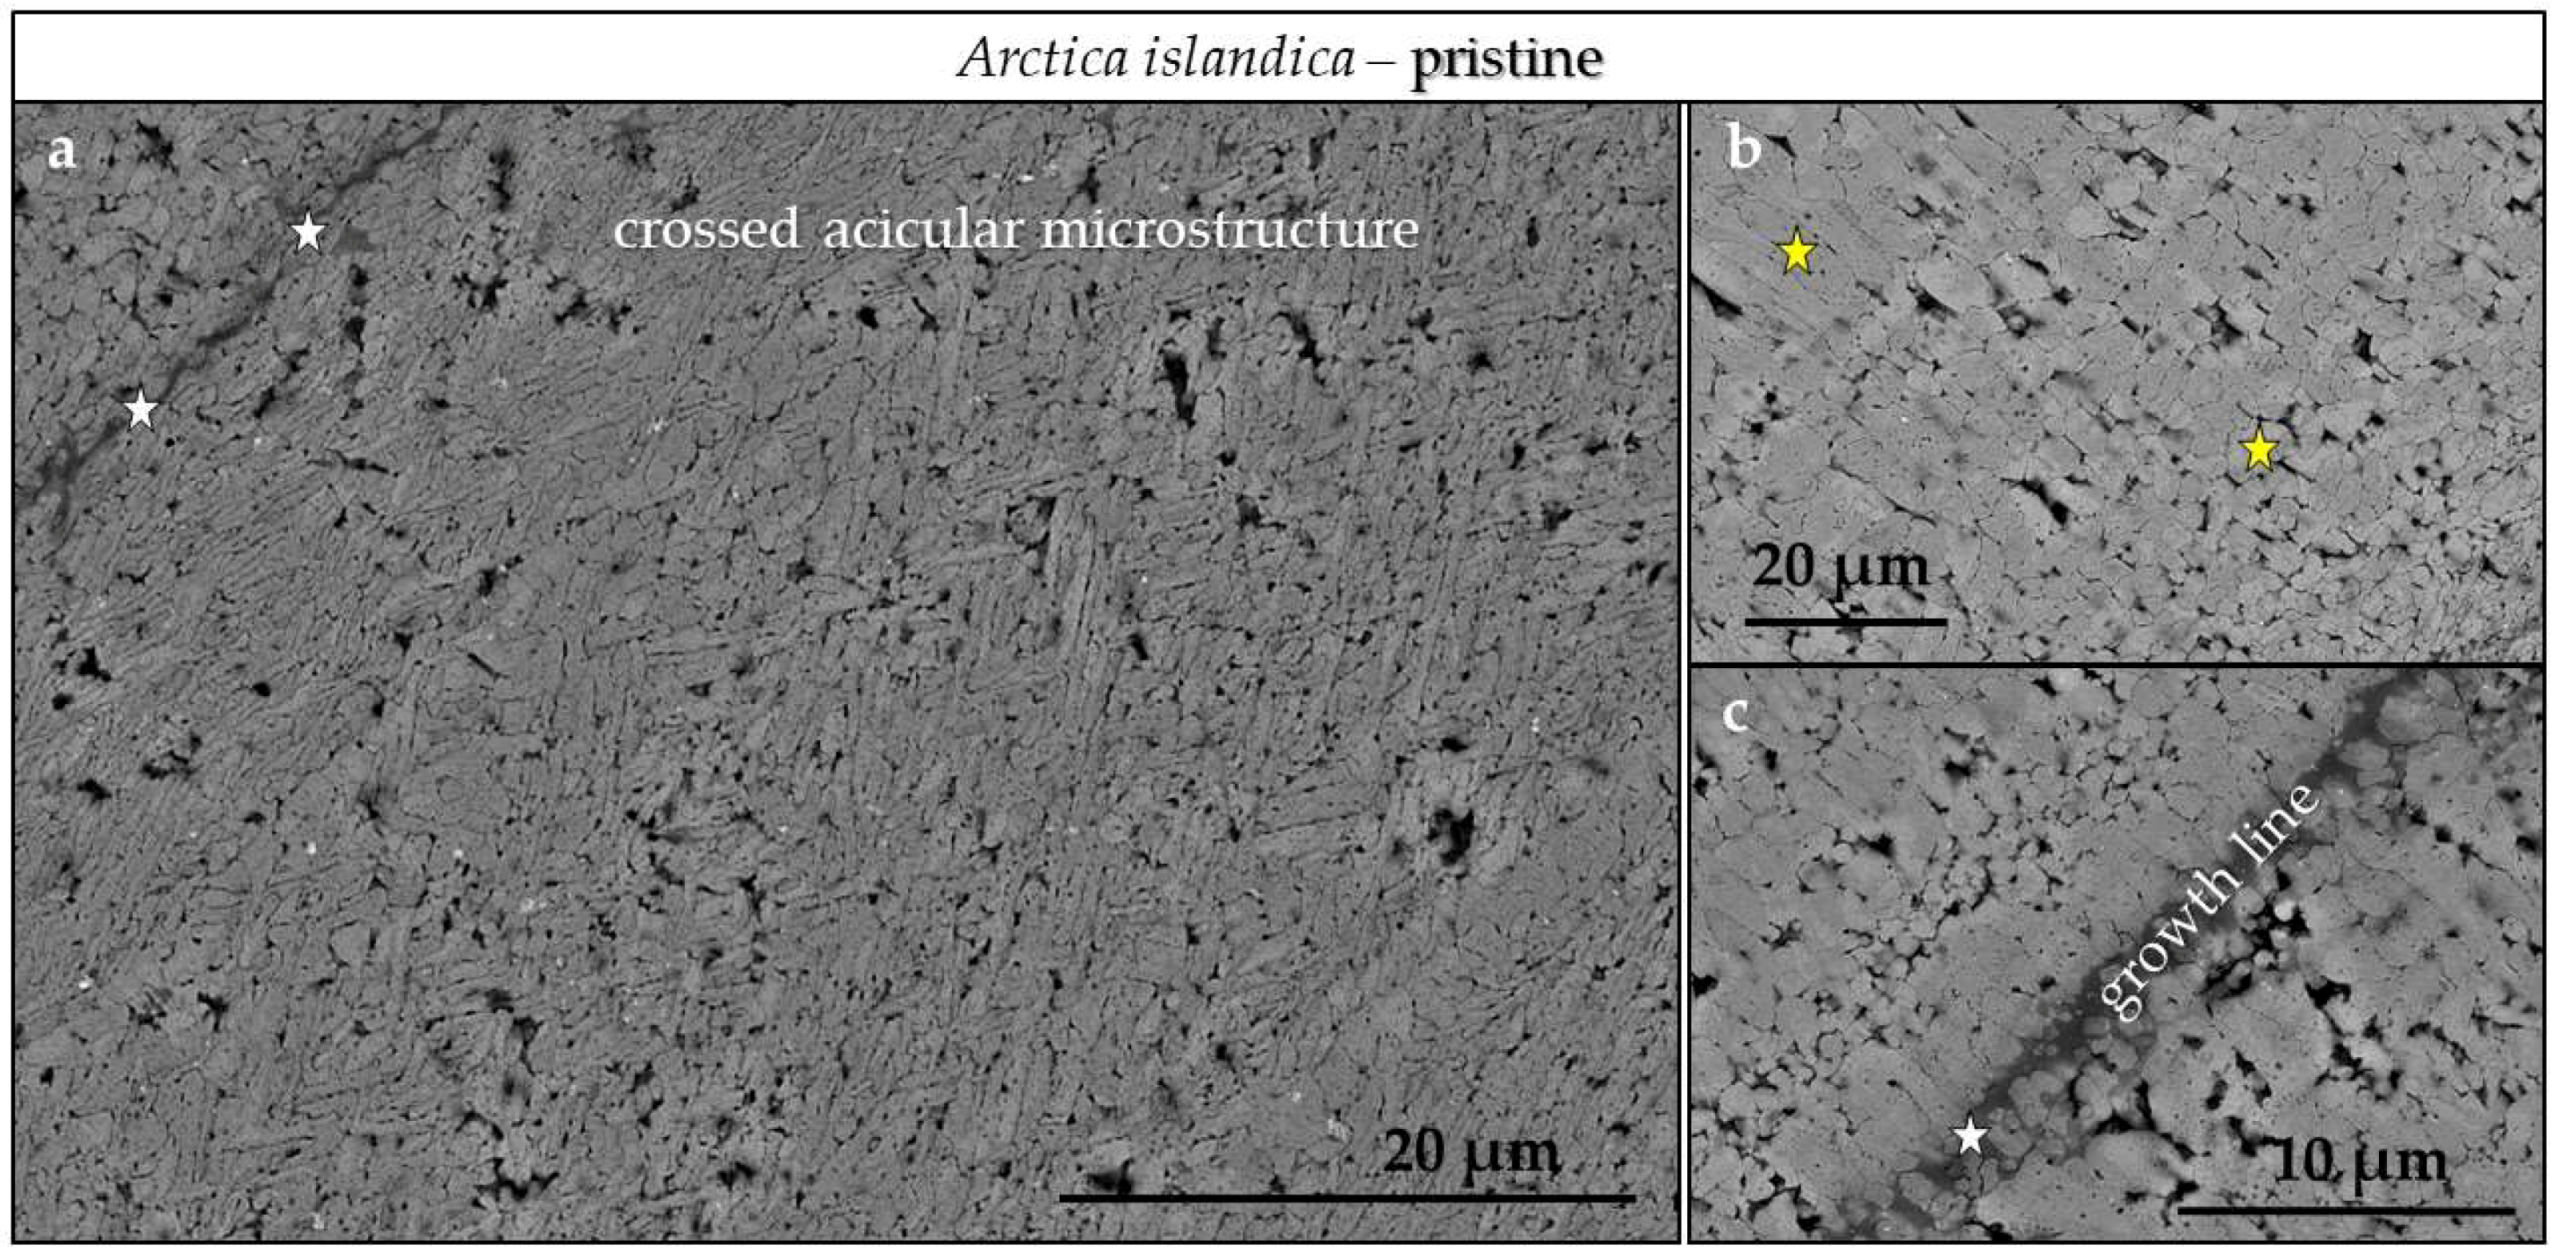
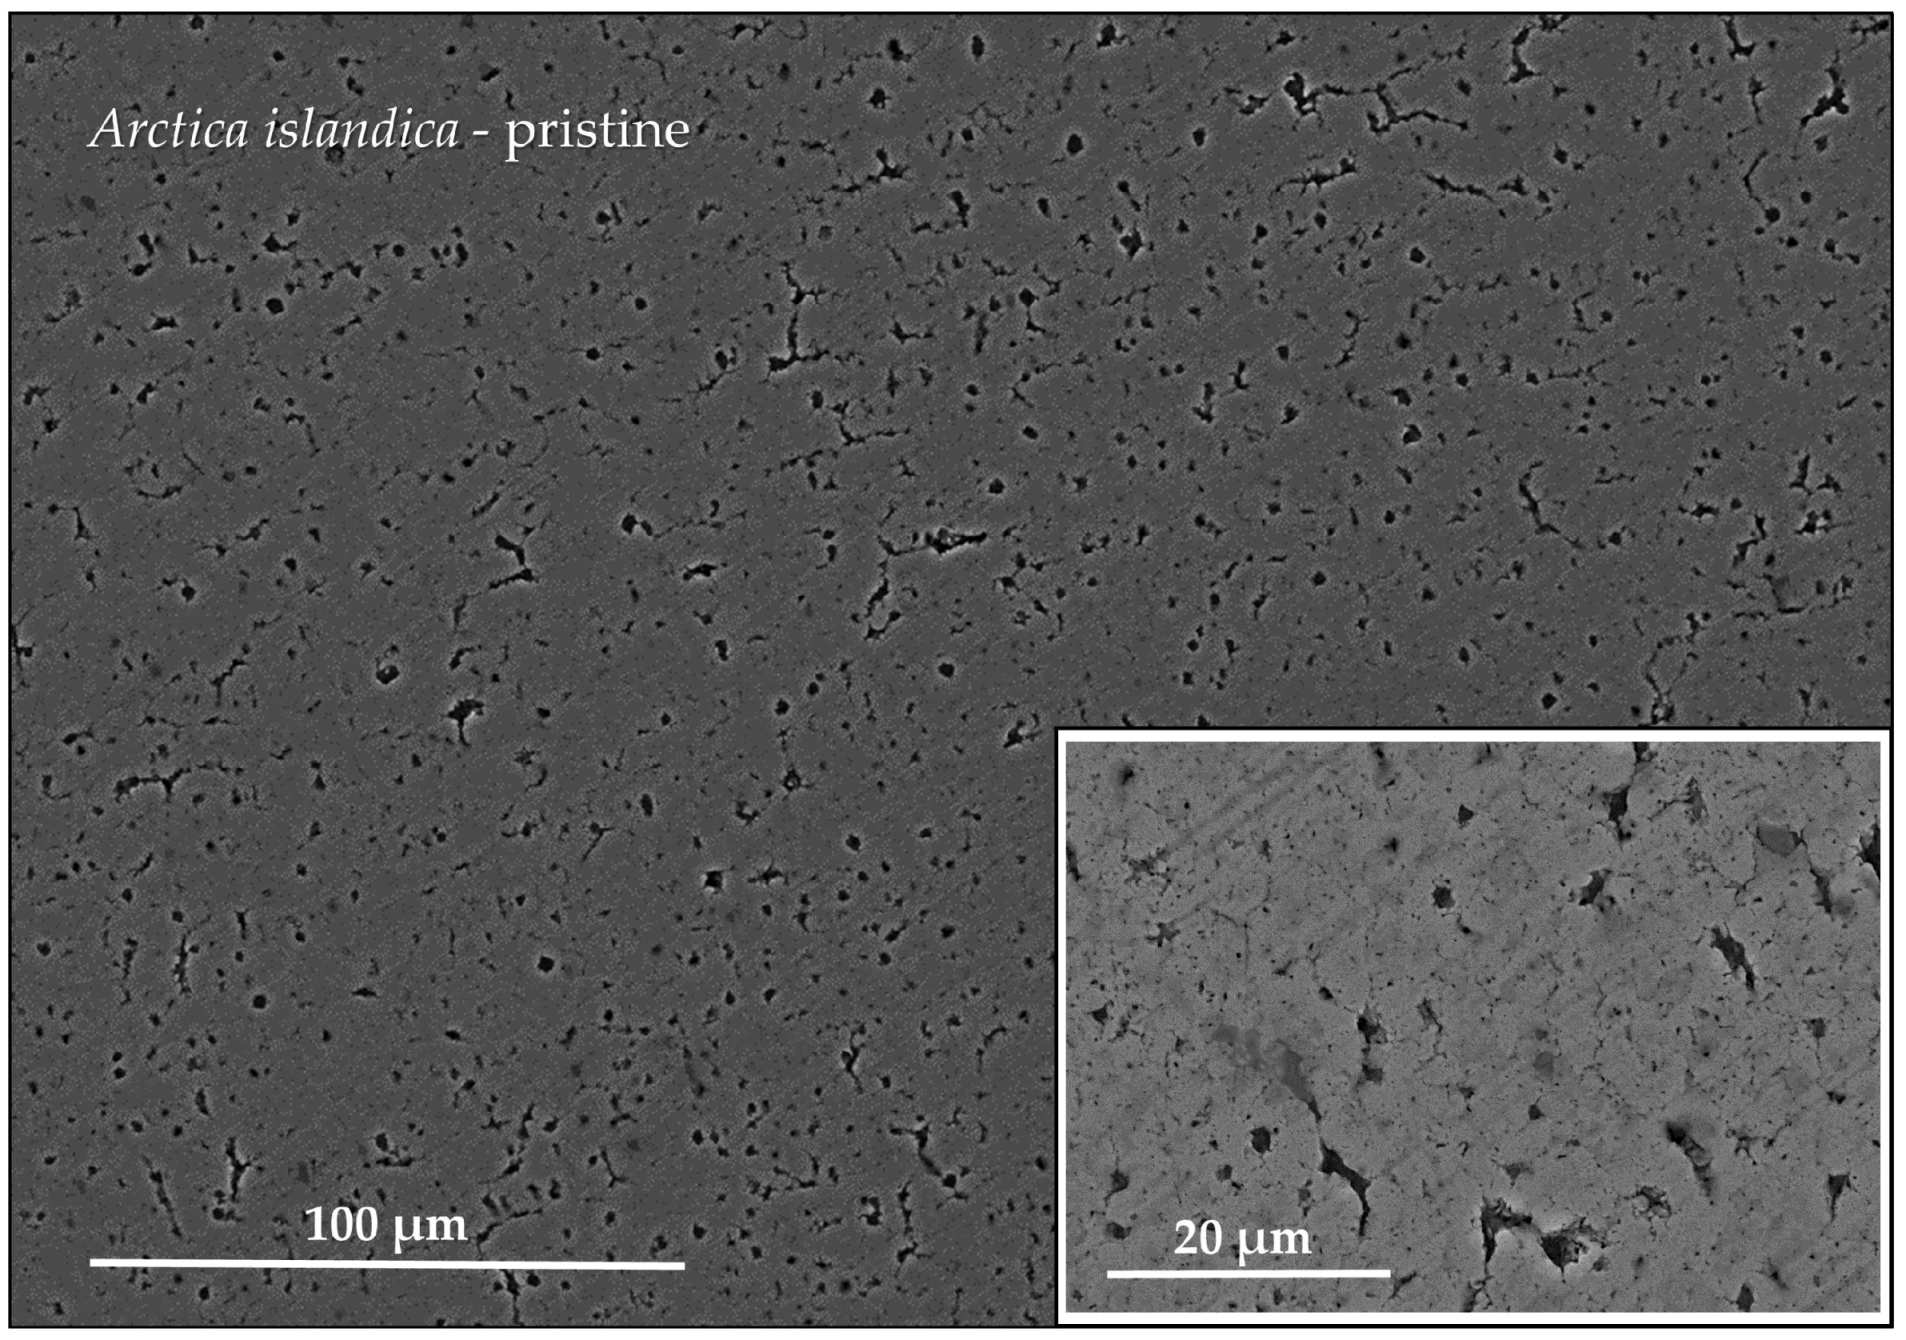
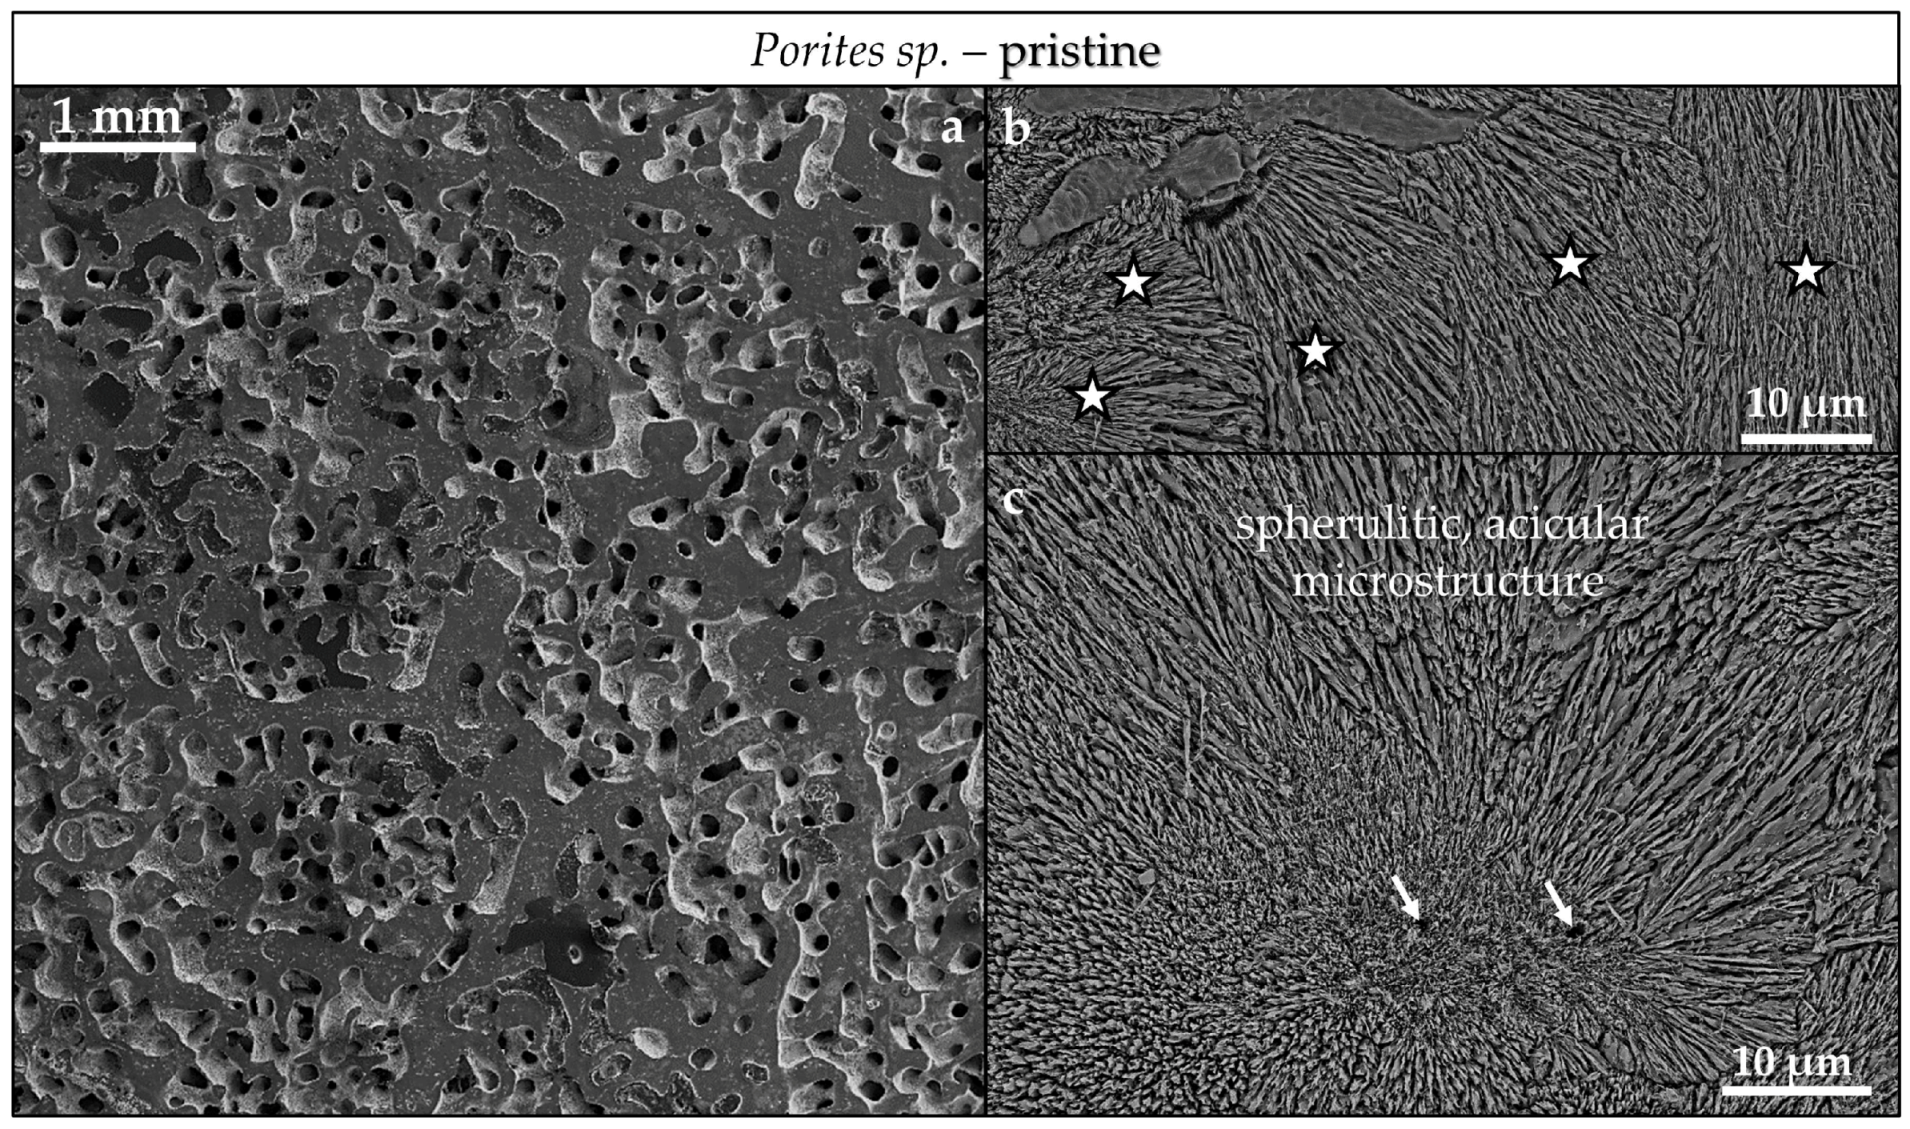
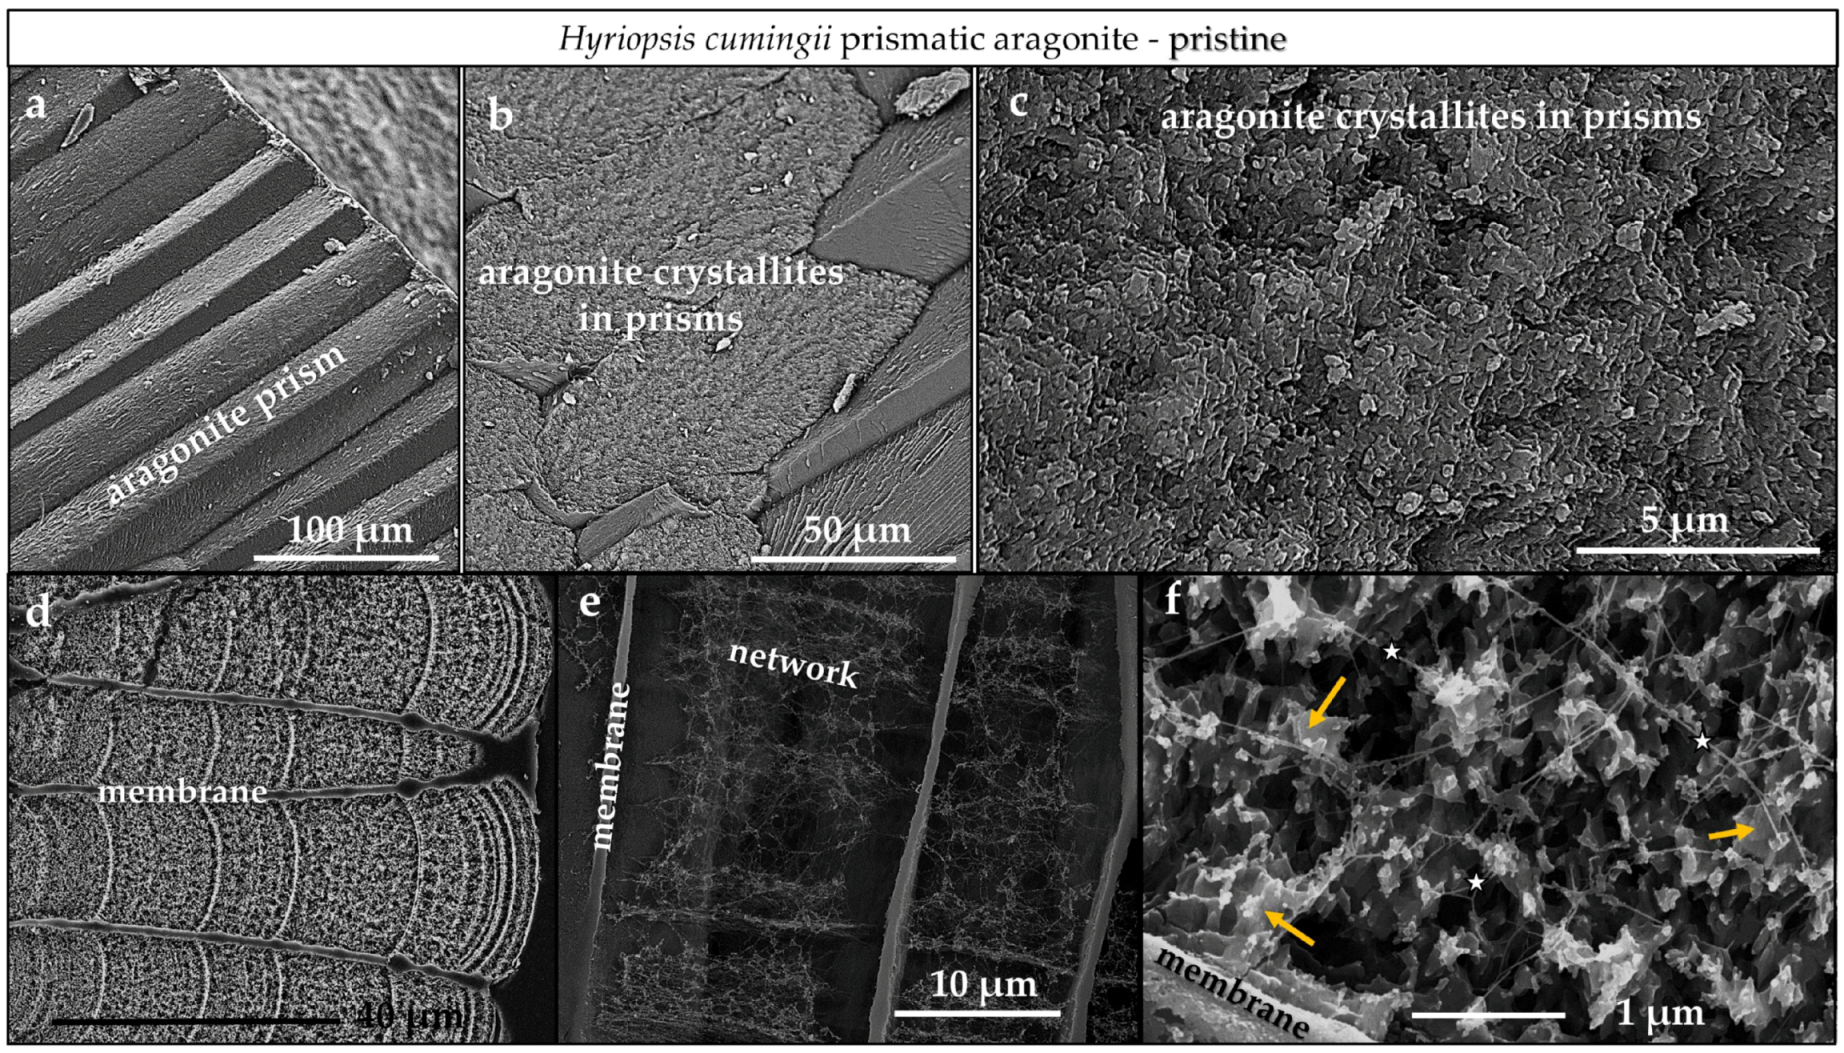
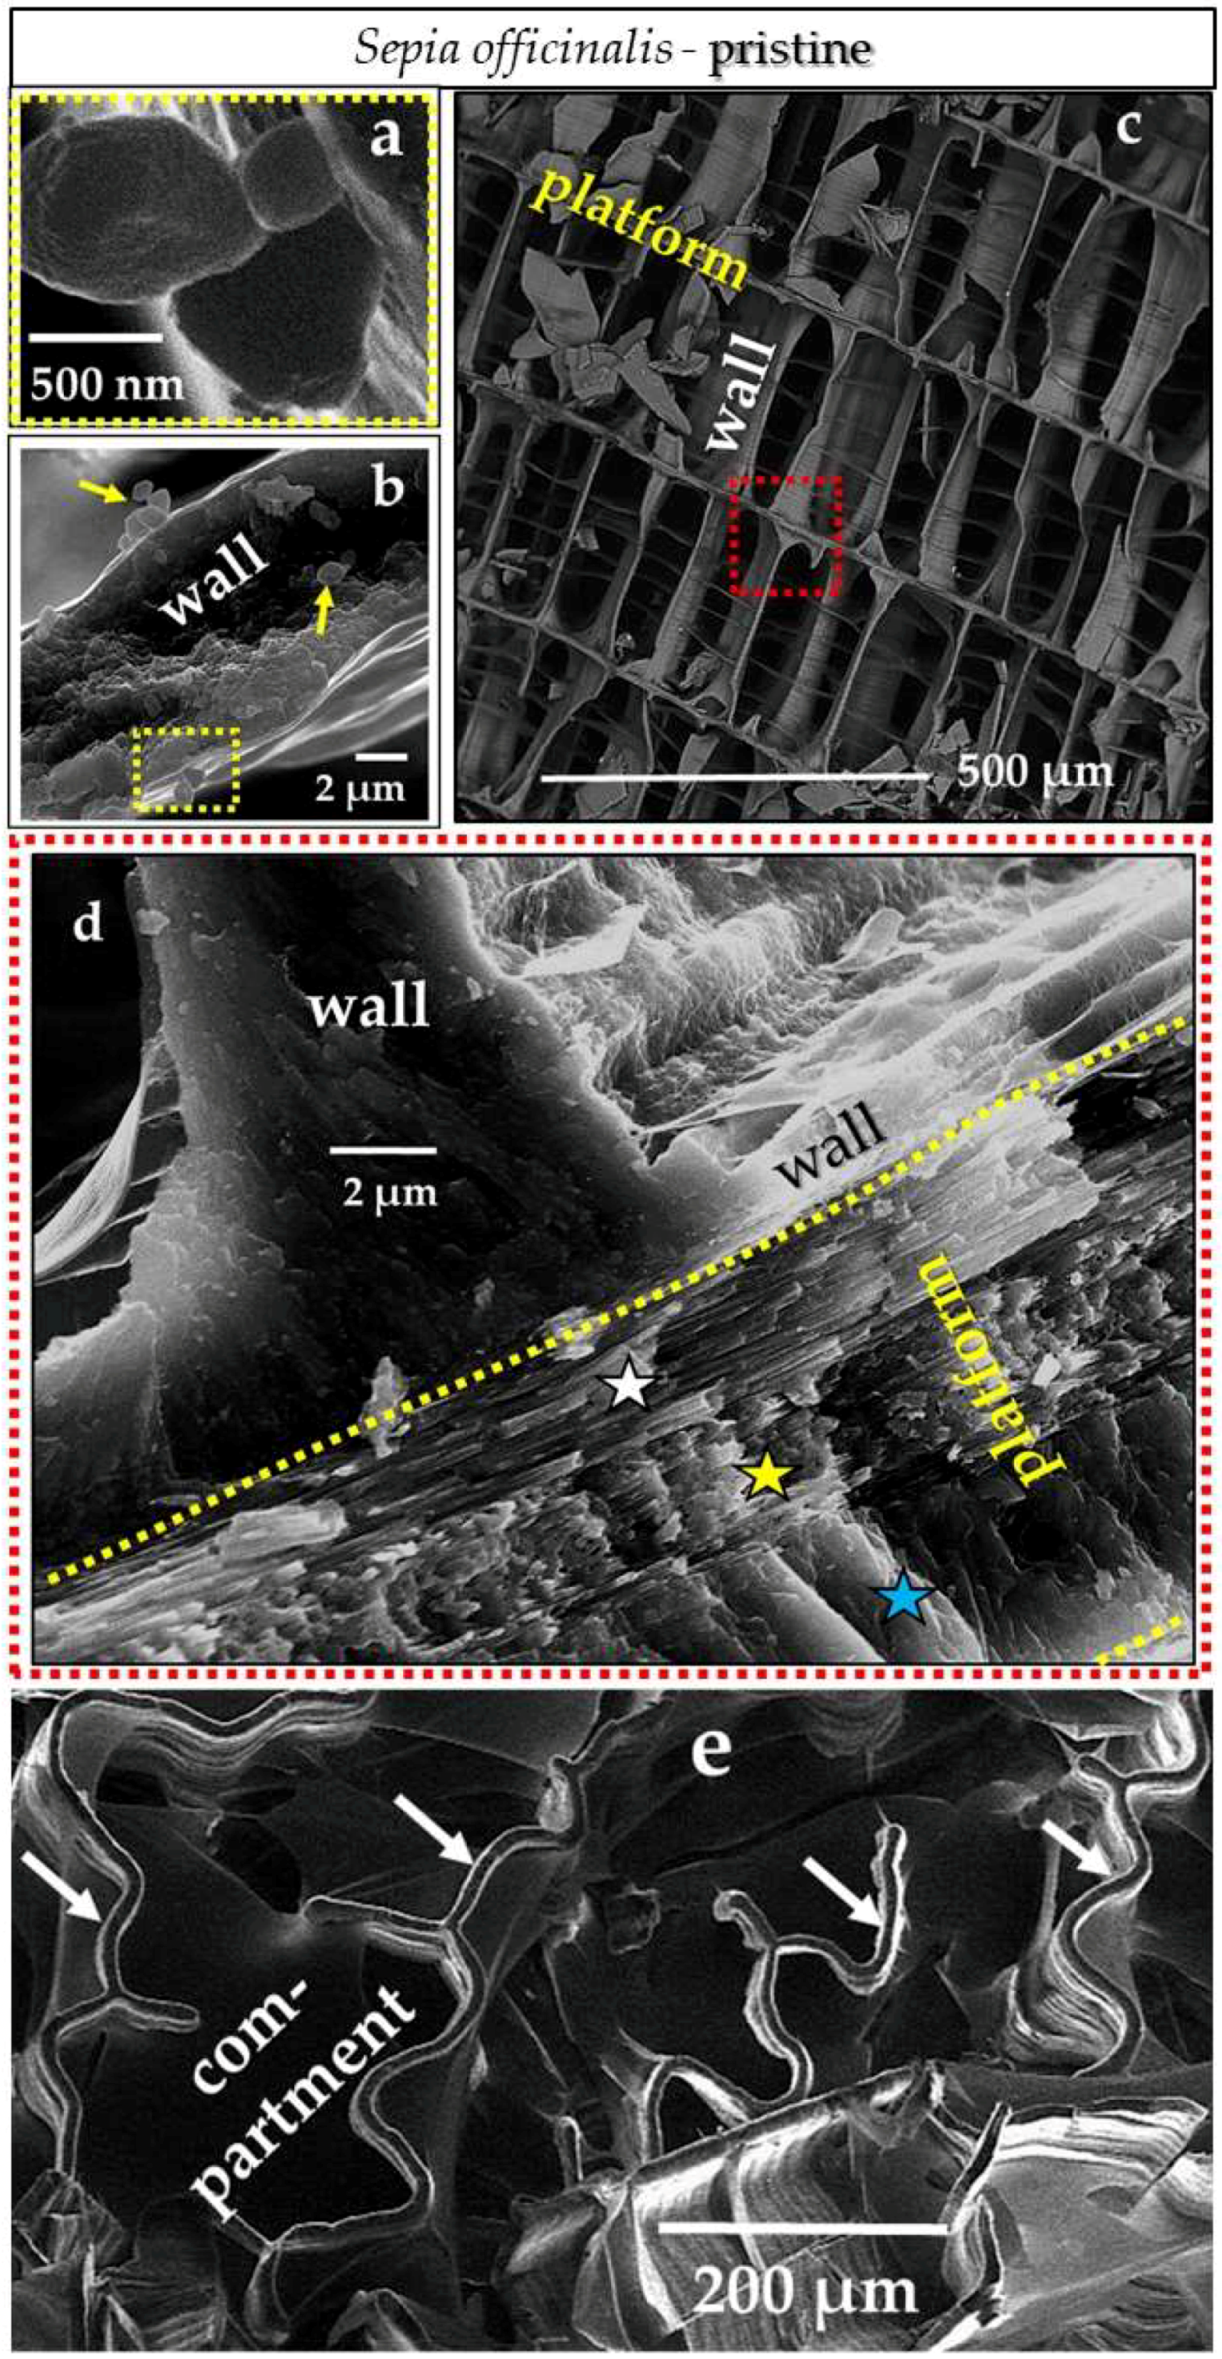
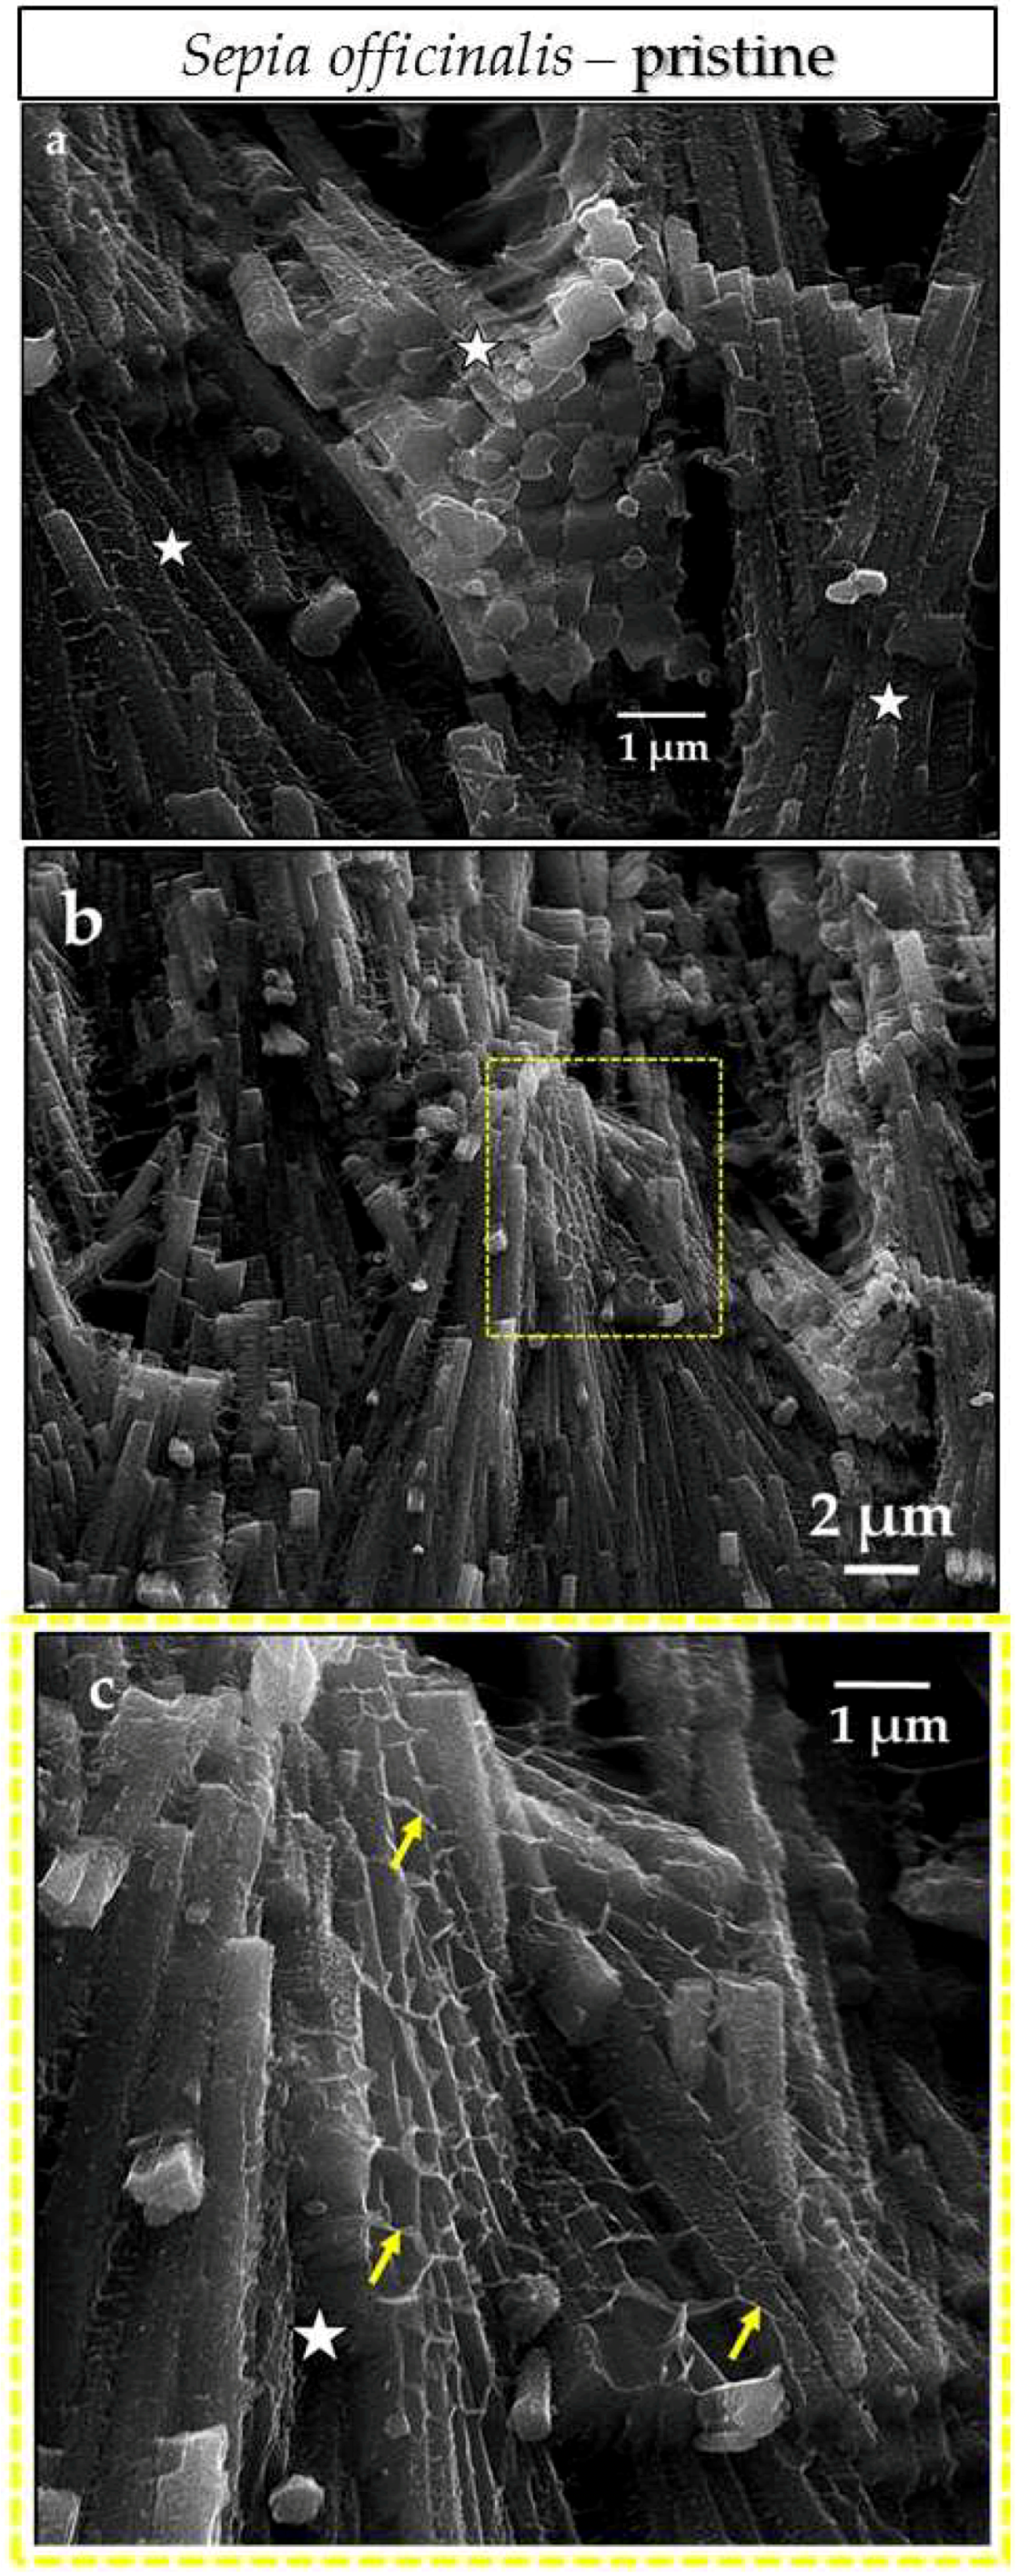
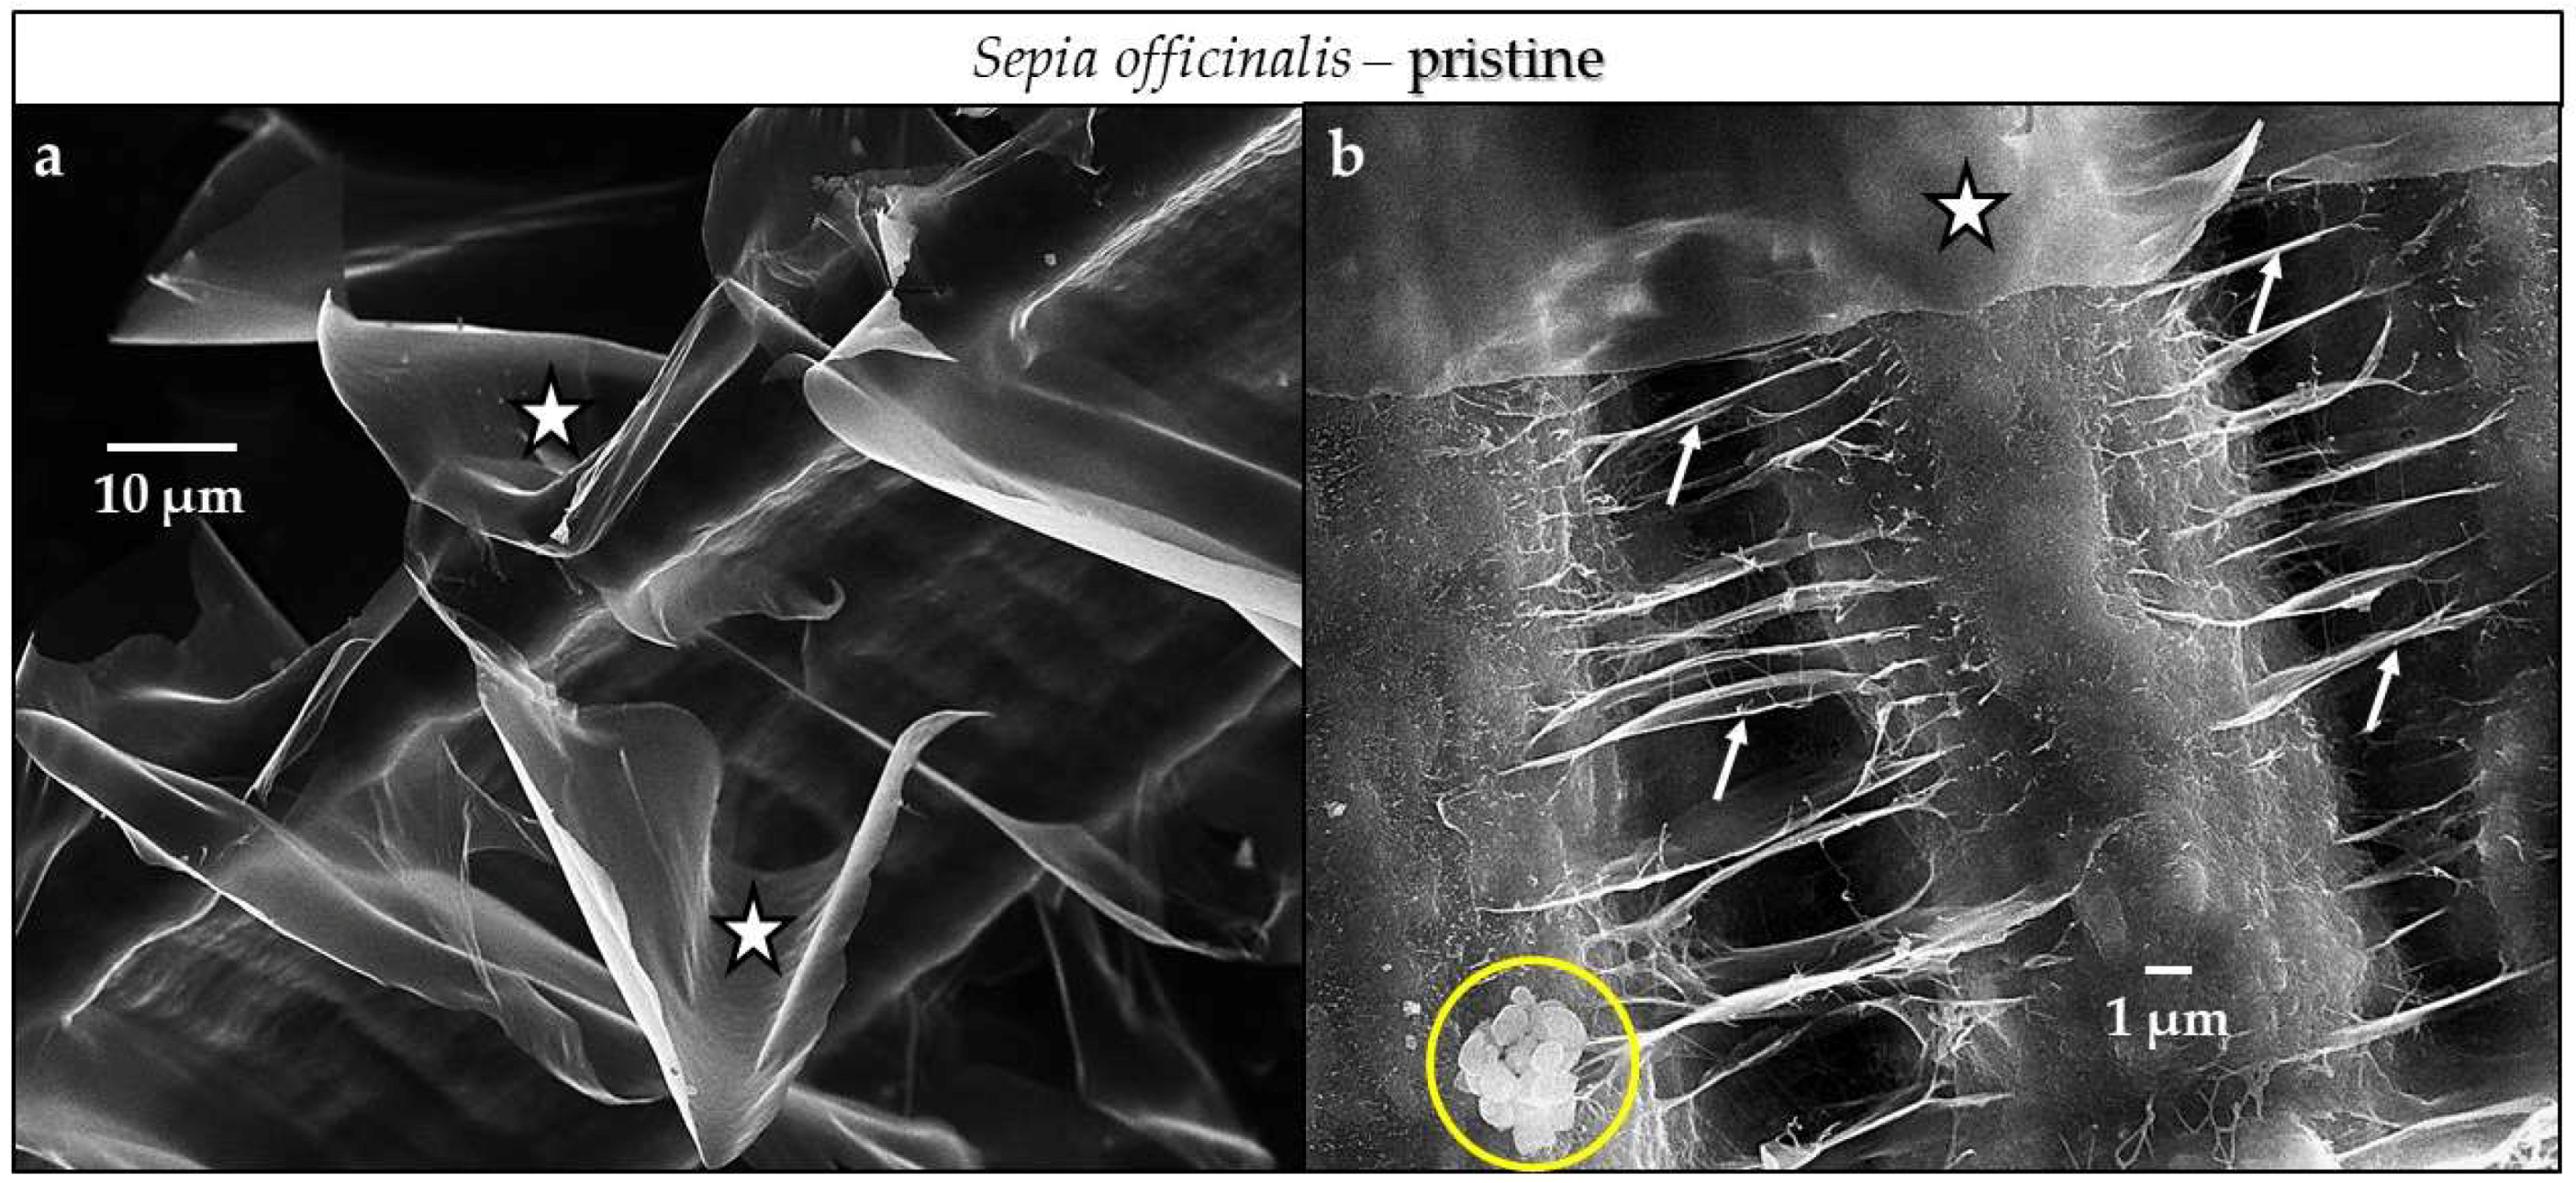
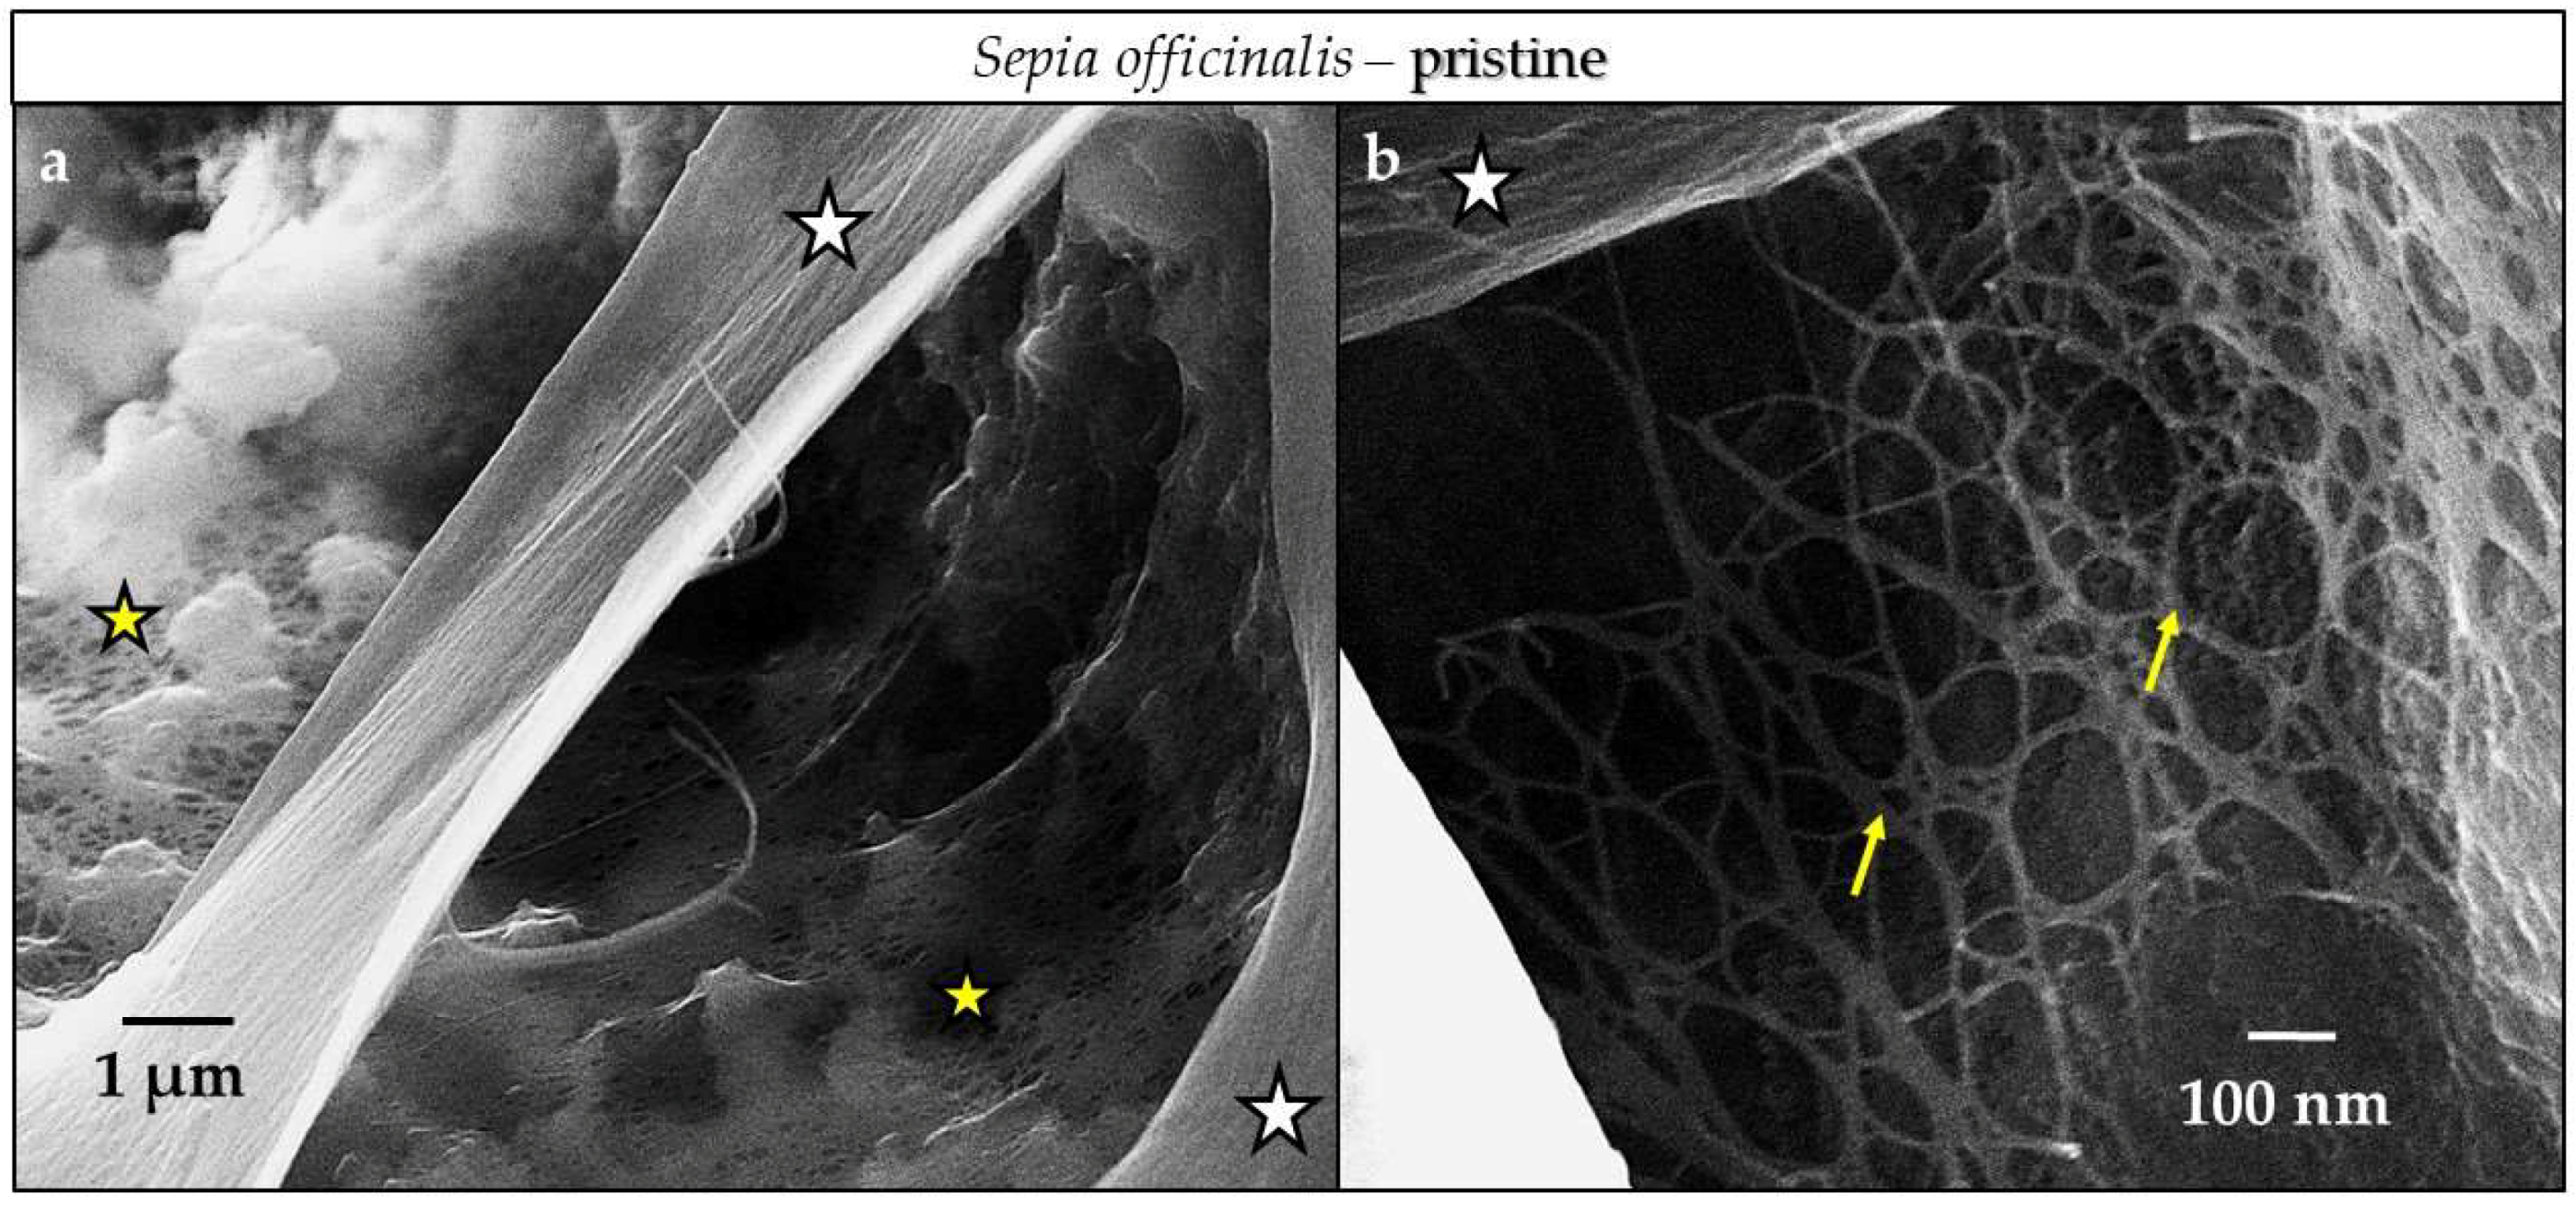
3.3. Scanning Electron Microscopy (SEM)

Figure 3, Figure 4, Figure 5, Figure 6, Figure 7, Figure 8, Figure 9 and Figure 10 present FE-SEM images showing crystallite and mineral unit arrangement preservation together with the distribution pattern of newly formed apatite (AP) for the investigated altered biogenic skeletons. As reference materials we used pristine equivalents of the geologic aragonite (Figure A4) and the altered skeletons (Figure A5, Figure A6, Figure A7, Figure A8, Figure A9, Figure A10, Figure A11, Figure A12, Figure A13, Figure A14, Figure A15 and Figure A16). Figure A4 shows structural features of a geologic aragonite single crystal that was altered for 14 days. We find that a thin layer of newly formed apatite has replaced the aragonite and covers the external surface of the crystal (Figure A4b). The apatite layer shows a multitude of cracks (Figure A4a) that most likely developed due to contraction when the sample was taken out of the boiling solution.
The shell of the bivalve Hyriopsis cumingii consists of aragonite that occurs in two distinct microstructures, nacreous aragonite next to the soft tissue of the animal and prismatic aragonite along the shell rim pointing to the seawater. The basic mineral units, prisms and tablets are encased by biopolymer membranes. Nacre tablets in the shell of the bivalve H. cumingii are arranged in a brick wall arrangement. As our XRD results (Figure A3) and the comparison between the pristine (Figure A5) and the 14 days altered (Figure 3c) shell portions show, the microstructure that was least transformed in the course of our experiments is nacreous aragonite. Nacre tablets as well as their microstructural arrangement remained well preserved even in the most altered sample (Figure 3). Even though, slight dissolution and reprecipitation has occurred as the surface of the 4 days altered and the nacre sample is covered with a layer of newly formed apatite crystals (Figure 3a,b). The weak and broad bands in the IR spectrum can be assigned to phosphate (ν3 and ν4). We identify them as AP, even though peaks that could be assigned to apatite were not found in the XRD pattern (Figure A3).
The microstructure of the shell of the bivalve Arctica islandica is also highly resistant to the formation of new apatite (compare images in Figure 4a,b to Figure A6a). The shell of pristine Arctica islandica (Figure A6 and Figure A7) consists of densely packed and irregularly shaped mineral units (yellow stars in Figure A6b,c and Figure A7) that are embedded into a network of biopolymer fibrils (Figure A6b,c and Casella et al., 2017 [32]). Mineral unit size, porosity and density of aragonite crystal packing are unevenly distributed within the shell (Figure A7 and Figure A8), such that, relative to inner shell portions, mineral unit and pore sizes along the shell rim pointing to seawater, are increased. Mineral unit organization in the shell of Arctica islandica is little structured, especially in shell portions along the seawater pointing shell rim (Figure A8b). However, aragonite that constitutes inner shell layers is present in a crossed-lamellar microstructural arrangement (Figure A8a), especially that next to the soft tissue of the animal. Growth lines are frequent and are easily observable (white stars in Figure A7a,c), as, at these, biopolymer contents and mineral unit sizes are increased. The shell of Arctica islandica can be addressed as consisting of densely packed aragonite. However, it shows primary porosity (Figure A8), with the porosity being unevenly distributed. Along the seaward pointing shell portion, pores are abundant and large, while at shell parts that are inward and closer to the soft tissue of the animal, pores are small and significantly less frequent.
As Figure 1 highlights, up to 7 days of alteration the Arctica islandica microstructure is highly resistant to conversion of bioaragonite to apatite, the morphology of crystallites and mineral units remains well preserved and only a negligible amount of apatite formation takes place. Alteration becomes more marked from nine days onwards, when we find occasional occurrences of AP in pores and cavities that develop when the organic material within the shell becomes decomposed.
As the macroarchitecture of the skeleton of the scleractinian coral Porites sp. consists of a multitude of vertical and transverse elements (e.g., septa, columns, pali, theca, trabercular units), the bulk 2D appearance of the coral sample is characterized by many voids, gaps and recesses (Figure A9a) and effects that the skeleton has a high surface area.
However, the basic mineral units of scleractinian coral skeletons are differently sized. Oriented clusters (white stars in Figure A9b) of densely packed aragonitic needles and acicles nucleate at and grow outward from cavities within the coral skeleton, the centers of calcification (white arrows in Figure A9c). The shape of basic mineral units in scleractinian coral skeletons can be addressed as partial or even as full spherulites. Already at 4 days of conversion a noticeable amount of AP forms and covers the surface of the coral skeleton (Figure 5a,b). At 14 days of conversion the AP cover increases in denseness (Figure 5c,d). In addition, we also observe some conversion to AP within the skeleton.
In contrast to the nacreous shell portion, prismatic aragonite in the shell of Hyriopsis cumingii is readily attacked. Aragonite prisms in modern H. cumingii (Figure A10a) are large units encased by thick biopolymer membranes (Figure A10d,e) consisting of aragonite crystallites (Figure A10b,c) placed within a network of organic fibrils (Figure A10f). Conversion from biogenic aragonite to apatite starts instantly and increases steadily with alteration time. At 14 days of alteration more than 25 wt % of prismatic aragonite of H. cumingii is transformed to AP, while the nacreous aragonite within the shell remains almost totally unaffected (Figure 1). At 4 of days of conversion we find that a layer of AP covers the prisms. When altered for 14 days, conversion affects both, the surface of the prisms (the cover with AP becomes thicker) and the aragonite crystallites within the prisms (Figure 6b–d).
The most rapid and profound conversion takes place in the cuttlebone of the cephalopod Sepia officinalis (this study and [16]). The macrostructure of the cuttlebone resembles a carpark structure and consists of regularly spaced platforms that are interconnected by curved walls forming differently sized compartments within the cuttlebone (Figure A11). Nanoparticulate aragonite (Figure A11a,b) with sizes between 400 to 600 nm constitute all skeletal elements, the platforms and the walls. For the walls, we do not find a specific arrangement of the nanoparticulate aragonite, contrasting to the platforms that comprise different layers (white, yellow and blues stars in Figure A1d), consisting of differently oriented stacks of aragonite rods (Figure A12, white stars in Figure A12a), with rods being composed of nanoparticulate aragonite embedded into a biopolymer matrix (Figure A12b, yellow arrows in Figure A12c). Etching of the cuttlebone for 180 s exhibits the biopolymer fraction within the skeleton (Figure A15 and Figure A16). The high amount of biopolymers present in the cuttlebone is well observable as well as the large variety of organic fabrics. For all biological hard tissues that we investigated in this study, the highest organic content is present in Sepia officinalis cuttlebone. This yields a huge interface area between the mineral and the biopolymer.
The aragonite within the cuttlebone is attacked instantly with the onset of the conversion process. Conversion for an hour already yields the formation of AP crystals within skeletal elements (white arrows in Figure 1b and Figure 7a). At conversion for 5 h the original carpark structure of the cuttlebone is still preserved (Figure 7b), even though about 60 wt % of the aragonite is converted to AP. Up to this stage AP formation takes mainly place within skeletal elements (Figure 7d), while AP growth onto outer surfaces, e.g., the walls of compartments (white arrows in Figure 7c) occurs to a lesser degree. We find that AP growth onto surfaces is highly increased during late stages of the reaction process (Figure 8 and Figure 9): AP crystals merge (Figure 9) and form larger units (white arrows in Figure 8b,c). This creates a dense and solid layer of AP crystals that reproduces the external shape of cuttlebone elements (Figure 8a). Figure 10 shows the macrostructure of Sepia officinalis cuttlebone that was exposed to the reaction with the phosphate-bearing solution for 3 days. Some ultrastructural features of the skeleton are still observable even though broken and deformed. The biopolymer membrane lining of the chambers is still present (yellow arrows in Figure 10d), however, now detached from the mineral. Even though the carpark structure of the skeleton is still preserved to some degree, the entire structure loses its cohesion as the walls detach from the platforms and the compartments become overgrown with newly formed precipitates.

4. Discussion

4.1. The Phase Conversion Mechanism

The conversion of the studied aragonitic biominerals and that of geologic aragonite into apatite occurs with the preservation of morphologies and some microstructural features. Pseudomorphic conversion of biocarbonate in contact with phosphate-bearing solutions takes place via interface coupled dissolution-recrystallization [16,22,33,34]. The conversion mechanism involves the dissolution of primary aragonite and the precipitation of secondary apatite [35,36,37,38,39,40]. The preservation of external morphologies and microstructural features requires that the dissolution and the crystallization reactions are temporarily and spatially coupled [22,35,36,37,38,39,40] and that the dissolution of aragonite is the conversion rate-controlling step [22,35,36,37,38,39,40,41,42,43,44].

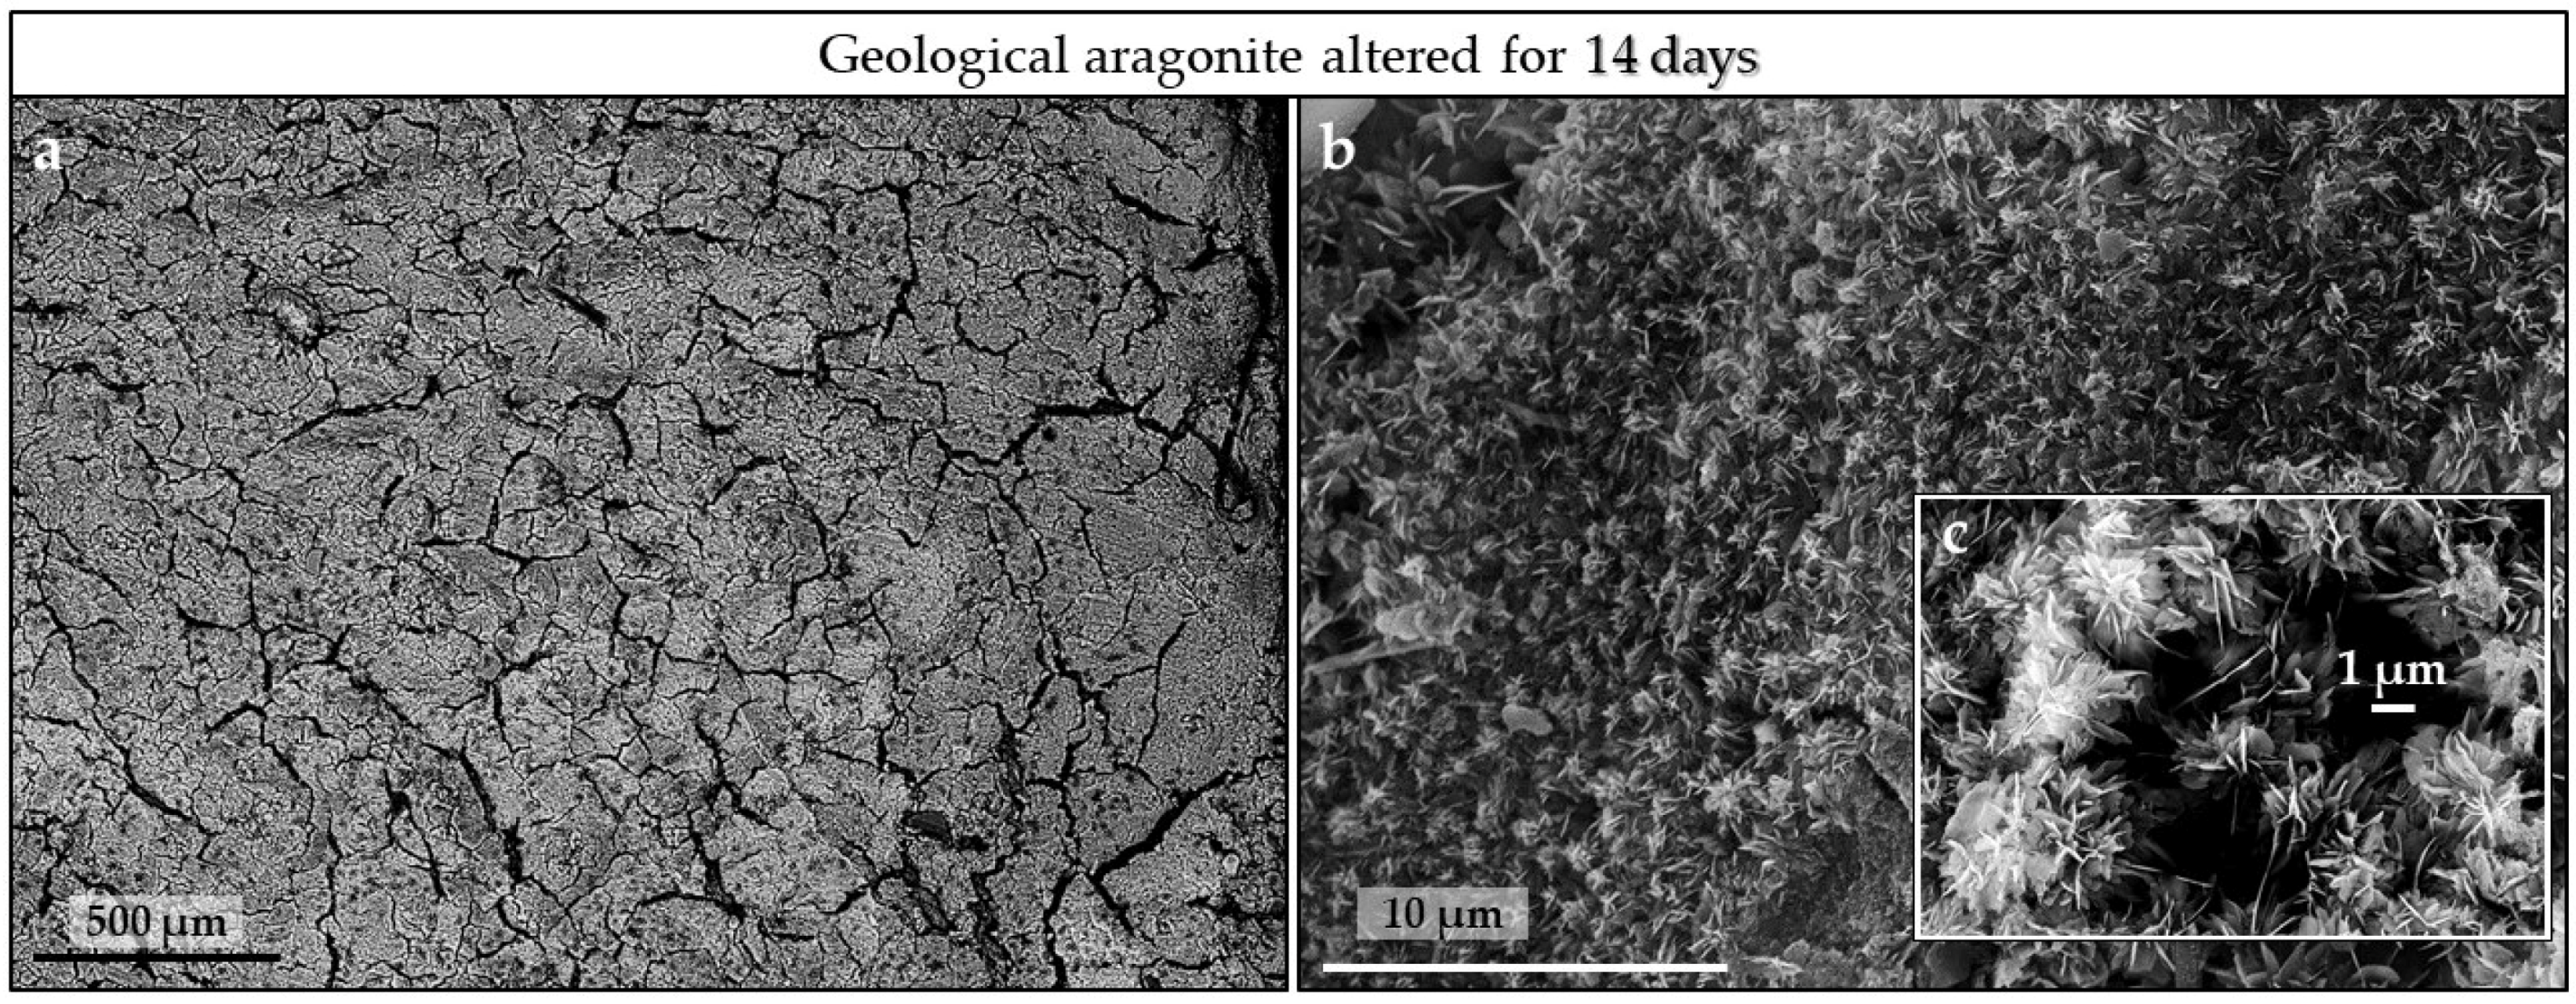
4.2. The Conversion of Geologic Aragonite

At 14 days of reaction we observe only a thin cover and a thin rim (~100 microns) of AP that replaces the outer surface of the aragonite crystal (Figure A4b). The transformed rim accurately reproduces the external shape of the aragonite crystal. The network of cracks within the newly formed AP layer covering the surface of the aragonite crystal (Figure A4a) is due to rapid cooling-related shrinkage and is most likely generated when the crystal is extracted from the boiling solution. The very limited conversion of geologic aragonite to AP is most probably not due to early surface passivation. Surface passivation during pseudomorphic mineral replacement occurs when (a) the structures of the parent and product phases show similarities that facilitate epitactic growth onto each other, and/or (b) the molar volume change associated with the conversion is positive [41]. Previous studies of the conversion of aragonite to AP under hydrothermal conditions demonstrated that AP grows oriented onto the aragonite surface [45]. Some authors interpreted this feature as evidence that the conversion is topotactic. However, strong arguments [33] support the notion that AP oriented growth develops with the advancement of the replacement front due to competitive growth. Hence, in those cases where an epitactic layer of the product phase forms, it often consists of an aggregate of crystals where several epitactic orientations coexist [46,47]. Consequently, the newly formed product layer commonly contains a certain amount of intrinsic intergranular porosity and does not seal completely the parent phase from further interaction with the solution [46,47]. In addition, the molar volume change associated with the aragonite—AP conversion is negative (−6%) [16,22,34]. As the external shape of the sample is preserved during conversion, porosity has to be generated to compensate the molar volume loss [35,36,37,38,39,40]. In addition, further porosity is generated due to the difference in solubility between the original and the product phases, e.g., AP is many orders of magnitude more soluble than geologic aragonite [37,40]. Hence, in the case of aragonite to apatite conversion, much porosity is generated, through which the fluid can communicate with the parent phase. In the case of geological aragonite, we must conclude that the negligible degree of conversion is not a consequence of lack of communication between the interface and the reaction fluid, where the dissolution-recrystallization reaction takes place. It is the consequence of a very slow dissolution rate of geologic aragonite under the experimental conditions used in this study. The slow dissolution of the geologic aragonite sample can be attributed to its low reactivity, to which its single crystallinity and its low surface area extent only adds up.

4.3. The Conversion of Biologic Aragonites

With the exception of H. cumingii nacre, which undergoes almost no phase change up to 14 days of alteration, all other biological hard tissues that were investigated in this study transform to AP at a much faster rate than geologic aragonite (Figure 1, Table 1). One difference that explains the higher rates of conversion is given by the fact that the biologic hard materials consist of nanometer-to micrometer sized biocrystals, while the geologic aragonite is a macroscopic single crystal. Hence, the surface area where the phosphate-bearing boiling solution can interact with the biogenic mineral is significantly higher in comparison to that of geologic aragonite. The direct consequence is a much faster dissolution of biogenic aragonite, and also a faster conversion to AP, as aragonite dissolution is the limiting step. In addition, the biogenic aragonite is more soluble than geological aragonite [48,49] since solubility is size-related and increases as the crystal size decreases—this also favors the faster conversion of biologic aragonite into AP.
Another major factor that plays a role in accelerating the conversion of biogenic aragonite to apatite relates to the composite nature of the biologic hard material. All extracellularly formed biological hard tissues contain occluded biopolymers [50,51,52,53], these being developed as organic membranes, fibers or networks. The steadily advancing degradation of the organic component effects that the biologic aragonite becomes progressively more porous, thus channels are formed, through which the solution can reach inner sample regions. This creates an additional increase in mineral surface area that is exposed to the fluid, and herewith contributes to a faster conversion kinetics. However, it should be kept in mind that this porosity is inherent to biological hard tissues and is independent of that, that develops due to the aragonite to AP conversion process itself.

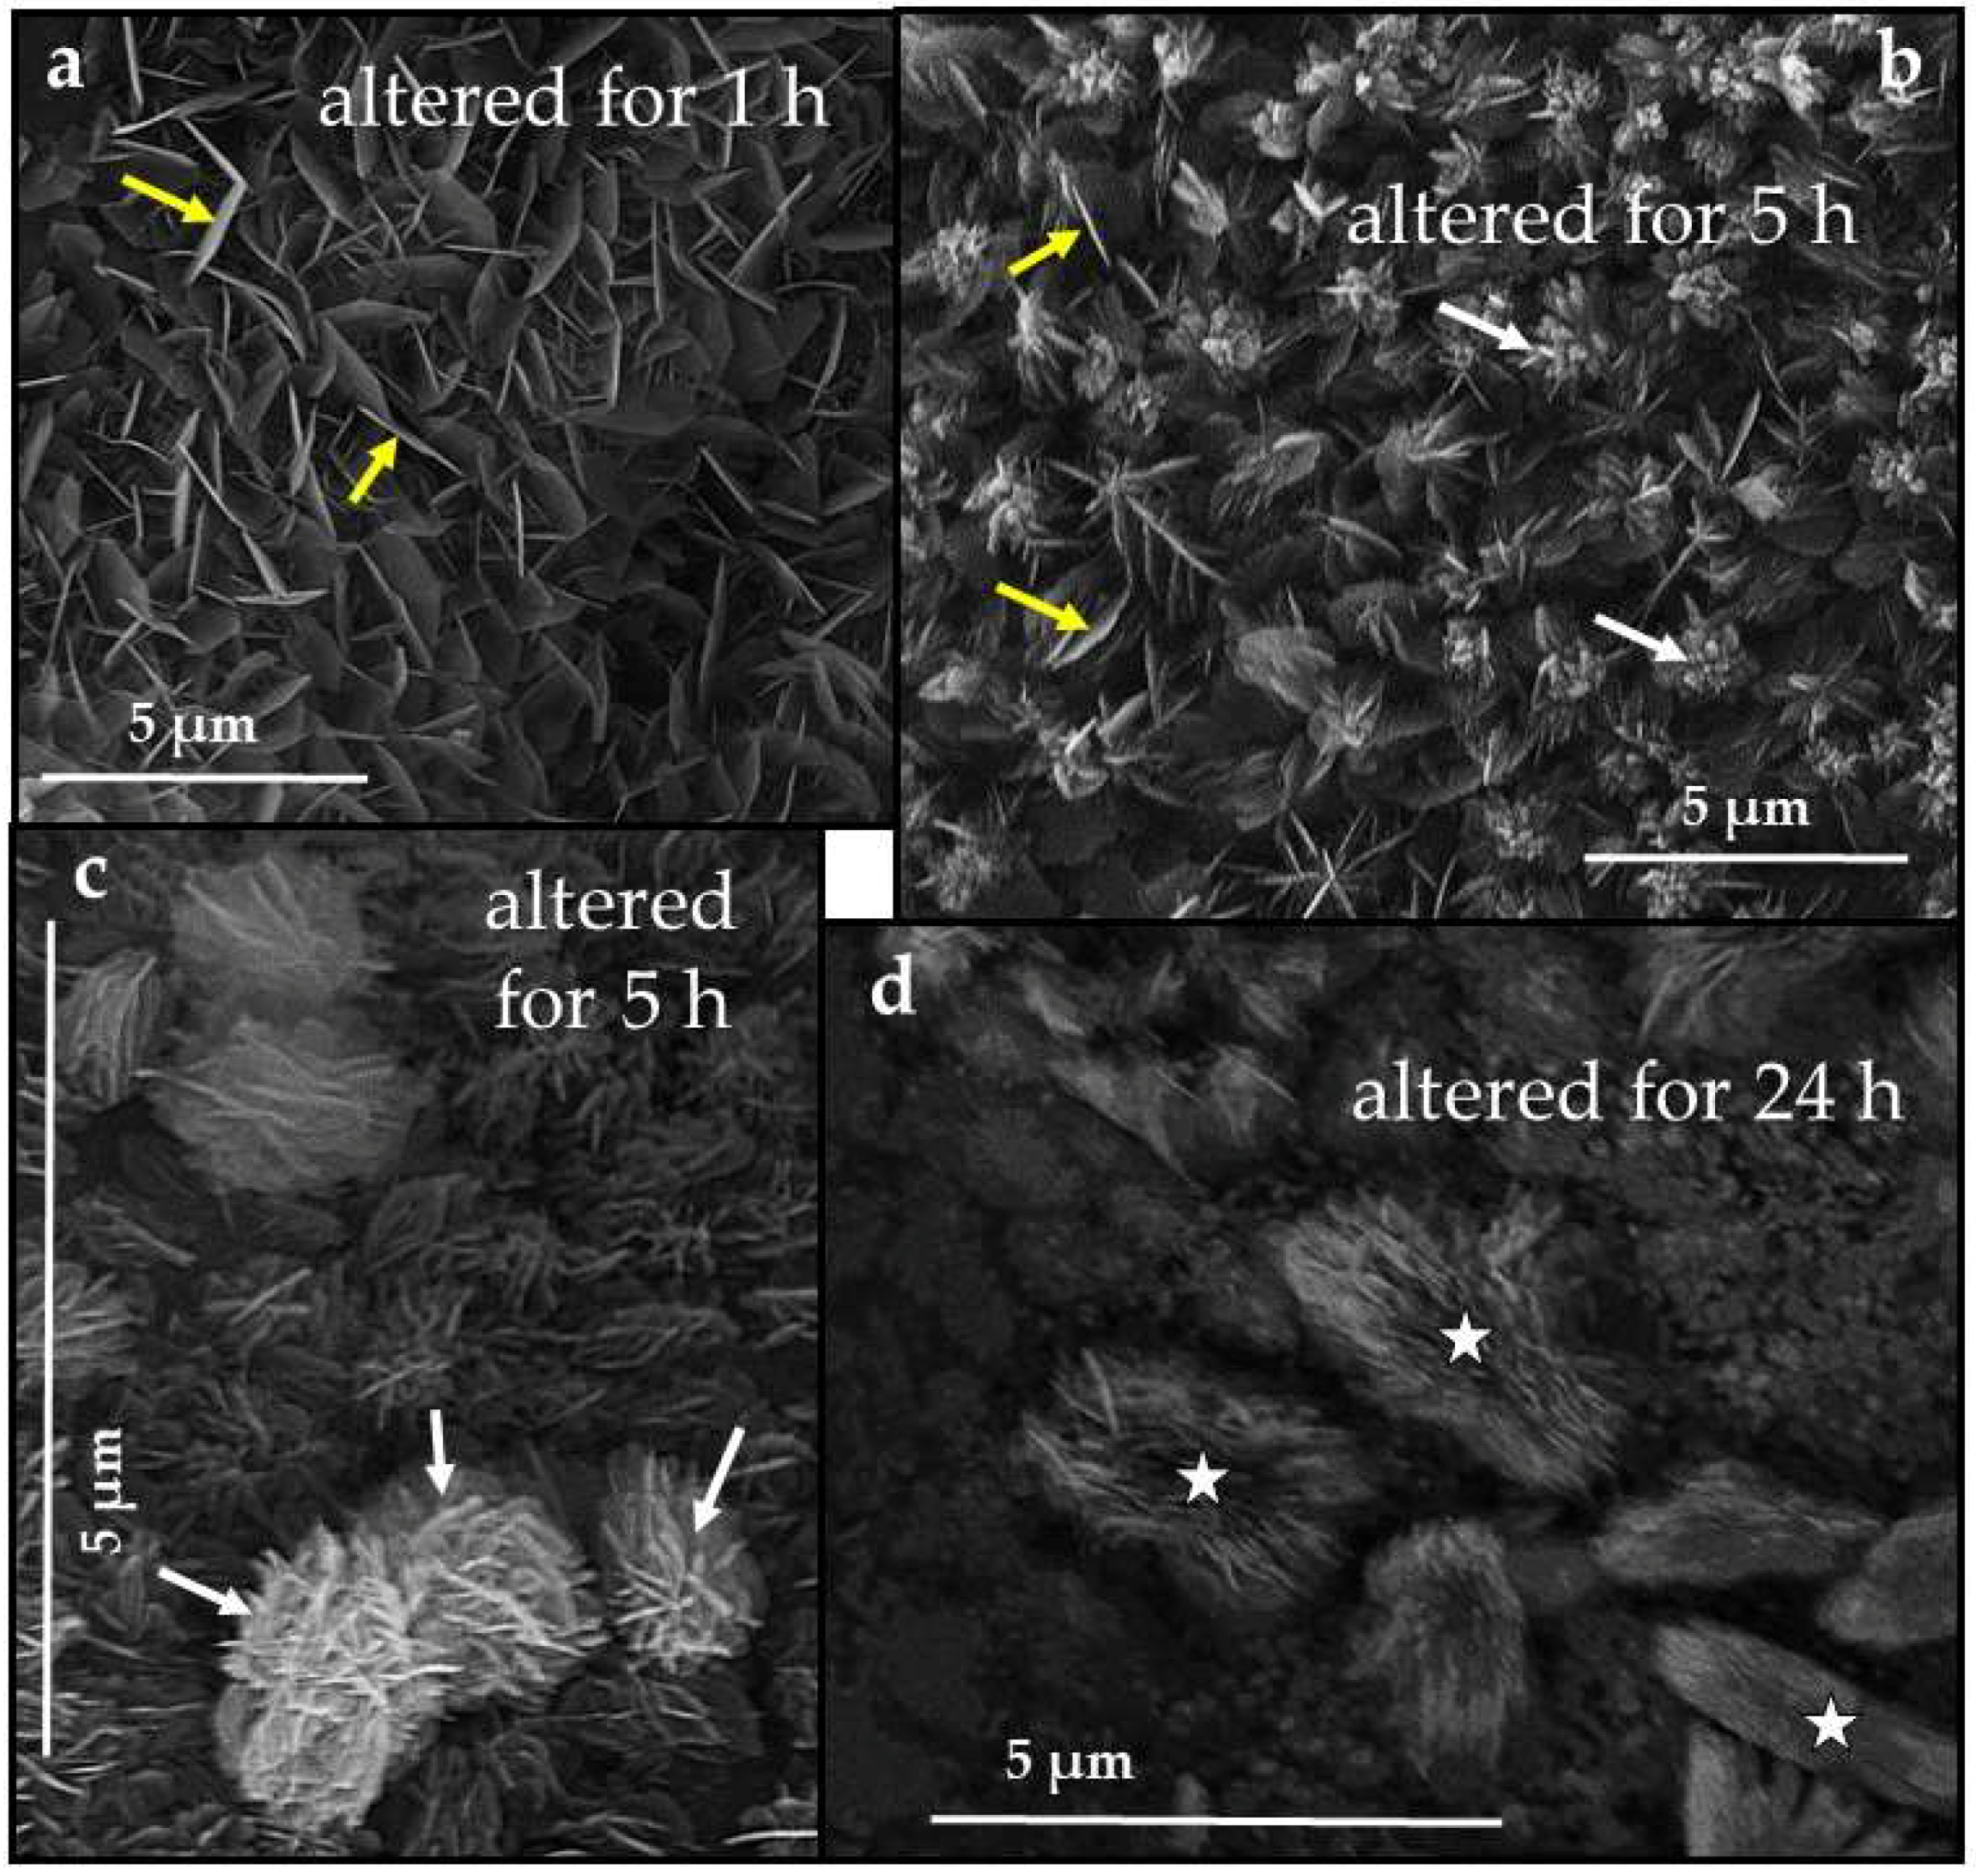
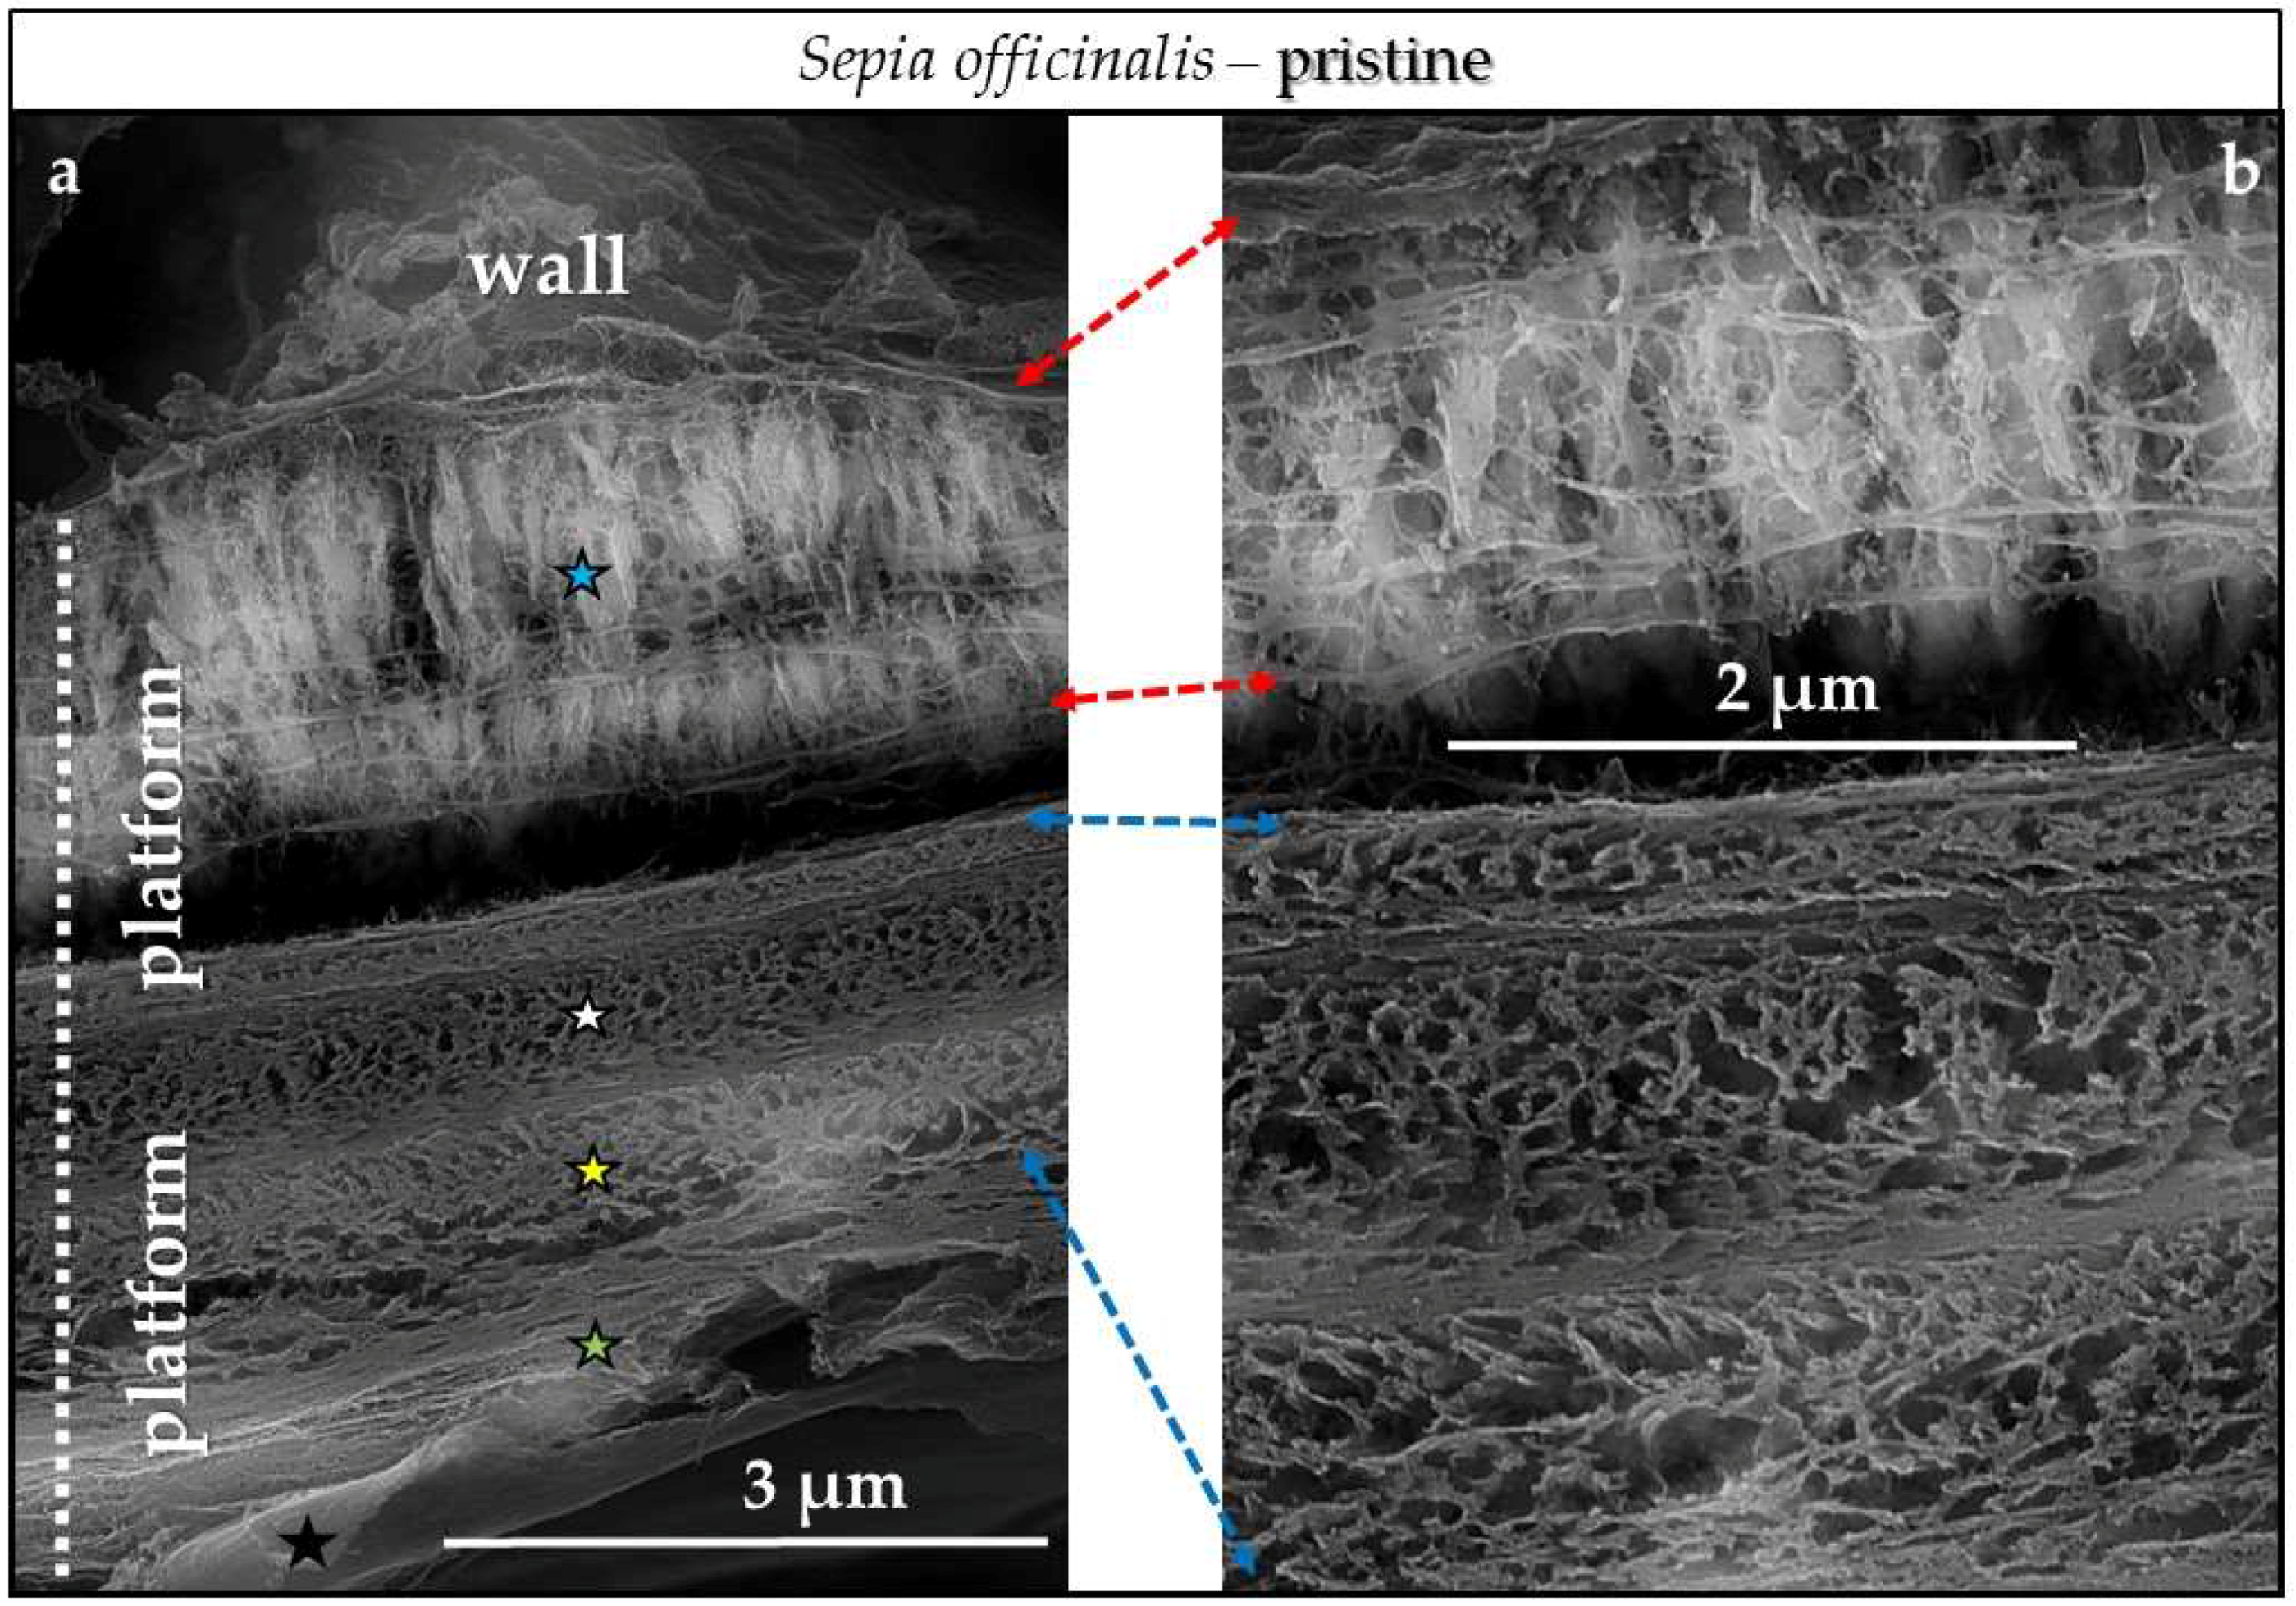
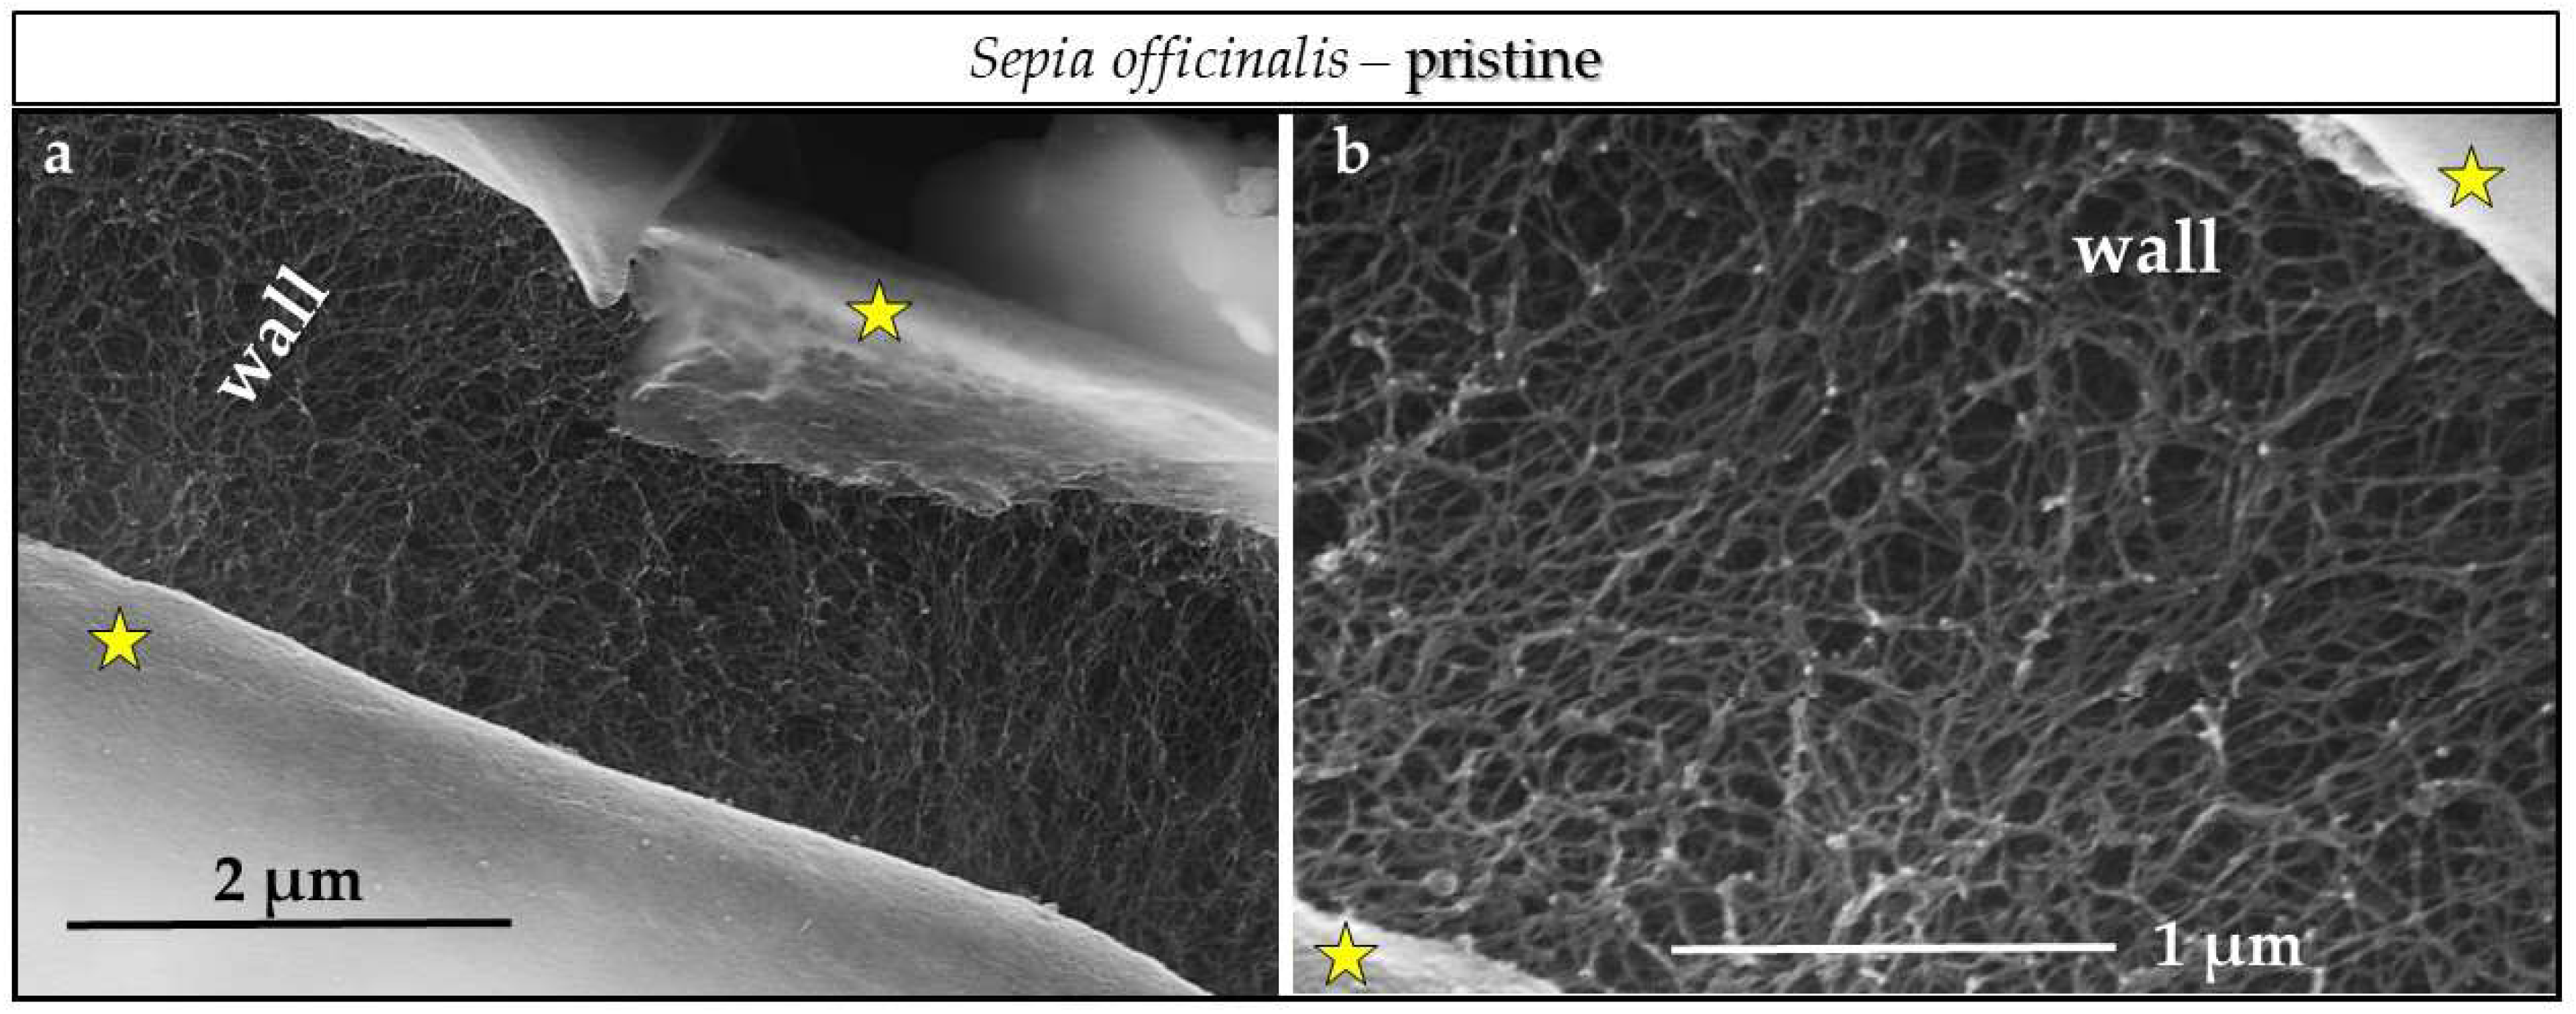
4.3.1. Sepia officinalis Cuttlebone Aragonite

Most interesting is the very different conversion kinetics of the investigated biogenic aragonite samples (a) from geologic aragonite and (b) between the biological materials themselves (Figure 1, Table 1). This is called forth by an interplay between specific microstructure, inherent (original) porosity, biopolymer content, fabric, pattern of organics distribution and the extent of mineral surface that can interact with the reaction fluid.
Sepia officinalis cuttlebone is the biomaterial that shows the highest reactivity. This highest reactivity compared to other biominerals cannot be attributed to differences in average crystallite size, since differences in this parameter are negligible (504 Å for H. cumingii and 486 Å for Sepia officinalis, the slowest and the fastest transforming biomaterial, respectively). Of the investigated hard tissues the cuttlebone has the most lightweight skeleton with the aragonite being well protected by various biopolymers: (a) a thick outer organic membrane shielding the outermost surface of the entire cuttlebone, (b) resistant biopolymer linings occluded within the cuttlebone covering the outer surfaces of all building elements (walls, platforms) (Figure A13a, Figure A14a and Figure A16), and (c) biopolymer films and networks occluded within the building elements and in between the aragonite crystallites (Figure A12b,c, Figure A13b and Figure A14, especially Figure A15 and Figure A16). Reaction, especially at the very beginning of the conversion process (up to three hours of reaction), takes place at an extremely fast rate and is facilitated by the very large surface area of the mineral that becomes exposed to interaction with the aqueous solution. The large surface area exposure is given by (a) the highly permeable carpark structure of the cuttlebone (Figure A11c), (b) the nanoparticulate nature of the biologic aragonite (Figure A11a), (c) the very delicate fabric (Figure A13b, Figure A15 and Figure A16) and (d) the rapid decomposition of organic material occluded within the building elements. Especially the latter contributes to an increase in porosity and escalates the conversion process.
The shape of the conversion curve for Sepia officinalis in our experiment very closely resemble that obtained by Kasioptas et al. [22] at similar temperature under hydrothermal conditions. These authors found that their experimental data fitted well the Avrami function. The profile of a curve that is given by the Avrami equation for phase transformation at constant temperature indicates that, subsequent to nucleation and initial rapid reaction, the transformation to a new phase steadily slows down as little unreacted material is left for the production of a new phase [54,55,56]. This is what we see for Sepia officinalis (Figure 1b). We find that two sections of the conversion curve can be distinguished according to different conversion rates (Figure 1b). Up to three hours of reaction the conversion rate of bioaragonite to AP is incredibly high. This is the time period where the minute aragonite crystallites within the structural elements of the hard tissue are transformed to AP (white arrows in Figure 7d). The reaction is driven by the fast decomposition of occluded organics (characterized by their delicate fabric) within the major structural elements. However, as it is well visible in Figure 7c,d, the membrane linings that protect the outer surfaces of structural elements remain unaffected up to that point (yellow stars in Figure 7d). Conversion slows significantly down after three hours of reaction (Figure 1b). This is the time period where the protecting biopolymer membrane linings start to become attacked as well. This facilitates AP nucleation onto the outer surfaces of the walls and the platforms (Figure 7c); progressive conversion induces their complete coverage with AP (Figure 8). When altered for a few days the compartments of Sepia officinalis are not just filled up with AP, as the conversion of bioaragonite to AP is complete in 24 h, thus there is no parent aragonite left to be transformed to AP. With ongoing conversion for a few days, we find that structural elements become highly deformed and the carpark structure becomes ruptured (Figure 10).

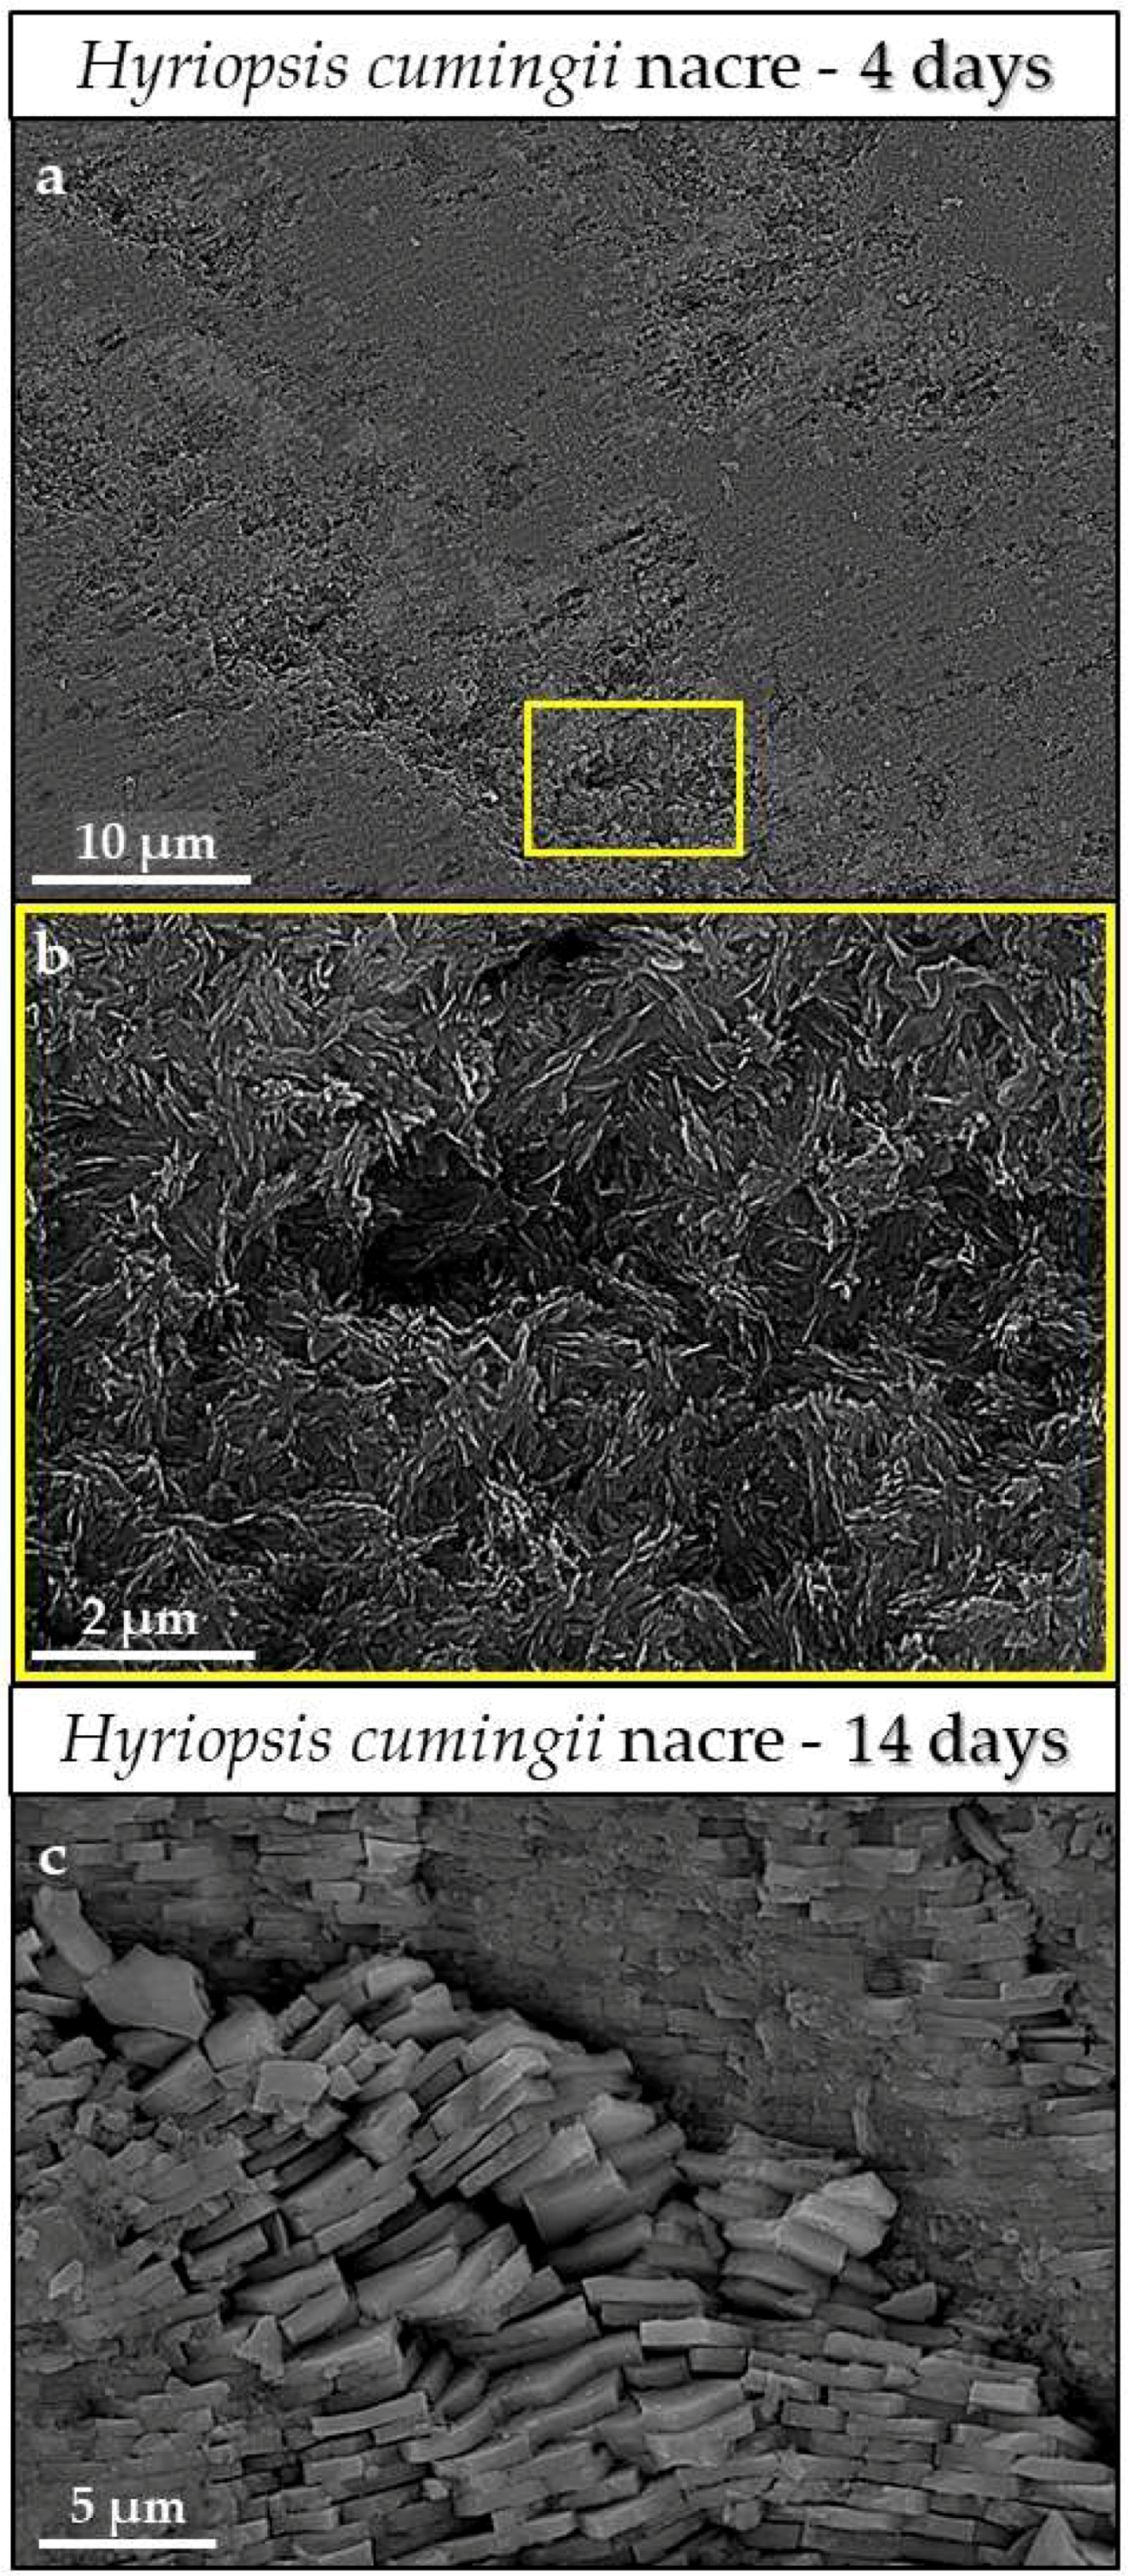
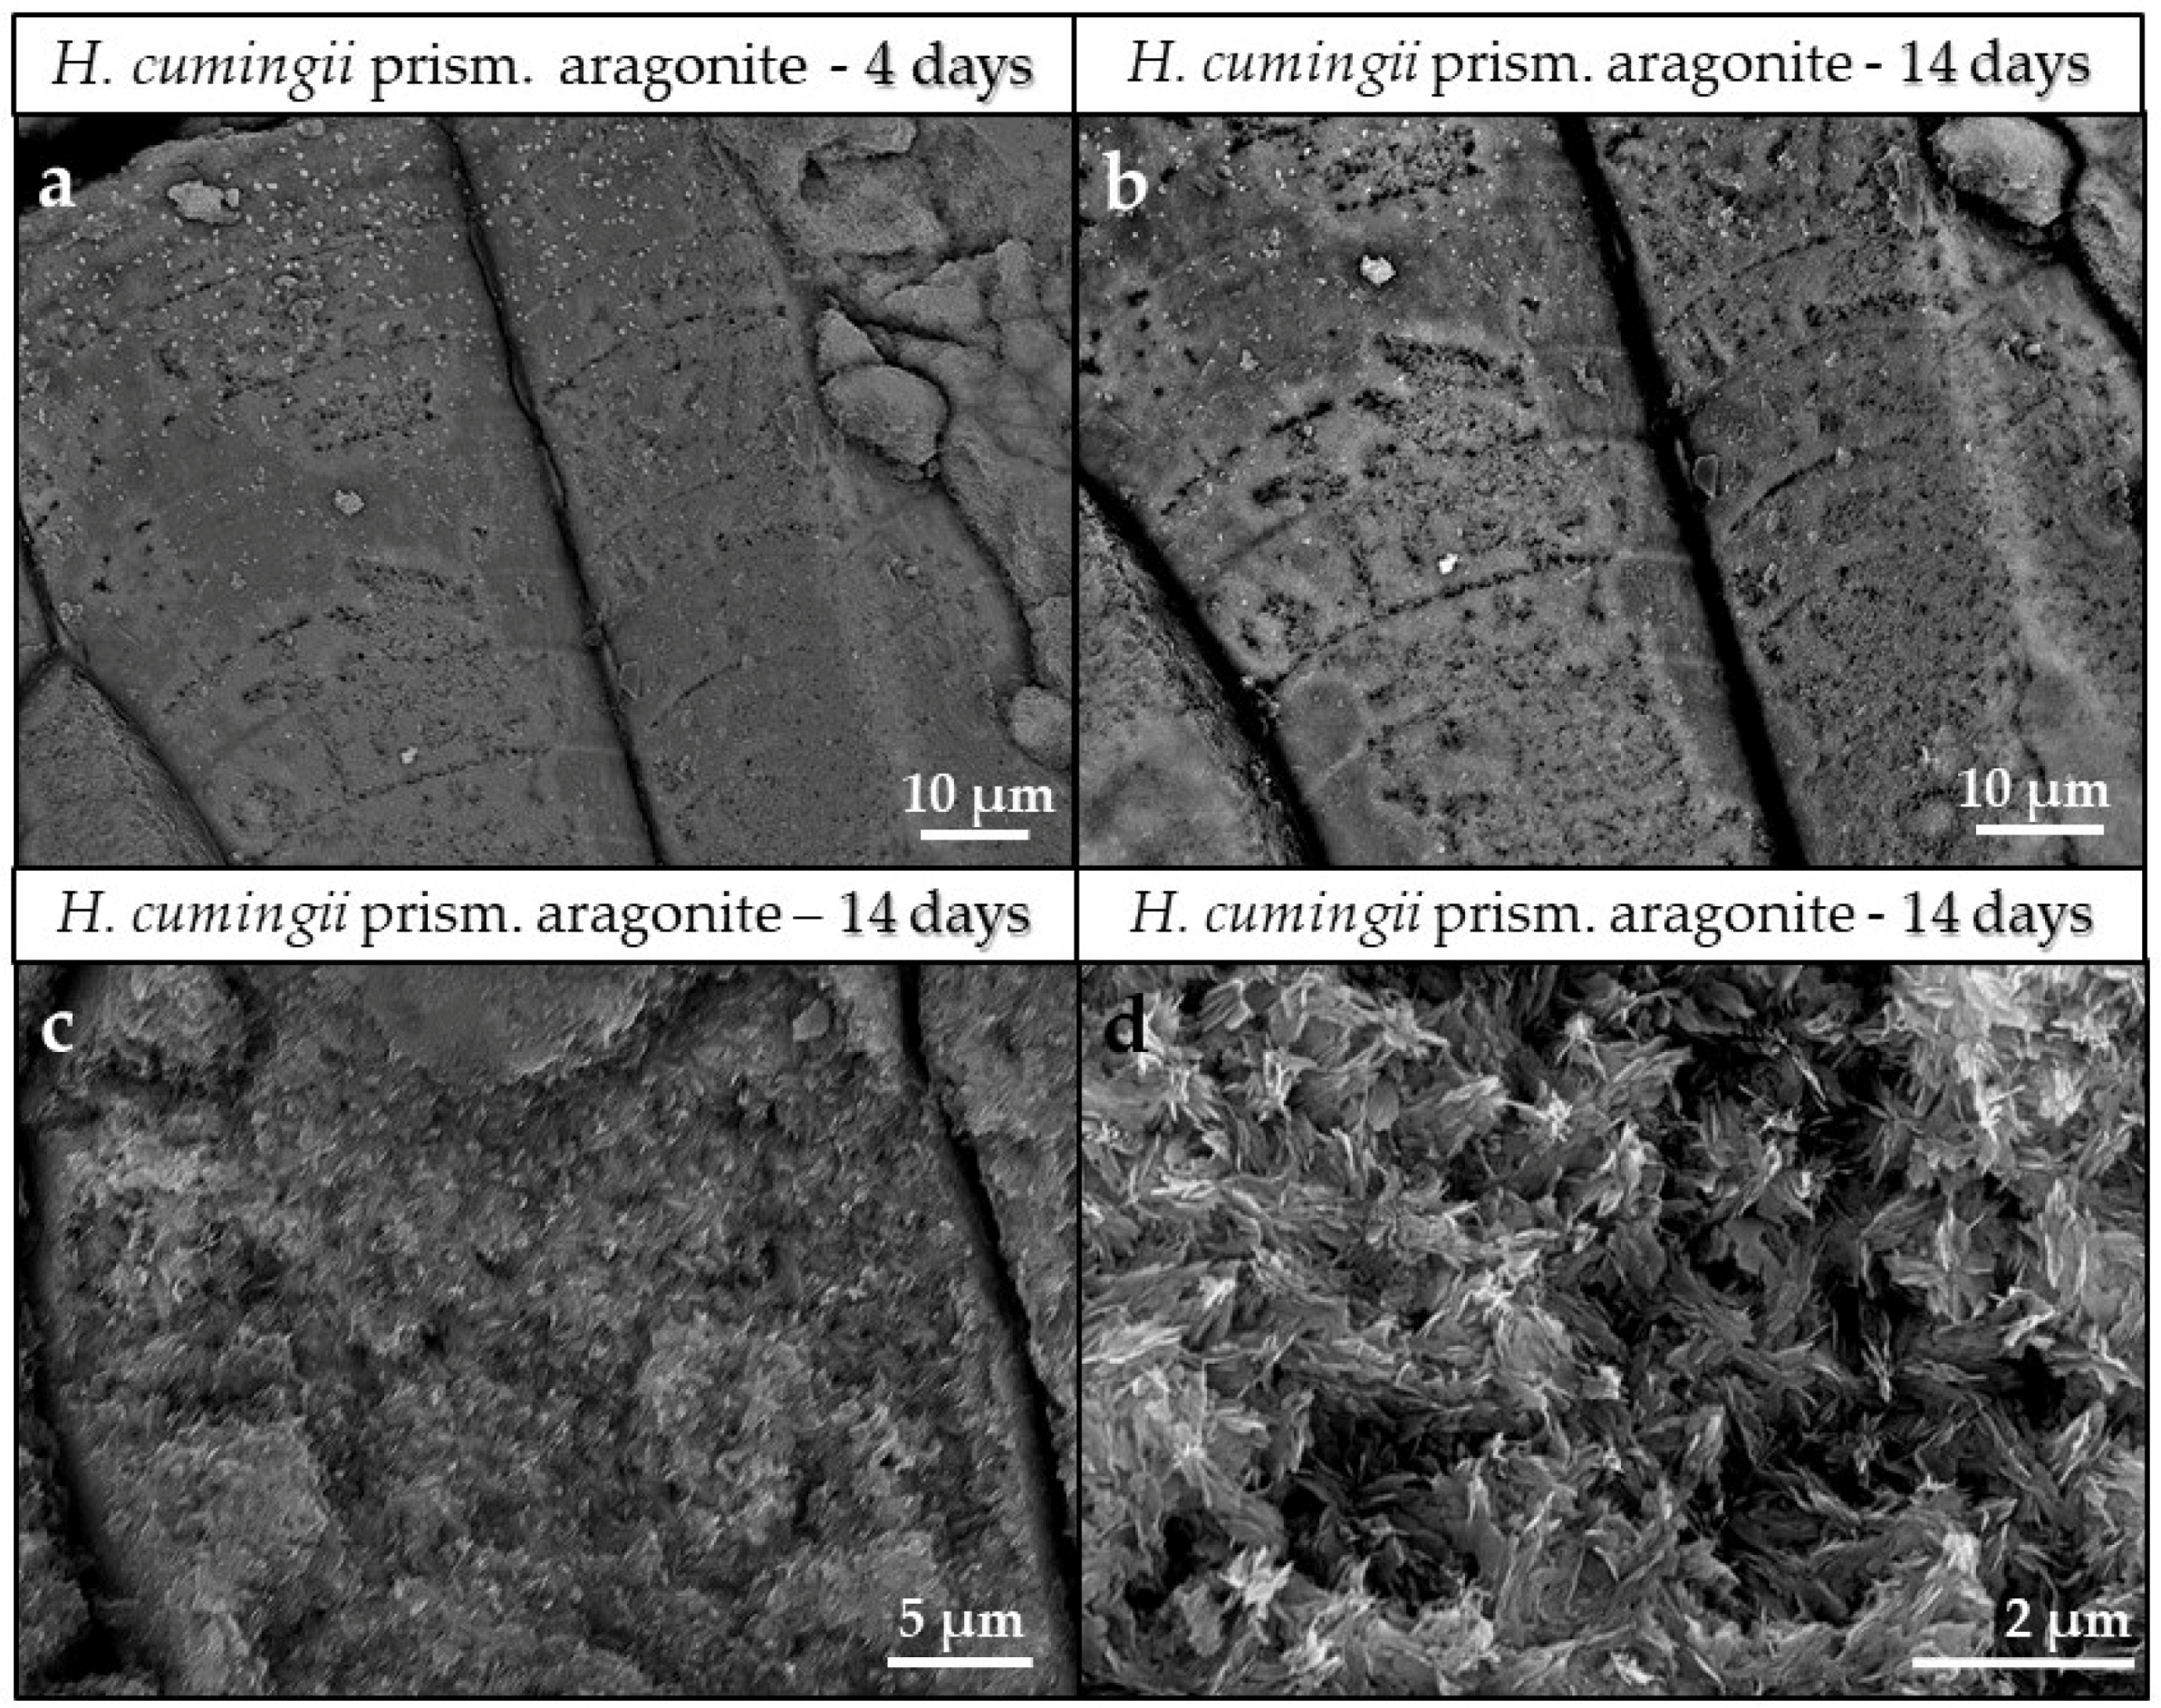
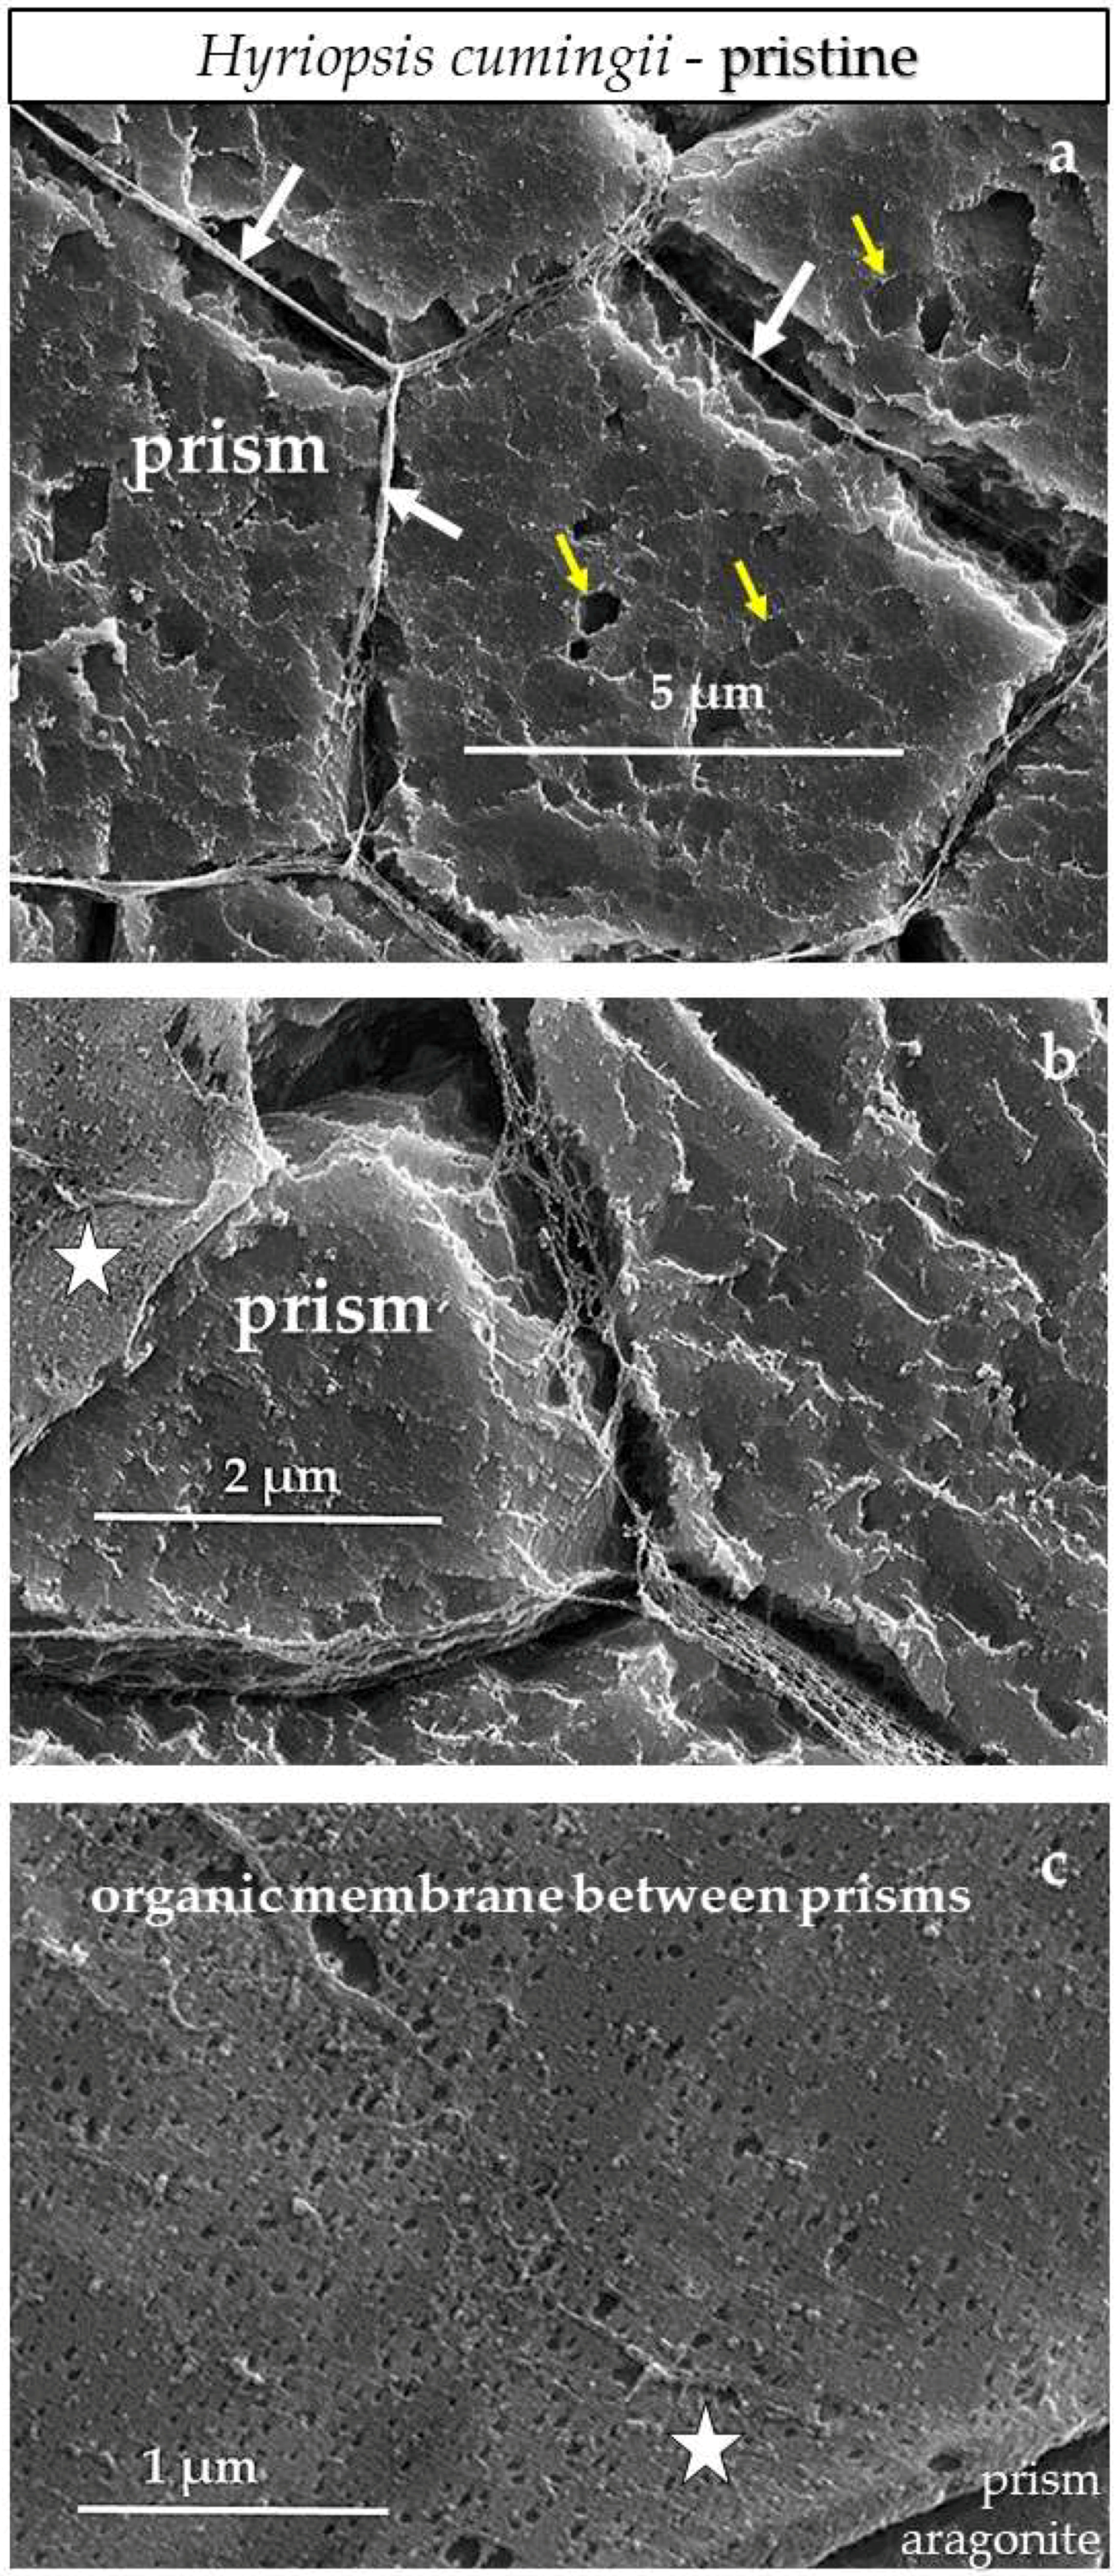
4.3.2. Porites sp. Acicular and Hyriopsis cumingii Prismatic Aragonite

Porites sp. and Hyriopsis cumingii prismatic aragonite are the biomaterials that reach the next highest degree of conversion to AP after Sepia officinalis cuttlebone (Figure 1, Table 1). Nonetheless, conversion kinetics is significantly different of that of the cephalopod cuttlebone. While in the cuttlebone replacement rates shoot up first and slow down at the end of the process, for Porites sp. aragonite and Hyriopsis cumingii prismatic aragonite we find at first (up to 4 days) a slow but steadily increasing dissolution of biological aragonite and precipitation of apatite (Figure 1a). Even though in Porites sp. and Hyriopsis cumingii prisms newly formed AP contents are high, the speed of conversion is not at all comparable to that of Sepia officinalis cuttlebone. In 14 days of alteration 25 and 38 wt % AP content is detected in H. cumingii prismatic shell layer and the Porites sp. skeleton, respectively. With progressive reaction time, between 4 and 9 days of reaction, conversion to AP in the coral skeleton stops, in contrast to prismatic aragonite in H. cumingii, where it still increases steadily. For the time period between 9 and 14 days of reaction, AP formation rates change again: it increases significantly for Porites sp., while it stops for H. cumingii prisms (Figure 1a).
In comparison to the cuttlebone, significantly less organics are occluded in the bivalve shell and the coral skeleton. Hence, there is significantly less surface area where the reaction fluid can react with the mineral. The steady formation of AP in the coral and the bivalve shell within the first four days of reaction can be attributed to dissolution of bioaragonite along outer surfaces of the skeletons. It is well visible (Figure 5) that already after 4 days of alteration the surface of Porites sp. becomes covered with a thick layer of AP crystals. Exactly at this point we find that conversion of aragonite to AP in Porites sp. stops (Figure 1a). As the coral skeleton is dense and has very little occluded organics the conversion rate to AP is slow compared to that of the exceedingly more porous and highly organic rich cuttlebone. However, it is much faster than the conversion rate of geologic aragonite. We know from previous work [57] that the reaction fluid enters the skeleton of Porites sp. through centers of calcification and that new mineral formation starts and extends from here into the skeleton. This characteristic is reflected in the conversion curve as well, with the sudden increase in AP content at later stages of reaction, between 9 and 14 days (Figure 1a), when AP formation in Porites sp. shoots up significantly.
The prismatic aragonite shell portion of Hyriopsis cumingii is slightly porous. We find pores between the columns as well as within the membranes that encase the aragonite of the columns (Figure A17). The reaction fluid enters the shell through these pores, infiltrates the entire prismatic shell portion and space between the columns as well as the inner parts of the columns. The network of biopolymer fibrils (Figure A10d–f) within the columns becomes easily decomposed as their fabric is delicate. Accordingly, the surface area where reaction fluid can react with the mineral becomes highly increased; the aragonite crystallites constituting the prisms are minute to small in size, easily dissolved and reprecipitated as apatite (Figure A10f). However, as Figure 1a shows, the conversion process for H. cumingii prisms stops abruptly at nine days of reaction. At this stage we find the surface of the columns to be covered with AP shielding the aragonite within the columns from reaction with the fluid. Even though more porosity is generated as the conversion progresses, an increase in tortuosity of the pathway that communicates the fluid with the remaining aragonite and a reduction in aragonite area exposed to the fluid might explain the slow-down of the reaction.

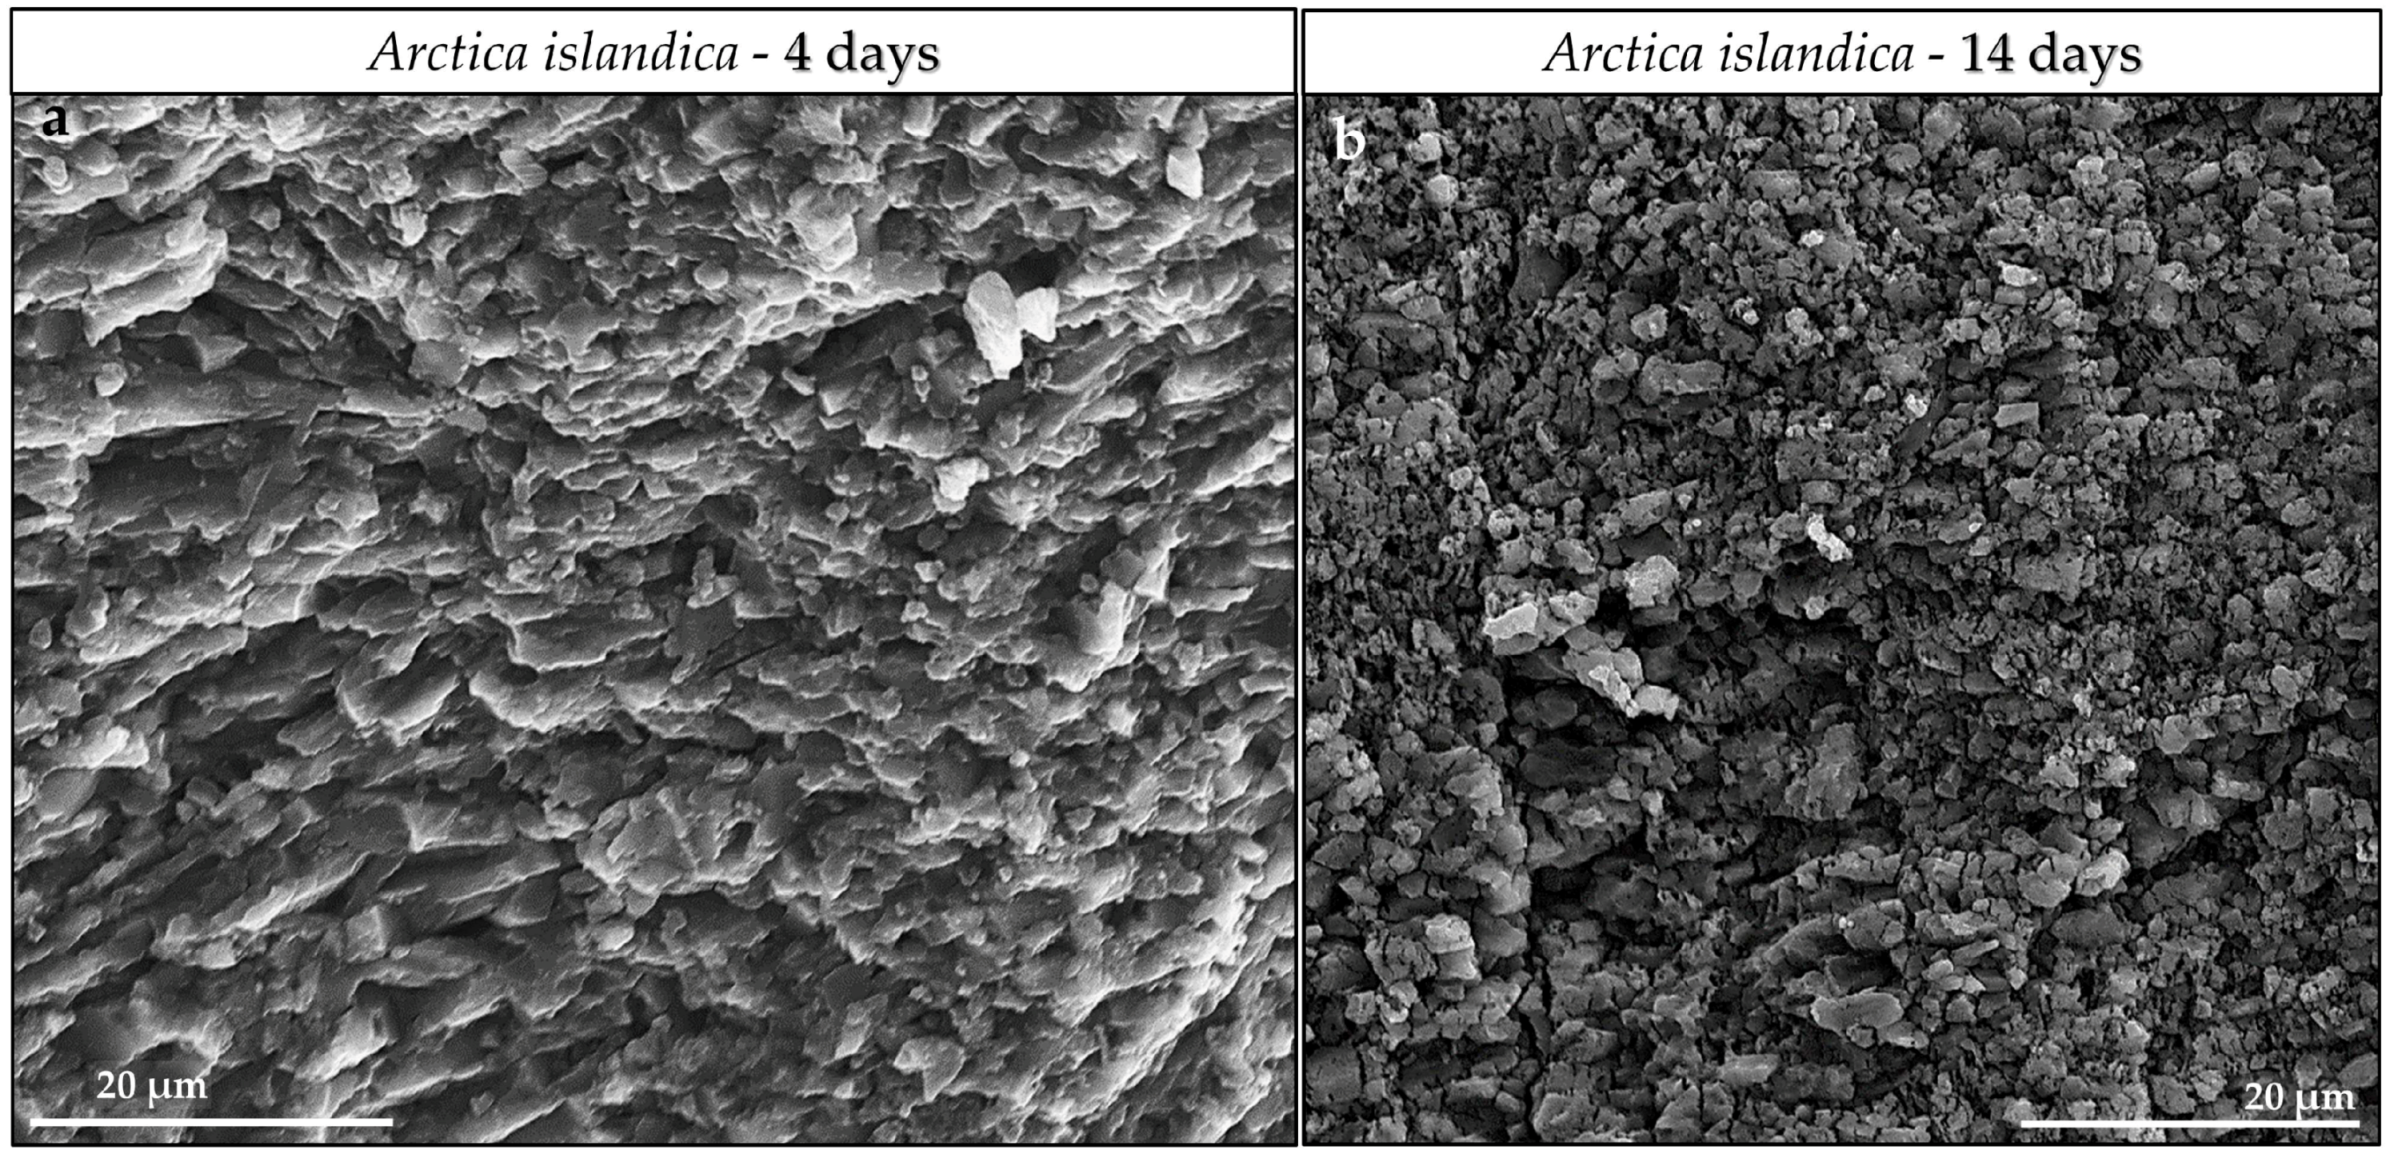
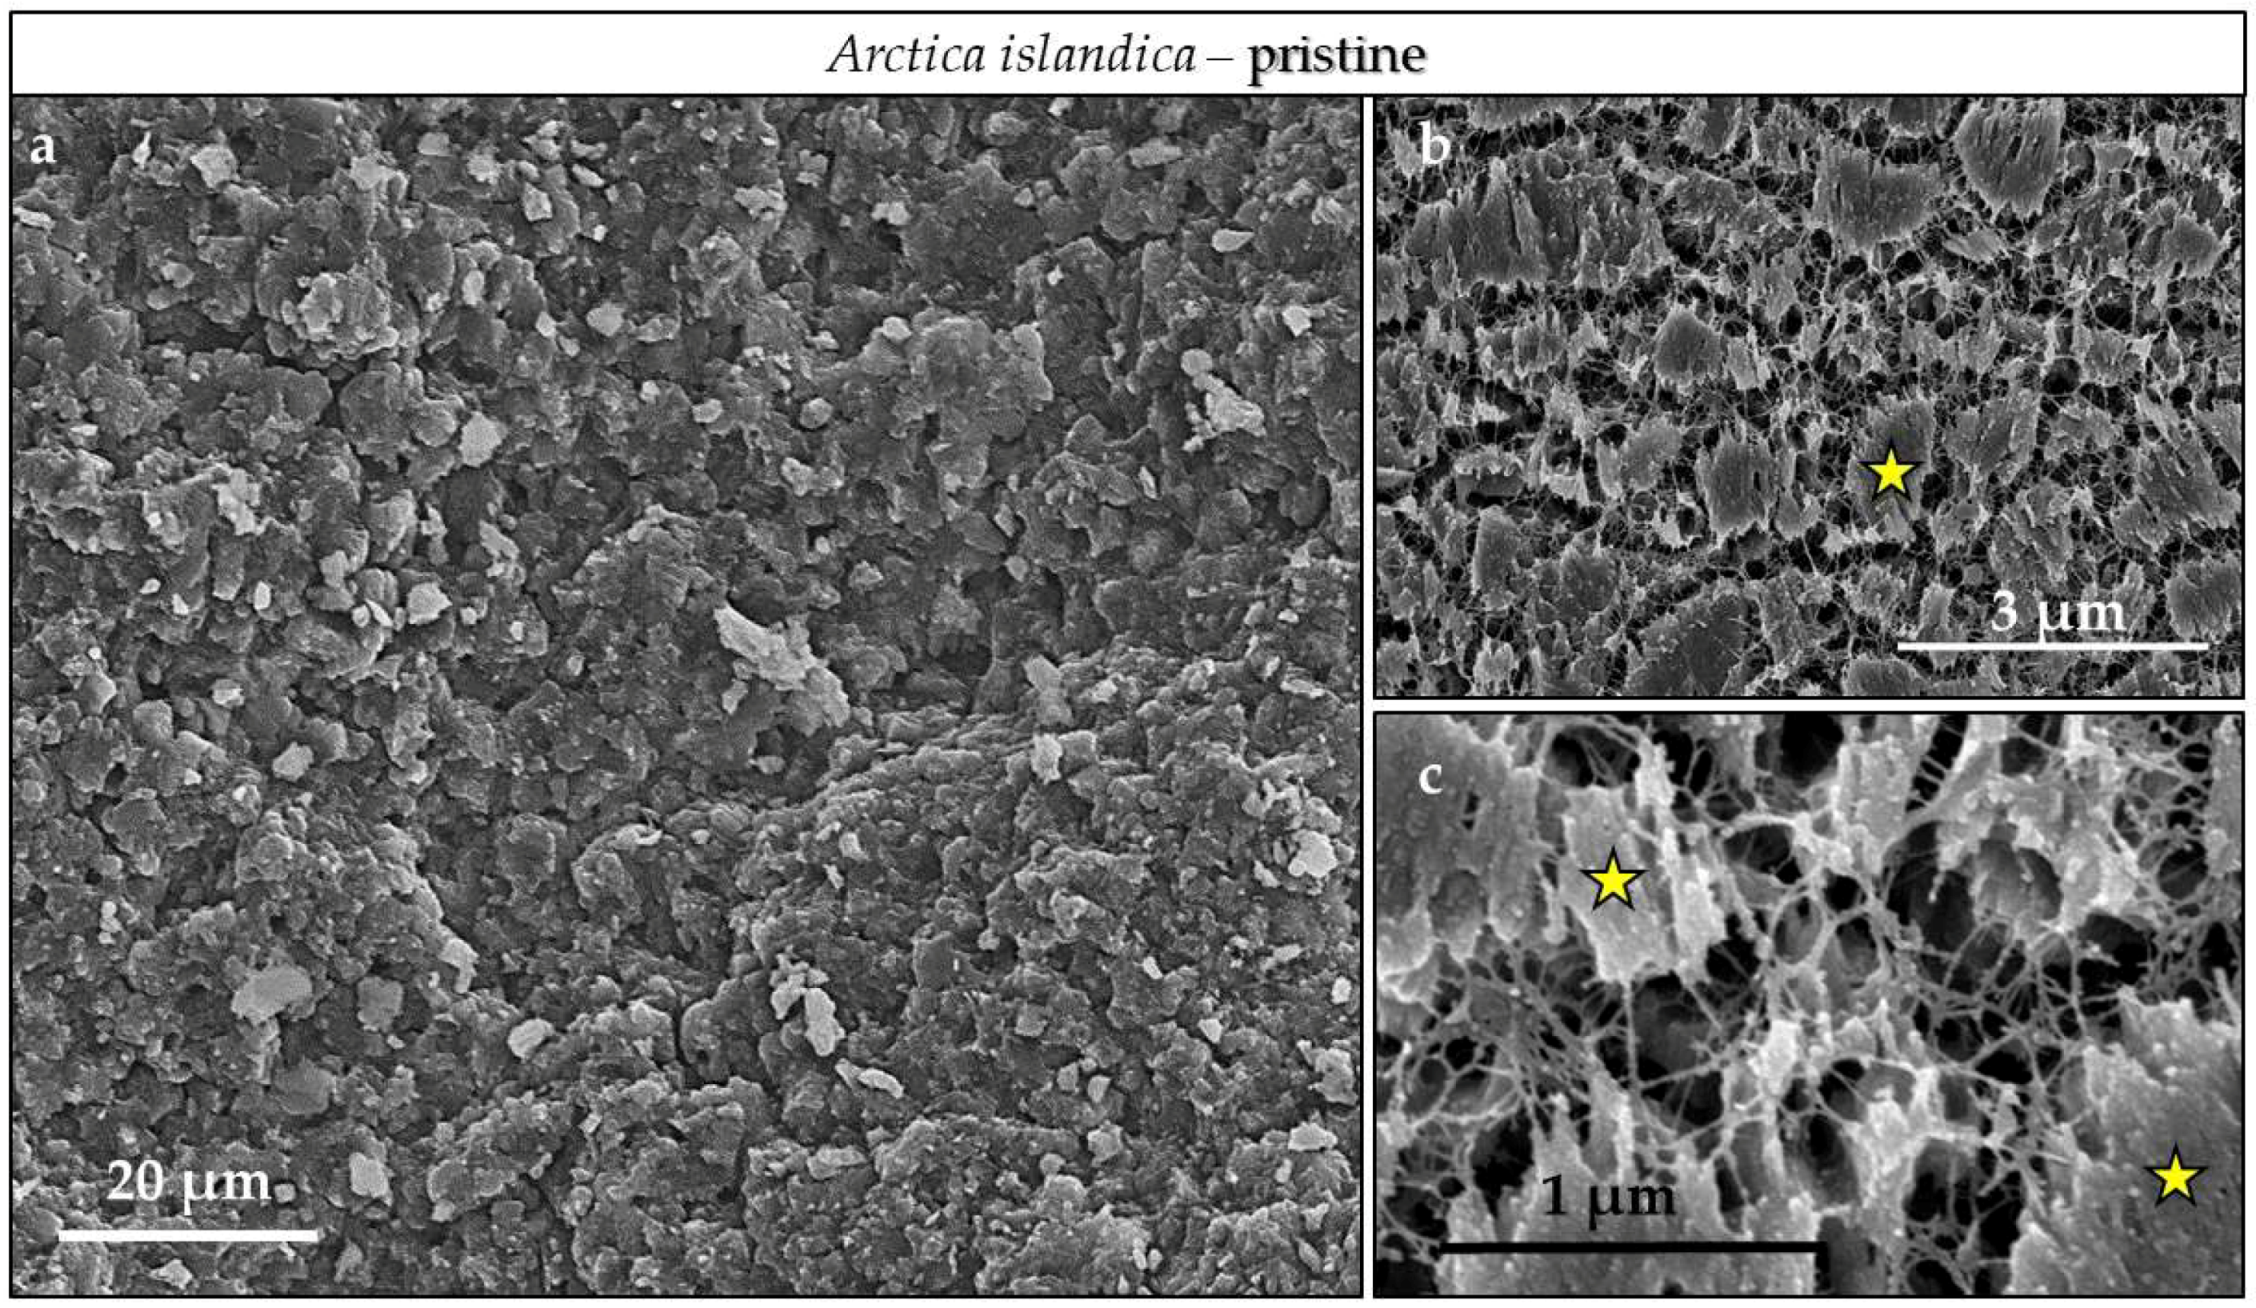
4.3.3. Arctica islandica Cross-Lamellar and Hyriopsis cumingii Nacreous Aragonite

The least conversion of bioaragonite to AP takes place in Arctica islandica cross-lamellar and Hyriopsis cumingii nacreous aragonite. In the latter we observe after 14 days of reaction less than 1 wt % of AP. In the shell of Arctica islandica, up to 7 days of conversion between 2 and 3 wt % and at 14 days of reaction only 11 wt % of AP formation, respectively (Figure 1, Table 1). As it is the case for Porites sp. and Hyriopsis cumingii prismatic aragonite, we find a slight increase in AP formation within the first 4 days of reaction for Arctica islandica aragonite as well. However, for Arctica islandica a time period follows (between 4 and 7 days) where AP formation ceases (Figure 1a). This is followed by a time span where we see a sudden increase in AP precipitation, especially along the seaward pointing rim of the shell (Figure 1a, Table 1). The shell of Arctica islandica is dense (especially shell parts next to the soft tissue of the animal) and consists of irregularly shaped mineral units that are embedded into a network of biopolymer fibrils (Figure A7 and Casella et al., 2017 [32]). The shell is crossed by growth lines, where the organic matter content is slightly increased (Figure A8). For the first 7 days of conversion treatment—where almost no AP formation occurs—most biopolymers within the shell become decomposed and, hence, the reaction fluid can permeate the entire hard tissue, not just its outer and inner surfaces. Due to decomposition of the biopolymers, there is a slight increase in mineral surface area, the amount of dissolved aragonite and that of newly formed apatite. For the final stage of alteration, we see for Arctica islandica a slight difference in AP formation kinetics between outer and inner shell layers. Along the seaward pointing shell part, conversion of bioaragonite to AP carries on (Figure 1a), while the aragonite that constitutes inward shell portions does not seem to transform further into apatite. In contrast to inner shell layers, the outer shell portion of Arctica islandica is porous (Figure A9 and Casella et al., 2017 [32]). Hence in these regions, the reaction fluid can enter the shell through the growth lines as well as through voids, the primary pores. These pores are largely absent in more inward shell parts. The latter is compact, up to 14 days of conversion there is not much space present for fluid permeation, aragonite dissolution and new AP precipitation (this study and Casella et al., 2017 [32]).
As it is well observable in Figure 1 and Table 1, Hyriopsis cumingii nacre is the most resistant biological hard tissue to aragonite dissolution and AP formation. Two facts account for this: (i) each nacre tablet is encased into a biopolymer membrane sheath (Figure A5c,d) that is obviously (ii) not affected by our conversion experiments due to: the used temperature, the chemical composition of our reaction fluid, and the time span of the experiment. Thus, the reaction fluid cannot infiltrate the shell except for the outer and inner surfaces of the shell. Hence, the tablets and their arrangement to stacks remains intact (Figure 3d). The behavior at conversion of this biogenic hard tissue resembles that of geologic aragonite most closely.

5. Conclusions

Biological hard tissues are hierarchical composites with unique microstructures. They interlink on many scales two distinct components: hard and brittle minerals with compliant biopolymers. Induced by evolutionary driven adaptation, modern skeletal microstructures and textures are highly diversified and are utilized as an additional means for the improvement of biomaterial functionality [58,59,60,61,62,63].
We discuss in this manuscript the effect of the composite nature of biocarbonate hard tissues and biogenic microstructures on the rate and kinetics of bioaragonite to apatite conversion in an open experimental set up. We deduce the following conclusions for the different biologic and non-biologic hard materials (Table 1 and Table 2, Figure A11).
  • We find highly distinct rates and kinetics of conversion to apatite for the selected aragonitic biological hard tissues. This is dependent on the ability of the reaction fluid to access aragonite crystallites, which directly relates to the content and the extent of decomposition of biopolymers within the hard tissue, the extent of the newly formed surface area and the specific biological hard tissue macro- and microstructures.
  • When treated for up to, respectively, 1 and 14 days, a profound conversion of bioaragonite to apatite within mineral units and/or structural elements takes place in the cuttlebone of the cephalopod Sepia officinalis and in the prismatic columns of the bivalve Hyriopsis cumingii.
    • Conversion of Sepia officinalis aragonite occurs almost instantly. It is highly accelerated at the beginning and slows down towards the end of the conversion process.
    • Conversion to AP in Hyriopsis cumigii prisms is steadily increasing for almost the entire time span of the experiment. However, the process stagnates for the final stages of the experiment.
  • Even though having a large surface area given by the specific macrostructure, the acicular microstructure of the warm water coral Porites sp. gives a compact hard tissue. At the start of the conversion process only outer skeletal surfaces are subject to dissolution and conversion to AP. With progressive conversion, apatite formation accelerates quickly when the fluid enters the skeleton through the centers of calcification.
  • The cross-lamellar microstructure in Arctica islandica is, at first, highly resistant to phase conversion. It speeds slightly up when the network of organic biopolymers becomes destroyed, and the reaction fluid can permeate the entire hard tissue. The presence of pores within outer shell layers facilitates fluid infiltration even further and accelerates even more the conversion process for this part of the shell.
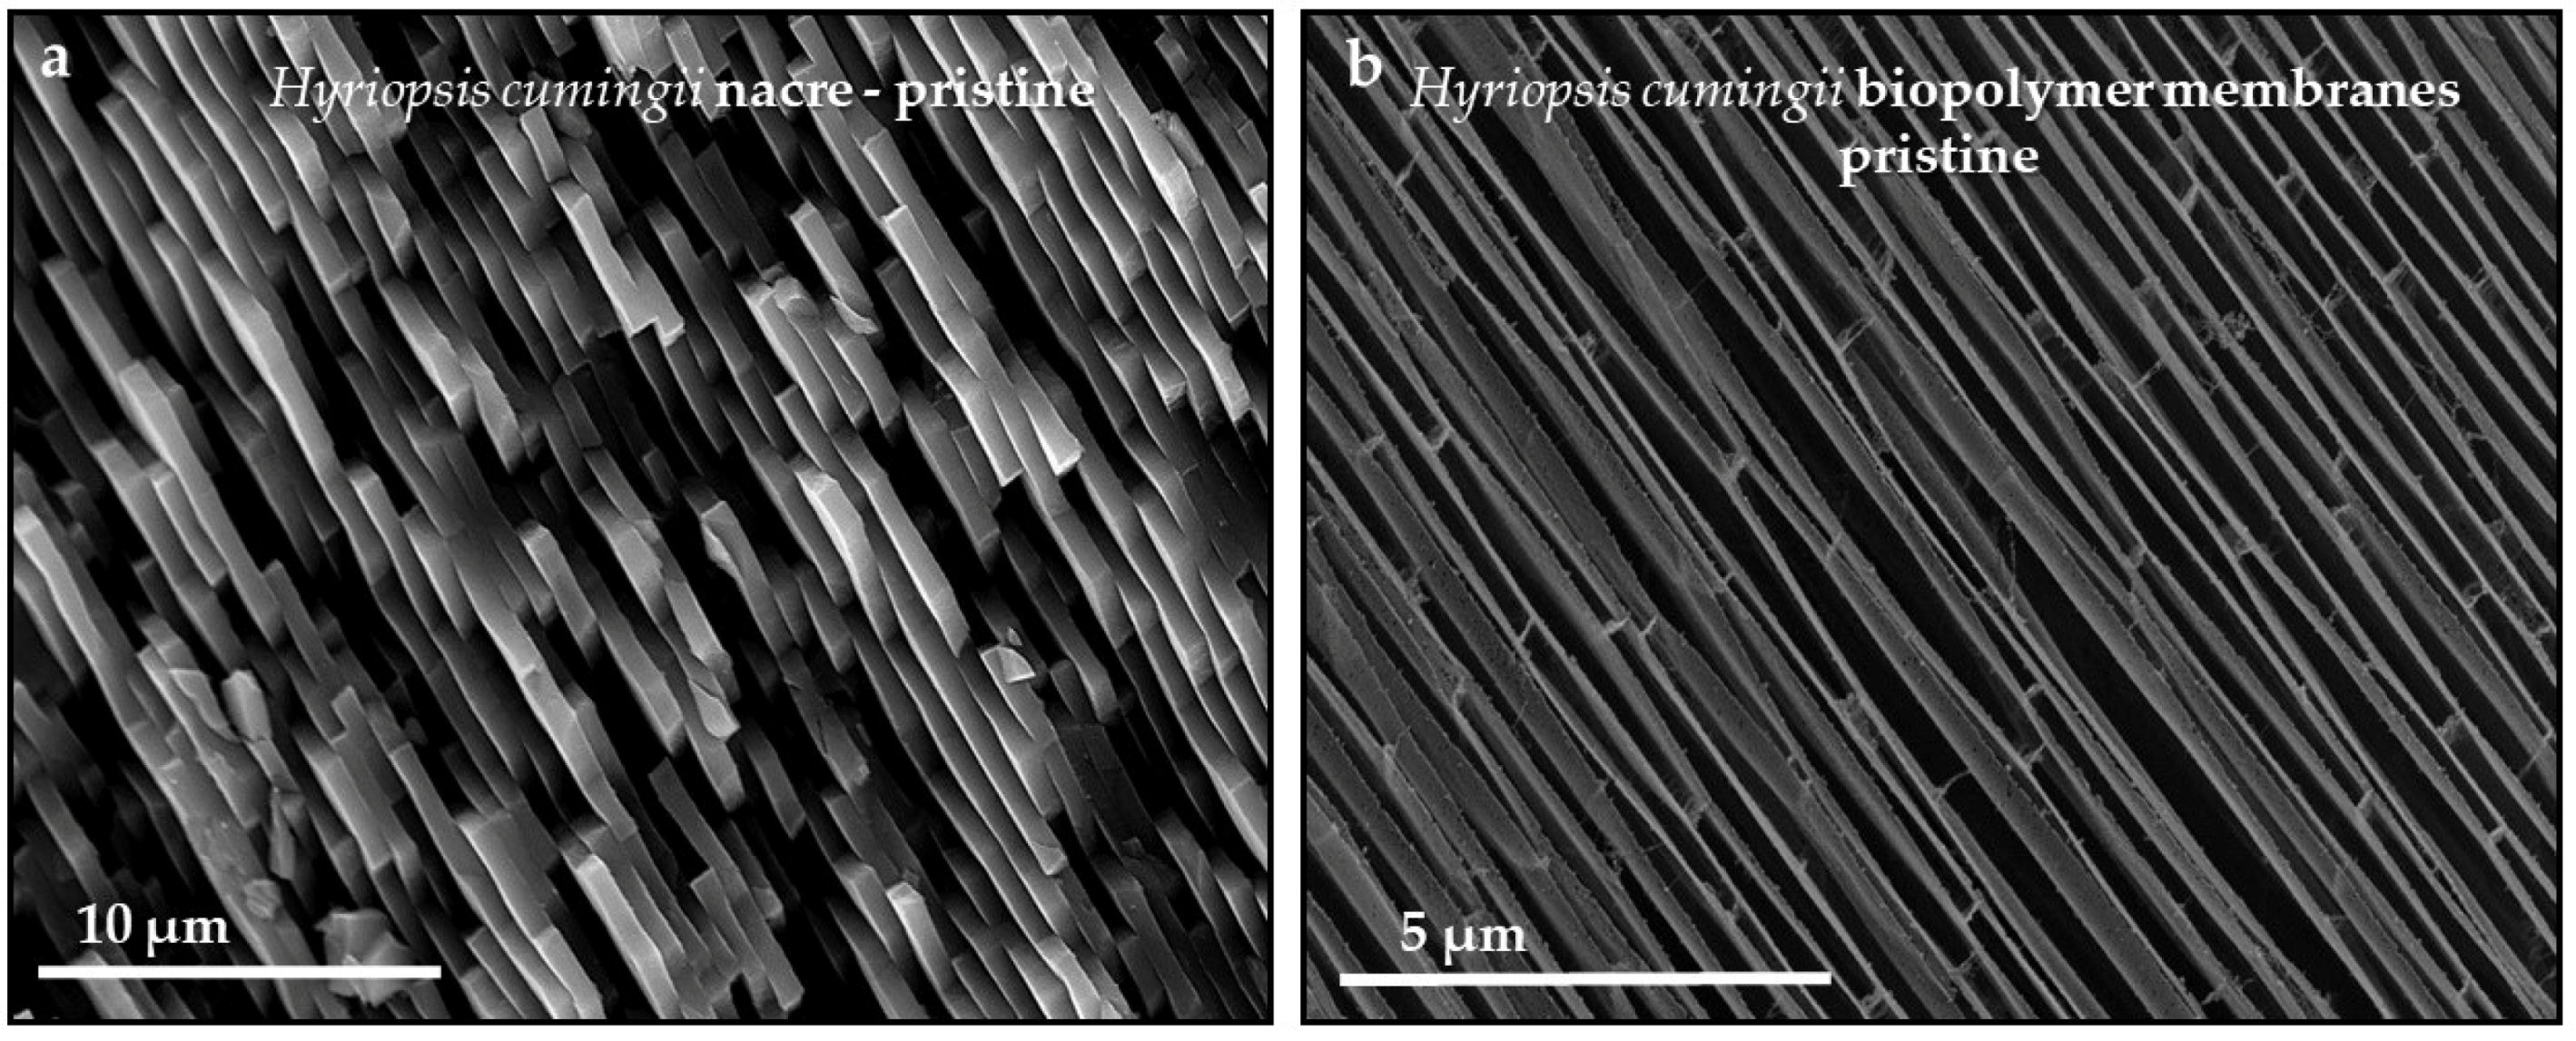
  • Nacreous aragonite in Hyriopsis cumingii is most resistant to conversion. Even though nacre tablets are encased by organic membranes, the latter are not decomposed easily, thus the aragonite of the nacreous shell layer is not attacked and remains intact.
  • All aragonite biominerals transform into AP at a much faster rate than geological aragonite. Hyriopsis cumingii nacre is the biomaterial that shows a conversion kinetics that resembles that of geologic aragonite most closely. This is consistent with the resistance to degradation of organic membranes in the former.

Supplementary Materials

The following are available online at https://www.mdpi.com/2075-163X/8/8/315/s1, X-ray diffractograms of all samples: Sepia officinalis, H. cumingii prismatic aragonite, H. cumingii nacreous aragonite, Porites sp., A. islandica inner layer, A. islandica outer layer, and Geologic aragonite.

Author Contributions

L.F.-D., S.V.-V. and M.G. conceived and designed the experiments; M.G. performed the experiments; M.G. and E.G. and M.N.Z. analyzed the data; A.Z. and X.Y. contributed to biochemical preparation, S.V.-V. contributed to the discussion. W.W.S. and S.V.-V. read the final version of the manuscript; L.F.-D., E.G. and M.G. wrote the paper.

Funding

This research was partially funded by projects CGL2016-77138-C2-1-P (MECC-Spain) and MAT2017-88148-R (MECC-Spain) (S.V.V. and L.F.-D.). M.G. is supported by the Deutsche Forschungsgemeinschaft, DFG Grant Gr 959/20-1,2.

Acknowledgments

We thank Christine Putnis for the invitation to publish our work within this Special Issue. Moreover, we want to thank the editors-in-house Jameson Chen and Jingjing Yang for handling the manuscript.

Conflicts of Interest

The authors declare no conflict of interest.

Appendix A

Figure A1. (a) Experimental setup; (b) overview of conducted conversion experiments. Sepia officinalis cuttlebone was transformed for 1 to 24 h and 2 and 3 days. Porites sp., Arctica islandica and Hyriopsis cumingii aragonite were transformed up to 14 days. Geological aragonite was transformed for 7 and 14 days. In (a): (1) Heating mantle, (2) Thermocouple, (3) Allihn condenser, (4) Sample fixed with a nylon thread.
Minerals 08 00315 g0a1
Figure A2. Exemplary Rietveld refinement plot for Porites sp. after conversion for one week. Red dots: data points, black line: calculated XRD profile, bottom blue line: difference of observed and calculated data, blue vertical bars: positions of aragonite diffraction peaks, red vertical bars: position of apatite diffraction peaks.
Minerals 08 00315 g0a2
Figure A3. XRD diffractograms (30–34° 2θ) of pristine and altered Hyriopsis cumingii nacre. Conversion was carried out for 14 days.
Minerals 08 00315 g0a3
Figure A4. FE-SEM images of geological aragonite transformed for 14 days.
Minerals 08 00315 g0a4
Figure A5. FE-SEM images of nacre tablets (a) and biopolymer sheaths (b) encasing the tablets.
Minerals 08 00315 g0a5
Figure A6. FE-SEM images of (a) aragonite crystallites and (b,c) mineral unit morphologies in pristine Arctica islandica, where mineral units are embedded into a network of biopolymer fibrils. Aragonitic mineral units are larger in size in the shell portion facing seawater relative to that part of the shell that is next to the soft tissue of the animal.
Minerals 08 00315 g0a6
Figure A7. FE-SEM images of (a) the shell microstructure of pristine Arctica islandica; (b,c) variation in size and morphology of constituting mineral units and presence of growth lines (white stars in (a,c) distinguished by an increased amount of biopolymer content.
Minerals 08 00315 g0a7
Figure A8. FE-SEM images of the portion of Arctica islandica shell that is next to seawater. This part of the shell is characterized by high porosity and larger sized mineral units compared to inner shell portions next to the soft tissue of the animal.
Minerals 08 00315 g0a8
Figure A9. FE-SEM images depicting the macro- and microstructure of the skeleton of the modern coral Porites sp. (a) Due to its specific architecture comprising many thin vertical and transverse elements, the skeleton of Porites sp. has an exceedingly high surface area This does not imply that the skeleton is porous. The microstructure of Porites sp. (this study and Casella et al., 2018) comprises a multitude of differently sized spherulites, mineral units consisting of radially arranged acicles and fibrils (b,c). These nucleate at centers of calcification (white arrows in c) and grow radially outward increasing in length until they abut the adjoining spherulite.
Minerals 08 00315 g0a9
Figure A10. FE-SEM images depicting microscale features of pristine Hyriopsis cumingii prismatic aragonite. (a) Aragonitic prisms comprise the outer shell layer adjacent to seawater, with all prisms being encased by organic membranes (d,e). Each prism consists of aragonite crystallites (b,c,f), embedded in an irregular network of thin biopolymer fibrils (e,f).
Minerals 08 00315 g0a10
Figure A11. FE-SEM images visualizing the macro-, micro- and nanostructure of pristine Sepia officinalis cuttlebone. (a) The cuttlebone is a lightweight structure comprising horizontal platforms and vertical walls, this arrangement of structural elements renders stability but also induces the formation of compartments; (b) the vertical walls (see view from above) are stabilized from implosion by vertical stop ridges consisting of thick biopolymer membranes (see (a)). Both, the walls and ridges consist of nanoparticulate aragonite (d,e). The platforms comprise arrays of aragonite rods (f), with the stacks of rods showing a well-defined twisted arrangement (white and yellow stars in (c)).
Minerals 08 00315 g0a11
Figure A12. FE-SEM images of arrays of aragonite rods (white stars in (a,b)) within pristine Sepia officinalis cuttlebone platforms. Each rod is a composite of a biopolymer matrix (or scaffold, yellow arrows in (b)) filled with aragonitic mineral.
Minerals 08 00315 g0a12
Figure A13. FE-SEM images of biopolymers occluded within the cuttlebone of pristine Sepia officinalis. Thick membranes line the walls and platforms (white stars in (a,b)). A network of biopolymer films is occluded within the major structural elements of the cuttlebone, e.g., in a wall (b). An accumulation of aragonite nanoparticles constituting the skeleton appear encircled in (b).
Minerals 08 00315 g0a13
Figure A14. FE-SEM images of biopolymer membranes (white stars in (a,b)), biopolymer networks (yellow arrows in (b)) and biopolymer foams containing nanoparticulate aragonite (yellow stars in (a)) in the cuttlebone of pristine Sepia officinalis.
Minerals 08 00315 g0a14
Figure A15. FE-SEM images of demineralized Sepia officinalis cuttlebone showing the organic component within the skeleton that encases aragonite crystallites and individual mineral units, e.g., aragonite rods, stacks of rods. The differently colored stars in (a) point to the different layers of a platform; see also Figure A11d. The black star in (a) indicates the presence of the thick biopolymer membrane that lines all outer surfaces of all structural elements within the cuttlebone; (b) Organic content within a platform shown with a slightly higher magnification, relative to that given in (a).
Minerals 08 00315 g0a15
Figure A16. FE-SEM images of the biopolymer network that is occluded within the walls of the cuttlebone of Sepia officinalis. Yellow stars in (a,b) point to the protruding biopolymer membranes that line all outer surfaces of all structural elements within the cuttlebone.
Minerals 08 00315 g0a16
Figure A17. FE-SEM images of etched sample surfaces showing in top view; (a,b) the assemblage of prisms with occluded biopolymer membranes (white arrows in (a), white stars in (b,c) between them. Well visible is the porous nature of the membranes (b,c). Well visible is the internal structuring of prisms (e.g., (a)). Yellow arrows in (a) point to roundish mineral grains that are slightly misoriented to each other.
Minerals 08 00315 g0a17

References

  1. Habraken, W.; Habibovic, P. Calcium phosphates in biomedical applications: Materials for the future? Materialstoday 2016, 19, 69–87. [Google Scholar] [CrossRef]
  2. Bohner, M. Resorbable biomaterials as bone graft substitutes. Materialstoday 2010, 13, 24–30. [Google Scholar] [CrossRef]
  3. Bohner, M. Design of ceramic-based cements and putties for bone graft substitution. Eur. Cells Mater. 2010, 20, 1–12. [Google Scholar] [CrossRef]
  4. Zhang, X.; Vecchio, K.S. Conversion of natural marine skeletons as scaffolds for bone tissue engineering. Front. Mater. Sci. 2013, 7, 103–117. [Google Scholar] [CrossRef]
  5. Clarke, S.A.; Choi, S.Y. Osteogenic cell response to 3-D hydroxyapatite scaffolds developed via replication of natural marine sponges. J. Mater. Sci. Mater. Med. 2017, 27, 1–11. [Google Scholar] [CrossRef] [PubMed] [Green Version]
  6. Rousseau, M. Nacre: A biomineral, a natural biomaterial, and a source of bio-inspiration. In Highlights in Applied Mineralogy; Heuss-Aßbichler, S., Amthauer, G., John, M., Eds.; De Gruyter: Berlin, Germany; Boston, MA, USA, 2018; pp. 285–300. ISBN 978-3-11-049734-2. [Google Scholar]
  7. Roy, D.M.; Linnehan, S.K. Hydroxyapatite formed from Coral Skeletal Carbonate by Hydrothermal Exchange. Nature 1974, 247, 220–222. [Google Scholar] [CrossRef] [PubMed]
  8. White, R.A.; Weber, J.N. Replamineform: A new process for preparing porous ceramic, metal, and polymer prosthetic materials. Science 1972, 176, 992–994. [Google Scholar] [CrossRef]
  9. Silve, C.; Lopez, E. Nacre initiates biomineralization by human osteoblasts maintained in vitro. Calcif. Tissue Int. 1992, 51, 363–369. [Google Scholar] [CrossRef] [PubMed]
  10. Berland, S.; Delattre, O. Nacre/bone interface changes in durable nacre endosseous implants in sheep. Biomaterials 2005, 26, 2767–2773. [Google Scholar] [CrossRef] [PubMed]
  11. Westbroek, M.; Marin, F. A marriage of bone and nacre. Nature 1998, 392, 861–862. [Google Scholar] [CrossRef] [PubMed]
  12. Fu, K.; Xu, Q. Characterization of a biodegradable coralline hydroxyapatite/calcium carbonate composite and its clinical implementation. Biomed. Mater. 2013, 8, 065007. [Google Scholar] [CrossRef] [PubMed]
  13. Green, D.W.; Ben-Nissan, B. Natural and Synthetic Coral Biomineralization for Human Bone Revitalization. Trends Biotechnol. 2017, 35, 43–54. [Google Scholar] [CrossRef] [PubMed]
  14. Pountos, I.; Giannoudis, P.V. Is there a role of coral bone substitutes in bone repair? Injury 2016, 47, 2606–2613. [Google Scholar] [CrossRef] [PubMed] [Green Version]
  15. Zhang, G.; Brion, A. Nacre, a natural, multi-use, and timely biomaterial for bone graft substitution. J. Biomed. Mater. Res. Part A 2017, 105, 662–671. [Google Scholar] [CrossRef] [PubMed]
  16. Reinares-Fisac, D.; Veintemillas-Verdaguer, S. Conversion of biogenic aragonite into hydroxyapatite scaffolds in boiling solutions. CrystEngComm 2017, 19, 110–116. [Google Scholar] [CrossRef]
  17. Rodríguez-Carvajal, J.; Roisnel, T. Line broadening analysis using fullprof*: Determination of microstructural properties. Mater. Sci. Forum 2004, 443–444, 123–126. [Google Scholar] [CrossRef]
  18. Jarosch, D.; Heger, G. Neutron diffraction refinement of the crystal structure of aragonite. Tschermaks Mineral. Petrogr. Mitt. 1986, 35, 127–131. [Google Scholar] [CrossRef]
  19. Kay, M.I.; Young, R.A. Crystal structure of hydroxyapatite. Nature 1964, 204, 1050–1052. [Google Scholar] [CrossRef] [PubMed]
  20. Dinnebier, R.E.; Billinge, S.J.L. Powder Diffraction: Theory and Practice; Royal Society of Chemistry: Cambridge, UK, 2008; pp. 300–303. ISBN 978-0-85404-231-9. [Google Scholar]
  21. Thompson, P.; Cox, D.E. Rietveld refinement of Debye-Scherrer synchrotron X-ray data from Al2O3. J. Appl. Crystallogr. 1987, 20, 79–83. [Google Scholar] [CrossRef]
  22. Kasioptas, A.; Geisler, T. Crystal growth of apatite by replacement of an aragonite precursor. J. Cryst. Growth 2010, 312, 2431–2440. [Google Scholar] [CrossRef]
  23. Kannan, S.; Rocha, J.H.G. Fluorine-substituted hydroxyapatite scaffolds hydrothermally grown from aragonitic cuttlefish bones. Acta Biomater. 2007, 3, 243–249. [Google Scholar] [CrossRef] [PubMed]
  24. Meejoo, S.; Maneeprakorn, W. Phase and thermal stability of nanocrystalline hydroxyapatite prepared via microwave heating. Thermochim. Acta 2006, 447, 115–120. [Google Scholar] [CrossRef]
  25. Destainville, A.; Champion, E. Synthesis, characterization and thermal behavior of apatitic tricalcium phosphate. Mater. Chem. Phys. 2003, 80, 269–277. [Google Scholar] [CrossRef]
  26. Raynaud, S.; Champion, E. Calcium phosphate apatites with variable ca/p atomic ratio i. Synthesis, characterisation and thermal stability of powders. Biomaterials 2002, 23, 1065–1072. [Google Scholar] [CrossRef]
  27. Han, J.-K.; Song, H.-Y. Synthesis of high purity nano-sized hydroxyapatite powder by microwave-hydrothermal method. Mater. Chem. Phys. 2006, 99, 235–239. [Google Scholar] [CrossRef]
  28. Ratner, B.; Hoffman, A. Biomaterials Science. An Introduction to Materials in Medicine, 3rd ed.; Academic Press: Cambridge, MA, USA, 2004; ISBN 978-0123746269. [Google Scholar]
  29. González-Díaz, P.F.; Hidalgo, A. Infrared spectra of calcium apatites. Spectrochim. Acta A 1976, 32, 631–635. [Google Scholar] [CrossRef] [Green Version]
  30. González-Díaz, P.F.; Santos, M. On the hydroxyl ions in apatites. J. Solid State Chem. 1977, 22, 193–199. [Google Scholar] [CrossRef] [Green Version]
  31. Vandecandelaere, N.; Rey, C. Biomimetic apatite-based biomaterials: On the critical impact of synthesis and post-synthesis parameters. J. Mater. Sci. Mater. Med. 2012, 23, 2593–2606. [Google Scholar] [CrossRef] [PubMed] [Green Version]
  32. Casella, L.A.; Griesshaber, E. Experimental diagenesis: Insights into aragonite to calcite conversion Arctica islandica shells by hydrothermal treatment. Biogeosciences 2017, 14, 1461–1492. [Google Scholar] [CrossRef]
  33. Kasioptas, A.; Geisler, T. Polycrystalline apatite synthesized by hydrothermal replacement of calcium carbonate. Geochim. Cosmochim. Acta 2011, 75, 3486–3500. [Google Scholar] [CrossRef]
  34. Schlosser, M.; Fröls, S. Combined hydrothermal conversion and vapor transport sintering of ag-modified calcium phosphate scaffolds. J. Am. Ceram. Soc. 2012, 96, 412–419. [Google Scholar] [CrossRef]
  35. Putnis, A. Mineral replacement reactions: From macroscopic observations to microscopic mechanisms. Mineral. Mag. 2002, 66, 689–708. [Google Scholar] [CrossRef]
  36. Putnis, A. Mineral replacement reactions. Rev Mineral Geochem 2009, 70, 87–124. [Google Scholar] [CrossRef]
  37. Putnis, A.; Putnis, C.V. The mechanism of reequilibration of solids in the presence of a fluid phase. J. Solid State Chem. 2007, 180, 1783–1786. [Google Scholar] [CrossRef]
  38. Ruiz-Agudo, E.; Putnis, C.V. Coupled dissolution and precipitation at mineral–fluid interfaces. Chem. Geol. 2014, 383, 132–146. [Google Scholar] [CrossRef]
  39. Putnis, C.V.; Fernandez-Díaz, L. Ion partitioning and element mobilization during mineral replacement reactions in natural and experimental systems. In Ion Partitioning in Ambient-Temperature Aqueous Systems; Prieto, M., Stoll, H., Eds.; Mineralogical Society of Great Britain & Ireland: London, UK, 2011; ISBN 978-0-903-05626-7. [Google Scholar]
  40. Pollok, K.; Putnis, C.V. Mineral replacement reactions in solid solution-aqueous solution systems: Volume changes, reactions paths and end-points using the example of model salt systems. Am. J. Sci. 2011, 311, 211–236. [Google Scholar] [CrossRef]
  41. Putnis, A. Transient porosity resulting from fluid–mineral interaction and its consequences. Rev. Mineral. Geochem. 2015, 80, 1–23. [Google Scholar] [CrossRef]
  42. Fernández-Díaz, L.; Pina, C.M. The carbonatation of gypsum: Pathways and pseudomorph formation. Am. Mineral. 2009, 94, 1223–1234. [Google Scholar] [CrossRef]
  43. Xia, F.; Brugger, J. Mechanism and kinetics of pseudomorphic mineral replacement reactions: A case study of the replacement of pentlandite by violarite. Geochim. Cosmochim. Acta 2009, 73, 1945–1969. [Google Scholar] [CrossRef]
  44. Xia, F.; Brugger, J. Three-dimensional ordered arrays of zeolite nanocrystals with uniform size and orientation by a pseudomorphic coupled dissolution-reprecipitation replacement route. Cryst. Growth Des. 2009, 9, 4902–4906. [Google Scholar] [CrossRef]
  45. Eysel, W.; Roy, D.M. Topotactic reaction of aragonite to hydroxyapatite. Z. Kristallogr. Cryst. Mater. 1975, 141, 11–24. [Google Scholar] [CrossRef]
  46. Roncal-Herrero, T.; Astilleros, J.M. Reaction pathways and textural aspects of the replacement of anhydrite by calcite at 25 °C. Am. Mineral. 2017, 102, 1270–1278. [Google Scholar] [CrossRef] [Green Version]
  47. Cuesta Mayorga, I.; Astilleros, J.M. Epitactic Overgrowths of Calcite (CaCO3) on Anhydrite (CaSO4) Cleavage Surfaces. Cryst. Growth Des. 2018, 18, 1666–1675. [Google Scholar] [CrossRef]
  48. Baig, A.A.; Fox, R.A. Relationships among Carbonated Apatite Solubility, Crystallite Size, and Microstrain Parameters. Calcif. Tissue Int. 1999, 64, 437–449. [Google Scholar] [CrossRef] [PubMed]
  49. Ortoleva, P. Solute reaction mediated precipitate patterns in cross gradient free systems. Z. Phys. B 1982, 49, 149–156. [Google Scholar] [CrossRef]
  50. Levi-Kalisman, Y.; Fallini, G. Structure of the nacreous organic matrix of a bivalve mollusk shell examined in the hydrated state using cryo-TEM. J. Struct. Biol. 2001, 135, 8–17. [Google Scholar] [CrossRef] [PubMed]
  51. Heinemann, F.; Launspach, M. Gastropod nacre: Structure, properties and growth-biological, chemical and physical basics. Biophys. Chem. 2011, 153, 126–1253. [Google Scholar] [CrossRef] [PubMed]
  52. Checa, A.G.; Marcías-Sánchez, E. Organic membranes determine the pattern of the columnar prismatic layer of mollusk shells. Proc. R. Soc. B 2016, 283, 20160032. [Google Scholar] [CrossRef] [PubMed]
  53. Gaspard, M.; Guichard, N. Shell matrices of recent rhynchonelliform brachiopods: Microstructures and glycosylation studies. Trans. R. Soc. Edinb. 2008, 98, 415–424. [Google Scholar] [CrossRef]
  54. Avrami, M. Kinetics of Phase change. I General Theory. J. Chem. Phys. 1939, 7, 1103–1112. [Google Scholar] [CrossRef]
  55. Avrami, M. Kinetics of Phase change. II Transformation-Time Relations for Random Distribution of Nuclei. J. Chem. Phys. 1940, 8, 212–224. [Google Scholar] [CrossRef]
  56. Avrami, M. Granulation, Phase Change, and Microstructure Kinetics of Phase Change. III. J. Chem. Phys. 1941, 9, 177–184. [Google Scholar] [CrossRef]
  57. Casella, L.A.; He, S. Assessment of hydrothermal alteration on micro- and nanostructures of biocarbonates: Quantitative statistical grain-area analysis of diagenetic overprint. Biogeosciences 2018. [Google Scholar] [CrossRef]
  58. Checa, A. Physical and Biological Determinants of the Fabrication of Molluscan Shell Microstructures. Front. Mar. Sci. (accepted).
  59. Genin, G.M.; Kent, A. Functional grading of mineral and collagen in the attachment of tendon to bone. Biophys. J. 2009, 97, 976–985. [Google Scholar] [CrossRef] [PubMed]
  60. Seidl, B.H.M.; Reisecker, C. Calcite distribution and orientation in the tergite exocuticle of the isopods Porcellio scaber and Armadillidium vulgare (Oniscidea, Crustacea)—A combined FE-SEM, polarized SCμ-RSI and EBSD study. Z. Kristallogr. 2012, 227, 777–792. [Google Scholar] [CrossRef]
  61. Huber, J.; Fabritius, H.O. Function-related adaptations of ultrastructure, mineral phase distribution and mechanical properties in the incisive cuticle of mandibles of Porcellio scaber Latreille, 1804. J. Struct. Biol. 2014, 188, 1–15. [Google Scholar] [CrossRef] [PubMed]
  62. Huber, J.; Griesshaber, E. Functionalization of biomineral reinforcement in crustacean cuticle: Calcite orientation in the partes incisivae of the mandibles of Porcellio scaber and the supralittoral species Tylos europaeus (Oniscidea, Isopoda). J. Struct. Biol. 2015, 190, 173–191. [Google Scholar] [CrossRef] [PubMed]
  63. Griesshaber, E.; Yin, X. Patterns of mineral organization in carbonate biological hard materials. In Highlights in Applied Mineralogy; Heuss-Aßbichler, S., Amthauer, G., John, M., Eds.; De Gruyter: Berlin, Germany; Boston, MA, USA, 2018; p. 344. ISBN 978-3-11-049734-2. [Google Scholar]
Figure 1. Newly formed apatite content of all samples relative to conversion time according to Rietveld analyses of the XRD measurements (a) 14 days H. cumingii nacre (brown line) and prismatic aragonite layer (black line), A. islandica outer (green line) and inner layer (blue line), geologic aragonite (violet data points) and Porites sp. (red line); (b) Sepia officinalis, conversion time 1–24 h. Error for H. cumingii nacre and Sepia officinalis is within the size of the corresponding data points.
Minerals 08 00315 g001
Figure 2. Infrared-spectra (450–1600 cm−1 and 3000–3800 cm−1) for Sepia officinalis cuttlebone transformed for 24 h together with IR-spectra for Porites sp. coral aragonite, H. cumingii prismatic aragonite, A. islandica outer and inner shell layer aragonite and H. cumingii nacreous aragonite. Spectra are arranged according to AP content (wt %) determined with XRD and Rietveld analyses. AP content increases from bottom to top spectra.
Minerals 08 00315 g002
Figure 3. FE-SEM images of Hyriopsis cumingii nacre after (a,b) 4 days of conversion and (c) 14 days of conversion. Very little conversion to AP has taken place, the original arrangement of nacre tablets is well preserved (c). Even though, slight dissolution of aragonite induced that the surface of the nacreous shell layer became encrusted with a thin layer of newly formed AP crystals (a,b).
Minerals 08 00315 g003
Figure 4. FE-SEM images of aragonite crystallite morphology and assembly after (a) 4 and (b) 14 days of conversion. We do not observe any major changes in crystallite morphology and size relative to that present in the pristine shell (compare Figure 4 to Figure A6a).
Minerals 08 00315 g004
Figure 5. FE-SEM images depicting the coral skeleton Porites sp. after (a) 4 and (b) 14 days of conversion. Newly formed AP crystals cover the surface of the hard tissue already at 4 days of conversion. The compactness of the AP cover increases significantly with conversion time. SEM images shown in (b,d) depict AP crystal morphologies that form with different conversion times.
Minerals 08 00315 g005
Figure 6. FE-SEM images showing Hyriopsis cumingii aragonite prisms altered for (a) 4 and (bd) 14 days. Overall prism morphology does not change with alteration time. A layer of newly formed AP crystals covers the surface of the prisms already at 4 days of conversion. It increases in denseness with conversion time. Crystal morphologies in (d) clearly show that the aragonite within the prisms becomes converted to apatite at 14 days of alteration.
Minerals 08 00315 g006
Figure 7. FE-SEM images showing Sepia officinalis cuttlebone altered for (a) 1 h and (bd) 5 h. Even as early as 1 h of alteration of the cuttlebone, aragonite within skeletal elements starts to be converted to AP (white arrows in (a)), in addition to some newly formed crystals (black arrows in (a)) that precipitate onto skeletal element surfaces. At 5 h of conversion of aragonite to AP, AP formation within skeletal elements proceeds rapidly further (white arrows in (d)). In addition, newly formed AP starts to cover the surface of skeletal elements (white arrows in (c). Yellow stars in (d) point to the biopolymer lining that covers the surface of a skeletal element, in this case, a wall.
Minerals 08 00315 g007
Figure 8. (ad) FE-SEM images of Sepia officinalis cuttlebone after 24 h of conversion. Outer surfaces of skeletal elements (e.g., a chamber (a)) within the skeleton are covered with AP crystals. These become dense (white star in (d)), often fuse (white arrows in b,c) and finally encase the outer surface of the skeletal element (white star in (a)), conserving its outer morphology.
Minerals 08 00315 g008
Figure 9. FE-SEM images showing the change in AP crystal morphology with progressive conversion of Sepia officinalis cuttlebone aragonite. (a) Conversion for 1 h; (b,c) conversion for 5 h and fusion of individual crystals; (d) fusion of some AP crystals and densification of the AP cover.
Minerals 08 00315 g009
Figure 10. (ad) FE-SEM images showing the Sepia officinalis cuttlebone ultrastucture when altered for 3 days. The original ultrastructure (yellow stars in (a)) is highly ruptured up to complete distortion (white star in (a)). Biopolymer membranes lining the chambers are not entirely decomposed yet (yellow arrows in (d)): However, they become detached from the surface of the skeletal element.
Minerals 08 00315 g010
Table 1. Samples used for conversion experiments, experiment time periods and apatite contents obtained for specific conversion times.
AP Content (wt %) after 4 DaysAP Content (wt %) after 7 DaysAP Content (wt %) after 9 DaysAP Content (wt %) after 14 Days
Porites sp.12.0(4)13.8(3)12.7(3)38(1)
Hyriopsis cumingii (nacre)< 1< 1< 1< 1
Hyriopsis cumingii (prismatic aragonite)7.2(4)16.4(8)24.8(9)25.8(9)
Arctica islandica (shell layer next to seawater)1.92.19.5(4)17.6(5)
Arctica islandica (shell layer next to soft tissue)2.52.49.6(7)11.4(4)
geologic aragonite (single crystal)not determined1.4not determined3.1
AP Content (wt %) after 1 HourAP Content (wt %) after 3 HoursAP Content (wt %) after 5 HoursAP Content (wt %) after 8 HoursAP Content (wt %) after 24 Hours
Sepia officinalis29.9(7)58.2(8)64.4(7)74.5(8)99(1)
Table 2. Pattern of conversion for the investigated biogenic microstructures and for non-biological aragonite at different conversion times.
0–4 Days4–7 Days7–9 Days9–14 Days
Acicular aragonite
Porites sp.
very strong increaseno changeno changevery strong increase
Prismatic aragonite
H. cumingii
strong increasevery strong increasevery strong increaseno change
Cross-lamellar aragonite
A. islandica
outer layer
slight increaseno changevery strong increasestrong increase
Cross-lamellar aragonite
A. islandica
inner layer
slight increaseno changevery strong increaseno change
Nacreous aragonite
H. cumingii
no changeno changeno changeno change
Geologic aragonite single crystal-no change-slight increase
0–1 Hour1–3 Hours3–5 Hours5–8 Hours8–24 Hours
Granular aragonite
Sepia officinalis
very strong increasevery strong increaseslight increasestrong increasevery strong increase

