Integrating the Theory of Sampling into Underground Mine Grade Control Strategies
by
 , , , ,
Simon C. Dominy
1,2,* ,
,
Hylke J. Glass
1,
Louisa O’Connor
2,
Chloe K. Lam
1,
Saranchimeg Purevgerel
3 and
Richard C.A. Minnitt
4 1
Minerals Engineering Research Group, Camborne School of Mines, University of Exeter, Penryn, Cornwall TR10 9FE, UK
2
Department of Mining and Metallurgical Engineering, Western Australian School of Mines, Curtin University, Bentley, WA 6102, Australia
3
Department of Mineral and Energy Economics, Western Australian School of Mines, Curtin University, Murray Street, Perth, WA 6000, Australia
4
School of Mining Engineering, University of the Witwatersrand, Johannesburg 2050, South Africa
*
Author to whom correspondence should be addressed.
Minerals 2018, 8(6), 232; https://doi.org/10.3390/min8060232
Submission received: 7 May 2018
/
Revised: 24 May 2018
/
Accepted: 25 May 2018
/
Published: 29 May 2018
(This article belongs to the Special Issue Sampling Across the Mine Value Chain)
Abstract
:Grade control in underground mines aims to deliver quality tonnes to the process plant via the accurate definition of ore and waste. It comprises a decision-making process including data collection and interpretation; local estimation; development and mining supervision; ore and waste destination tracking; and stockpile management. The foundation of any grade control programme is that of high-quality samples collected in a geological context. The requirement for quality samples has long been recognised, where they should be representative and fit-for-purpose. Once a sampling error is introduced, it propagates through all subsequent processes contributing to data uncertainty, which leads to poor decisions and financial loss. Proper application of the Theory of Sampling reduces errors during sample collection, preparation, and assaying. To achieve quality, sampling techniques must minimise delimitation, extraction, and preparation errors. Underground sampling methods include linear (chip and channel), grab (broken rock), and drill-based samples. Grade control staff should be well-trained and motivated, and operating staff should understand the critical need for grade control. Sampling must always be undertaken with a strong focus on safety and alternatives sought if the risk to humans is high. A quality control/quality assurance programme must be implemented, particularly when samples contribute to a reserve estimate. This paper assesses grade control sampling with emphasis on underground gold operations and presents recommendations for optimal practice through the application of the Theory of Sampling.
1. Introduction
1.1. Overview
Sampling is a critical component throughout the mine value chain; it includes the sampling of both in-situ and broken material for geological (resource and grade control), geoenvironmental, and geometallurgical purposes [1,2,3,4,5,6,7]. Sampling errors generate both monetary and intangible losses [3,8]. The data produced must be fit-for-purpose in order to contribute to Mineral Resources/Ore Reserves reported in accordance with the 2012 Joint Ore Reserves Committee (JORC) [9] or other codes. Quality assurance/quality control (QAQC) is critical to maintain data integrity through documented procedures, sample security, and monitoring of precision, accuracy and contamination. Samples and their associated assays are key inputs into important decisions throughout the mine value chain.
The Theory of Sampling (TOS) defines sampling errors, where actions may lead to uncertainty and create a total measurement error [1,10]. Theory of Sampling attempts to break down this error into a series of contributions along the sampling value chain (e.g., the planning to assay-measurement process) (Table 1).
Errors are generally additive throughout the sampling value chain and generate both monetary and intangible losses. The aim is to collect representative samples to accurately describe the material in question. Sample collection is followed by reduction in both mass and fragment size to provide a sub-sample for assay. An assay is the quantitative measurement of the concentration (e.g., mass fraction such as g/t gold) of a metal by a given methodology, for example a 30 g fire assay followed by measurement of gold using an instrumental method (e.g., inductively coupled plasma spectroscopy).
1.2. Grade Control Paradigm
Underground mines focus on the maximisation of ore and minimisation of waste recovery. The traditional role of grade control samples relates to: development ore/waste decisions, investigation of ore limits and grade deportment within (for example) vein versus wall rocks, identification of grade trends and/or local continuity along development or in stopes, and local estimation and input into the short- to medium-term mine plan.
The process of grade control broadly comprises: data collection, integration and interpretation, supervision of development and mining, local estimation and input into stope design, stockpile and mill feed management, and leading ultimately to reconciliation. In many cases, grade control samples constitute just-in-time samples as the assay results should be returned within 24 h or less to allow ore/waste decisions to be made. Where samples feed into ore/waste decisions, the risks of potential economic impact must be understood. It may be the case that the results are biased and that time would be better spent on detailed geological mapping and/or more drilling. In other cases, the decisions based on grade control samples are not critical. Once a face or stockpile sample is collected, the operation has already spent money and committed to develop infrastructure and development.
1.3. Sampling for Grade Control
Underground grade control sampling methods have remained the same for many years [11,12], though sample preparation and assaying techniques have improved greatly. Methods are dominated by hand-collected chip and channel in-situ samples and grab broken-rock samples. In many mines, diamond core drilling and/or reverse circulation (RC) drilling has become important in the grade control process. A best practice grade control programme will provide information on grade and its relationship to geology (Figure 1).
Grade control samples such as chip or channel samples are relatively cheap to collect, and apart from the effort involved, easy to take. The potentially large numbers of samples used in estimation smooth out individual assay variability. However, the consequence is that the sampling distributions drawn from these data may show large numbers of low grade assays, positive disjointed tails, and high skewness. This makes the estimation process more challenging and generally indicates that the samples are not representative.
1.4. Mineralisation Characteristics
Gold deposits often pose challenges during sampling because of their apparently erratic grade distribution. Consideration should be given to the nature of the ore with respect to in-situ gold particle sizing and distribution; the partition of gold between sulphide-locked and free categories; geological versus assay cut-offs; and stringers/disseminations that require sampling beyond vein margins. Coarse gold-bearing mineralisation is generally characterised by a high geological or in-situ nugget effect and prone to high sampling nugget effect if sampling activities are not optimised [13,14]. Gold particles greater than 100 µm in size are generally considered to be coarse, where very coarse gold is greater than 2000 µm in size.
In some gold deposits, there is evidence to show the existence of both fine- and coarse-gold particles that may be part of separate paragenetic stages or coeval and overprinted [15]. The fine gold particles are more likely to be disseminated through the ore zone and responsible for a relatively low background grade of between 0.5 g/t Au and 5 g/t Au. The coarse particles will be more dispersed and/or clustered, and are more likely to be related to higher grade zones or shoots.
Identification of the background grade and associated gold particle size characteristics is important, since they may represent the only part of the mineralisation that can be sampled relatively easily [15]. For example, if a deposit with a mean grade of 10 g/t Au has a background grade of 2 g/t Au related to fine gold and the rest of the inventory (8 g/t Au) related to coarse gold, then 70% of the contained gold can potentially be under-sampled.
There is evidence to show that relationships exist between increased gold grade and larger potentially clustered gold particles [16]. In some cases, 50% of the gold is greater than 100 µm in size, with extreme cases of 90% above 100 µm and including 60% about 1000 µm. Coarse particles may be more clustered and related to high-grade zones. In rare cases, fine gold particles may cluster to form pseudo-coarse gold masses of up to 500 µm in size. Clustering can have a significant impact on sampling protocols, particularly during the early stages of sampling broken rock, whether it is bulk sampling of development rounds, grab sampling of stockpiles, field sampling of RC chippings, or laboratory sampling of crushed drill core. Once the sample has been pulverised, the additional in-situ heterogeneity related to clustering is removed, though it may still be relatively high if coarse gold is present.
1.5. Sampling: Decisions, Financial Loss, and Compliance
Once a sampling error is introduced, it propagates through all subsequent processes contributing to the uncertainty of the end result and any decisions made thereon [3,4,8,17]. Across the mine value chain, these errors generate financial and intangible losses [3,4,8]. The financial consequences of sub-optimal grade control sampling can be significant and relate to: incorrect operational decisions, poor reserve estimates, reduced mine life, and poor reconciliation.
These financial losses arise due to misunderstanding of the principal factors that affect the size of sampling errors, such as the mass of the sample, the effects of splitting a sample to reduce the mass, and the influence of the nominal particle size. The handling and processing of sample material without due regard to the sampling characteristics of the material being sampled is a major source of sampling errors (e.g., coarse versus fine gold dominated mineralisation). This significant problem of ore/waste misclassification is a consequence of the support and information effects. The support effect relates to the difference in size at which samples are collected and mining blocks are extracted. The information effect is a function of the availability of data at the time that decisions are made about the destinations of ore and waste. Ore/waste misclassification will be minimised through samples of an optimal mass and spacing.
In the Australian context, The JORC Code 2012 requires the Competent Person(s) to provide commentary on the entire sampling process. The company undertaking sampling is required to have quality assurance policies, sampling procedures, and protocols in place. There is sometimes a casual approach to grade control sampling and associated activities, where protocols, QAQC, training, and periodic review are not undertaken. This will nearly always result in operational performance problems that require time and money to remedy.
Dominy [4] presents a number of underground case studies where annual financial losses due to poor sampling range between US $2 M to US $12 M before corrective actions were taken. Key issues related to incorrect and poorly implemented sampling methods, inappropriate sample preparation and assay methods, and poor or no QAQC.
1.6. Current Practice and Focus of this Contribution
Many large operations have removed the need for development sampling, relying on the use of drilling. Small mines (<0.25 Mt per annum) continue to use development samples (e.g., linear, sludge, and grab) both for resource evaluation and grade control activities. Some will have minimal drilling to support mine planning. Where development sampling is required, there is a need for best practice, particularly when it feeds into a resource that will be publically reported.
This paper draws on the practical experience of the authors to provide the reader with the background required to establish a fit-for-purpose underground grade control sampling programme. It critically assesses the sampling methods used and their optimal collection, preparation, and assaying through the application of TOS. A number of examples are presented to validate discussions where appropriate. Whilst the paper focusses on gold-based operations, the conclusions are applicable to other metalliferous mines. In addition, its coverage is relevant to surface sampling using the same methods.
2. Theory of Sampling
2.1. TOS Overview
Theory of Sampling was developed in the 1950s by Dr Pierre Gy to deal with sampling challenges in the mining industry, though it has far wider applications [1,10]. It provides important guidelines for reducing sampling errors (Table 2), though there is still much to do in the context of research, communication, and education [18].
Its application to underground grade control sampling has been variable, with leading use in the South African gold sector [19,20,21]. Some of the resistance to the application of TOS relates to the use of the Fundamental Sampling Error (FSE) equation and confusion as to its calibration and application. Theory of Sampling has a wider usage than simply the FSE equation and includes a number of errors that must be considered to achieve representative samples (Table 2).
Theory of Sampling provides an insight into the causes and magnitude of errors that may occur during the sampling of particulate materials (e.g., broken rock). Theory of Sampling strictly does not include sampling of in-situ material such as face samples, as the sample does not have an equiprobable chance of being collected. However, its application is relevant and helps to understand some of the challenges of field sampling through analysis of the so-called incorrect sampling errors during the sample collection process [4,21]. The application of TOS includes the mandatory use of an appropriate QAQC system, including the use of duplicates. Table 3 shows the cause and effect of the common sampling errors and provides some solutions.
2.2. Correct Sampling Errors
The correct sampling errors (CSE) are considered “correct” because they cannot be removed by perfect sampling procedures (Table 2). They are random errors and relate to the inherent heterogeneity of the material being sampled and control precision [1]. In the context of grade control, low precision generates ore/waste misclassification and poor reconciliation.
The FSE relates to the constitution heterogeneity of the material in question. The FSE can be estimated via the FSE equation [10,22]; it does not cancel out and remains even after a sampling operation is perfect. The FSE is controlled via the optimisation of sample mass and size reduction process.
The second CSE is the grouping and segregation error (GSE). From a practical perspective, GSE cannot be measured, but it is likely to have a material effect when not controlled [23]. It is controlled by accumulating many small increments to form a composite sample. Segregation can theoretically be reduced by homogenisation, though in the presence of liberated gold and/or sulphide particles it is a futile exercise that often promotes further segregation [4,24].
2.3. Incorrect Sampling Errors
The incorrect sampling errors arise as a consequence of the physical interaction between the material being sampled and the technology employed to extract the sample (Table 2). Incorrect sampling errors are systematic errors which result in bias. They can be reduced by the correct application of sampling methods, equipment, and procedures, and are the errors most likely to affect grade control sampling [1].
2.4. FSE Equation and Application to Gold Ores
2.4.1. Background
The FSE can be modelled before material is sampled, provided certain characteristics are determined [1,10,22]. The FSE is applicable to grade control samples once they are collected (e.g., a face sample is broken rock in a sample bag). For any process where the FSE escalates, there is an associated loss due to uncertainty, which in terms of grade control relates to ore/waste misclassification. The FSE equation (“François-Bongarçon modified” version) is given as [22]:
where f = shape factor; g = granulometric factor; dn = nominal material size; c = mineralogical factor; d95Au = liberation diameter; b = (3 − α), where α is determined experimentally from Duplicate Series Analysis (DSA) tests [25], or a default value of α = 1.5 is generally applied [22]; MS = sample mass; and ML = lot mass. The sampling constant (K) is a product of: f·g·c (d95Au)b. Using this formula, it is possible to: (a) calculate the error for a given sample size split from the original, or (b) calculate what sub-sample size should be used to obtain a specified variance at a given reliability.
FSE(rel var) = f·g·c (d95Au)b·dnα (1/MS − 1/ML)
2.4.2. Calibration of FSE Equation Inputs
The key parameter to determination is the gold liberation diameter—a particle size parameter [1,22]. For gold mineralisation, it can be defined as the screen size that allows 95% of gold given a theoretical liberated lot to pass (d95Au) [13,22]. If gold particles cluster, then d95Au should be defined as the cluster diameter—dAuclus [16].
Approaches to FSE equation calibration range from guesswork to the implementation of Heterogeneity Tests (HTs) or DSA. The HT allows the direct determination of K, whereas the DSA approach (and variants thereof) determines both K and α [1,25,26,27].
The HT is the most commonly applied calibration method in the mining industry. The DSA approach is both complex and time consuming to apply, so it is relatively rare compared to the HT. The HT is prone to severe precision problems, particularly when coarse gold is present [27]. A further problem is that it provides values for K only at the fragment size at which the calibration exercise is carried out (often 10 mm). It has been shown that in such cases, the values for d95Au are far too low. In the presence of coarse gold, the HT approach may require samples of hundreds of kilogrammes in size. The method may not be a standard industry approach, since it is likely only to provide a correct value when mineralisation is disseminated [27].
As a result of these issues, the authors recommend a direct and holistic approach to characterisation with key outputs being [7,15,16,27,28]:
- Realisation of gold deportment, in particular the partitioning of gold as free gold, gold in sulphides, and refractory gold.
- Gold particle size curve(s), including effects of clustering and relationship between gold particle size and grade (e.g., high grade versus background grade).
- Definition of key FSE equation inputs (d95Au versus dAuclus) and the sampling constant K.
- Recommendations as to optimum in-situ sample mass requirements.
The direct approach to d95Au may include a combination of methods such as core logging, underground face observation, optical and automated microscopy, X-ray tomography, and staged liberation and concentration [7,28,29,30]. Characterisation studies allow the practitioner to set the ore sampling expectations across a number of d95Au-grade scenarios. In the production environment, optimisation at the breakeven cut-off grade is usually the critical point. Where this requires specialist and potentially costly protocols, then a cost-benefit analysis is required to understand the theoretical need versus practical reality.
2.4.3. Applicability to Gold Ores
François-Bongarçon [31] and François-Bongarçon and Gy [22] addressed some key issues in the application of the FSE equation and proposed a modified equation (Equation (1)). The modified equation has been applied successfully by practitioners to optimise sampling campaigns [7,17,23,29,32,33]. The use of the FSE equation represents a model that may or may not be attained in practice, but provides a starting point from where protocols can be optimised. Results of QAQC programmes will provide evidence for representativity through the application of field and laboratory duplicates [34,35].
2.5. TOS and Geostatistics
Theory of Sampling and geostatistics are inextricably linked through the nugget effect [36]. In geostatistics, the nugget effect is the random component of variability that is superimposed on the regionalised variable. In sampling, the magnitude of the nugget effect relates to: in-situ heterogeneity of the mineralisation; sample support; sample density; and sample and assay procedures. The nugget effect has two principal components [13,14,36]: the geological nugget effect (GNE) and the sampling nugget effect (SNE).
The GNE relates to the microscopic differences in composition throughout the mineralised zone/domain. It principally refers to the distribution of single grains or clusters of gold particles distributed through the ore zone [16]. Variability is greatest where there are small-scale, low continuity structures such as high-grade gold carriers within the main structure or veinlets within wall rocks [14].
The SNE is directly related to the sampling process: that is, to the size of the field samples taken; the effectiveness of collection; sample preparation; the size of sub-samples after splitting; and analysis [13,14]. Throughout the mine value chain, optimised sampling protocols aim to reduce the total sampling variance thereby also reducing the total nugget variance, skewness of the data distribution, and number of extreme data values.
2.6. Sample Representativity
2.6.1. Representative Sampling
A sample is representative when the analytical results are within acceptable levels of bias and precision [37]. Whilst precision (i.e., reproducibility) can be determined from duplicate samples, bias is difficult to estimate without generally impractical and costly experimental efforts.
The Danish Horizontal Standard [38] uses the relative sampling variability (RSV) metric to measure total sampling variability—the percentage coefficient of variability for repeat sample values. The higher the RSV, the poorer the precision indicating that the sampling procedure requires improvement. Relative sampling variability measures the total empirical sampling variance influenced by the heterogeneity of the lot sampled under the current sampling procedure [38]. The RSV comprises all stages of the sampling protocol, including all errors incurred by mass reduction, as well as analytical error. The accepted value of RSV is up to the practitioner and based upon the nature of the mineralisation in question, the data quality objectives, and what is cost-effective and practical. Experience shows that the RSVs of underground linear samples generally lies between 50% and 400%, but can reach 750% depending on the mineralisation. The RSV for a given sample type and support can be reduced through TOS and QAQC application [7,39,40]. The ultimate test of sample representativity is reconciliation between predicted grade and actual performance to within acceptable limits.
2.6.2. Data Quality Objectives
The data quality objective (DQO) is the level of total error that a given sampling protocol is designed to achieve. It is quoted as a precision value reported at a given confidence limit, usually 68% or 90%. The confidence limits can be defined as the reliability, where, for example, 90% means that the assay results will lie within the given precision in 90 out of 100 times [2]. Pitard [37] states that the total precision (error) for resource and grade control sampling should not be more than ±32%, with the FSE component not more than half of the total error (±21%). Fundamental Sampling Error is generally reported at the 68% reliability. It is up to the practitioner as to which reliability to accept, but for grade control samples to achieve an FSE of ±21% at the 68% reliability is reasonable.
The key error components across the sampling value chain are: sample collection (Table 4; sampling value chain (SVC) stages 2–3), preparation (Table 4; SVC stage 4), and analysis (Table 4; SVC stage 5). These can be estimated via an empirical approach using duplicate samples [34,39]. The sampling component error contains both the GNE (e.g., the in-situ variability) and the sample collection errors (e.g., delimitation (DE), extraction (EE), etc.). All TOS errors (e.g., FSE, GSE, DE, etc.; Table 2) contribute to the SNE. The typical ranges of component errors are given based on experience [6,7,34,37,39]. The optimal total target error is within ±20%, though for high-nugget/coarse-gold mineralisation a value of ±40% may be more appropriate. Values for the FSE and other TOS errors are based on general guidelines for acceptable uncertainty (Table 4) [37].
2.6.3. Fit-for-Purpose Samples
A sampling and assaying programme must produce data that are fit-for-purpose for the required need [4,17]. In this context, fit-for-purpose refers to sampling and assaying that contributes to a resource/reserve that will be reported in accordance with the 2012 JORC Code (or other codes), and/or a grade control programme that minimises ore/waste misclassification.
Development of sampling protocols in the context of TOS must be based on the specific mineralisation [7,28]. A critical input is that of QAQC to maintain data quality through documented procedures, sample security, monitoring of precision, accuracy, and contamination. If a batch of samples can be deemed to be representative and associated assaying complies with QA documentation and QC metrics, then fit-for-purpose is indicated. In addition, the fit-for-purpose test must consider the spatial distribution and number of samples. For example, if all samples comply with QAQC requirements, but do not sample the entire mineralisation (e.g., a certain vein set cannot be accessed and sampled in large profile drives), then they are not fit-for-purpose to evaluate the mineralisation in question.
2.7. Sample Spatial Distribution
2.7.1. Primary Sample Mass
Definition of gold particle size distribution within geo-domains supports the estimation of a primary (in-situ) theoretical sample mass [15]. With discrete gold particles, use of a Poisson-based method provides an indication of the sample mass that may be required to yield a given precision [23,42,43]. For gold deposits with discrete gold, there is a high probability of drawing non-gold particles. Hence, if a sample is too small, it will contain no gold. The Poisson model is a limiting case of the Binomial model where the proportion (p) of the rare component (e.g., gold) is very small, while the proportion of the material surrounding the gold (q) is practically unity (where q = 1 − p). It can be applied to both liberated and non-liberated (i.e., in-situ) cases, since on the sample scale, gold particles are rare events and can be considered as being discrete [23].
The approach assumes the equant particle (or grain) model where: (1) particles are free with no composite particles; (2) particles are either nuggets or gangue minerals; (3) nuggets have the same size, shape, and composition; (4) the gold occurs only in the nuggets; (5) a small number of nuggets are present in samples; and (6) a large number of gangue particles are present in the samples. The critical assumptions are (3) and (5) above. Assumption (3) is unlikely to be true since the population will have variable particle sizes and shapes. For assumption (5), the larger nuggets will be rare, but the fine background gold is likely to be more abundant and disseminated. The Poisson approach defines a maximum theoretical sample mass based on the largest gold nuggets present.
For example, gold mineralisation at a potential underground breakeven cut-off grade of 3.5 g/t Au and a d95Au of 1 mm, requires a 250 kg theoretical sample mass to yield ±20% precision at 90% reliability. If each face is represented by a composite channel sample of 4 kg, then 63 samples are required to evaluate the ore zone. Such a figure could be used to guide the sampling around a stope panel. A 2800 t stope panel could be blocked out by raises and drives totalling 120 m. If each advance was 1.8 m, then this is 70 samples around the panel. Seventy 4 kg samples yields a total mass of 280 kg, which is above the theoretical optimum.
Given that theoretical sample mass, face separation, and stope panel size are relatively fixed, the variables that can be changed are individual sample mass and number of samples per face. An individual field sample may not be representative, particularly in coarse-gold mineralisation. A theoretical field sample mass of many tonnes could be required to achieve an acceptable precision. As noted previously, a reasonable strategy is to collect multiple samples across a given domain (e.g., stope panel). Each sample may be locally unrepresentative, though by taking numerous spatially distributed samples the mean grade may be ultimately approached and variability reduced.
2.7.2. Sampling Domains
The optimum sample mass should be considered in the light of potential sampling domains, which are spatial zones of similar sampling characteristics based principally on grade and d95Au. The definition of sampling domains is an iterative process, where characterisation studies will allow sampling expectations to be set across a number of d95Au-grade scenarios, thus allowing the worst case scenario to be applied via an achievable protocol across the mineable width. In the simplest case, a vein and wall rocks may have different sample mass requirements (Table 5).
In the example presented, a central high-grade narrow vein is surrounded by lower-grade wall rocks, with stockwork vein sets (Table 5). Characterisation of both domains indicates that the high-grade central zone contains coarse gold. Consequently, the theoretical sample mass for both zones varies from 5 kg (wall rocks) to 20 kg (central), respectively, to achieve ±20% precision at 90% reliability. Mining focusses on the central vein, with the wall rocks making up diluting material in 3 m by 3 m development drives and a minimum stoping width of 1.5 m. Face chip-channel samples of 5 kg/m were collected across the wall rocks and vein. These are of a similar support to the NQ diamond drilling used. A duplicate sample study gave total errors of 18% and 37%, respectively. Both values indicate acceptable error for the fine-gold wall rock and coarse-gold vein scenarios.
2.7.3. Sample Density
Linear and drill sample spacing can be optimised using variography. However, this requires the existence of substantive data to produce a realistic variogram model. The spacing of development samples is controlled by the separation of faces, and thus ranges between 1.8 m and 4 m. Extension variance theory can be used to assess the geometric distribution of samples around and within a block; however, it requires input of variogram parameters. Initial sampling programmes, particularly for drilling, are likely to be driven by experience-based spacing until variography can be completed.
3. Grade Control Sampling Methods
3.1. Type of Samples
Many gold deposits are vein- or shear-hosted structures that have a thickness dimension that is considerably less than their strike and dip dimensions. Various sample types have traditionally been used for grade control (Table 6). The most common are in-situ samples collected by the geologist or geotechnician from development walls or faces. Broken rock sample collection is conducted by grabbing from rock piles (e.g., stockpiles, dumps, trucks, etc.). Core and percussion drilling methods are also applied (Table 6). Samples are collected at all stages of the mine development chain from pre-production, to stoping, and post-production (Table 7).
3.2. Linear Sampling
3.2.1. Chip Sampling
This technique involves taking a series of chips over a continuous or semi-continuous band using a hammer and chisel (Figure 2). When a series of discontinuous chips are collected, a series of punctual samples result which are effectively “specimens”. Depending on geology, the chip-band can be cut horizontally, vertically, or perpendicular to the dip of the ore body (Figure 3). The separation of the individual chips varies from touching (a chip-channel) to centimetres or more apart. Chip sampling is susceptible to extreme errors (DE and EE) through operator preferences and rock hardness (Table 8 and Table 9).
3.2.2. Channel Sampling
This method involves cutting a channel across the rock face. Depending on geology, the channel can be cut horizontally, vertically, or perpendicular to the dip of the ore body (Figure 3). The channel should be kept at a uniform width and depth to ensure a low DE and EE. Channels should generally be around 5 cm to 10 cm wide and 2.5 cm deep to yield a sample of between 3–6 kg/m. In practice, hand-cut channel samples are relatively difficult to keep uniform, and can be more like a “chip-channel” sample. Cutting of channels rarely permits equal depth representation over the entire cross-section (e.g., DE) due to different rock hardness and human effects. Sample quality may decrease as the channel progresses across the face due to poor sampler motivation and fatigue.
Some operations use a diamond saw to cut channels in an attempt to improve sample quality (Figure 4A–C) [7,32,44,45]. Two parallel saw cuts to about 2.5 cm depth are made 5 cm to 10 cm apart across the required width (Figure 4B). A hammer and chisel (or compressed air pick) is then used to extract the intervening block of sample (Figure 4D).
A typical 1 m length saw-cut channel cut should yield a sample mass of 4 kg (2.5 cm by 5 cm profile). It is unlikely that perfect sample extraction will be achieved due to irregularities at the base of the cut (e.g., where the sample block breaks free, EE). Where a large sample is required, channel width and/or depth can be increased or multiple channels cut. The principal barrier to low DE in saw-cut channels is rock face roughness. Where the face is very uneven, then even a saw cut is difficult to place and may result in high DE and EE across the sample zone.
Single- or double-blade saw units are generally powered by compressed air and require water for dust suppression. Single-blade units are the most appropriate, from both a safety and efficiency perspective. Double-blade units have the advantage that two parallel cuts are made at the same time 2 cm apart, though double-blade units are generally heavier and pose more of a manual handling and safety issue. Multiple cuts, one below the other, can be made using the upper or lower original cut as a guide.
Saw-cut channels are generally of higher quality, though bias may occur when fines are washed away during cutting, particularly in soft sections (EE). With rough/uneven rock surfaces, sample quality can be compromised since the extracted sample has a variable support along the channel. A larger saw blade may help to ameliorate a rough surface. The cost and time for taking saw-cut channel samples depends on rock hardness and the availability of services to run the saw, but experience shows that a well-trained two-person team can cut and collect a metre of channel sample in 10–15 min. Proper training and the use of personal protective equipment will reduce safety concerns with the use of saws.
A reasonable quality channel sample can be extracted using an air pick chipping device (Figure 4D), but it is prone to operator induced DE bias, either purposeful (e.g., a deep cut around a high grade section) or accidental (e.g., a deeper cut around soft material). Air picks have the tendency to produce fly-rock, which is both an EE and safety issue. Channel sample attributes and errors are given in Table 10 and Table 11.
3.2.3. Panel Sampling
Panel samples comprise multiple chips spaced across a panel (i.e., <50% rock sampled, chip-panel sample) or contiguous chips over the entire panel area (panel-channel sample; >50% rock sampled) (Figure 5).
Dispersed clusters of coarse gold in a vein system at the Gwynfynydd Mine (UK) created a negative bias in grade control samples, leading to the replacement of standard chip-channel samples by panel-channel samples [12]. Faces were divided into horizontal quarters and close-chipped to give a 25 kg sample from across each of two panels. Processing of the combined 50 kg micro-bulk sample was through a gravity separation unit located on surface. The resulting data were used to map grade trends along development and to provide a semi-quantitative grade. The potentially larger mass (>100 kg) of panel samples compared to chip or channel samples, means they are typically used for metallurgical sample collection (Figure 5). Panel sampling errors are given in Table 12 and key attributes in Table 13.
3.3. Discussion: Practical Issues of Linear Sampling Methods
3.3.1. Integration with Geological Mapping
Geological mapping is a critical activity during grade control and is particularly applicable where geology and geometry are variable and mine openings need to respond accordingly [12]. The primary objective is to identify and locate the ore zone or at least the section likely to contain the ore with respect to the minimum stoping width. The secondary objective is to determine the attitude and position of relevant structures that control the 3D form of ore shoots or gold carriers (Figure 3). Thus, mapping has an intimate relationship with sampling [12,46]. Sample locations should be picked up by the mine surveyors to ensure that they can be recalled in 3D space to support resource models and mine design.
3.3.2. Sample Collection and Methodology
The geologist must ensure that samples are delineated and extracted efficiently to minimise DE and EE. This means an even width and depth across the sample zone must be cut and that all liberated rock fragments are captured in the sample. Extraction of saw-cut channels is relatively easy, but more challenging for hammer cut channels. Chisels should be of high quality with a sharp point, as blunt points eject fine rock fragments (EE).
Sample capture is important (minimisation of EE), where one of the most effective methods is to use of a bucket or purpose-designed receptacle that can be held by an assistant close to the rock face. It is important to ensure that the receptacle opening is wide enough to allow sample material to enter. A tarpaulin can be placed on the drive or stope floor immediately below the delineated sample area (Figure 5B,C). An alternate sample capture method is to use rubber mats (e.g., lengths of conveyor belt; Figure 5D), which whilst relatively heavy, can be cleaned more effectively. Sample contamination (PE) needs to be minimised during collection. Key areas for consideration include: cleaning of faces or walls prior to sampling (avoid use of dirty water); ensuring that all sample collection equipment is clean; avoiding the re-use of sample bags (particularly calico bags where fines can become entrained in the weave); and minimising of fly-rock contamination during sampling.
Chip and channel sampling are prone to EE because as much as 20% (typically 5–10%) of the extracted (chipped) sample mass is lost as fly rock rather than being captured in the sample. Extraction error can be reduced by careful chipping and ensuring that any sample receptacle is large enough. A two-person sampling team reduces both DE and EE, where one person extracts and the other catches the sample material. Where channel sampling is used, a piece of wood or aluminium cut to the channel dimensions can be used to gauge delimitation.
Where multiple channels or chips are being collected across a face or sidewall, they should be collected from the bottom sample upwards. This approach avoids contamination of lower samples from those above from falling fragments. Where the sample band/channel is inclined to cut the ore zone at right angles, sampling should commence at the lower end and work upwards.
The greatest EE during face sampling arises from differential, hard versus soft rock properties, as a greater quantity of softer material usually enters the sampling bag (Fourie and Minnitt, 2016). If this is high-grade, then the sample will be positively biased, and if low-grade, vice versa. In very hard sections, there is a likelihood of sample loss, as rock chips from each hammer blow will fly away from the sampling bag or a lack of sample collected.
In a study based on Witwatersrand (RSA) gold mines, Fourie and Minnitt [21] identified an “in-stope sample discard process”, where samplers were prone to make a selection of what they believe was better looking material. Such discard of waste and preferential selection of mineralised material leads to a positive “waste discard bias” and hence higher sample assays [21].
In well-jointed and/or bedded rocks, collection by hammering presents difficulties in that adjacent non-sample material may fall into the sample lot (e.g., contamination; PE). This alien material is unwanted and needs to be either removed or avoided by screening or barring down the loose zone prior to sampling.
The quality of chip and channel samples is highly dependent upon the sampling crew and the underground environment. The best-trained crews are unlikely to collect a high-quality sample. Quality will vary from crew to crew and from shift to shift. The mine environment will also effect quality through local temperature/humidity (e.g., fatigue effects), sample location (e.g., drive vs. stope vs. raise), and time of shift (e.g., fatigue/motivation effects). Additional bias (DE) also comes from the human eye, where the geologist will be drawn to collecting a larger sample from visible gold or high-grade areas (e.g., sulphide-rich). Collector bias can be reduced by ensuring that all samples are collected along a marked grade line and staff training (Figure 1).
In many mines, face samples are taken at a height above the drive floor, often 1 m ± 0.5 m, though this depends on the type of ore body. For example, in the shallow-dipping Witwatersrand reefs, face samples are taken across the reef irrespective of how high or low it is from the floor of the stope. In some operations, the face is divided into two horizontal halves, with a single channel taken along the half line or one sample taken along the centre of each half (i.e., two face samples). For larger drive profiles, 3 m by 3 m and greater, it is difficult to sample safely above 2 m. In this case, a service vehicle or rugged step-ladder is required to provide a safe working platform. In a production environment this may be difficult, and in some cases a sample may not be collected. If relevant, the geologist will have to use their experience to evaluate the effect of not sampling a particular geological domain.
Rowland and Sichel [47] compared chip and channel sampling within selected Witwatersrand mines, concluding that: cutting chip or channel samples by hand was difficult, sampling supervision and training are critical, and when using compressed air saws or picks it was possible to collect better quality samples quicker. Storrar [11] emphasises the need to minimise DE and EE during sample collection, and the need for the sampler to be motivated, trained, and encouraged to maintain a high standard in sampling practice.
3.3.3. Sampling under Production Conditions
Time spent at a working face is critical, therefore the geologist must develop skills to collect the best information in the shortest time. There is rarely an hour to spend at a face and more likely it is 15–30 min. Operational pressure tends to be higher in large mechanised mines, whereas in smaller mines there is usually a higher focus on grade rather than tonnes. Whilst not wanting to unduly hold up development, time to do the job properly and collect samples in a geological context is imperative. The authors maintain that once the mining crew has made a face safe, it is not unreasonable for a geologist to be allowed 30 min at the face per shift. Actual time required will depend on ore body complexity and drive size. In reality, the actual delay cost by allowing geologists access to a face is minimal, though few mines will neither realise or admit this. However, it can be very difficult to get the cooperation of the drilling crews if their bonus depends on meters of advance or number of holes drilled. Grade control activity should be factored into the mining contract through geological-related quality checks, for example, stope and drive profile measurement and sampling.
Where shanty drives are cut in narrow low-angle ore zones, the exposure of mineralisation in sidewalls allows sampling to be potentially undertaken behind the development face if immediate ore/waste decisions are not required (e.g., Nalunaq [32]; Figure 2A).
There can be an inverse relationship between the size of a mine and sample mass collected at face, generally where smaller mines collect larger samples. Similarly, there can also be a relationship between mine size and sample quality, where smaller mines collect higher quality samples. However, some large mines, notably those on the Witwatersrand, have put much time and effort into improving sample quality [19,20,21]. Mass and quality issues relate to: the rate of face advance, time pressures, and availability of the geologist. Some mines require 24/7 coverage by the geological team to ensure all development faces are sampled.
3.3.4. Sampling and the Geological Context
A major focus is to ensure that samples are collected in a geological context. Beyond the digital camera, some mines use rugged computers to record face data. Automated 3D digital face mapping systems are now also available [48]. The importance of geological input into grade control cannot be overstated and has implications for selective mining and stope design [12].
Sample lengths should generally be less than 1.2 m and greater than 0.3 m. Where the vein is very narrow (<0.5 m) or a key geological domain within a larger structure is very narrow, care must be taken. In some instances, any chip sample collected will be small (<1 kg). In one example, the author has seen geologists collect a purposely large sample (e.g., 4 kg) in a narrow (25 cm) high-grade (>30 g/t Au) vein domain within a 2.5 m host reef. This yielded a support of 16 kg/m compared to other samples in the same face, which had a support of 6 kg/m. A strong grade bias resulted in the face grades. In high-grade narrow structures, the probability of sample collection bias, planned or not, is high when visible gold is present.
Geologically-controlled high-quality samples are particularly important where the ore body boundary is based on an assay contact. There may be no convenient geological indicators, with reliance being placed on the final assay grade to determine ore and waste. In this case, samples down to 0.1 m may be collected. During the sampling of faces, it is important for the geologist to take note of the contacts between mineralised and unmineralized material. In some high-grade deposits it is common for visible gold to occur at the boundary between two rock types (e.g., quartz versus shale or massive versus laminated quartz). When cutting samples, it is likely that the high-grade material can be sampled twice for the different rock domains. In this case, it is important for the true high-grade lithology sample to be extended a few cm into the lower grade zone to avoid contamination of the lower grade zone.
Fourie and Minnitt [21] identified “soft-reef” bias within the carboniferous reefs of the Witwatersrand. So-called soft-reef bias contributes to the generation of significant sampling error and bias is the result of the over-extraction of soft, carbon-rich material compared to the harder host rocks. This bias results in an overestimation of the grade of the in-situ sample [47,49,50]. Cawood [50] suggests that the soft-reef bias results in the overestimation of grade by up to 26%, due to the over-extraction (e.g., EE) of the high-grade carbon-rich material.
Wall rocks may contain disseminated gold and/or stringer veins, which will need to be sampled as separate domains from the main gold carrier (e.g., vein, shear, dyke, etc.; see Table 5). At an early stage, characterisation is required to investigate which geological domains bear gold and in what form.
3.3.5. Recording Sampling Quality
The key qualifiers of sample quality are DE and EE. A simple observational index that can be recorded on the sample log/face sheet to report quality, which can then be integrated into the database (Table 14). Rating is based on the visual review of DE and EE of the sample. It is then possible for the geologist to review the quality of samples being used to inform a given stope/resource block(s). Should the majority of samples have an “LQ” (i.e., low quality) rating for example, then any resource estimate can take this into account by using a lower reporting category if appropriate.
A study undertaken by Freese, Flitton, and Pillay [19] on chip sampling at the Kopanang mine (Witwatersrand) led to the introduction of a quality index (QI). The QI measured a number of parameters based on before and after photographs of each sample site including: area and depth of the sample, width of sample, sample mass, and time taken to collect the sample. They found that closer supervision of sampling activities and application of the QI led to increased sample masses being recovered by samplers. Fourie and Minnitt [20] used a laser scanner to profile a face before and after sampling to produce a 3D image of the sampled zone.
An alternate method is to record the mass of each sample at the laboratory after drying. This measures the quantity of recovered rock over the expected mass. A target acceptance of ±5% is nominally taken around the expected. Above or below this range, the samples are either over- or under-sampled. This method is not perfect, for example an under-extracted sample could yield a close to normal mass based on contamination by fallen material out of the delimited area.
Example of a mass-recovery QI for linear samples is shown in Table 15, where the rating is based on percentage of samples on target. The data was collected from the same mine by the same crew from 2.5 m by 2.5 m faces, which comprised 1.0–1.3 m of quartz vein hosted in weak–strongly altered dolerite wall rocks. The highest quality sample was the saw-cut channel, which achieved 75% of samples on target. The lowest quality was the chip samples, achieving 0% with all under-sampled. The air-pick cut channel yielded a low value, which was due to excessive loss (EE) by fly rock.
3.3.6. Sample Support
Sample support (e.g., volume) and quality (e.g., minimised ISE) exert controls on the sampling nugget effect, where larger samples yield a lower nugget effect [13,14,36]. Magri and McKenna [45] report a comparison study between chip and channel (saw cut) samples in two Witwatersrand mines. In one mine (Randfontein), the chip samples were taken under close supervision and were then duplicated with minimal supervision. Variography of the two sets revealed very similar structure (e.g., model type and range), but different total nugget effects with chip sample nugget effect being higher. In the second mine (Western Areas), the initial chip samples were duplicated with saw cut channel samples. Variography showed that the total nugget effect of the channel samples was half that of the original chip samples. The authors also concluded that a spacing of 5 m for the channel samples would be equivalent to a spacing of about 2.5 m for the chip samples. Similar results were also noted in other Witwatersrand studies [44,49].
Dominy [42] reports on a study undertaken in a North American gold operation. Three 50 m long drives up-dip from one another were re-sampled under close supervision using air-pick cut channel samples (support of 3 kg/m). The new channels were cut as close as possible to the site on the backs of the previous face chip-samples (support of 3 kg/m). Sample preparation and assay protocols were defined for a moderately coarse gold-bearing ore for the new sample set, including 1 kg screen fire assays. The new data (98 samples) displayed a 20% upgrade in comparison to the original data. The nugget effect of the new data was 61% compared to 80% for the original data. Dominy et al. [7] report on the evaluation of a sheeted vein gold deposit, where 60 saw-cut channel (8 kg/m) and chip samples (3 kg/m) were collected as field duplicates. The channels yielded a nugget effect of 63% (RSV 145%) and the chips a nugget effect of 87% (RSV 296%).
4. Grab Sampling
4.1. Introduction
There are a number of mines using grab samples (or muck or broken rock samples) as a method of grade control [51,52]. The goal of grab sampling is to predict the grade of ore from a particular source (e.g., stope, stockpile, or truck) and/or reconcile with the predicted grade. It is often used because of access issues (e.g., non-entry stopes—sub-level caving operations), safety (e.g., to avoid unsupported backs), or lack of other sample data. On occasion, samples may also be taken from drive or stope floors to monitor gold loss. Surface grab sampling is often used to monitor the grade of stockpiles prior to blending or feeding to the plant or for reconciliation purposes. A fuller discussion and case studies are given in Dominy [51], and Carswell et al. [39] present a case study based on the high-grade Gosowong mine (Indonesia).
4.2. Collecting Grab Samples
Grab sampling involves collecting a large sample or series of smaller samples (that are later combined) from the muckpile at a face or drawpoint, or from tram cars or trucks transporting the ore from these points. Samples are generally collected by hand or shovel by a geologist, field technician, or miner (Figure 6). Non-scientific protocols usually define sample mass and number of samples, where an individual mass may range between 1 kg and 6 kg. The mass is limited in practical terms by health and safety issues, as well as the capacity of the laboratory to process samples within a reasonable timeframe. The number of samples collected is generally arbitrary and often constrained by laboratory capacity.
4.3. Grab Sampling in Block Cave Mines
Block cave operations have been traditionally reliant upon drawpoint grab sampling for grade control [52]. Similar to other large mines, drawpoint sampling is used to monitor grade over a period of time. When the plant is reconciling to the predicted feed grade, then the samples are not important. However, when reconciliation becomes negative, they can be used to track grade across active drawpoints.
The question of representativity is a continual point of disagreement between practitioners. Drawpoint grab sampling focuses on the fraction of material that is small enough to be picked up by hand and put into a sample bag. This introduces a bias (e.g., DE and EE) due to the fact that no sample is taken from the coarse size fraction (>15 cm), which is relevant when ores have a demonstrated characteristic for increasing grade in the finer fractions. A drawpoint may produce 200 t of ore per day and be sampled every 10 days, which equates to 10 kg of sample for every 2000 t [52]. A grid can be drawn onto the rill surface indicating where samples are to be taken in an attempt to spread sample coverage (Figure 7).
The use of grab sampling in block cave mines, whilst problematic, provides management with information which allows them to make decisions where the grade appears to be reducing. Future very large-scale caving operations will require a new approach to production sampling to meet safety and health expectations. The numbers of draw points (potentially up to 1000) combined with the use of more automation mean that a faster and smarter sampling will be required to meet the demands of bigger mines [52].
4.4. Grab Sampling and Errors
4.4.1. Error Generation
The efficacy of grab sampling has frequently been questioned due to the presence of large size distribution biases in the method and hence high FSE and GSE [51]. Bias can be exacerbated due to the natural tendency of the sampler to be drawn to richer fragments or to the fact that fines are often enriched in gold and/or sulphides. Another challenge relates to the fact that muckpiles are rarely mixed; therefore, the collection of samples from the pile surface is never going to be representative of the block of ground from which it was drawn. This problem is exacerbated by the fact that in development headings, detonator time delays eject material sequentially from the face, initially from the centre, and finally from the edges. Thus the muckpile will be zoned with the last material blasted on the top. Samples collected from trucks, tram cars, or stockpiles/dumps may be more “homogenised”.
In long-hole stoping, the last material to be blasted will generally be from the hangingwall and footwall of the stope, and may be entirely dilution (i.e., low grade or barren). Diluting blocks are likely to be relatively large, but will be under-sampled. In narrow ore bodies extracted by the long-hole method, minimum stoping widths may require a significant amount of edge dilution, which will generally end up on top of the pile. In cut-and-fill operations there is a risk of cement fill entering the ore stream. If this is the case, then it should be included in any grab samples since it is part of the mill feed and its non-collection is an EE.
High or low-grade material may preferentially segregate in the pile during mucking. Additional issues result from the use of water underground to suppress dust. Sprinkler systems or water jets spraying onto a muckpile exacerbates segregation of fines to the pile base. In some cases, spraying can lead to gold loss into drive or stope floors. The same is true for surface stockpiles where water is used to reduce dust or where there is high rainfall.
In order to obtain a more reliable sample, a large quantity of broken rock (up to 100 kg or more) will usually have to be collected on a day-to-day basis, which is generally impractical in a mining situation. Sampling needs to be throughout the pile volume, which is again impossible, and hence tram car sampling is a preferred, but still not optimal option. Some correlation generally exists, whereby large fragments are enriched or depleted with respect to gold. The sample mass that should be ideally collected is dependent on the size of the largest fragments in the pile and on the nature of the contained mineralisation (e.g., coarse versus fine gold content). The coarser the rock fragments and the coarser the gold, the larger the sample mass required.
4.4.2. Comparison Between Contrasting Ore Types
A comparison between two contrasting ore types is shown in Table 16, illustrating that in some cases, grab sampling can work relatively well. The two deposits have similar head grades, but contrast as low-nugget no-coarse gold (Mine I) and high-nugget dominant-coarse gold (Mine II). Notably the field sampling error component for the two deposits is very different at 27% and 68%, respectively. As a result, the grab sample-derived grade estimate for Mine I is good (107%), whereas for Mine II is very poor (227%). This difference principally relates to the granulometry and gold particle distribution of the ore types. In Mine I, gold is relatively evenly distributed through the muckpile and does not differ substantially from one fragment size range to another. However, in Mine II, there is a dominance of gold in the sub-2.5 cm fragment fraction, and thus the grab samples are biased since the +2.5 cm fraction is not represented properly.
Caution is required with the interpretation of duplicate grab sample analysis. In one example, duplicate analysis indicated low variability of the sampling component (e.g., ~25%), but this masked the fact that the samples were representing the <3 cm fraction well, but not the coarser >3 cm fractions. In this case there was low heterogeneity in the high-grade fine fraction related to the consistent liberation of gold-bearing sulphides. However, this fraction contained around 50–65% of the total gold. Full characterisation, including a granulometric study is required to understand grab sample representativity.
4.5. Summary
The key issue with grab sampling is the size of primary sample required to be representative. The few kilogrammes that are usually collected are generally inadequate and leads to a large FSE, potentially to ±500% or more. This error may be reduced by collecting multiple small samples over a pile, for example fifty 5 kg samples giving a composite of 250 kg. Pitard [23] suggests that a minimum of 32 individual samples should be taken from a pile to reduce the GSE. In the most challenging of cases (e.g., some coarse gold systems), it is possible that hundreds of kilogrammes or tonnes are required for each sample composite. Where large samples are collected, the best option is sample size and fragment reduction via a sampling tower. The FSE equation can be used to optimise sample reduction, where Equation (1) can be rearranged to solve for MS.
The method is prone to high sampling errors (Table 17); key attributes are given in Table 18. Grab sampling may be effective where grades vary little between size fractions (e.g., fine disseminated gold that is locked in sulphides; Table 16) and where both the ore and waste break into pieces of approximately equal size. In many gold mines, despite best efforts, the geologist should expect precision to be poor and ore/waste misclassification high.
There are situations when grab sampling is the only way to evaluate grade, for example where there is no drilling and/or development cannot be safely accessed. Grab sampling is known to work sometimes in low-nugget effect mineralisation styles (e.g., disseminated gold deposits), but in heterogeneous coarse gold systems a positive bias is likely given that the fine fraction is generally enriched in gold (Table 18) [39]. If grab sampling is the only option, then gold particle characterisation, granulometric, and duplicate programmes must be undertaken to determine representativity.
5. Drilling Methods
5.1. Diamond Core Drilling
Diamond core samples are generally the highest quality samples that can be produced when core recovery is above 85% (e.g., low DE and EE). Core can be oriented spatially in 3D for geological and rock mass characterisation. Coring in broken ground may require more expensive large-diameter core and triple-tube drilling techniques to achieve acceptable recoveries. Similarly, core drilling in swelling ground may require special mud to achieve higher recoveries. Core has a small relative volume (e.g., ranging from BQ 3 kg/m to PQ 15 kg/m) of material and may result in locally unrepresentative samples. The method is relatively slow and expensive, which may pose some restrictions on close-spaced drilling. Diamond core drilling is used in a number of mines for grade control and short- to medium-term planning purposes [7,40,53,54,55].
5.2. Reverse Circulation Drilling
Reverse circulation (RC) drilling technology is now available to underground mines [56]. It provides a larger volume (e.g., 35–45 kg/m) of sample than drill core in a relatively shorter time (7–10 m/h) and at lower cost. Holes can be angled orthogonally to the mineralisation for better geometric representation. Chip sizes are relatively small and consistent. However, sample recovery in poor ground conditions may be inadequate (high EE). Reverse circulation cuttings can provide useful information, but lack the detailed structural component which is available with core. Care needs to be taken to ensure correct sampling equipment whilst splitting a sub-sample at the rig (minimisation of DE and EE). Despite producing a relatively good quality primary sample, a negative of RC is that a large FSE can result where a small sub-sample is taken from the primary sample. Thus, a 5 kg sub-sample from an original 1-m 40 kg composite from a medium-grade (3–4 g/t Au) coarse gold ore could yield an FSE of greater than ±40%. Duplicate sample analysis provides an appropriate way to empirically evaluate any RC protocol [56].
5.3. Sludge Drilling
Sludge or blasthole drill sampling involves using a jumbo, long-hole, or air-leg drills to create open holes and collect the cuttings in catchers or strategically placed containers [57]. Sample mass can vary from 2 kg/m for air-leg drills up to 12 kg/m for long-hole rigs.
The traditional sludge sample paradigm is the collection of sample material per rod length (e.g., 1.2 m to 1.8 m) per hole (Figure 8). However, a small number of operations collect cuttings from an entire blast ring that may yield around 2–3 t of sample. Collection of the primary sample is a challenge, but can be achieved via a hole collar device feeding to a hopper or simply placing the hopper under the hole whilst drilling. The primary sample mass then needs to be reduced, which can be undertaken via a splitter unit located underground or on surface. For a 2–3 t primary sample, a 200–500 kg split is potentially required to achieve an FSE of ±20%, though this depends on the nature of the gold and grade. The sub-sample can be processed via a laboratory-scale gravity plant or split down further for multiple bulk cyanidation. Such an approach has been applied to high nugget mineralisation extracted by long-hole stoping [42].
A small number of operations have practiced the collection of sludge samples from development faces by scooping cuttings from the floor of the level (Figure 8). This method is prone to very high sampling errors and best described as a gambling process. In all sludge sampling exercises, there are usually problems with loss of fines and the sample being biased by contamination from the sides of the hole. Care needs to be taken whilst splitting a sub-sample to minimise DE, EE, and PE. Like RC, sludge drilling produces a large primary sample, though generally of low quality. A similarly large FSE can result, where a small sub-sample is taken from the primary sample.
Ovalle et al. [58] propose the “Sampdrill” method which utilises a hand-held drill to place multiple small diameter holes into the drive face or walls. The cuttings from each hole are then taken as an individual sample or composited to a larger sample. This methodology was applied to porphyry copper mineralisation, but is less likely to be relevant to gold unless it is fine-grained and disseminated.
Sludge sampling is often used to check where the ore zone is greater than the drive width. In other cases, it is used to check that blastholes are in ore via assay and/or visual inspection of channels. Sludge-based assays are generally not used to support resource estimates.
5.4. Comment
A reduction in the need for linear samples results from the use of more pre-development drilling at a spacing to allow local estimation [53,55]. McBeath and Whitworth [55] present a case study where drilling was reduced to 5 m to improve ore/waste definition in a geometrically complex and high-nugget effect ore body. Both diamond core and RC drilling can be used underground, with RC drilling providing a relatively quick and cheap alternative.
6. Other Sampling Methods
6.1. Bulk Sampling
In the underground context, bulk samples are used to assess grades in complex deposits and also provide geological, geotechnical, and geometallurgical information. The term bulk sample is not rigorously defined, but can be taken as the collection of a series of large (often >1 t) samples across a mineralised zone for test work. They are typically undertaken during pre-feasibility and feasibility studies and are seen as an insurance policy by verifying drill- or linear sample-based grade estimates and/or to support metallurgical pilot test work [7,29,59]. Bulk sampling is generally not relevant to routine grade control activities. However, some high-nugget coarse-gold operations have collected micro-bulk samples (100–250 kg) via face panel sampling (Figure 5) for grade control [12,60,61].
6.2. Conveyor Belt Sampling
So-called belt sampling is not generally relevant underground, though may be locally important for grade control activities as a measure of plant feed grade. Where undertaken, belt sampling must apply all TOS principals and in particular, a correctly designed automatic sample cutter should be employed [5]. The manual scooping or grabbing of samples from a belt is inappropriate and is dangerous. The FSE equation (Equation (1)) can be used to optimise the mass of sample required for the given feed granulometry. Cutters must collect a complete cross-section of the stream, with both the leading and trailing edges of the cutter clearing the stream at the end of each traverse. In addition, the cutter must be non-restrictive and self-clearing, fully discharging each increment without any reflux, overflow, or hang-up [5]. Falling stream cutters are preferable to direct belt cutters. Poorly designed and operated cutters are prone to high DE and EE, and the sample mass and number of increments should be optimised to the feed rate to ensure a low FSE.
7. Sample Preparation and Assay
In some cases, a mine will have its own laboratory which speeds up the turnaround time for assays. Where samples inform a resource estimate, it is preferable for the laboratory to be operated by an independent and accredited third party. If the laboratory is run by the mining company, then it is critical that it be independently audited on a regular basis and that umpire assays are undertaken as part of its QAQC programme.
Sample mass and fragment size reduction must be undertaken within the framework of the TOS; the FSE equation can be applied (Equation (1)). Particular care is required in the presence of coarse gold, with possibilities for gold loss and/or contamination [24,30,32,54,59,62]. Broken rock samples from the mine (e.g., a face channel sample) must be crushed prior to splitting and pulverisation to avoid high DE, EE, and GSE. Large pulverisers such as the LM5 (maximum capacity 3 kg) are useful; however, removal of the pulp needs to be maximised (EE) and contamination controlled (PE). It is recommended that laboratories include a barren flush after visible gold-bearing samples. However, if the ore bears coarse gold, then flushing after each sample is optimal. Assaying of the pulveriser wash (e.g., sand) is recommended at a rate of 1 in 10–20 for coarse gold ores. DE and EE are potentially high during sample mass reduction, and a Jones riffle splitter or rotary sample divider should be used. Mat-rolling and grab sampling from the pulp must be avoided (DE, EE, and GSE) [1,4,24].
The traditional paradigm of crushing and pulverising the entire sample (e.g., chip or channel sample, or half drill core) and taking a 30–60 g sub-sample for fire assay is potentially flawed [4,7,17]. The approach is prone to high CSE and ISE, particularly when the assay charge is scooped from the pulp. The propensity of gold not to pulverise efficiently (exacerbated in the presence of coarse gold), promotes FSE and GSE, and potentially loss or contamination (e.g., PE) during sub-sampling for the fire assay charge.
The use of an entire sample for total assay effectively yields FSE and GSE values of zero [7,12,54,59,63]. With good laboratory practice, the PE and AE can be minimised. Arguments against whole core sampling in particular, revolve around no reference core remaining for re-logging, check sampling, etc. However, the authors contend that with modern digital photography, detailed logging and internal and/or external peer review that this should not be an issue. A reference sample can be split by rotary sample divider after crushing.
There are a number of techniques employed to assay samples for gold (Table 19); these include traditional fire assay, and large charge methods such as screen fire assay, LeachWELL, pulverise and leach, and whole sample by gravity. The LeachWELL method is particularly suited to gold assaying, as samples of up to 5 kg can be leached [64]. LeachWELL is a catalyst that increases the dissolution rate of gold, where samples can potentially be leached in less than 24 h. The gold laden solution is then analysed via an instrumental method such as atomic adsorption spectrometry. LeachWELL is not a total assay, therefore evaluation of its performance on a given ore type is required. In most cases, the leach tails are subjected to a duplicate fire assay to provide a total gold grade.
Sample protocols should not be left solely to the laboratory to decide, but established by the project team based on characterisation. In the absence of duplicate samples, the FSE equation (Equation (1)) can be used to evaluate protocol precision across different ore types. Examples are given in Table 20 for a series of protocols based on a fine- and coarse-gold ore types. It must be remembered that the FSE equation only evaluates the FSE; an acceptable FSE value can be swamped by high GSE, DE, EE, etc., thus making it inappropriate for use.
8. Quality Assurance/Quality Control and Error Quantification
8.1. Quality Assurance and Quality Control
Quality assurance and QC are the key components of a quality management system [35]. Quality assurance is the collation of all actions necessary to provide adequate confidence that a process (e.g., sampling, test work, and assaying) will satisfy quality requirements. While QA deals with prevention of problems, QC aims to detect them. Quality control procedures monitor precision and accuracy of data, as well as possible sample contamination during preparation and assaying. Throughout any grade control programme, QAQC is a key activity to determine fit-for-purpose samples [17]. Some mines do not apply QAQC to grade control samples as they are not included in resource estimates; however, this attitude is generally flawed, given that ore/waste decisions are based on the samples. Where grade control samples inform a resource estimate, then QAQC is an absolute.
Protocols should be set up to cover field collection, laboratory preparation, and analysis (Table 21). During grade control, QAQC should include field duplicates and certified reference material (CRM) submission (e.g., minimum three CRMs at a range of grades including blanks). Laboratory QAQC will include internal CRMs, pulp duplicates, umpire sample submission, pulp screen tests, and contamination tests. In particular, duplicate field samples provide a measure of variability of the entire sampling process.
Documentation of sample collection and laboratory activities is an important part of QAQC, and staff training and monitoring. It is the opinion of the authors that quality samples flow from well-trained and experienced personnel. Operations should ensure that all grade control staff are trained in sampling and during their first few months have adequate mentoring. This will be additional to all standard operational and safety training. Proper training will be facilitated by well-written and illustrated documentation. Training and mentoring should be linked to continuous quality improvement, where protocols are internally and externally audited at least annually. On-going supervision and periodic re-training are recommended, where activities must be practical-based at the rock face and not simply in the classroom.
8.2. Chain of Custody
Chain of custody (COC) procedures are particularly relevant if samples inform a resource estimate. Chain of custody must provide a documented, legally defensible record of the custody of samples from collection through analysis [35]. A sample is considered to be in custody if it meets at least one of the following conditions, where the sample is: in someone’s physical possession or view, secured to prevent tampering, or secured in an area restricted to authorised personnel.
Chain of custody procedures in the underground environment are more difficult than for surface-based activities. The greatest risk of sample tampering is during collection, and prior to the sealing of sample bag(s) or core trays. At the mine face, samples should be bagged and sealed with a wire tie. Drill core trays can be covered with a metal lid and strapped. Samples and trays should be returned to surface as quickly as possible via the most efficient means.
A sample or core record sheet can be used as a COC document to track sample progress from face/rig, to core shed and laboratory. Face, grab, or core samples will need to be securely transported to the laboratory, which may be either onsite or offsite. In either case, the COC document can be used to track progress and record handovers. Where samples have a journey to an offsite laboratory, then transport should be secure.
8.3. Errors along the Sampling Value Chain
The results of duplicate sampling programmes document the magnitude of errors across the sampling value chain (Table 1, Table 2, Table 3 and Table 4). These generally show that a large component of the total error is introduced during sample collection. As a result, undertaking excessive efforts to reduce errors during preparation and analysis will not always result in a substantive error reduction. In contrast, the collection of larger high-quality field samples will result in error reduction providing that protocols are optimised appropriately.
Test work from a narrow vein deposit exemplifies the impact of sampling error through the comparison of chip and channel samples (Table 22). Seventy-five sample triplicates (chip, hand-cut channel, and saw-cut channel) were collected from around a 40 m by 20 m stope block. The block was sampled from faces located every 1.5 m along its upper and lower drives and two raises. After cleaning, a reference line was drawn across each face centre and the samples collected from the bottom up; chip sample (7 cm wide by 1.5 cm deep), hand-cut and then saw-cut channels (4.5 cm wide by 2.5 cm deep). The sample delimitation dimensions were designed to achieve a theoretical sample support of 3 kg/m. The mineralisation was known to have a moderate variability, containing visible gold to 1.5 mm in size. In the test area, the vein was near vertical and its width relatively consistent, ranging from 0.8 m to 1.2 m. Only the vein was sampled. All samples were prepared and assayed in the same way, via a total sample preparation and screen fire assay route. The FSE for the protocol was effectively zero. A QAQC programme was applied, with all CRMs and blanks within expectation.
The results show a marked reduction in RSV and nugget effect between the three sample sets (Table 22). The rigorous laboratory protocol and QAQC indicate that errors within the laboratory were at a minimum. Therefore, the remaining variability relates to the geological nugget effect and sample collection. The dominant error for the channel samples relates to the geological nugget effect, given that sampling error was minimal. The dominant difference between the chip and saw-cut channel samples relates to sampling error. The results corroborate previous findings, showing that saw-cut channel samples provide the best sample quality.
Duplicate sample analysis across the sampling and laboratory process allows errors to be apportioned to each phase of activity [34,41]. Dominy [42] reports test work from a moderate coarse gold-bearing (d95Au: 750 µm) vein system. A series of fifty non-contiguous underground faces were sampled via chip, hand-cut channel, and saw-cut channel samples. A field duplicate was taken for each, and at the laboratory coarse and pulp duplicates were taken (Table 23). The results demonstrate the dominance of sample collection error and higher chip sample error compared to the channel samples (e.g., reduced DE and EE). The high preparation error most likely represents liberated coarse gold present in the crushed material. The analytical error is at the high end of acceptable, reflecting some remnant heterogeneity from the coarse gold. The total error could be reduced to around 23% by putting the entire saw-cut sample through a LeachWELL assay.
There a need to move towards the quantification of errors, where a first step is the application of the RSV as defined in DS3077 [38]. Resolution of individual relative errors across sampling, preparation, and analysis can be gained from duplicate sample pairs (Table 23 and Table 24). From a spatial perspective, variography provides a method to determine the relative proportion of in-situ/geological versus sampling nugget effect based on duplicate field pairs.
9. Integration into the Mining Process
9.1. Mining Method and Grade Control
Grade control sampling strategy is related to mining method, which broadly relates to ore body width and dip, and rock mass properties (Table 6 and Table 7). Mining methods are described as being either entry or non-entry, where entry methods allow access to the stope and non-entry methods do not.
Entry methods such as shrinkage and cut-and-fill stoping offer opportunities for on-going sampling during production. However, such methods are inherently more risky from a safety perspective, and require careful risk assessment and planning before undertaking in-stope grade control activities. These are well-suited to complex narrow (<3 m) mineralised systems that require strong geological control to achieve some selectivity and flexibility. On-going sampling and mapping allows monitoring of grade, placement of pillars, and reaction to changes in ore zone orientation. Where strong mining selectivity is required, the effects of high sampling error can be particularly severe leading to ore/waste misclassification.
Non-entry methods such as long-hole stoping and sub-level caving can only be sampled in development drives and sub-levels, and potentially slot raises. They are therefore relatively safe from a grade control perspective, as humans do not enter stopes. The methods are suited to wide structures where geological control may be less critical and bulk extraction appropriate. In mass mining operations, such as those using sub-level caving, grade control is reliant on grab sampling.
The best approach for optimal mine design is to use diamond drilling at an appropriate spacing in advance of development. This will tend to be the case in larger operations employing non-entry methods. Smaller, often narrow vein operations with a small resource base will be more reliant on definition of stope blocks by linear sampling methods. For these mines, the decision as to what will be mined has effectively already been made. A retrospective decision to process a development round can only be made if it has been stockpiled separately. Small mines generally require selective mining, therefore optimal sampling and integration with mapping becomes critical. A low-grade stockpile is recommended to ensure that misclassified ore can be recovered, even if at the end of the mine life [13,14,65].
An asset of the geologist is the ability to work and communicate with mining crew(s). Communication needs to provide a rationale for good samples, why poor samples are problematic and provide an explanation for the methods used. There are often excuses the geologist does not have enough time at the face because the miners do not want them there. There is some truth in this, though a good working relationship with crews will pay dividends. In particular, if a crew understands why a geologist is mapping and sampling a face, then their attitude is more likely to be a positive one. A progressive operation will include grade control familiarisation in its induction and training programme.
9.2. Safety Aspects of Grade Control
Of overwhelming importance is the consideration of safety in the sampling of stopes, drives, crosscuts, and raises. A primary consideration is rock mass conditions and the need for support systems such as mesh, bolts, and/or shotcrete. Under no circumstances should samplers work under unsupported ground unless a clear case for no support is in place. Before any rock face is sampled, it should be reviewed by a competent person and scaled if necessary.
Some mines have already removed face sampling from the routine and replaced it by either grab sampling or more drilling. Grab sampling is generally not an optimal alternative, though depending upon mineralisation type could be appropriate. Drilling is a costlier option (e.g., diamond core, RC, or sludge), though should be considered in the light of better local grade estimation and short-term planning. In all cases, geological information can be collected back from faces via visual (mapping and photography) or automated methods [48].
9.3. Grade Estimation
A grade control programme may produce a number of different sample types, typically linear samples (e.g., channel) and diamond core samples. These have inherent differences in sample quality, spatial distribution (e.g., linear samples close-spaced along drives versus a regular wide-spaced drill grid), sample support (e.g., 2 kg/m chip samples versus 8.7 kg/m HQ core), and potentially assay methods. Bias between different sample types can be investigated via statistical (e.g., graphically and numerically) and spatial (variogram) analysis. If it is identified, there are options available to the estimator, including removal of the less reliable data or factoring one of the datasets if a consistent relationship can be defined and explained.
Grade control samples generally result in grade populations that have large numbers of low-grade assays, long tails, and high skewness. Linear, particularly chip or chip-channel samples may be imprecise and biased, and display variability when compared to drill samples. Their usage must be driven by analysis and understanding of limitations. Underground mines generally collect samples in a “block out” approach, essentially along 2, 3, or 4 sides of a stope panel. Block models should encompass as much sample data as possible to inform a kriged estimate. Local estimates will generally show better reconciliation with mining when based on quality drill samples at an appropriate spacing.
Recognising that linear samples may input into the short- to medium-term mine plan, it is important that the practitioner consider all aspects of the programme. Key issues are the sampling method(s) used (e.g., linear and/or drilling), sub-sampling techniques and sample preparation, assay method, QAQC application and compliance, data spacing and distribution, and orientation of data in relation to geological controls. Based on these and potentially other considerations, the practitioner can apply an appropriate resource classification to provide a measure of this risk in the estimate (e.g., Inferred, Indicated and Measured Mineral Resources) [9]. For example, in a high-nugget deposit where multiple high-quality samples have been collected around a series of stope blocks, the classification may only be Inferred, whereas exactly the same scenario in a low-nugget deposit may yield a Measured resource. As the nugget effect increases, local estimation becomes more difficult, and thus reconciliation becomes potentially poorer on a short-term basis [14]. Many high- to extreme-nugget effect ore bodies will operate solely on Inferred Mineral Resources, though this is dependent upon the data spacing available [14,54]. Moderate- to low-nugget effect ore bodies will generally define at least Indicated Mineral Resources with Probable Ore Reserves [66].
9.4. Reconciliation
The ultimate challenge of any mine is that of achieving acceptable reconciliation between the long-term reserves and short-term grade control model with actual plant performance. In many gold mines, the reserve estimate overstates the achieved grade. Whilst reconciliation problems can be related to estimation approach and/or mining, there are often underlying reasons related to sampling error particularly bias (e.g., in-stope sample discard or soft reef bias: refer Section 3.3) and incompatible datasets (e.g., mixing drillhole and channel sample results).
In higher nugget mineralisation, reconciliation over short periods of time (e.g., month by month) will generally be difficult as variability may be ±50% or more [14]. Thus, longer periods of time are likely to show more acceptable results (e.g., ±20% over three months). Operators should avoid knee-jerk reactions such as altering cut-off grades or blending strategies based on one or two months of poor reconciliation. Viewing a resource/reserve estimate as an “estimate” is important and operators should understand the likely tolerances of grade and tonnage figures. In particular, they should understand the sampling process and its effect on estimates and decision making.
9.5. Sampling Historical Mine Workings
Grade control sampling methods are also applied in the re-evaluation of historical mine workings and may be used to support a resource estimate. Samples can be collected from the backs, faces, and sidewalls of drives, crosscuts, raises, and stope pillars. In some cases, samples will also be collected from drive and/or stope floors where broken material needs to be checked for potential gold content. Care is required when accessing historical mine workings, particularly in terms of rock stability, air quality, and open voids.
Methods are no different to operating mines, though there is often a focus on backs or sidewall sampling given that faces are already extracted. This imposes some working at height issues depending on drive size. Backs sampling is usually dominated by chip-channel samples given that it is difficult to collect a sample from an uneven surface above head level (Figure 9). This leads to a potentially large DE and EE. A tarpaulin placed on the floor immediately below the sample point generally provides a practical solution to catching as much chipped/cut material as possible.
In some cases, legacy grade control data may be available. This will require upcycling via validation (e.g., re-sampling/assaying), integration with modern data (e.g., new mapping and/or other geochemical data), and interpretation/modelling. New samples may be used to validate legacy data and support a resource estimate, in which case QAQC and COC protocols will need to be in place.
10. Future of Grade Control
10.1. Making Efficiency Gains
The ultimate grade control programme will have all work at the face automated, thus eliminating the need for humans to be in contact with the rock face. Automated mapping capability already exits through such systems as Sirovision [48].
Sensor-based technology hosted on mining equipment and/or conveyor belts has the potential to assist in this matter [67,68]. Kurth [68] reports the application of the Geoscan system which uses prompt gramma neutron activation analysis (PGNAA) to determine the grade of crushed material on a conveyor belt. Analysis can be undertaken over time periods potentially representing between 10 t and 40 t of feed which can then be diverted into high- and low-grade stockpiles (e.g., a bulk ore sorting process). At the current time, gold grade cannot be directly determined via PGNAA though its correlation with other elements (e.g., Cu and/or S) can enable a grade to be estimated. Such technology has the potential to improve the grade control process and also to feed into geometallurgical-based ore control.
Hand-held X-ray fluorescence has already been used in some base metal mines for the determination of grade at the face; however, it has yet to be applied successfully in precious metal mines. Laser-induced breakdown spectroscopy (LIBS) has been slated as a potential contributor, though its application within the mining industry is still at an early stage [69].
An automated and potentially robotic approach to sample collection that results in high-quality face samples under geological control would be a key gain. This would ensure that geologists do not have to access the face directly and ensuring sample collection is consistent and safe. The authors are aware of various attempts to mechanise face sampling, but none that have been commercialised to date. One observed by the primary author (S.D.) in the late 1990s, involved a grinding head mounted on a hydraulic boom that was pulled across the face to excavate a relatively consistent channel. A rubber cuttings catcher device was mounted below the cutter head. At the time, the grinding head appeared to work relatively well, though further work was required to improve sample collection. It is unknown how the trials progressed.
Recent advances in gamma activation analysis (PhotonAssay) provides for faster laboratory assay requiring less preparation and an assay mass of around 0.5 kg. Tickner et al. [70] report a sample throughput of 20–80 per hour and samples presented as either crushed rock or pulps.
The digital mine is high on the agenda of many companies [67]. From a grade control perspective, assay data can feed into the digital realm and can be interfaced with digital photographs, outputs from automated mapping, and surveys. Once into the digital platform, artificial intelligence may then allow direct feed into development control and design, and grade models. Data analytics will play a role in analysing grade and other data to produce more effective and agile short-term mine plans, potentially real-time information, and lead to automated reconciliation. Sensors in drill holes, at the mine face and in the plant, will be critical for this development.
10.2. Ore Control versus Grade Control
Grade control has a traditional focus on measuring and controlling grade outputs from the mine. Ore control has the same aim, though provides a wider scope across grade, metallurgical, and geoenvironmental parameters. It is a key activity of operational (or tactical) geometallurgy, which is essentially a mine optimisation process. Geometallurgy seeks to resolve grade, metallurgical, and mining variability based on information such as geochemistry, mineralogy, grade, and lithology obtained from spatially distributed samples or measurement points. Key parameters that can be obtained from ore (grade) control activities include metallurgical recovery, comminution, and geochemistry, which are fed into the short-term block model. Grade control samples can potentially be utilised to collect geometallurgical data during mining (Table 25). Ore control links with the digital mine through a data-rich environment that produces real-time information, agile short-term mine plans, and automated reconciliation.
11. Public Reporting of Grade Control Sampling
The public reporting of grade control results is as important as resource drilling results when they contribute to a resource estimate. The JORC Code 2012 has global application for the reporting of exploration results, resources, and reserves [9]. It requires the Competent Person(s) to provide commentary on the sampling and assaying process. When it comes to sample representativity, it is not unusual for a public release or report to simply state: “the sampling and assaying programme has been extensive, where representative samples were collected” or “the samples were deemed to be representative” with little or no justification.
The JORC Code 2012 (Table 1 Section 1 (Sampling techniques and data)) [9] is aimed at the geologist and subsequent resource model (if appropriate), even if it is based on grade control samples. It covers disclosure on key matters such as: sampling techniques; sub-sampling techniques and sample preparation; quality of assay and laboratory tests; verification sampling and assaying; location of data points; data spacing and distribution; sample security; and audits or reviews.
Sampling and assaying protocols can be written in the framework of DS3077 [38] to provide an auditable trail. Protocols can be summarised in the general format of Table 26 to provide an assessment programme quality. Even if a resource estimate based on grade control samples is not publicly reported, it is best practice to report at least internally using The JORC Code 2012 Table 1 framework [9].
12. Planning and Implementing a Grade Control Programme
Acceptance of programme value by management will be critical and requires the business case and deliverables to be promoted early on. Recommendations to plan and implement a new or improved underground grade control sampling programme are provided in Table 27.
A five stage approach is recommended starting with (1) scoping; moving to (2) development through to (3) execution; (4) validation; and (5) refinement. Beyond establishing the business case and aims of the grade control programme, a major precursor is the gold characterisation study that focusses on the evaluation of gold particle size and distribution. It is important to understand the mineralisation and controls to gold distribution through evaluation of geology, ore body shape and architecture, and grade distribution. Some mineralisation styles are more forgiving than others given their sampling characteristics (Figure 10).
Characterisation leads to development of the sampling strategy and selection of sampling methods. Each method has relative positives and negatives, which should be considered during scoping (Table 28). Early in the planning process (Stage 2), there may be minimal actual sample data available, particularly duplicates. In this case, supported by characterisation results, the model-based FSE equation (Equation (1)) can be applied to evaluate sampling protocols. As the programme develops, then duplicate samples permit an empirical approach to the estimation of error.
The execution stage focusses on ensuring that staff are properly equipped and trained, with the emphasis on reducing sampling errors and increasing sample quality. Validation and refinement follows, led by QAQC analysis.
The investment required to design an underground grade control sampling programme is variable and dependent upon the type of mineralisation and size of operation. Indicative costs for a characterisation study are US $50–150 K per domain, though much of the data can often be gained from and/or shared with metallurgical programmes [6,7]. Characterisation is required during project evaluation or during production when new ore bodies and/or ore types are encountered. On-going grade control sampling costs relate to mineralisation type and mining method. For a small operation (e.g., 100,000 t per annum) an annual cost may be in the region of US $0.3–0.5 M, whereas for a much larger operation (e.g., 1 Mt per annum) more likely US $1.5–2.0 M or more per annum. These indicative figures include the cost of sample collection, sample preparation and assaying, staffing and consumables, but do not include drilling costs.
13. Conclusions
- (1)
- Practitioners can be justifiably critical of linear and grab sampling methods, given their potential for poor precision and high bias. However, they have a role to play in underground grade control, depending on their ultimate use and effort put into making them representative. Maintaining representative samples is advantageous; however, there will always have to be a balance between what is theoretical, practical, and safe. It is important to understand what decisions the sample data will be used for and the inherent risks involved both in collection and decision-making. Critical end-member applications are (a) to support a reserve estimate for short-term mine planning, or (b) as ”indicators” to map grade trends and/or deportment along development and in specific geological domains.
- (2)
- A range of sampling methods are available, all of which require evaluation before routine acceptance. The greatest error is generally introduced during sample collection (e.g., DE and EE). A cost-effective way to reduce sample collection error involves staff training in TOS and correct collection methods. Whilst correctly collected channel samples are of a higher quality than chip samples, chip samples will continue to have importance given their relative ease of collection. A reduction in the need for linear samples will only come from innovation or the use of more pre-development drilling at a spacing to allow local estimation.
- (3)
- Where grade control samples support a reserve estimate, a QAQC programme must be introduced to ensure on-going quality of sampling and assaying. Written protocols and procedures, periodic auditing of protocols and people, and training are required. DS3077 provides a framework on which to compile transparent protocols [38].
- (4)
- Sample protocol optimisation is best undertaken at the breakeven cut-off grade given that it is the ore/waste decision point. An optimised sampling programme will never be perfect and as a result, ore/waste misclassification will occur particularly where the nugget effect is high; thus a low-grade stockpile is recommended. Many small mines do not have drilling, therefore the most practical and representative linear samples are required.
- (5)
- Samples feed into reserve and grade control models that are reconciled with plant performance. All errors along the sampling value chain are additive and impart data variability making estimation less reliable. Errors should be evaluated by empirical means to quantify their impact on the estimation and decision making process. Where sets of mixed data such as channel and drill core samples are used for estimation, it is important to ensure that any bias between the samples is identified and acted upon if appropriate.
- (6)
- The human impact on sampling is great, given that the operating environment is generally unforgiving and hazardous. The sampling process is a physical one and often carried out by relatively junior and inexperienced staff. Team training is critical to improve sample quality and representativity.
- (7)
- Geologists must appreciate the rigors of the TOS and also understand the needs of production. The “ideal” is advantageous, but not always practical. However, where the ideal becomes impractical, the potential effects of the non-ideal on the decision making process must be understood. Management and technical staff should be educated to ‘sample better’ throughout the mine value chain.
- (8)
- In some cases, the application of grade control samples is an exercise in futility. This usually reflects extreme-nugget effect coarse-gold mineralisation. Challenges are particularly exacerbated when grades are low (<5 g/t Au) and/or where the dominant gold particle size is >1 mm or clusters. In these cases, the best option is likely to be bulk (or mini-bulk) sampling and strong geological control during mining.
- (9)
- In context of other mineral deposits, particularly those of base metals, the application of TOS and its error evaluation is relevant. Additionally, use of the FSE equation is also relevant, though the original FSE equation is usually applied in this case. The challenges of applying the various sample types are the same. QAQC is required, particularly when samples feed into a resource estimate.
- (10)
- Company management in their pursuit to reduce costs, often reduce grade control expenditure with no consideration of the impact on the quality of samples and decisions made thereon. Persuading managers to spend the money to rectify the problems, even when they are clearly identified, can be challenging.
Author Contributions
S.C.D. conceived the paper. S.C.D., H.J.G., and L.O. analysed the numerical data presented. C.K.L. and S.P. reviewed publically available reports to assess industry practice. R.C.A.M. contributed his expertise from the South African gold mines. All authors contributed to the writing and editing of the paper.
Acknowledgments
The authors acknowledge a number of current and former mining companies across Australia, Africa, East Asia, Europe, and the Americas for the opportunity to input into grade control programmes. S.C.D. acknowledges discussions with the late Allan (Bon) Royle and Alwyn Annels on many aspects of mine sampling. R.C.A.M. acknowledges extensive support from the South African gold mining industry. Thanks are due to the Minerals reviewers for helpful comments on the manuscript.
Conflicts of Interest
The authors declare no conflict of interest.
References
- Pitard, F.F. Pierre Gy’s Sampling Theory and Sampling Practice; CRC Press: Boca Raton, FL, USA, 1993; p. 488. [Google Scholar]
- Glass, H.J.; Zegers, T.W. Statistical aspects of sampling particulate matter. In Proceedings of the Surface Mining Conference, Johannesburg, South Africa, 30 September–4 October 1996; Southern African Institute of Mining and Metallurgy: Johannesburg, South Africa, 1996; pp. 157–164. [Google Scholar]
- Minnitt, R.C.A. Sampling: The impact on costs and decision making. J. South. Afr. Inst. Min. Metall. 2007, 107, 451–462. [Google Scholar]
- Dominy, S.C. Importance of good sampling practice throughout the gold mine value chain. Min. Technol. 2016, 125, 129–141. [Google Scholar] [CrossRef]
- Holmes, R.J. Sampling procedures. In Advances in Gold Ore Processing; Elsevier: Amsterdam, The Netherlands, 2016; pp. 45–56. [Google Scholar]
- Dominy, S.C.; O’Connor, L.; Glass, H.J.; Purevgerel, S.; Xie, Y. Towards representative metallurgical sampling and recovery testwork programmes. Minerals 2018, 8, 193. [Google Scholar] [CrossRef]
- Dominy, S.C.; O’Connor, L.; Glass, H.J.; Xie, Y. Geometallurgical study of a gravity recoverable gold orebody. Minerals 2018, 8, 186. [Google Scholar] [CrossRef]
- Carrasco, P.C.; Carrasco, P.; Jara, E. The economic impact of incorrect sampling and analysis practices in the copper mining industry. Chemom. Intell. Lab. Syst. 2004, 74, 209–214. [Google Scholar] [CrossRef]
- Joint Ore Reserves Committee (JORC). Australasian Code for Reporting of Exploration Results, Mineral Resources and Ore Reserves—The JORC Code; Joint Ore Reserves Committee of the Australasian Institute of Mining and Metallurgy, Australian Institute of Geoscientists and Minerals Council of Australia: Melbourne, Australia, 2012; p. 44. [Google Scholar]
- Gy, P.M. Sampling of Particulate Materials: Theory and Practice; Elsevier: Amsterdam, The Netherlands, 1982; p. 431. [Google Scholar]
- Storrar, C.D. Underground sampling with special reference to gold reefs. In South African Mine Valuation; Southern African Institute of Mining and Metallurgy: Johannesburg, South Africa, 1981; pp. 36–63. [Google Scholar]
- Dominy, S.C.; Platten, I.M.; Fraser, R.M.; Dahl, O.; Collier, J.B. Grade control in underground gold vein operations: The role of geological mapping and sampling. In Proceedings of the International Mining Geology Conference, Perth, Australia, 17–19 August 2009; Australasian Institute of Mining and Metallurgy: Melbourne, Australia, 2009; pp. 291–307. [Google Scholar]
- Pitard, F.F. The in-situ nugget effect: A major component of the random term of a variogram. In Proceedings of the World Conference on Sampling and Blending, Porto Alegre, Brazil, 23–25 October 2007; Fundacao Luiz Englert: Porto Alegre, Brazil, 2007; pp. 91–110. [Google Scholar]
- Dominy, S.C. Predicting the unpredictable—Evaluating high-nugget effect gold deposits. In Mineral Resource and Ore Reserve Estimation; Australasian Institute of Mining and Metallurgy: Melbourne, Australia, 2014; pp. 659–678. [Google Scholar]
- Dominy, S.C.; Xie, Y.; Platten, I.M. Gold particle characteristics in narrow vein deposits: Implications for evaluation and metallurgy. In Proceedings of the Narrow Vein Mining Conference, Ballarat, Australia, 14–15 October 2008; Australasian Institute of Mining and Metallurgy: Melbourne, Australia, 2008; pp. 91–104. [Google Scholar]
- Dominy, S.C.; Platten, I.M. Clustering of gold particles and implications for sampling. Appl. Earth Sci. 2007, 116, 130–142. [Google Scholar] [CrossRef]
- Lyman, G.J.; Robertson, I.G.; Day, T. The simple facts about sampling gold ores. In Proceedings of the Mill Operators Conference, Perth, Australia, 10–12 October 2016; Australasian Institute of Mining and Metallurgy: Melbourne, Australia, 2016; pp. 159–172. [Google Scholar]
- François-Bongarçon, D.M. A brief history of Pierre Gy’s sampling theory and current trends in its acceptance in the mining world. In Proceedings of the Sampling Conference, Perth, Australia, 27–29 May 2008; Australasian Institute of Mining and Metallurgy: Melbourne, Australia, 2008; pp. 13–14. [Google Scholar]
- Freese, B.; Flitton, T.; Pillay, A. Quality control and assurance of underground chip sampling at Kopanang Mine, South Africa. In Proceedings of the Sampling and Analysis Conference, Muldersdrift, South Africa, 4–6 June 2013; Southern African Institute of Mining and Metallurgy: Johannesburg, South Africa, 2013; pp. 277–278. [Google Scholar]
- Fourie, D.; Minnitt, R.C.A. The simulated chip-sample model as a method for qualifying error and bias in sampling thin carboniferous reef types. J. South. Afr. Inst. Min. Metall. 2014, 114, 19–30. [Google Scholar]
- Fourie, D.; Minnitt, R.C.A. Review of gold reef sampling and its impact on the mine call factor. J. South. Afr. Inst. Min. Metall. 2016, 116, 1001–1009. [Google Scholar] [CrossRef]
- François-Bongarçon, D.M.; Gy, P.M. The most common error in applying Gy’s formula in the theory of mineral sampling and the history of the Liberation factor. J. South. Afr. Inst. Min. Metall. 2002, 102, 475–479. [Google Scholar]
- Pitard, F.F. Pierre Gy’s Theory of Sampling and Ingamells Poisson Process Approach: Pathways to Representative Sampling and Appropriate Industry Standards; Aalborg University: Esbjerg, Denmark, 2009; p. 309. [Google Scholar]
- Royle, A.G. Splitting gold assay pulps containing coarse gold. J. Leeds Univ. Min. Assoc. 1989, 89, 63–68. [Google Scholar]
- Minnitt, R.C.A.; Assibey-Bonsu, W. A comparison between the duplicate series method and the heterogeneity test as methods for calculating the sampling constants. J. South. Afr. Inst. Min. Metall. 2010, 110, 251–268. [Google Scholar]
- Minnitt, R.C.A. Calibrating K and Alpha in Gy’s formula: A new approach. Math. Geosci. 2016, 48, 211–232. [Google Scholar] [CrossRef]
- Dominy, S.C.; Xie, Y. Optimising sampling protocols via the heterogeneity test: Challenges in coarse gold mineralisation. Min. Technol. 2016, 125, 103–113. [Google Scholar] [CrossRef]
- Dominy, S.C.; Platten, I.M.; Xie, Y.; Minnitt, R.C.A. Underground grade control protocol design: Case study from the Liphichi gold project, Larecaja, Bolivia. Appl. Earth Sci. 2011, 119, 205–219. [Google Scholar] [CrossRef]
- Cintra, E.C.; Scabora, J.A.; Viegas, E.P.; Barata, R.; Maia, G.F. Coarse gold sampling at Sao Francisco mine, Brazil. In Proceedings of the World Conference on Sampling and Blending, Porto Alegre, Brazil, 23–25 October 2007; Fundacao Luiz Englert: Porto Alegre, Brazil, 2007; pp. 187–197. [Google Scholar]
- Gonzalez, P.; Cossio, S. A review of sampling protocol for a gold ore based on liberation study. In Proceedings of the World Conference on Sampling and Blending, Porto Alegre, Brazil, 23–25 October 2007; Fundacao Luiz Englert: Porto Alegre, Brazil, 2007; pp. 163–174. [Google Scholar]
- François-Bongarçon, D.M. Extensions to the demonstration of Gy’s formula. Explor. Min. Geol. 1998, 7, 149–154. [Google Scholar]
- Dominy, S.C.; Petersen, J.S. Sampling coarse gold-bearing mineralisation-developing effective protocols and a case study from the Nalunaq mine, Southern Greenland. In Proceedings of the World Conference on Sampling and Blending, Sunshine Coast, Australia, 10–12 May 2005; Australasian Institute of Mining and Metallurgy: Melbourne, Australia, 2005; pp. 151–165. [Google Scholar]
- Fallon, M.; Rowley, M.; Du Plessis, E.; Golenya, F.; Robertson, I.; Swanson, R. Confirming the sampling, sample preparation and assaying protocols at two Yilgarn gold deposits. In Proceedings of the Sampling Conference, Perth, Australia, 21–22 August 2012; Australasian Institute of Mining and Metallurgy: Melbourne, Australia, 2012; pp. 47–62. [Google Scholar]
- Stanley, C.R.; Smee, B.W. Strategies for reducing sampling errors in exploration and resource definition drilling programmes for gold deposits. Geochem. Explor. Environ. Anal. 2007, 7, 329–340. [Google Scholar] [CrossRef]
- Simon, A.; Gosson, G. Considerations on quality assurance/quality control and sample security. In Proceedings of the Sampling Conference, Perth, Australia, 27–29 May 2008; Australasian Institute of Mining and Metallurgy: Melbourne, Australia, 2008; pp. 135–140. [Google Scholar]
- François-Bongarçon, D.M. Theory of sampling and geostatistics: An intimate link. Chemom. Intell. Lab. Syst. 2004, 74, 143–148. [Google Scholar] [CrossRef]
- Pitard, F.F. Guidelines for acceptable allotted sampling uncertainty. In Proceedings of the World Conference on Sampling and Blending, Lima, Peru, 19–22 November 2013; Gecamin: Santiago, Chile, 2013; pp. 89–98. [Google Scholar]
- DS3077. Representative Sampling–Horizontal Standard; Danish Standards Foundation: Copenhagen, Denmark, 2013; p. 41. [Google Scholar]
- Carswell, J.T.; Yulia, K.; Lesmana, D.; Steamy, K. Grade control sampling quality assurance/quality control in a high-grade gold mine—Gosowong, Indonesia. In Proceedings of the International Mining Geology Conference, Perth, Australia, 17–19 August 2009; Australasian Institute of Mining and Metallurgy: Melbourne, Australia, 2009; pp. 285–290. [Google Scholar]
- Sims, D.A.; Benton, R. Life on the Rollercoaster—Mining and milling the Kencana K1 orebody, Indonesia. In Proceedings of the International Mining Geology Conference, Perth, Australia, 17–19 August 2009; Australasian Institute of Mining and Metallurgy: Melbourne, Australia, 2009; pp. 319–327. [Google Scholar]
- Stanley, C.R.; Lawrie, D. Average relative error in geochemical determinations: clarification, calculation and a plea for consistency. Explor. Min. Geol. 2007, 16, 267–275. [Google Scholar] [CrossRef]
- Dominy, S.C. Sampling and Evaluation of Vein Gold Deposits; Final Technical Report for DevR-MIDAS Project; University of Greenwich: Chatham, UK; Welsh Gold PLC: Dolgellau, UK, September 1998; p. 230. [Google Scholar]
- François-Bongarçon, D.M. Fishy samples: How big a sample to avoid the infamous Poisson effect. In Proceedings of the World Conference on Sampling and Blending, Cape Town, South Africa, 21–23 October 2009; Southern African Institute of Mining and Metallurgy: Johannesburg, South Africa, 2009; pp. 43–46. [Google Scholar]
- Gouws, J. The use of diamond saws in underground sampling at Randfontein Estates Gold Mining Company, Witwatersrand. J. Inst. Mine Surv. S. Afr. 1986, 23, 85–97. [Google Scholar]
- Magri, E.J.; McKenna, A.P. A geostatistical study of diamond saw sampling versus chip sampling. J. South. Afr. Inst. Min. Metall. 1986, 86, 335–347. [Google Scholar]
- Potter, D.; Sheriff, C.; Collins, P. Significance of geological control on assay data in the narrow, high-grade gold quartz veins at the Sand Queen mine, Comet Vale, Western Australia. In Proceedings of the Narrow Vein Mining Conference, Ballarat, Australia, 14–15 October 2008; Australasian Institute of Mining and Metallurgy: Melbourne, Australia, 2008; pp. 71–78. [Google Scholar]
- Rowland, R.S.; Sichel, H.S. Statistical quality control of routine underground sampling. J. South. Afr. Inst. Min. Metall. 1960, 60, 251–284. [Google Scholar]
- Van Der Merwe, H.C. Sirovision: A proposed solution for the implementation of a digital geological mapping system at AngloGold Ashanti’s Moab Khotsong mine. In Proceedings of the World Gold Conference, Misty Hills, South Africa, 26–30 October 2009; Southern African Institute of Mining and Metallurgy: Johannesburg, South Africa, 2009; pp. 183–191. [Google Scholar]
- Lerm, C. Evaluation of chip sampling vs the gold analyser. J. Inst. Mine. Surv. S. Afr. 1994, 27, 77–87. [Google Scholar]
- Cawood, F.T. Underground face sampling on narrow reefs—Sampling practice and its impact on the mine call factor on Witwatersrand gold mines. J. Inst. Mine Surv. S. Afr. 2003, 31, 202–224. [Google Scholar]
- Dominy, S.C. Grab sampling for underground gold mine grade control. J. South. Afr. Inst. Min. Metall. 2010, 110, 277–287. [Google Scholar]
- Ross, I.T. Sampling in block cave mines. In Proceedings of the Sampling Conference, Perth, Australia, 21–22 August 2012; Australasian Institute of Mining and Metallurgy: Melbourne, Australia, 2012; pp. 81–85. [Google Scholar]
- Arslan, N.; Ozkayhan, M. Diamond drilling at Efemcukuru gold mine, Turkey—A case study on the benefits of timely and cost-effective drilling to short-term planning. In Proceedings of the International Mining Geology Conference, Hobart, Australia, 20–22 September 2017; Australasian Institute of Mining and Metallurgy: Melbourne, Australia, 2017; pp. 285–290. [Google Scholar]
- Dominy, S.C. Sampling coarse gold-bearing mineralisation-developing effective protocols and a case study from the Ballarat mine, Australia. In Proceedings of the World Conference on Sampling and Blending, Perth, Australia, 9–11 May 2017; Australasian Institute of Mining and Metallurgy: Melbourne, Australia, 2017; pp. 3–19. [Google Scholar]
- McBeath, R.; Whitworth, D. What drilling density is optimal—A case study from the Golden Pig mine. In Proceedings of the Underground Operators Conference, Townsville, Australia, 29–31 July 2002; Australasian Institute of Mining and Metallurgy: Melbourne, Australia, 2002; pp. 33–37. [Google Scholar]
- Clark, F.; Carswell, J.T. Using reverse circulation drilling to improve sampling in a complex underground gold operation, Sunrise Dam mine, Western Australia. In Proceedings of the International Mining Geology Conference, Adelaide, Australia, 18–20 August 2014; Australasian Institute of Mining and Metallurgy: Melbourne, Australia, 2014; pp. 143–152. [Google Scholar]
- Prouhet, J.-P. A quick method of sampling development headings. In Proceedings of the Ore Reserve Estimation and Grade Control Conference, Ville d’Esterel, QC, Canada, 25–27 September 1967; CIM: Montreal, QC, Canada, 1968; pp. 97–102. [Google Scholar]
- Ovalle, A.; Magri, E.; Zuniga, P.; Pitard, F.F. Sampdrill. Quant. Geol. Geostat. 1997, 8, 767–779. [Google Scholar]
- Johansen, G.F.; Dominy, S.C. Development of sampling and assaying protocols at the new Bendigo gold project, Victoria, Australia. In Proceedings of the World Conference on Sampling and Blending, Sunshine Coast, Australia, 10–12 May 2005; Australasian Institute of Mining and Metallurgy: Melbourne, Australia, 2005; pp. 175–183. [Google Scholar]
- Roberts, L.S.; Dominy, S.C.; Nugus, M.J. Problems of sampling and assaying in lode-gold deposits—Case studies from Australia and north America. In Proceedings of the International Mining Geology Conference, Bendigo, Australia, 17–19 November 2003; Australasian Institute of Mining and Metallurgy: Melbourne, Australia, 2004; pp. 387–400. [Google Scholar]
- Dominy, S.C. Effects of sample mass on gravity recoverable gold test results in low grade ores. Appl. Earth Sci. 2014, 123, 234–242. [Google Scholar] [CrossRef]
- Dominy, S.C.; Annels, A.E.; Johansen, G.F.; Cuffley, B.W. General considerations of sampling and assaying in a coarse gold environment. Appl. Earth Sci. 2000, 109, 145–167. [Google Scholar] [CrossRef]
- Hutchison, R. Geology and definition of the Wattle Dam coarse gold deposit. In Proceedings of the Gravity Gold Conference, Ballarat, Australia, 21–22 September 2010; Australasian Institute of Mining and Metallurgy: Melbourne, Australia, 2010; pp. 109–118. [Google Scholar]
- Elder, D.J. Leachwell versus fire assay: Comments from assay quality assurance at Tarmoola gold mine. In Proceedings of the International Mining Geology Conference, Coolum, Australia, 14–17 May 2000; Australasian Institute of Mining and Metallurgy: Melbourne, Australia, 2009; pp. 43–52. [Google Scholar]
- Pitard, F.F. Sampling correctness: A comprehensive guide. In Proceedings of the World Conference on Sampling and Blending, Sunshine Coast, Australia, 10–12 May 2005; Australasian Institute of Mining and Metallurgy: Melbourne, Australia, 2005; pp. 55–66. [Google Scholar]
- Sims, D.A. Sampling practices at Vera Nancy gold mine. In Proceedings of the International Mining Geology Conference, Coolum, Australia, 14–17 May 2000; Australasian Institute of Mining and Metallurgy: Melbourne, Australia, 2009; pp. 35–42. [Google Scholar]
- Benndorf, J.; Buxton, M.W.N. Sensor-based real-time resource model reconciliation for improved mine production control—A conceptual framework. Min. Technol. 2016, 125, 54–64. [Google Scholar] [CrossRef]
- Kurth, H. Measuring ore quality using real-time on-belt elemental analysis—More than grade control. In Proceedings of the International Mining Geology Conference, Hobart, Australia, 20–22 September 2017; Australasian Institute of Mining and Metallurgy: Melbourne, Australia, 2017; pp. 213–220. [Google Scholar]
- Rifai, K.; Laflamme, M.; Constantin, M.; Vidal, F.; Sabsabi, M.; Blouin, A.; Bouchard, P.; Fytas, K.; Castello, M.; Nguegang Kamwa, B. Analysis of gold in rock samples using laser-induced breakdown spectroscopy: Matrix and heterogeneity effects. Spectrochim. Acta B 2017, 134, 33–41. [Google Scholar] [CrossRef]
- Tickner, J.; Ganly, B.; Lovric, B.; O’Dwyer, J. Improving the sensitivity and accuracy of gamma activation analysis for the rapid determination of gold in mineral ore. Appl. Radiat. Isot. 2017, 122, 28–36. [Google Scholar] [CrossRef] [PubMed]
Figure 1.
Face photographs showing sample lines based on geology: (A) A single chip sample line divided into a central vein sample with associated hanging and footwall samples; (B) Dual face chip sample lines across a sheeted vein zone.
Figure 1.
Face photographs showing sample lines based on geology: (A) A single chip sample line divided into a central vein sample with associated hanging and footwall samples; (B) Dual face chip sample lines across a sheeted vein zone.

Figure 2.
(A) Chip-channel sampling. Samples collected from sidewall of shanty drive. Each sample comprises near continuous chips collected across the vein; (B) Hand channel sampling of side walls.
Figure 2.
(A) Chip-channel sampling. Samples collected from sidewall of shanty drive. Each sample comprises near continuous chips collected across the vein; (B) Hand channel sampling of side walls.
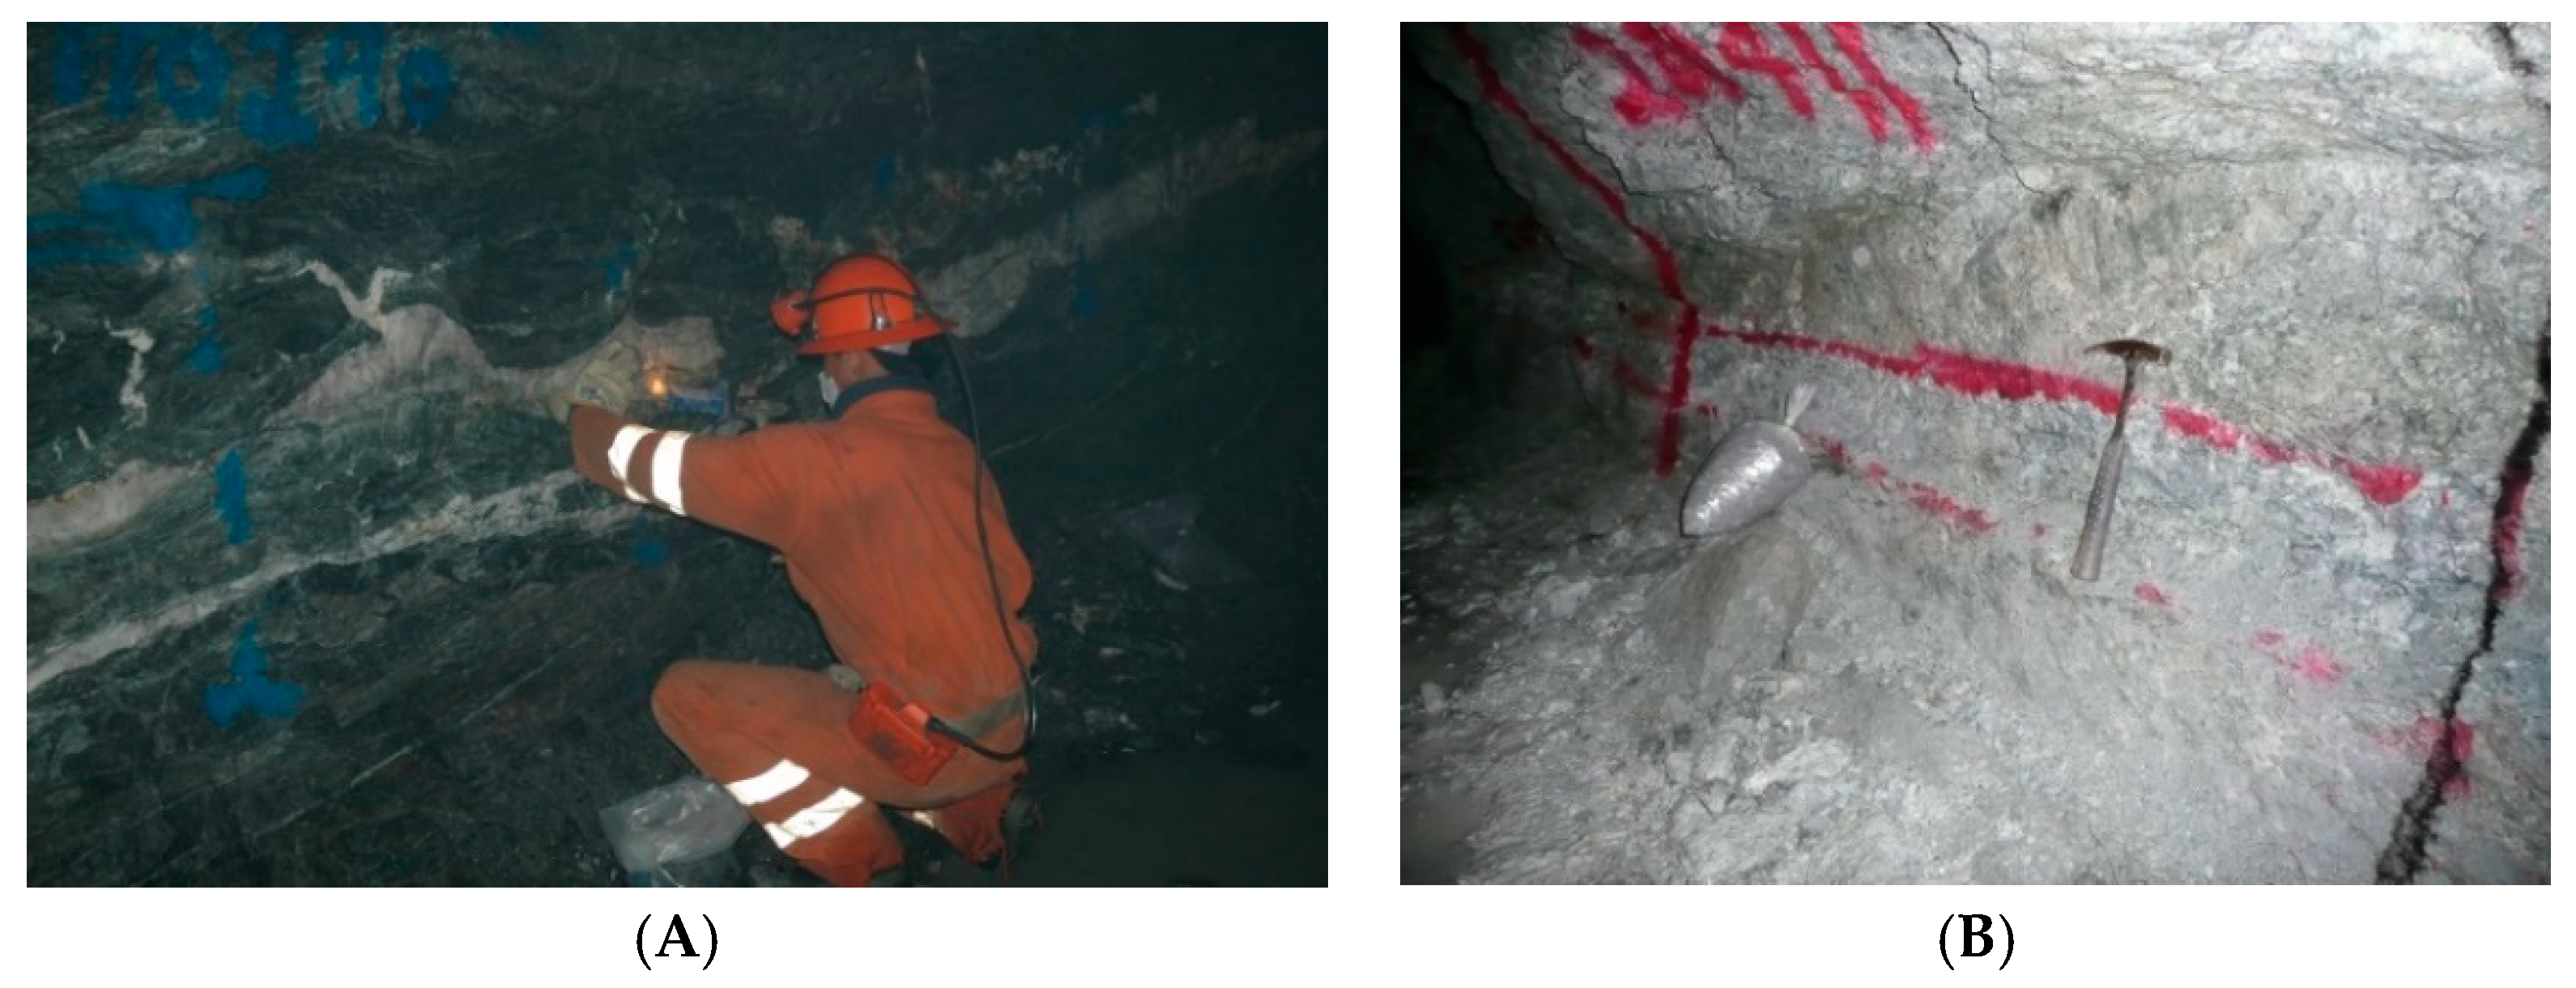
Figure 3.
Orientation of linear samples (e.g., chip-channel) to match geological requirements. Sub-vertical quartz reef in foreground with area of flat veining on the footwall (blue line marks footwall contact). Sub-vertical reef sampled horizontally (samples 1 and 7), whereas flat footwall veins sampled vertically (samples 2–6).
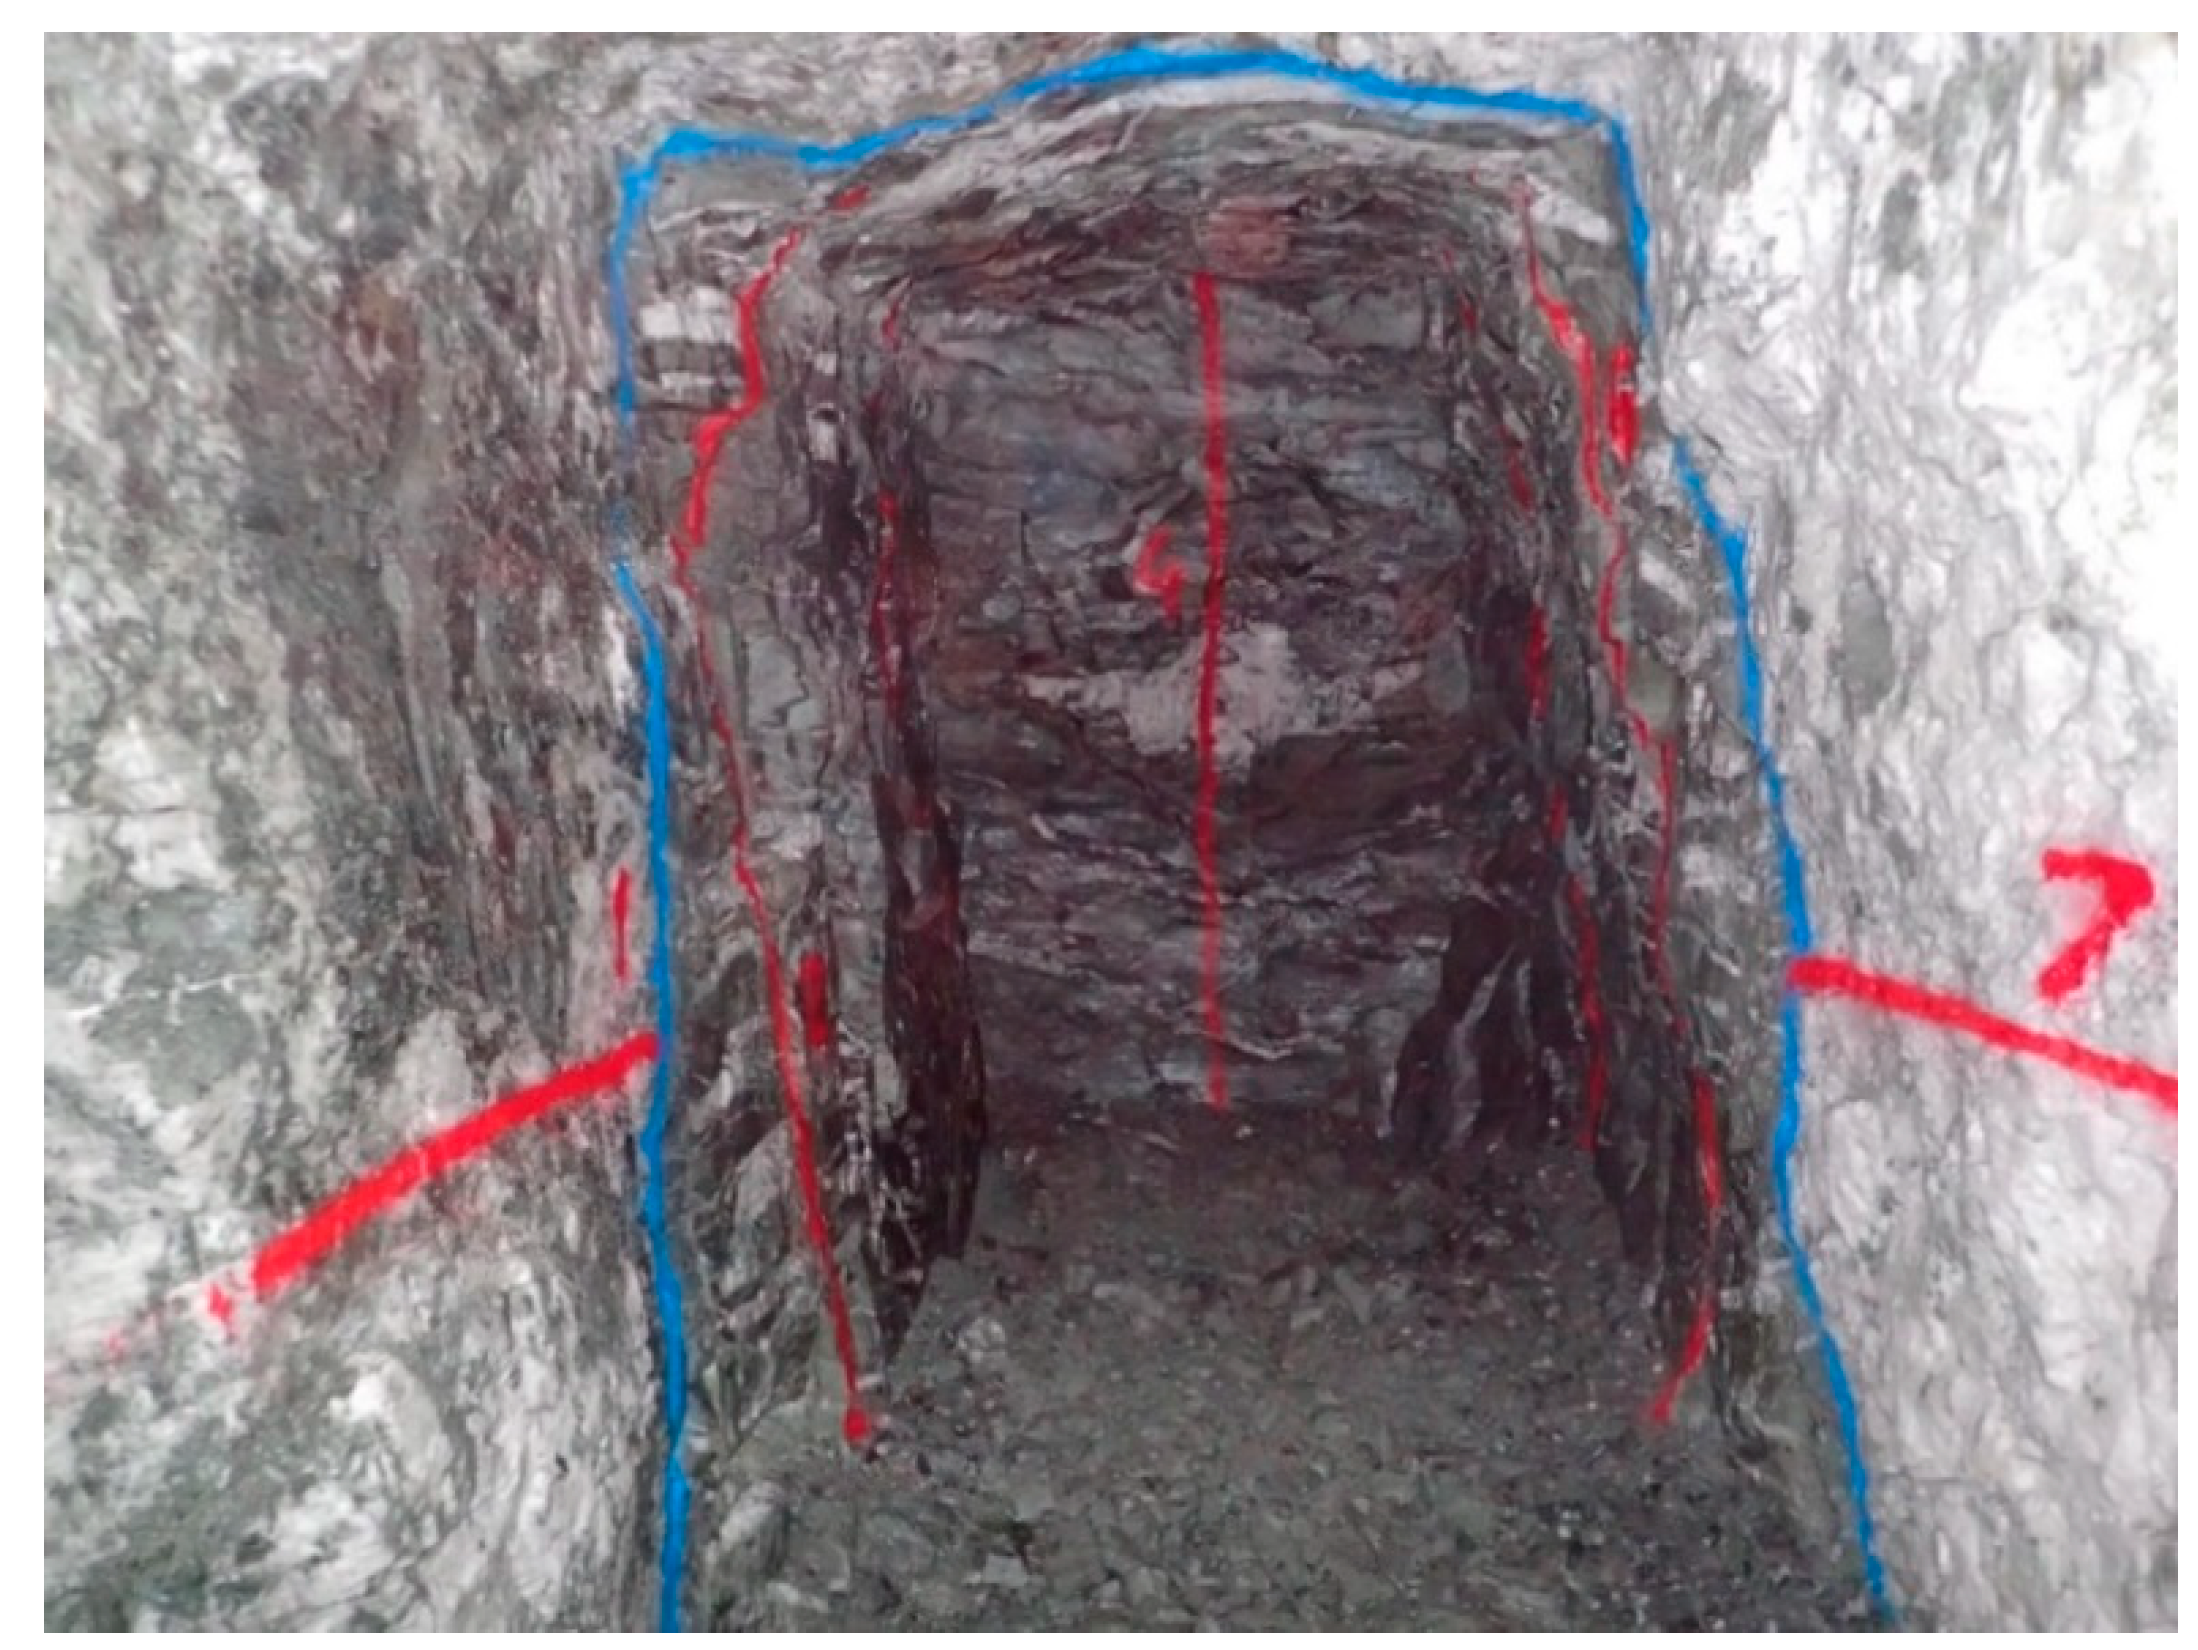
Figure 4.
Collection of saw-cut channel sample (A) and resulting channel (B); Cutting a sidewall channel sample (C) and using an air pick to remove the sample (D).
Figure 4.
Collection of saw-cut channel sample (A) and resulting channel (B); Cutting a sidewall channel sample (C) and using an air pick to remove the sample (D).

Figure 5.
(A) Panel sample preparation. Large (100 kg) samples were required for metallurgical testing and grade verification; (B) Collecting panel samples with hammer and chisel. Samples were chipped from the drive sidewalls onto a plastic floor sheet; (C) Part of panel sample. Chip fragment size is reasonably well controlled, with a maximum fragment size of about 8 cm, and most below 5 cm. With samples collected from brittle material such as quartz there are a substantial proportion of sub-1 mm fragments present; (D) Alternate sample capture method using rubber mats.

Figure 6.
Grab sampling from a surface stockpile showing the challenges of collecting a representative sample and oversampling fine material.
Figure 6.
Grab sampling from a surface stockpile showing the challenges of collecting a representative sample and oversampling fine material.

Figure 7.
Drawpoint with sampling grid (Left) and sample collection (Right).

Figure 8.
Types of sludge sampling. (A) Collection of stope blasthole sludge via plastic boxes placed below the hole leads to very high DE and EE; (B) Collection of face blasthole sludge via scooping from the drive floor leads to high FSE, GSE, DE, and EE.
Figure 8.
Types of sludge sampling. (A) Collection of stope blasthole sludge via plastic boxes placed below the hole leads to very high DE and EE; (B) Collection of face blasthole sludge via scooping from the drive floor leads to high FSE, GSE, DE, and EE.

Figure 9.
Backs channel sampling in historical workings. A chip-channel is produced, where sample fragments are supposedly being collected in a plastic bowl. In this case the EE is high, as many extracted fragments are not being collected. In addition, DE on the shoulders of the drive is particularly high since the delimited samples are biased within the delimited zone on the curved drive shoulder.
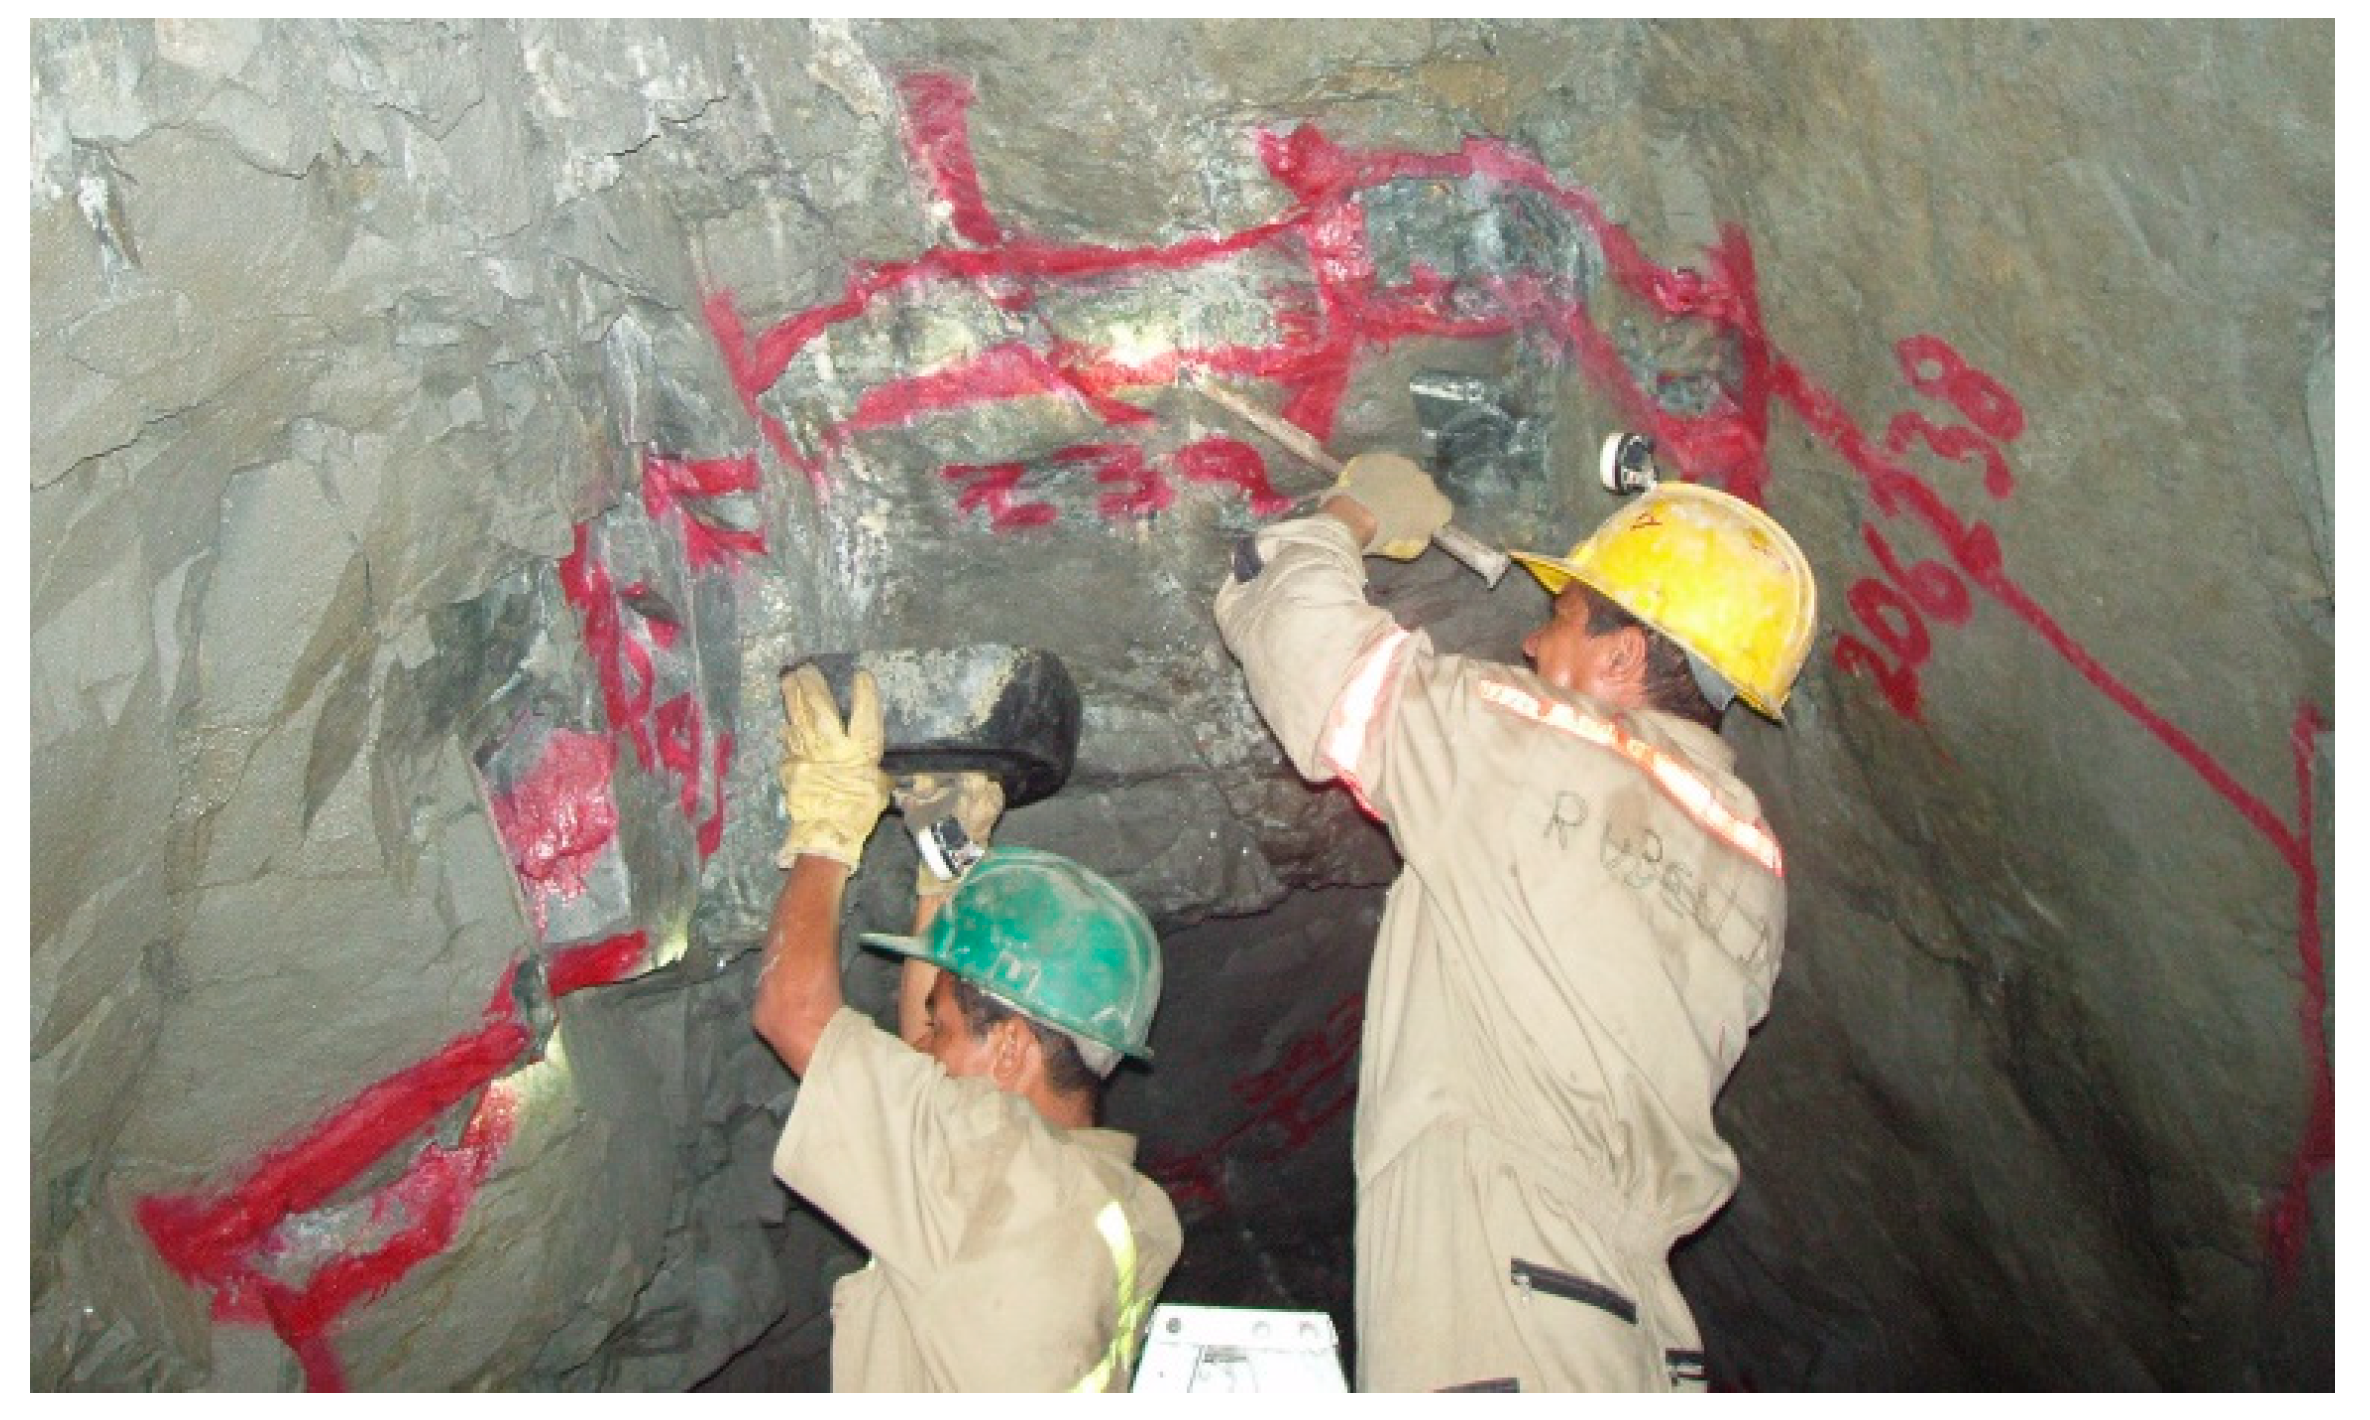
Figure 10.
Generalised applicability of sampling methods based on mineralisation type (dominance of coarse vs. fine gold and nugget effect). Red: avoid method; Orange: avoid method where possible; Green: method applicable, assuming good practices, optimised protocols, and QAQC. [1] Coarse nominally defined as gold >100 µm in size; [2] Nugget effect sub-divided into four ranges: low (0–25%), medium (25–50%), high (50–75%) and extreme (75–100%); [3] Chip-channel samples potentially appropriate if chips are contiguous or at least dominantly semi-contiguous; and [4] Panel-chip samples potentially appropriate if chips are contiguous or at least dominantly semi-contiguous. DC: diamond core drilling; RC: reverse circulation drilling.


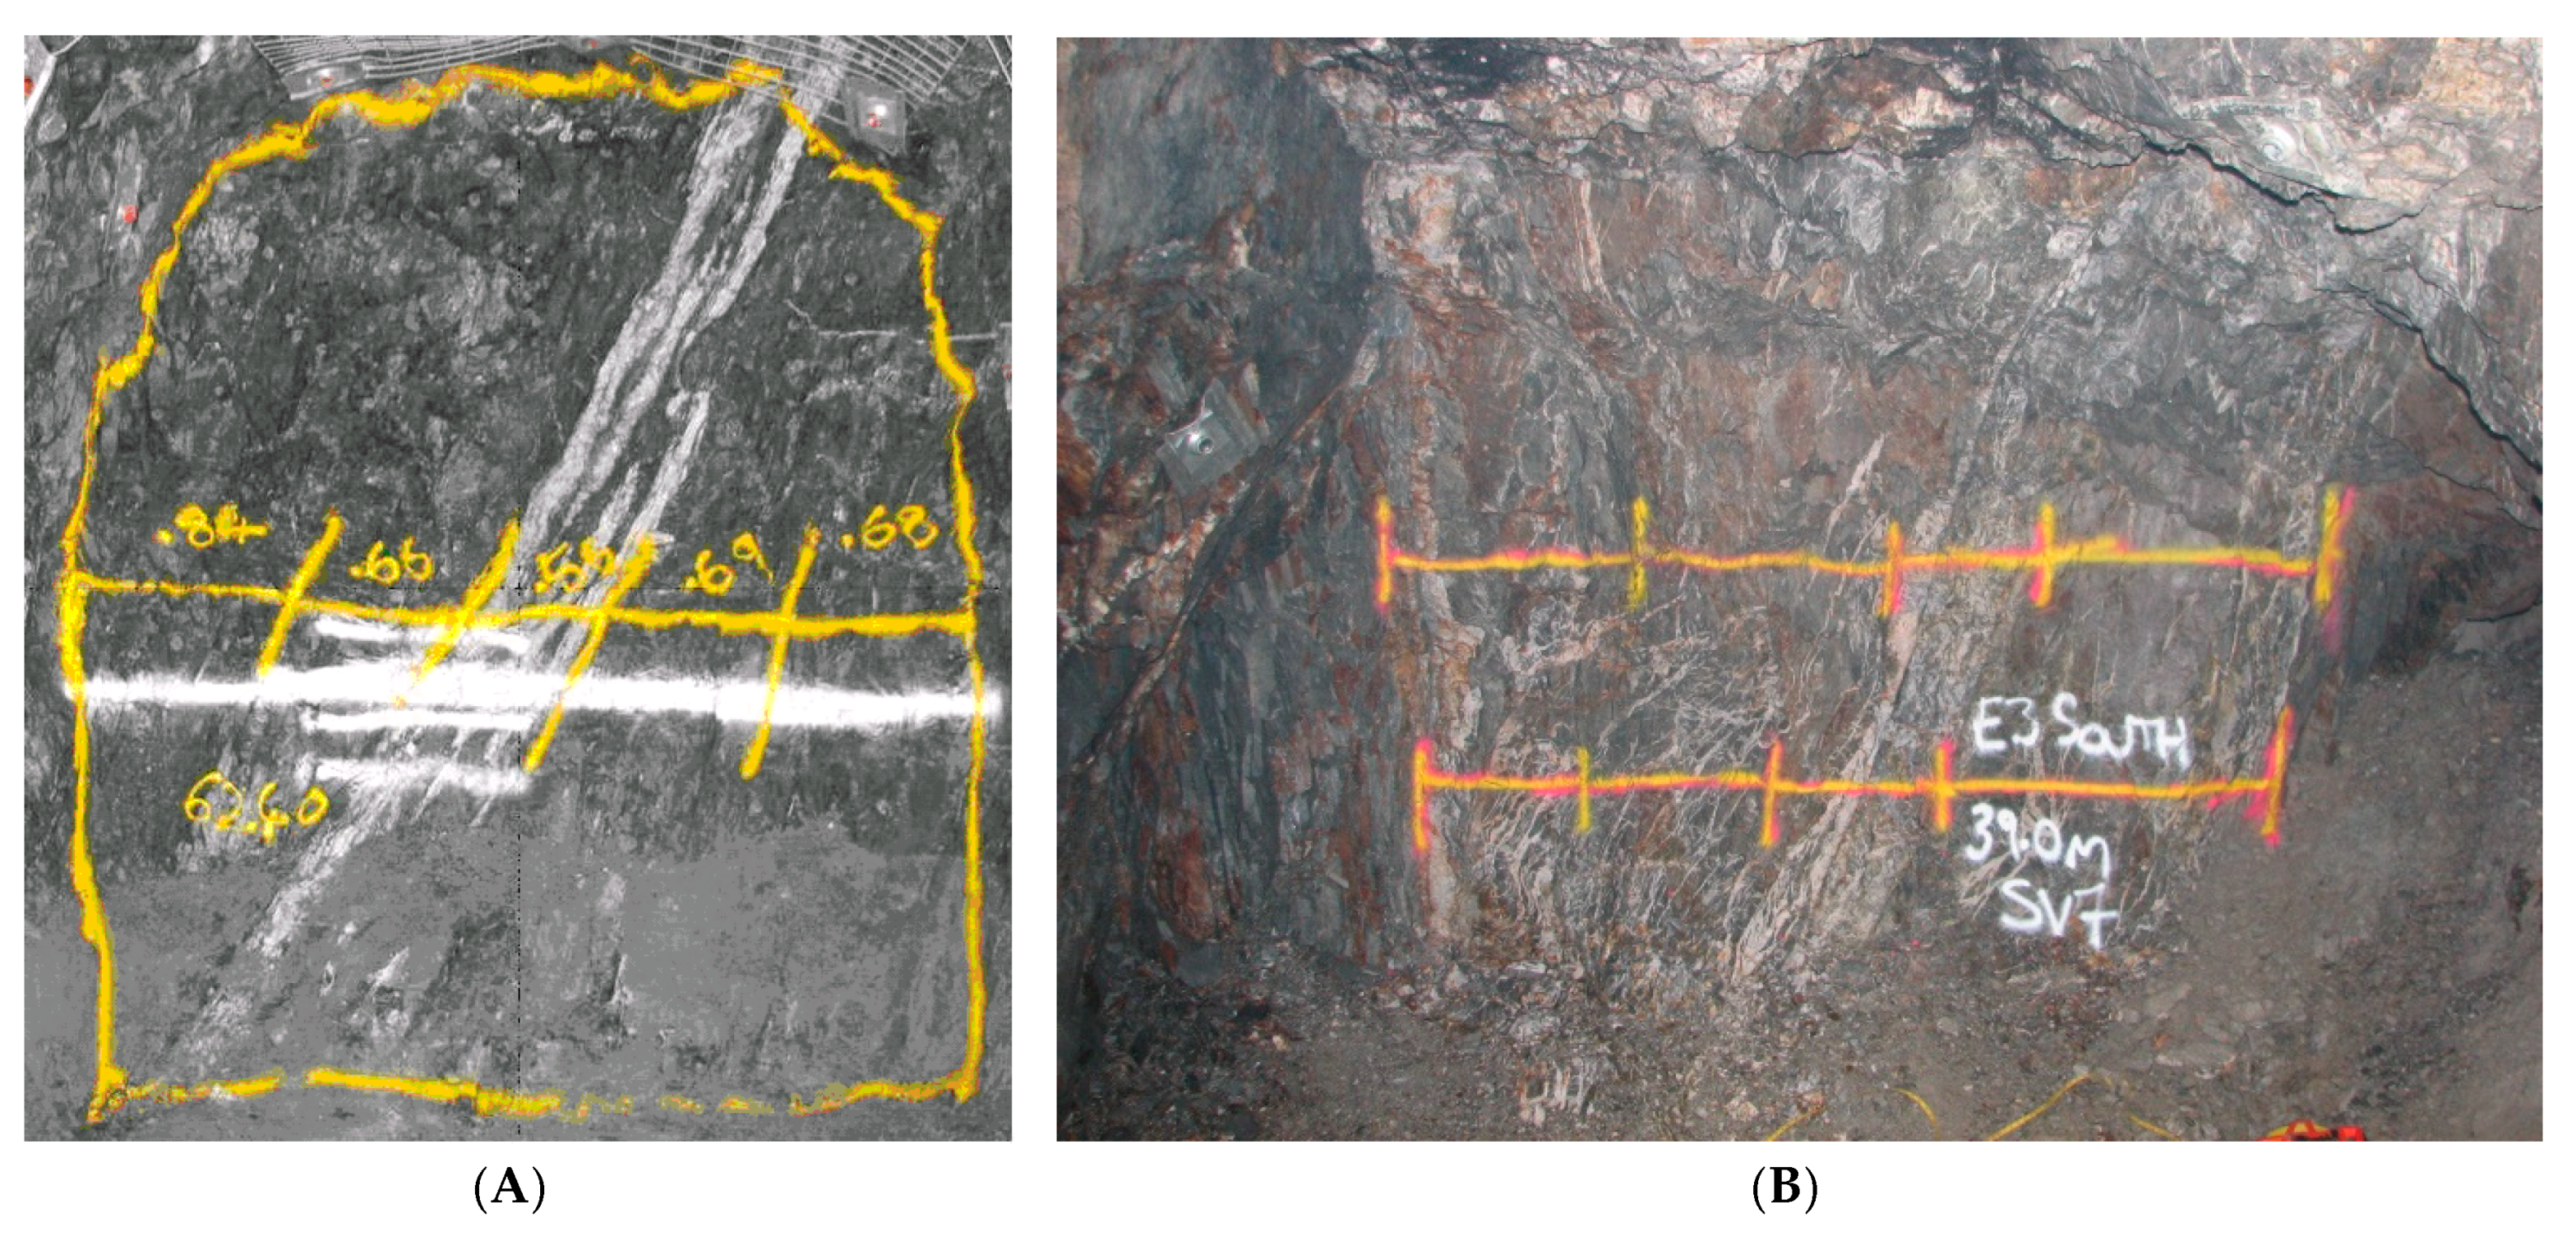
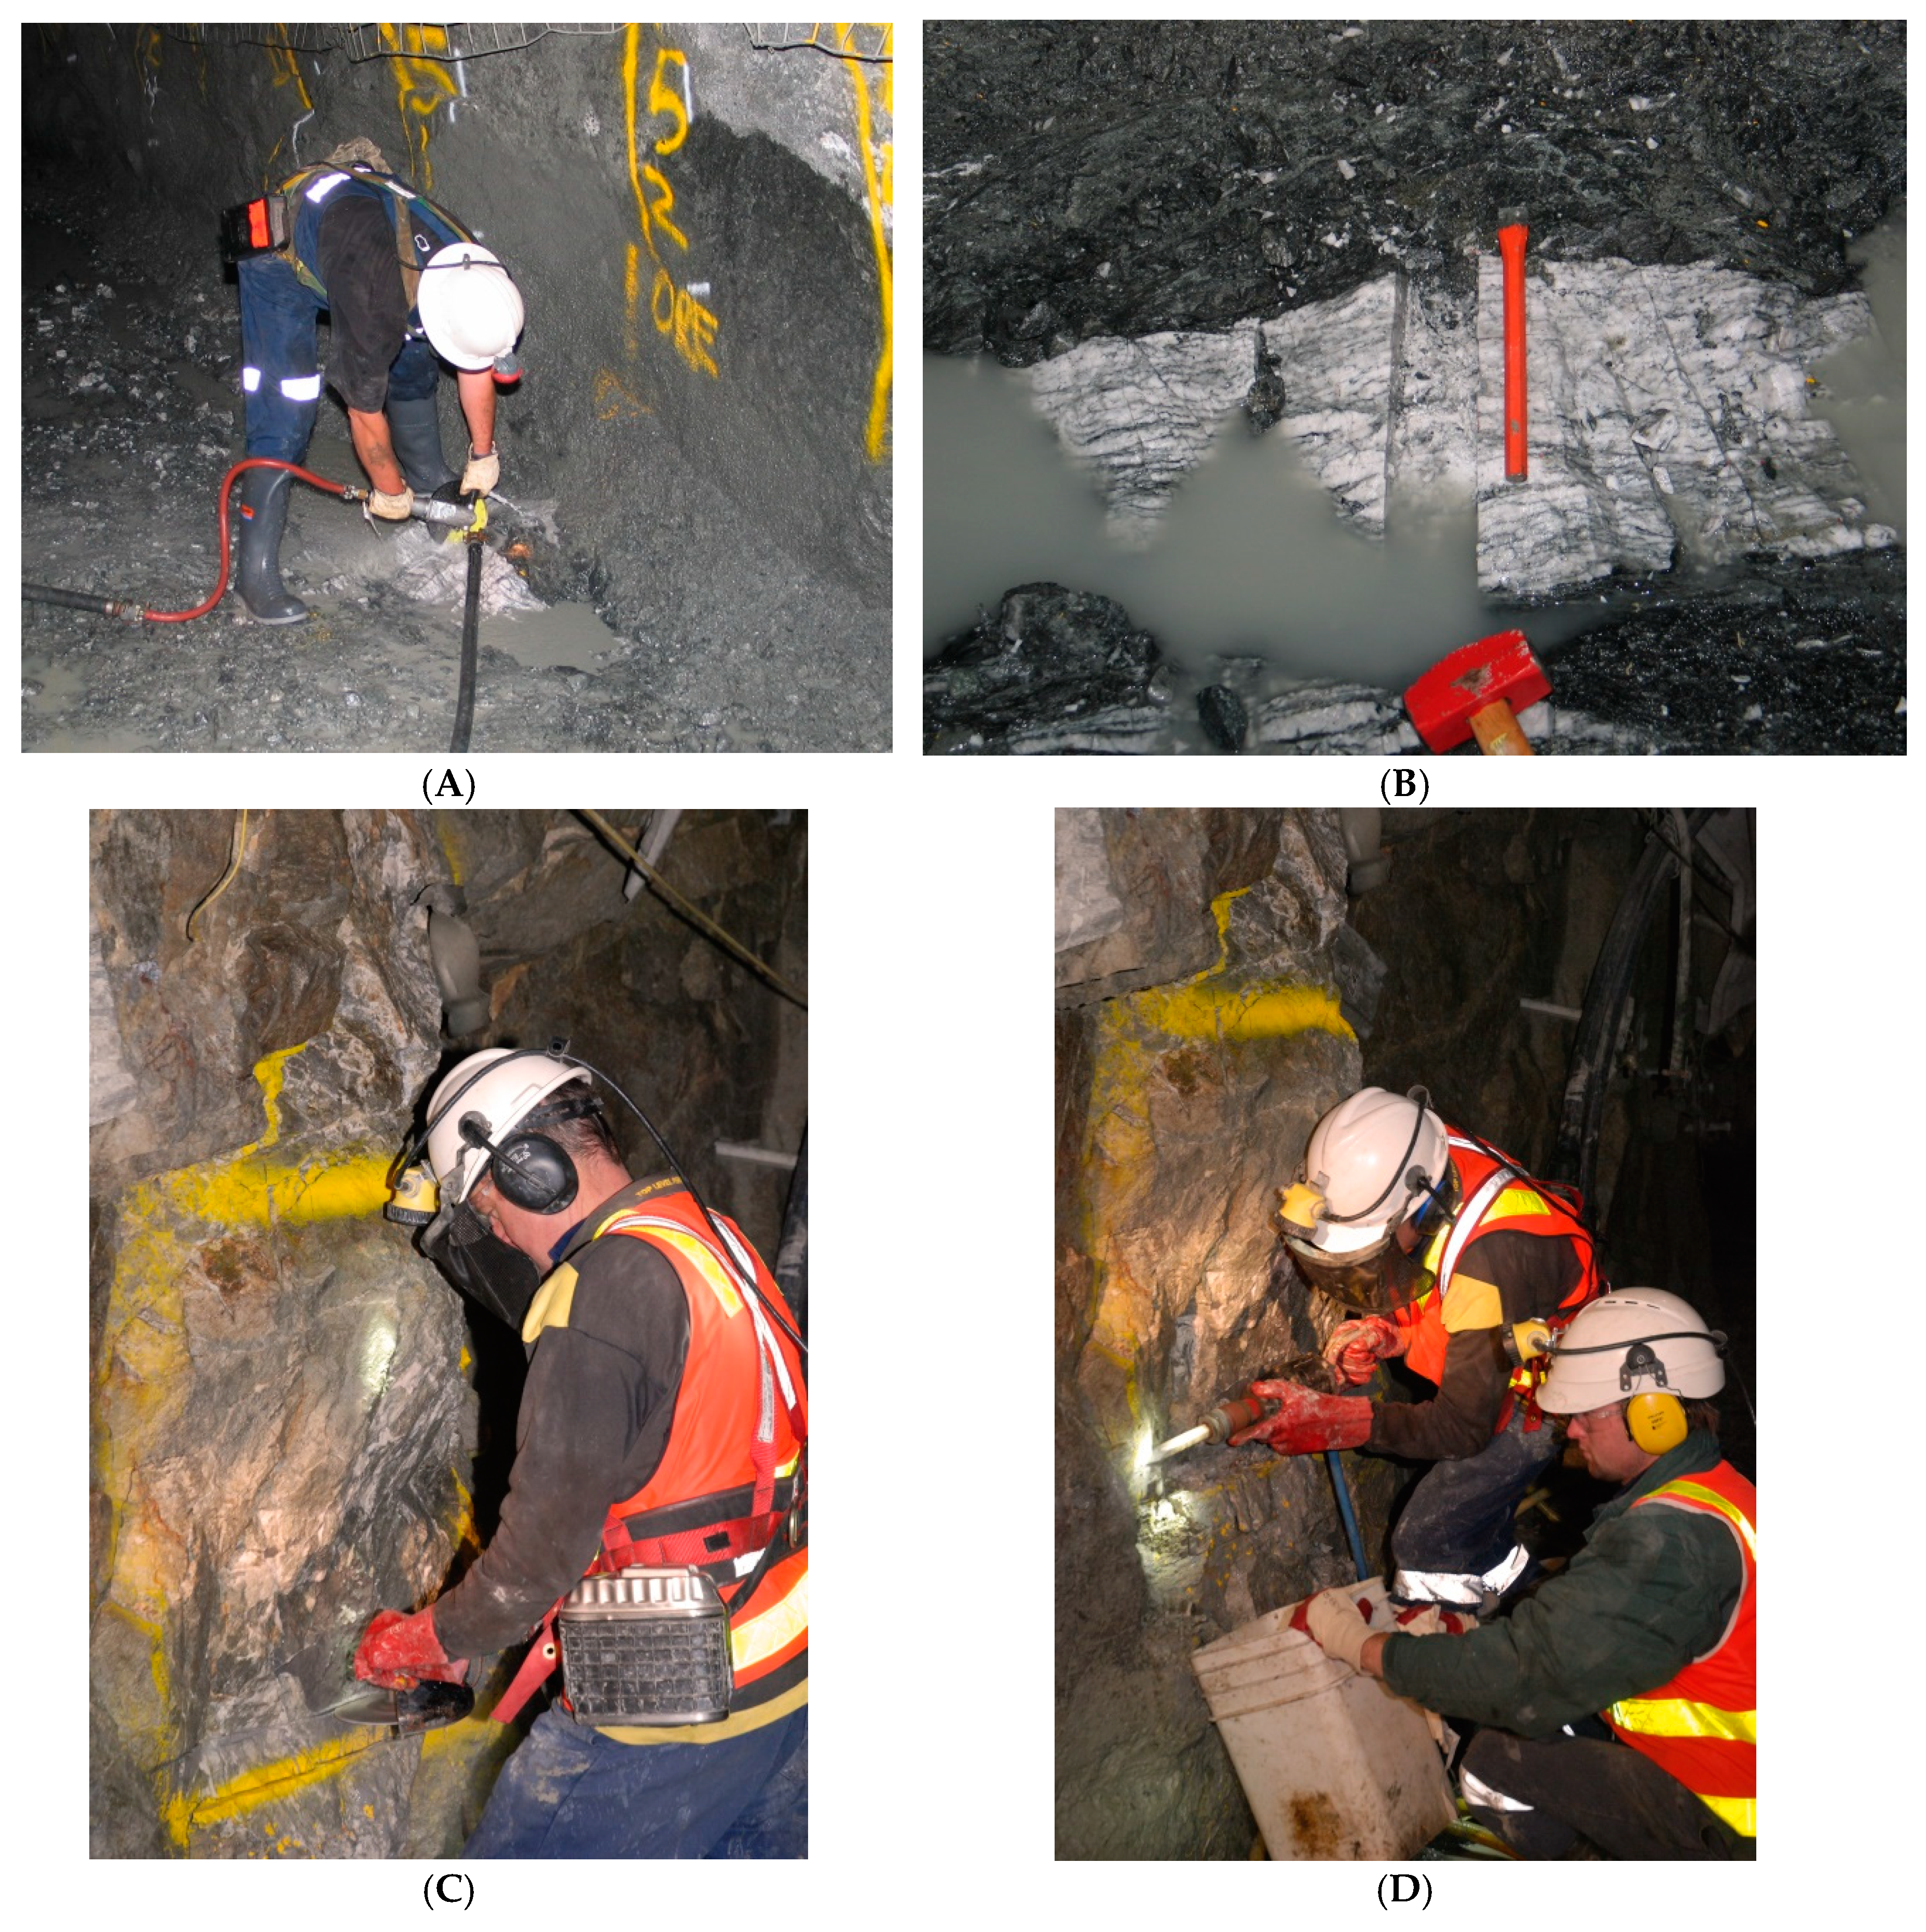
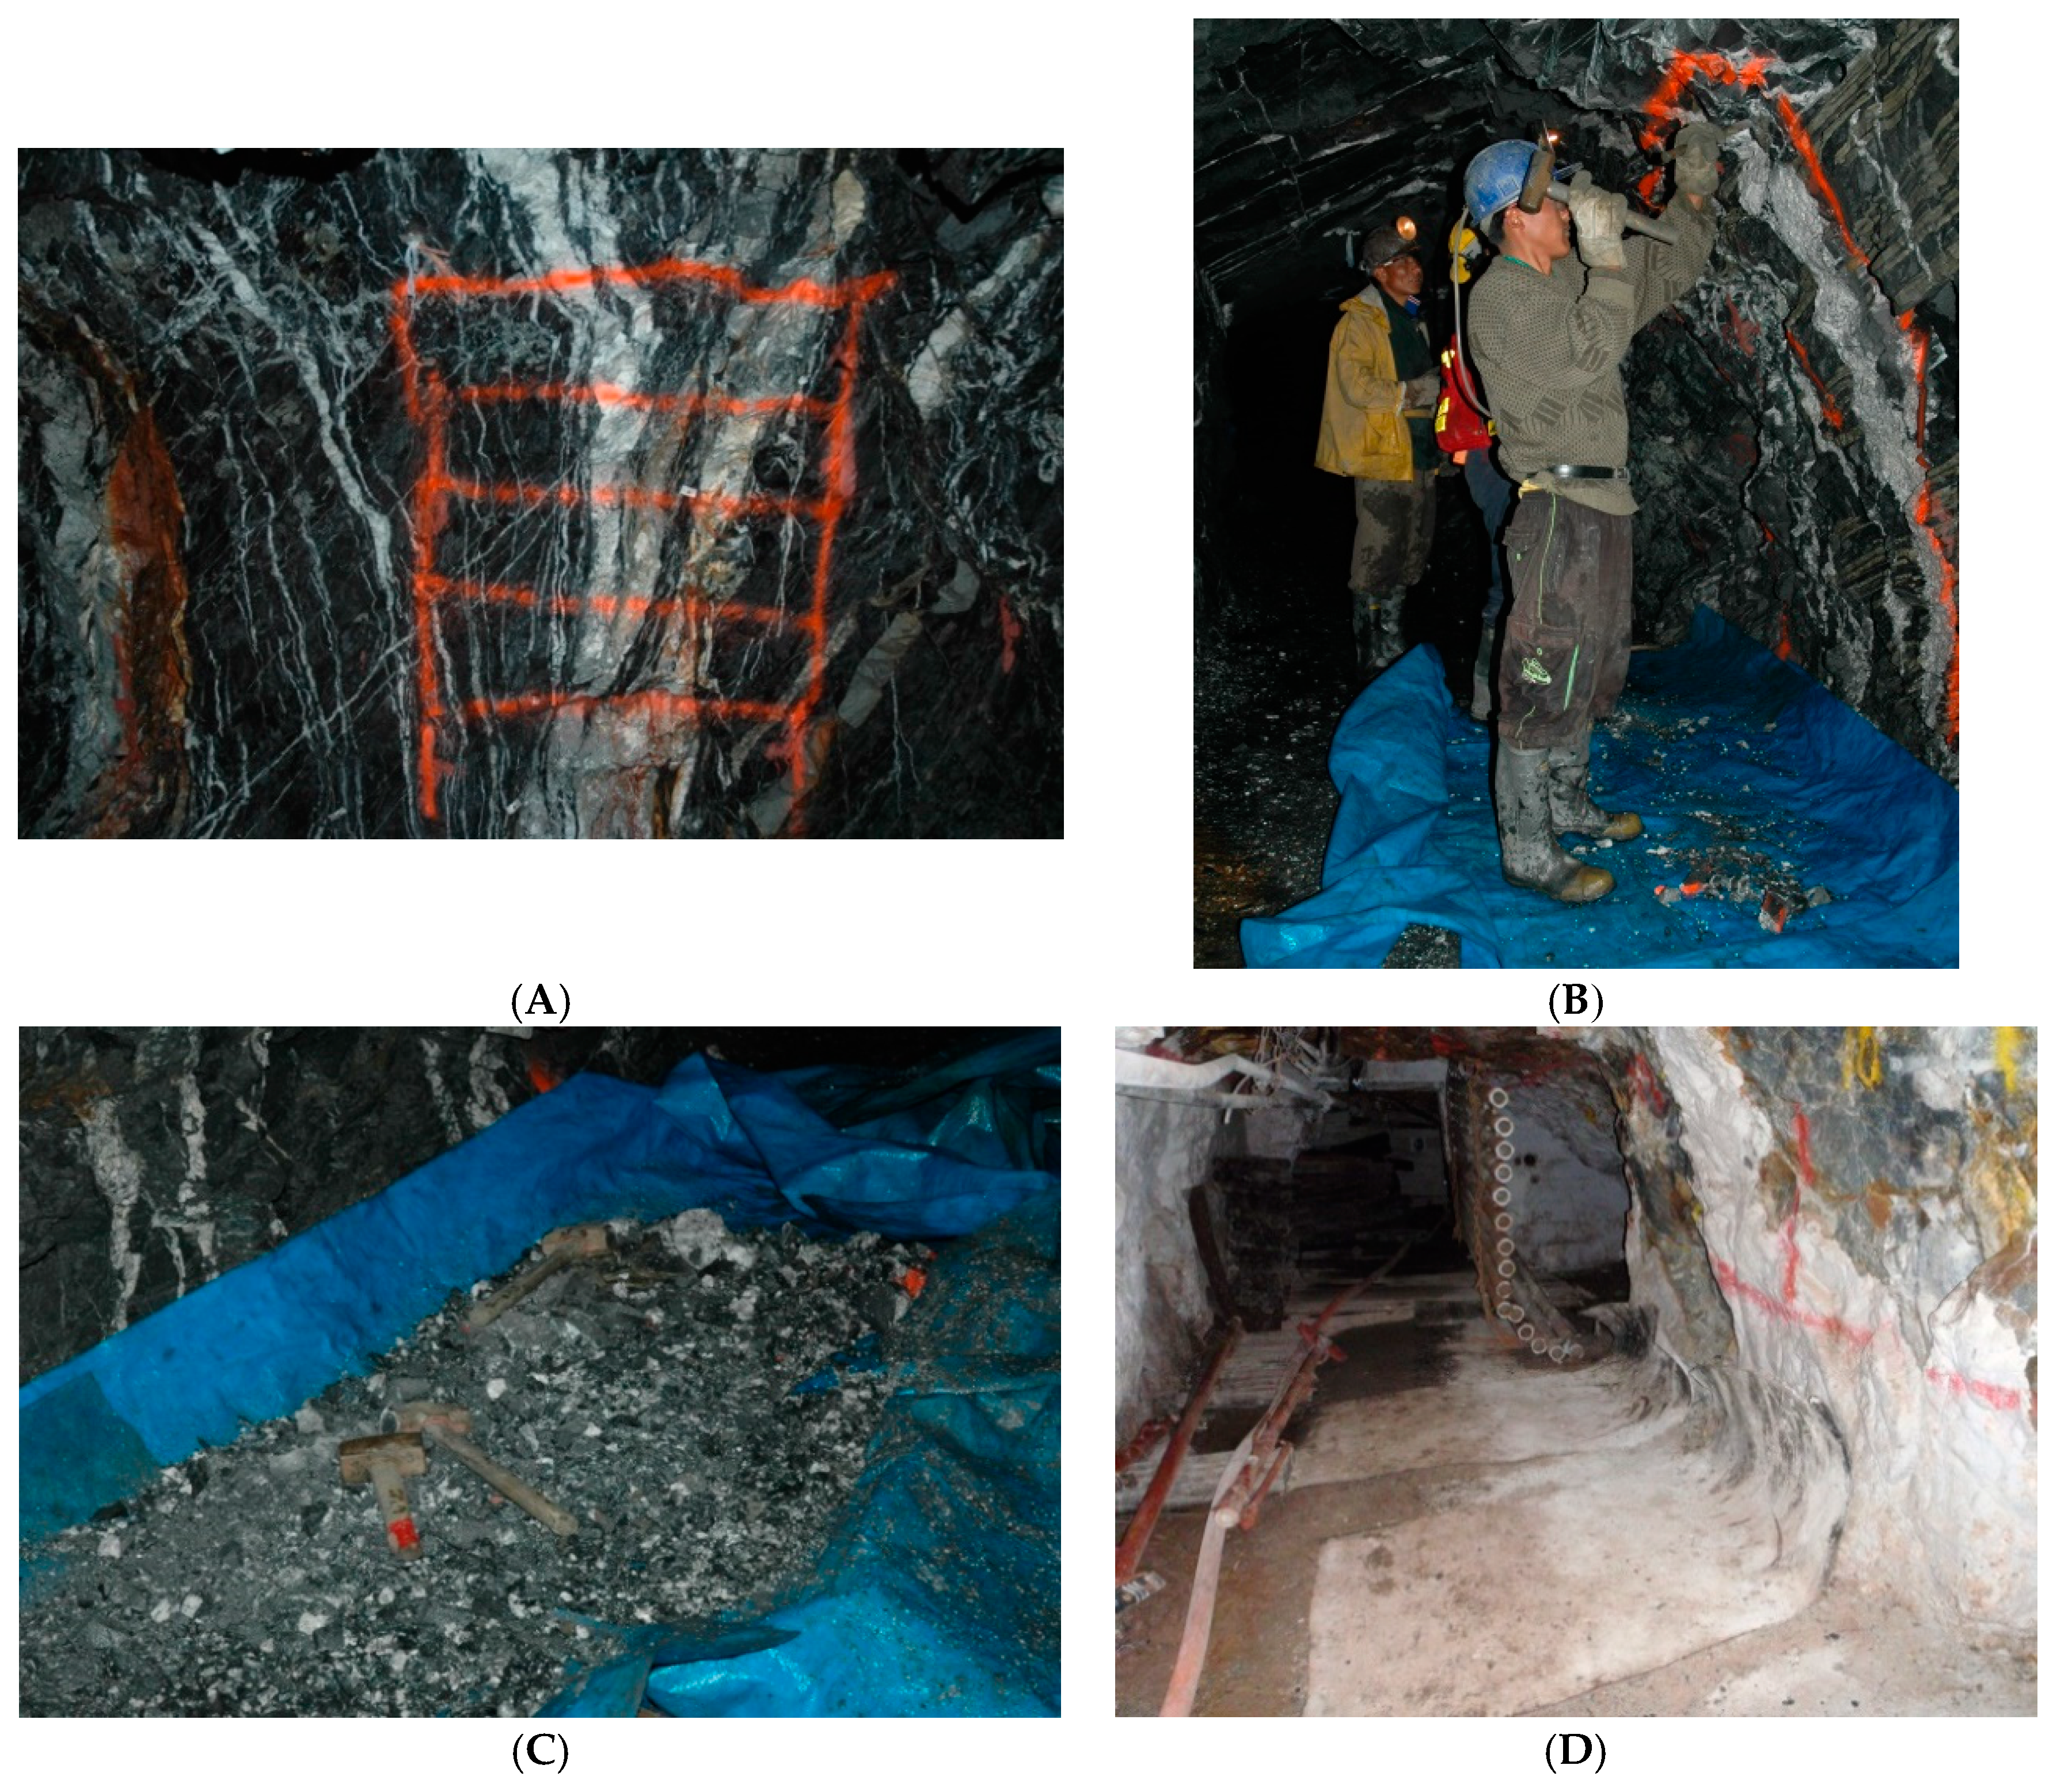
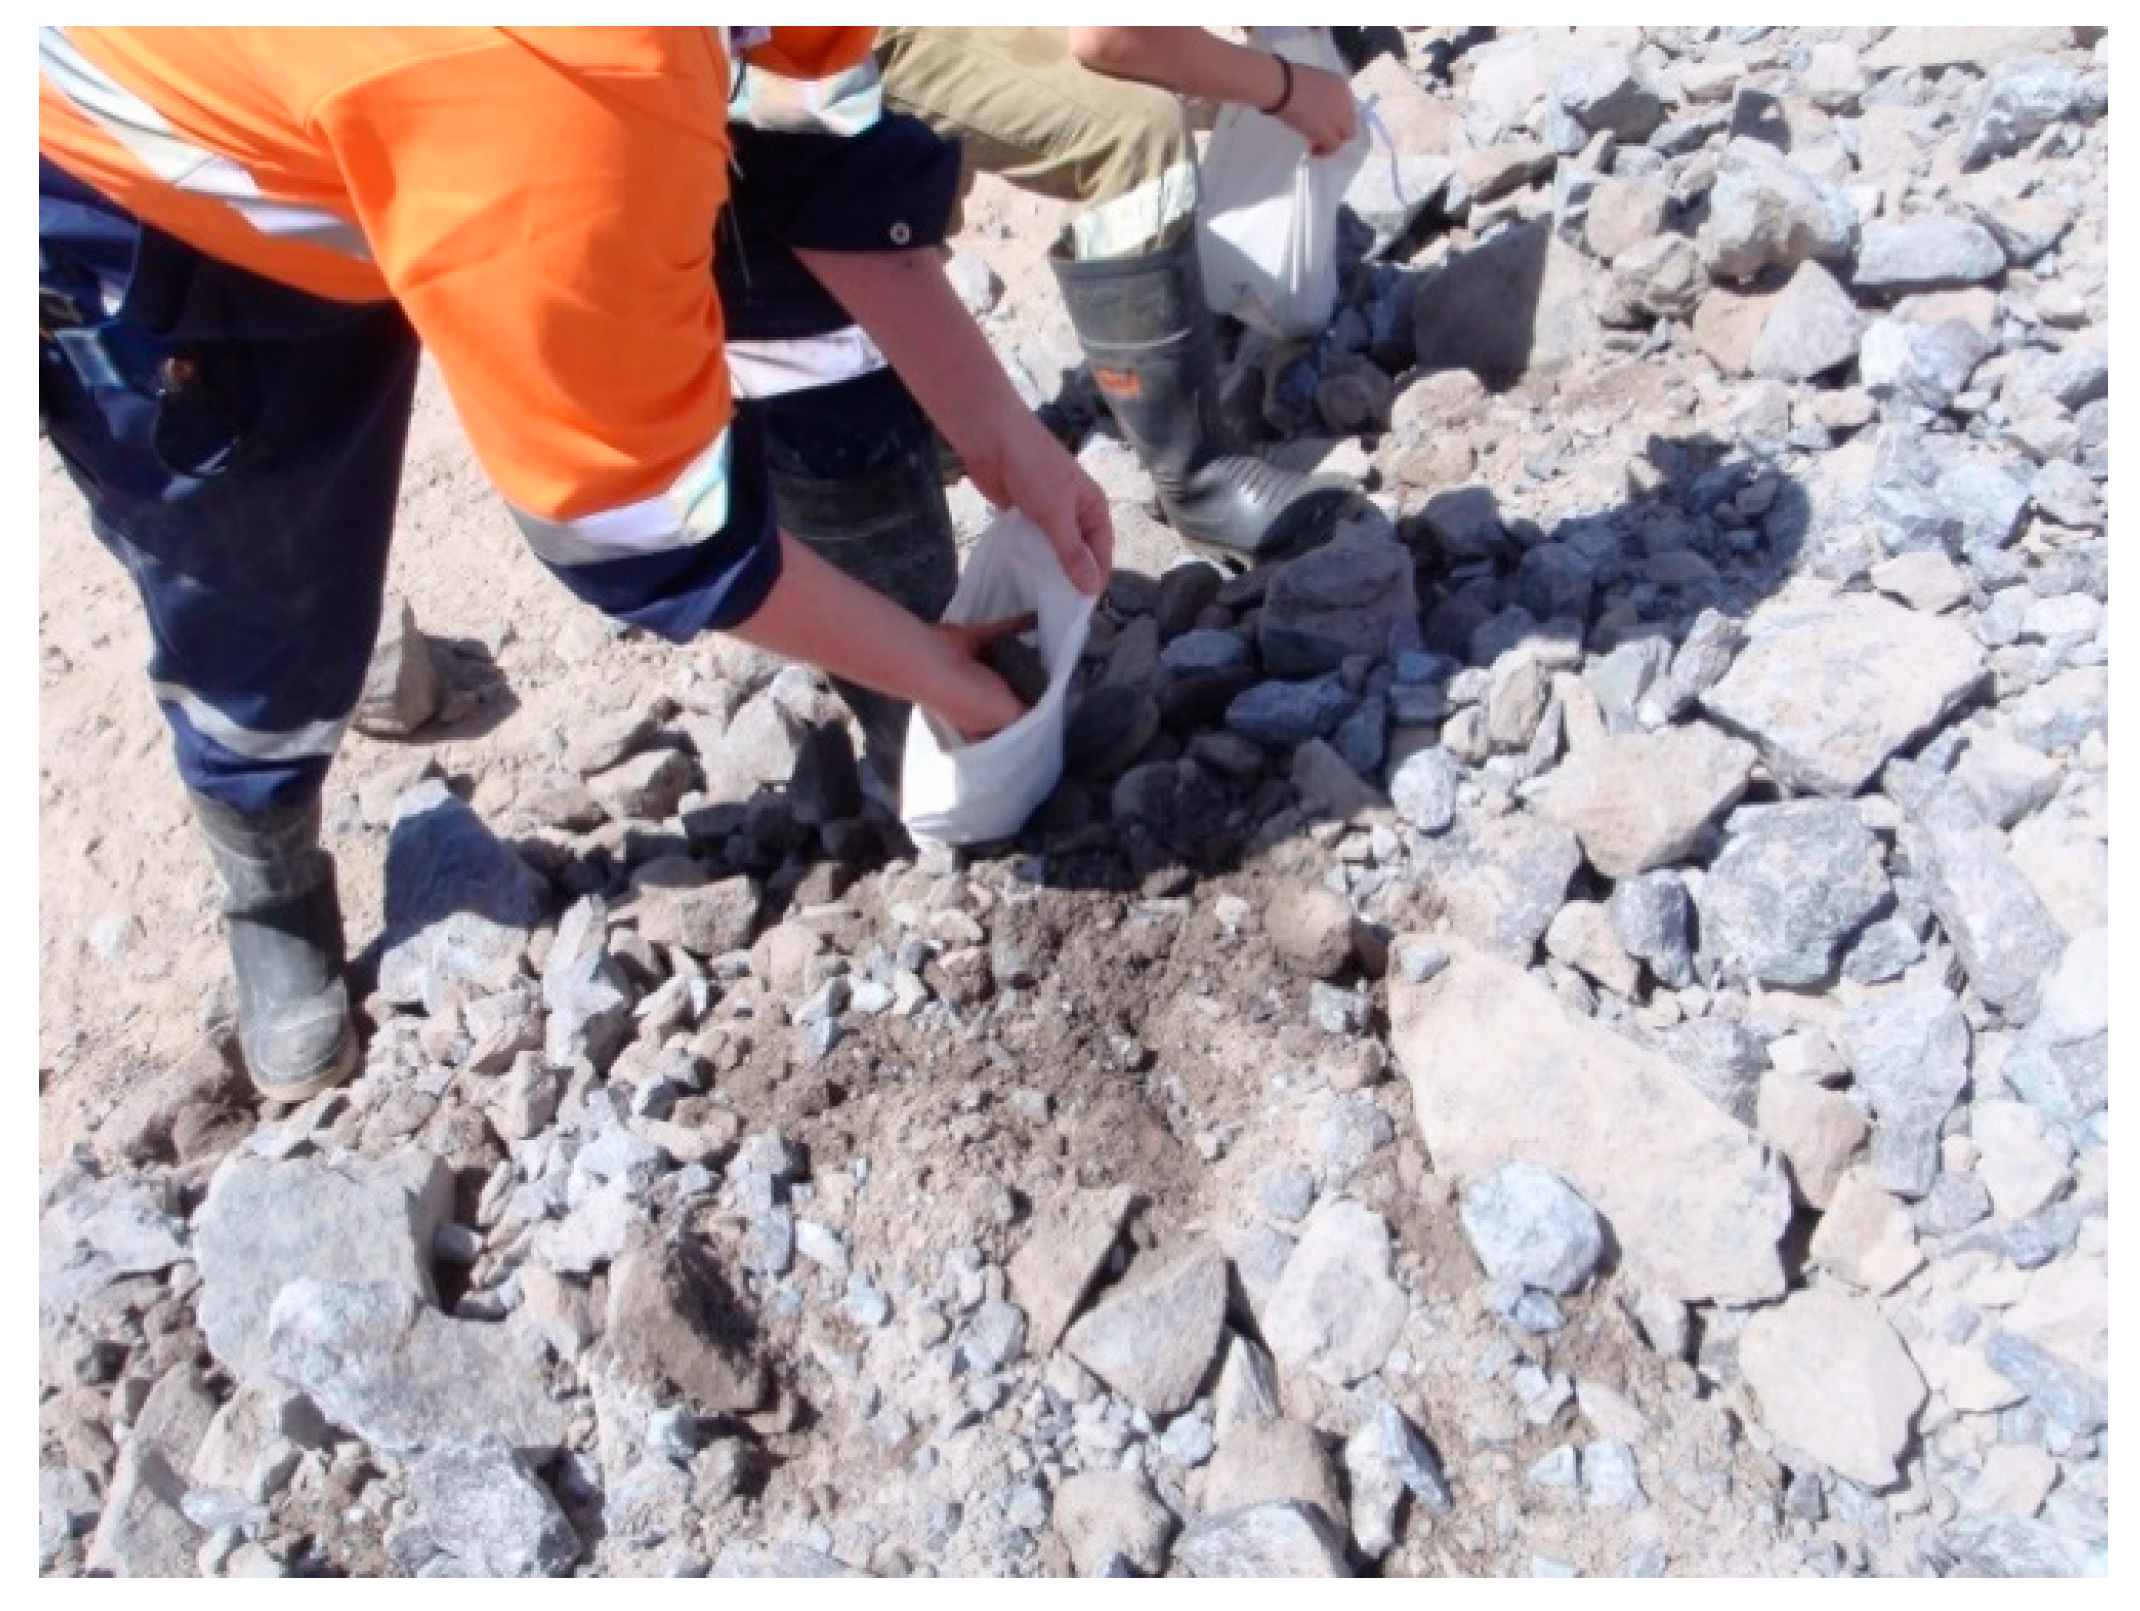
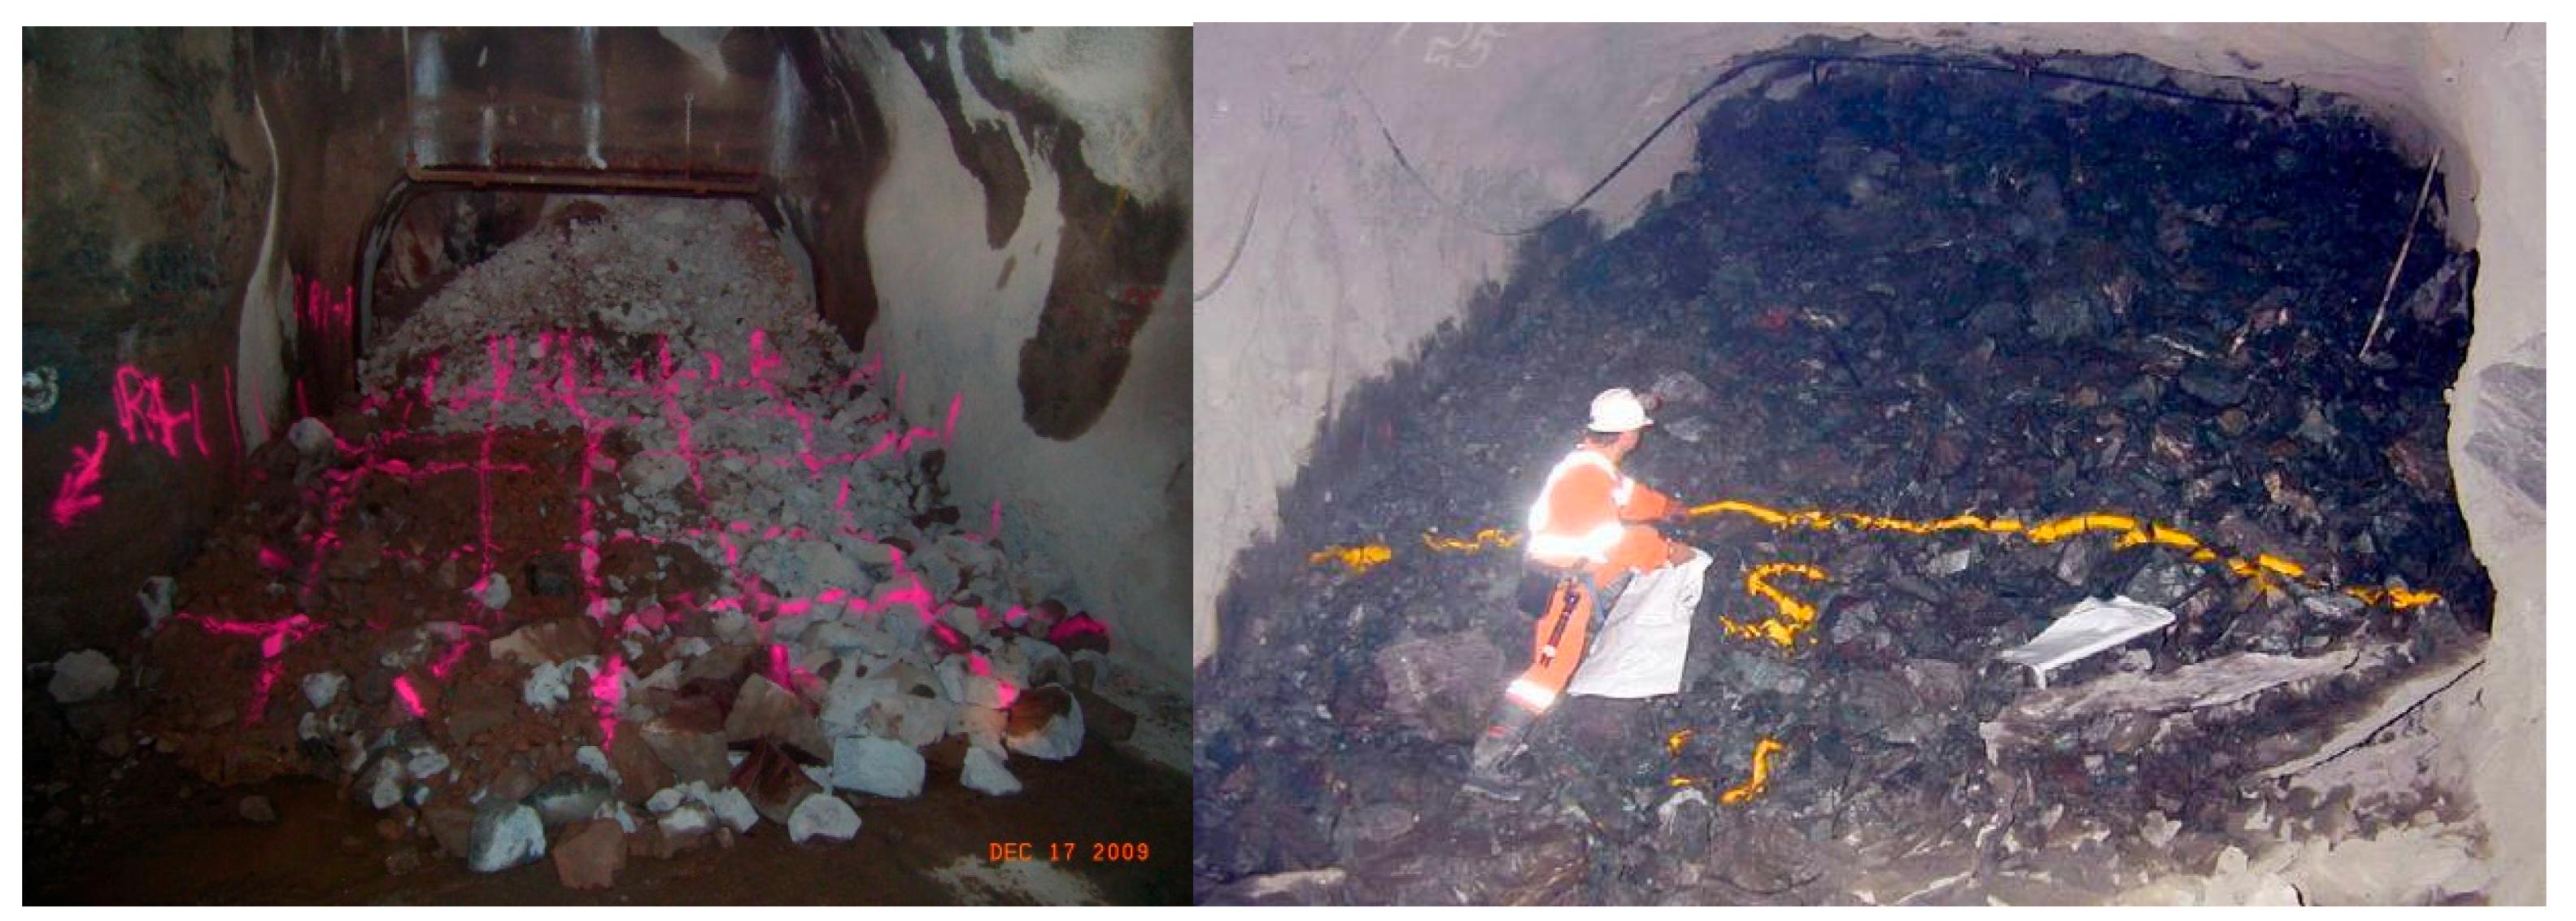
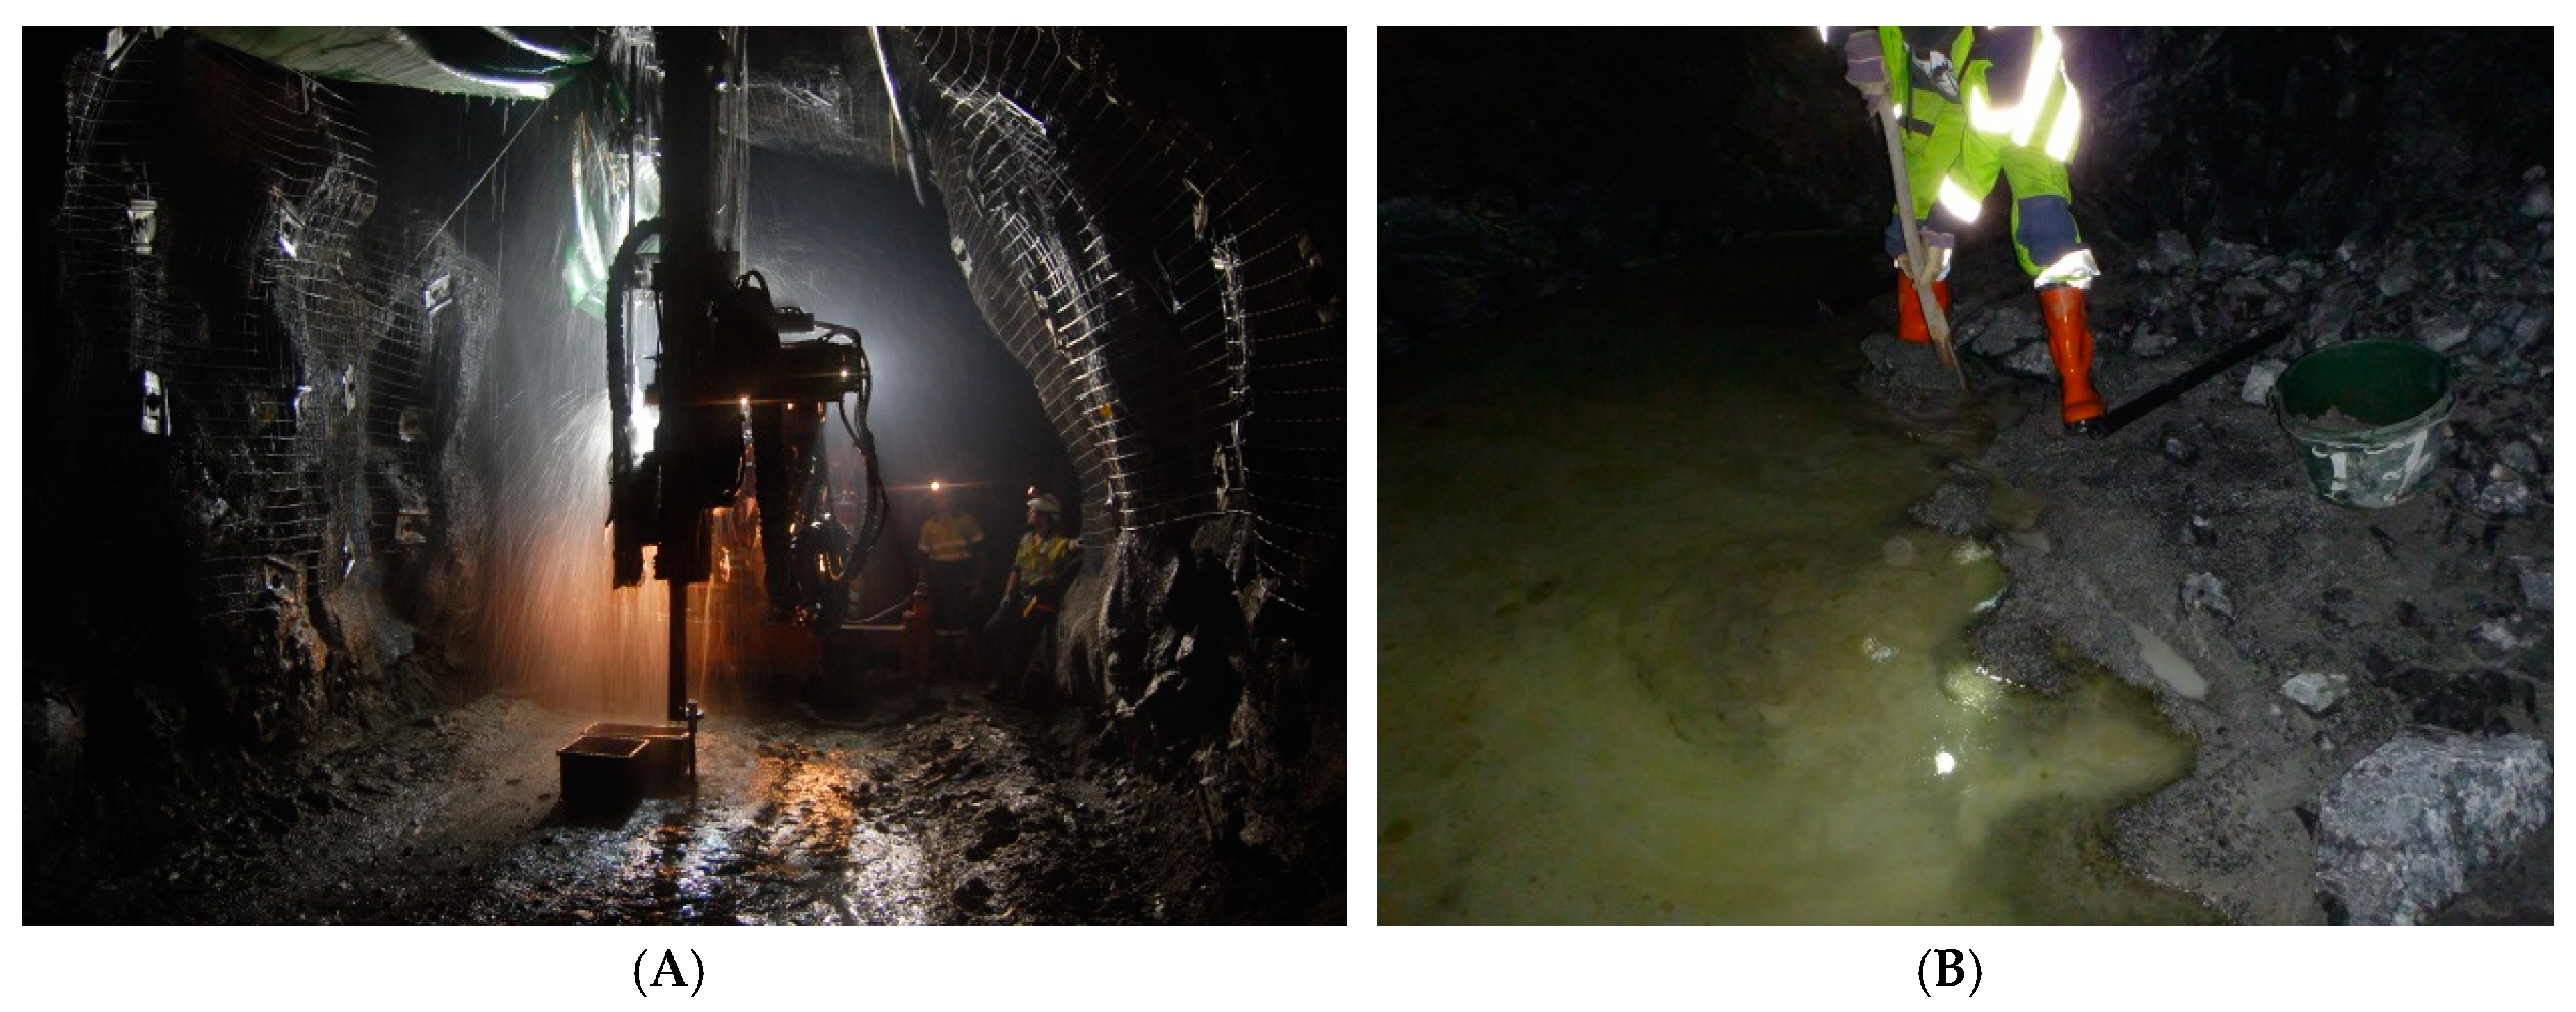
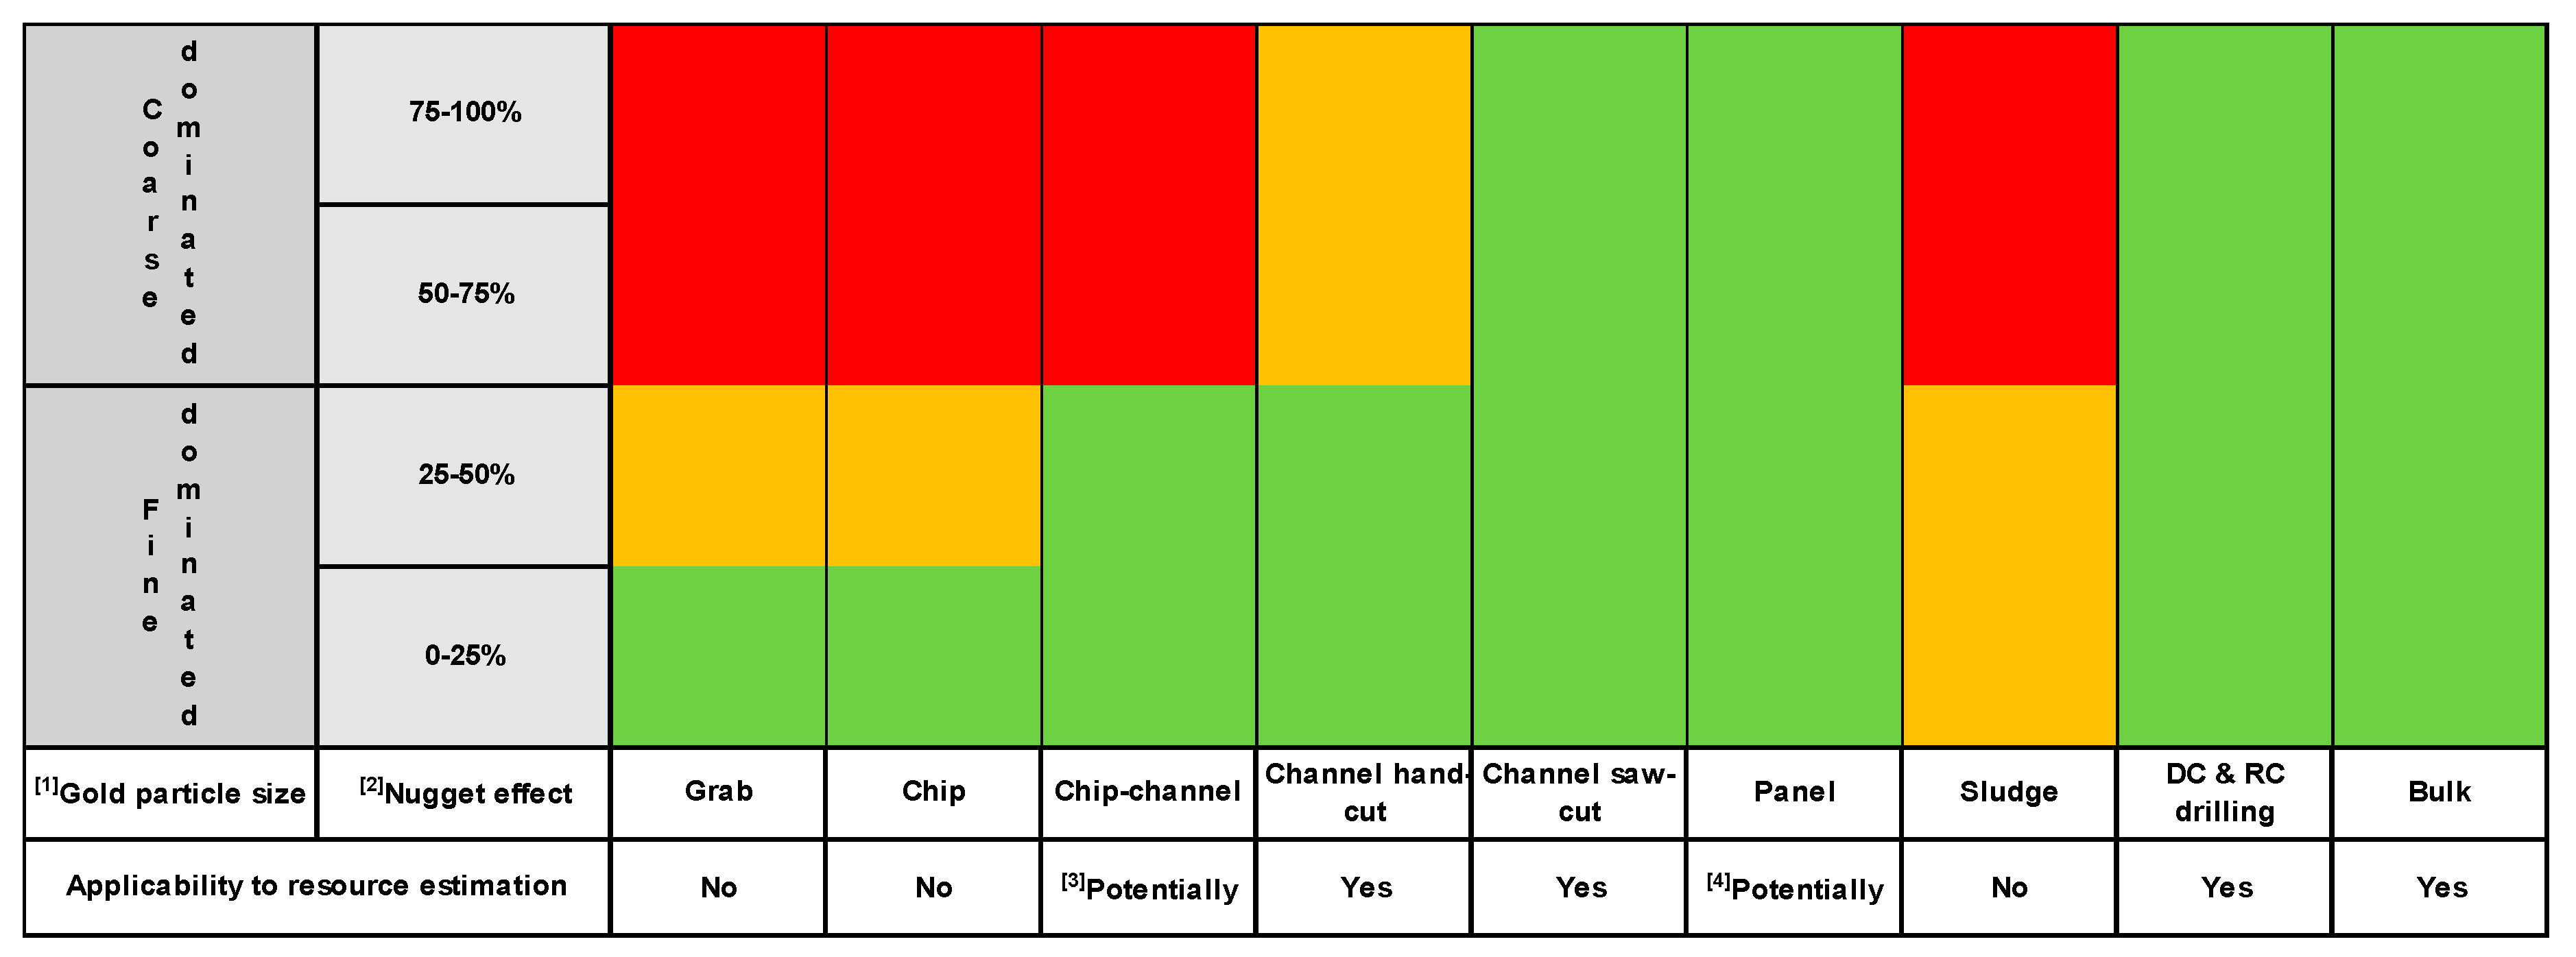
Table 1.
Sampling value chain.
| Stage | Planning | Collection | Transport | Laboratory Preparation | Assaying |
|---|---|---|---|---|---|
| 1 | 2 | 3 | 4 | 5 | |
| Activity | Scope Develop Execute | Observe Collect Bag and tag QAQC Integrity/security Chain of custody | Integrity/security Chain of custody | Equipment operation Equipment clean QAQC Integrity/security | Equipment operation Equipment clean QAQC Integrity/security |
| Sampling errors | In-situ nugget effect FSE, GSE DE, EE, WE | PE | FSE, GSE DE, EE, WE, PE | PE AE | |
| Dominant effect on results | Precision Bias | Bias | Precision (if splitting) Bias | Bias | |
FSE: fundamental sampling error; GSE: grouping and segregation error; DE: delimitation error; EE: extraction error; PE: preparation error; WE: weighting error; AE: analytical error; QAQC: Quality assurance/quality control.
Table 2.
Definition of Theory of Sampling (TOS) sampling errors.
| Sampling Error | Acronym | Error Type | Effect on Sampling | Source of Error | Error Definition |
|---|---|---|---|---|---|
| Fundamental | FSE | Correct Sampling Error (CSE) | Random Errors—Precision Generator | Characteristics of the ore type. Relates to constitution and distribution heterogeneity | Results from grade heterogeneity of the broken lot. Of all sampling errors, the FSE does not cancel out and remains even after a sampling operation is perfect. Experience shows that the total nugget effect can be artificially high because sample masses are not optimal. |
| Grouping and Segregation | GSE | Relates to the error due to the combination of grouping and segregation of rock fragments in the lot. Once rock is broken, there will be segregation of particles at any scale (e.g., surface stockpile or laboratory pulp). | |||
| Delimitation | DE | Incorrect Sampling Error (ISE) | Systematic Errors—Bias Generator | Sampling equipment and materials handling | Results from an incorrect shape of the volume delimiting a sample. |
| Extraction | EE | Results from the incorrect extraction of a sample. Extraction is only correct when all fragments within the delimited volume are taken into the sample. | |||
| Weighting | WE | Samples should represent a consistent mass per unit (e.g., kg/m). | |||
| Preparation | PE | Refers to issues during sample transport and storage (e.g., mix-up, damage, loss and alteration), preparation (contamination and/or losses), and intentional (sabotage and salting), and unintentional (careless actions and non-adherence of protocols) actions. | |||
| Analytical | AE | - | Analytical process | Relates to all errors during the assay and analytical process, including issues related to rock matrix effects, careless actions, and analytical machine maintenance and calibration. |
Table 3.
Cause, effect, and solutions to TOS errors.
| Sample Type | Error Type | Cause | Error | Effect | Nugget Effect Component | Solution |
|---|---|---|---|---|---|---|
| In-situ (e.g., linear samples and core) | Random | In-situ heterogeneity | Local representativity | Poor precision | GNE | Larger samples More samples |
| Broken rock (from rock chips to blasted material and laboratory pulps) | Constitution Heterogeneity | FSE | Poor precision | SNE | Optimised protocols Larger samples More samples | |
| Constitution and Distribution Heterogeneity | GSE | Poor precision | SNE | Optimised protocols More sample increments | ||
| Systematic | Poor quality sampling protocols | DE, EE, WE, PE, and AE | High bias | SNE | Optimised protocols Efficient training Strict QAQC |
GNE: geological nugget effect; SNE: sampling nugget effect.
Table 4.
Distribution of errors across stages of a gold grade control sampling programme. Refer to Table 1 for the sampling value chain.
Table 4.
Distribution of errors across stages of a gold grade control sampling programme. Refer to Table 1 for the sampling value chain.
| Error | SVC Stage | Sample Type/Activity | TOS Errors | 1 Duplicate Component Error Range | 2 FSE | 3 Other TOS Errors |
|---|---|---|---|---|---|---|
| Sampling | 2 & 3 | In-situ sampling (e.g., core and linear samples) | GNE, DE, EE, WE, PE | ±20–70% | GNE | |
| ±16% | ±23% | |||||
| Broken rock sampling (e.g., grab, sludge, and RC samples) | FSE, GSE, DE, EE, WE, PE | |||||
| Preparation | 4 | Drying | PE | ±5–20% | ±11% | |
| Crushing/grinding | PE | |||||
| Splitting | FSE, GSE, DE, EE, PE | |||||
| Analytical | 5 | Splitting | FSE, GSE, DE, EE, PE | ±1–15% | ±8% | |
| Analysis | AE | |||||
| Total error | ±20–70% | ±21% | ±23% | |||
| Target error (fine-gold)/coarse-gold | (±20%) ±40% | ±32% | ||||
1 Potential component error range as determined from duplicate sample (pair) analysis [34,41]; 2 Maximum recommended FSE distribution across the sampling stages [37]; 3 Maximum recommended other TOS error distribution across the sampling stages [37]; SVC: sampling value chain; RC: reverse circulation.
Table 5.
Example from a South American project of sampling characteristics for vein-stockwork wall rock mineralisation domains.
Table 5.
Example from a South American project of sampling characteristics for vein-stockwork wall rock mineralisation domains.
| Parameter/Domain | Wall Rocks | Central Vein |
|---|---|---|
| Mineralisation Characteristics | ||
| Geology | Quartz vein stockwork hosted in black shale. Individual veins to 10 mm width | Composite laminated quartz vein |
| Gold deportment | Free gold in quartz and pyrite | Free gold in quartz |
| Domain width (m) | 5 | 1 |
| Grade (g/t Au) | 5 | 16 |
| Nugget effect (%) | 25 | 60 |
| Sampling Characteristics | ||
| >100 µm (%) | >2 | 50 |
| d95Au (µm) | 75 | 650 |
| Sampling constant (K: g/cm1.5) | 630 | 2500 |
| Theoretical sample mass (kg) | 5 | 20 |
| Theoretical mass per unit length (kg/m) | 1 | 20 |
| 1 Duplicate Channel Sample Analysis | ||
| Field component error (%) | 14 | 33 |
| Preparation component error (%) | 8 | 14 |
| Analytical component error (%) | 8 | 11 |
| Total error (%) | 18 | 37 |
| No. pairs (field, preparation, and pulp) | 50 | 50 |
1 Sample protocol comprises 5 kg field sample crushed to P90 −1.5 mm and rotary split to 2 kg, pulverised to P90 −75 µm, and the entire pulp subjected to screen fire assay. Protocol FSE for domains ±7% (wall rocks) and ±20% (central vein), respectively, at 68% reliability. Errors estimated via the method presented in [34,41].
Table 6.
Underground grade control sampling types and methods. Note, strictly drilling is a linear sampling method, though it is classified separately here as it is different from the main grade control methods.
Table 6.
Underground grade control sampling types and methods. Note, strictly drilling is a linear sampling method, though it is classified separately here as it is different from the main grade control methods.
| Sample Type | Sampling Method | Definition | Photograph |
|---|---|---|---|
| Linear | Chip | Individual punctual chip specimens collected in a discontinuous fashion aggregated to form a sample | Figure 2A |
| Chip-channel | Series of continuous chips aggregated to form a sample | Figure 2B, Figure 3 and Figure 4 | |
| Channel | Consistent volume cut across sample zone, can be hand or diamond saw cut | Figure 5A,B | |
| Panel | Large and/or multiple chip or chip-channel samples | ||
| Broken rock | Grab | Hand “grab” of sample from a rock pile | Figure 6 and Figure 7 |
| Drill hole | Diamond core | Solid core of sample over a given length | - |
| Reverse circulation | Chippings over a given length recovered though the centre of the drill string | - | |
| Blast hole/sludge | Chippings over a given length recovered up the outside of the drill string | Figure 8 |
Table 7.
Sample type for different stoping methods during the mining production chain.
| Stoping Method | Stoping Type [Selectivity] | Development and Pre-Production Stage | Production (Stoping) Stage | Post-Production (Mucking and Transport) Stage |
|---|---|---|---|---|
| Shrinkage | Entry [Selective] | Linear samples Grab samples Diamond core Reverse circulation Blast hole/sludge | Linear samples Grab samples Blast hole/sludge | Grab samples |
| Cut and fill | ||||
| Room and pillar | ||||
| Drift and fill | ||||
| Longhole (open and sub-level variants) | Non-entry [Non-selective] | Grab samples | ||
| Sub-level caving | ||||
| Block caving |
Table 8.
Likely sampling errors during the collection of chip or chip-channel samples.
| Sampling Error | 1 Error Magnitude | Error Effect |
|---|---|---|
| DE | Moderate-high | Often high as the sample is generally poorly demarcated. |
| EE | Moderate-high | Expected to be high, as the sample is chipped out and generally leaves an irregular band in 3D. May be extreme if very different rock properties are encountered across a sample. Prone to operator bias for high-grade/shiny sections and/or soft material. |
| WE | Moderate | Dependent upon EE and specifically rock hardness. Can be variable. |
1 Indicative error magnitude: Red: high (> ±15%); Orange: moderate (±5–15%).
Table 9.
Chip sampling attributes for grade control.
| Attribute | Comment |
|---|---|
| Logistics and planning | Easy: can be collected with minimum preparation, though can be time consuming if rock is hard. |
| Frequency of collection | Moderate–high: any reasonable number of samples can be collected, but will take time. |
| Hazard exposure | Low–high: Depends upon sampling location. Local safety protocols must be applied. Requires sampler to be at rock face. Risk of fly rock during collection. |
| Flexibility of method | High: can be undertaken at relatively short notice. |
| Cost | Low–moderate: labour intensive though relatively fast. |
| Sample quality | Low: generally low quality sample. |
| Value proposition | Moderate–low: whilst relatively quick in the production setting, the poor quality sample provides a low value that may lead to ore/waste misclassification. |
Table 10.
Likely sampling errors during the collection of channel samples.
| Sampling Error | 1 Error Magnitude | Error Effect | |
|---|---|---|---|
| Hand Cut | Saw Cut | ||
| DE | Moderate | Moderate | Generally good as the sample is similar to a drill hole. |
| EE | High | Moderate–low | High if different rock properties are encountered across a sample. For hand collected samples, hard rock leads to loss of sample in hard rock as fly particles. In soft/friable material will lead to bias due to oversampling or loss. Saw-cut channels generally better, though cooling water may lead to loss in soft/friable areas. |
| WE | Moderate | Low | Dependent upon EE and specifically rock hardness. Can be variable. Reduced if saw-cut channel. |
1 Indicative error magnitude: Red: high (>±15%); Orange: moderate (±5–15%); Green: low/acceptable (<±5%).
Table 11.
Channel sampling attributes.
| Attribute | Comment |
|---|---|
| Logistics and planning | Moderate–difficult: requires time and/or compressed air saw to collect. |
| Frequency of collection | Moderate: any reasonable number of samples can be collected, but will take more time than chip |
| Hazard exposure | Low–high: Depends upon sampling location. Local safety protocols must be applied. Requires sampler to be at rock face. Risk of fly rock if collected by hand or air pick. Care required if a diamond saw is used due to rotating parts. |
| Flexibility of method | High: can be undertaken at short notice. Slow to cut by hand, 30 min or more for 1 m sample. Can be quite quick to collect a saw-cut sample once the saw is set up. |
| Cost | High: labour intensive and can require compressed air saw. |
| Sample quality | High: potentially a high quality sample. |
| Value proposition | Moderate–high: whilst relatively time consuming and costly, the higher quality sample provides increased value. |
Table 12.
Likely sampling errors during the collection of panel samples.
| Sampling Error | 1 Error Magnitude | Error Effect |
|---|---|---|
| DE | Low–moderate | Generally good as the sample is delineated on the face. |
| EE | Moderate–high | Can be acceptable, but may be locally high as rock chips are collected. May be very high if different rock properties are encountered across a panel. Oversampling of “shiny” and/or soft/friable material. |
| WE | Low–moderate | Dependent upon EE and specifically rock hardness. Can be variable. |
1 Indicative error magnitude: Orange: moderate (±5–15%); Green: low/acceptable (<±5%).
Table 13.
Panel sample attributes.
| Attribute | Comment |
|---|---|
| Logistics and planning | Moderate–difficult: requires time to collect by hand. |
| Frequency of collection | Low–moderate: any number of samples can be collected, but will take time and depend upon sample size. |
| Hazard exposure | Low–high: Depends upon sampling location. Local safety protocols must be applied. Requires sampler to be at rock face. Risk of fly rock during collection. |
| Flexibility of method | High: can be undertaken at short notice, but may take at least 30 min per sample to collect. |
| Cost | Moderate–high: potentially cost intensive for large samples. |
| Sample quality | Moderate–high: potentially a high quality sample with large area of face coverage. |
| Value proposition | Moderate–high: whilst relatively time consuming and costly, will provide a large sample mass. |
Table 14.
Sample quality rating as applied at the Gwynfynydd mine. Rating applied to both chip-channel 1 and panel 2 samples.
Table 14.
Sample quality rating as applied at the Gwynfynydd mine. Rating applied to both chip-channel 1 and panel 2 samples.
| Sample Quality | Code | Definition |
|---|---|---|
| High | HQ | Well-defined and extracted/recovered sample. Clear cut channel or paneled area. Sample mass >90% of target mass |
| Medium | MQ | Moderate to well-defined and moderately extracted/recovered sample. Sample mass 70–90% of target mass |
| Low | LQ | Moderately defined and poorly extracted/recovered sample. Sample mass <70% of target mass |
1 Target channel sample mass generally 5 kg/m; 2 Target panel sample mass 50 kg across 2–3 m by 0.5 m panel area.
Table 15.
Example of mass recovery (quality index (QI)) for linear samples across quartz-dominated vein mineralisation from a North American mine [42].
Table 15.
Example of mass recovery (quality index (QI)) for linear samples across quartz-dominated vein mineralisation from a North American mine [42].
| Sample Type | No. Samples | 1 Expected (kg/m) | 2 Data Range (kg/m) | 3 Under-Sampled (%) | 4 Target (%) [within ±5%] | 5 Over-Sampled (%) | 6 Quality Rating (%) |
|---|---|---|---|---|---|---|---|
| Chip | 105 | 2.0 | 0.4–1.8 | 100 | 0 | 0 | 0 |
| Chip-channel | 135 | 2.0 | 1.0–3.2 | 50 | 24 | 26 | 24 |
| Panel (hand cut) | 45 | 6.0 | 4.7–7.1 | 50 | 41 | 9 | 41 |
| Channel (air-pick cut) | 135 | 2.5 | 1.3–2.8 | 43 | 42 | 5 | 42 |
| Channel (hand cut) | 120 | 3.0 | 1.8–3.9 | 36 | 53 | 11 | 53 |
| Channel (saw cut) | 125 | 3.0 | 2.2–3.5 | 20 | 75 | 5 | 75 |
1 Mass of sample based on chip or channel target volume; 2 actual range of mass collected: 3 proportion of samples below 95% of target mass; 4 proportion of samples within target ±5% mass; 5 proportion of samples above 105% of target mass; 6 and proportion of samples within target ±5% mass.
Table 16.
Examples of grab sample performance from two contrasting mineralisation styles from South America [42].
Table 16.
Examples of grab sample performance from two contrasting mineralisation styles from South America [42].
| Parameter | Mine I | Mine II |
|---|---|---|
| Characteristics of Mineralisation | ||
| Mineralisation style | Epithermal vein | Mesothermal vein |
| Gold deportment | Free gold disseminated through quartz | Free gold within quartz and pyrite |
| Percentage > 100 µm | 0 | 45 |
| Liberation diameter (µm) | 50 | 850 |
| Sampling constant (K) | 90 | 7400 |
| Nugget effect (from drilling) (%) | 17 | 72 |
| Granulometric Characteristics 1 | ||
| Screened tonnage (t) | 51 | 54 |
| −3 mm grade (g/t Au) | 10.1 | 49.4 |
| +3–6 mm grade (g/t Au) | 9.6 | 36.9 |
| +6–12 mm grade (g/t Au) | 9.2 | 28.6 |
| +12–25 mm grade (g/t Au) | 9.0 | 19.7 |
| +25–50 mm grade (g/t Au) | 8.8 | 4.6 |
| +50 mm grade (g/t Au) | 8.4 | 2.2 |
| Weighted lot mean grade | 9.2 | 12.2 |
| Grab Sample Duplicate Analysis 2 | ||
| Field component error (%) | 27 | 68 |
| Preparation component error (%) | 10 | 26 |
| Analytical component error (%) | 7 | 8 |
| Total error (%) | 30 | 73 |
| No. of pairs (each of field, preparation and pulp duplicates) | 50 | 50 |
| Test Stope Reconciliation 3 | ||
| Grab sample mass (kg) | 3–4 | 4–6 |
| Sample location | Underground re-muck pile | Surface stockpile |
| No. grab samples collected | 285 | 325 |
| Stope tonnage (t) | 8000 | 9400 |
| Plant reconciled head grade (g/t Au) | 9.0 | 10.9 |
| Grab sample mean grade (g/t Au) | 9.6 | 24.7 |
| Grab/mill head grade (%) | 107 | 227 |
| Grab sample RSV (%) | 75 | 335 |
1 Granulometric tests undertaken on an individual development round. Each lot was screened and then crushed in its entirety to P90 −5 mm and 100 kg split off by rotary sample divider to yield an FSE of ±20% at 68% reliability. Each sample was submitted to a laboratory where it was ground to P90 −2 mm and 25 kg split off by rotary sample divider to yield an FSE of ±20% at 68% reliability. The entire 25 kg was cyanide leached. 2 Analysis was undertaken on a number of duplicates taken from the test stope programme.3 Granulometric and duplicate studies based on stope ore.
Table 17.
Sampling errors and their impact on grab sampling.
| Sampling Error | 1 Error Magnitude | Error Effect During Grab Sampling |
|---|---|---|
| FSE | High | Relates to collection of a sample that is generally too small for the lot and is biased to the finer fractions. |
| GSE | High | The muckpile bears a natural segregation particularly of fines that settle to the pile base. |
| DE | High | Routine grab samples only sample the surface of the muckpile. Delimited zone is not representative of the pile. Large tracts of the pile go effectively unsampled. |
| EE | High | The poorly delimited sample does not extract all the rock fragments within the sample zone due to differential fragment sizes. |
| WE | Moderate | Consistent mass usually collected, though can be variable from sample to sample. |
1 Indicative error magnitude: Red: high (>±15%); Orange: moderate (±5–15%).
Table 18.
Grab sampling attributes.
| Attribute | Comment |
|---|---|
| Logistics and planning | Easy: relatively easy to undertake. |
| Frequency of collection | High: numerous small (<6 kg) samples can be collected. |
| Hazard exposure | Low–high: Depends upon sampling location; risk with multiple small samples as composite high mass results in manual handling issues. Sampling of surface or underground stockpiles may pose traffic hazards. May require sampler to be at the rock face if collecting from a muck pile. |
| Flexibility of method | High: can be undertaken quickly and at relatively short notice. |
| Cost | Low: relatively easy and quick to collect, cost principally sample preparation and assaying. |
| Sample quality | Poor: prone numerous sampling errors. |
| Value proposition | Low: strong likelihood of bias, and thus ore/waste misclassification. |
Table 19.
Summary of gold assay methods.
| 1 Assay Type | Assay Charge | Nature of Method | Application | Outcome |
|---|---|---|---|---|
| Fire assay (FA) | 30–50 g | The standard method of fire assaying for gold. | Small charge mass. Poor reproducibility in the presence of coarse gold. | Grade |
| Screen fire assay (SFA) | 0.5–2 kg | A variant of FA, the SFA reduces the coarse-gold problem by sieving out the coarse fraction (100–150 μm screens) and assaying it separately. | An effective method for dealing with coarse gold. Can be used on samples up to 10 kg. | Grade Per cent coarse gold |
| LeachWELL (LW) | 0.5–5 kg | Method overcomes the problem of coarse particles by assaying the entire sample. 24 h leach time effective for most coarse gold deposits. | Large charge mass. Effective method for dealing with coarse gold. The method needs to be controlled by assaying the undissolved residues to check for partly dissolved gold. | Grade Leach recovery (if tails assayed) |
| Pulverise and leach (PAL) | 1 kg | Essentially same as LeachWELL. Crushed (approx. P80 −10 mm) sample is leached and pulverised at the same time. 1–1.5 h leach time. | Smaller charge mass. Potentially effective method for dealing with coarse gold. Some issues relate to contamination of pulverise/leach pots. Method needs to be controlled by assaying the undissolved residues to check for partly dissolved gold. | Grade Leach recovery (if tails assayed) |
| Gamma activation (Chrysos Photon Assay) | 0.5 kg | Novel method based on bombarding the sample with high-energy X-rays to produce gamma rays, which are measured across a given energy for gold. | Moderate charge mass. Sample preparation requires just coarse crush. Reported 1–2 min analysis time. | Grade |
| Whole sample gravity processing (GRAV) | >5–500 kg | Takes a large sample and processes entirely via gravity (e.g., Knelson and/or Wilfley table) to produce a gold concentrate and tails for assay. | Very large charge mass. Effective method for dealing with coarse gold. Method needs to be managed to ensure maximisation of gold recovery. Not useful for fine gold, unless gravity used for gold-rich sulphide concentration and/or clustered fine gold is present, hence larger sample warranted. | Grade GRG (single-stage) Leach recovery (if tails leached) Gold particle size profile (if GRG screened) |
1 Assay type (e.g., LW) with charge size (e.g., 2000 g) given as LW2000. GRG: gravity recoverable gold.
Table 20.
Sensitivity of the FSE and sampling errors based on ore type (grade and liberation diameter) and sample protocol.
Table 20.
Sensitivity of the FSE and sampling errors based on ore type (grade and liberation diameter) and sample protocol.
| 1 Preparation-Assay Protocol | 2 FSE (%) | Comments | 3 Total Error | |||
|---|---|---|---|---|---|---|
| Fine Gold | Coarse Gold | Fine Gold | Coarse Gold | |||
| (A) | (1) 2.5 kg crush to P80 −3 mm (2) Pulverise to P90 −75 µm, scoop off 30 g (3) Take for FA30 | ±5 | ±8–30 | Coarse gold FSE range reflects potential efficiency of the pulverising process, where coarse gold (>100 µm) may remain after pulverising Scooping of 30 g from pulp will promote DE, EE and GSE | Low | High |
| (B) | (1) 2.5 kg crush to P80 −3 mm, riffle split off 500 g (2) Pulverise to P90 −75 µm (3) Take for LW500 | ±17 | ±165 | High FSE in both cases indicates splitting at P80 −3 mm As entire 0.5 g sample is pulverised and LW500, then minimal errors at this stage | Mod | High |
| (C) | (1) 2.5 kg crush to P80 −3 mm (2) Pulverise to P90 −75 µm, riffle split off 0.5 kg (3) Take for LW500 | ±1 | ±2–10 | Scooping of 0.5 kg from 2.5 kg of pulp will promote DE, EE and GSE Splitting of 0.5 kg from 2.5 kg must be undertaken using a rotary splitter, particularly in the coarse gold case to minimise DE, EE, and GSE | Low | High |
| (D) | (1) 2.5 kg crush to P80 −3 mm (2) Pulverise to P90 −75 µm, riffle split off 2 kg (3) Take for LW2000 | ±1 | ±1–5 | Approach minimises all sampling errors including FSE Splitting of 2 kg from 2.5 kg should be undertaken using a rotary splitter, particularly in the coarse gold case to minimise DE, EE, and GSE | Low | Low |
1 Based on gold grade of 6 g/t Au; fine gold liberation diameter 50 µm (K = 115 g/cm1.5); coarse gold liberation diameter 1000 µm (K = 10,200 g/cm1.5); Francois-Bongarçon modified FSE equation (Equation (1)) applied using default alpha at 1.5 and 68% reliability; sampling errors as defined in Table 2; assay methods as defined in Table 19. Protocols expedited with good practice and QAQC (Table 21). FA30: 30 g fire assay; LW500-2000: LeachWELL 500 g to 2000 g. 2 FSE error definition: Red: high (>±30%); Orange: moderate (±20–30%); Green: low (<±20%). 3 Indicative total error: Red: high (>±50%); Orange: moderate (±30–50%); Green: low (<±30%).
Table 21.
Best practice QAQC for a grade control sampling programme that informs a resource estimate.
Table 21.
Best practice QAQC for a grade control sampling programme that informs a resource estimate.
| QAQC Action | 11 Rate | Instigator | Key Performance Indicators Fine Gold/[Coarse Gold] | |
|---|---|---|---|---|
| 1 Field duplicates | 1 in 20 | Operation | 90% ±10–25% HARD 10 [90% ±25–50% HARD] | 90% ±13–35% RSV [90% ±35–70% RSV] |
| 2 Sample quality index | All | Operation | Depends upon sample type; for saw-cut channels >80%; for diamond drill core >85% recovery | |
| 3 Coarse reject duplicates | 1 in 20 | Laboratory | 90% ±10–20% HARD [90% ±20–50% HARD] | 90% ±13–28% RSV [90% ±26–70% RSV] |
| 4 Pulp duplicates | 1 in 20 | Laboratory | 90% ±10% HARD [90% ±10–20% HARD] | 90% ±13% RSV [90% ±13–28% RSV] |
| 5 Certified Reference Materials | 1 in 20 | Operation and laboratory | <2δ (“safe zone”) no action required 2δ–3δ (“warning”) investigate (re-assay 25% of batch if required) >3δ (“action”) re-assay 100% of batch | |
| 6 Blanks | 1 in 20 | Operation and laboratory | Less than 0.05 g/t Au | |
| 7 Pulp quality | 1 in 20 | Laboratory | 95% to be P95 −75 µm | |
| 8 Barren flush | 1 in 20–50 | Laboratory | <<0.5% gold loss | |
| 9 Umpire | 1 in 20 | Operation | 90% ±10% HARD | 90% ±13% RSV |
| Laboratory audit | Quarterly | Operation | Full adherence to agreed practices and performance levels | |
| QAQC review | Monthly | Operation and laboratory | Compliance across all metrics | |
1 Applies to any sample type collected. 2 Applied to linear and drill samples; key performance indicators (KPIs) based on sample type and expected mass. 3 Laboratory crusher or RC rig rejects. 4 Dependent upon nature of ore and assay method. For samples assayed via screen fire assay (SFA), a high precision would be expected for undersize fraction. 5 Recommendation to have a minimum of three CRMs at grades ranging from cut-off, ROM, and high-grade. For any batch of (say) 20–30 samples, the three key CRMs should be added. Note that by their very need to be homogeneous, CRMs do not bear coarse gold, but they can be matrix matched by being quartz-dominated, sulphide-bearing, etc. The laboratory will also insert its own CRMs. CRMs used for SFA process will just be fire assayed. Action is required if 3δ breached, usually re-assay of the entire batch if possible. 6 Blanks provide a measure of contamination. They should be inserted after expected high-grade and/or visible gold-bearing samples. If substantial visible gold is present, two separate blanks should be placed after the sample. One blank should be added together with the three CRMs per batch. Laboratory will also place blanks into the sample stream. 7 Test involves screening (or use of an autosizer) of the pulp to ensure 95% passing. All samples should pass or the entire batch should be reground. 8 Barren flush may be inserted after each and every sample for coarse gold samples. Assaying of the barren flush; for fine gold ores, a rate of 1 in 50 is appropriate increasing to 1 in 20 for coarse gold ores. Careful management of coarse gold ores is required. It is suggested that laboratories include a “wash” after visibly high-grade (e.g., visible gold-bearing) samples. However, if the ore bears notable coarse gold, then cleaning is best after each sample given that even low grade samples can bear coarse gold particles. 9 Monthly submission of samples (typically pulps), including standards and duplicates is sufficient to provide a check of primary laboratory results. This is especially important where an on-site laboratory is being used as it provides independent confirmation of the results. Where SFA, LW, or PAL is used, there may be no pulp residues to submit. In this case, coarse rejects can be used. Umpire samples (e.g., pulps or coarse duplicates) should be returned to the mine and submitted by mine staff to the umpire laboratory. In some cases, the laboratory (mine or off-site) may submit umpire samples as part of their internal QAQC. 10 HARD is half the absolute difference of the pair divided by the pair mean; HARD value for fine versus [coarse gold]; HARD can be expressed as RSV, where HARD = , e.g., ±10% HARD is ±13% RSV. 11 It is important to ensure that enough QA data is collected, particularly during a small sampling programme. The rate of insertion of CRMs, blanks, etc. may need to be increased beyond the nominal 1 in 20 to achieve a minimum of 10 results.
Table 22.
Example from an Australian mine showing comparison between chip and channel sample replicates. Total number of samples in each type was 75. Mean grades cut and diluted to stope width. Reconciled stope head grade 13.7 g/t Au.
Table 22.
Example from an Australian mine showing comparison between chip and channel sample replicates. Total number of samples in each type was 75. Mean grades cut and diluted to stope width. Reconciled stope head grade 13.7 g/t Au.
| Type | Mean Support (kg/m) [Range] | Target Support (%) [within ±5%] | Mean Grade (g/t Au) | Percent of Mined Grade (%) | RSV (%) | Nugget Effect (%) | 1 Sample Collection Errors | 2 Preparation and Assay Errors |
|---|---|---|---|---|---|---|---|---|
| Chip-channel | 2.1 [1.4–3.4] | 22 | 21.3 | +55 | 198 | 68 | High: DE, EE, and WE | Low: entire sample crushed and pulverised prior to total sample screen fire assay with triplicate fine-fraction fire assay. All equipment cleaned between samples. |
| Channel (hand cut) | 2.6 [2.1–3.3] | 63 | 16.7 | +22 | 135 | 54 | Low-moderate: DE, EE, and WE | |
| Channel (saw-cut) | 2.8 [2.3–3.1] | 77 | 16.3 | +19 | 81 | 41 | Low: DE, EE, and WE |
1 Indicative sample collection error definition: Red: high (>±50%); Orange: moderate (±20–50%); Green: low (<±20%). 2 Indicative preparation and assay error: Red: high (>±20%); Orange: moderate (±10–20%); Green: low (<±10%).
Table 23.
Example from a North American mine of RSV values for duplicates taken across each mine face [42]. See also Table 24, Mine B example.
| Sample Type/Error (Preparation Route) | Sampling (%) | Preparation (%) | Analytical (%) | Total (%) |
|---|---|---|---|---|
| 1 m 3 kg Field Sample | Crushed to <1.5 mm; Riffle Split into 1.5 kg Sub-Samples | Pulverised to 75 µm; 50 g Riffle Split from 1.5 kg for Fire Assay | 1 m 3 kg Sample to Duplicate 50 g Fire Assay | |
| Chip | 67 | 31 | 17 | 76 |
| Channel (hand) | 48 | 29 | 14 | 58 |
| Channel (saw) | 21 | 27 | 15 | 37 |
| Estimated stage FSE | - | 23 | 18 | 29 |
Table 24.
Examples from South (Mine A) and North (Mine B) America showing error comparison between two differing styles of gold mineralisation [42].
Table 24.
Examples from South (Mine A) and North (Mine B) America showing error comparison between two differing styles of gold mineralisation [42].
| Parameter | Mine A | Mine B |
|---|---|---|
| Characteristics of Mineralisation | ||
| Mineralisation style | Epithermal vein | Mesothermal vein |
| Mining method | Underground (long-hole open stoping) | Underground (shrinkage stoping) |
| GRG component (%) | 20 | 55 |
| Grade (g/t Au) | 10 | 15 |
| Grade RSV (%) | 67 | 117 |
| Nugget effect (%) | 20 | 65 |
| Liberation diameter (µm) | 70 | 750 |
| Sampling Constant (K) | 115 | 2600 |
| Routine sample type used | Chip | Channel (hand cut) |
| Pairwise RSV for Each Error | ||
| No. of duplicate pairs used | 50 | 50 |
| Chip (sampling error) | 31% | 67% |
| Channel [hand] (sampling error) | 27% | 48% |
| Channel [saw-cut] (sampling error) | 25% | 21% |
| Range of preparation errors | 10–14% | 27–31% |
| Range of analytical errors | 7–11% | 14–17% |
Table 25.
Potential contribution of grade control samples to geometallurgical ore control. Assumes best practice sample collection for all samples. Green: applicable; Orange: potentially; Red: no.
Table 25.
Potential contribution of grade control samples to geometallurgical ore control. Assumes best practice sample collection for all samples. Green: applicable; Orange: potentially; Red: no.
| Sample Type/Geomet Parameter | In-Situ Rock | Broken Rock | ||||
|---|---|---|---|---|---|---|
| Drill | Linear | |||||
| Core | RC | Sludge | Chip | Channel 1 | Grab | |
| Geochemistry/mineralogy | ||||||
| Rock mass | ||||||
| Comminution | ||||||
| Metallurgical recovery | ||||||
| Geoenvironmental | ||||||
1 Includes hand-cut and saw-cut channels and panel samples.
Table 26.
Example of risk review for a grade control sampling programme used to support a resource estimate [6].
Table 26.
Example of risk review for a grade control sampling programme used to support a resource estimate [6].
| Key Parameter | Comment | Material Error | 1 Total Error Rating | |
|---|---|---|---|---|
| 1 | Spatial distribution and number of samples | Samples collected at approx. 2 m intervals along drives. Raises not sampled Each stope block informed by around 20–25 samples | GNE | Moderate |
| 2 | Sample mass | Each face composite sample approx. 2–4 kg; total sample mass collected approx. 65–70 kg Indicated optimum mass around 450 kg to achieve 90% ±15% | GNE | High |
| 3 | Degree of domaining | Wall rock and central shear sampled separately | - | Low |
| 4 | Collection and handling | Samples collected by chip-channel Uneven weighting across the face, where the soft narrow central-shear is oversampled (approx. 5–6 kg/m) compared to the wall rocks (approx. 2–3 kg/m) All samples placed into calico bags and tied | EE, WE | High |
| 5 | Transport and security | No chain of custody recorded between mine and off-site laboratory | PE | Moderate |
| 6 | Preparation | Entire sample lot crushed and pulverised, and 30 g riffle split for fire assay Equipment cleaning variable | FSE, GSE, DE, EE, PE | High |
| 7 | Assay | Fire assay process undertaken correctly, but together with 6 not appropriate for coarse gold ore | - | Moderate |
| 8 | QAQC | One CRM used at high grade (70% within 3δ; 30% above 3δ) Few blanks used No written protocols for the sampling-assaying process | PE, AE | High |
| 9 | Validation | Plant recovers 35% less gold than estimate | - | High |
| Sample representativity (1)–(4) | Poor | |||
| Assay quality (5)–(8) | Poor | |||
| Fit-for-purpose rating (1)–(9) | Poor | |||
1 Indicative overall error definition: FSE: Red: high (>±30%); Orange: moderate (±20–30%); Green: low (<±20%).
Table 27.
Summary of steps to achieve optimal grade control sampling programmes.
| Stage | Key Activity |
|---|---|
| 1: Scope |
|
| 2: Develop |
|
| 3: Execute |
|
| 4: Validate |
|
| 5: Refine |
|
Table 28.
Summary of sampling errors and risk rating for grade control sampling. For linear/broken rock sampling, it assumes a fully equipped two-person team to achieve best practice sample collection. Errors are best-case scenarios based on careful sample collection/operation.
Table 28.
Summary of sampling errors and risk rating for grade control sampling. For linear/broken rock sampling, it assumes a fully equipped two-person team to achieve best practice sample collection. Errors are best-case scenarios based on careful sample collection/operation.
| Sample Type | Summary | 1 Sampling Errors | 2 Total Error Rating | ||
|---|---|---|---|---|---|
| DE | EE | WE | |||
| Linear | |||||
| Chip | Easy to collect, relatively fast High number can be collected Cheap | High | |||
| Chip-channel | Relatively easy to collect and fast Moderately high number can be collected Moderately cheap | High | |||
| Channel (hand-cut) | Less easy to collect, requires effort Moderately high number can be collected Higher cost | Mod | |||
| Channel (saw-cut) | Requires effort and specialist equipment Moderate number can be collected Higher cost | Low | |||
| Panel | Medium-large sample size (>25 kg) Large sample size Less easy to collect Moderate number can be collected | Mod | |||
| Broken Rock | |||||
| Grab | Relatively easy to collect Moderate number can be collected Cheap | High | |||
| Drilling | |||||
| Diamond core | Well established method Good geological information Relatively costly | Low | |||
| Reverse circulation | FSE potentially mod-high when sub-sample split from original, though modern technology much improved Cheaper than core drilling | Low | |||
| Sludge (blasthole) | FSE potentially mod-high when sub-sample split from original Sample collection/splitting at the rig problematic, though some mines have devised a reasonable catcher system Cheap | Mod | |||
| Mini-bulk (<1 t)/Bulk (>1 t) | |||||
| Bulk | Comprise (i) panel or (ii) blasted/excavated blocks Careful planning required Good geological and geotechnical information Relatively costly depending upon mass | Low | |||
1 Indicative sampling error definition: FSE: Red: high (>±30%); Orange: moderate (±20–30%); Green: low (<±20%). 2 Indicative total error: Red: high (>±50%); Orange: moderate (±30–50%); Green: low (<±30%).
© 2018 by the authors. Licensee MDPI, Basel, Switzerland. This article is an open access article distributed under the terms and conditions of the Creative Commons Attribution (CC BY) license (http://creativecommons.org/licenses/by/4.0/).
Share and Cite
MDPI and ACS Style
Dominy, S.C.; Glass, H.J.; O’Connor, L.; Lam, C.K.; Purevgerel, S.; Minnitt, R.C.A. Integrating the Theory of Sampling into Underground Mine Grade Control Strategies. Minerals 2018, 8, 232. https://doi.org/10.3390/min8060232
AMA Style
Dominy SC, Glass HJ, O’Connor L, Lam CK, Purevgerel S, Minnitt RCA. Integrating the Theory of Sampling into Underground Mine Grade Control Strategies. Minerals. 2018; 8(6):232. https://doi.org/10.3390/min8060232
Chicago/Turabian StyleDominy, Simon C., Hylke J. Glass, Louisa O’Connor, Chloe K. Lam, Saranchimeg Purevgerel, and Richard C.A. Minnitt. 2018. "Integrating the Theory of Sampling into Underground Mine Grade Control Strategies" Minerals 8, no. 6: 232. https://doi.org/10.3390/min8060232
Note that from the first issue of 2016, this journal uses article numbers instead of page numbers. See further details here.