Selective Flocculation Separation of Fine Hematite from Quartz Using a Novel Grafted Copolymer Flocculant
by
 ,
,
Jinxia Zhang
1, 
Weiguang Sun
1,
Zhiyong Gao
2,*,
Fusheng Niu
1,
Long Wang
1,
Yawei Zhao
1 and
Yuesheng Gao
3,* 1
College of Mining Engineering, North China University of science and technology, Tangshan 063210, China
2
School of Minerals Processing and Bioengineering, Central South University, Changsha 410083, China
3
Department of Chemical Engineering, Michigan Technological University, Houghton, MI 49931, USA
*
Authors to whom correspondence should be addressed.
Minerals 2018, 8(6), 227; https://doi.org/10.3390/min8060227
Submission received: 30 April 2018
/
Revised: 20 May 2018
/
Accepted: 23 May 2018
/
Published: 28 May 2018
Abstract
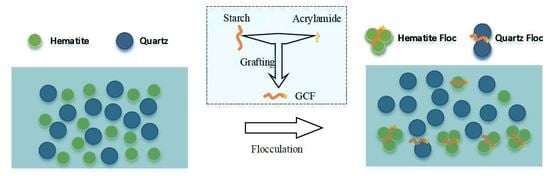
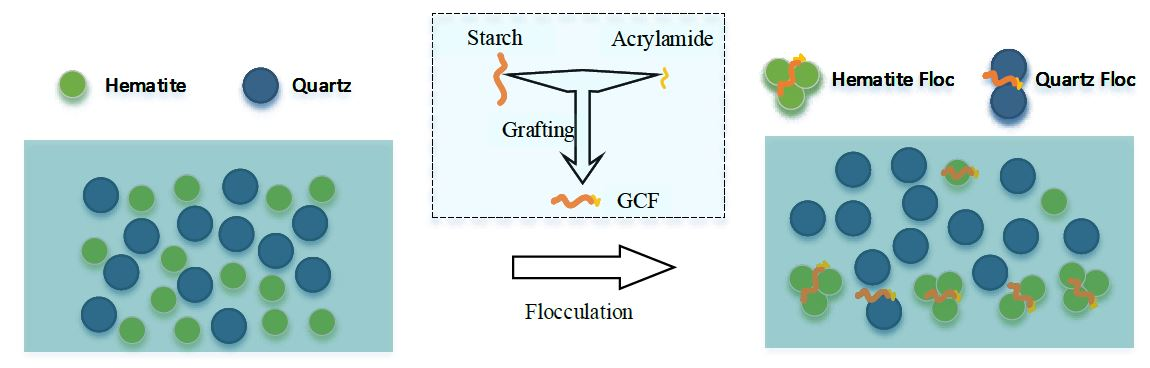
:Beneficiation of ultrafine mineral particles (typically with an average size less than 20 µm) remains a critical problem for the mineral processing industry. Selective flocculation technique has been found to show great potential to tackle this problem, whose success mainly depends on the selective adsorption of a flocculant on the target mineral particles. In this work, a novel copolymer flocculant was synthesized by grafting starch and acrylamide, which for the first time, was employed in the flocculation separation of fine hematite from quartz. The composites of the grafted copolymer flocculant (GCF) were characterized by Fourier transform infrared spectroscopy (FTIR) and scanning electron microscopy (SEM). The single mineral flocculation results showed that at the pH of 10–11 and GCF concentration of 125 mg/L, hematite flocs with a compact texture were formed, whose average diameter and fractal dimension reached 36 µm and 2.02, respectively; while quartz flocs were barely observed, and the average diameter of particles stayed at approximately 20 µm. Furthermore, the selective flocculation separation was confirmed in the mixed mineral flocculation. From adsorption tests and zeta potential measurements, it is shown that GCF tended to adsorb more selectively and intensely on hematite surfaces compared with quartz. This study provides a valuable reference for the efficient recovery of fine hematite particles.
1. Introduction
The growing demand for steel and the depletion of high quality iron ores have boosted the research into the comprehensive utilization of intractable iron resources [1,2,3], among which fine mineral particles (FMPs) account for a large proportion. Previous studies have agreed that a promising FMPs separation technique lies in flocculation, which applies a selective flocculant on the target FMPs [4,5,6]. A selective flocculant has various active functional groups on its molecular chain [7,8]. These functional groups selectively adsorbed on the target mineral through electrostatic interactions, hydrogen bonding, and chemical bonding. In this way, large and loose flocs are formed, leading to the agglomeration of FMPs [9,10,11].
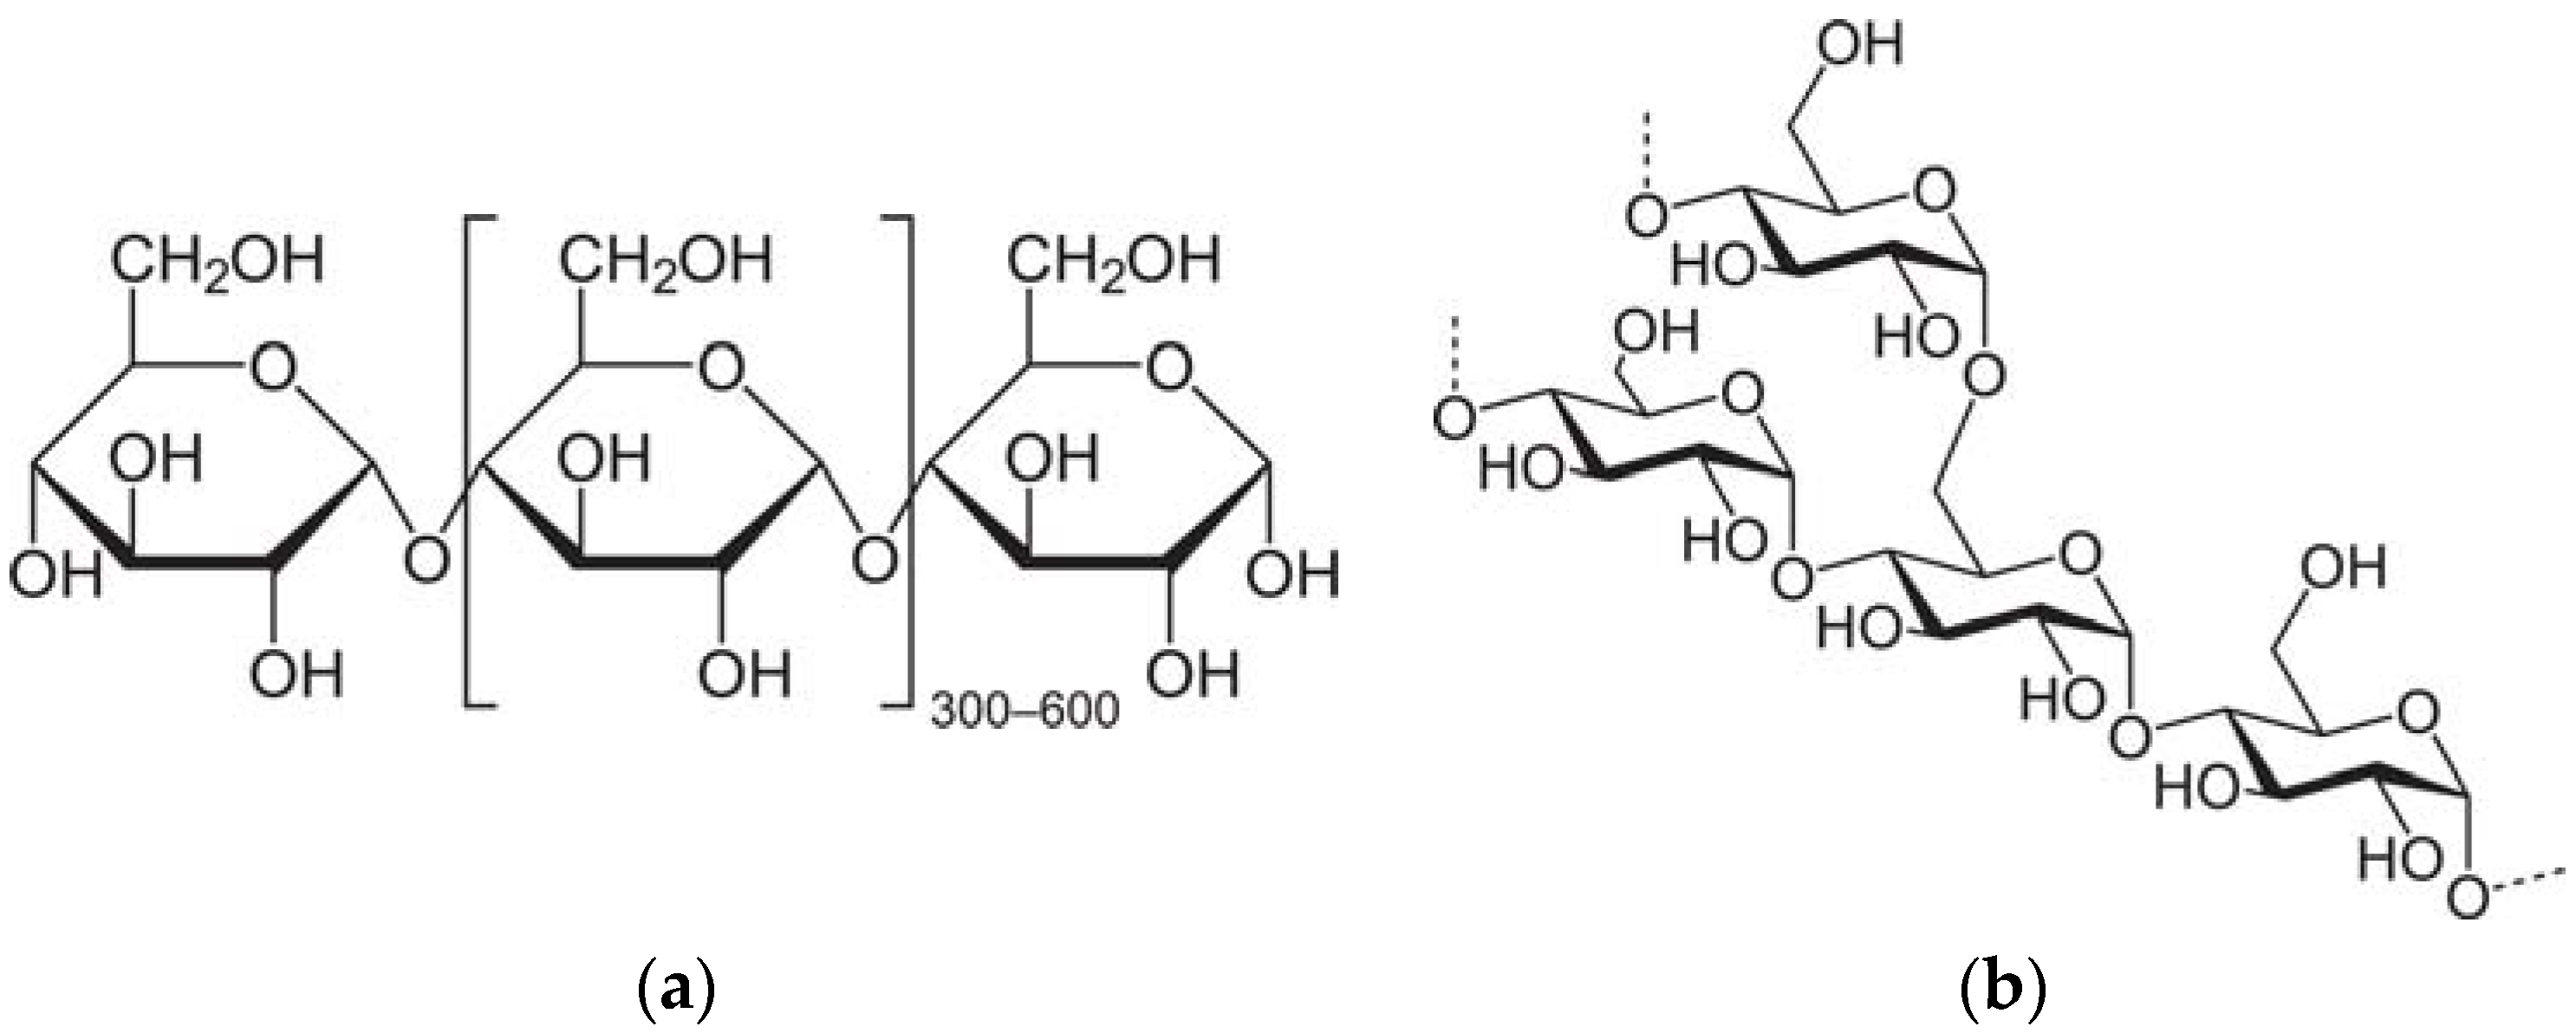
Starch is a commonly used polymer flocculant. In 1975, Tilden Iron Ore mine, MI, USA, applied corn starch to the selective flocculation of fine hematite for the first time. Since then, numerous reports have focused on this topic. Yang et al. [12] attempted to inhibit hematite floatability with corn starch, aiming to disclose the effect of starch solubility on the flocculation-flotation separation of quartz and hematite. The inhibition test showed that corn starch adsorbed on hematite surfaces and then impaired the floatability of hematite. Weissenborn et al. [13] attributed the preferential adsorption of starch on hematite to its high concentration of hydroxylated metal adsorption sites. The structure of the starch molecule also plays a role in its functionality; for example, Pavlovic et al. [14] found that amylose outperforms amylopectin in the adsorption capacity on the mineral surface. The molecular structures are presented in Figure 1. Due to the aforementioned advantages, starch has been, and will continue serving as an effective flocculant. Therefore, the modification of starch by grafting deserves our attention in this work.
Benzoyl hydroxamic acid (PDHA) is another flocculant that has been found to be effective in hematite flocculation and low-grade rare earth concentrates [15]. Taking sodium oleate as the flocculant, Gong et al. explored the selective flocculation behaviours in the apatite-hematite system [16,17]. Fuerstenau et al. [18] suggested hematite flocculation and subsequent flotation to occur in the same pH interval, and the optimal pH for flotation recovery to fall in the range of 6–9.4. Natarajank et al. [19] revealed that fine-grained hematite could be successfully separated from quartz and other gangue minerals by microbiological treatment plus selective flocculation.
So far, considerable research has been done on the flocculation features of fine hematite ores from different perspectives such as floc size and stability. However, there are few reports focusing on the flocculant selectivity for hematite, quartz and argillaceous minerals, which has dampened the selectivity of fine particle flocculation. This paper aimed to develop a highly selective flocculant for fine hematite separation. A new copolymer compound from starch and acrylamide was synthesised, and its molecular structure was assessed by FTIR and SEM. The compound was applied to the selective flocculation of fine hematite, and the mechanism in the separation of fine hematite from quartz was illustrated through particle size tests, zeta potential measurements and adsorption tests.
2. Materials and Methods
2.1. Samples and Reagents
Pure hematite samples (TFe grade: 67.72%) were obtained from Luanxian County, Hebei, China, while quartz samples (grade: 99.87%) were acquired from Jiangsu, China. The mean particle sizes of hematite and quartz were 16.79 µm and 19.41 µm, respectively. The particle size distributions of the two materials are presented in Figure 2.
The reagents include soluble starch ((C6H10O5)n–(H2O)), acrylamide (C3H5NO), ceric ammonium nitrate ((NH4)2Ce(NO3)6), acetone ((CH3)2CO), ethylene glycol ((CH2OH)2), glacial acetic acid (CH3COOH), potassium iodide (KI), acetic acid (CH3COOH), iodine (I2), silicon dioxide (SiO2), potassium chloride (KCl), hydrogen chloride (HCl) and sodium hydroxide (NaOH). All these reagents are analytically pure.
2.2. Methods
2.2.1. Preparation of Starch-Acrylamide Graft Copolymer
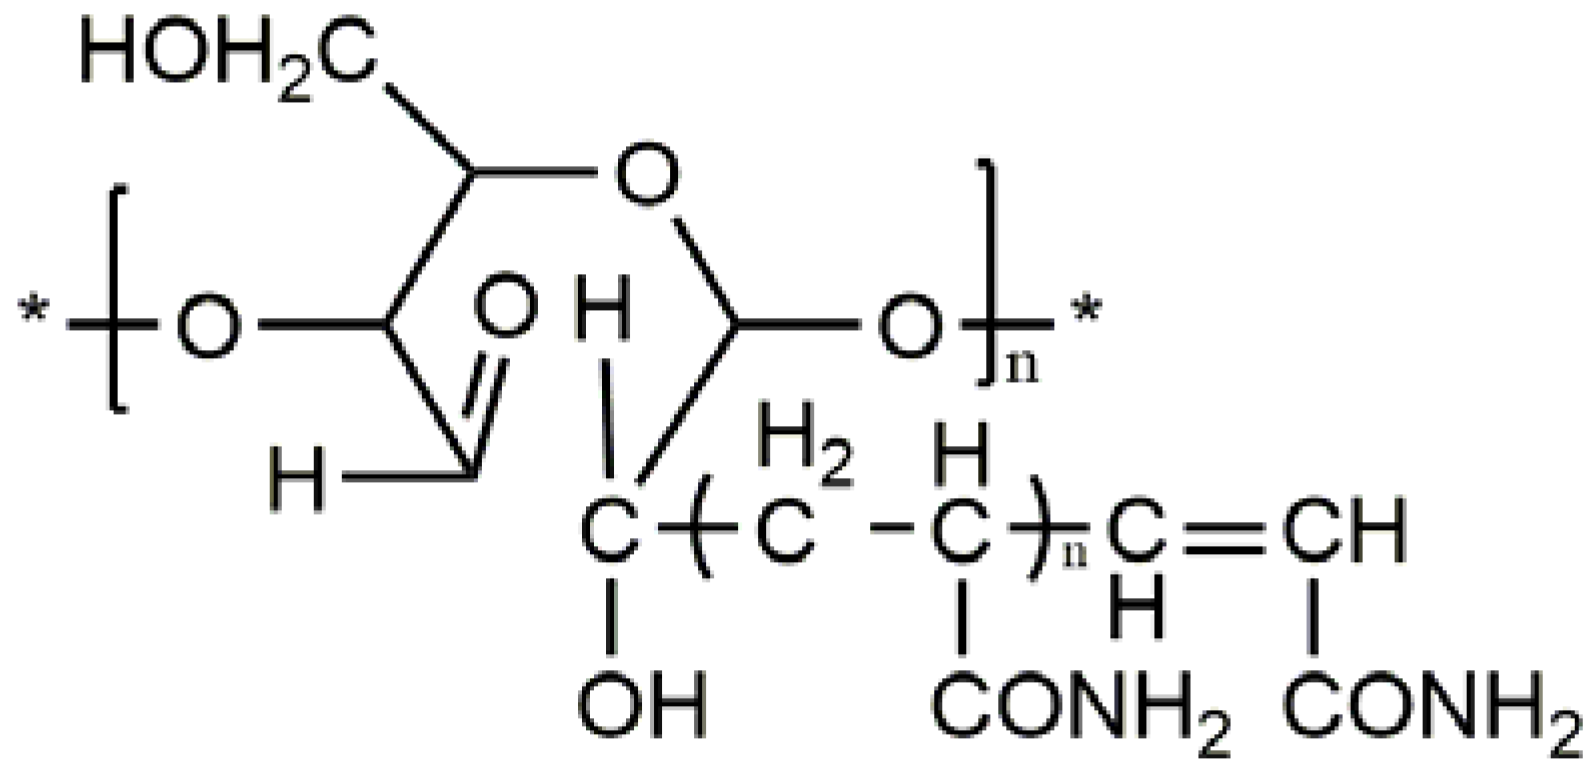
Fixed amounts of soluble starch and distilled water were poured into four flasks, each of which consists of a reflux condenser, an electric stirrer, a nitrogen inlet pipe, a nitrogen outlet pipe and a thermometer. After nitrogen was introduced to each of the flask, the soluble starch was gelatinized at 80 °C for 30 min and cooled to polymerization temperature. Then, the initiator and monomer were added. The mixture was cooled to room temperature upon reaching the required reaction time, forming the polymerization product. The product was washed with acetone and kept in vacuum for drying at 60 °C until the precipitate reached a constant weight. Next, the graft copolymer was relocated to a piece of rectangular filter paper, tied with white cotton, and placed in a Soxhlet extractor. After that, the solution was refluxed to a constant weight using a mixed solvent of the acetic acid and ethylene glycol (volume ratio: 40:60), and the precipitate was dried in a vacuum box at 60 °C. The residues were dissolved in a fixed amount of 0.5 mol/L sodium hydroxide solution at 50 °C and subjected to electromagnetic stirring for a certain period. The stirred solution was filtered, and the filter product was dried to obtain the pure grafted copolymer flocculant (GCF), whose molecular structure is presented in Figure 3.
2.2.2. FTIR Detection
For the characterization of GCF, Fourier transform infrared (FTIR) spectra were collected by a Nicolet-740 Spectrophotometer (Nicolet Instrument Technologies, Inc., Madison, WI, United States). One gram of freshly ground GCF with a size of −2 µm was placed in a 40 mL beaker. After stirring for 30 min, samples were filtered, washed three times with distilled water at the same pH and dried in a vacuum oven at 37 °C for 24 h. Then, infrared adsorption spectra were collected with the potassium bromide (KBr) serving as background.
2.2.3. Scanning Electron Microscopy (SEM) Observation
After gold spraying, the conductive test sample was placed in the vacuum chamber of the FEI Quanta 600 FEG Environmental SEM (FEI, Eindhoven, the Netherlands) to observe the surface micro morphologies and particle size at different magnifications.
2.2.4. Single Mineral Flocculation Tests
In these tests, 4 g of a single mineral was kept in the glass beaker of the TZC-4 instrument and diluted to 100 mL with the required solution and distilled water with stirring. Then, the mixed solution was relocated quickly to the particle analyser, producing the settlement curves under these conditions which will be specified in the Results section. The collected data was processed with the internal data processing module of the instrument. Thus, the size and distribution of hematite flocs were obtained.
2.2.5. Mixed Mineral Flocculation Tests
In these tests, hematite and quartz were mixed at the mass ratio of 1:1 resulting in the Fe grade of 33.75%. Ore pulp was prepared by mixing 15 g samples with 800 mL distilled water in a 1000 mL glass beaker. Then, 1% of GCF was added to the pulp and stirred for 5 min. After stirring, the pulp was relocated quickly to a 1000 mL cylinder and left to settle for 1 min. The supernatant was extracted, and the precipitate was dried, weighed, and analysed. Grade was obtained by X-ray fluorescence (XRF) technology, while the yield was defined as the percentage of the total feeding sample (15 g) precipitated as shown in Equation (1).
2.2.6. Zeta Potential Measurements
Zeta potential measurements were conducted at 20 °C using a Zeta Plus Zeta Potential Analyser (Bruker, Bremen, Germany). The samples were freshly ground in an agate mortar to a size of −2 µm, followed by the dispersion of mineral suspensions containing 0.02 g samples and 40 mL KCl (0.01 mol/L) solution as the background electrolyte in a 100 mL beaker at a given pH and flocculant concentration. After settling for 5 min, the supernatant liquid was transferred to a capillary cell used for the zeta potential measurement. The tests were repeated three times for good reproducibility, and the mean values were chosen to ensure the accuracy.
2.2.7. Adsorption Capacity Tests
The adsorption capacity of the GCF on the mineral surface was an important methodology to measure the flocculation performance of minerals during flocculation. Adsorption tests were carried out on the basis of the principle that after the adsorption, the reduction of the GCF amount in the solution is linearly related to the mineral surface adsorption. The suspension was made following the same procedure as flocculation process and then removed by centrifuging at 5000 r/min for 10 min. The supernatant was run through a UV spectroscope (UV−2000 Shimadzu, Kyoto, Japan) at 490 nm. The equation of mineral surface adsorption is expressed as follows:
where Γ is the adsorption capacity of mineral, mol/g; C0 and C are initial and residual concentrations of the GCF in suspension, mol/L; V is volume of suspension, mL; m is the mass of mineral, g.
3. Results and Discussion
3.1. Characterization of GCF
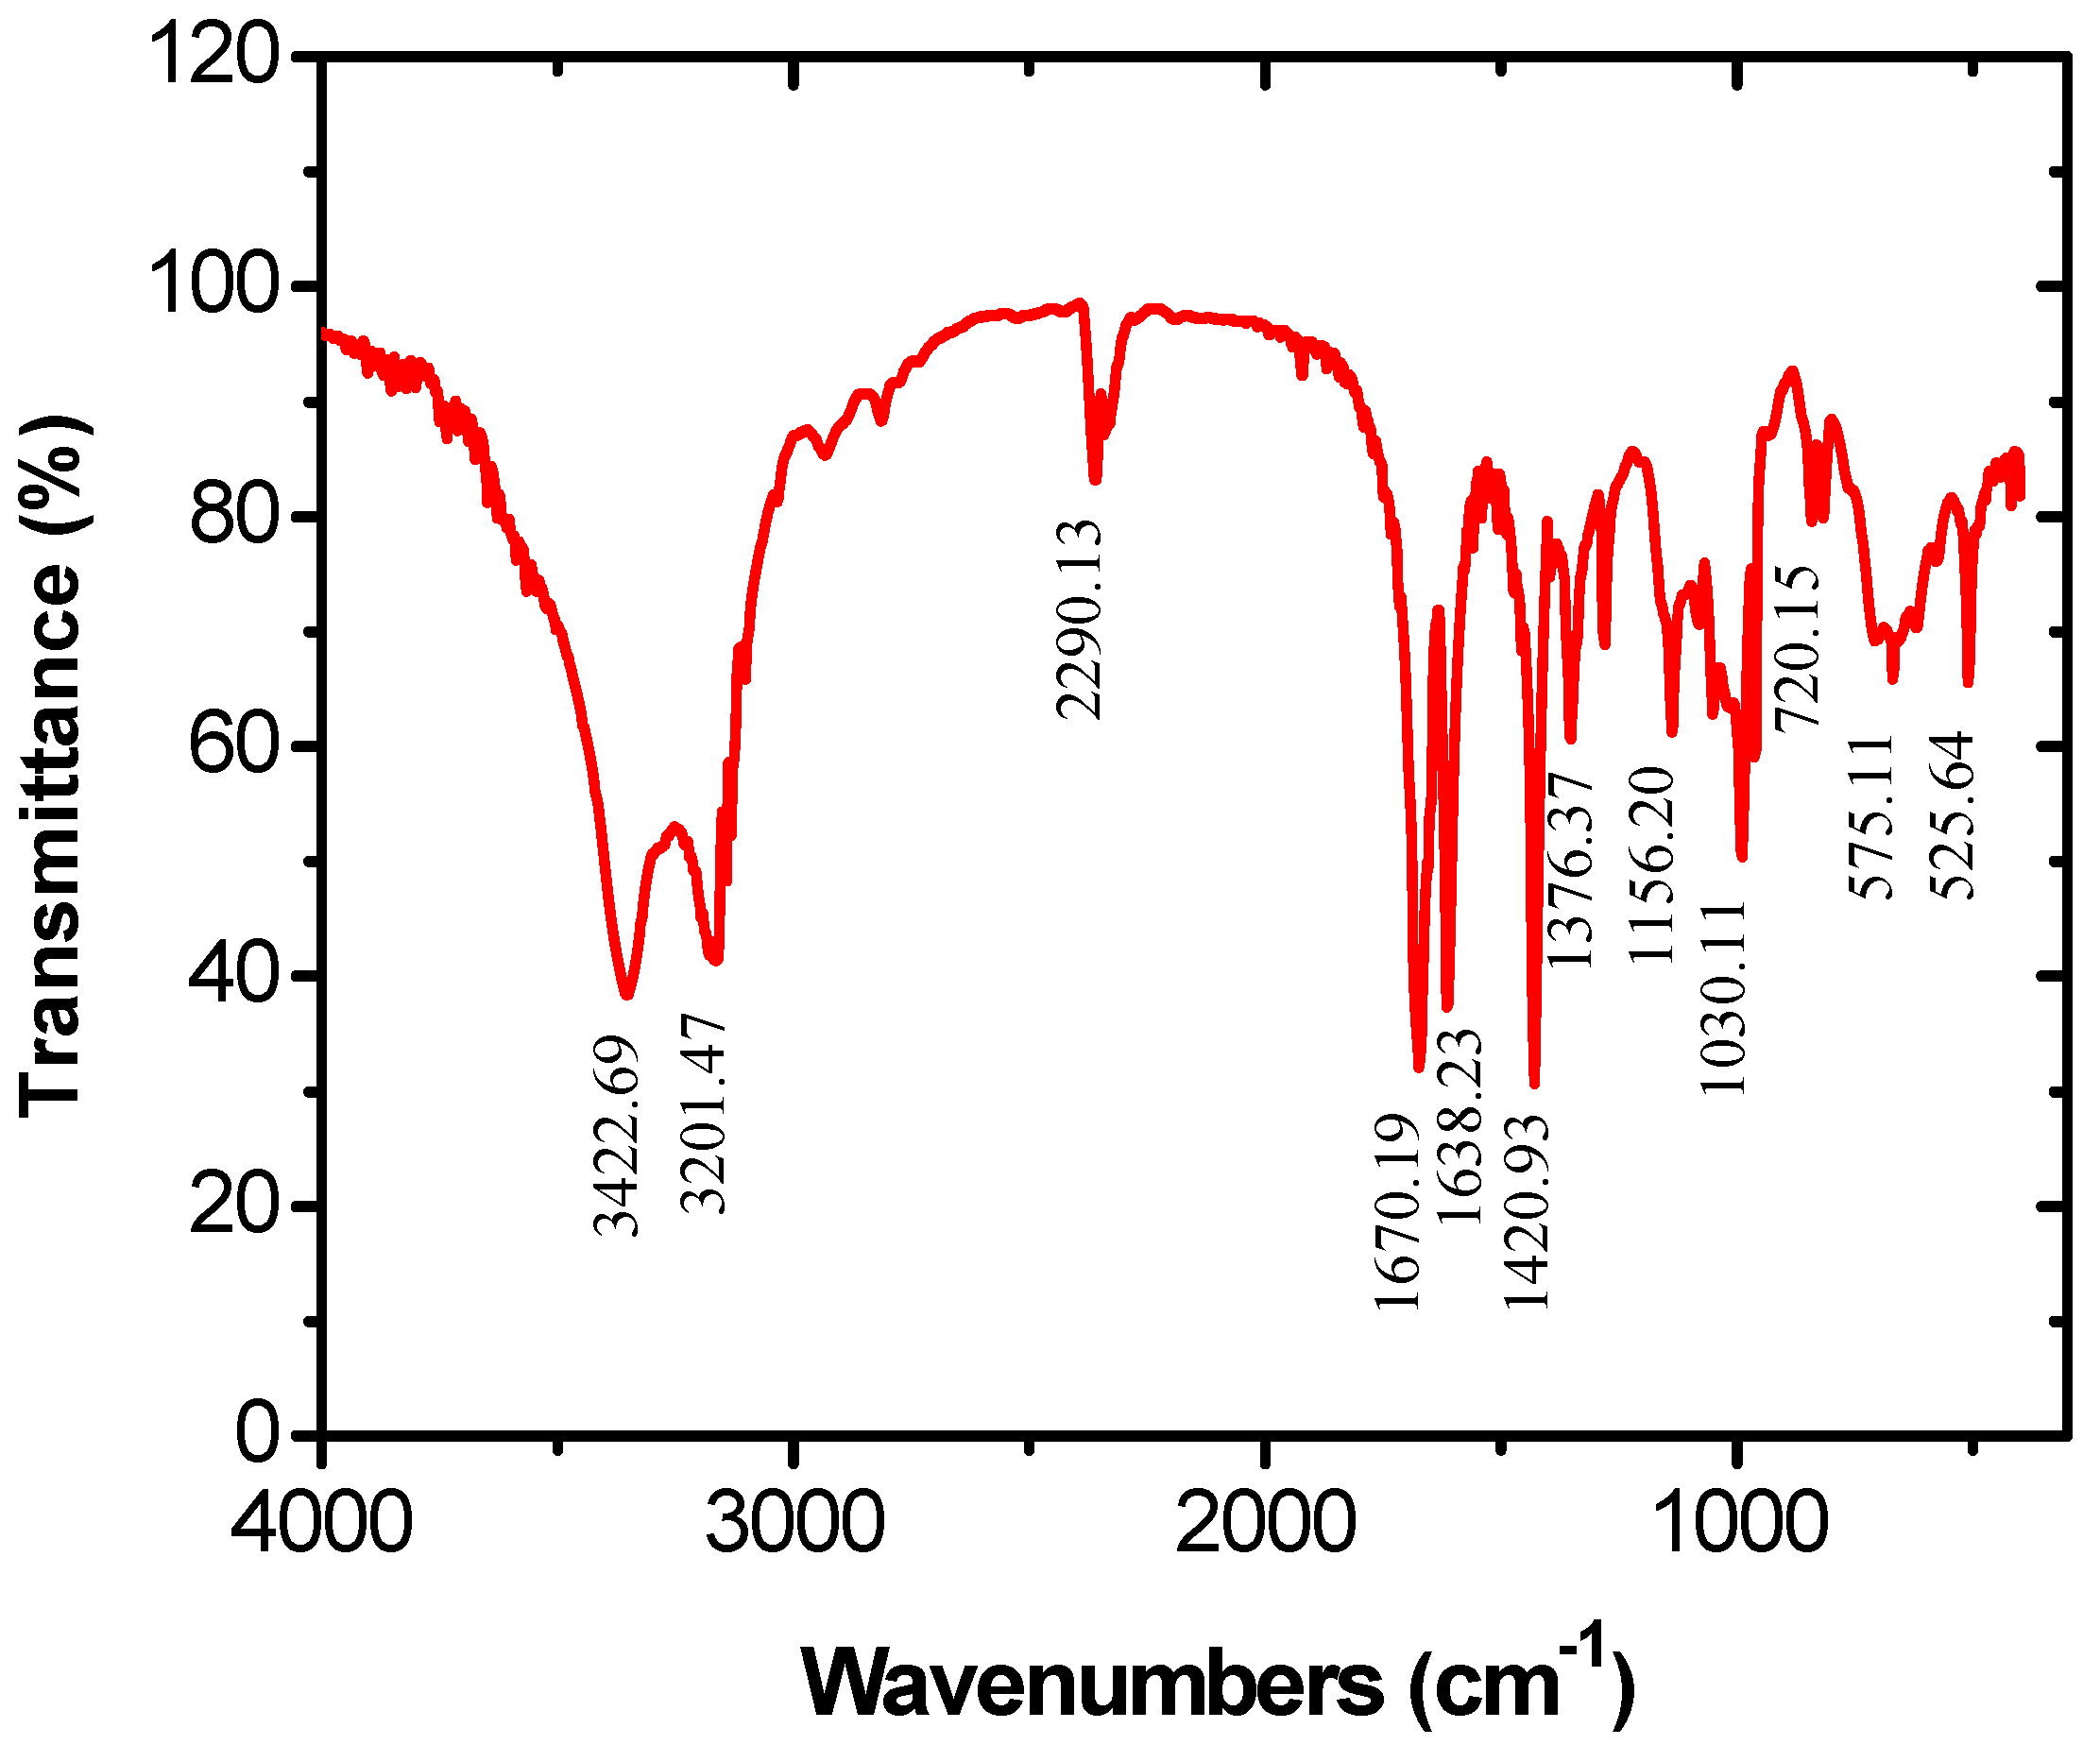
The FTIR spectra of the GCF are displayed in Figure 4. The absorption peak at 3422.69 cm−1 is produced by the superposition between the telescopic vibration peak of –OH in the starch and the telescopic vibration peak of –NH2. The absorption peak at 1670.19 cm−1 results from the C=O stretching vibration of amide. These characteristic peaks demonstrate that the acrylamide monomer has been grafted to starch on the molecular chain.
Two parameters were introduced to facilitate the analysis, namely, the grafting rate and conversion rate. The ratio of weights of the polymer (acrylamide) in grafts and the substrate (starch) or the so called “grafting ratio”, was calculated as shown in Equation (3).
The percentage of the total polymer(acrylamide) formed that grafted to the starch was considered as the conversation ratio, which can be computed by Equation (4).
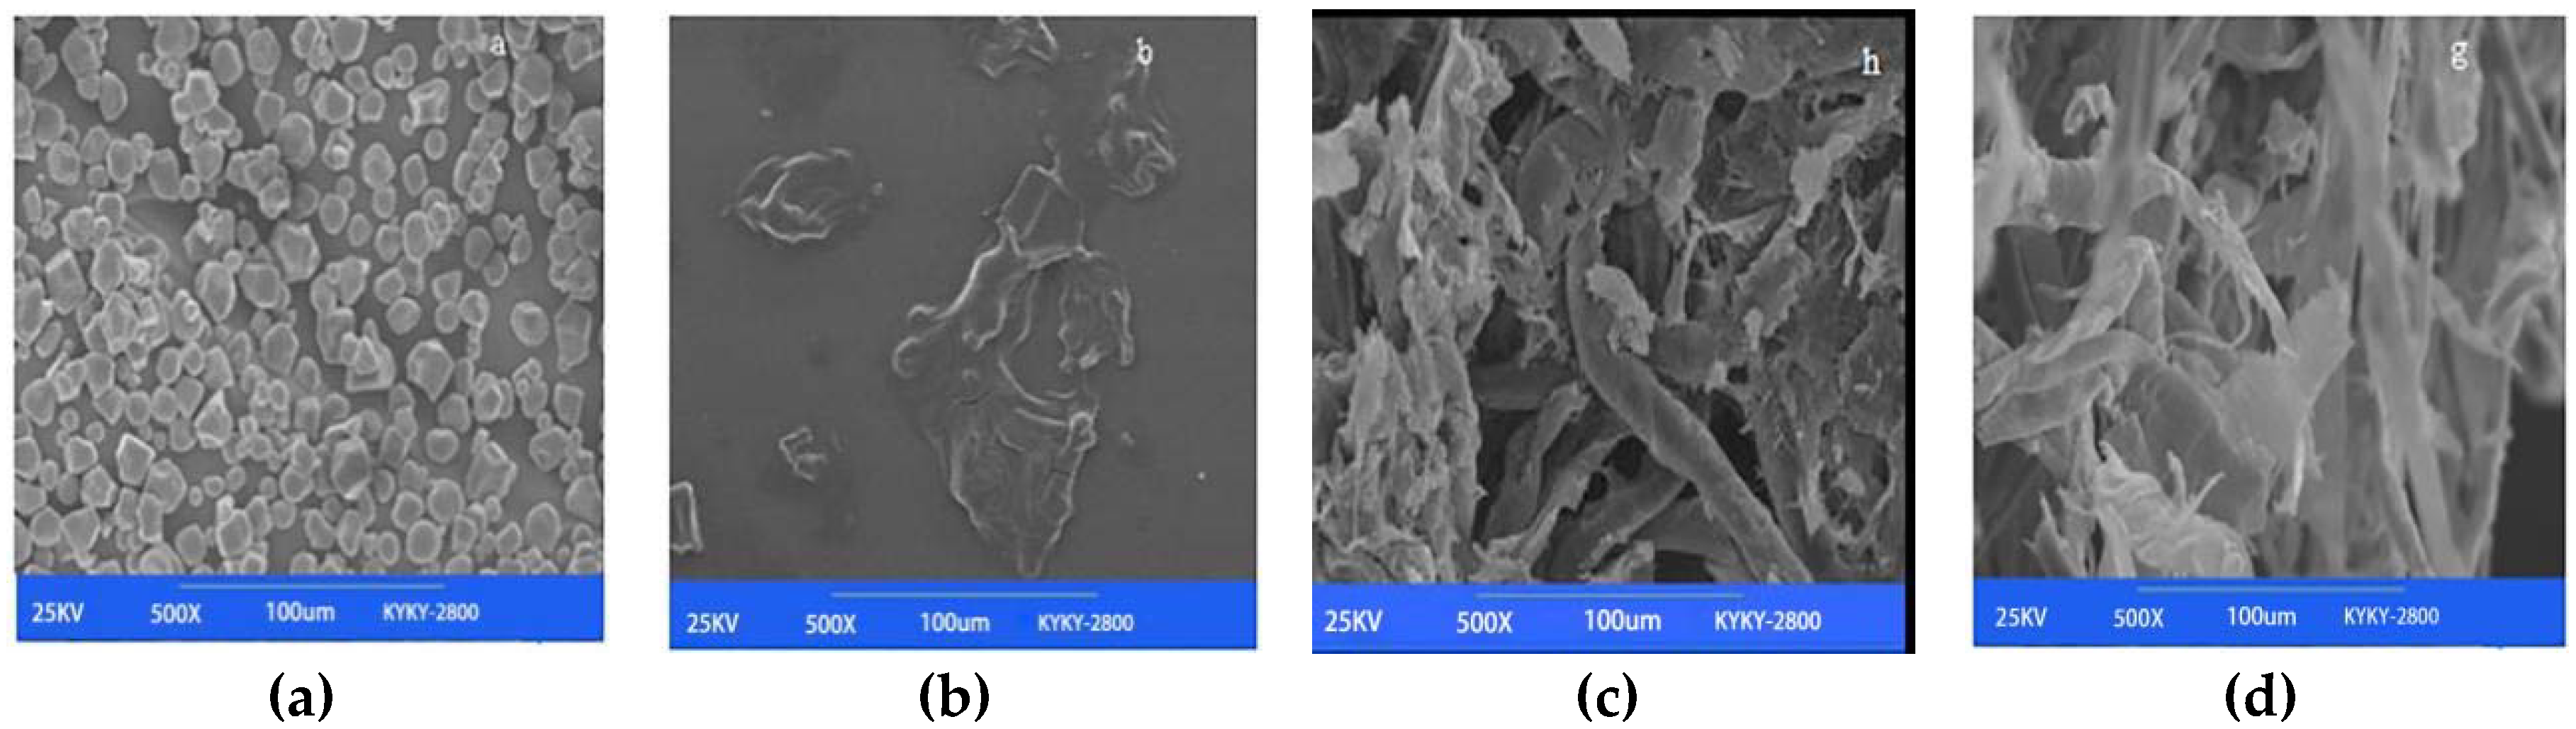
Under the test conditions, the grafting rate reached 87.45% and the conversion rate reached 89.71%. The SEM images are recorded in Figure 5. Figure 5a shows that the unreacted starch mainly exists as small spherical particles (size: 10 µm); Figure 5b indicates that acrylamide particles occupy a large portion of soluble starch particles and are more transparent; Figure 5c,d reflect the morphological differences between GCF and the raw materials: no small single particle is observable due to the dendric and stripped morphology and the gelatinized expansion of starch.
3.2. Effect of pH on Floc Sizes
The effect of pH on the diameter of the hematite and quartz flocs was investigated at room temperature of 25 °C and the GCF concentration of 150 mg/L, and the results are shown in Figure 6. with the increase of pH, the floc size of quartz increased slightly and then decreased to the range of 19–22 µm. However, a different trend is witnessed for hematite: the floc size decreased to the minimum (approximately 29 µm) as the pH was increased to 8. It was followed by increasing to more than 40 µm when pH further increased. Compared with the original sizes of quartz and hematite (19.41 µm and 16.79 µm, respectively), the GCF has a stronger flocculation capability for hematite than for quartz.
3.3. Effect of GCF Concentrations on Floc Sizes
In view of the previous result, the effect of flocculant concentration on the floc size of hematite and quartz was investigated at the pH of 10–11 where the difference between two flocs sizes is relatively large and the cost to reach such a pH range is acceptable. According to the results in Figure 7, the floc size of quartz exhibited a slight increase and that of hematite showed a significant increase with the increasing GCF concentration. Under the concentration of 125 mg/L, the hematite floc size reached 36.12 µm, while the mean floc size of quartz was merely 20 µm. As the concentration increased to 250 mg/L, the size of hematite floc reached a plateau. Considering both the flocculant cost and the size difference, 125 mg/L was chosen for the following analysis.
3.4. Fractal Dimension of Hematite Flocs
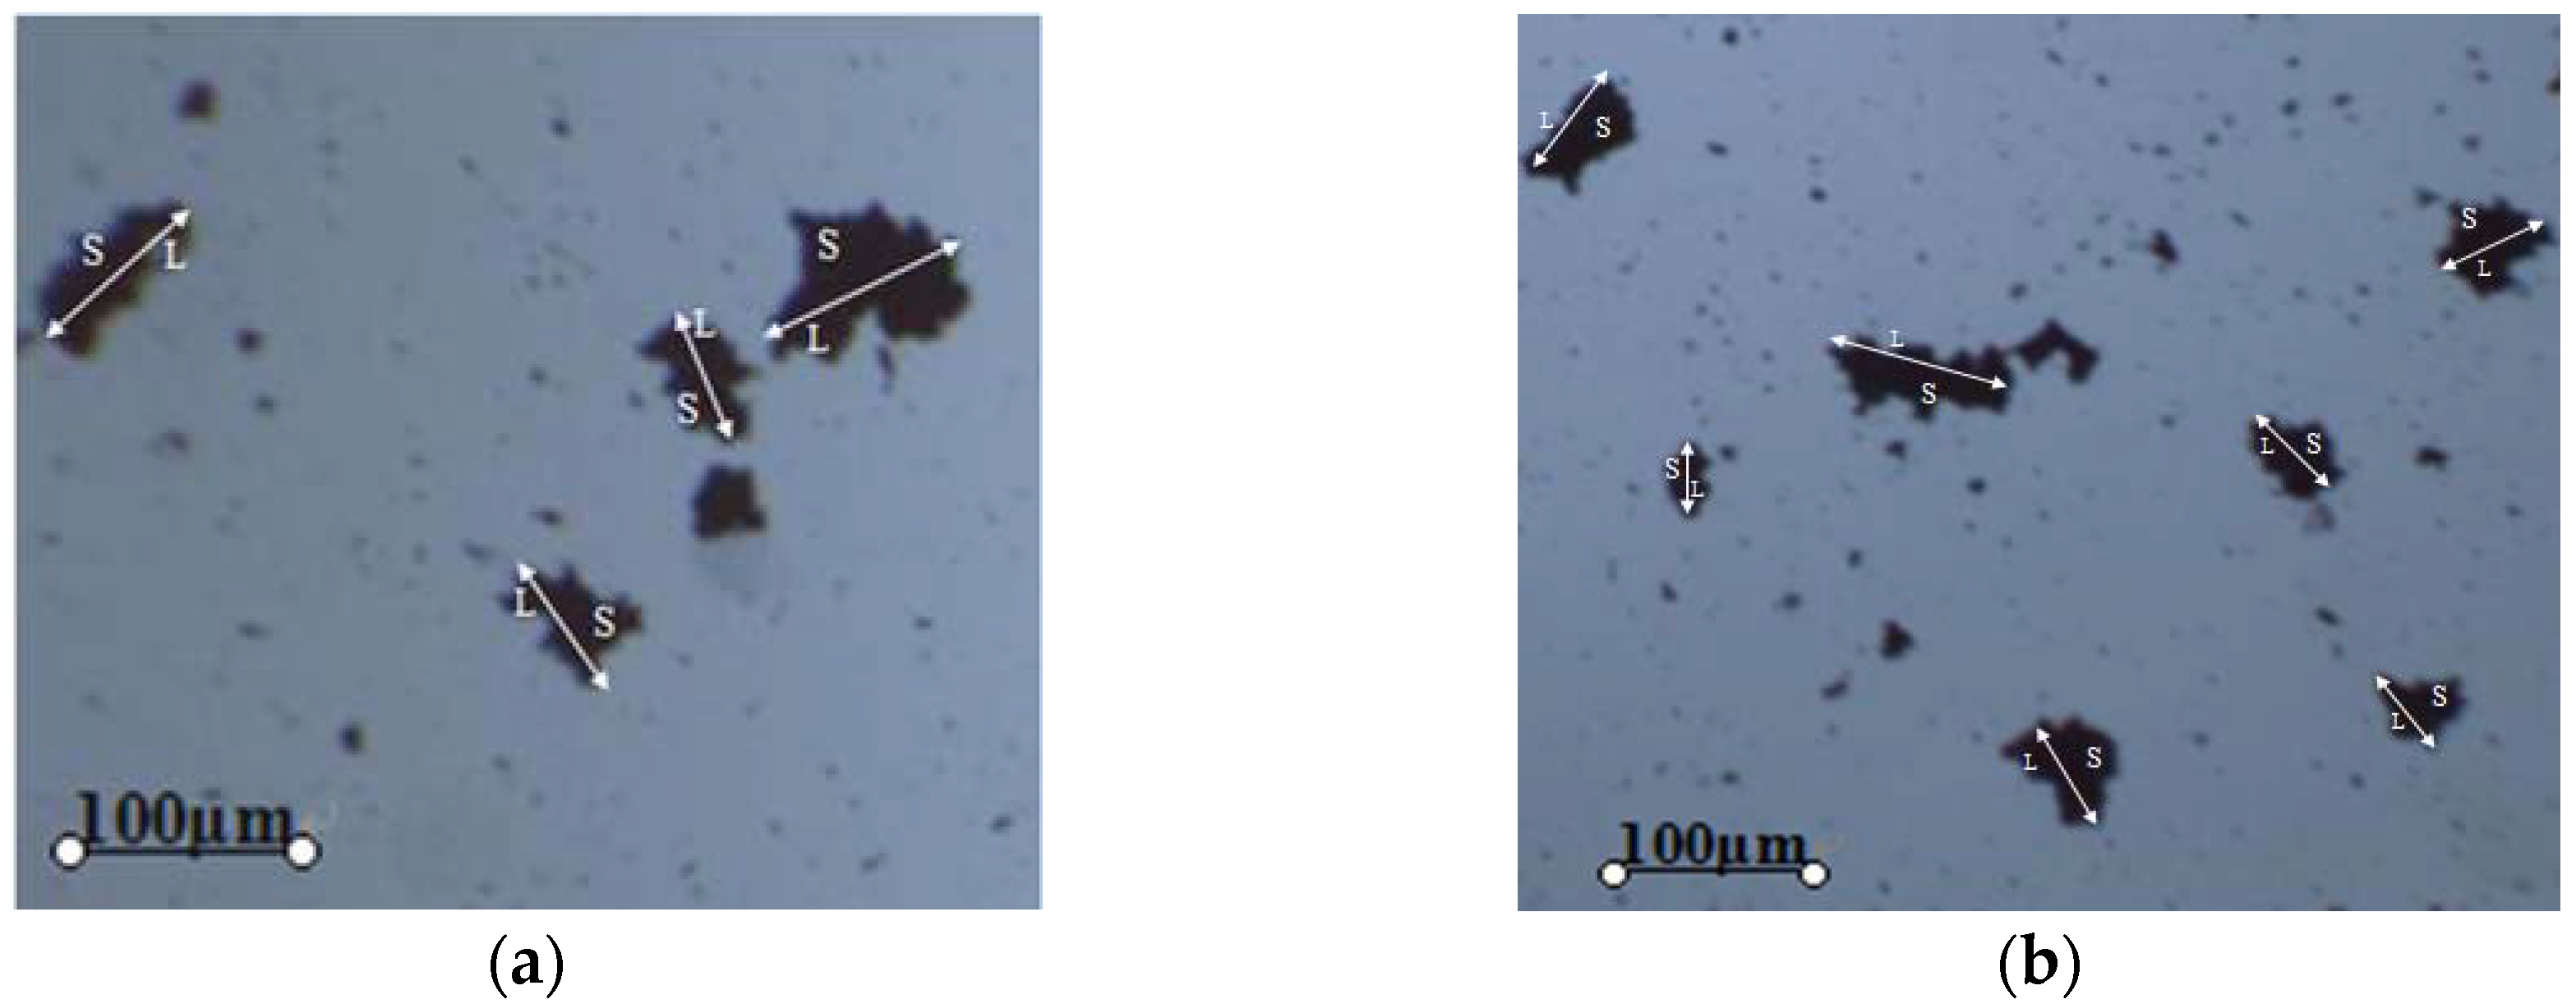
The morphologies of hematite particles flocs formed by GCF were observed directly and plotted as shown in Figure 8, where (a) and (b) described flocs at two reprehensive positions. The floc structure and formation carried typical fractal features, due to the high irregularity of floc surface and interior. Therefore, the fractal theory was introduced to depict the floc realistically and illustrate its formation process [20,21,22]. The fractal dimension of flocs can be calculated based on the relationship between the maximum floc length and the projected area [23]. The calculation formulas are Equations (5) and (6):
where S is the projected area of the flocculant (mm2); B is the fractal coefficient; L is the maximum floc length (mm); D is the fractal dimension of the floc. The values of S and L were directly obtained from Figure 8.
Taking lnS as the ordinate and lnL as the abscissa, Equation (6) was plotted as a linear function, which reveals the linear relationship between the projected area and maximum floc length. In Figure 9, the slope D of the line stands for the fractal dimension.
Figure 8 and Figure 9 show the GCF can assemble fine hematite particles into flocs. The fitted fractal dimension of the flocs was obtained as 2.02, indicating that the floc structure is almost as compact as the actual hematite particles of the same size. Compared with fine particles, hematite flocs can be easily attached to the bubbles in the subsequent flotation, and immune to the effect of the slurry flow state. Besides, the flocculation is unlikely to get broken given such a fractal dimension [24].
3.5. Mixed Mineral Flocculation Tests
For comparison purposes, starch, acrylamide and GCF were adopted for the selective flocculation of mixed minerals with an Fe grade of 33.75%. The test results are shown in Table 1. In the absence of flocculants, the yield and grade of the product were 29.56% and 37.12%, respectively, due to the difference in settling velocity of hematite and quartz particles. The addition of 125 mg/L traditional flocculant starch resulted in the increase of both yield and grade to 50.45% and 42.38%, respectively. It is worthy to note that polyacrylamide performed better to obtain a yield of 61.14, while the grade was only 35.07%, worse than that when utilizing starch at the same dose. However, when the same concentration of GCF was added, the yield and grade of the product turned out to be 62.17% and 46.13%, respectively, increasing by 32.61% and 9.01% from the levels in the non-flocculant test. It is understandable that the product yield increases because the flocculants enlarged the apparent particle size of the product and thus sped up the settling of the particles. The increase of grade is the result of the selective flocculation of hematite. Compared with conventional flocculants, GCF exhibited a better flocculation behaviour both in intensity and selectivity.
3.6. Effect of GCF on Mineral Surface Potentials
Several experiments were carried out to identify the effect of GCF on the Zeta potential of hematite and quartz at different pH and the flocculant concentration of 125 mg/L. The experimental results are shown in Figure 10.
As shown in Figure 10, the isoelectric point (IEP) of hematite and quartz were 7.5 and 2.1, respectively. The results agree well with reference data [25,26]. It is clear that the addition of GCF has little effect on the Zeta potential of quartz, which means the flocculant is hardly adsorbed on the quartz surface. By contrast, the surface potential of the hematite shifted negatively due to the adsorption of the GCF. While OH− ions dominate above pH 7, our results show that GCF molecules still adsorbed on hematite surfaces significantly, indicating an intense interaction between hematite and GCF molecules.
3.7. Analysis of the Adsorption of GCF on Mineral Surfaces
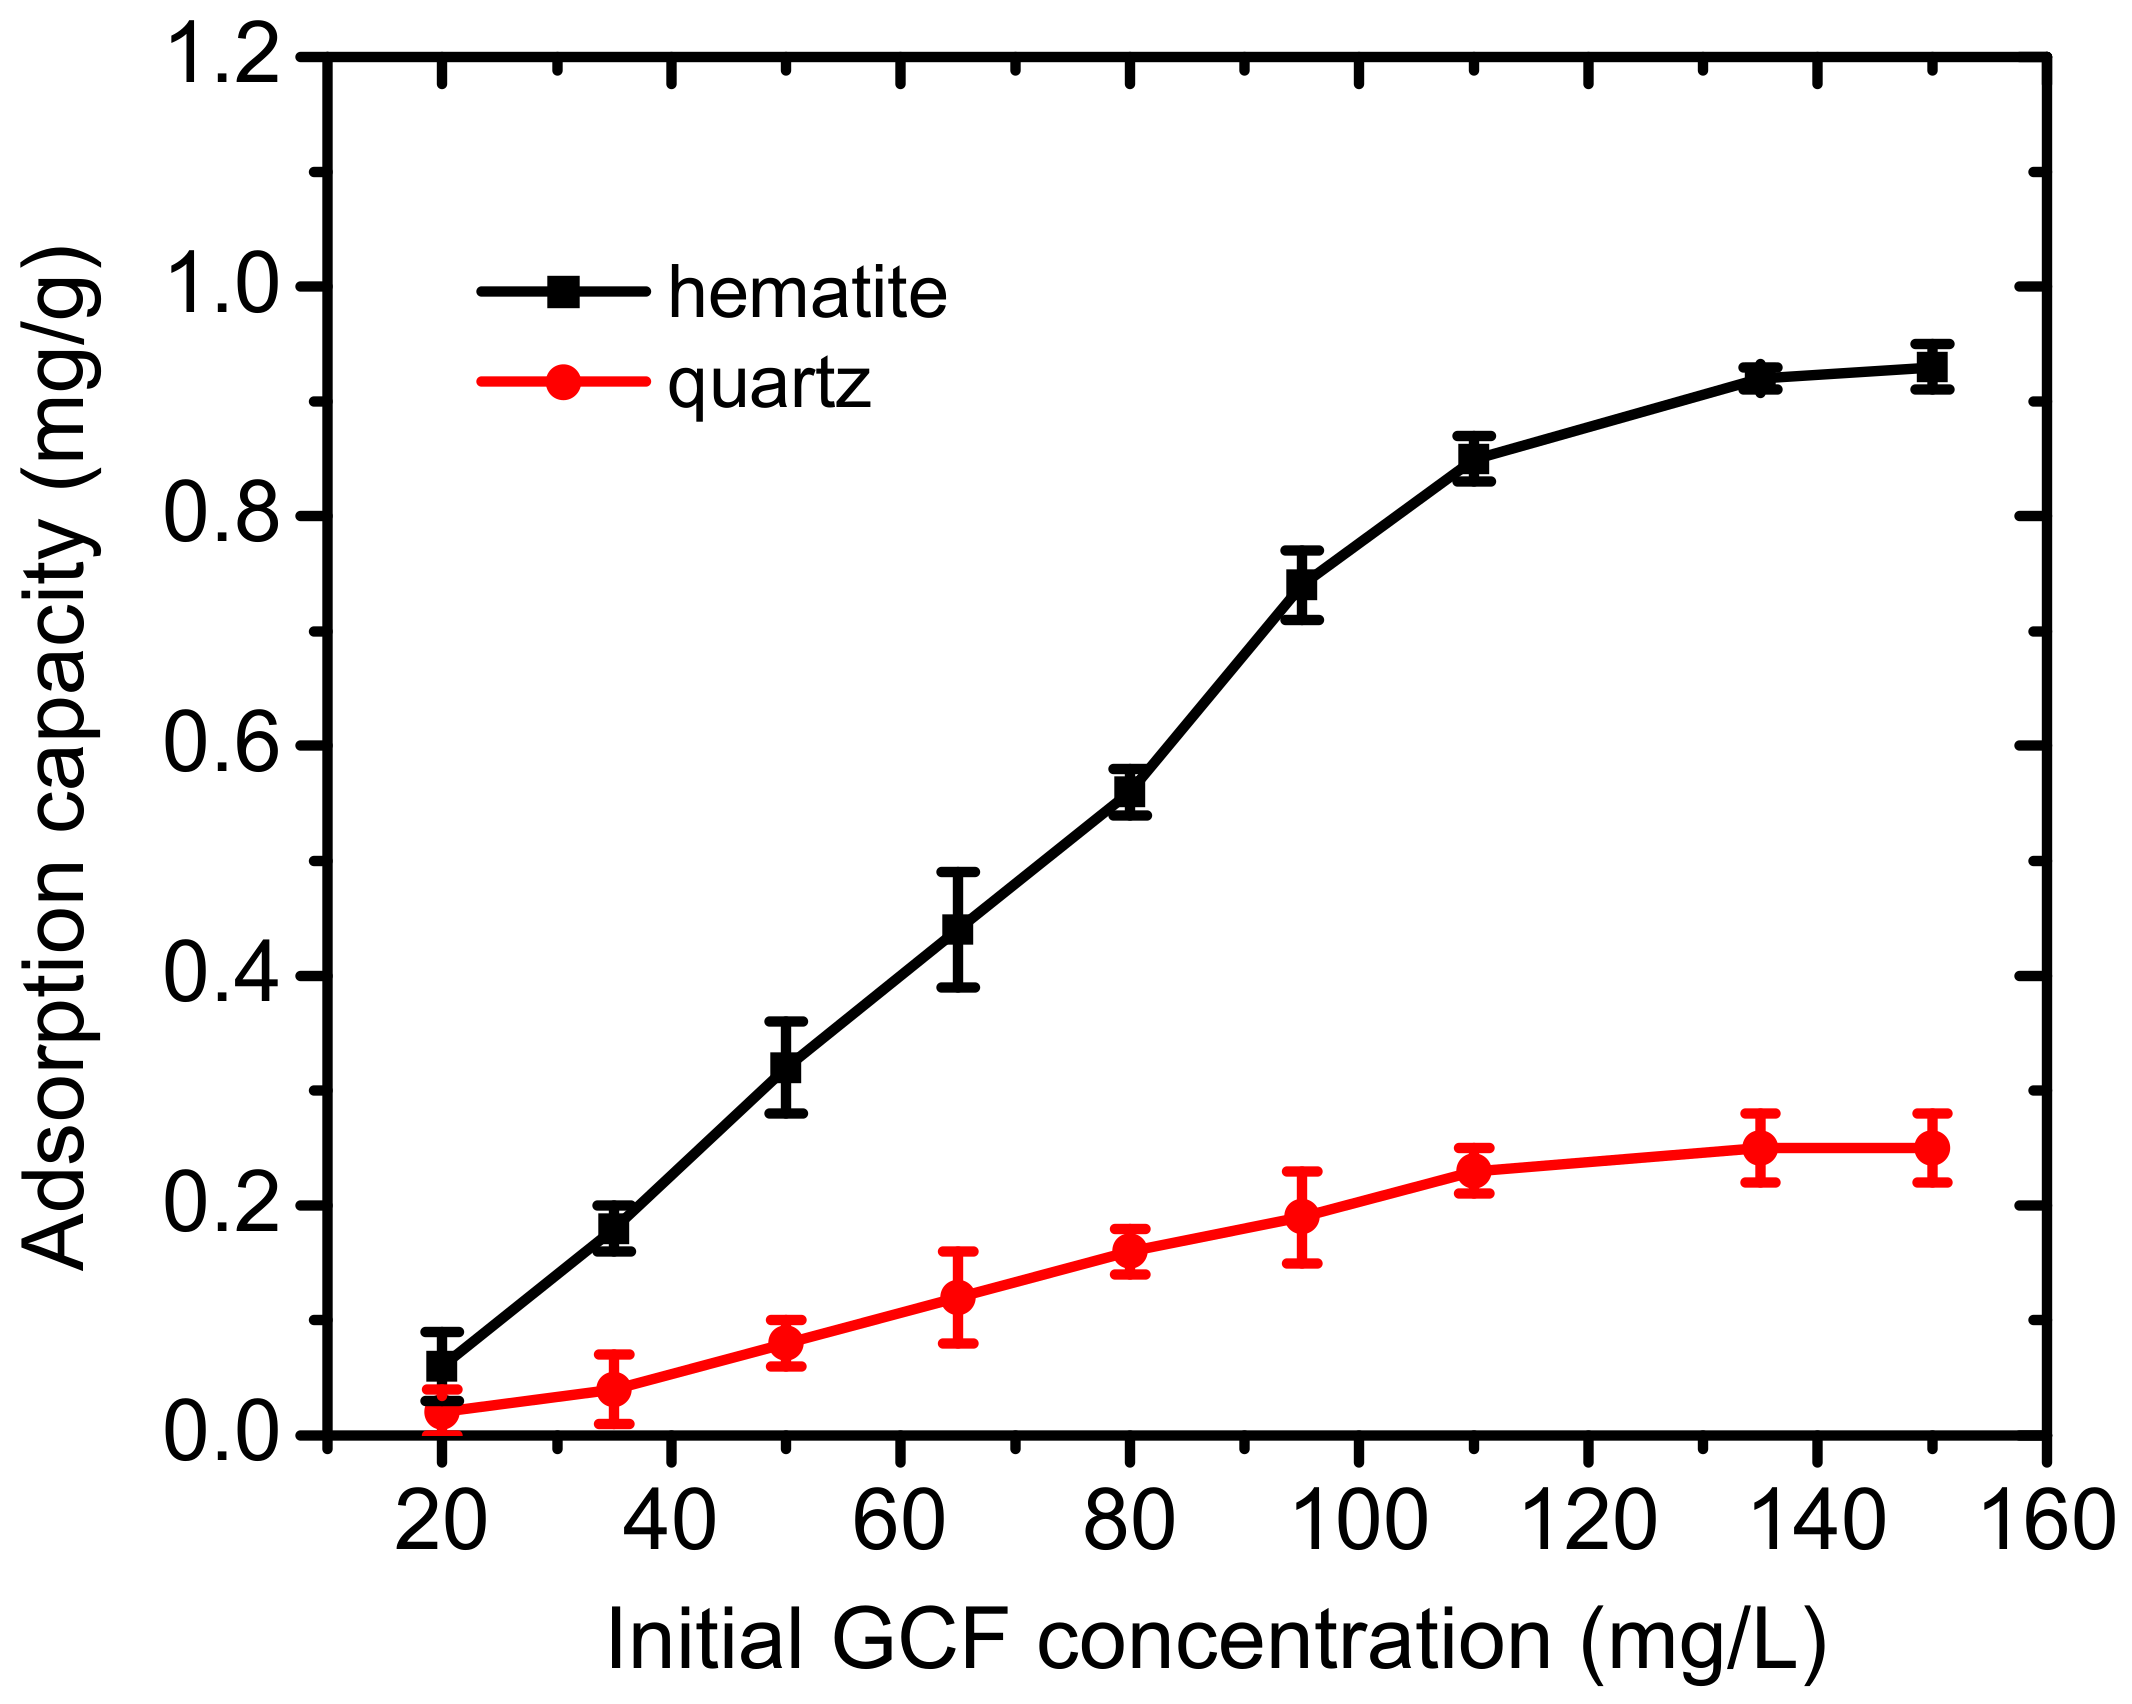
The adoption of GCF on mineral surfaces is displayed in Figure 11. The experiments were conducted at the pH of 10.4 and the GCF concentration served as the only variable.
It can be seen that the amount of the GCF adsorbed on quartz surfaces only grew slightly with the increase of the initial concentration. The GCF adsorption amount was merely 0.21 mg/g at an initial concentration of 150 mg/L. Meanwhile, for hematite, the adsorption amount increased to approximately 0.9 mg/g with the concentration increasing, indicating a more intensive adsorption than that for quartz. It should be noted that for the adsorption of CGF on hematite, the adsorption capacity did not reach saturation in the experimental range, though the acceleration was gradually becoming smaller when the initial GCF concentration was over 125 mg/L, showing that this dose was reasonable to be set as the studied concentration in preceding sections. Thus, the GCF adsorbed preferentially on the surfaces of hematite than that of quartz. The experimental results are consistent with the previous results of both single and mixed mineral flocculation tests, and Zeta potential measurements.
4. Conclusions
Based on the systematic investigation of the flocculation of hematite and quartz using GCF as the flocculant, the following conclusions can be drawn.
(1) The GCF promotes the flocculation of hematite particles via adsorption on the mineral surfaces. At the pH of 10–11 and flocculant concentration of 125 mg/L, hematite flocs were formed with mean floc size of 36.12 µm and fractal dimension of 2.02. The floc structure was almost as compact as the actual hematite particles of the same size, and unlikely to get broken.
(2) The hematite selective flocculation tests indicate that the GCF can improve the yield and grade of product by 32.61% and 9.01%, respectively, from the levels in the non-flocculant test. Compared with conventional flocculants starch and acrylamide, GCF exhibited advantageous properties such as leading better yield and grade at the same time.
(3) The mechanism lies in that the GCF prefers to adsorb stably on hematite surfaces than on quartz surfaces, which is confirmed by Zeta potential measurements and adsorption analysis.
In fact, a pilot test using GCF as the flocculant to recover real fine hematite ores has been carried out and both yield and grade are excellent, which will be presented as a separate report soon. The plan of a field test is also in progress.
Author Contributions
Z.G., F.N. and L.W. designed the experiments; W.S. and J.Z. performed the experiments; Y.Z. and Y.G. analysed the data; J.Z. wrote the paper; Z.G. and Y.G. funded the research and improved the paper.
Acknowledgments
This work is financially supported by the National Natural Science Foundation of China (51474087, 51774328), the Natural Science Foundation of Hunan Province of China (2018JJ2520), the Young Elite Scientists Sponsorship Program by CAST (2017QNRC001) and Hundred Excellent Innovative Talents Support Program in Hebei Universities (No. BR2-214). The authors also appreciate invaluable suggestions on the language revision from Hassan Raza and Samantha Verran at Michigan Tech.
Conflicts of Interest
The authors declare no conflict of interest.
References
- Yao, J.; Yin, W.Z.; Gong, E. Depressing effect of fine hydrophilic particles on magnesite reverse flotation. Int. J. Miner. Process. 2016, 149, 84–93. [Google Scholar] [CrossRef]
- Wei, S.N.; Sonsie, R.; Forbes, E.; Frank, G.V. Flocculation/flotation of hematite fines with anionic temperature responsive polymer acting as a selective flocculant and collector. Miner. Eng. 2015, 77, 64–71. [Google Scholar]
- Jankovic, A. Developments in iron ore comminution and classification technologies. Iron Ore 2015, 251–282. [Google Scholar] [CrossRef]
- Drzymala, J.; Fuerstenau, D.W. Selective flocculation of hematite in quartz–hematite–ferric ion–polyacrylic acid system. Part 2. Effect of grinding and a hydrofluoric treatment on selectivity of flocculation. Int. J. Miner. Process. 2014, 129, 1–5. [Google Scholar] [CrossRef]
- Chen, W.; Feng, Q.; Zhang, G.; Li, L.; Jin, S. Effect of energy input on flocculation process and flotation performance of fine scheelite using sodium oleate. Miner. Eng. 2017, 112, 27–35. [Google Scholar] [CrossRef]
- Shibata, J.; Fuerstenau, D.W. Flocculation and flotation characteristics of fine hematite with sodium oleate. Int. J. Miner. Process. 2003, 72, 25–32. [Google Scholar] [CrossRef]
- Lapointe, M.; Barbeau, B. Dual starch-polyacrylamide polymer system for improved flocculation. Water Res. 2017, 124, 202–209. [Google Scholar] [CrossRef] [PubMed]
- Molatlhegi, O.; Alagha, L. Adsorption characteristics of chitosan grafted copolymer on kaolin. Appl. Clay Sci. 2017, 150, 342–353. [Google Scholar] [CrossRef]
- Angus, M.; Kridten, B.L.; Jonas, A.M. Improved dewatering behaviour of clay minerals dispersions via interfacial chemistry and particle interactions optimization. J. Colloid Interface Sci. 2006, 293, 116–127. [Google Scholar]
- Miettinen, T.; Ralston, J.; Fornasiero, D. The limits of fine particle flotation. Miner. Eng. 2010, 23, 420–437. [Google Scholar] [CrossRef]
- Gregory, J. Polymer adsorption and flocculation in sheared suspensions. Colloids Surf. 1988, 31, 231–253. [Google Scholar] [CrossRef]
- Yang, S.; Li, C.; Wang, L. Dissolution of starch and its role in the flotation separation of quartz from hematite. Powder Technol. 2017, 320, 346–357. [Google Scholar] [CrossRef]
- Weissenborn, P.; Warren, L.; Dunn, J. Selective flocculation of ultrafine iron ore 2. Mechanism of selective flocculation. Colloids Surf. A 1995, 99, 29–43. [Google Scholar] [CrossRef]
- Pavlovic, S.; Brandao, P. Adsorption of starch, amylose, amylopectin and glucose monomer and their effect on the flotation of hematite and quartz. Miner. Eng. 2003, 16, 1117–1122. [Google Scholar] [CrossRef]
- Yu, B.; Che, X.; Zheng, Q. Flotation of ultra-fine rare-earth minerals with selective flocculant PDHA. Miner. Eng. 2014, 60, 23–25. [Google Scholar] [CrossRef]
- Qi, G.W.; Klauber, C.; Warren, L. Mechanism of action of sodium silicate in the flotation of apatite from hematite. Int. J. Miner. Process. 1993, 39, 251–273. [Google Scholar] [CrossRef]
- Yin, W.Z.; Yang, X.S.; Zhou, D.P.; Li, Y.J.; Lü, Z.F. Shear hydrophobic flocculation and flotation of ultrafine Anshan hematite using sodium oleate. Trans. Nonferrous Met. Soc. China 2011, 21, 652–664. [Google Scholar] [CrossRef]
- Gebhardt, J.E.; Fuerstenau, D.W. The effect of trace surfactant impurities on the adsorption of sodium dodecyl sulfonate on hematite. J. Colloid Interface Sci. 1984, 101, 278–279. [Google Scholar] [CrossRef]
- Natarajan, K.A.; Deo, N. Role of bacterial interaction and bioreagents in iron ore flotation. Int. J. Miner. Process. 2001, 62, 143–157. [Google Scholar] [CrossRef]
- Patricio, L.E.; Angeles, B.; Carlos, N. Estimating fractal dimension of microalgal flocs through confocal laser scanning microscopy and computer modelling. Algal Res. 2017, 28, 74–79. [Google Scholar]
- Haki, A.; El Hadi, M.A.; Bouhafid, A. Assessment of the pyrolysis, combustion and fractal dimension of fragmented oil shale particles. Powder Technol. 2017, 318, 569–588. [Google Scholar] [CrossRef]
- Wang, Z.Y.; Zheng, P. Predicting settling performance of ANAMMOX granular sludge based on fractal dimensions. Water Res. 2017, 120, 222–228. [Google Scholar] [CrossRef] [PubMed]
- Gregory, J. The density of particle aggregates. Water Sci. Technol. 1997, 36, 1–13. [Google Scholar] [CrossRef]
- Zhao, J.; Fu, X.H.; Song, G.Y.; Liu, J.T.; Zhang, L.L. Effect of floccule morphological characteristics on the collision and attachment between floccule and bubble. J. China Coal Soc. 2017, 42, 739–744. [Google Scholar]
- Besson, A.; Guiraud, P. High-pH-induced flocculation–flotation of the hypersaline microalga Dunaliella salina. Bioresour. Technol. 2013, 147, 464–470. [Google Scholar] [CrossRef] [PubMed]
- Li, D.; Yin, W.Z.; Xue, J.W.; Yao, J.; Fu, Y.F.; Liu, Q. Solution chemistry of carbonate minerals and its effects on the flotation of hematite with sodium oleate. Int. J. Miner. Metall. Mater. 2017, 24, 736–744. [Google Scholar] [CrossRef]
Figure 1.
Molecular structures of amylose (a) and amylopectin (b).

Figure 2.
Size distributions of hematite and quartz particles.
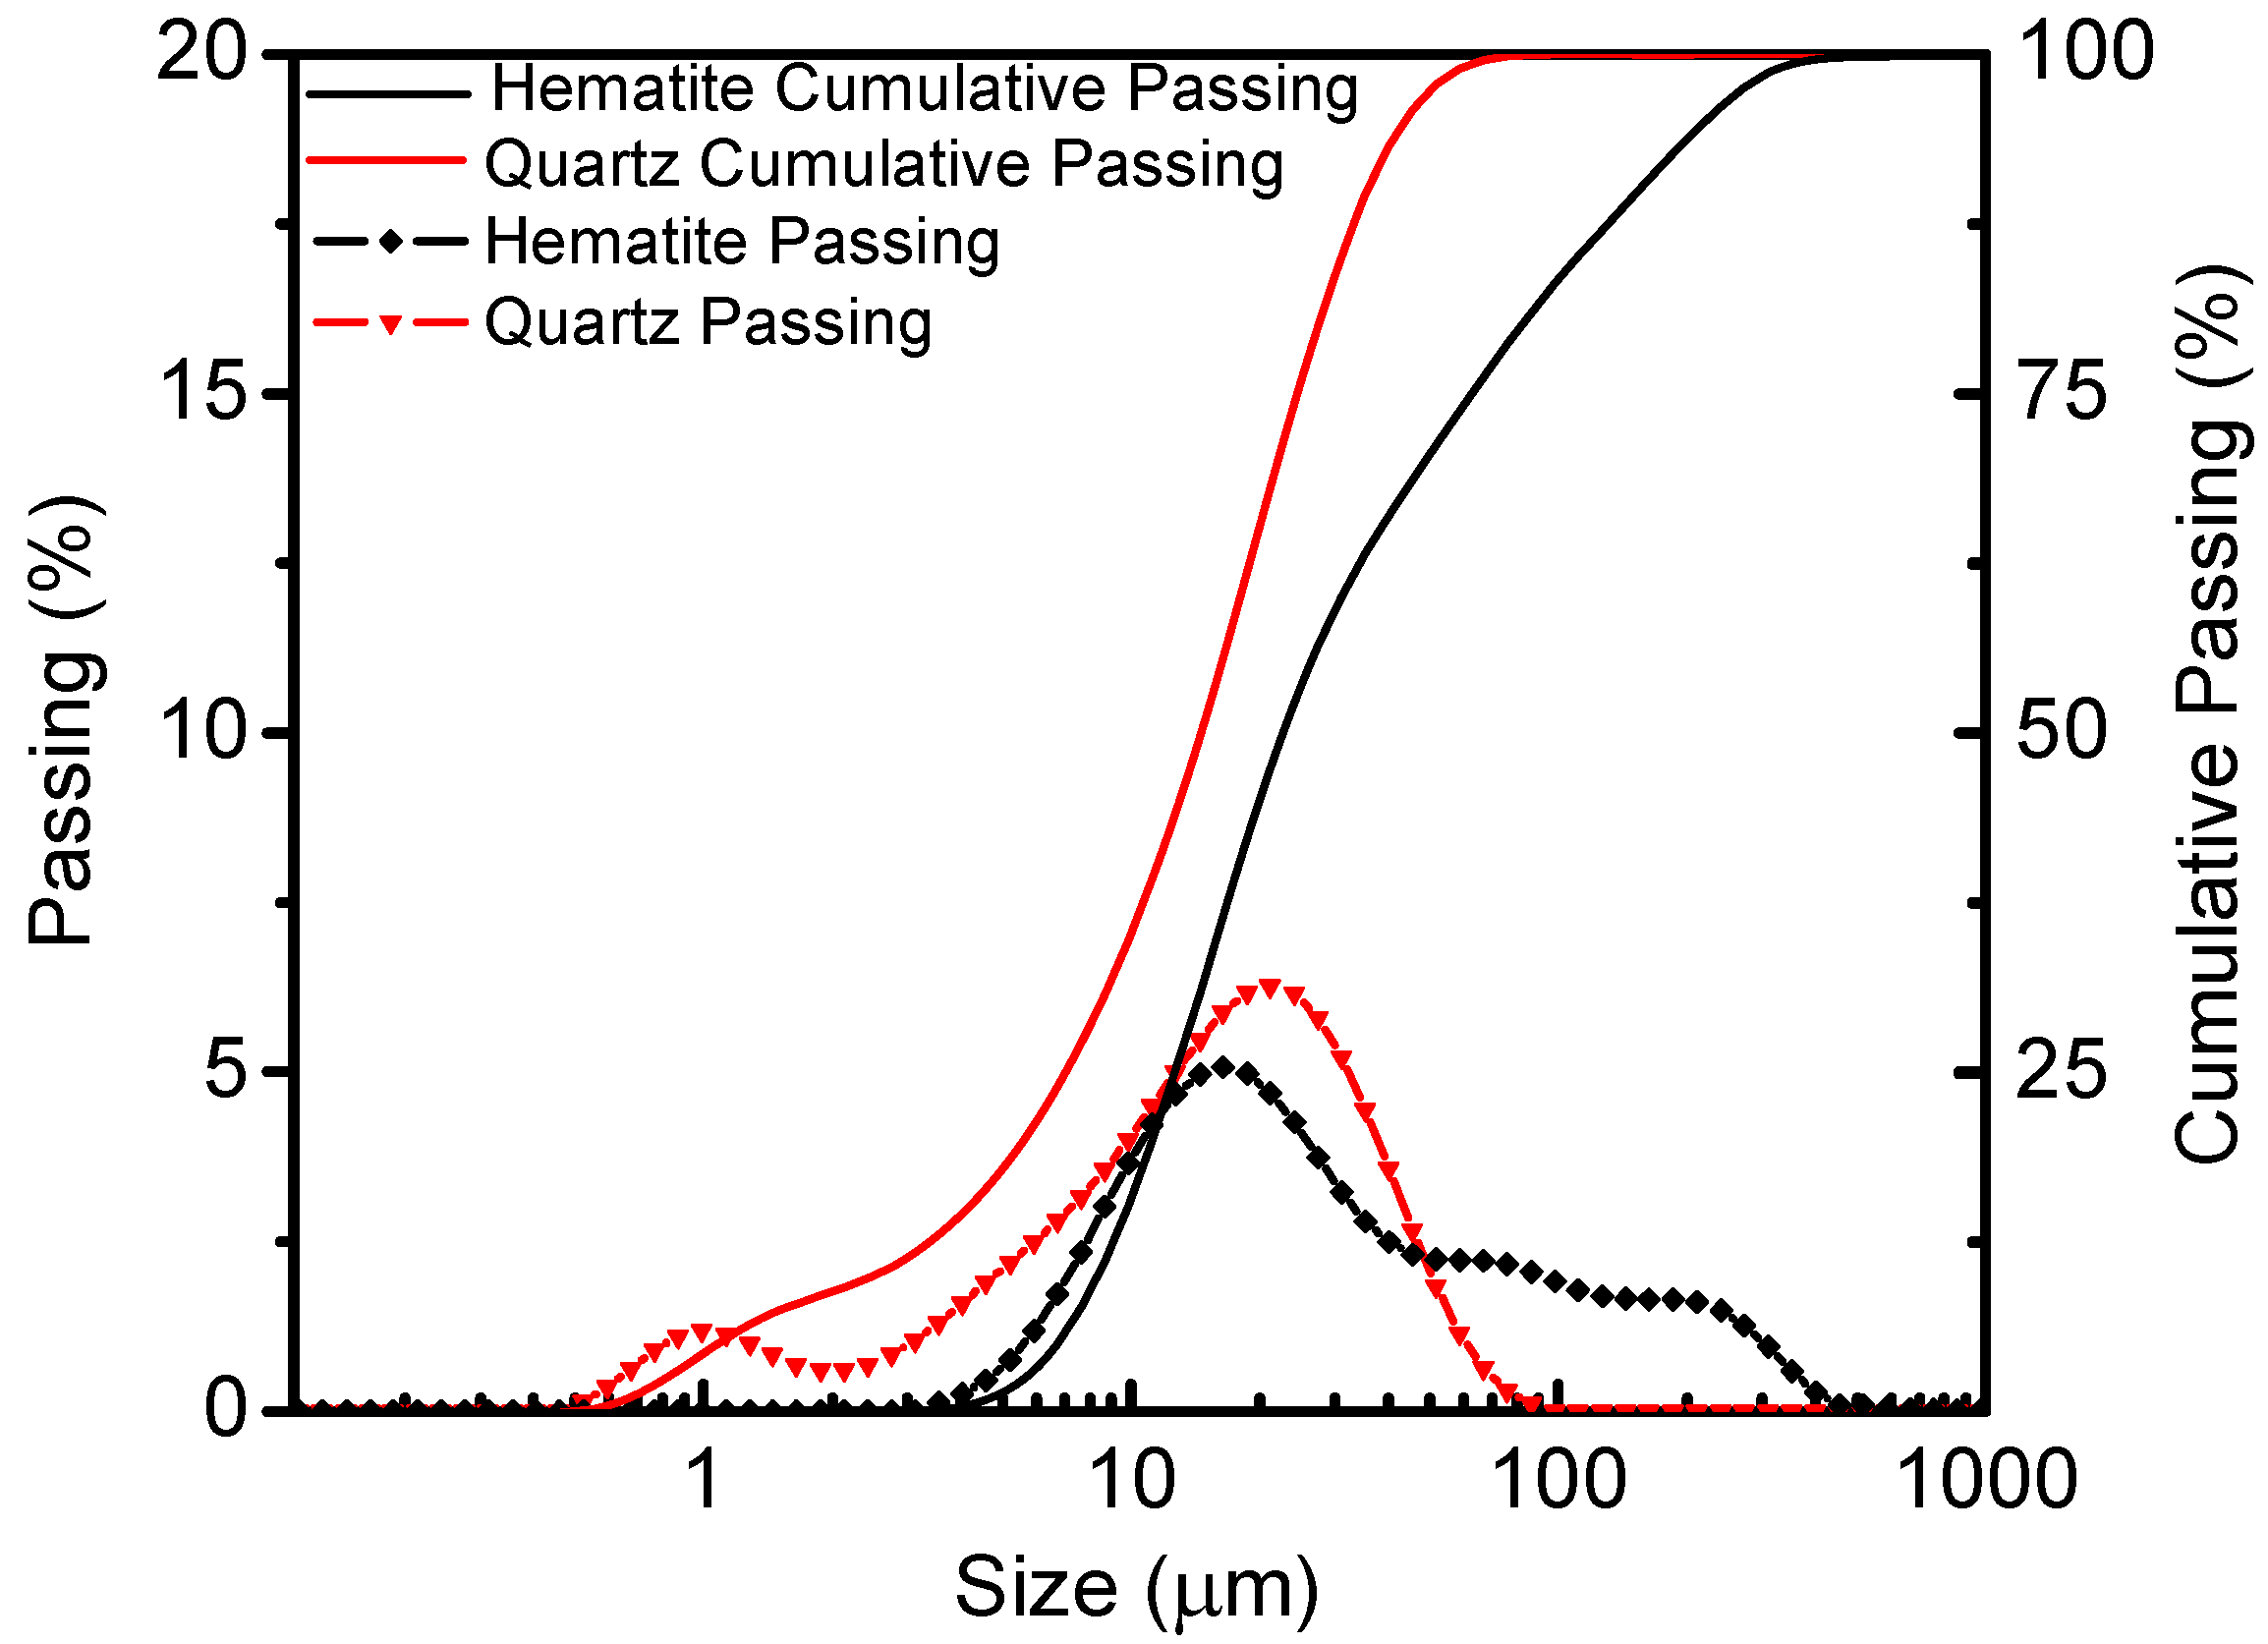
Figure 3.
Molecular structure of GCF.

Figure 4.
FTIR spectra of the GCF.

Figure 5.
SEM images of starch (a); acrylamide (b) and GCF (c,d).

Figure 6.
Effect of pH on the average mineral floc sizes using GCF as a flocculant.
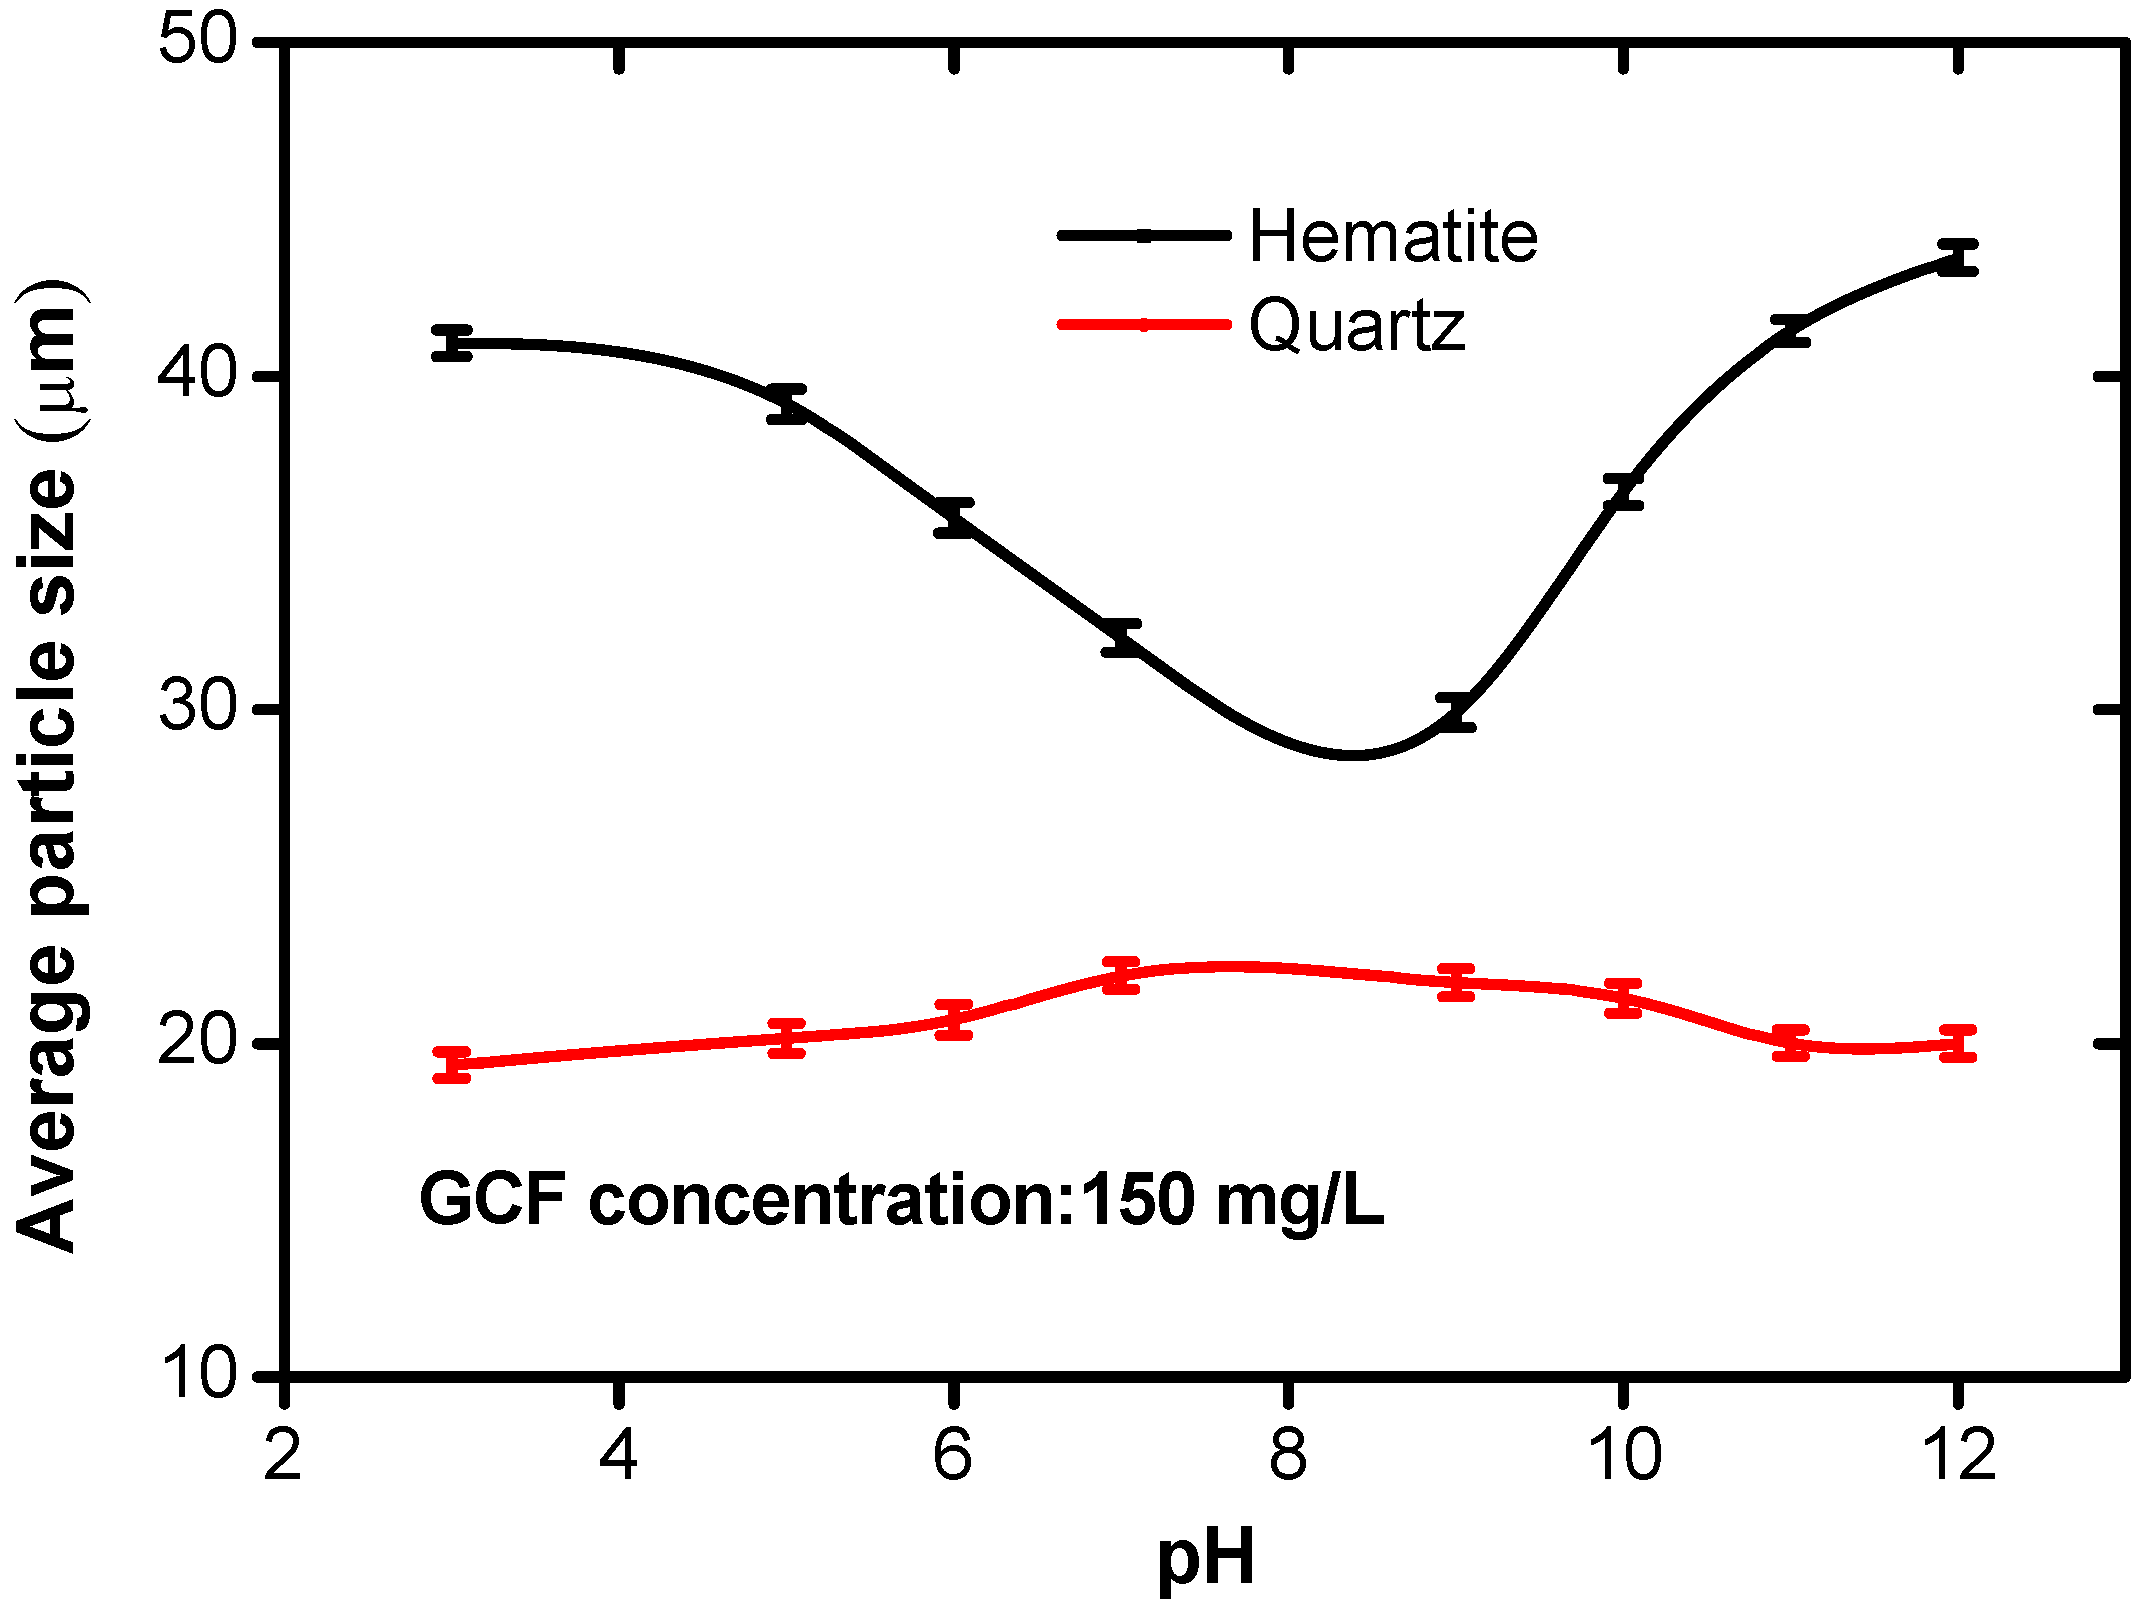
Figure 7.
Effect of GCF concentration on the mean floc sizes.
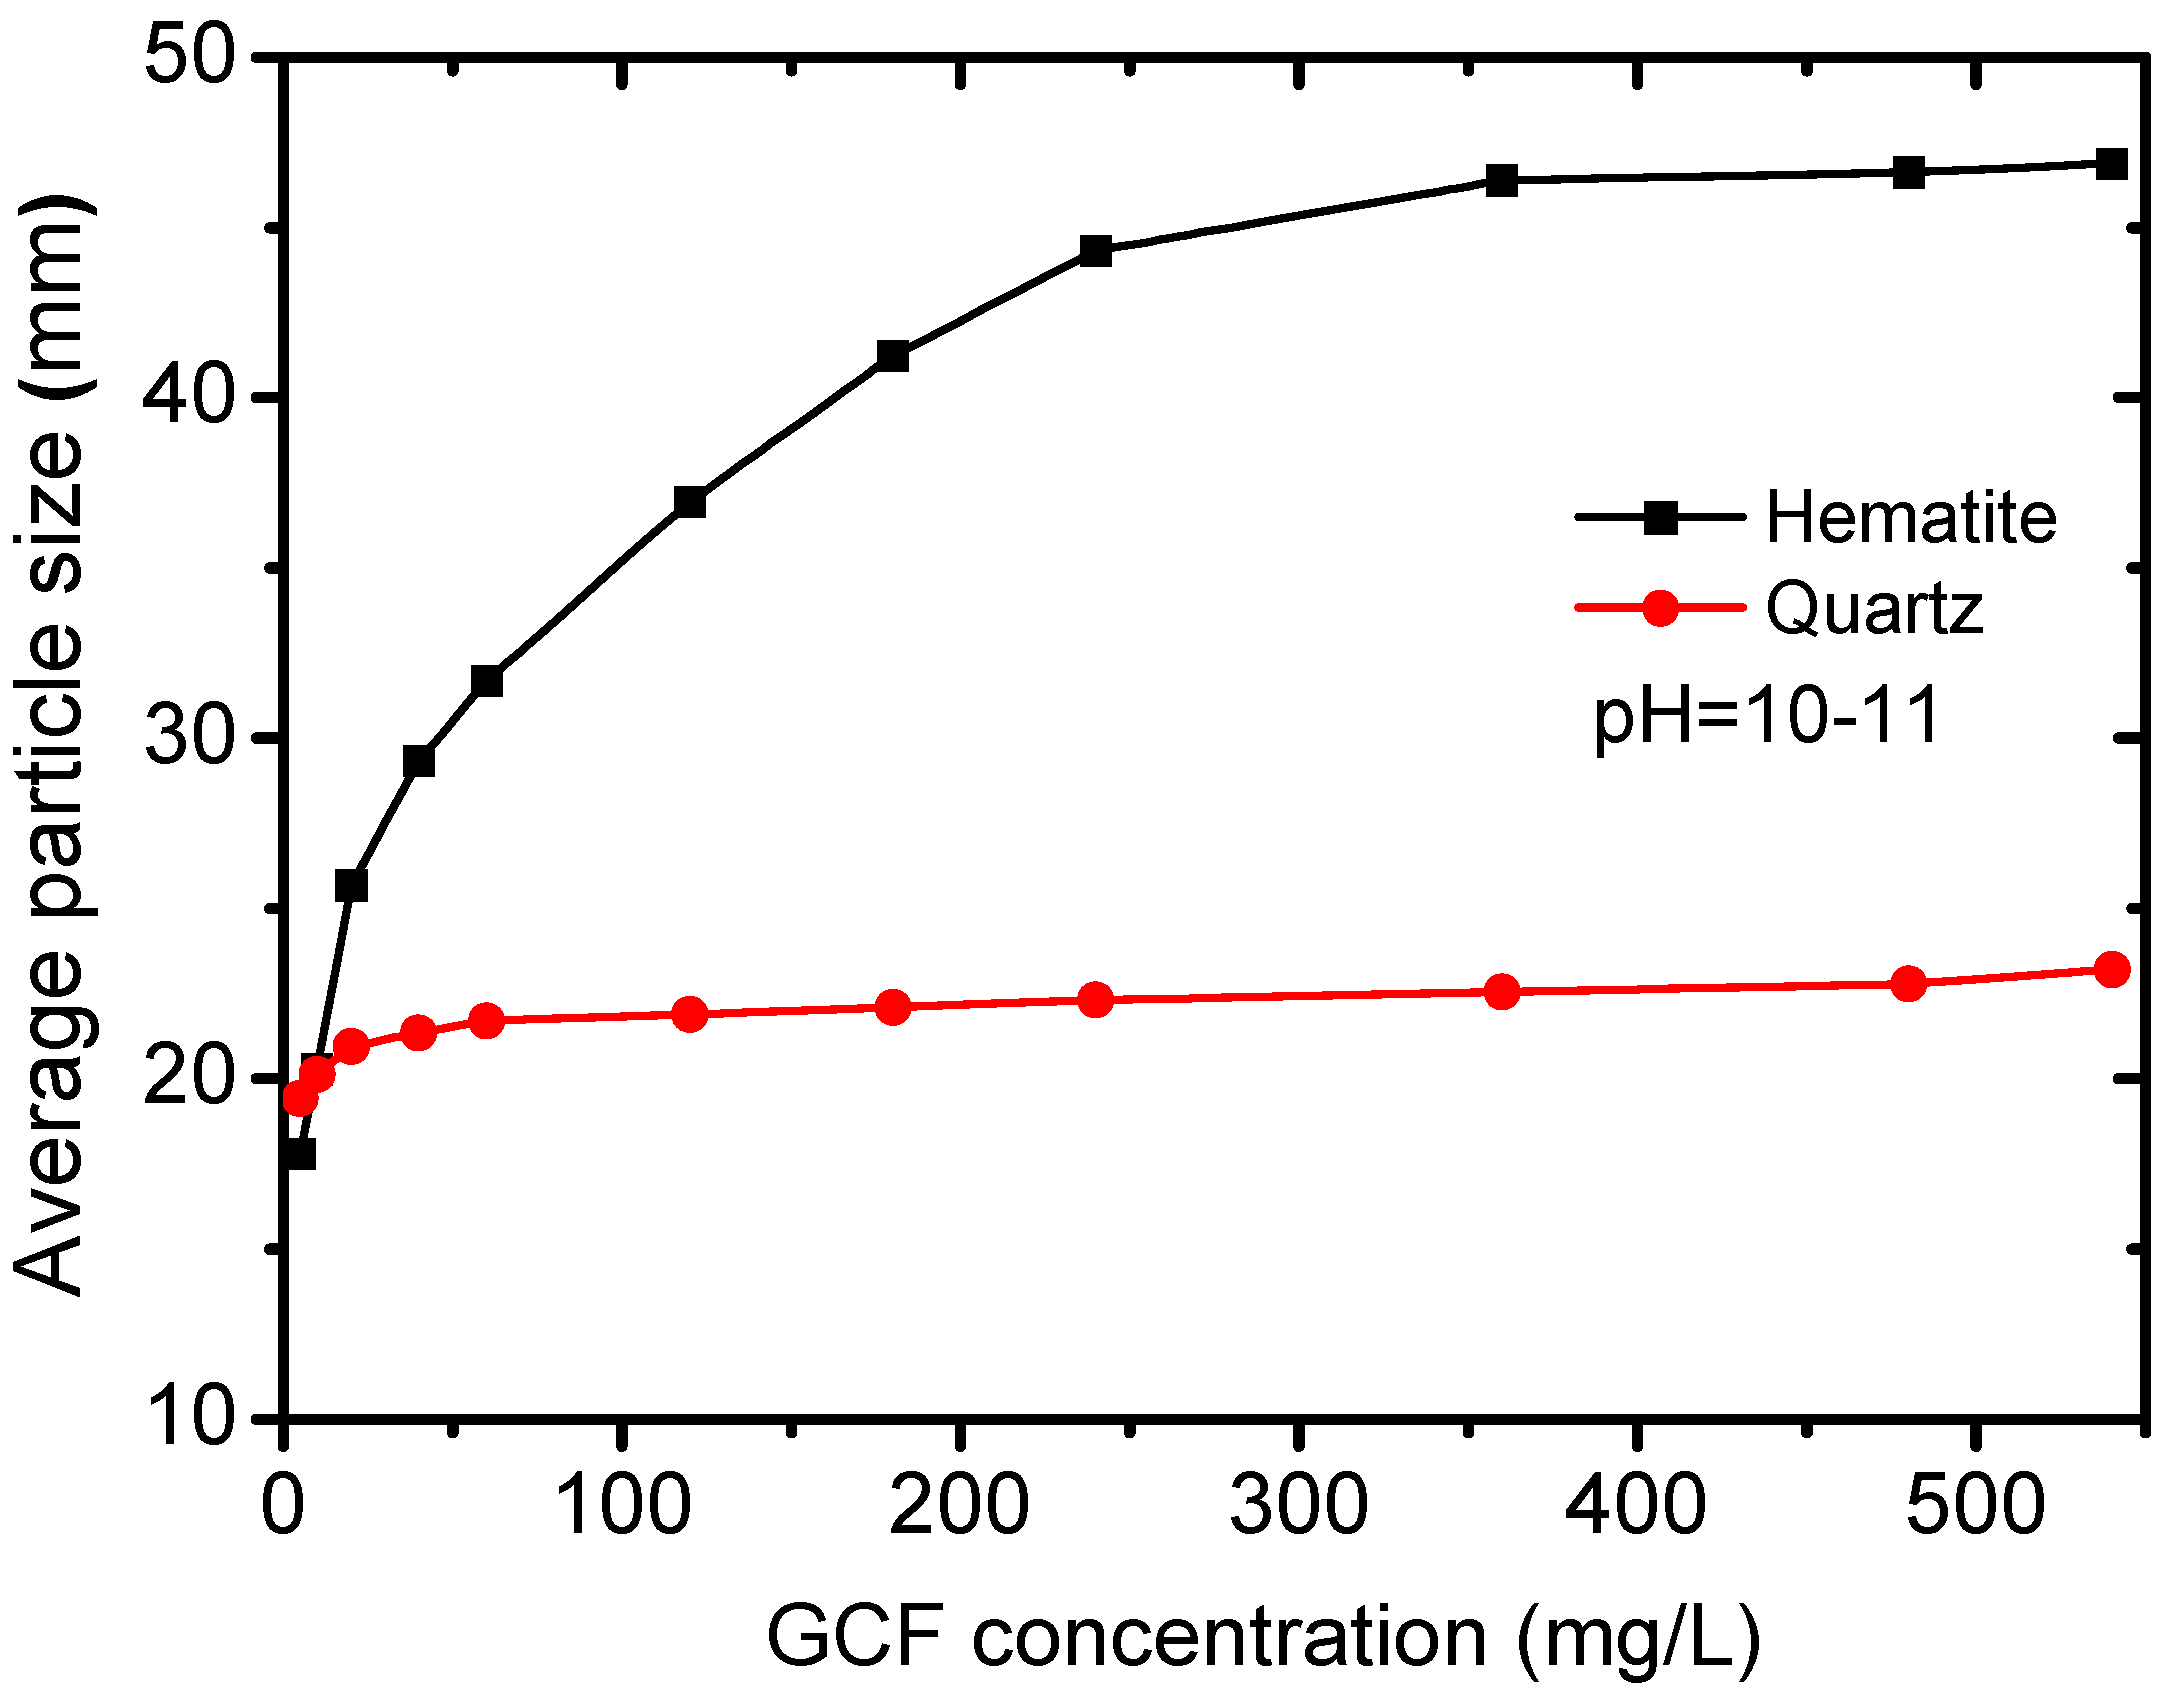
Figure 8.
Morphologies of the hematite flocs: (a) position 1, (b) position 2.

Figure 9.
Fractal dimension (D) of hematite flocs.

Figure 10.
Effect of GCF on the Zeta potential of hematite and quartz at different pH.

Figure 11.
Determination of the adsorption amount of graft copolymer on mineral surfaces.


Table 1.
Effects of different flocculants on selective flocculation.
| Flocculant Type | (mg/L) | Precipitate | |
|---|---|---|---|
| Yield/% | Grade/% | ||
| Blank | 0 | 29.56 | 37.12 |
| Starch | 125 | 50.45 | 42.38 |
| Polyacrylamide | 125 | 61.14 | 35.07 |
| GCF | 125 | 62.17 | 46.13 |
© 2018 by the authors. Licensee MDPI, Basel, Switzerland. This article is an open access article distributed under the terms and conditions of the Creative Commons Attribution (CC BY) license (http://creativecommons.org/licenses/by/4.0/).
Share and Cite
MDPI and ACS Style
Zhang, J.; Sun, W.; Gao, Z.; Niu, F.; Wang, L.; Zhao, Y.; Gao, Y. Selective Flocculation Separation of Fine Hematite from Quartz Using a Novel Grafted Copolymer Flocculant. Minerals 2018, 8, 227. https://doi.org/10.3390/min8060227
AMA Style
Zhang J, Sun W, Gao Z, Niu F, Wang L, Zhao Y, Gao Y. Selective Flocculation Separation of Fine Hematite from Quartz Using a Novel Grafted Copolymer Flocculant. Minerals. 2018; 8(6):227. https://doi.org/10.3390/min8060227
Chicago/Turabian StyleZhang, Jinxia, Weiguang Sun, Zhiyong Gao, Fusheng Niu, Long Wang, Yawei Zhao, and Yuesheng Gao. 2018. "Selective Flocculation Separation of Fine Hematite from Quartz Using a Novel Grafted Copolymer Flocculant" Minerals 8, no. 6: 227. https://doi.org/10.3390/min8060227
Note that from the first issue of 2016, this journal uses article numbers instead of page numbers. See further details here.