1. Introduction
Dynamic technological progress in image retrieval methods has contributed to the rapid enlargement of both image and video sequence databases. This situation has driven the need for techniques that will enable the automated management of sets of image data, including query by image techniques, a topic that has recently been intensively elaborated on in the literature. Such methods are being developed in many fields of science and technology, but are rarely applied in the geological sciences. This need not be the case, and several selected methods are considered here to that end. The methods would facilitate the searching of large microscopic geological image databases using query by image or image fragment techniques [
1,
2,
3].
A recent application of similar imaging methods includes the novel technology “the Fingerprint of Things”, which is based on recording characteristic images of materials within databases and, subsequently, identifying the particular materials by comparing new images with visual databases [
4,
5]. Such innovations affect the development of methods for image and video storage and exploration [
6,
7,
8,
9,
10]. Geological image content is difficult to automatically standardize due to the irregular distribution of grains relating to colour and texture. Difficulties occur when an analysed image dataset is very large and, as a result, defining similarity becomes too time-consuming and laborious for a non-automated analysis. Thus, we have assessed several solutions relating to automatic analysis and evaluated the use of local feature matching for a situation in which there is no information related to the details of the analysed geological database. The goal of the currently described research was to validate if selected feature descriptors can help with the typical issues that emerge during microscopic rock observation, such as shifts, rotations, the change of enlargement, polarization change, etc.
2. Materials and Methods
A variety of image feature detection methods are discussed in the literature; however, in general, there are two major methodologies for extracting the features of an image: global and local [
11]. Global features are the image parameters calculated on the basis of an entire image that are often based on the statistical analysis of brightness level histograms [
12] or their conversions [
13,
14]. They are also sometimes calculated using frequency domain or mathematical models, e.g., multiscale autoregressive models [
15]. They are also sensitive to image enlargement or image transformations, which is a disadvantage in the case of automatic geological image analysis. The local features of an image rely on the fragmentary variance of an image; they define the so-called characteristic points and analyse their surroundings, which, as a result, leads to the creation of a set of local feature images. The methodology for defining two similar points or areas between images is a topic commonly discussed in the literature [
16]. It is an important factor and varies relative to the practical application, such as the use of the QBIC (query by image content) system design in geology, which is utilized in this study. QBIC systems, a type of CBIR (content-based image retrieval) methods, were proposed and implemented in the 1990s. Currently, the systems in use can be based on various methods of similarity checks and the use of various descriptors. The general scheme requires that, in order to search the required images, the user sends a query to the system in a form of an image or its fragment and the output information is a set of images that fulfil a given criterion for the search (for example, the visual similarity). In the present research, the usefulness of applying the QBIC methodology in geology, which is based on the use of descriptors that rely on the local environment of the key-points of the images (Features from Accelerated Segment Test algorithm (FAST), Minimum Eigenvalue Algorithm (MEA), Harris–Stephens algorithm (HSA), Binary Robust Invariant Scalable Keypoints (BRISK), and Speeded Up Robust Features (SURF)), is considered. Such a technique is widely discussed in the context of computer vision, and, rather than describing the algorithms in detail, references to relevant research papers proposing many various feature detectors and descriptors are provided [
17,
18,
19,
20], together with detailed comparisons of their effectiveness and subjective evaluations of particular types of data [
21,
22,
23].
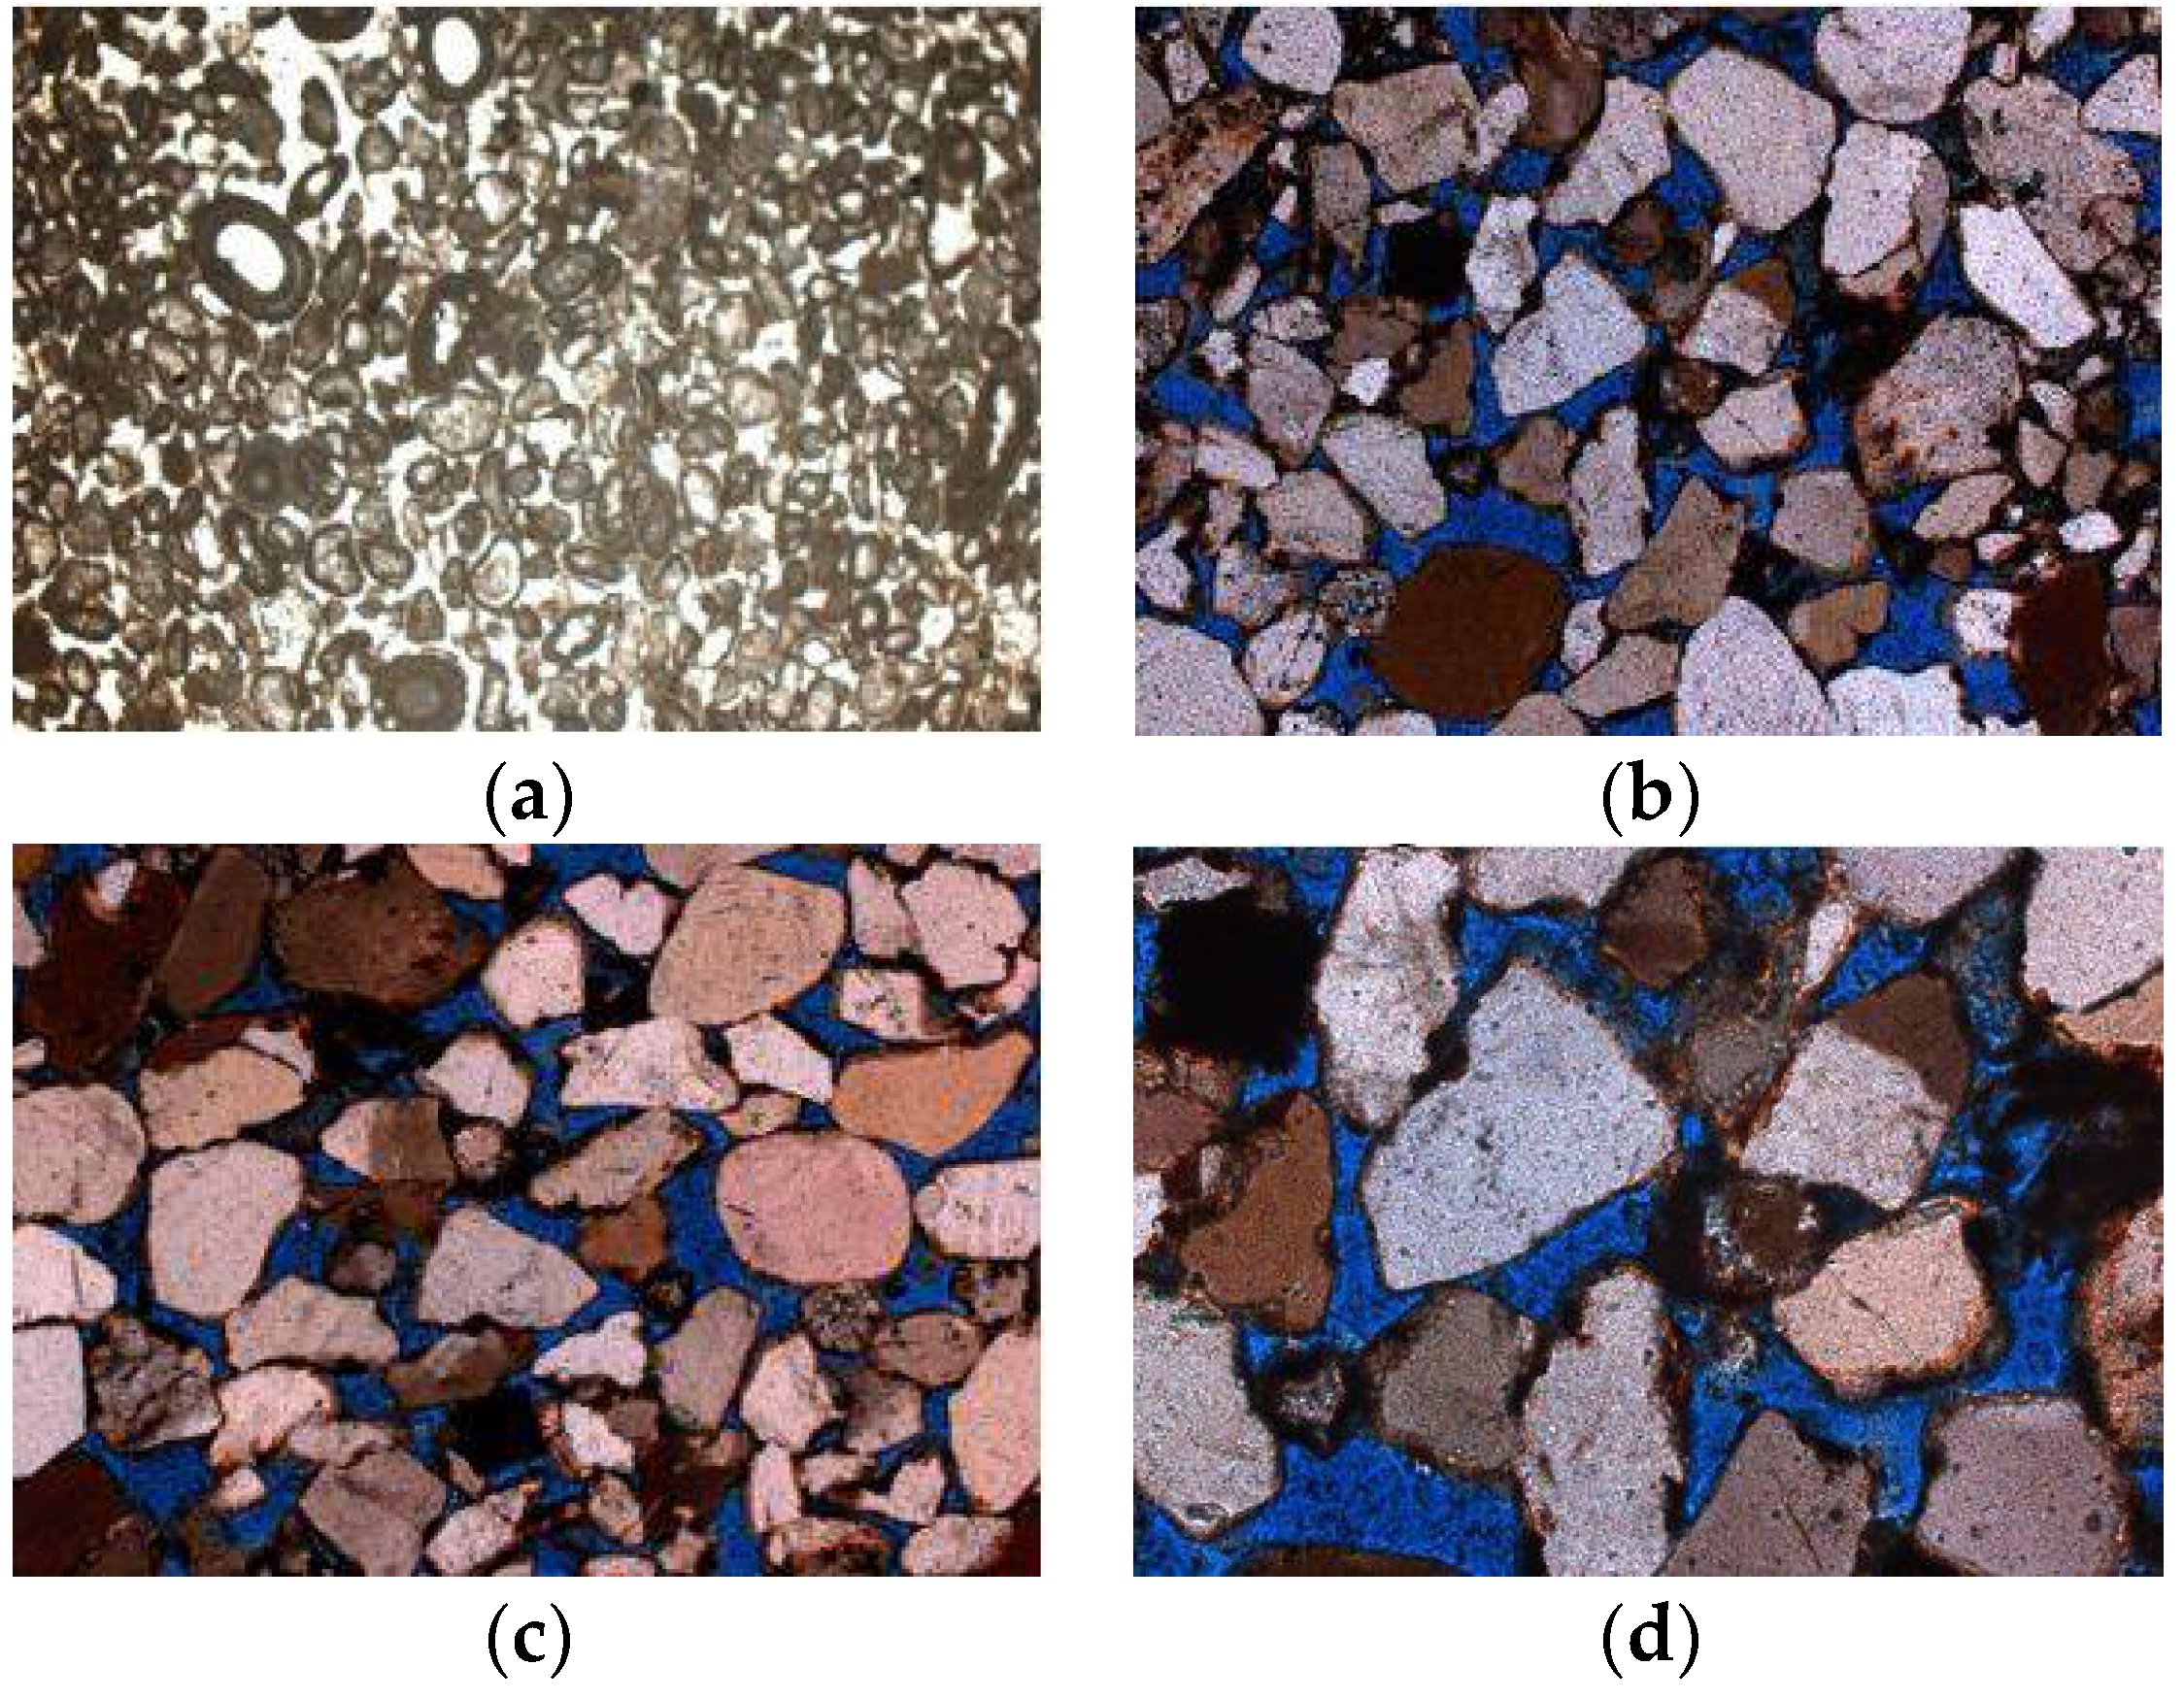
Five functional grain tracking cases were considered, with a non-transformed, geometrically rotated, manually rotated, computer-magnified, and an acquisitive-magnified query image as part of the origin frame. Two types of rock were used: sandstone from Solec and limestone from Slowinsko. The sandstone sample comes from the Rotliegendal layers located near Poznan (western Poland). The Devonian limestone sample was taken in north-western Poland near Szczecin. For grain tracking based on a non-transformed query image, a video sequence of carbonates from Slowinsko was used (
Figure 1a). It was recorded through a polarized microscope with crossed polarizers, with a magnification of ×50 and a resolution of 1264 × 896 pixels, at a speed of 10 frames per second and a duration of 34 s, and thus 340 frames were extracted. For grain tracking with a geometrically rotated query image, the authors used sandstone from Solec (
Figure 1b–d). It was obtained by a polarization microscope, with variable polarization, variable magnification, and a resolution of 1264 × 896 pixels. This rock was also used for grain tracking.
Image rotation during the image acquisition stage, which usually takes place when the angle of the rotating table is changed, can cause the polarization of light, a change in the output colour of the image (
Figure 1b,c), and, consequently, a different graphic representation of the same object. This was observed in the case of sandstone from Solec, with a rotation angle of 30 degrees (providing 12 images of the same rotated area). Visual diversity also occurs when acquiring an image for a microscope using different magnifications. This scenario was evaluated using the sandstone from Solec, registered by a polarized microscope with the following magnifications: ×100, ×200, and ×400 (
Figure 1b–d). This case involved object tracking with an acquisitive-magnified query image.
The authors also performed an analysis from the perspective of the QBIC system, using selected local features. An algorithm was established to match the cases under consideration with possible modifications that take the matching pattern thresholds for the analysed case into account. These steps are as follows:
Image database selection (DSall);
Query image selection (DSx);
Local feature (IP—interest point) detection in DSx and DSall using: cornerPoints (HSA and MEA algorithms), binary robust invariant scalable keypoints features, SURF features;
Feature vector (FV) extraction from DSx and DSall—descriptors are derived from pixels surrounding an interest point (IP) with specified methods: SURF descriptor or fast retina keypoint descriptor;
Selecting only those feature vectors (FV) that are considered to be the strongest matches;
Retrieving the number of corresponding points (MIP) for each image.
Five methods of searching for interest points (IP) were compared: corner points with features from the accelerated segment test (FAST) algorithm [
24], the minimum eigenvalue algorithm (MEA) [
25,
26], the Harris–Stephens algorithm (HSA) [
21,
27], binary robust invariant scalable key points (BRISK) [
21], and blobs using speeded-up robust features (SURF) algorithm [
17,
18].
For the HSA method, the following set of parameters was used: a low value (1%) of the minimum accepted quality of corners as a fraction of the maximum corner metric value in the image, and a small filter size [3 × 3] used to smooth the gradient of the image. The FAST method was applied with a low value (1%) for the minimum accepted quality of corners as a fraction of the maximum corner metric value in the image, and a low value (10%) of the minimum intensity difference between a corner and its surrounding region. The MEA’s application parameters were a low value (1%) of the minimum accepted quality of corners as a fraction of the maximum corner metric value in the image, and a neighbouring mask as a region of corner detection, selected as [3 × 3]. The BRISK parameters were set as follows: the minimum intensity difference between a corner and its surrounding region was equal to 20%, a low value (1%) of the minimum accepted quality of corners as a fraction of the maximum corner metric value in the image, and the scale spaces number was equal to 4 (the number of octaves to be implemented). The graphical application of SURF is presented in the results section with a series of filter response maps obtained by convolving the same input image with a filter of increasing size and scale levels to compute per octave equal to 4. The following FV descriptors were used: SURF for characteristic blob-type points and fast retina keypoint descriptors [
28] for corner types.
3. Results and Discussion
The effectiveness of the search by image system for geological materials, as well as for petrographic data, should make it possible to change the types of query image. Image-based grain tracking for non-transformed, rotated, and scaled query images was assessed. The methods were evaluated by comparing the characteristics of the MIP of the interest points, and then selecting the most similar values as a possible basis for determining images’ visual similarity.
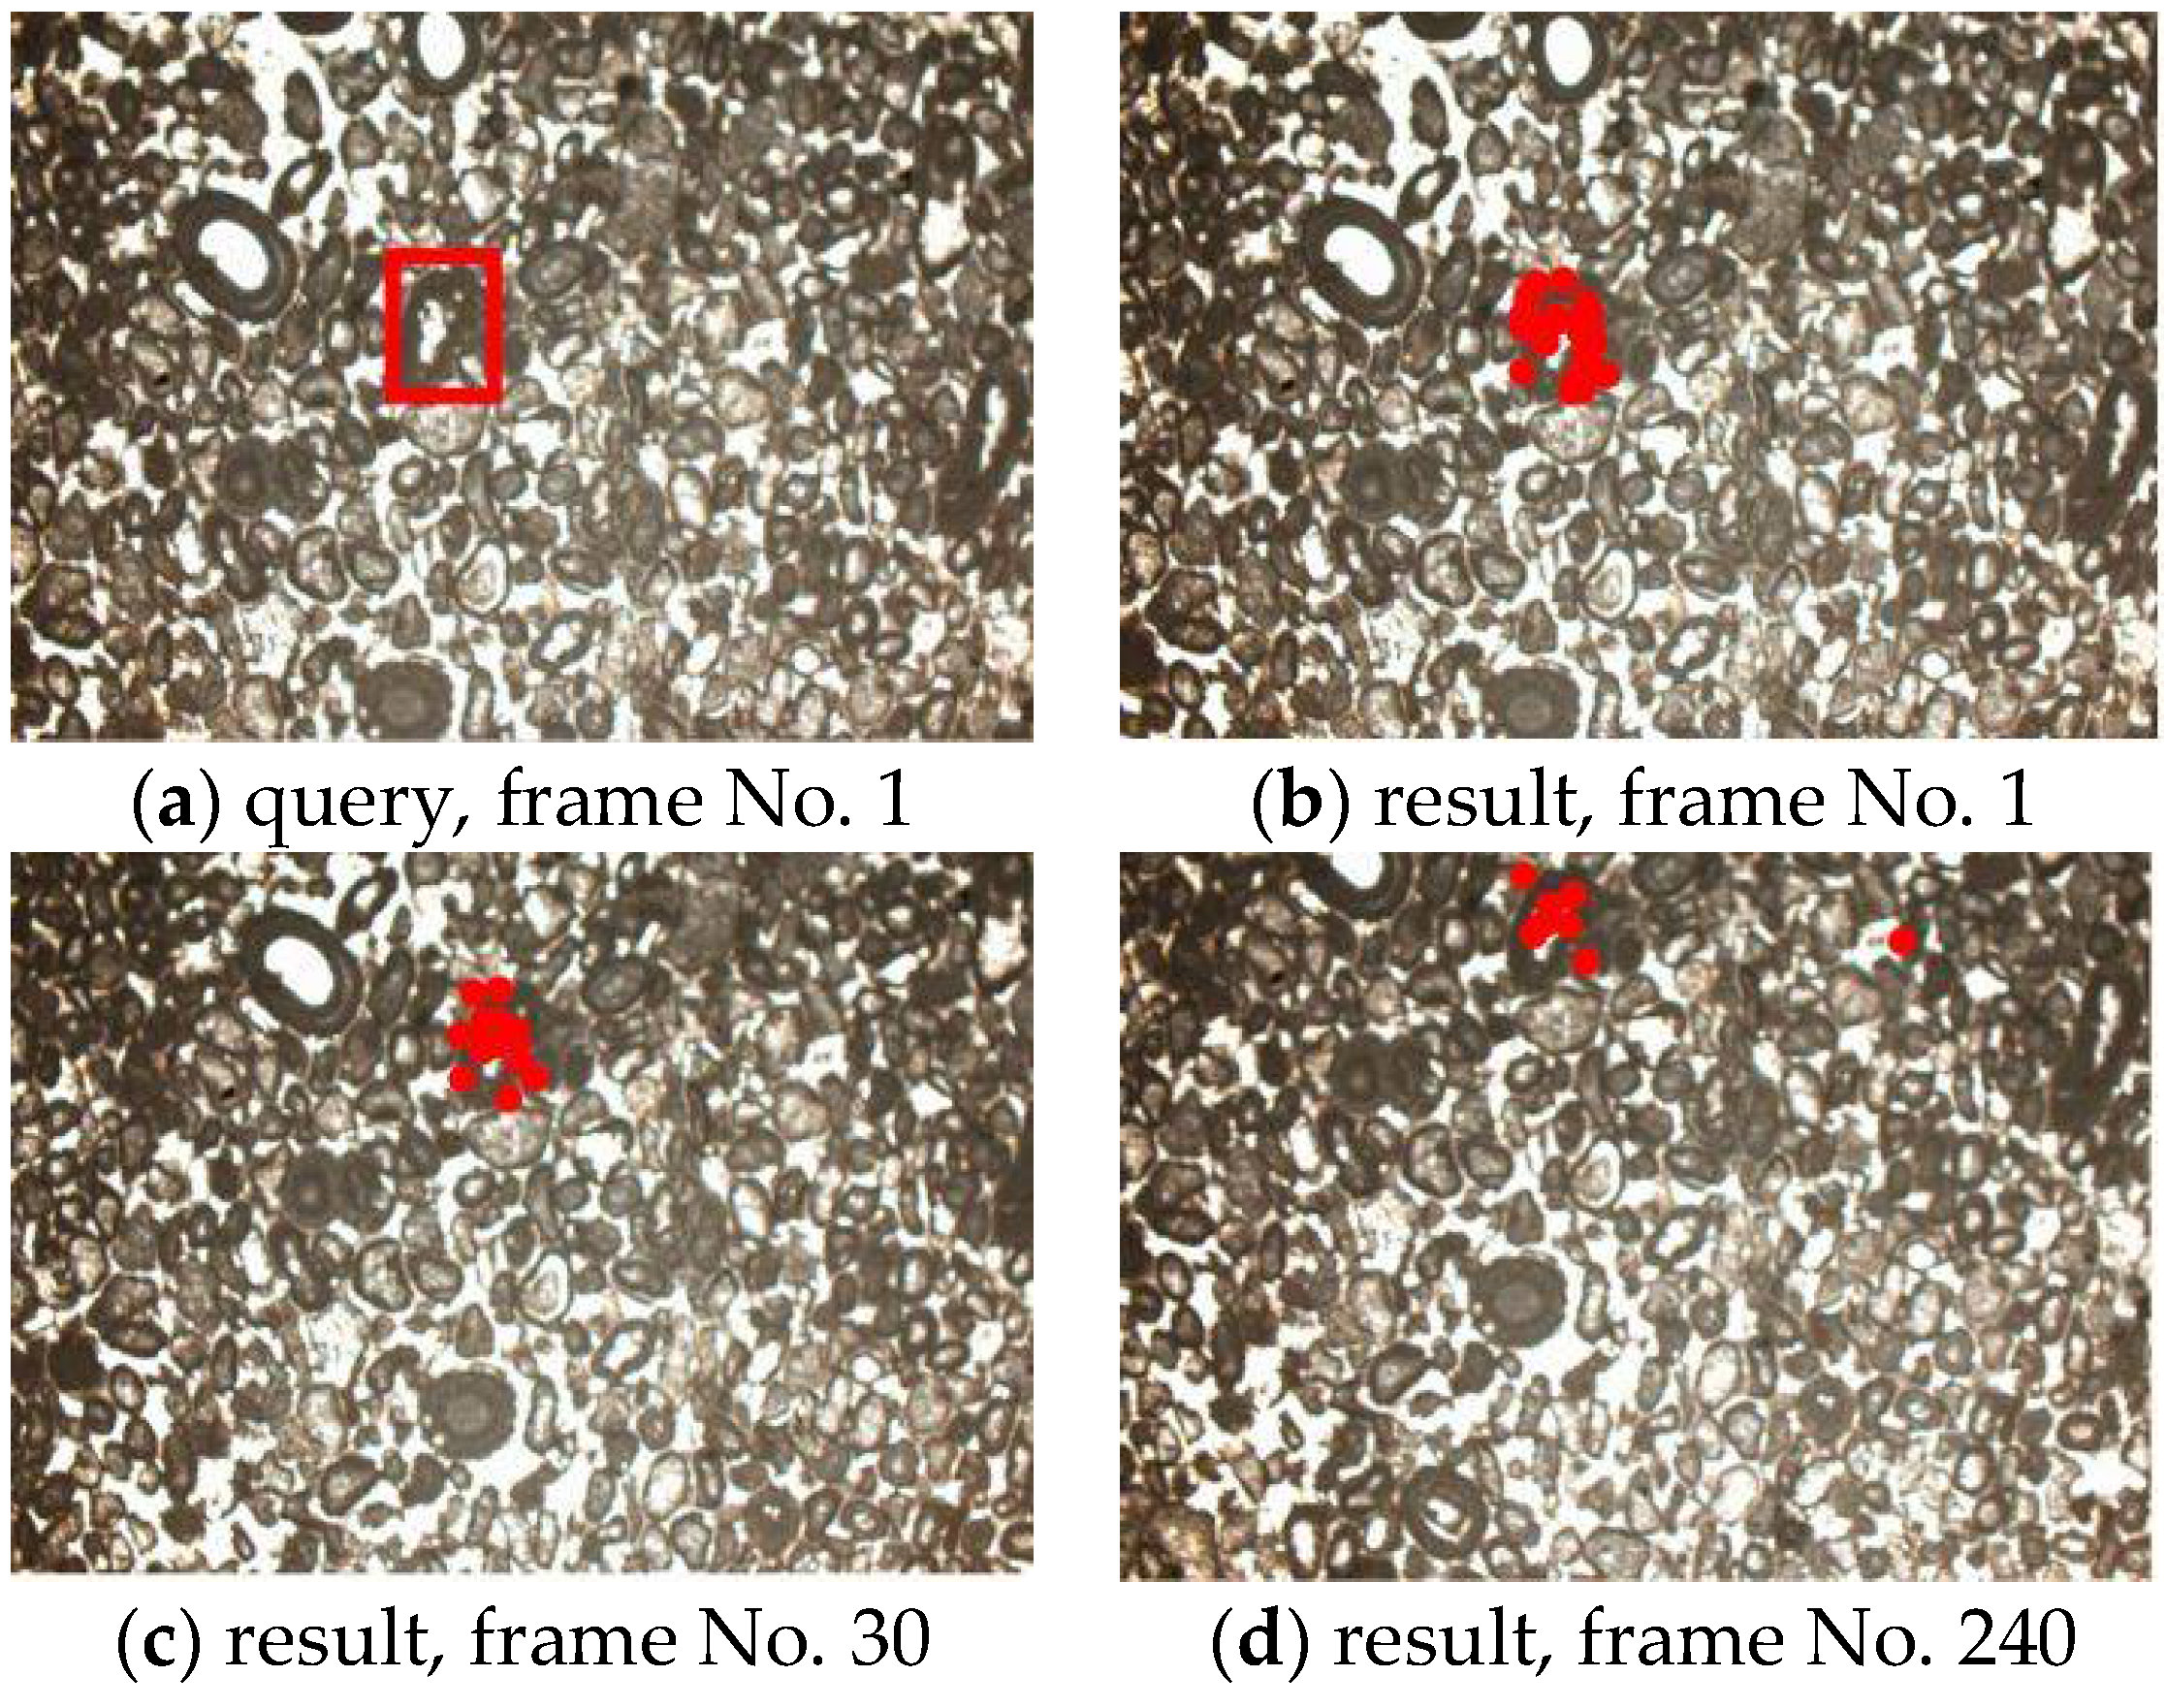
3.1. Object Tracking with a Non-Transformed Query Image
For the evaluation of grain tracking based on a selected non-transformed query image, a data set of carbonates from Slowinsko was presented. The images shown in
Figure 2 represent a sample of the graphical results from tracking with the SURF method as IP, as well as FV, for a given query image.
Satisfactory results were obtained with a non-transformed query image. Illustrative results are shown in
Table 1—the average (MIP average) value of the number of identical characteristic points, which fell in the range of 5% (but 0.35% in the case of SURF) of the best matches for the entire analysed frame set. The threshold is an individual matching value in general, for the analysed case in particular, and was established empirically. As a result, the SURF algorithm returned a number of matched interest points that was much larger. The smallest number of MIPs for a given match resulted from the BRISK algorithm, which also proved correct, i.e., it contained no erroneous matches. All of the methods detected an increased number of similar points in the same set of frames of the analysed video sequence. However, the SURF method detected significantly more points, and, for this type of data, SURF is the most effective algorithm.
3.2. Grain Tracking with a Rotated Query Image
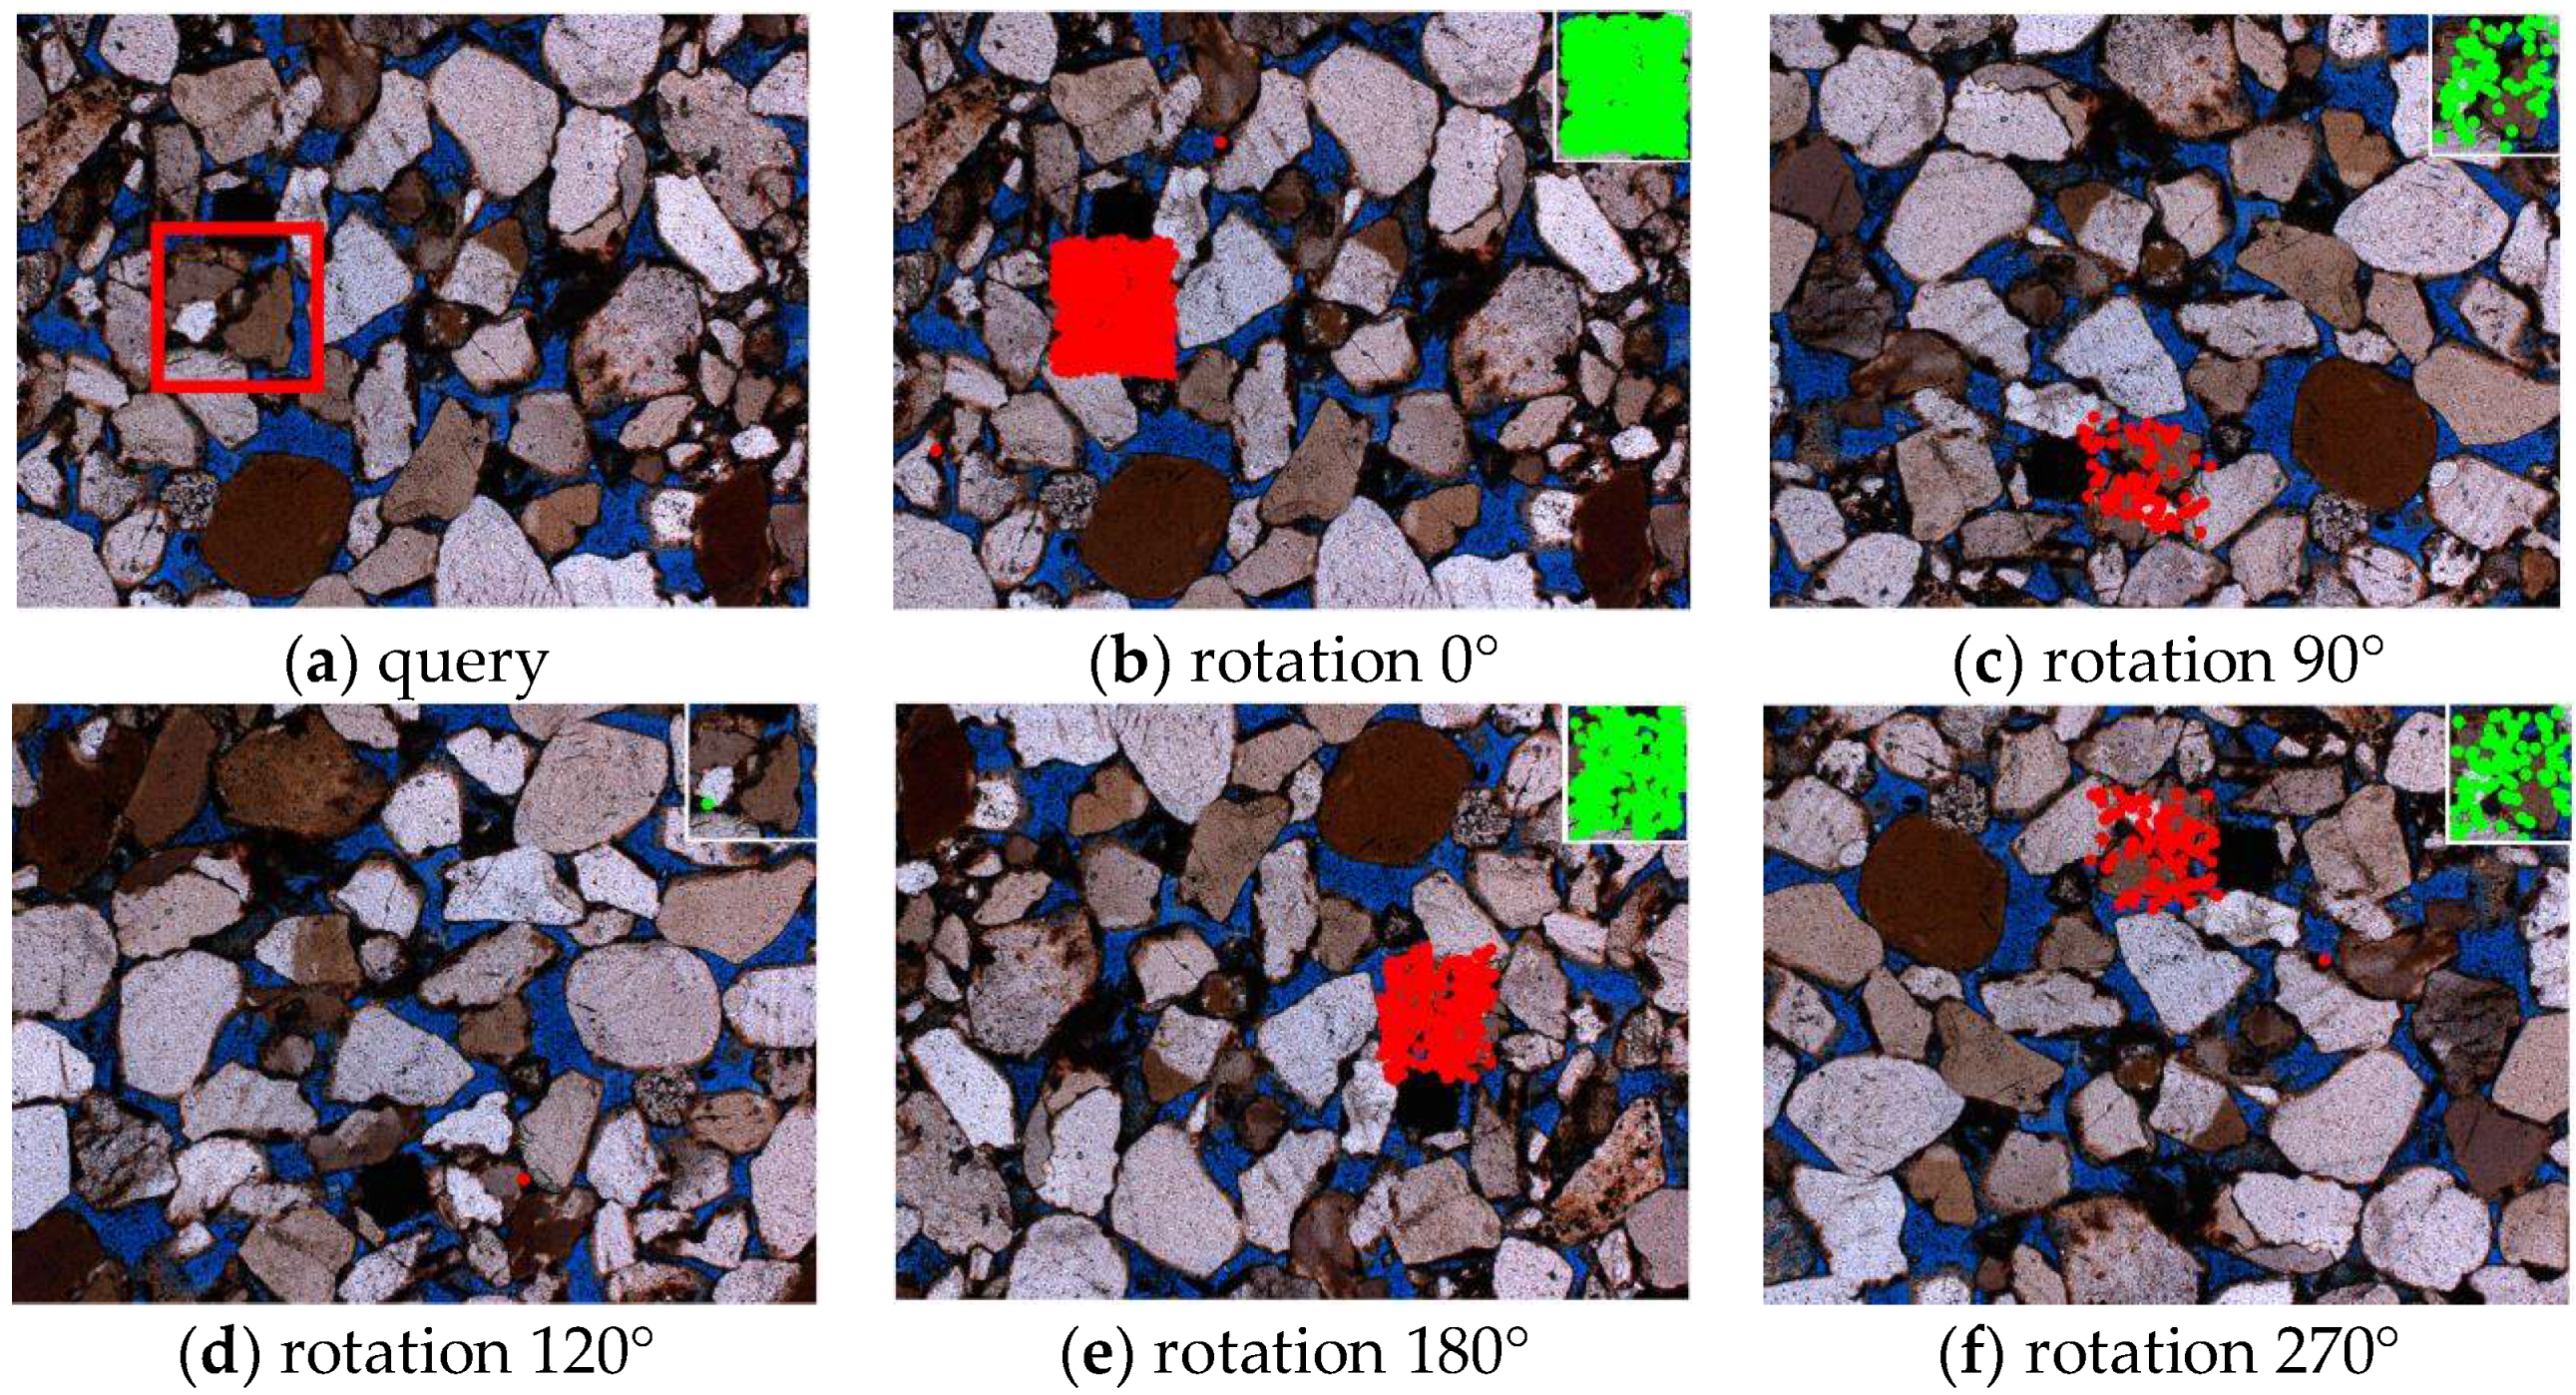
When discussing the effectiveness of a search by image system for geological data, one should consider the possibility of a query image rotation for two cases: when the query image was computer-rotated in a geometric way (e.g., as a result of editing in a graphics editor) and when the image acquisition was accomplished from a different perspective (e.g., as a result of rotating the table of a microscope). For the computer-rotated query image, images of sandstone from Solec were used (
Figure 3).
Geometrical conversions do not influence the site’s polarization, and thus the colours of the rotated image do not change. The query image was rotated by an angle selected from the range of 0°–330°, with a variable step of 30°. Satisfactory results (
Table 2) were obtained by performing a computer-rotated query using angles set to multiples of 90 degrees. For this example, at least 32 identical characteristic points were detected following the application of the SURF method to achieve a much lower fitting threshold (the SURF matched the 0.35% threshold, while other methods matched the 5% threshold). The MEA algorithm proved to render relatively good results for the rotated object search. The number of correctly detected features using the FAST and HSA methods was acceptable for symmetric rotations around the x-axis and y-axis; however, the MIP number was at least 50% smaller and may not be sufficient for geological grain tracking.
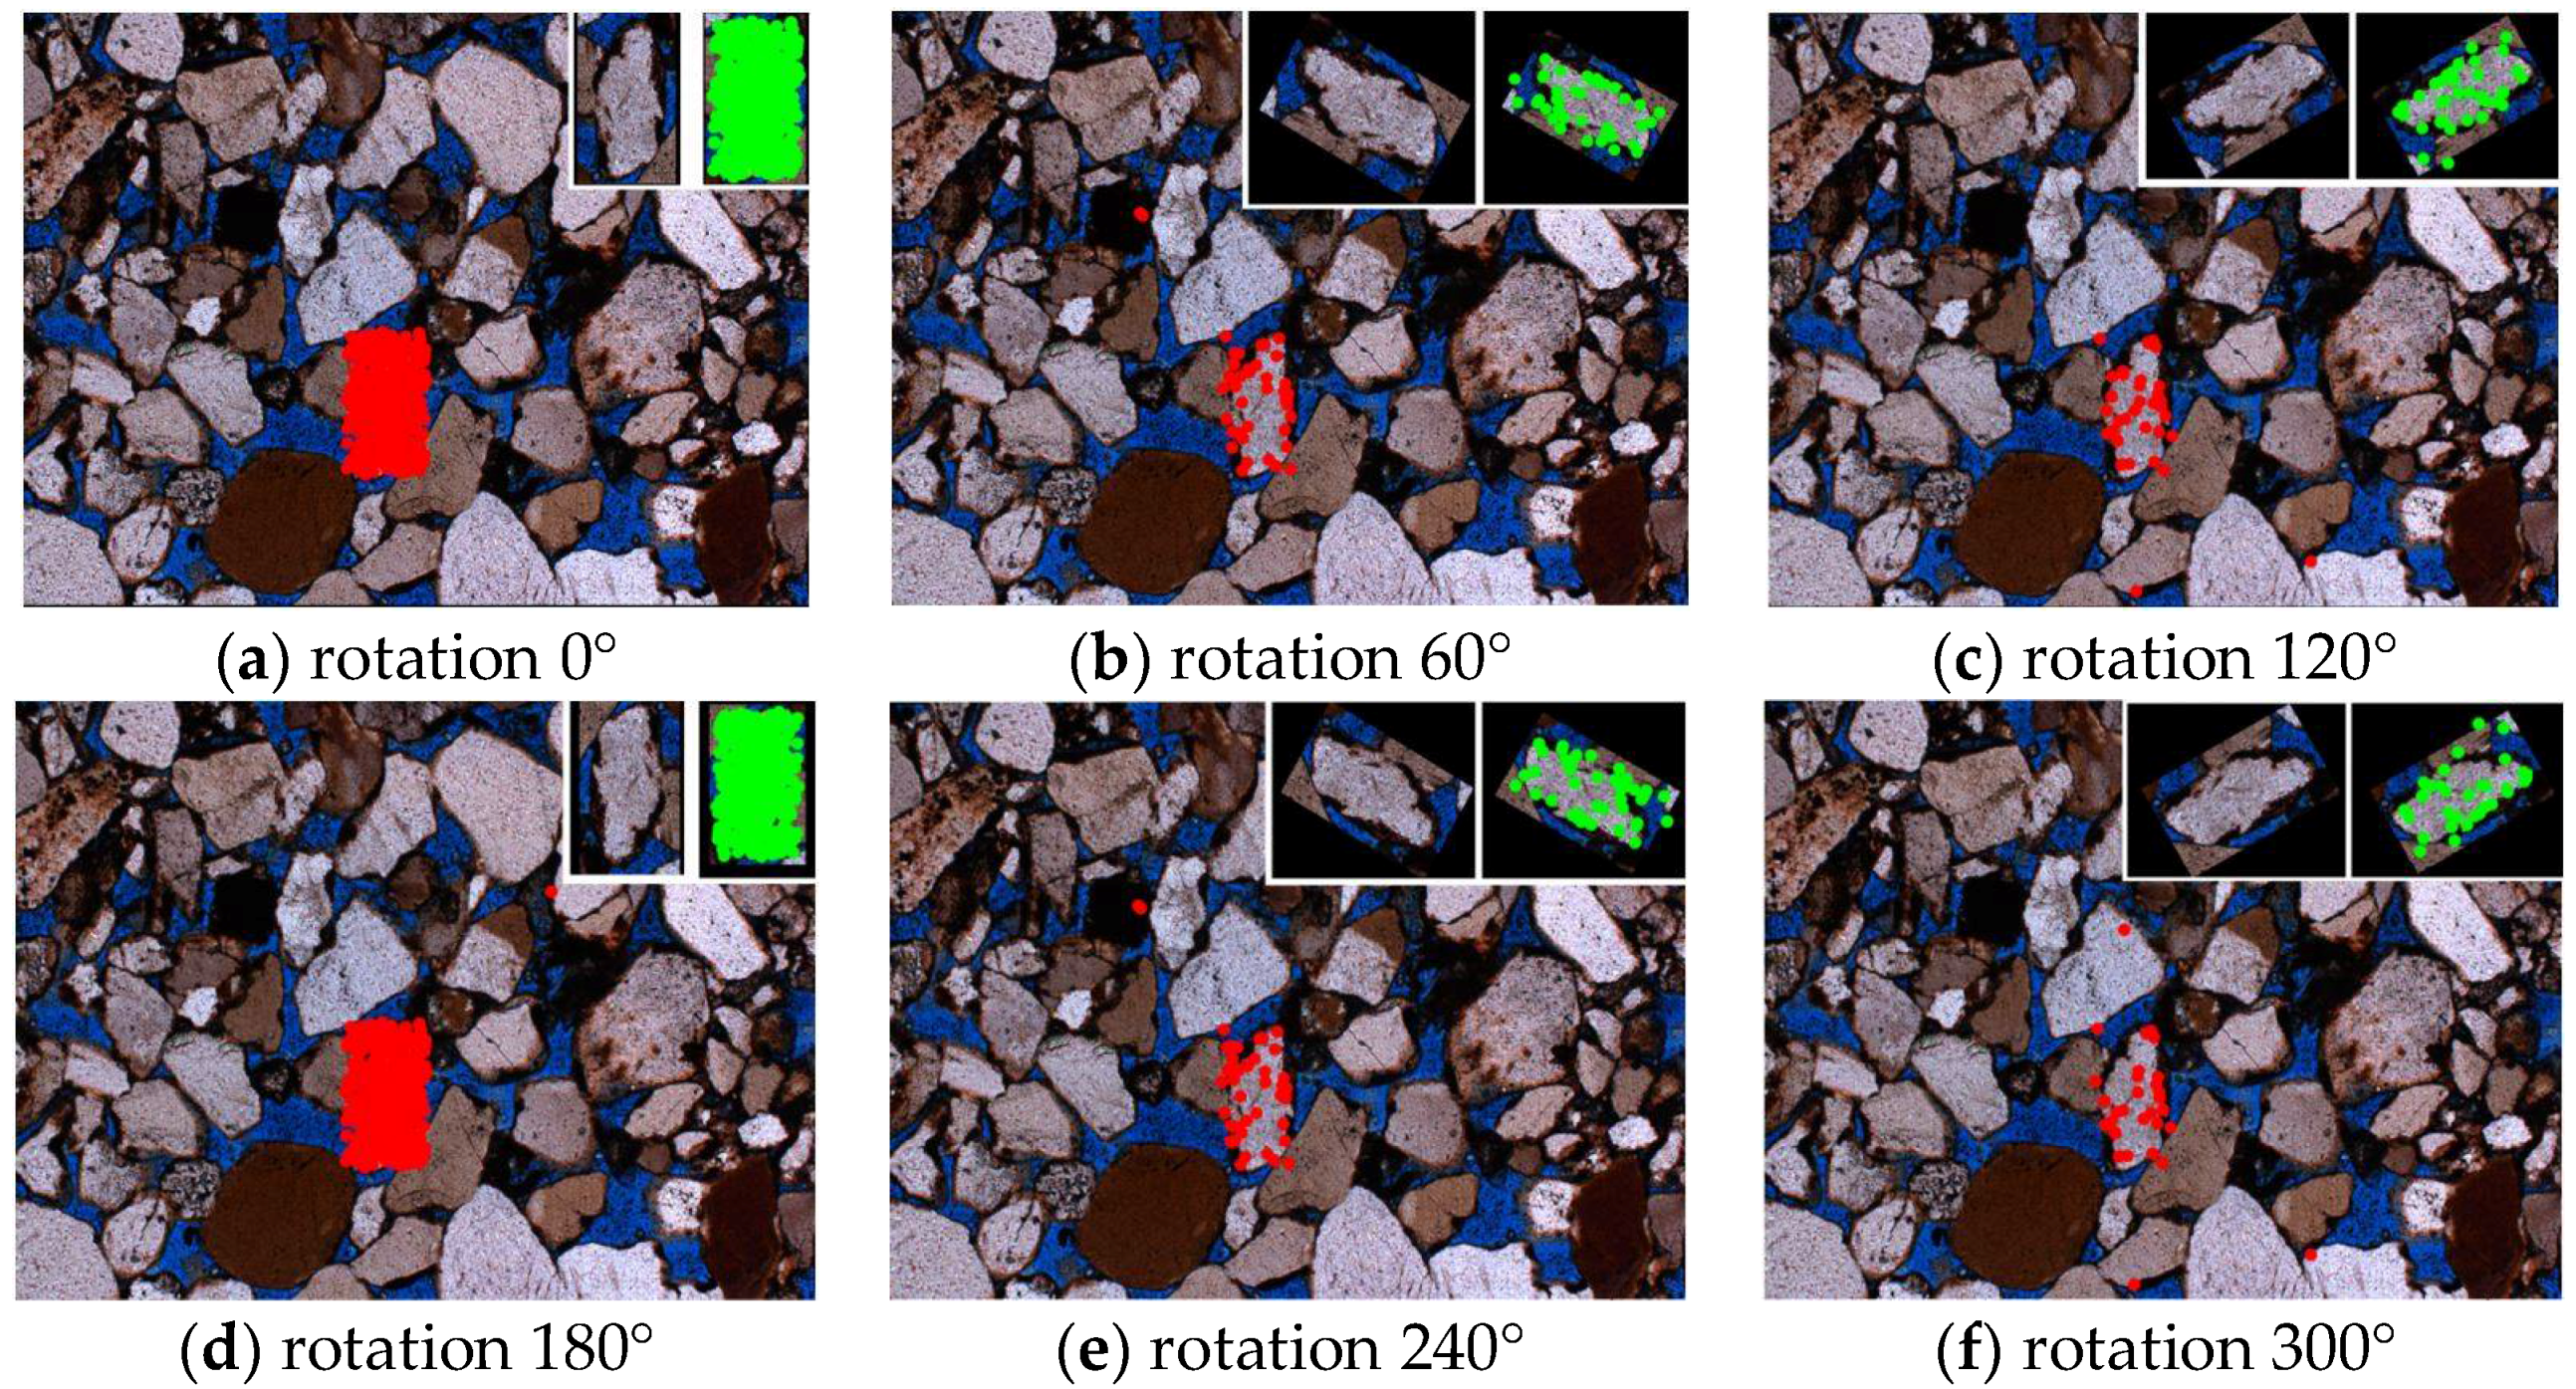
Less satisfactory results were obtained for objects registered at different angles of microscope set-up (
Table 3).
Figure 4 shows a sample search of a rotated object, recorded with a polarized microscope. An image of quartzite was registered with α angle equalling 0°–330° and a step of 30°. A change in the position of a rotary table caused the change of colour (
Figure 4a,d), which significantly influenced the quality of the search, especially since the query image is not rotated, i.e., it does not change its colour.
The local feature detectors are based on the representation of the grey levels of an image, which affects the quality of a search. The SURF method was the most effective; however, disproportions between an image without rotation (0°) and a rotated image were significant, with at least a two- or five-fold drop in the number of characteristic features for rotated images (for the SURF and MEA methods). The remaining algorithms were sensitive to the manner of data acquisition; therefore, they appear to be insufficient for use with geological data. They require adaptation for geological purposes and only then should research into their utility be continued.
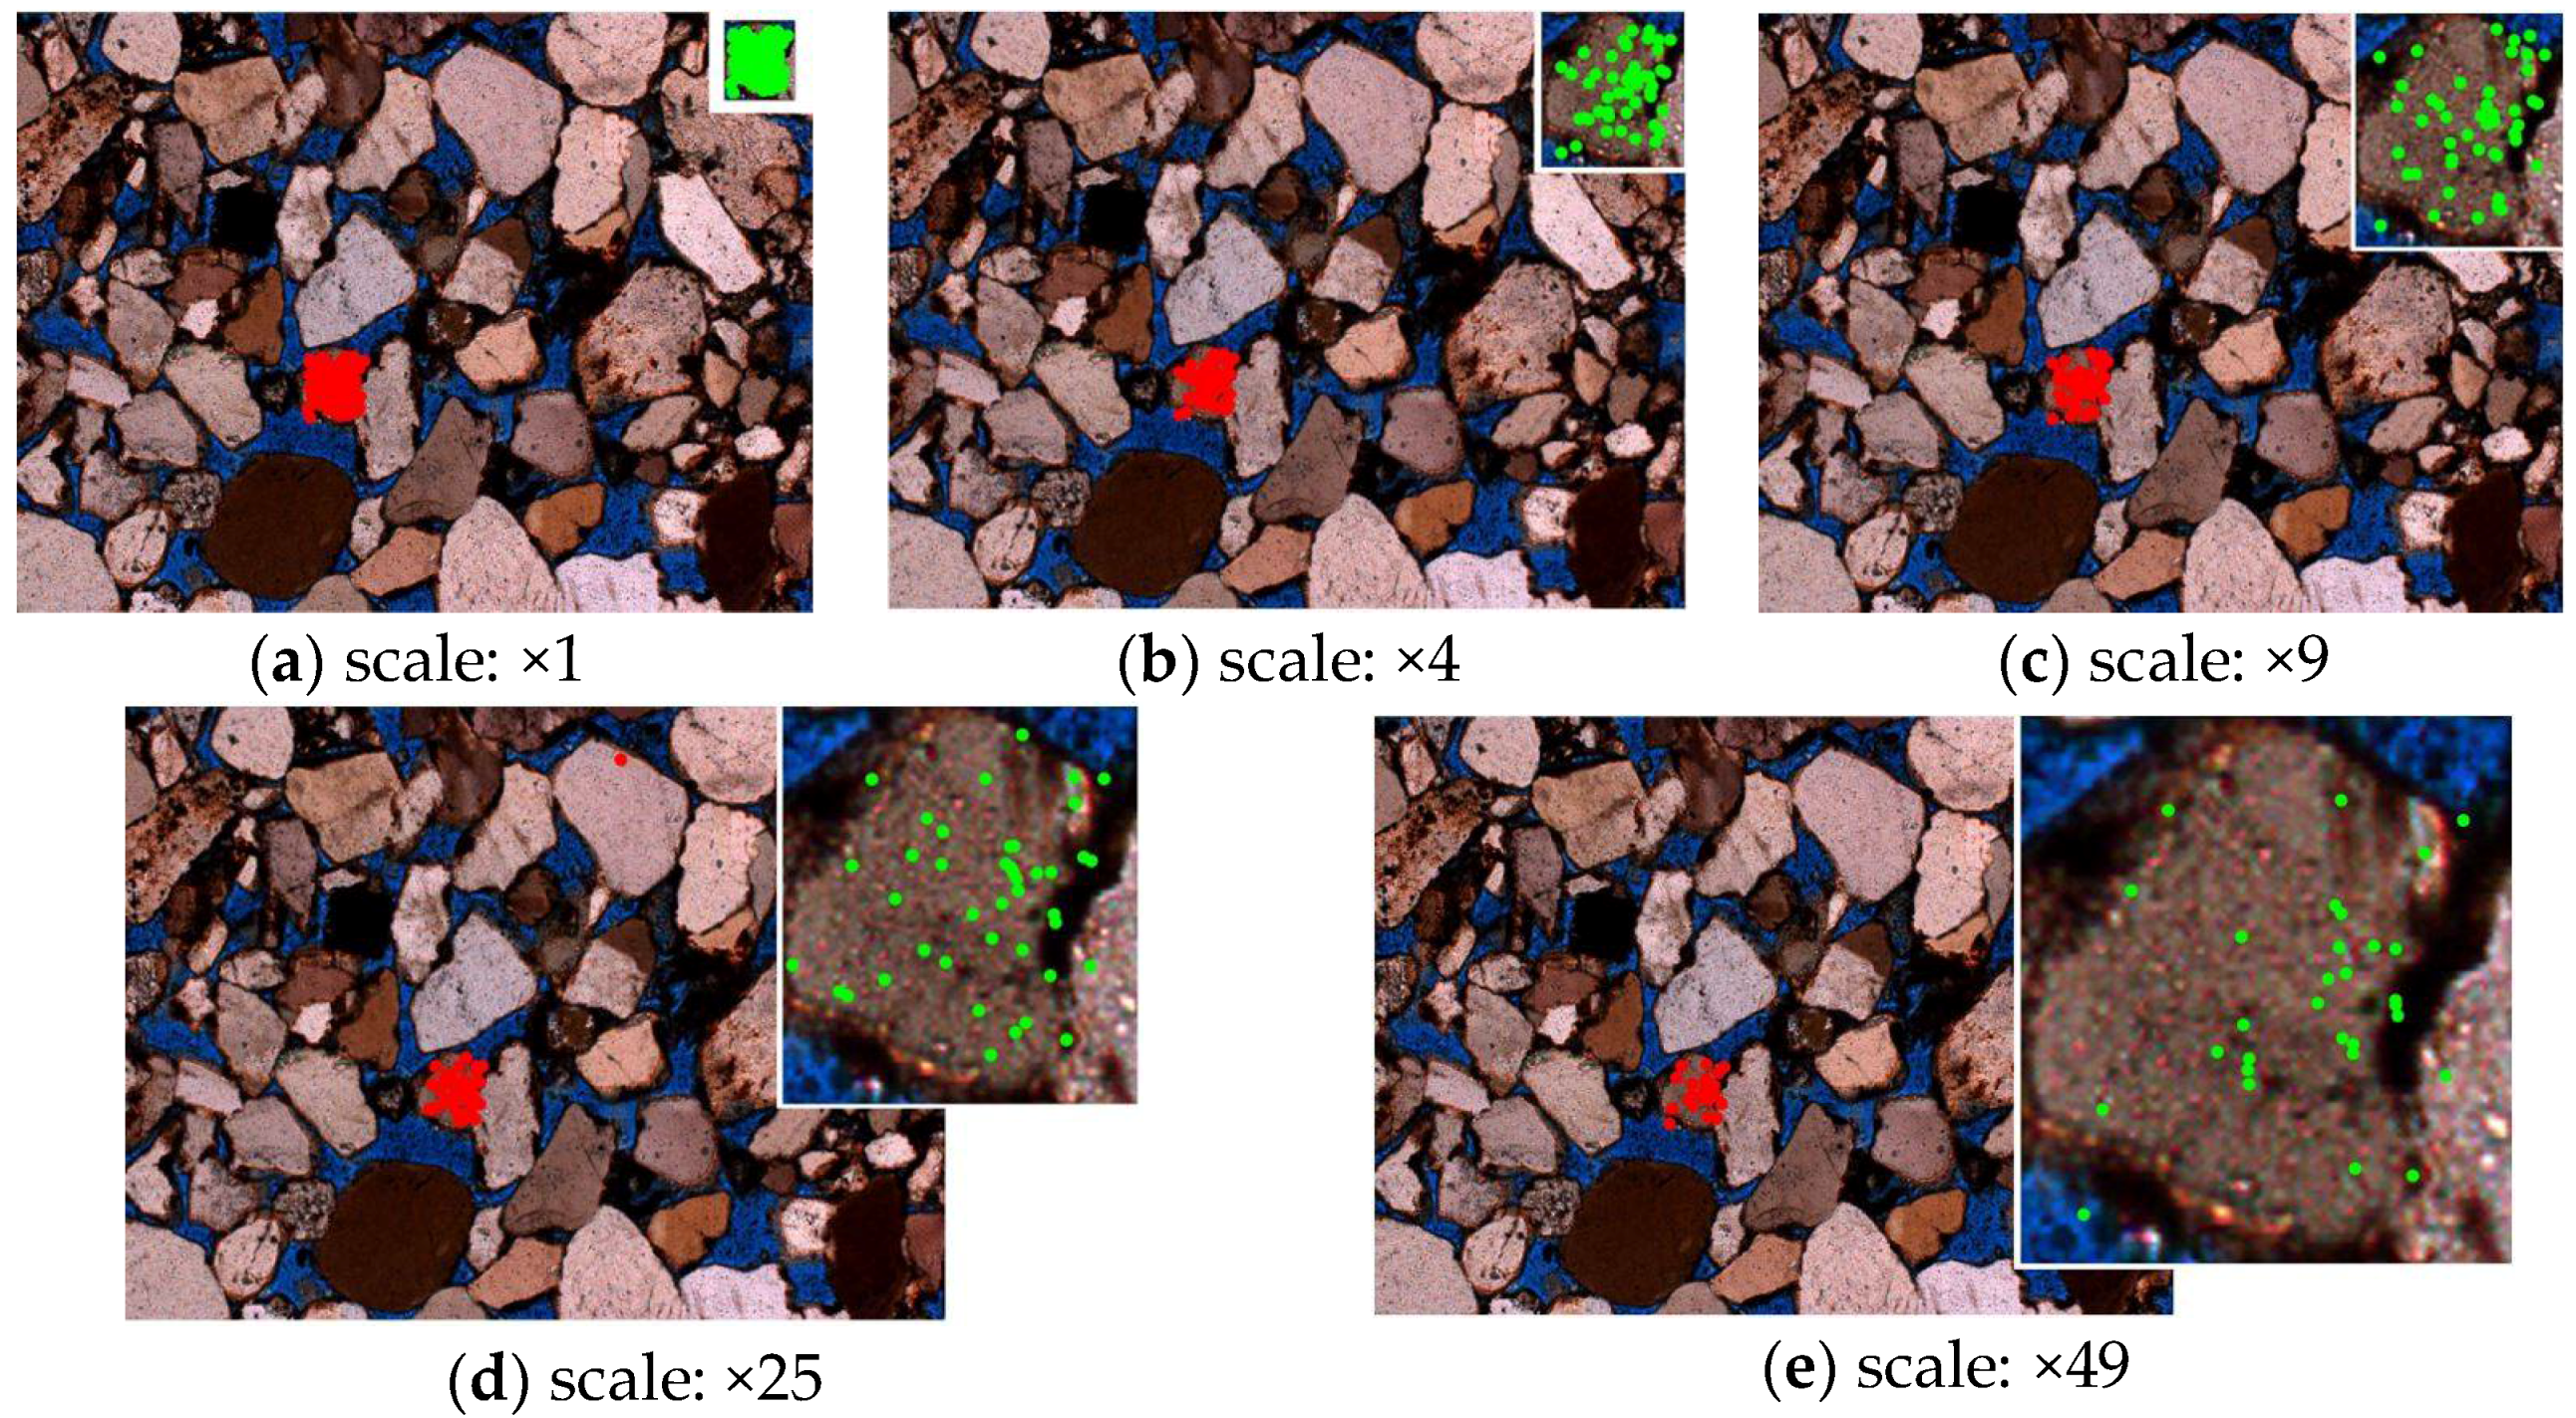
3.3. Grain Tracking with a Scaled Query Image
Constructing search by image methodology in geology is challenging, since it is also a question of object detection similar to a query but registered with different magnifications. Such an issue should be considered in two ways: in the context of a geological data analysis (computer-scaled images, see
Figure 5), and in the context of images retrieved with different microscope magnifications (
Figure 6). The results of correct feature detection for a computer-scaled query image are presented in
Table 4. An image search under different enlargements, with scaling performed by computer methods, rendered satisfactory results only for the SURF method; however, it was sensitive to significant data reduction. SURF ensures that the points of interest are scale-invariant by transforming the image using the multi-resolution pyramid technique, to copy the original image with a Gaussian pyramid or Laplacian pyramid shape, in order to obtain an image with a special blurring effect on the original image, called scale-space [
29,
30].
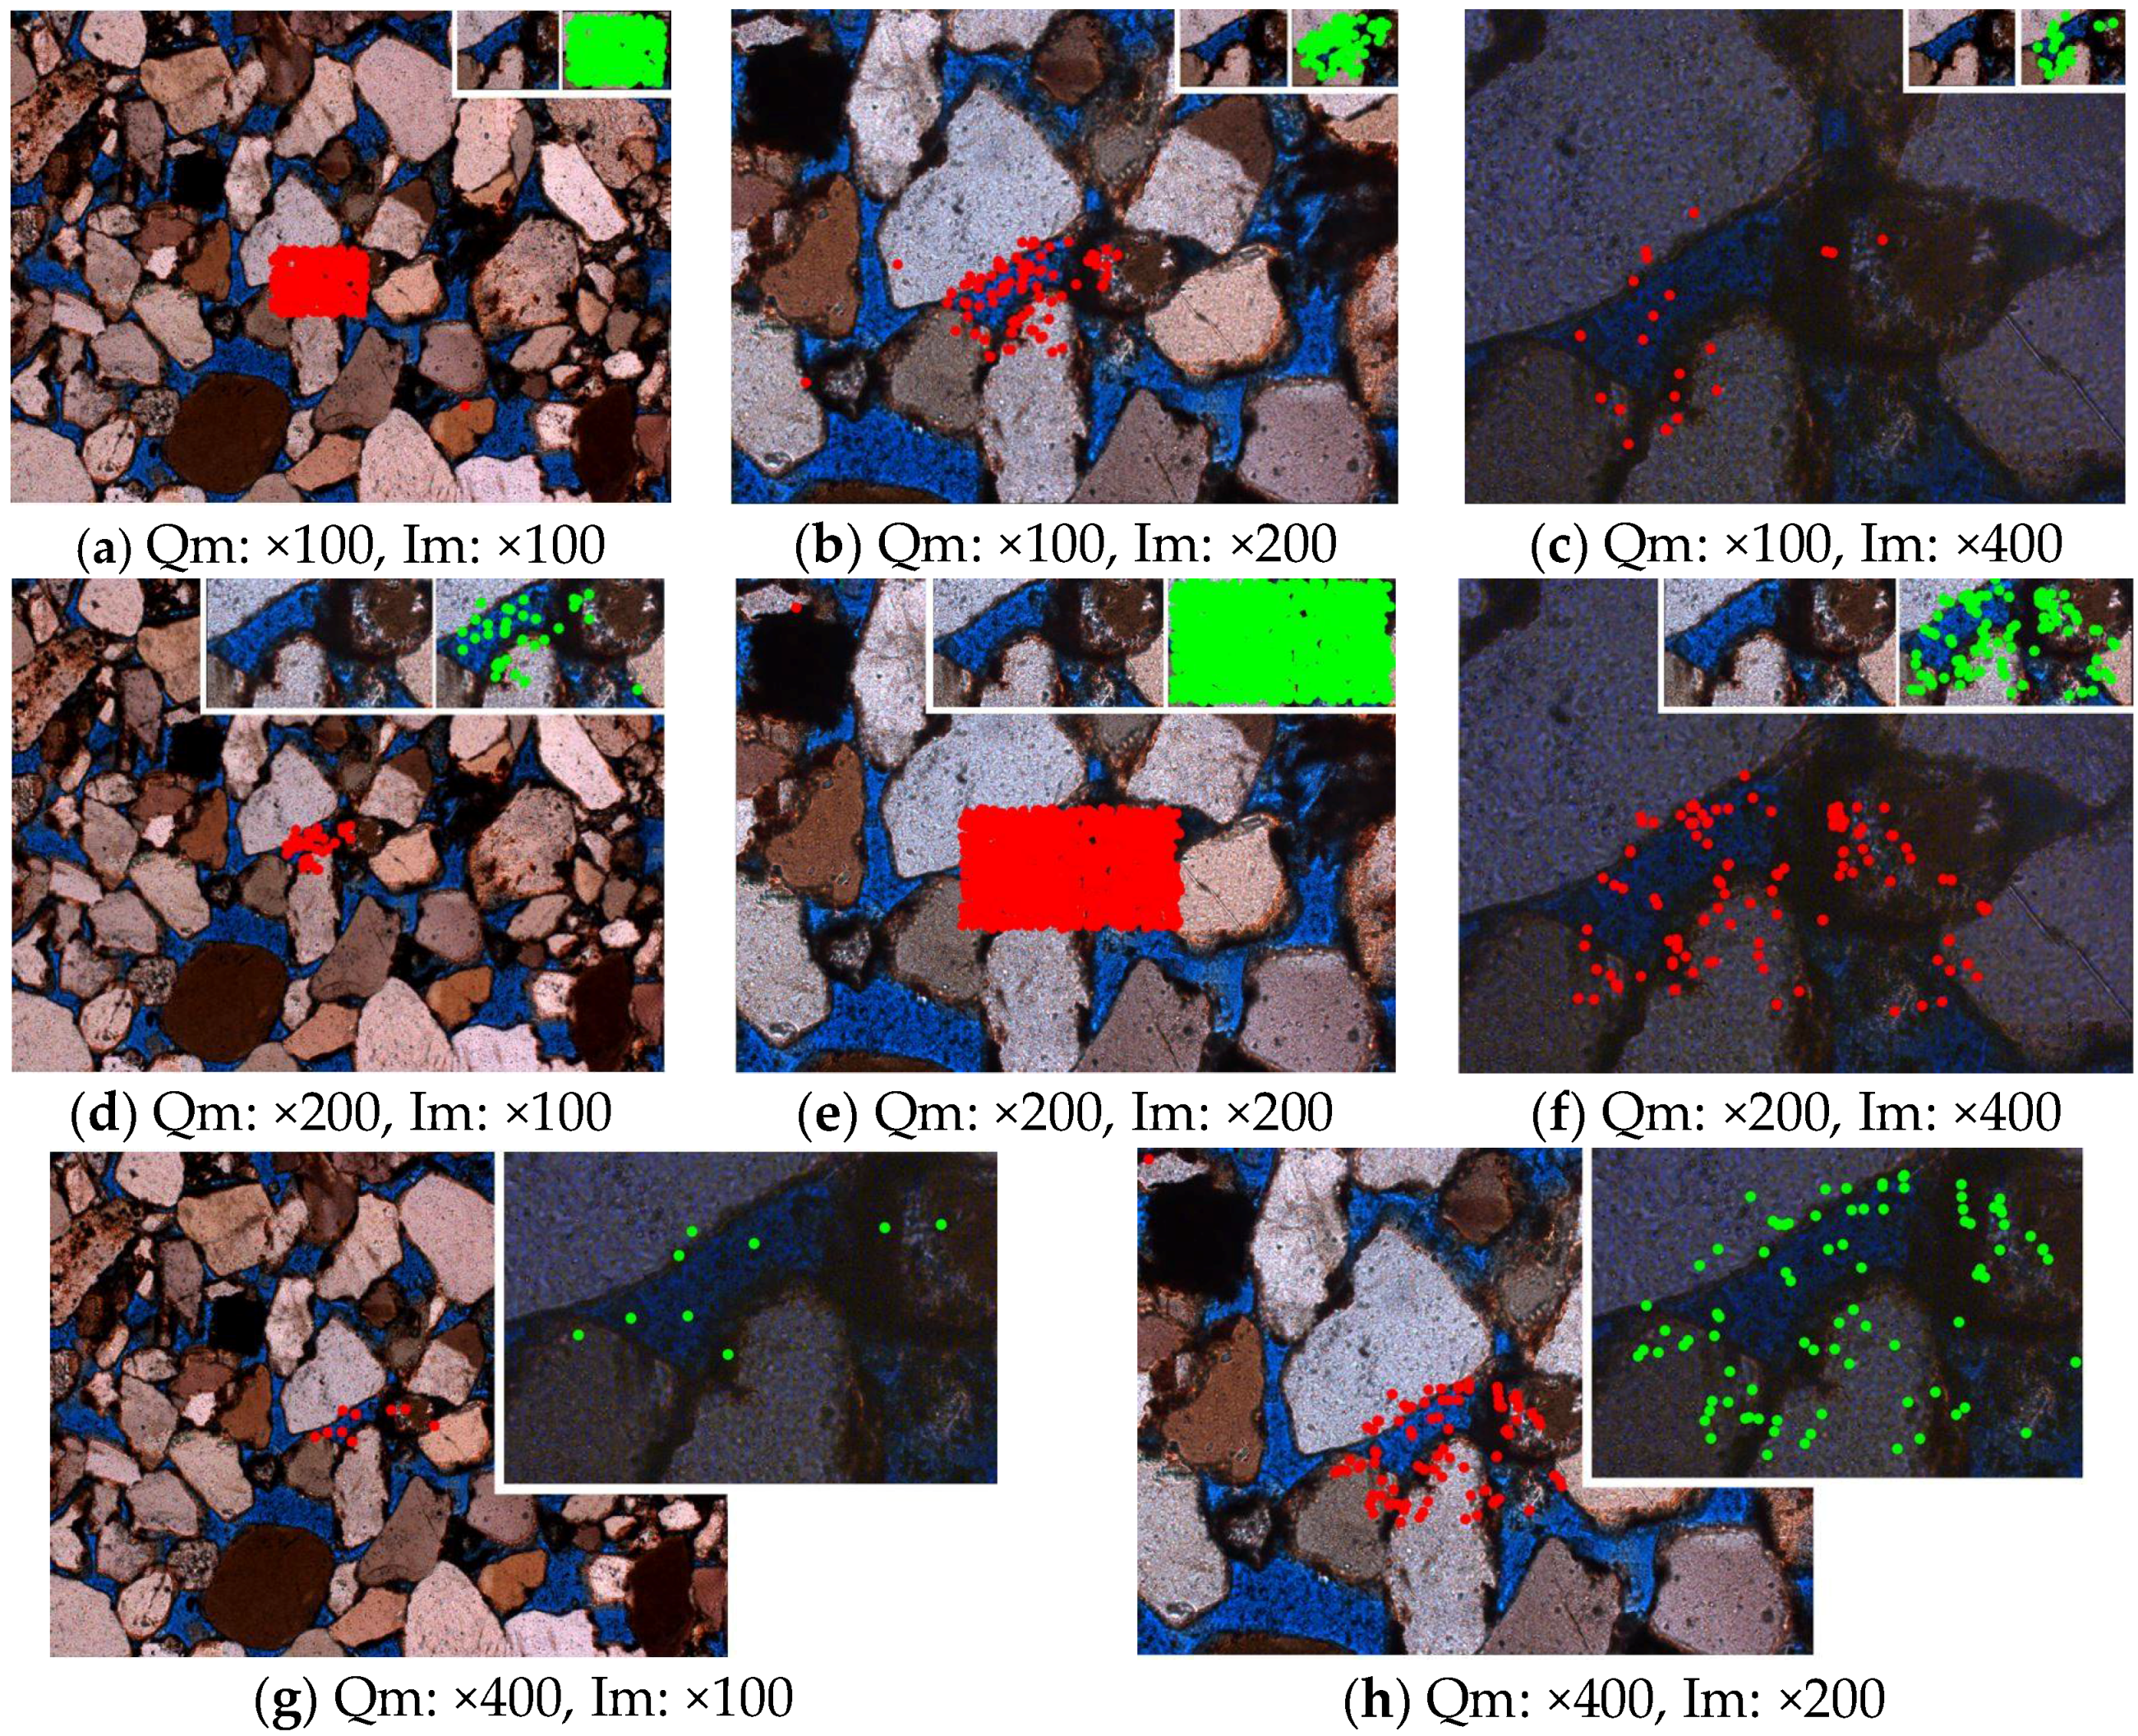
Image acquisition with different microscope magnifications is characterized by different, resolutions of a pixel, therefore resulting in different representations of the values of the pixels neighbouring the searched image. Query images were selected from all registered magnifications (
Figure 6). The results of an image search under different magnifications, with scaling performed using an optical microscope, produced the poorest results for all the conducted experiments (
Table 5). The poor effect was a result of processing an image registered under various microscope magnifications, which, from the observer’s perspective, were visually different images (i.e., displaying different grayscale levels and different variable textures, although, geologically, it is the same rock). In this case, the number of identical detected points (MIP) for various enlargements is scarce and not significant, even with the application of the SURF method, i.e., the method that previously gave the most accurate results. Of note, for magnifications exceeding ×400, the search key encompassed virtually the whole picture, which rendered a large MIP, particularly for the MEA and SURF methods.
Relatively good results were obtained only with the SURF method when a similar (next) magnification level was used. For example, query magnification ×100 can search for similarities in image magnification equalling ×200 and query magnification ×200 can search for similarities in image magnification equalling ×100 and ×400.
3.4. Searching in Geological Image Databases
The use of descriptors that rely on the local surrounding key points of an image was based on an example of two different rocks. This section contains a results obtained from an analysis of a greater number of microscopic rock images.
The results presented thus far show that the proposed methods—and the SURF method in particular—are useful for searching for images containing objects visually similar to a given search key in databases. Additionally, the SURF method was demonstrated to be immune to minor alterations to the image and query size, as well as to changes of angles between the two. With this in mind, the SURF method was implemented for searching through a large geological image database. The database was composed of 7400 microscope images of 37 various rocks. The rocks were amphibolites, anhydrites, dolomites, granites, shales, marbles, sandstones, porphyries, and syenites, all coming from different locations.
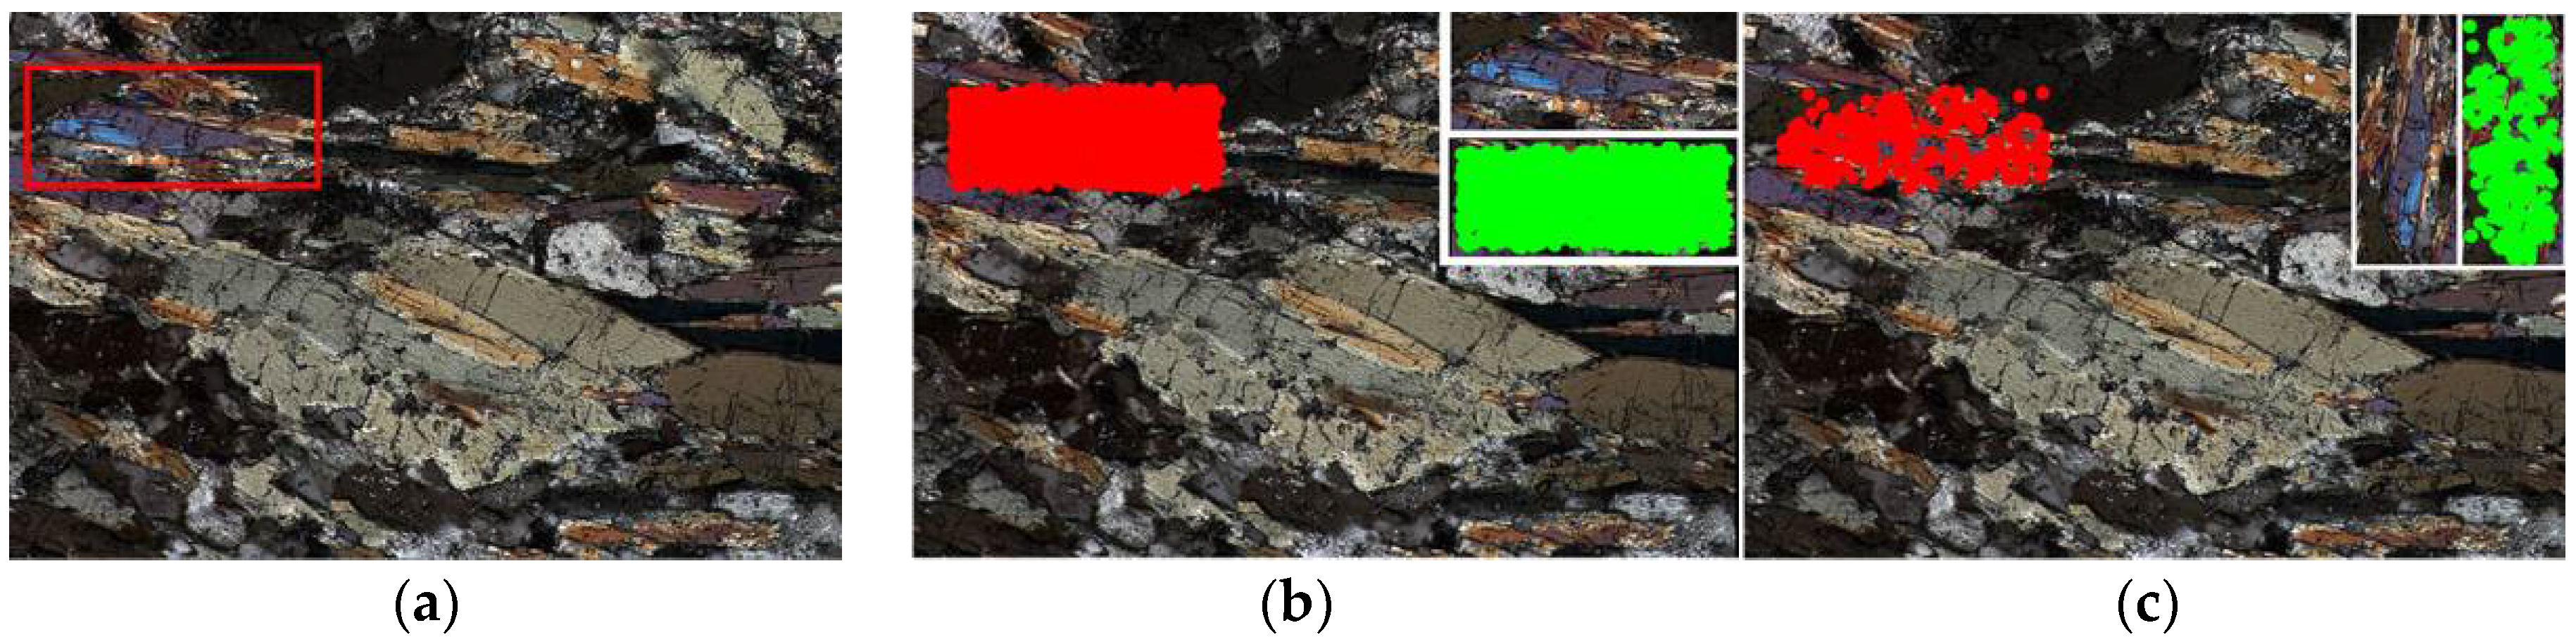
A fragment from an image of an amphibolite from Spitsbergen was selected as the search query. Two search procedures were tested. The first search query was a cut-out piece of the image. The second procedure involved using the same fragment, but rotated by 90 degrees and reduced in size by 10% (
Figure 7).
The results support the use of SURF for image searching. In the first case (image query without rotation and size reduction), the application of SURF resulted in the identification of 1030 similar points between the image piece and the image from which this piece had been cut. For the remaining 7399 images from the database, the number of similar points ranged from 0 to 2. In the second case (image query rotated and reduced in size), the number of similar points between the image piece and the image from which it had been cut out was 254. For the remaining 7399 images from the database, the number of similar points ranged from 0 to 3.
The result demonstrates unequivocally that the proposed method can be successfully used in the process of searching through databases of geological images in order to find a given analysed rock.
4. Summary
This paper compares the possibility of using selected local feature detectors as a methodological database for queries by image content in the field of geological sciences. The aim was to evaluate several techniques that are well-known to the computer vision community in order to automate reverse image searching in geological image databases. The processes of visual searching for similar objects or images were carried out by means of a query image. Five techniques were evaluated in order to determine their relative utility for searching geological images, taking into account the confound of differing image transformations (like computer and microscopic image rotations or magnifications). The research demonstrated that the SURF algorithm was the best characteristic feature algorithm for all of the examples discussed. It detected the highest number of characteristic points for all instances that were analysed. Additionally, the validation test, i.e., searching the database with the use of a scaled and rotated fragment of an image, where the database had 7400 images of 37 different rocks, demonstrated the usefulness of SURF for the unambiguous identification of the searched image.
The authors state that this innovative research on the use of content-based image retrieval techniques in the field of geology confirms that the defined methods can be used for searching microscopic rock image databases. The work was limited to searching for very similar objects; however, the methods of matching local features can also be used for searching less similar objects, though this will require modifying the parameters of the presented method. The purpose of the paper was to show that such methods can be used and developed for practical applications in geology and specifically demonstrates their utility for polarization microscopy images. However, these methods can also be used to track elements in other research techniques, e.g., for chemical and isotopic analysis using microbeam techniques such as electron microprobe, laser ablation inductively coupled plasma mass spectrometry, and secondary ion mass spectrometry [
31,
32,
33].
Generally, the described methods may be used for geological applications where image data are used. They can be useful, for example, for verifying whether a given section has already been analyzed, or to retrieve images from the database that would be similar to the currently analyzed material. It can be applied during the collaboration of many research teams. In this scenario, searching the databases of all coworkers in order to find the same or similar object may become significant.
The authors are not aware of any commercial programs that allow the use of the features described in this paper for strictly geological applications. At the same time, we believe that their implementation in existing commercial systems would not present a programming challenge. Thus, if it were made clear that the methods discussed in this work could be useful to the geological community, these methods may be implemented in commercial software. In sum, we conclude that these techniques should not remain a sporadic tool in the field of geology, but are both feasible and advantageous for mainstream applications.


