Article

Tiberiobardiite, Cu9Al(SiO3OH)2(OH)12(H2O)6(SO4)1.5·10H2O, a New Mineral Related to Chalcophyllite from the Cretaio Cu Prospect, Massa Marittima, Grosseto (Tuscany, Italy): Occurrence and Crystal Structure

1
Dipartimento di Scienze della Terra, Università di Pisa, Via Santa Maria 53, I-56126 Pisa, Italy
2
Department of Applied Geological Sciences and Geophysics, University of Leoben, Peter Tunner Str. 5, A-8700 Leoben, Austria
*
Author to whom correspondence should be addressed.
Minerals 2018, 8(4), 152; https://doi.org/10.3390/min8040152
Submission received: 23 March 2018 / Revised: 6 April 2018 / Accepted: 9 April 2018 / Published: 11 April 2018
(This article belongs to the Special Issue New Mineral Species and Their Crystal Structures)

Abstract

:
The new mineral species tiberiobardiite, ideally Cu9Al(SiO3OH)2(OH)12(H2O)6(SO4)1.5·10H2O, has been discovered in the Cretaio Cu prospect, Massa Marittima, Grosseto, Tuscany, Italy, as very rare, light green, vitreous, tabular {0001}, pseudo-hexagonal crystals, up to 200 μm in size and 5 μm in thickness, associated with brochantite. Electron microprobe analysis gave (in wt %, average of 5 spot analyses): SO3 10.37, P2O5 3.41, As2O5 0.05, SiO2 8.13, Al2O3 5.54, Fe2O3 0.74, CuO 62.05, and ZnO 0.03, for a total of 90.32. Based on an idealized O content of 42 atoms per formula unit, assuming the presence of 16 H2O groups and 13.5 cations (without H), the empirical formula of tiberiobardiite is (Cu8.69Al0.21Fe0.10)Σ9.00Al1.00(Si1.51P0.54)Σ2.05S1.44O12.53(OH)13.47·16H2O. The main diffraction lines, corresponding to multiple hkl indices, are [d in Å (relative visual intensity)]: 9.4 (s), 4.67 (s), 2.576 (m), 2.330 (m), and 2.041 (mw). The crystal structure study revealed tiberiobardiite to be trigonal, space group R 3 ¯ , with unit-cell parameters a = 10.6860(4), c = 28.3239(10) Å, V = 2801.0(2) Å3, and Z = 3. The crystal structure was refined to a final R1 = 0.060 for 1747 reflections with Fo > 4σ (Fo) and 99 refined parameters. Tiberiobardiite is the Si-analogue of chalcophyllite, with Si4+ replacing As5+ through the coupled substitution As5+ + O2− = Si4+ + (OH). The name tiberiobardiite honors Tiberio Bardi (b. 1960) for his contribution to the study of the mineralogy of Tuscany.

1. Introduction

The occurrences of small Cu ore deposits in the ophiolitic sequences of the Northern Apennines (Italy) have been known for a long time, and they represent one of the few Cu sources in Italy. Notwithstanding their past economic importance, little mineralogical and geological information has been provided about these deposits (e.g., [1,2,3,4]). These studies mainly focused on the primary ore mineralogy, whereas secondary assemblages were usually not taken into account. On the other hand, the potential occurrence of interesting mineral species was suggested by the identification of phosphates belonging to the mixite group (e.g., calciopetersite from Monte Beni, Firenzuola [5]).
The small Cu prospect of Cretaio (latitude 43°03′10″ N, longitude 10°58′40″ E), near the small village of Prata, Massa Marittima, Grosseto, Tuscany, Italy, is characterized by several alteration phases of the primary Cu-Fe ore minerals [6]. During the study of this mineral assemblage, a phase related to chalcophyllite was identified. Its unit-cell volume was significantly smaller than chalcophyllite (ΔV = −2.5%), thus indicating the likely occurrence of some chemical substitutions. Indeed, qualitative chemical analyses, as well as Raman spectroscopy, suggested the absence of As in the studied material, making a structural investigation mandatory to fully characterize the mineral. Quantitative chemical analysis and crystal structure refinement proved that the studied phase is the Si-analogue of chalcophyllite. This new mineral was named tiberiobardiite, in honor of the mineral collector Tiberio Bardi (b. 1960), for his contribution to the study of Tuscan mineralogy. Tiberio Bardi provided the type material of volaschioite [7] and promoted the mineralogical investigation of the ophiolite-hosted mineralization occurring in the Monte Beni area, north of Florence [8], where he collected the specimen of calciopetersite used for the crystal structure study [5]. Recently, together with other mineral collectors (Cristiano Bazzoni, Mauro Bernocchi, Cesare Betti, and Riccardo Marini), Tiberio Bardi contributed to the mineralogical rediscovery of the small Cu ore deposits of Cretaio, where he first collected the type material of tiberiobardiite. The mineral and its name have been approved by the IMA CNMNC, under the number 2016-096. The holotype specimen is deposited in the mineralogical collection of the Museo di Storia Naturale of the University of Pisa, Via Roma 79, Calci (Pisa), under the catalogue number 19900.
The occurrence, physical properties, and crystal structure of tiberiobardiite are described in this paper.

2. Geological Setting and Occurrence of Tiberiobardiite

No detailed geological studies have been performed on the small Cu ore deposit of Cretaio. The available data are limited to some mining reports dating to the early decades of the 20th century [6]. The ore deposit is represented by a small concentration of Cu sulfides (bornite, chalcocite, and covellite) and hematite, scattered as stockwork veins within highly deformed gabbro belonging to the Liguride units. Minor chalcopyrite has been observed only in quartz + calcite veins.
The primary sulfides are strongly altered into a series of secondary minerals: antlerite, brochantite, chalcanthite, chalcoalumite, connellite, langite, libethenite, malachite, posnjakite, serpierite/devilline, and spangolite. Tiberiobardiite was found associated with abundant brochantite. Its origin is likely related to the supergene alteration of the Cu ore minerals in an oxidizing and hydrous low-T environment. The individual elements were derived from Cu ores (Cu and S) and from rock-forming minerals occurring in the gabbro (Al, Si, and minor P).

3. Experimental Data

3.1. Mineral Description and Physical Properties

Tiberiobardiite (Figure 1) occurs as thin, tabular {0001} crystals, having a pseudo-hexagonal outline, up to 200 μm in diameter and 5 μm in thickness. The mineral is green, with a pale green streak; it is transparent, and its luster is vitreous. Tiberiobardiite is brittle, with a perfect {0001} cleavage. Its fracture is irregular. Its hardness and density, as well as optical properties, were not measured, owing to the small amount of available material. The calculated density, based on the ideal formula, is 2.528 g/cm3. The mean refractive index, obtained from the Gladstone-Dale relationship [9,10], using the ideal formula and the calculated density, is 1.568.

3.2. Chemical Data

Preliminary energy dispersive spectrometry (EDS) analysis showed the presence of Cu, Al, Fe, P, Si, and S as the only elements with Z > 8.
Quantitative chemical analyses were carried out using a Superprobe JEOL JXA 8200 electron microprobe operating in WDS mode at the Eugen F. Stumpfl laboratory, Leoben University, Austria. The experimental conditions were as follows: accelerating voltage 20 kV, beam current 10 nA, and beam size 3 μm. The standards were (element and emission line) as follows: chromite (Al Kα), chalcopyrite (S Kα, Cu Kα), zircon (Si Kα), pyrite (Fe Kα), skutterudite (As Lα), apatite (P Kα), and sphalerite (Zn Kα). The following diffracting crystals were selected: PETJ for S, Si, and P; TAP for Al and As; and LIFH for Fe, Cu, and Zn. Direct H2O determination was not performed, owing to the scarcity of the material. The occurrence of H2O, suggested by the crystal structure refinement, was further confirmed by micro-Raman spectroscopy (see below).
The collection of reliable chemical data for tiberiobardiite was a very difficult task, owing to the small size of the available crystals, which made the preparation of a good-quality polished surface difficult. Moreover, the mineral is unstable under the electron beam, showing evidence of strong dehydration. Indeed, the structural determination (see below) indicated the occurrence of 16 H2O, 13.5 cations (without H atoms), and ~14 OH groups, implying the occurrence of ~36.6 wt % H2O. It should be noted that by adding such an H2O content to the total given in Table 1, an unrealistically high total of ~126.9 wt % is obtained. Notwithstanding such an important limitation, the atomic ratios among cations are in good agreement with the results of the structural study.
On the basis of an idealized O content of 42 atoms per formula unit (apfu), to be compared with 42.2 found in the structural study (see below), assuming the occurrence of 16 H2O groups and 13.5 cations (without H), the empirical formula of tiberiobardiite is (Cu8.69Al0.21Fe0.10)Σ9.00Al1.00(Si1.51P0.54)Σ2.05S1.44O12.53(OH)13.47·16H2O, with rounding errors. The ideal formula is Cu9Al[SiO3(OH)]2(SO4)1.5(OH)12·16H2O, which corresponds to the following (in wt %): SO3 8.45, SiO2 8.45, Al2O3 3.59, CuO 50.36, and H2O 29.15, for a sum of 100.00.

3.3. Micro-Raman Spectroscopy

Unpolarized micro-Raman spectra were collected on an unpolished sample of tiberiobardiite in nearly backscattered geometry using a Jobin-Yvon Horiba XploRA Plus apparatus equipped with a motorized x-y stage and an Olympus BX41 microscope with a 50× objective. The 532 nm line of a solid-state laser was used. The minimum lateral and depth resolution was set to a few μm. The system was calibrated using the 520.6 cm−1 Raman band of silicon before each experimental session. The spectra were collected through multiple acquisitions with single counting times of 120 s. The backscattered radiation was analyzed with a 600 mm−1 grating monochromator.
Figure 2 shows the observed Raman spectrum of tiberiobardiite. The region between 100 and 1200 cm−1 (Figure 2a) can be divided into three ranges, as follows:
(i)
Range 100–300 cm−1: bands at 124, 203, and 261 cm−1, possibly related to lattice modes;
(ii)
Range 300–700 cm−1: bands at 394, 440, 487, 544, and 589 cm−1, related to the bending modes of the [SiO3(OH)] and (SO4) groups;
(iii)
Range 700–1200 cm−1: two bands at 965 and 1097 cm−1 occur. The former could be due to the contribution of the [SiO3(OH)] and (SO4) groups, whereas the weak band at 1097 cm−1 is likely related to the (SO4) antisymmetric stretching, in agreement with the band position in the Raman spectrum of chalcophyllite (1100 cm−1; [11]). A similar interpretation was proposed for the bands observed between 900 and 1150 cm−1 in barrotite [12]. It is worth noting the absence of the strong band at ~840 cm−1 occurring in the Raman spectrum of chalcophyllite, which was interpreted as being due to the (AsO4) symmetric stretching mode [11]. The same feature, at a slightly lower wavenumber (825 cm−1), was reported in barrotite [12].
In the region between 3000 and 4000 cm−1, a strong and broad band was observed (Figure 2b). Such a band is related to O–H stretching vibrations. The band deconvolution, performed using the software Fityk [13], revealed the presence of three bands, centered at 3218, 3418, and 3555 cm−1. By using the relationships between O–H stretching frequencies and O⋯O distances [14], the three Raman bands could correspond to three different kinds of hydrogen bonds (i.e., short (=strong) bonds (O⋯O ~2.70 Å), intermediate (O⋯O ~2.80 Å), and long (=weak) bonds (O⋯O ~3.00 Å)).

3.4. Crystallography

Powder X-ray diffraction data of tiberiobardiite were collected using a 114.6 mm Gandolfi camera and Ni-filtered Cu Kα radiation (Table 2). Unit-cell parameters were not refined from the X-ray powder diffraction pattern owing to the multiple indexing for most of the observed reflections.
A single-crystal X-ray diffraction study was performed using a Bruker Smart Breeze diffractometer equipped with an air-cooled CCD detector and graphite-monochromatized Mo Kα radiation. The detector-to-crystal working distance was 50 mm. Data were corrected for the Lorentz-polarization factor, absorption, and background effects, using the package of software Apex2 [16]. Unit-cell parameters of tiberiobardiite are a = 10.6860(4), c = 28.3239(10) Å, V = 2801.0(2) Å3, and space group R 3 ¯ , suggesting isotypic relationships between tiberiobardiite and chalcophyllite [17]. Consequently, the crystal structure of the former was refined using Shelxl-2014 [18] starting from the atomic coordinates of the latter. Scattering curves for neutral atoms were taken from the International Tables for Crystallography [19]. After several cycles of isotropic refinement, the R factor converged to 0.22, lowered to 0.16 after taking into account the twinning according to the {10-10} plane. In agreement with the chemical data, the site hosting As in chalcophyllite was found to be occupied by lighter atoms (i.e., Si and P). Its site occupancy was fixed based on electron microprobe data, owing to the similarity between the scattering factors of Si and P. In agreement with [17], the displacement parameters of the S atom and the O atoms belonging to the SO4 group (i.e., O6 and O7) were large. The refinement of the site occupancy at the S site pointed to S0.82(1), then fixed to 0.75 to achieve the electrostatic balance. The Ow8 site was found to be split into two sub-positions Ow8a and Ow8b. The latter was too close to Ow9, and consequently, the site occupancy at Ow9 was constrained to be the same as that at Ow8a in order to avoid the too short Ow9–Ow8b distance. Hydrogen atoms were not located. After several cycles of anisotropic refinement for all the atoms, the R1 converged to 0.0602 for the 1747 reflections with Fo > 4σ (Fo). Details of the data collection and refinement are given in Table 3. CIF is available as Supplementary Materials.
The crystal structure refinement of tiberiobardiite points to the crystal chemical formula Cu9(Al0.96Fe0.04)[(Si0.75P0.25)O3(OH0.75O0.25)]2(OH)12(H2O)6(SO4)1.5·10.2H2O (Z = 3).

4. Crystal Structure Description

4.1. General Features and Cation Coordinations

The atomic coordinates, site occupancies, and equivalent isotropic displacement parameters of tiberiobardiite are given in Table 4. Table 5 reports selected bond distances, whereas Table 6 shows the bond-valence balance.
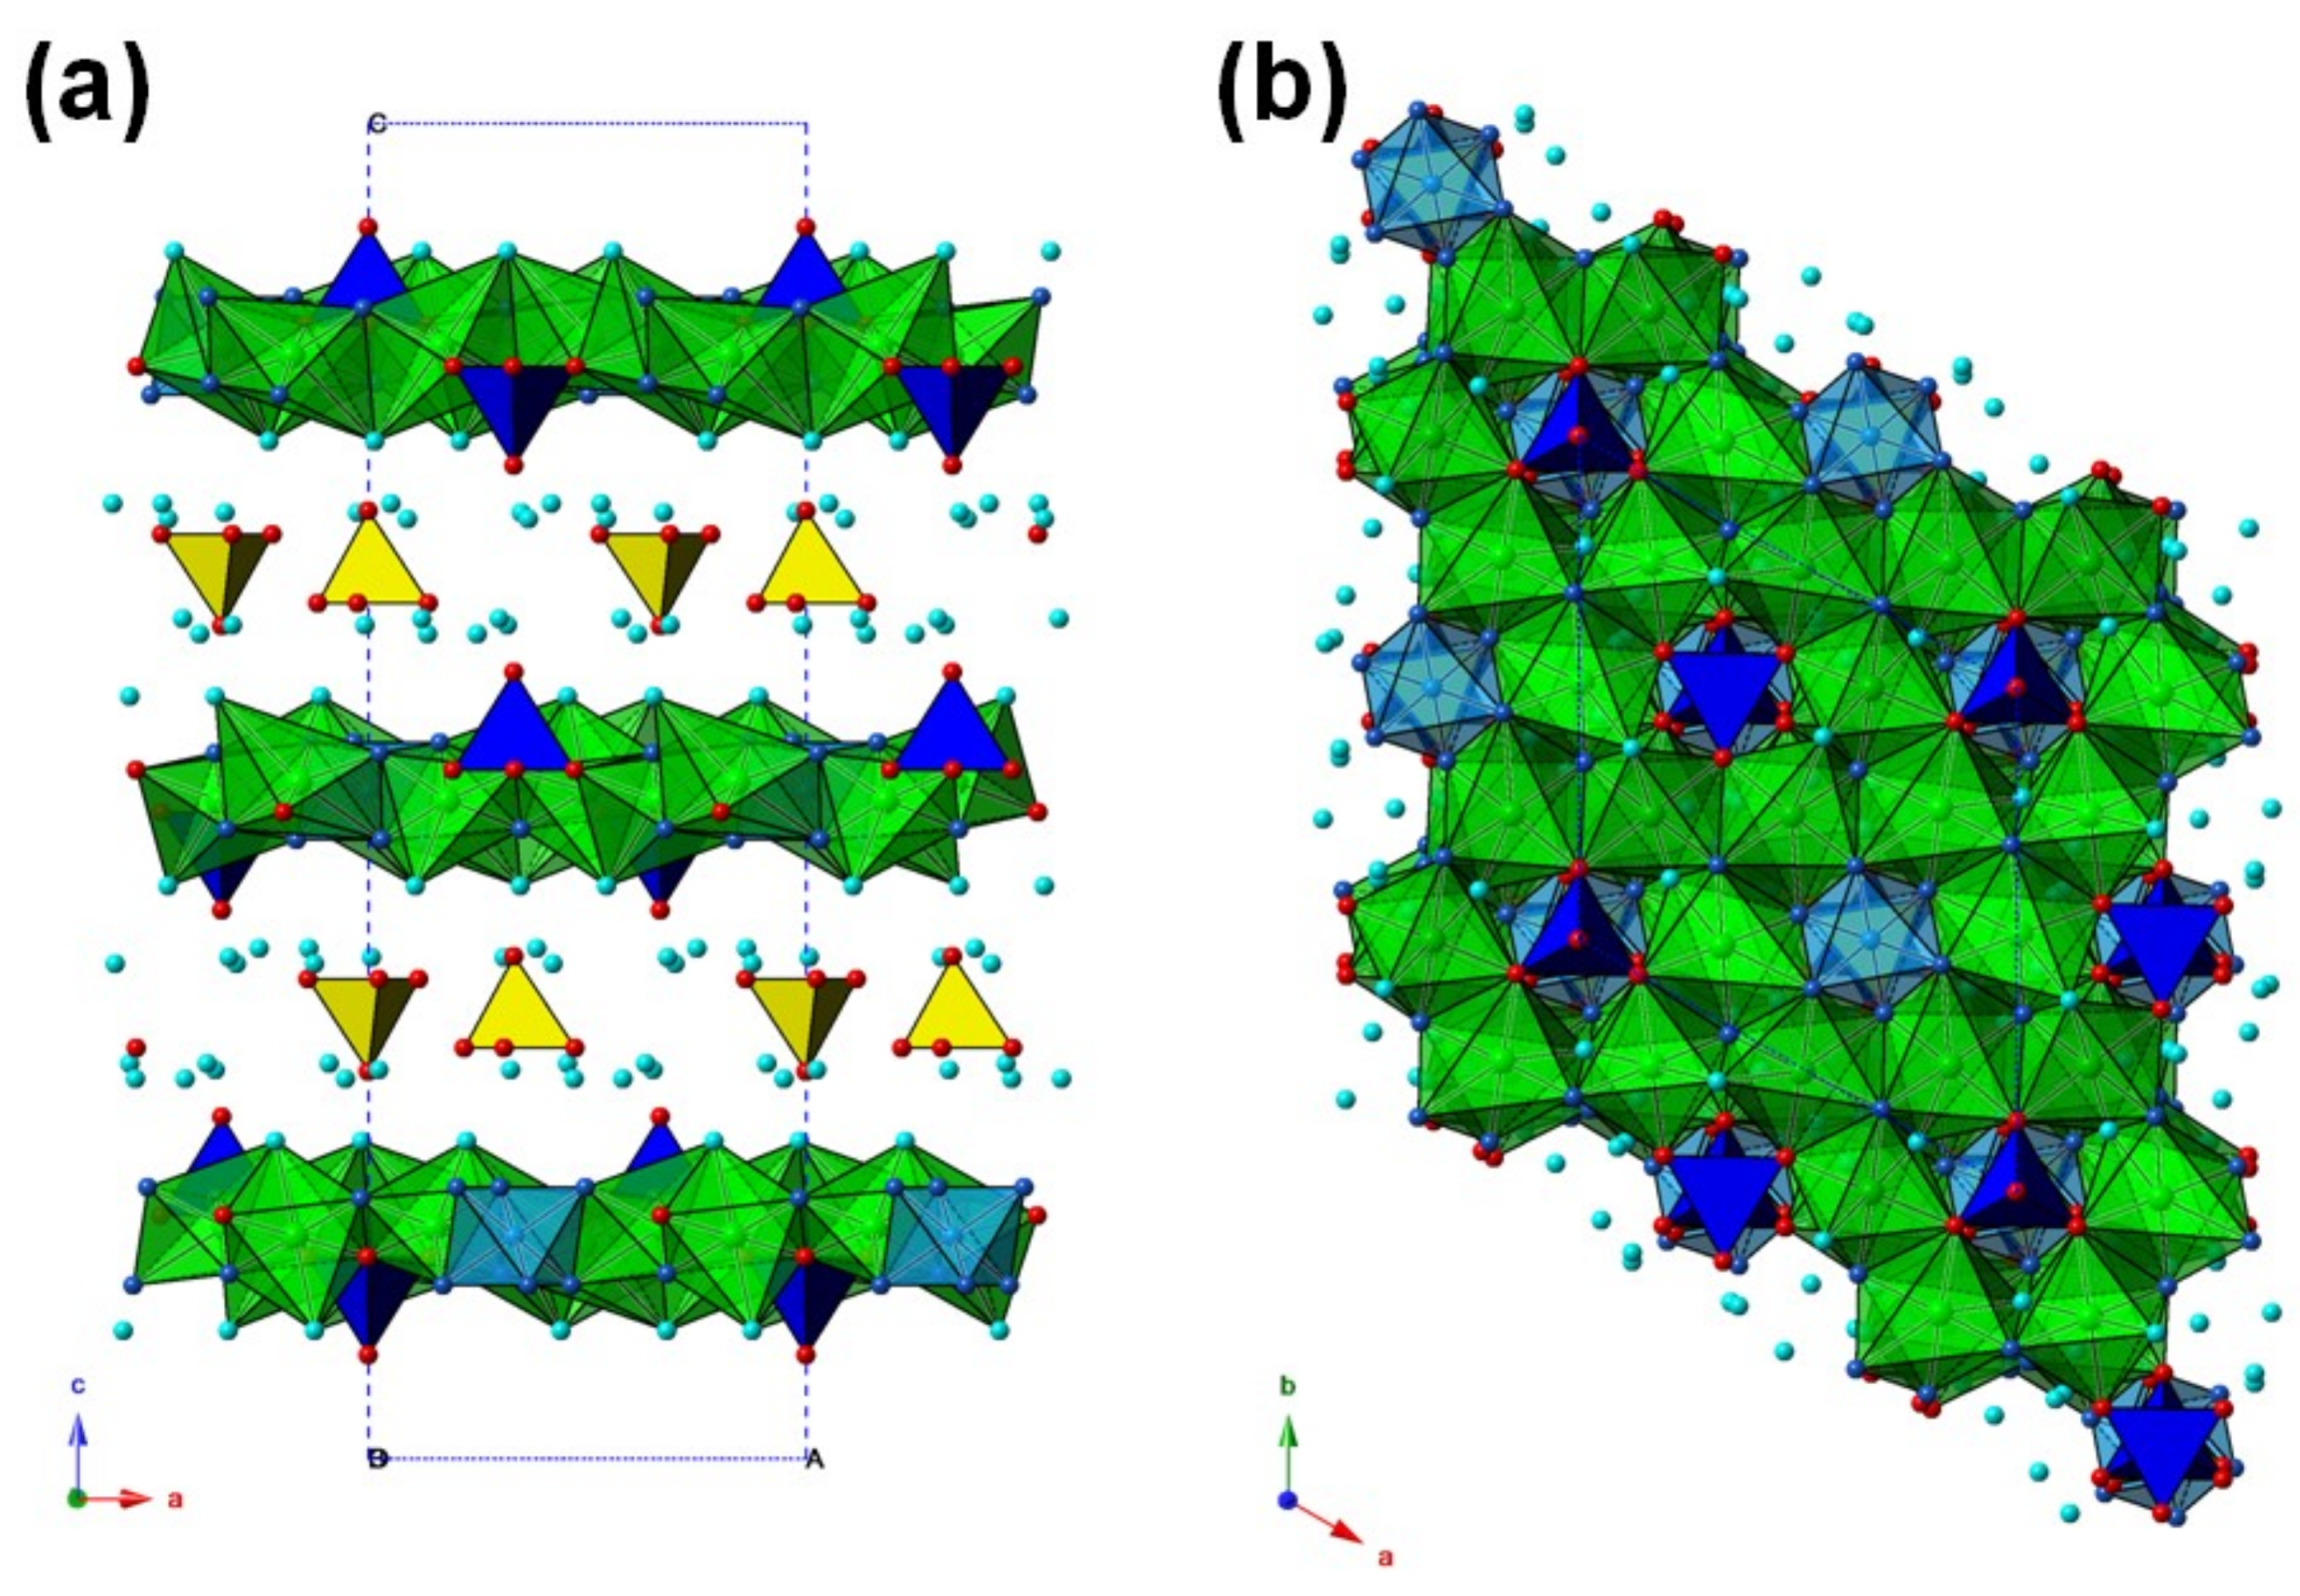
The crystal structure of tiberiobardiite (Figure 3) is composed by five independent cation positions (Cu1, Cu2, Al, Si, and S) and nine anion sites in the asymmetric unit. It can be described as formed by {0001} heteropolyhedral layers, composed by Cuφ6 polyhedra (φ = O, OH, H2O), Al(OH)6 octahedra, and (Si,P)O3(OH,O) tetrahedra, alternating with interlayers hosting SO4 and H2O groups. The {0001} heteropolyhedral layers are formed through the edge-sharing of Cu polyhedra, with three unoccupied octahedral positions out of 12 available ones per unit cell. Such unoccupied positions actually host Al, lying on the −3-point symmetry, and the Si site, on the 3-point symmetry, a little off the {0001} sheet. The Si-centered tetrahedra are alternatively disposed above and below the sheet.
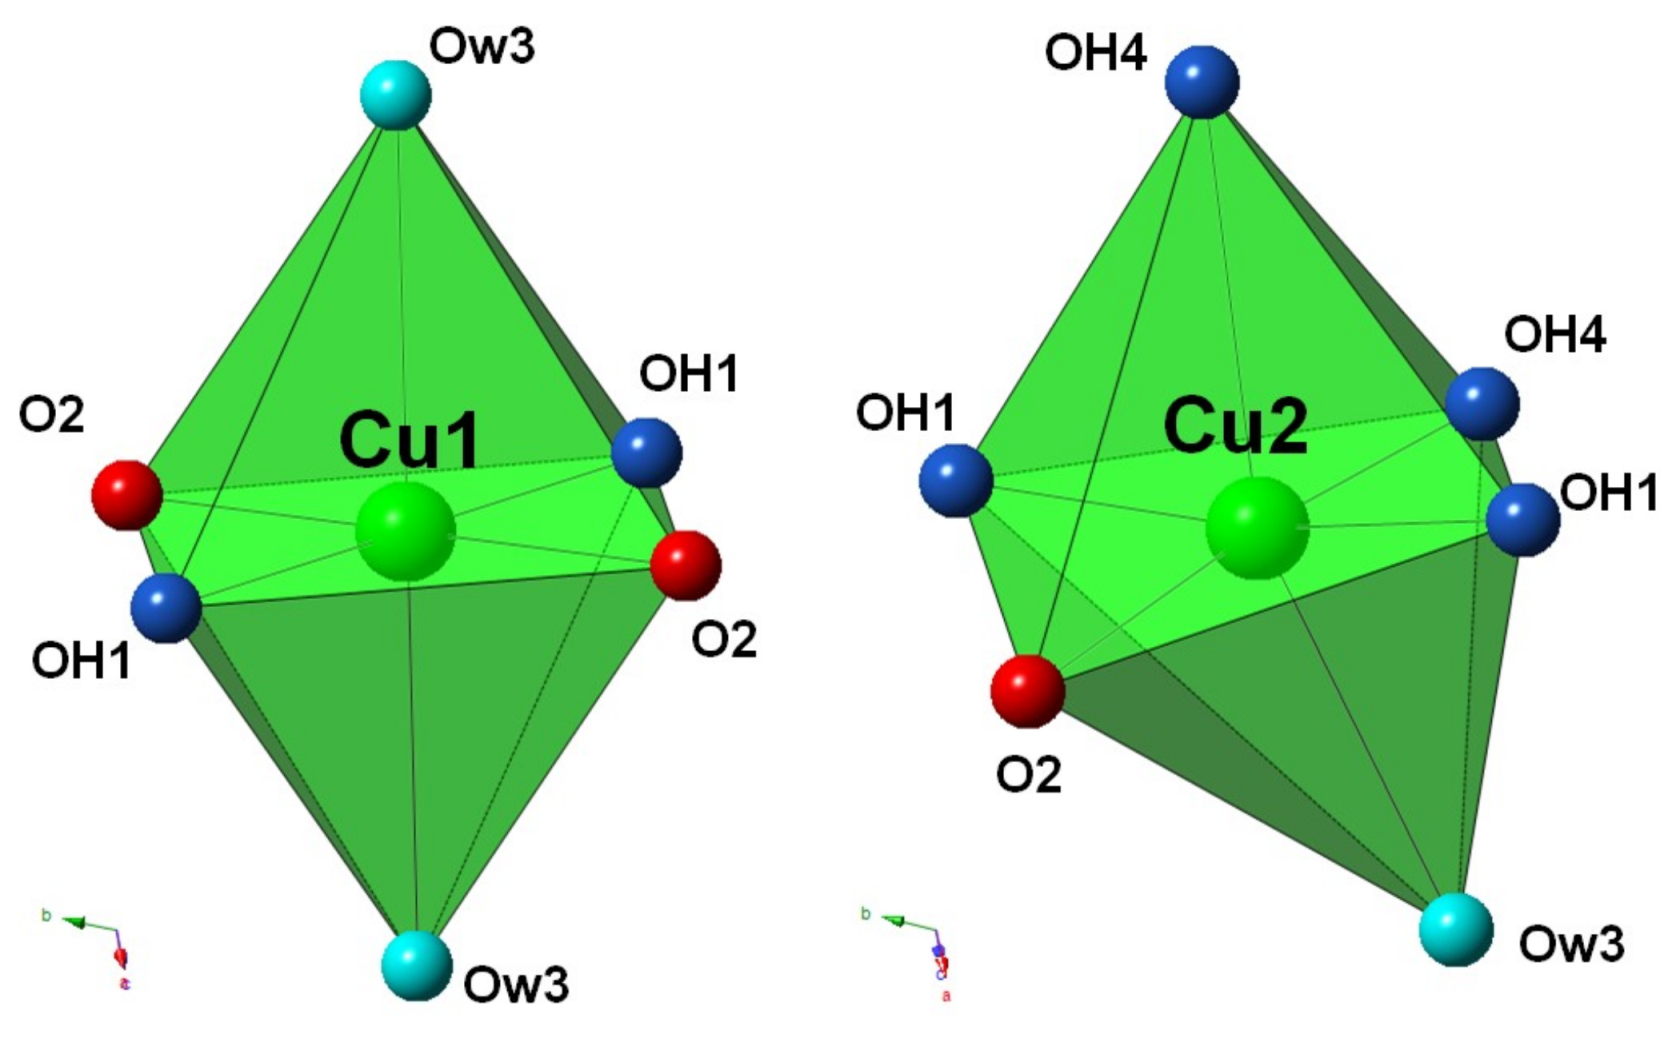
The two independent Cu sites (Cu1 and Cu2) display a six-fold coordination, showing the typical distorted (4 + 2) octahedral coordination related to the Jahn–Teller effect of Cu2+ (e.g., [20]). Considering the nature of the ligands φ, two different kinds of polyhedra occur (i.e., Cu1O2(OH)2(H2O)2 and Cu2O(OH)4(H2O) (Figure 4)), in agreement with the structure of chalcophyllite [17]. The average of the four shorter Cu–φ distances, corresponding to the equatorial bonds, is 1.962 and 1.968 Å for the Cu1 and Cu2 sites, respectively, in agreement with previous studies [21]. The axial bonds are definitely longer, ranging between 2.48 and 2.54 Å. The bond-valence sums (BVS) at the Cu1 and Cu2 sites are 2.10 and 2.05 valence units (v.u.), respectively (Table 6).
Aluminum is hosted in a regular octahedron, connected with the Cu polyhedra through edge-sharing, and is coordinated by OH groups only. In agreement with the chemical data, aluminum is partially replaced by minor Fe3+. The bond-valence sum is in good accord with the theoretical value (i.e., 3.06 v.u.).
The Si-centered tetrahedra are connected through corner-sharing to the (Cu–Al)-polyhedra {0001} sheets. The fourth oxygen atom (OH5) points to the interlayer and is involved in the hydrogen bond system characterizing tiberiobardiite. The average bond distance at the Si site, 1.578 Å, agrees with a mixed (Si and P) occupancy, as suggested by the chemical data. Owing to the similar scattering factors of Si and P, the site occupancy was fixed to (Si0.75P0.25), in accord with electron microprobe data. The corresponding BVS is 4.47 v.u., slightly higher than the calculated value of 4.25 v.u. based on site occupancy.
The {0001} sheet has the simplified chemical composition {Cu9Al[(Si0.75P0.25)O3(OH0.75O0.25)]2(OH)12(H2O)6}3+.
Successive sheets are separated by interlayers hosting SO4 and H2O groups. The S site is statistically occupied by S atoms, with a site occupancy fixed, based on the chemical data, to 0.75. Similarly, the site occupancy at the O6 and O7 sites, bonded to S, were fixed to the same value. The average <S–O> distance is 1.464 Å, in agreement with the average <S–O> distance in sulfate minerals (i.e., 1.473 Å) [23]. In addition to the SO4 group, the interlayer is completed by two H2O groups, hosted at the Ow9 and the split Ow8a/b positions. In order to avoid too short O⋯O distances, Ow9 and Ow8b cannot be fully occupied simultaneously. These sites are only partially occupied, with Ow8a and Ow9 having the same site occupancy (0.70), whereas Ow8b has a lower occupancy (0.30). The chemical formula of the interlayer is [(SO4)1.5·10H2O]3−.

4.2. The Hydrogen Bond System in Tiberiobardiite

The nine anion positions can be divided, based on their BVS (Table 6), in O2−, OH, and H2O-hosting sites. 
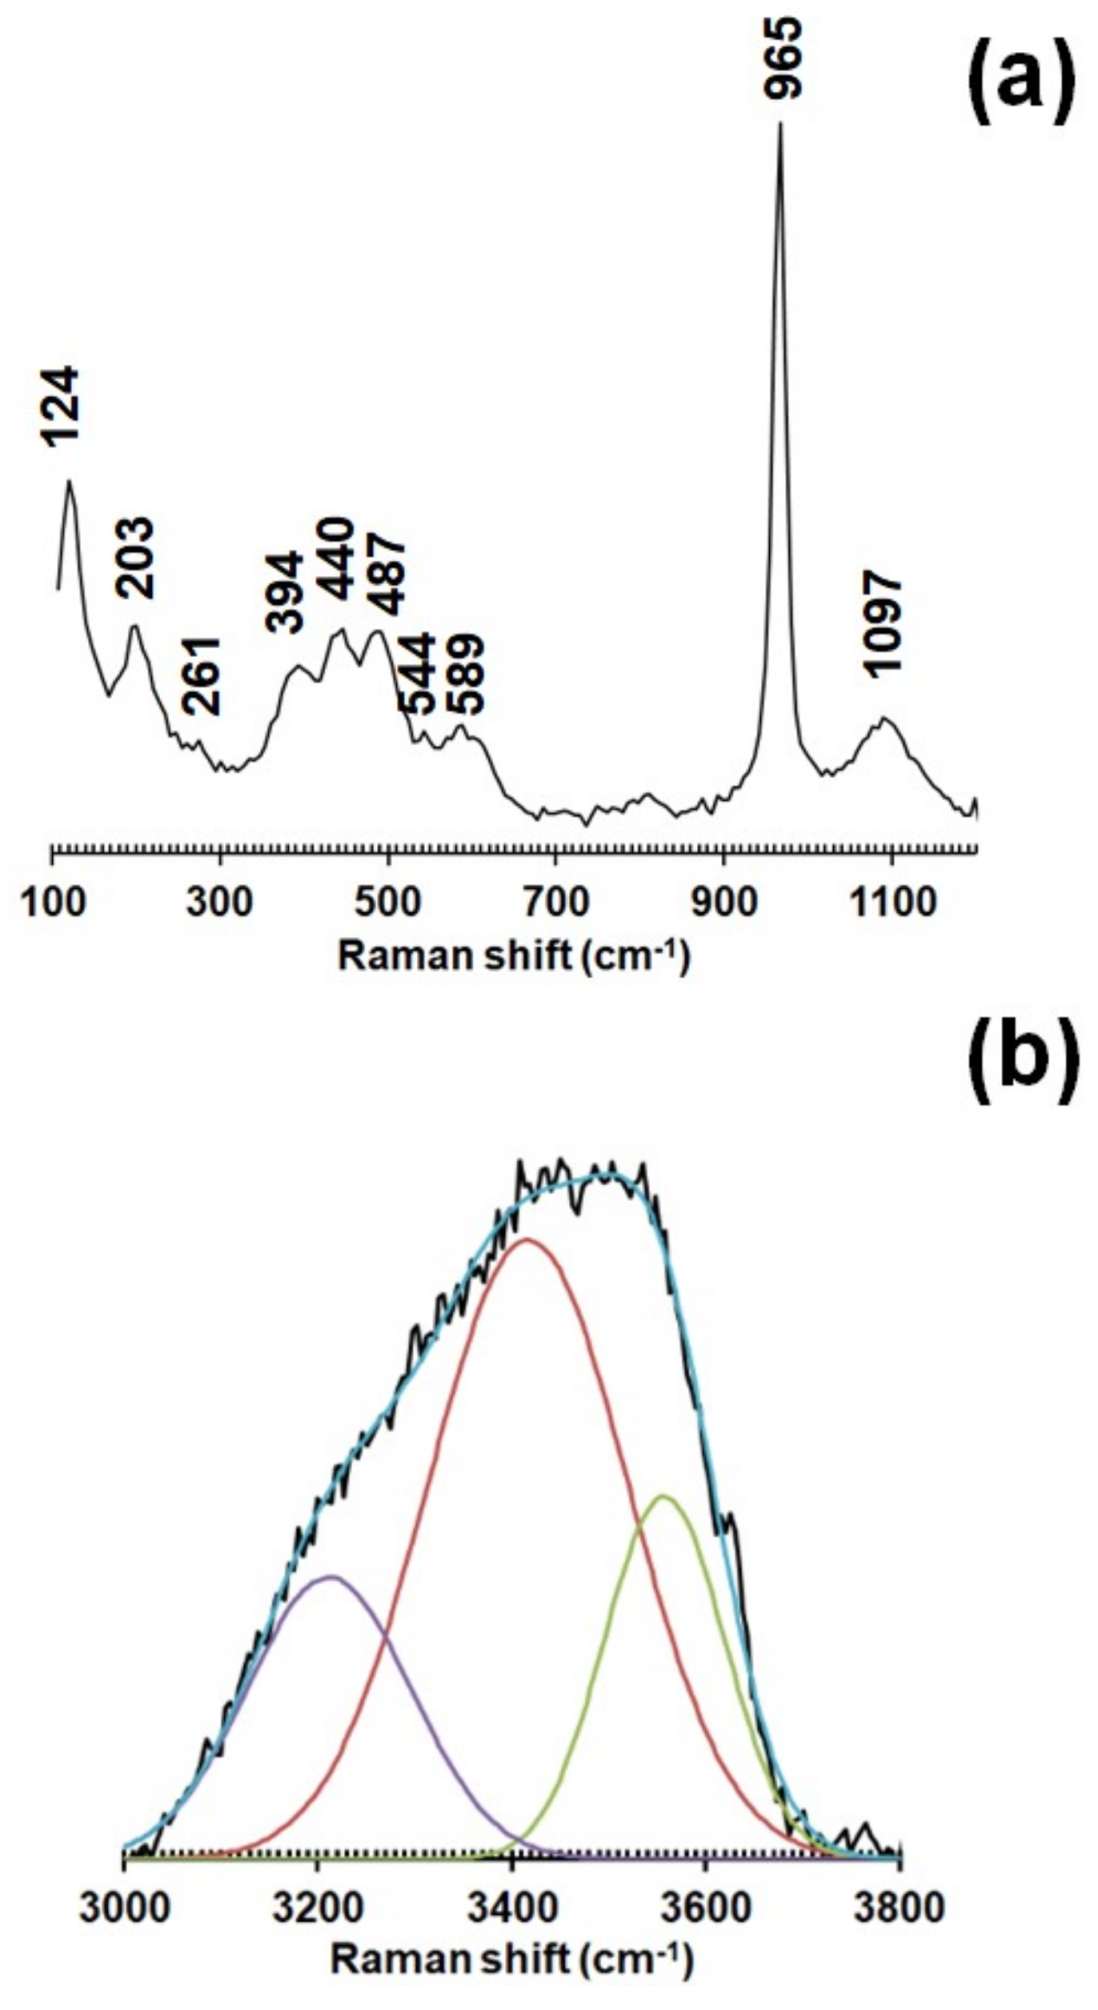
Table 7 reports the observed O⋯O distances shorter than 3 Å; their values agree with those calculated from the O–H stretching frequencies measured through Raman spectroscopy. Coupling this information with the occurrence of several underbonded anion positions, the important role played by the hydrogen bonds in tiberiobardiite can be hypothesized.
The hydrogen bond scheme is well-defined as regards the anion forming the {0001} heteropolyhedral layers, whereas it is more difficult to be described for interlayer H2O groups.
The heteropolyhedral layer is composed by anion sites OH1 to OH5. The valence sum at O2 (2.02 v.u.) agrees with its occupancy by O2−, whereas Ow3 (0.22 v.u.) is consistent with a H2O group. OH1 is a donor of an H-bond to Ow8a/Ow8b (at 2.74/2.72 Å), and OH4 is a donor to O7 (at 2.96 Å); the BVS at OH1 and OH4, after correction for the H-bond in agreement with [24], are 1.15/1.14 and 0.98 v.u., respectively. This bond scheme is analogous to that observed in chalcophyllite [17]. On the contrary, whereas O5 is an acceptor of three H-bonds from Ow9 in chalcophyllite [17], the mixed (OH, O) nature of OH5 in tiberiobardiite, related to the Si4+ + OH = P5+ + O2− substitution, requires a different H-bond pattern. Different configurations are possible, considering the possible occurrences of Ow8b and Ow9. Taking into account the site occupancy of these two sites (i.e., 0.70 Ow9 and 0.30 Ow8b, close to 2/3 Ow9 and 1/3 Ow8b), a model with OH5 bonded to two Ow9 and one Ow8b could be proposed. On the basis of the Si–P atomic ratio, an (OH)0.75O0.25 occupancy at OH5 should occur, corresponding to an expected weighted BVS of 1.25 v.u. It is likely that Ow9 and Ow8b could be donors of the H-bond, whereas the second Ow9 could accept an H-bond from OH5. Accordingly, the BVS at OH5 would be 1.31 v.u., consistent with the proposed site occupancy.
In the interlayer, the BVS values are in accord with the H2O groups at the Ow8a/Ow8b and Ow9 sites (0 v.u.), consistent with their role as interlayer H2O groups. The oxygen atoms belonging to the SO4 group are significantly underbonded (1.55 and 1.53 v.u. at the O6 and O7 sites, respectively) and they are acceptors of H-bonds. O6 is an acceptor of H-bonds from three symmetry-related H2O groups hosted at the Ow3 site, achieving a BVS of 2.12 v.u. Oxygen at the O7 site is involved in a more complicated H-bond system than that shown in chalcophyllite, where this site is H-bonded to Ow8 (at 2.66 Å), Ow9 (at 2.88 Å), and OH4 (at a longer distance of 3.03 Å) [17]. Indeed, the split nature of Ow8 and the partial occupancy of the H2O-hosting sites allowed different configurations. Taking into account O⋯O distances as well as O⋯H2O⋯O angles, a hypothetical model around O7 in tiberiobardiite can be proposed. This site could be H-bonded with Ow8a (at 2.73 Å) and Ow9 (at 2.84 Å), as in chalcophyllite, with an additional bond with OH4 (at 2.96 Å). The O7⋯Ow8a distance of 2.96 Å could not likely represent a hydrogen bond, because the O7⋯Ow8a⋯Ow9 would be ~133°, to be compared with two possible O7⋯Ow8a⋯Ow9 configurations (bifurcated H-bond, as in chalcophyllite [17]) showing angles of ~109° and 102°, respectively, closer to the average value of 108.3° observed in crystalline hydrates [25]. In such a way, the BVS at O7 would be 2.05 v.u.
In agreement with [17], when the SO4 group is absent, additional H2O groups could occur at the O sites. Consequently, it could be difficult to propose a reliable H-bond system involving the Ow8a/Ow8b and Ow9 sites, that could show variable H-bond patterns. As a matter of fact, hydrogen bonds are fundamental in bonding successive {0001} heteropolyhedral layers and in “trapping” the SO4 groups in the interlayers.

5. Discussion

5.1. Relationships with Chalcophyllite

Tiberiobardiite is the Si-analogue of chalcophyllite, with Si4+ replacing As5+ through the coupled substitution As5+ + O2− = Si4+ + OH. These two minerals form the chalcophyllite group (Table 8), in agreement with [26]. The occurrence of P5+ partially replacing Si4+ allows us to also hypothesize the existence of the P-analogue, ideally [Cu9Al(PO4)2(OH)12(H2O)6](SO4)1.5·10–12H2O.
These species are related to barrotite, {Cu9Al[SiO3(OH)]2(OH)12(H2O)6}{(SO4)[AsO3(OH)]0.5}·2H2O. In fact, the crystal structure of barrotite was not solved, and consequently, the actual relationships with the chalcophyllite group minerals are unknown. Indeed, As could be hosted in an independent tetrahedral site, or it could partially replace (SO4) groups in the interlayer, through the substitution (SO4)2− = [AsO3(OH)]2−. In this latter case, the ideal formula of barrotite could be the same as that of tiberiobardiite, from which it differs in the lower hydration state and the shorter c axis (Table 8).

5.2. Secondary Cu2+ Oxysalt Minerals in Ophiolite-Hosted Ore Deposits from Tuscany (Italy)

The secondary mineral assemblages associated with ophiolite-hosted ore deposits from Tuscany (Italy) have received little attention by mineralogists, and very few data are currently available (Table 9). In addition to the widespread occurrence of the copper carbonates azurite and malachite, known since the 19th century (e.g., [27]), several common sulfates have been identified in the last thirty years (i.e., brochantite, chalcanthite, langite, posnjakite, and serpierite) (e.g., [28,29]). The study of the mineral association occurring in the small Cretaio prospect allowed to increase the knowledge of these phases, with further description of antlerite, some Cu–Al sulfates (chalcoalumite, cyanotrichite, and spangolite), and a mineral belonging to the devilline group [6]. Spangolite is characterized by the occurrence of the Cl anion, as well as the two Cu halides clinoatacamite and connellite; the latter was identified from the same occurrence of spangolite at Cretaio and in close association with clinoatacamite, cuprite, and native copper also from the Montecastelli Cu deposit, along the Pavone River valley (e.g., [30]).
It is worth noting the occurrence of some copper phosphates in the ophiolite-hosted deposits (i.e., calciopetersite and libethenite from Monte Beni [5] and Cretaio [6]). Moreover, a still unidentified member of the mixite group has been recently identified in the mineral assemblages from Cretaio. Likely, phosphorus could be derived from the interaction between the acid solutions derived from sulfide weathering and apatite, occurring as accessory minerals in the host rocks. Phosphorus is enriched also in tiberiobardiite, and the potential occurrence of the P-analogue of tiberiobardiite and chalcophyllite could be likely found in the phosphate-rich assemblages from ophiolite-hosted deposits.

Supplementary Materials

The following are available online at https://www.mdpi.com/2075-163X/8/4/152/s1, CIF: tiberiobardiite.

Acknowledgments

Tiberio Bardi is acknowledged for providing us with the studied material. We wish to thank also the mineral collectors Cristiano Bazzoni, Mauro Bernocchi, Cesare Betti, and Riccardo Marini for providing us with studied material from the Cretaio prospect. The comments of six anonymous reviewers helped us improve the paper.

Author Contributions

C.B. conceived of and designed the experiments; C.B. performed the diffraction experiments; C.B. and M.P. analyzed the data; F.Z. performed the chemical analysis; and C.B. wrote the paper.

Conflicts of Interest

The authors declare no conflict of interest.

References

  1. Bertolani, M. I giacimenti cupriferi nelle ofioliti di Sestri Levante. Per Miner. 1952, 21, 149–170. [Google Scholar]
  2. Bertolani, M.; Rivalenti, G. Le mineralizzazioni metallifere della miniera di Montecatini in Val di Cecina (Pisa). Boll. Soc. Geol. Ital. 1973, 92, 635–648. [Google Scholar]
  3. Zaccarini, F.; Garuti, G. Mineralogy and chemical composition of VMS deposits of northern Apennine ophiolites, Italy: Evidence for the influence of country rock type on ore composition. Miner. Petrol. 2008, 94, 61–83. [Google Scholar] [CrossRef]
  4. Garuti, G.; Bartoli, O.; Scacchetti, M.; Zaccarini, F. Geological setting and structural styles of Volcanic Massive Sulfide deposits in the northern Apennines (Italy): Evidence for seafloor and sub-seafloor hydrothermal activity in unconventional ophiolites of the Mesozoic Tethys. Boletín de la Sociedad Geológica Mexicana 2008, 60, 121–145. [Google Scholar] [CrossRef]
  5. Biagioni, C.; Bonaccorsi, E.; Orlandi, P. Occurrence and crystal structure of calciopetersite from Monte Beni (Firenzuola, Florence, Tuscany, Italy). Atti della Società Toscana de Scienze Naturali 2011, 116, 17–22. [Google Scholar]
  6. Bardi, T.; Bazzoni, C.; Bernocchi, M.; Betti, C.; Biagioni, C.; D’Orazio, M.; Pagani, G. Cretaio. La vecchia ricerca cuprifera presso Prata, Massa Marittima (GR). Riviera Miner. Ital. 2017, 51, 104–118. [Google Scholar]
  7. Biagioni, C.; Bonaccorsi, E.; Orlandi, P. Volaschioite, Fe3+4(SO4)O2(OH)6·2H2O, a new mineral from Fornovolasco, Apuan Alps, Tuscany (Italy). Can. Miner. 2011, 49, 605–614. [Google Scholar] [CrossRef]
  8. Bardi, T.; Becucci, A.; Biagioni, C. Monte Beni. I minerali dell’ex cava Fantoni (Pietramala, Firenzuola, Firenze). Micro 2012, 10, 98–109. [Google Scholar]
  9. Mandarino, J.A. The Gladstone-Dale relationship. Part III. Some general applications. Can. Miner. 1979, 17, 71–76. [Google Scholar]
  10. Mandarino, J.A. The Gladstone-Dale relationship. Part IV. The compatibility concept and its application. Can. Miner. 1981, 19, 441–450. [Google Scholar]
  11. Frost, R.L.; Palmer, S.J.; Keeffe, E.C. Raman spectroscopic study of the hydroxyl-arsenate-sulfate mineral chalcophyllite Cu18Al2(AsO4)4(SO4)3(OH)24·36H2O. J. Raman Spectrosc. 2010, 41, 1769–1774. [Google Scholar] [CrossRef]
  12. Sarp, H.; Černý, R.; Pushcharovsky, D.Y.; Schouwink, P.; Teyssier, J.; Williams, P.A.; Babalik, H.; Mari, G. La barrotite, Cu9Al(HSiO4)2[(SO4)(HAsO4)0.5](OH)12·8H2O, un noveau mineral de la mine de Roua (Alpes-Maritimes, Frances). Riviera Sci. 2014, 98, 3–22. [Google Scholar]
  13. Wojdyr, M. Fityk: A general-purpose peak fitting program. J. Appl. Crystallogr. 2010, 43, 1126–1128. [Google Scholar] [CrossRef]
  14. Libowitzky, E. Correlation of O–H stretching frequencies and O–H⋯O hydrogen bond lengths in minerals. Mon. Chem. 1999, 130, 1047–1059. [Google Scholar]
  15. Kraus, W.; Nolze, G. PowderCell—A program for the representation and manipulation of crystal structures and calculation of the resulting X-ray powder patterns. J. Appl. Crystallogr. 1996, 29, 301–303. [Google Scholar] [CrossRef]
  16. Bruker AXS Inc. Apex 2. In Bruker Advanced X-ray Solutions; Bruker AXS Inc.: Madison, WI, USA, 2004. [Google Scholar]
  17. Sabelli, C. The crystal structure of chalcophyllite. Z. Kristallogr. 1980, 151, 129–140. [Google Scholar]
  18. Sheldrick, G.M. Crystal structure refinement with SHELXL. Acta Crystallogr. 2015, C71, 3–8. [Google Scholar]
  19. Wilson, A.J.C. (Ed.) International Tables for Crystallography. In Mathematical, Physical and Chemical Tables; Kluwer Academic: Dordrecht, The Netherlands, 1992. [Google Scholar]
  20. Burns, P.C.; Hawthorne, F.C. Static and dynamic Jahn-Teller effects in Cu2+ oxysalt minerals. Can. Miner. 1996, 34, 1089–1105. [Google Scholar]
  21. Eby, R.K.; Hawthorne, F.C. Structural relations in copper oxysalt minerals. I. Structural hierarchy. Acta Crystallogr. 1993, B49, 28–56. [Google Scholar] [CrossRef]
  22. Brese, N.E.; O’Keeffe, M. Bond-valence parameters for solids. Acta Crystallogr. 1991, B47, 192–197. [Google Scholar] [CrossRef]
  23. Hawthorne, F.C.; Krivovichev, S.V.; Burns, P.C. The crystal chemistry of sulfate minerals. Rev. Miner. Geochem. 2000, 40, 1–101. [Google Scholar] [CrossRef]
  24. Ferraris, G.; Ivaldi, G. Bond valence vs bond length in O⋯O hydrogen bonds. Acta Crystallogr. 1988, B44, 341–344. [Google Scholar] [CrossRef]
  25. Chiari, G.; Ferraris, G. The water molecule in crystalline hydrates studied by neutron diffraction. Acta Crystallogr. 1982, B38, 2331–2341. [Google Scholar] [CrossRef]
  26. Mills, S.J.; Hatert, F.; Nickel, E.H.; Ferraris, G. The standardisation of mineral group hierarchies: Application to recent nomenclature proposals. Eur. J. Miner. 2009, 21, 1073–1080. [Google Scholar] [CrossRef]
  27. D’Achiardi, A. Mineralogia Della Toscana; Forni: Pisa, Italy, 1872. [Google Scholar]
  28. Capperi, M.; Bazzoni, C. Impruneta (FI). Nuovi ritrovamenti. Riviera Miner. Ital. 1996, 20, 331–333. [Google Scholar]
  29. Betti, C.; Bazzoni, C.; Bernocchi, M.; Pagani, G.; Ciriotti, M.E.; Bittarello, E.; Batoni, M.; Batacchi, C. Poggio del Cornocchio (Firenze–Pisa–Siena): Storia, miniere e minerali di una zona poco conosciuta. Micro 2017, 15, 2–43. [Google Scholar]
  30. Dini, A.; Boschi, C. I giacimenti cupriferi delle ofioliti toscane. Geologia e ipotesi genetiche. Riviera Miner. Ital. 2017, 51, 84–101. [Google Scholar]
Figure 1. Tiberiobardiite, thin, pseudo-hexagonal crystals, up to 40 μm in size, with iron oxides. Cretaio, Prata, Massa Marittima, Grosseto, Tuscany. Holotype specimen, #19900, collection of the Museo di Storia Naturale of the University of Pisa.
Minerals 08 00152 g001
Figure 2. Micro-Raman spectrum of tiberiobardiite in the spectral range 100–1200 cm−1 (a) and 3000–4000 cm−1 (b). In (b), the components contributing to the broad band are shown.
Minerals 08 00152 g002
Figure 3. Projection of the crystal structure of tiberiobardiite viewed down b (a) and c (b). Polyhedra: green = Cu1 and Cu2 sites; light blue = Al site; blue = Si site; and yellow = S site. Circles: light blue = H2O groups; blue = OH; and red = O.
Minerals 08 00152 g003
Figure 4. Bonding environment of Cu sites in tiberiobardiite.
Minerals 08 00152 g004
Table 1. Chemical data of tiberiobardiite.
Oxidewt % (n = 5)Rangee.s.d.
SO310.379.67–10.940.51
P2O53.413.02–3.800.28
As2O50.050.00–0.170.07
SiO28.137.29–9.030.77
Al2O35.544.93–6.470.57
Fe2O30.740.61–0.830.09
CuO62.0557.44–65.203.06
ZnO0.030.00–0.100.04
Total90.3284.86–93.703.35
Table 2. Observed and calculated X-ray powder diffraction data (d in Å) for tiberiobardiite.
IobsdobsIcalcdcalch k lIobsdobsIcalcdcalch k l
s9.41009.360 0 3--22.6461 2 −7
--45.621 0 4m2.57622.5712 2 3
--25.341 1 0132.5712 2 −3
--24.831 0 −5m2.330102.3252 2 −6
s4.67274.720 0 652.3252 2 6
44.651 1 3mw2.04172.0372 2 −9
54.651 1 −312.0372 2 9
--33.8732 0 −4vw1.85921.8542 0 14
--63.5842 0 5vw1.77621.7692 2 12
--53.1470 0 931.7692 2 −12
--13.1362 1 4w1.54841.5426 0 0
--13.0853 0 011.5422 2 −15
--22.9761 2 5w1.52821.5226 0 3
--22.9323 0 −321.5226 0 −3
vw2.7332.7121 1 −9w1.46921.4666 0 6
--22.7081 0 1021.4666 0 −6
w2.68132.6722 2 0
Note: intensity and dhkl were calculated using the software PowderCell 2.3 [15] based on the structural model given in Table 4. Only reflections with Icalc >1 are listed, if not observed. The five strongest reflections are given in bold. Observed intensities were visually estimated (s = strong; m = medium; mw = medium-weak; w = weak; vw = very weak).
Table 3. Crystal and experimental details for tiberiobardiite.
Crystal data
Crystal size (mm)0.180 × 0.050 × 0.005
Cell setting, space groupTrigonal, R 3 ¯
a, c (Å)10.6860(4), 28.3239(10)
V3)2801.0(2)
Z3
Data collection and refinement
Radiation, wavelength (Å)Mo Kα, λ = 0.71073
Temperature (K)293
max (°)58.35
Measured reflections18,912
Unique reflections2809
Reflections with Fo > 4σ (Fo)1747
Rint0.0633
Rσ0.0799
Range of h, k, l−10 ≤ h ≤ 14, −14 ≤ k ≤ 13, −38 ≤ l ≤ 37
R [Fo > 4σ (Fo)]0.0602
R (all data)0.1167
wR (on F2)0.1354
GooF1.044
Number of least-square parameters99
Maximun and minimum residuals (e3)1.26 (at 0.98 from Si), −1.10 (at 0.65 from Cu2)
Table 4. Site labels, Wyckoff sites, site occupancy factor (s.o.f.), atom coordinates, and equivalent isotropic displacement parameters (Å2) for tiberiobardiite.
SiteWyckoff Sites.o.f.x/ay/bz/cUeq
Cu19dCu1.001/21/21/20.0196(3)
Cu218fCu1.000.33920(8)0.18074(7)0.50669(3)0.0172(2)
Al3bAl0.96Fe0.04001/20.0094(12)
Si6cSi0.75P0.252/31/30.46619(10)0.0145(6)
S6cS0.751/32/30.32465(14)0.0348(10)
OH118fO1.000.3223(4)0.3489(4)0.52847(15)0.0153(9)
O218fO1.000.5279(4)0.3353(4)0.48438(15)0.0213(10)
Ow318fO1.000.3482(6)0.4550(5)0.42895(18)0.0507(15)
OH418fO1.000.1312(4)0.1635(4)0.46337(14)0.0152(10)
OH56cO1.002/31/30.4107(3)0.037(2)
O66cO0.751/32/30.3764(3)0.030(2)
O718fO0.750.2174(9)0.5274(9)0.3075(3)0.059(2)
Ow8a18fO0.70(1)0.3180(10)0.3109(11)0.6244(4)0.080(3)
Ow8b18fO0.30(1)0.249(3)0.381(3)0.6179(8)0.080(3)
Ow918fO0.70(2)0.4200(12)0.2991(14)0.3709(4)0.103(4)
Table 5. Selected bond distances (in Å) in tiberiobardiite.
Cu1–OH11.948(4) × 2Cu2–OH41.944(4)Si–OH51.571(9)
–O21.977(4) × 2 –O21.965(4) –O21.580(4) × 3
–Ow32.476(5) × 2 –OH11.972(4)
–OH11.991(4)S–O71.463(8) × 3
Al–OH41.909(4) × 6 –OH42.464(4) –O61.466(10)
–Ow32.541(6)
Table 6. Bond-valence sums (in valence units (v.u.)) in tiberiobardiite.
SiteCu1Cu2AlSiSΣanions
OH10.48×20.45
0.43
1.36
O20.45×20.46 1.11×3 2.02
Ow30.12×20.10 0.22
OH4 0.49
0.12
0.51×6 1.12
OH5 1.14 1.14
O6 1.551.55
O7 1.53×31.53
Ow8a -
Ow8b -
Ow9 -
Σcations2.102.053.064.476.14 *
Note: bond parameters after [22]. In mixed or partially occupied sites, the bond-valence sum has been calculated taking into account the site occupancy. Right superscripts indicate the number of bonds for each cation. * Assuming full-occupancy at the S site.
Table 7. O⋯O distances (in Å) and corresponding bond strengths (in v.u.) in tiberiobardiite, calculated according to [24].
O⋯Od (Å)v.u.
OH1 ⋯ Ow8a2.745(11)0.21
OH1 ⋯ Ow8b2.72(2)0.22
Ow3 ⋯ O62.778(7)0.19
Ow3 ⋯ Ow92.711(13)0.22
OH4 ⋯ O72.960(8)0.14
OH5 ⋯ Ow8b2.83(3)0.17
OH5 ⋯ Ow92.718(11)0.22
Ow8a ⋯ O72.727(13)0.21
Ow8a ⋯ O72.958(13)0.14
Ow8b ⋯ O72.95(3)0.14
Ow9 ⋯ O72.835(13)0.17
Ow8a ⋯ Ow92.632(14)0.27
Ow8a ⋯ Ow92.876(16)0.16
Ow8b ⋯ Ow92.69(2)0.23
Table 8. Members of the chalcophyllite group and related minerals.
MineralChemical Formulaa (Å)c (Å)V3)Ref.
Chalcophyllite group
Chalcophyllite[Cu9Al(AsO4)2(OH)12(H2O)6](SO4)1.5·12H2O10.7628.682873.3[17]
Tiberiobardiite{Cu9Al[SiO3(OH)]2(OH)12(H2O)6}(SO4)1.5·10H2O10.6928.322801.0this work
Unclassified
Barrotite{Cu9Al[SiO3(OH)]2(OH)12(H2O)6}{(SO4)[AsO3(OH)]0.5}·2H2O10.6521.952156.5[12]
Table 9. Secondary Cu2+ oxysalts in ophiolite-hosted ore deposits from Tuscany.
MineralChemical FormulaOccurrences
Halides
ClinoatacamiteCu2(OH)3ClMontecastelli
ConnelliteCu19(SO4)(OH)32Cl4·3H2OCretaio, Montecastelli
Carbonates
AzuriteCu3(CO3)2(OH)2Widespread
MalachiteCu2(CO3)(OH)2Widespread
Sulfates
AntleriteCu3(SO4)(OH)4Cretaio
BrochantiteCu4(SO4)(OH)6Widespread
ChalchantiteCu(SO4)·5H2OCretaio, Impruneta
ChalcoalumiteCuAl4(SO4)(OH)12·3H2OCretaio
CyanotrichiteCu4Al2(SO4)(OH)12·2H2OCretaio
Devilline/serpieriteCaCu4(SO4)2(OH)6·3H2OCretaio, Impruneta
LangiteCu4(SO4)(OH)6·2H2OCretaio, Impruneta, MVC
LinariteCuPb(SO4)(OH)2MVC
PosnjakiteCu4(SO4)(OH)6·H2OCretaio, MVC, CdC
SpangoliteCu6Al(SO4)(OH)12Cl·3H2OCretaio
Phosphates
CalciopetersiteCaCu6(PO4)2(PO3OH)(OH)6·3H2OMonte Beni
LibetheniteCu2(PO4)(OH)Cretaio
Silicates
ChrysocollaCu2−xAlx(H2-xSi2O5)(OH)4·nH2OWidespread
TiberiobardiiteCu9Al(SiO3OH)2(SO4)1.5(OH)2·16H2OCretaio
Note: minerals occurring in more than three localities are indicated as “widespread”. CdC = Cetine di Camporbiano, Pisa and MVC = Montecatini Val di Cecina, Pisa.

