
Effect of Additives on Arsenic, Boron and Selenium Leaching from Coal Fly Ash


Abstract
1. Introduction
2. Materials and Methods
2.1. Coal Fly Ash and Additives
2.2. Fly Ash Treatment and Leaching Test
2.3. Characterization of the Elements in CFA and Additives
2.4. Chemical Analyses
3. Results
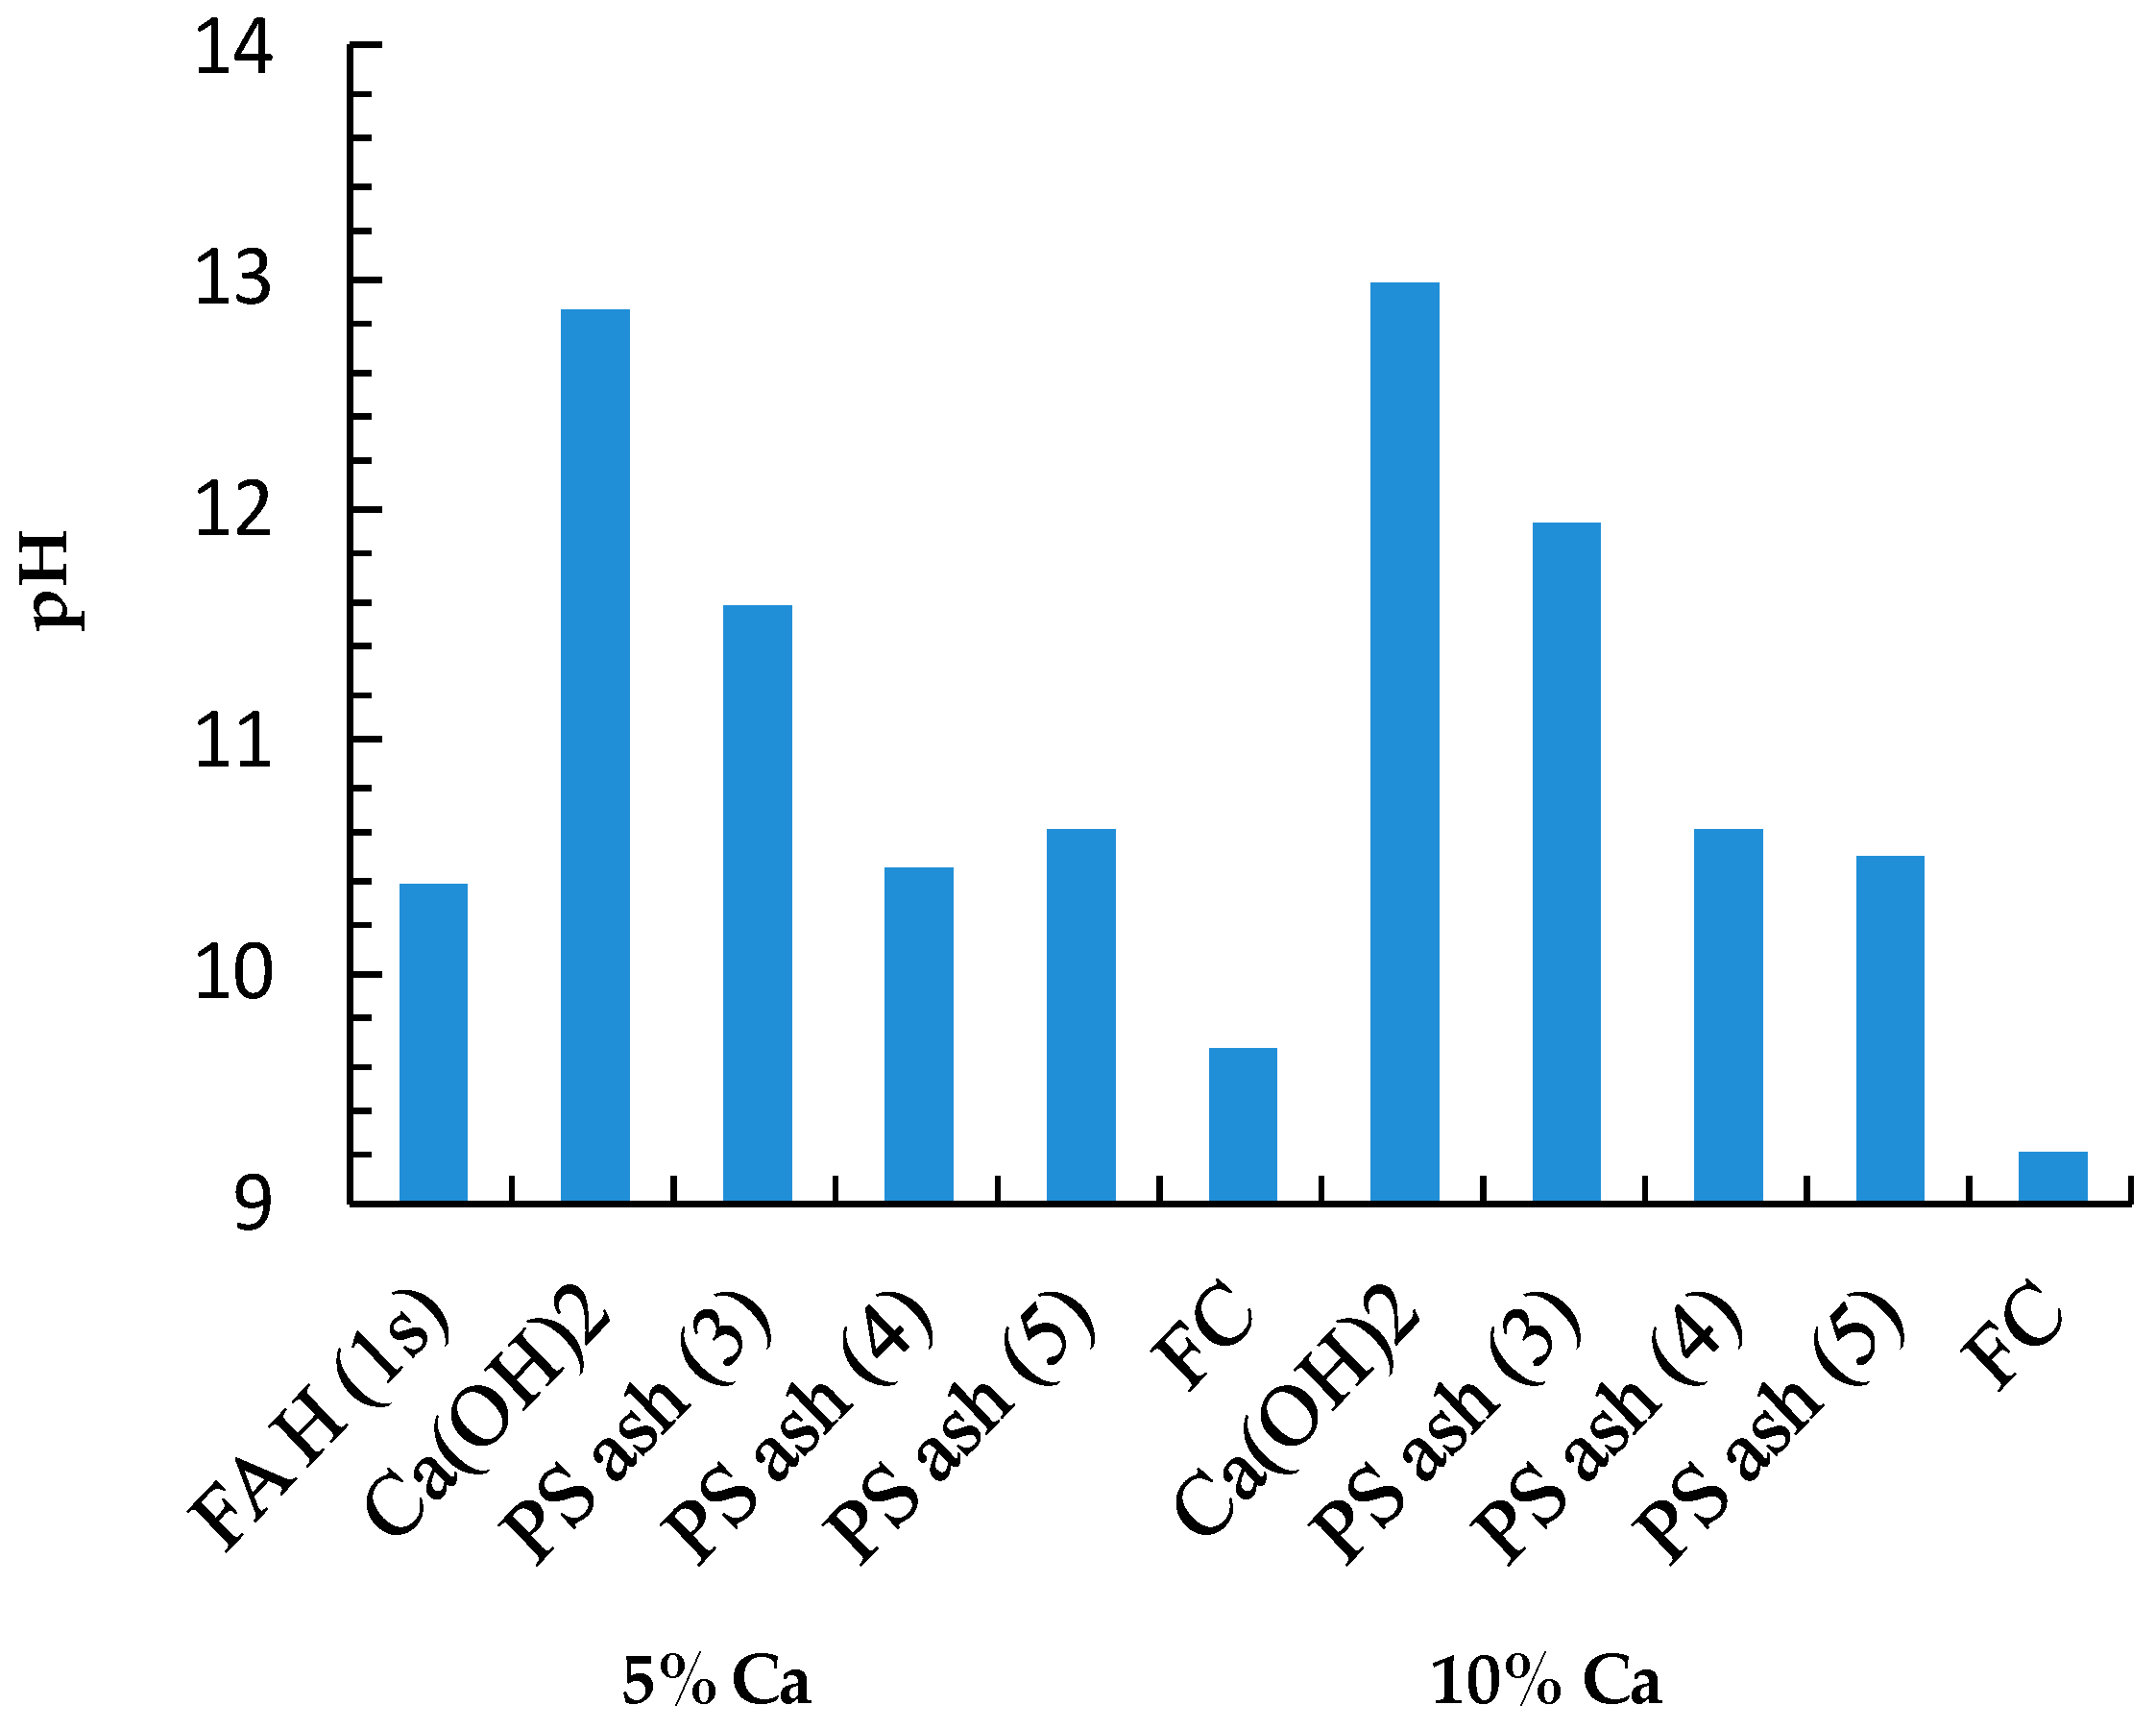
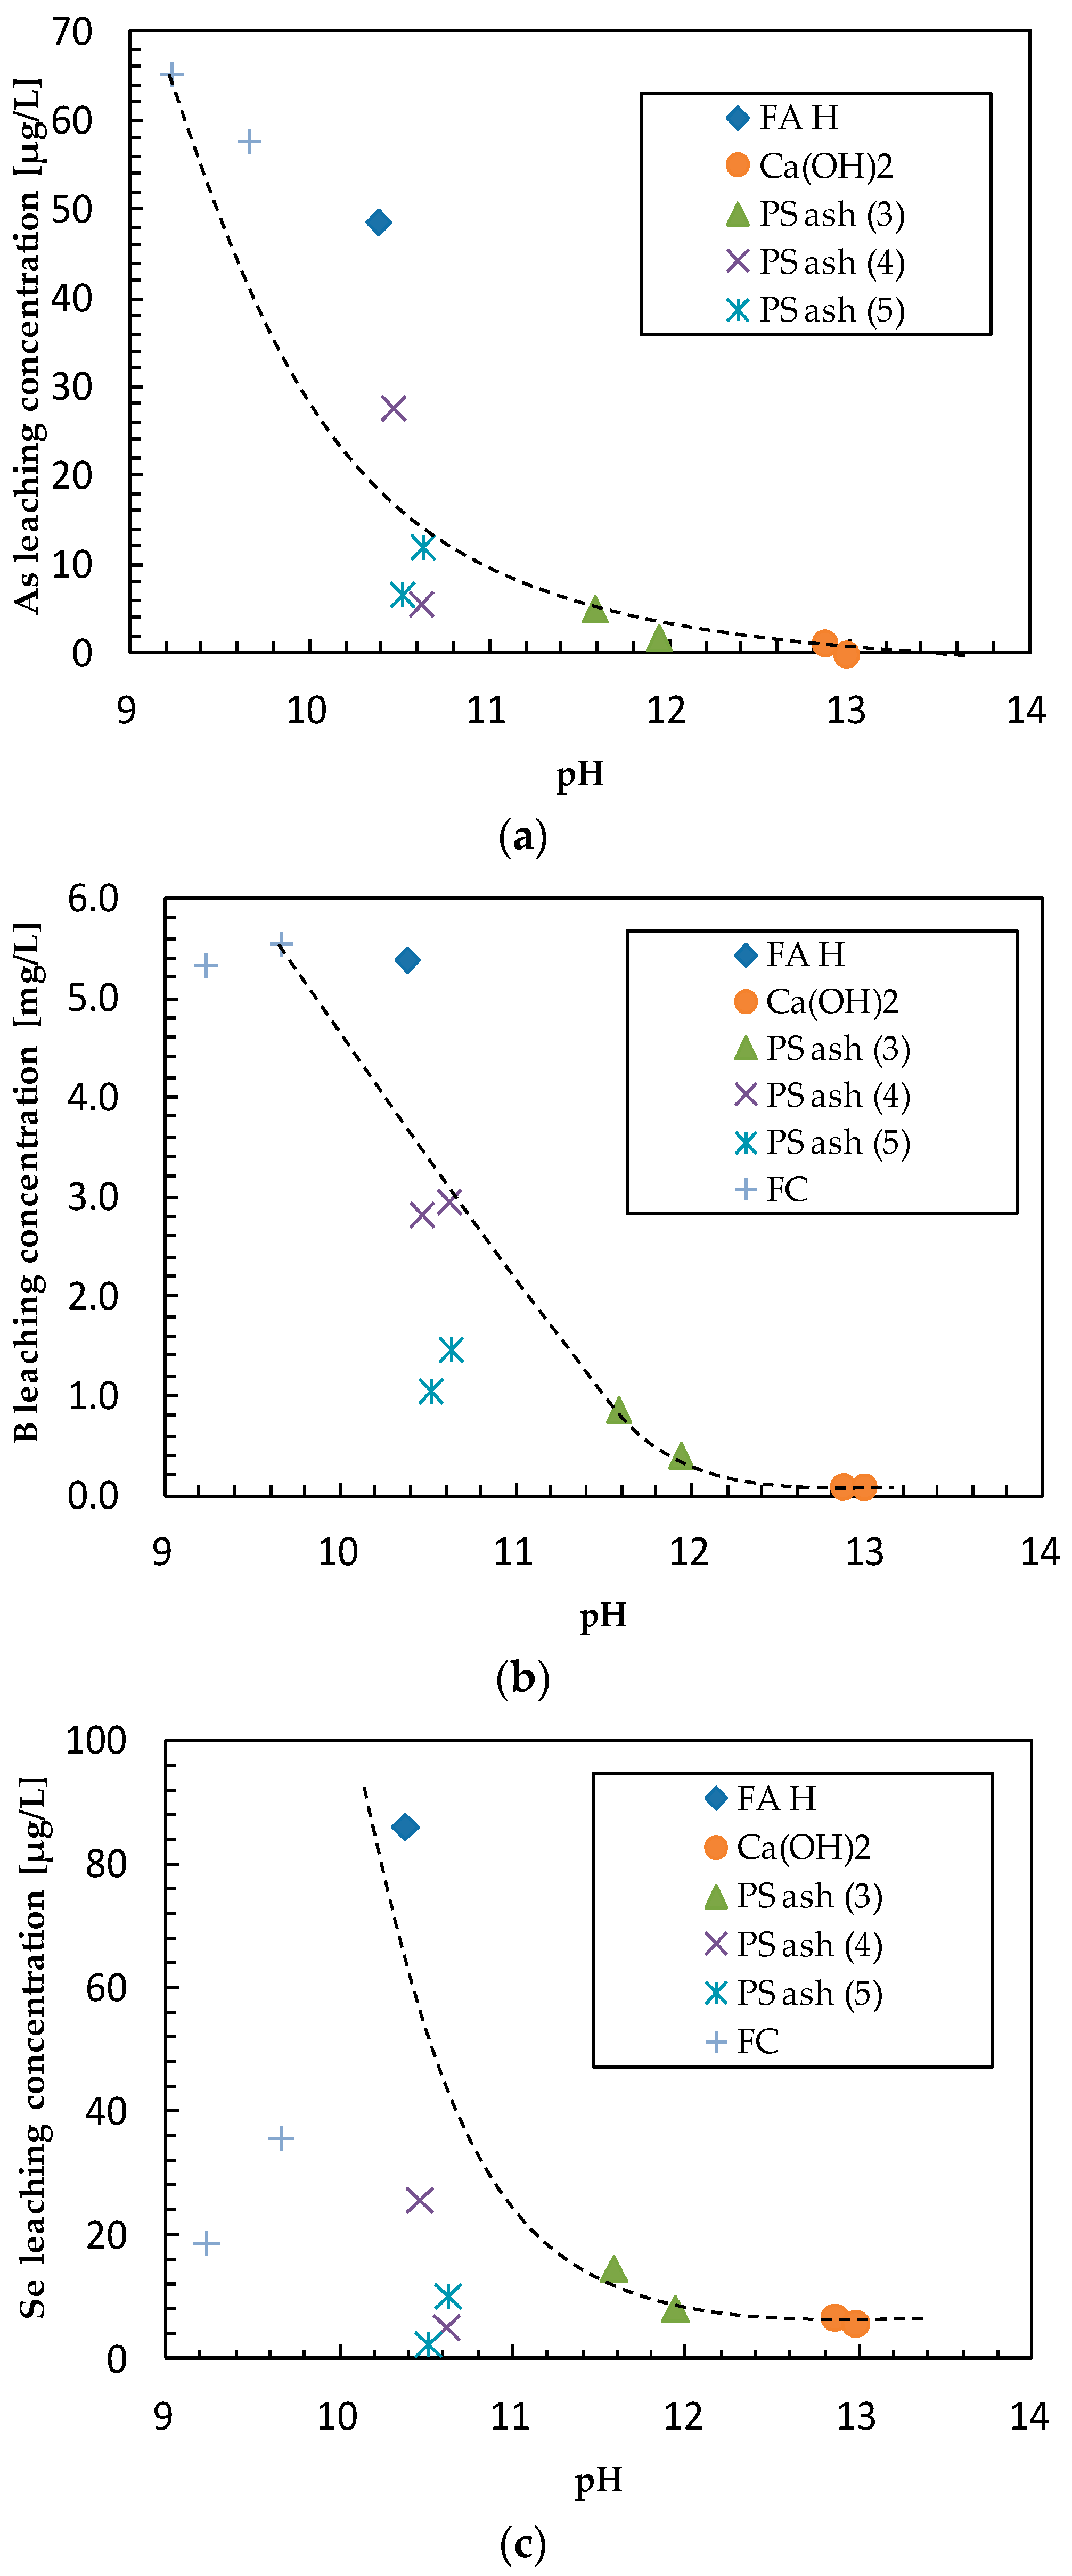
3.1. pH of the Leachates
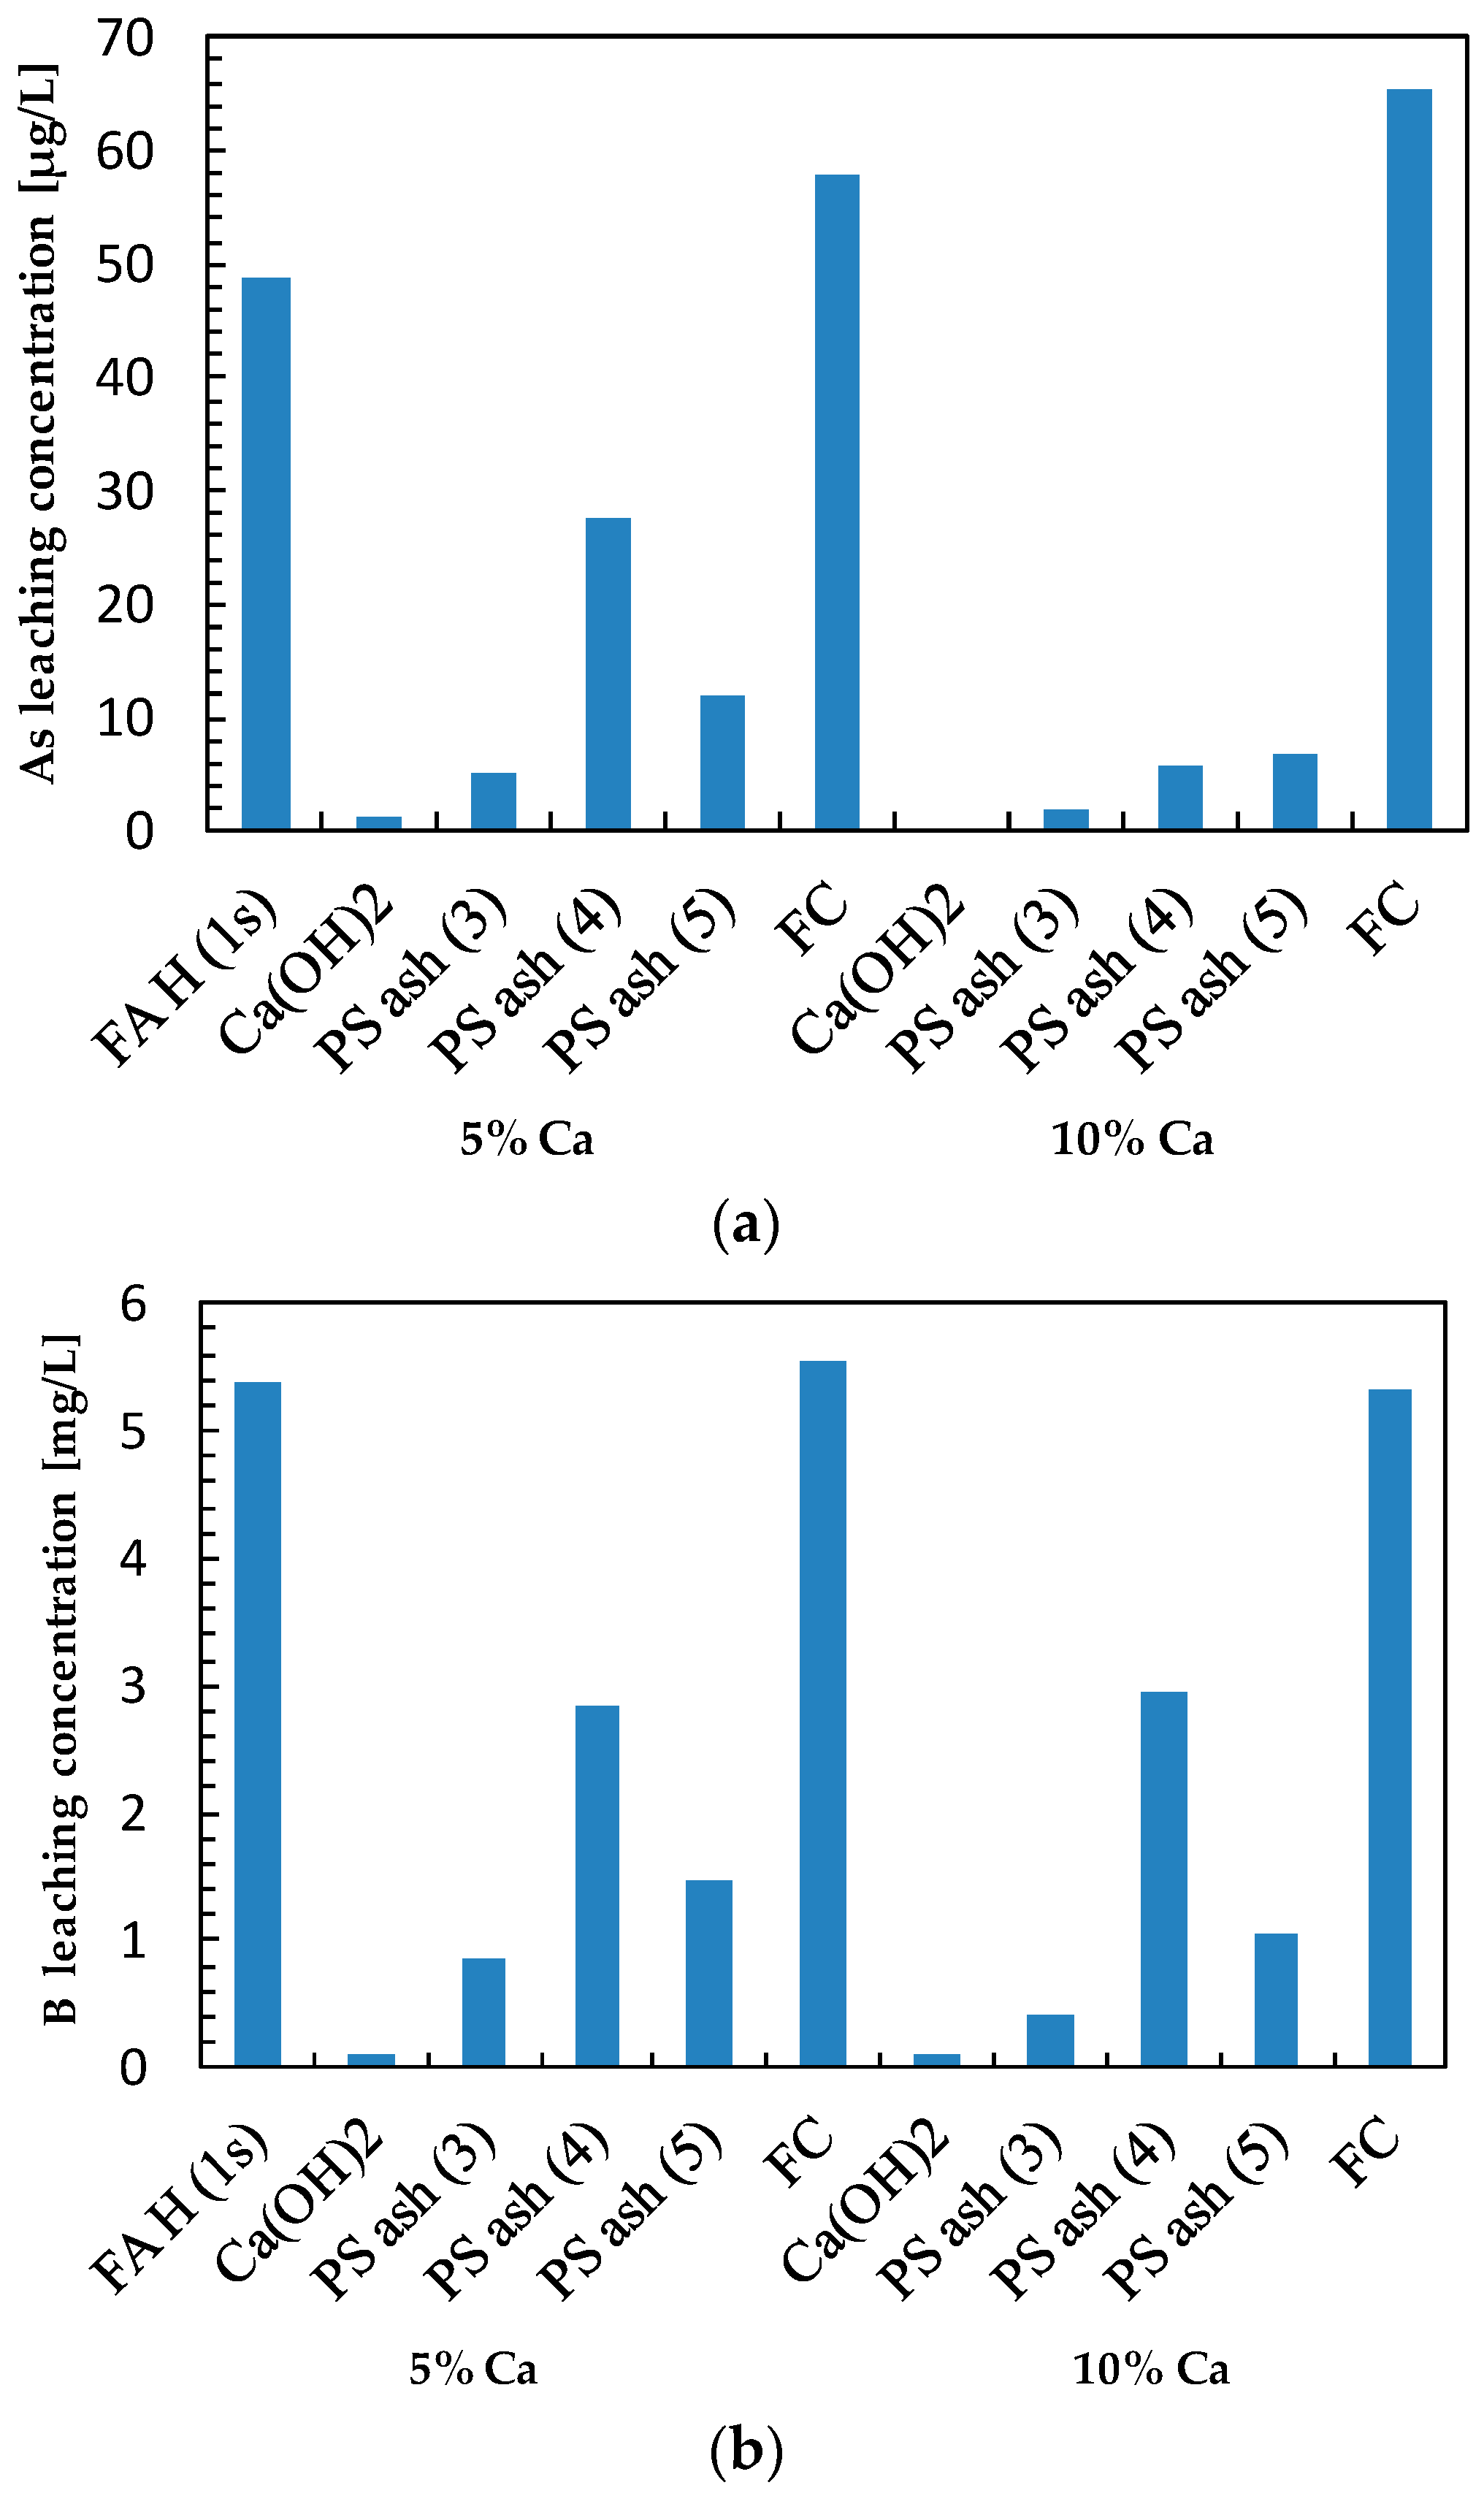
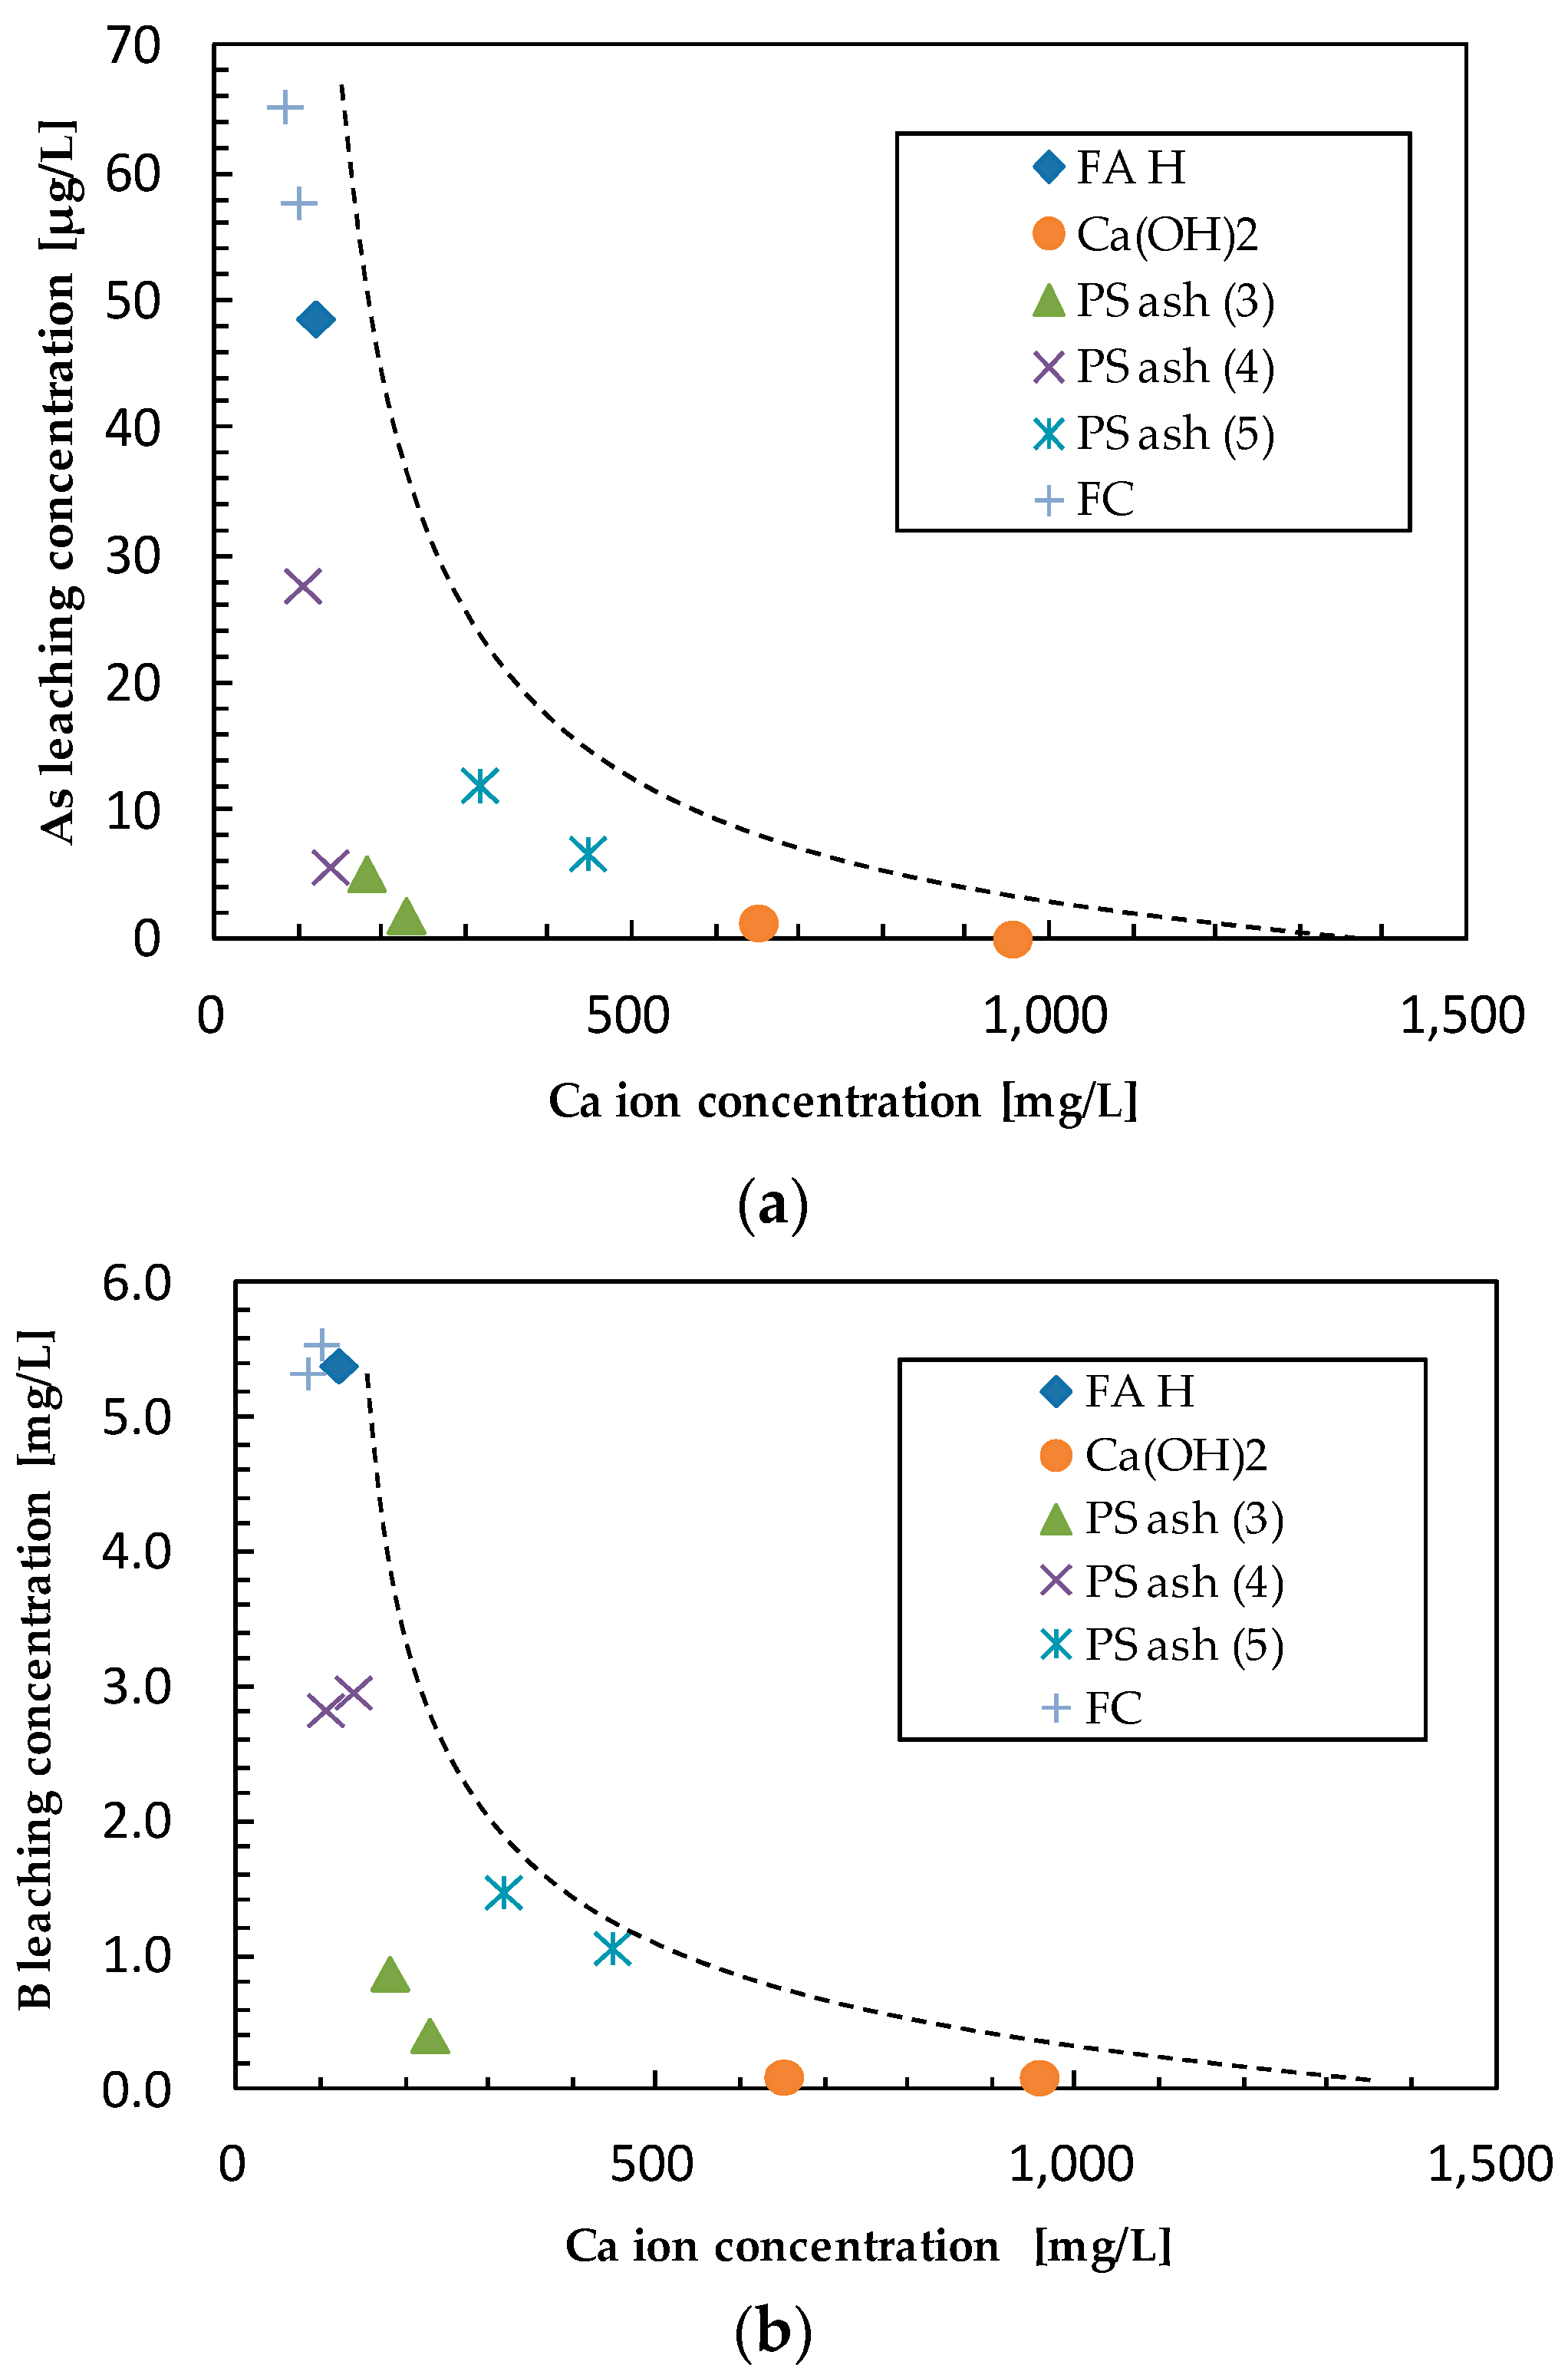
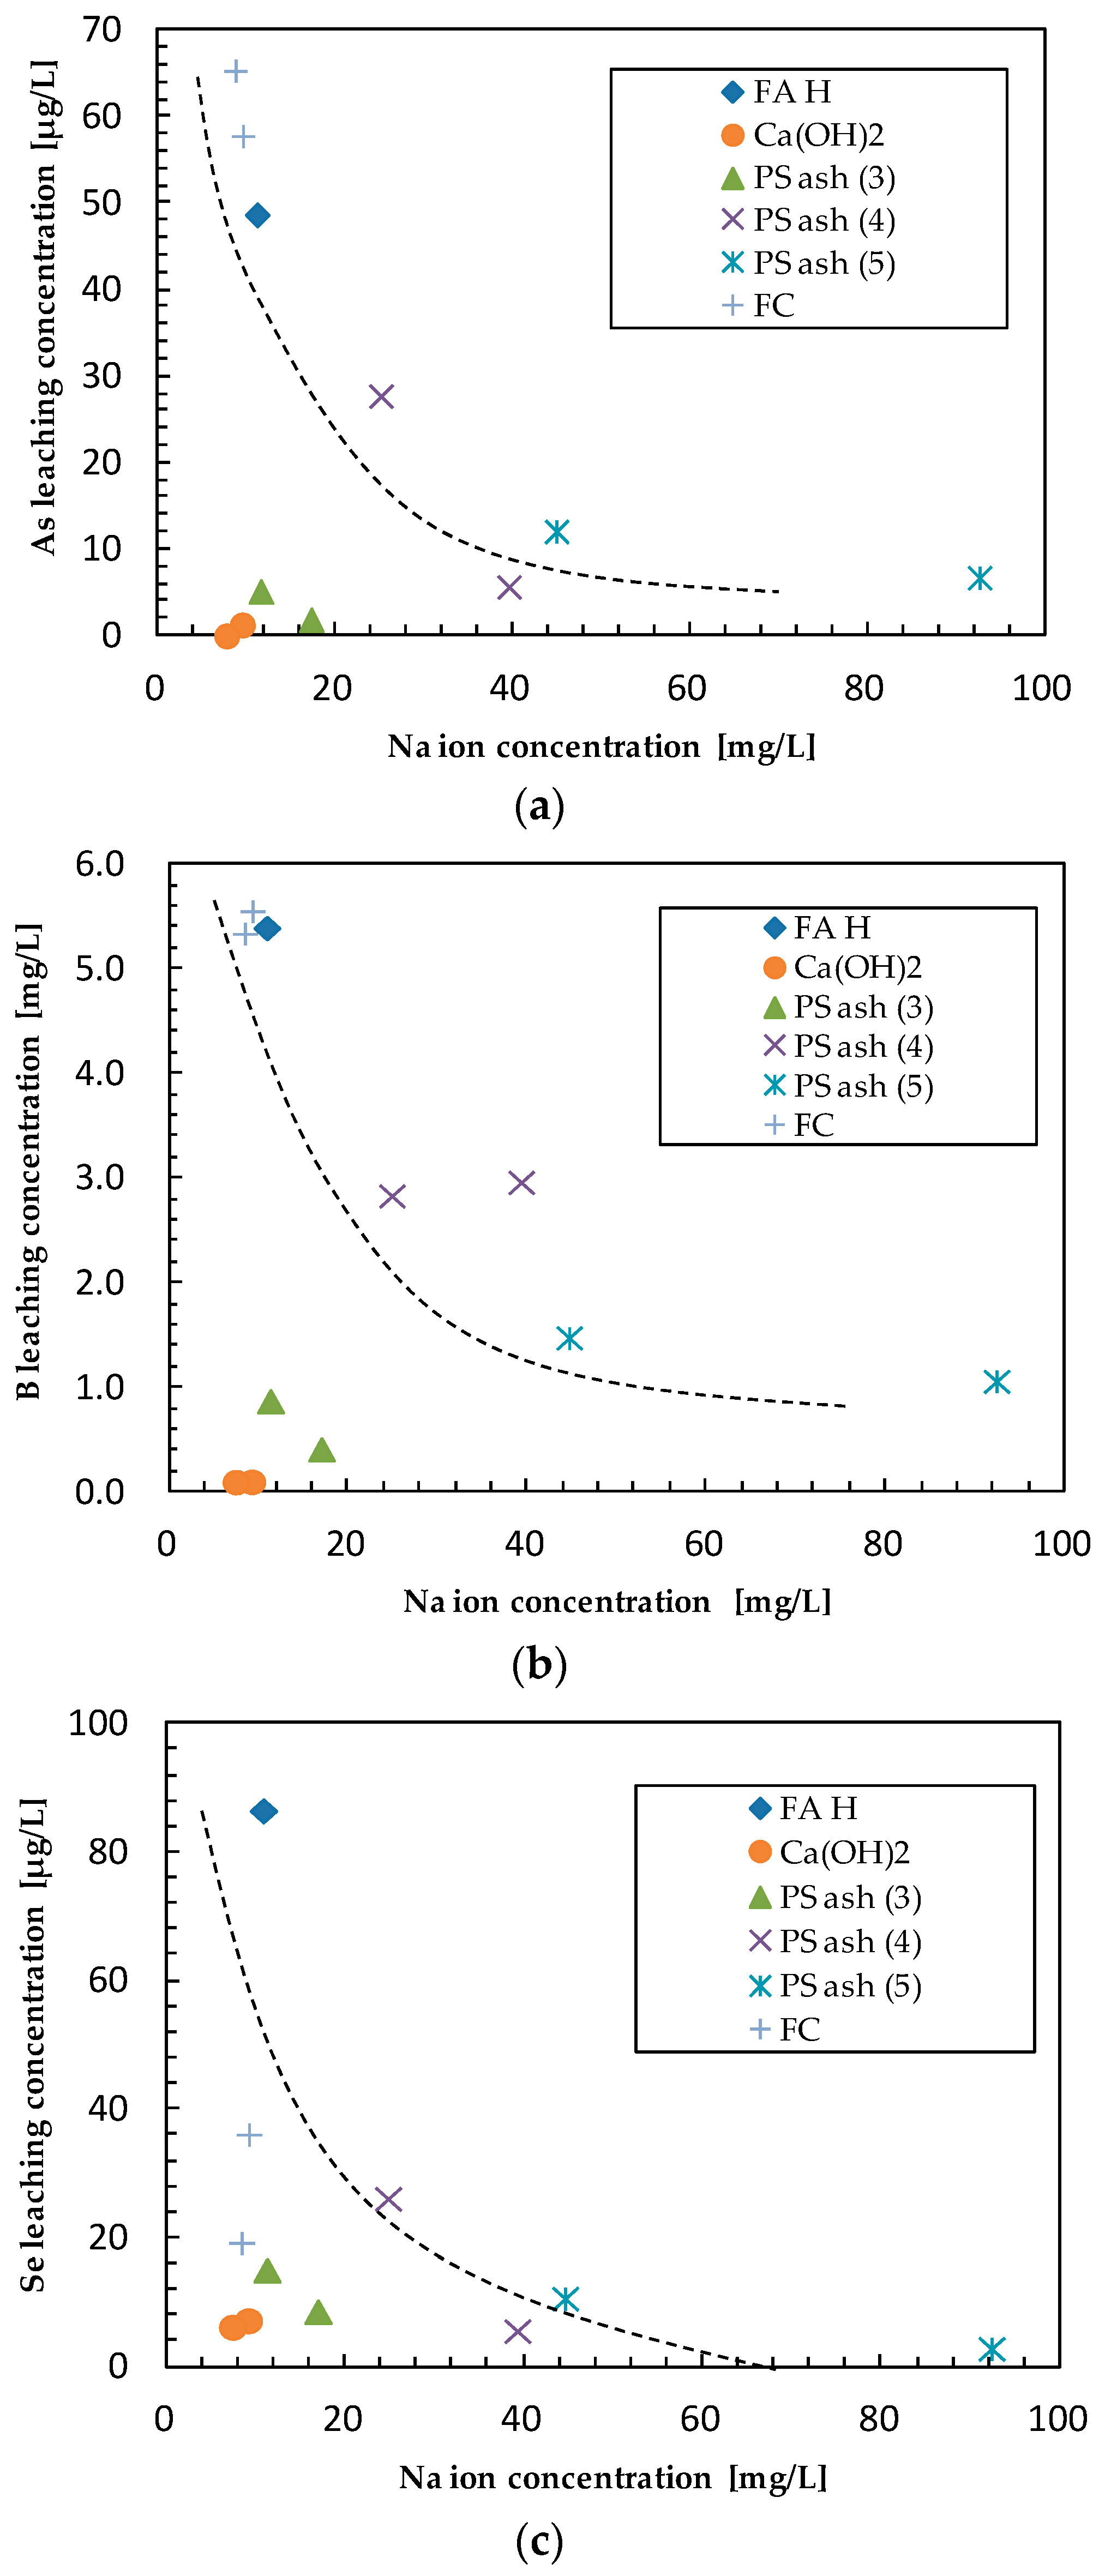
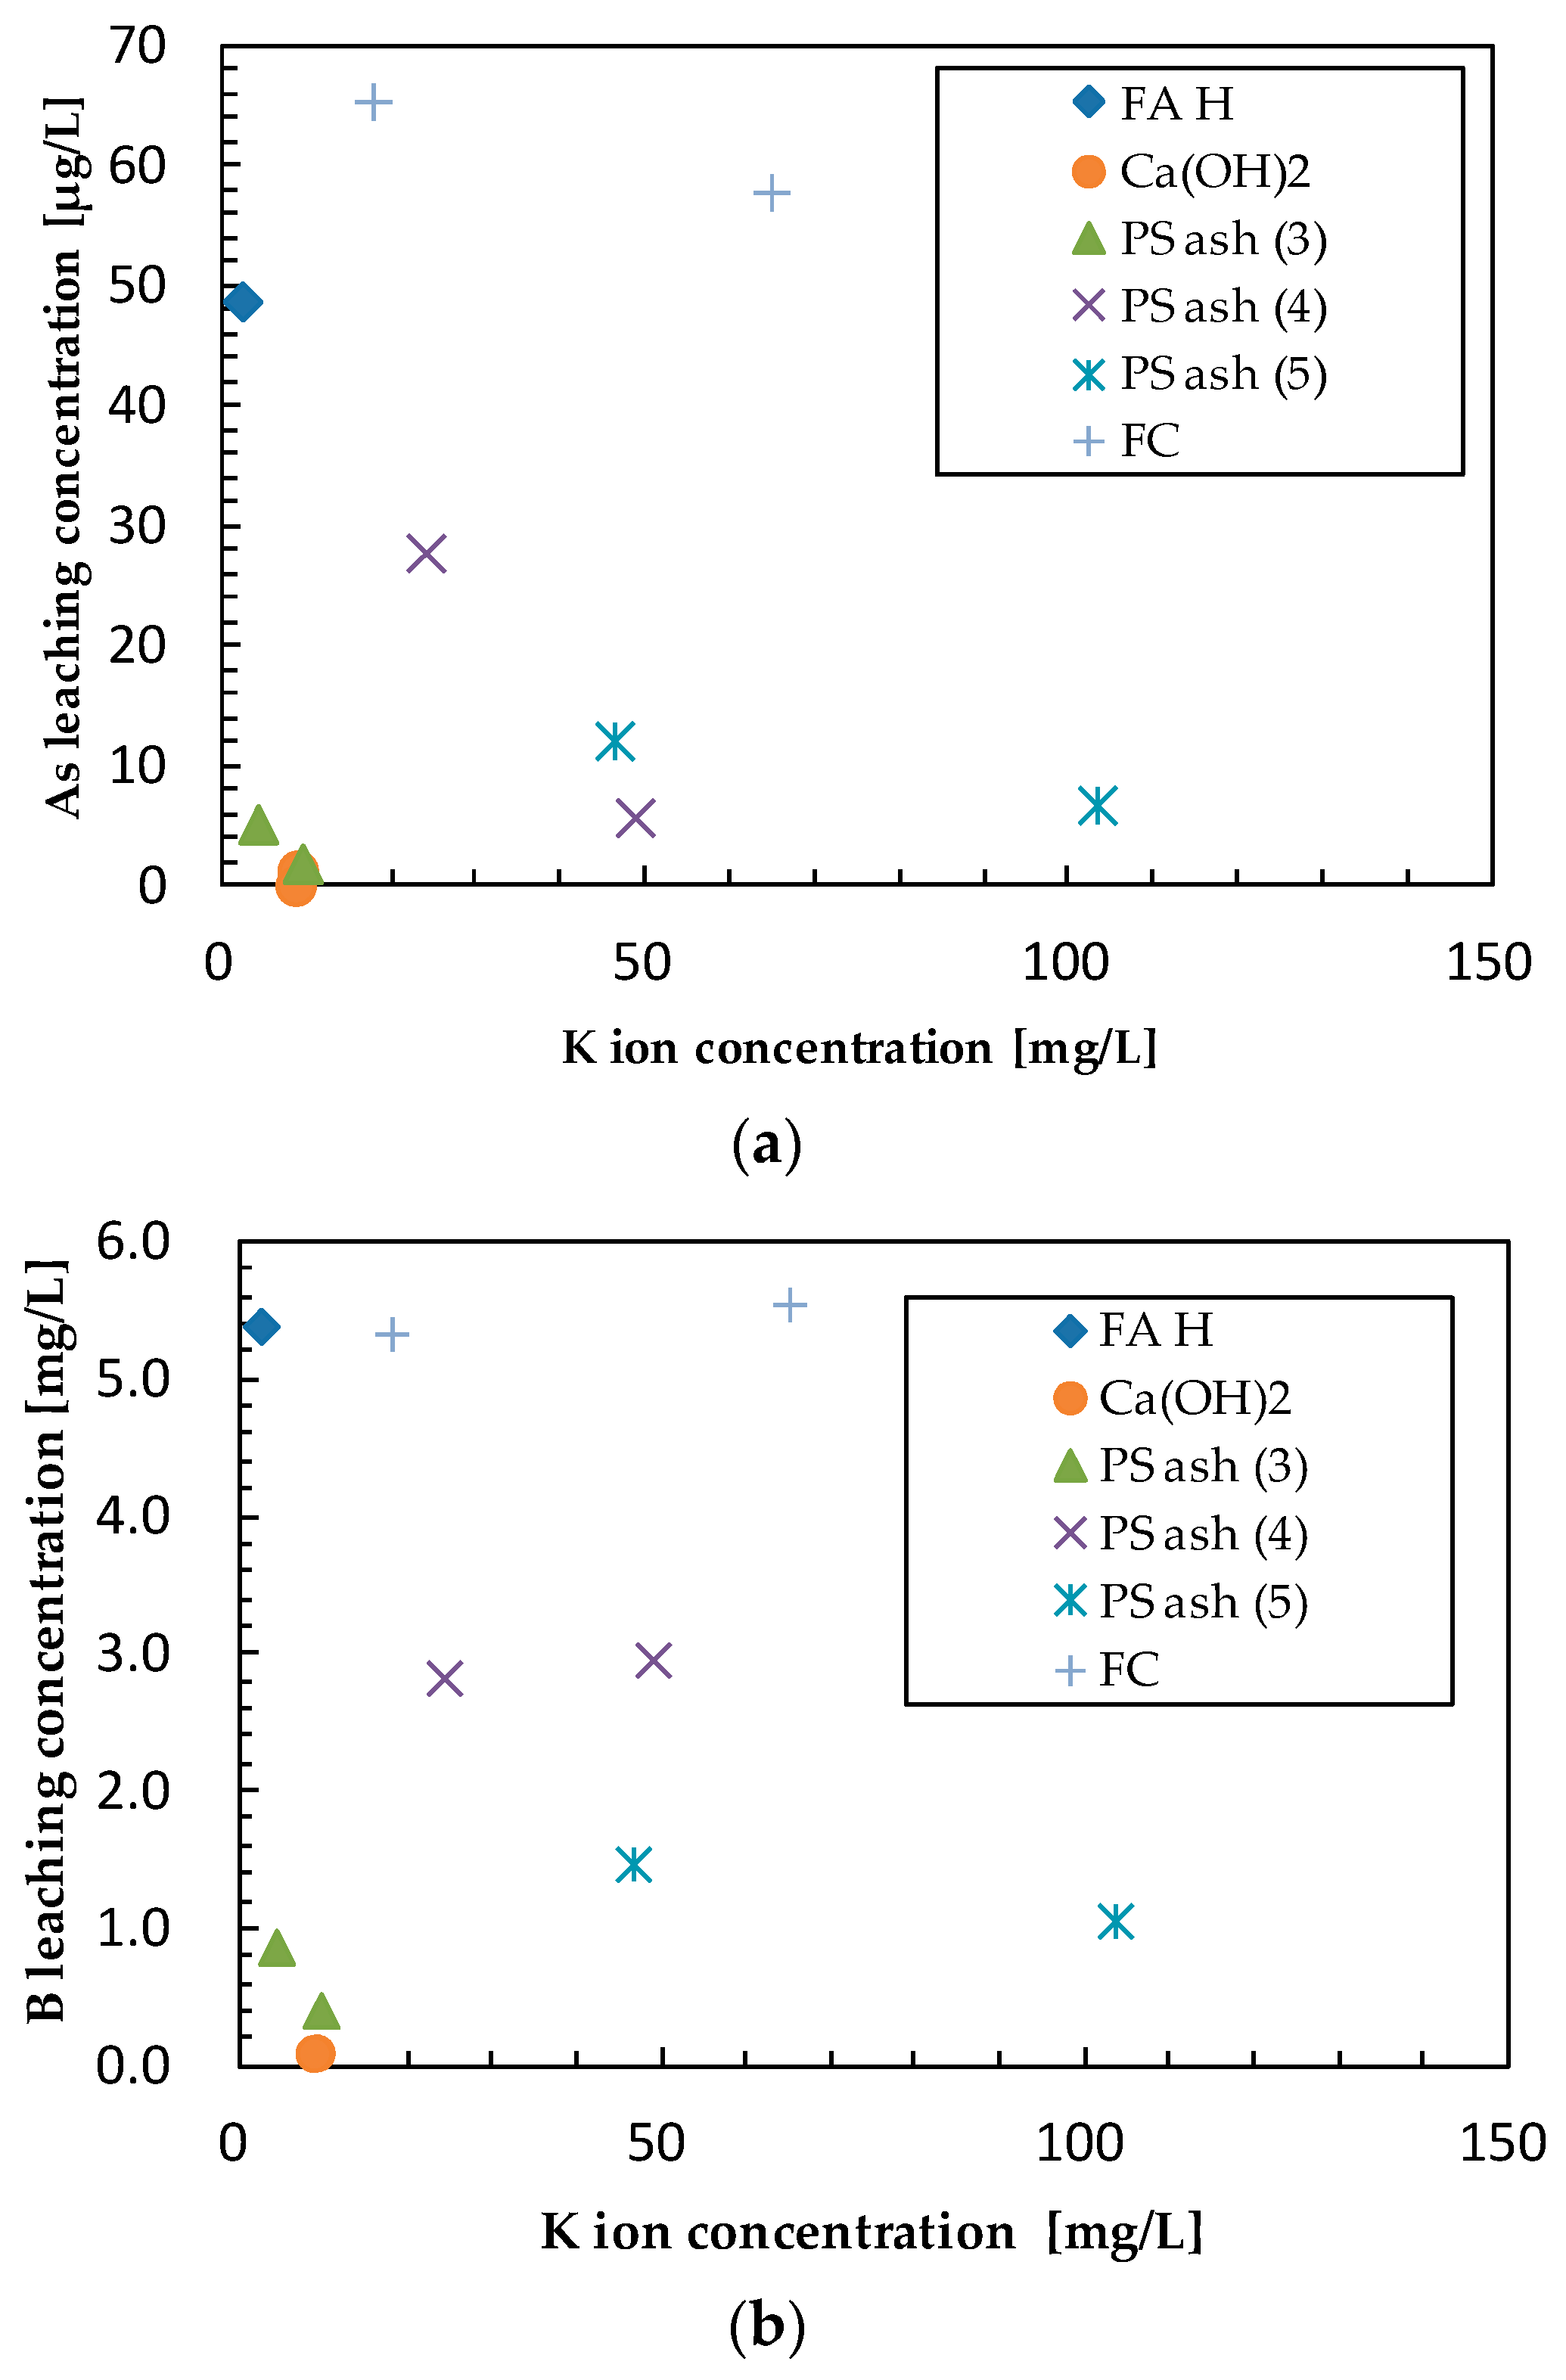
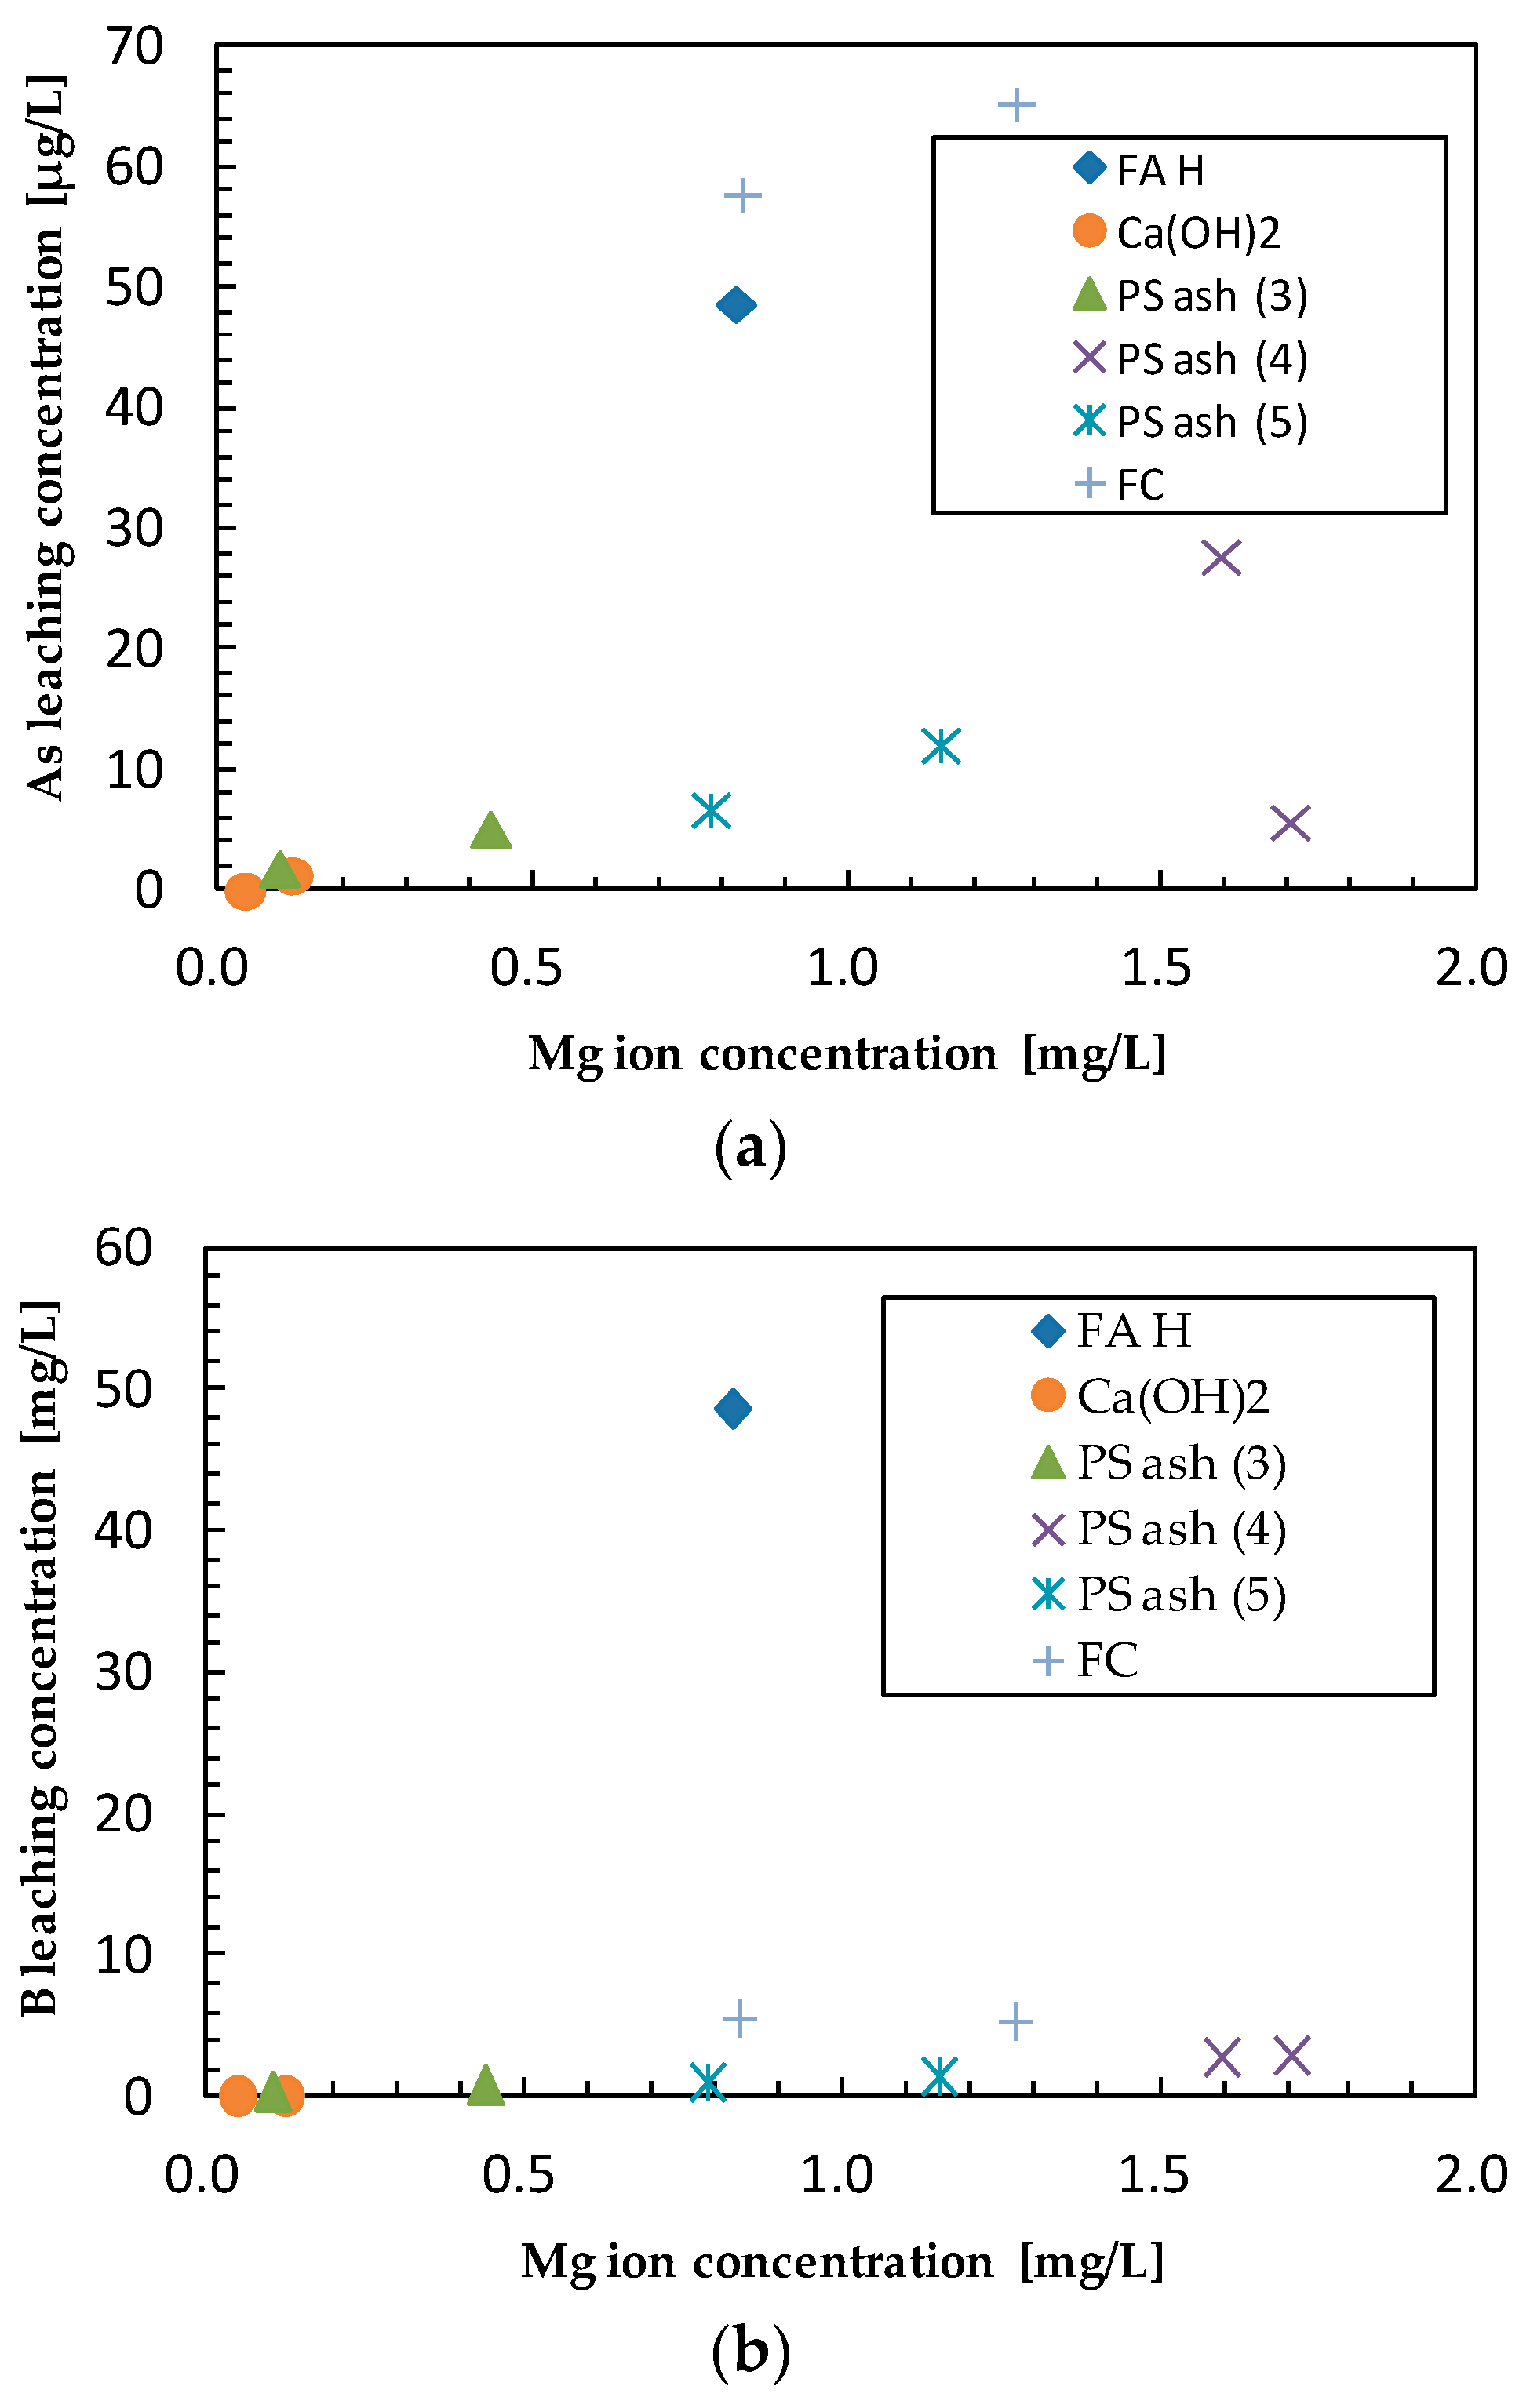
3.2. Effect of Additives on Arsenic Leaching
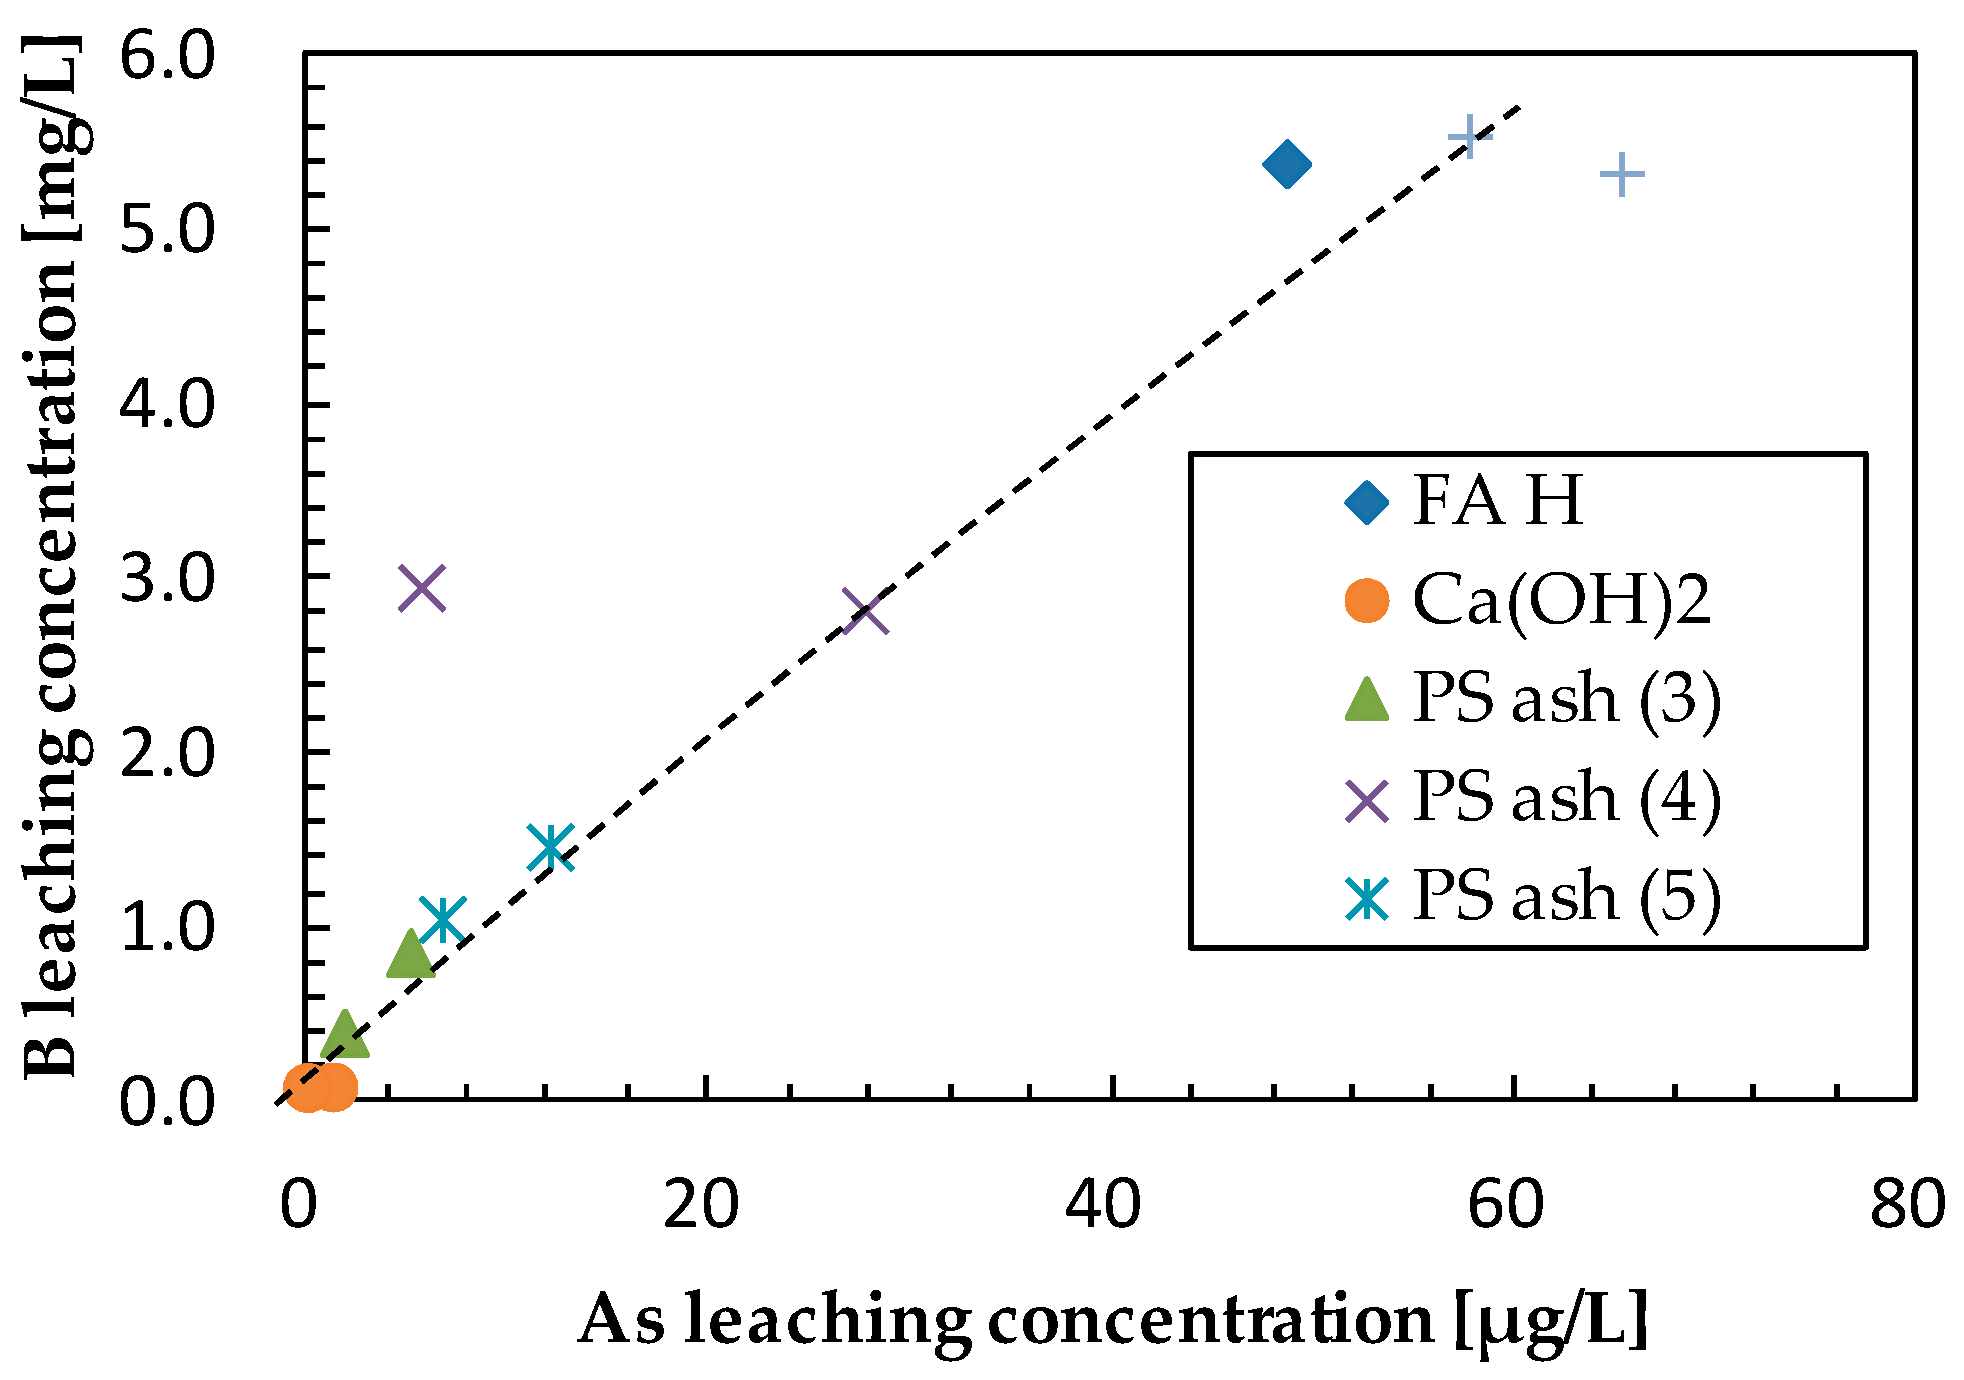
3.3. Effect of Additives on Boron Leaching
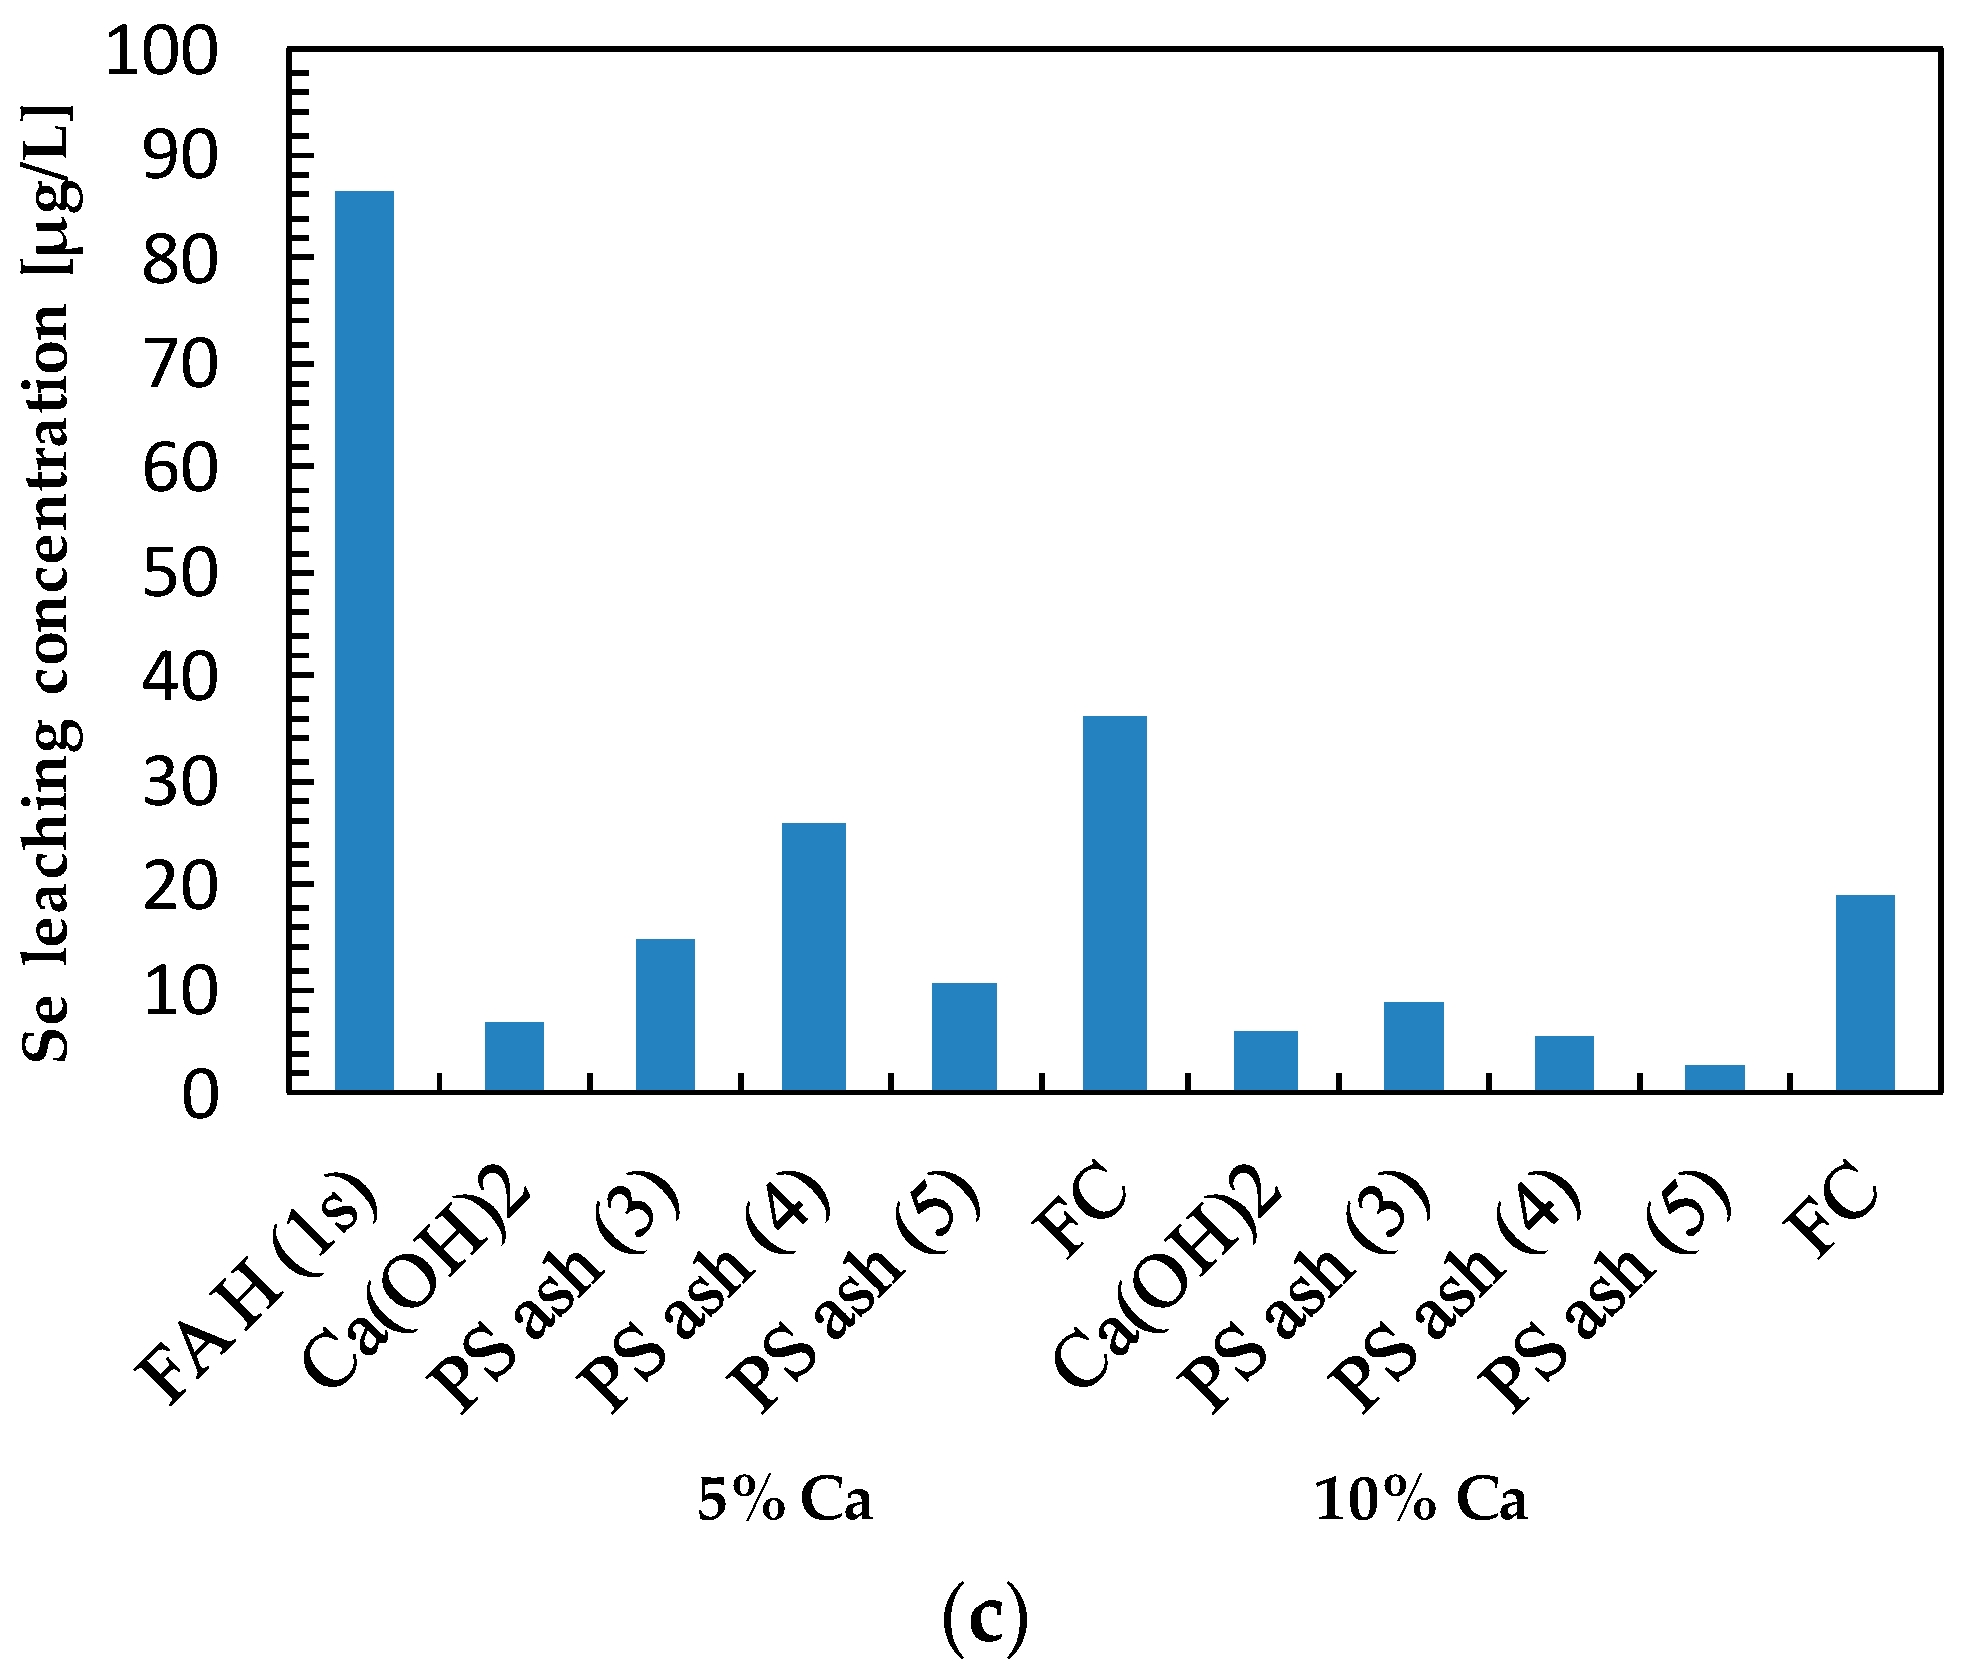
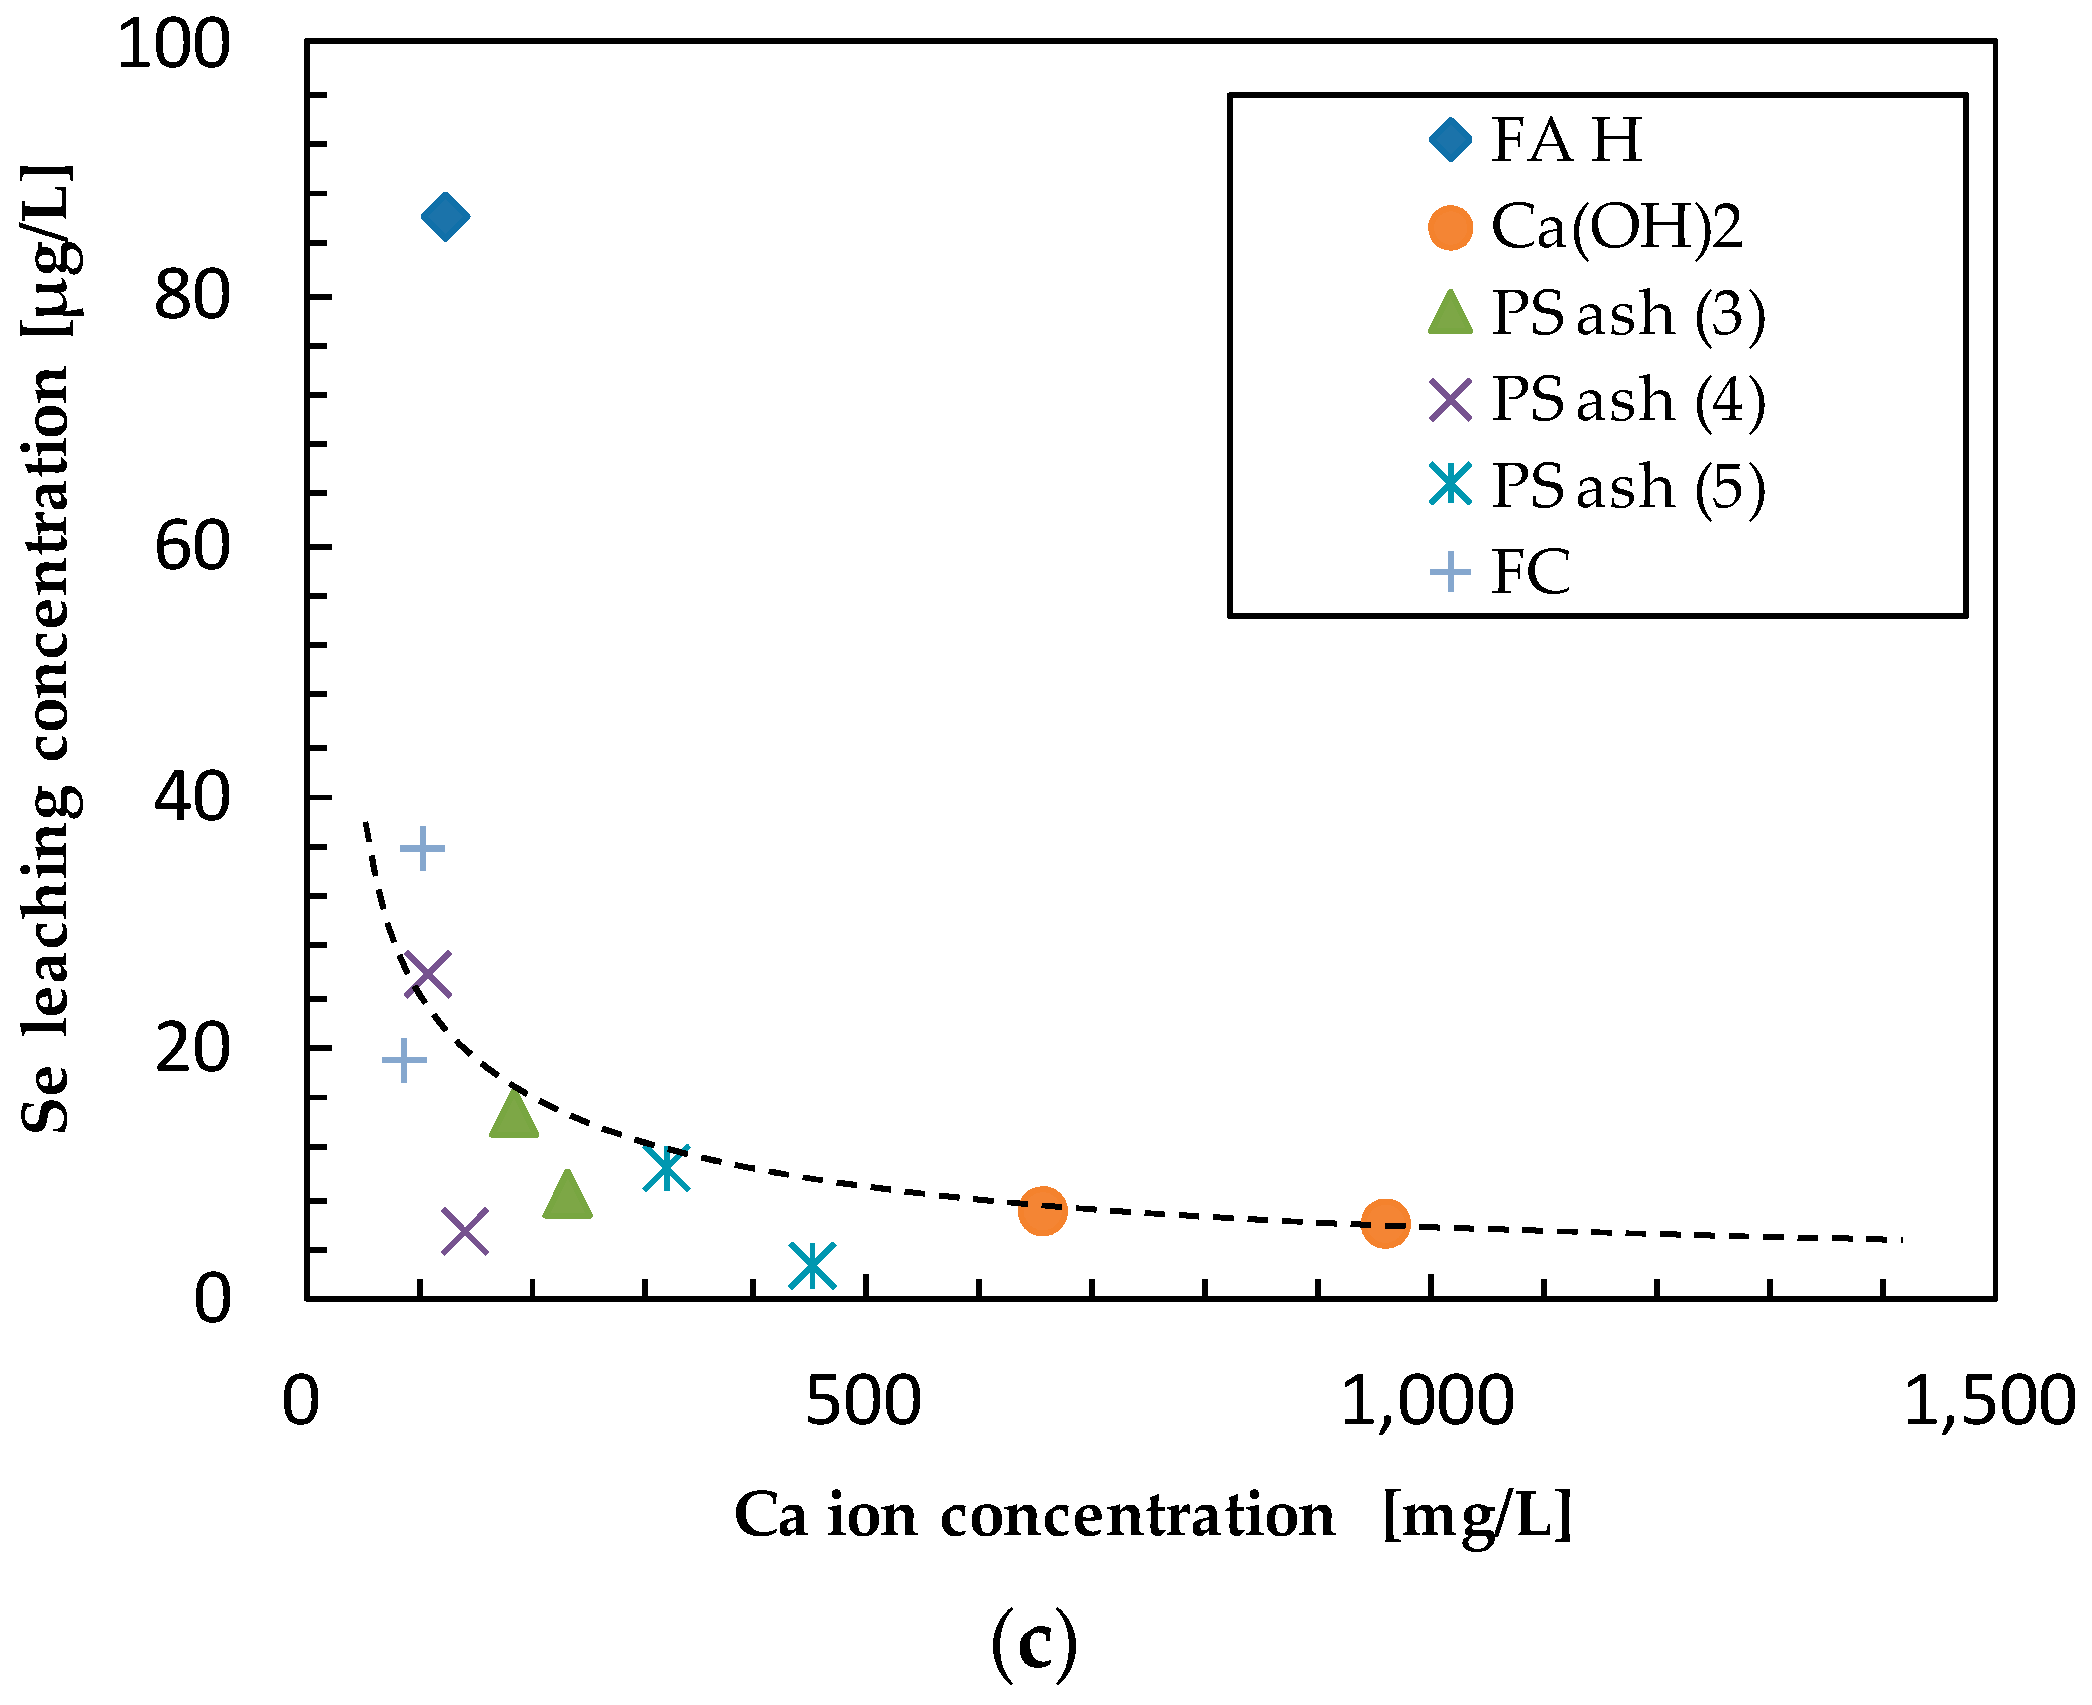
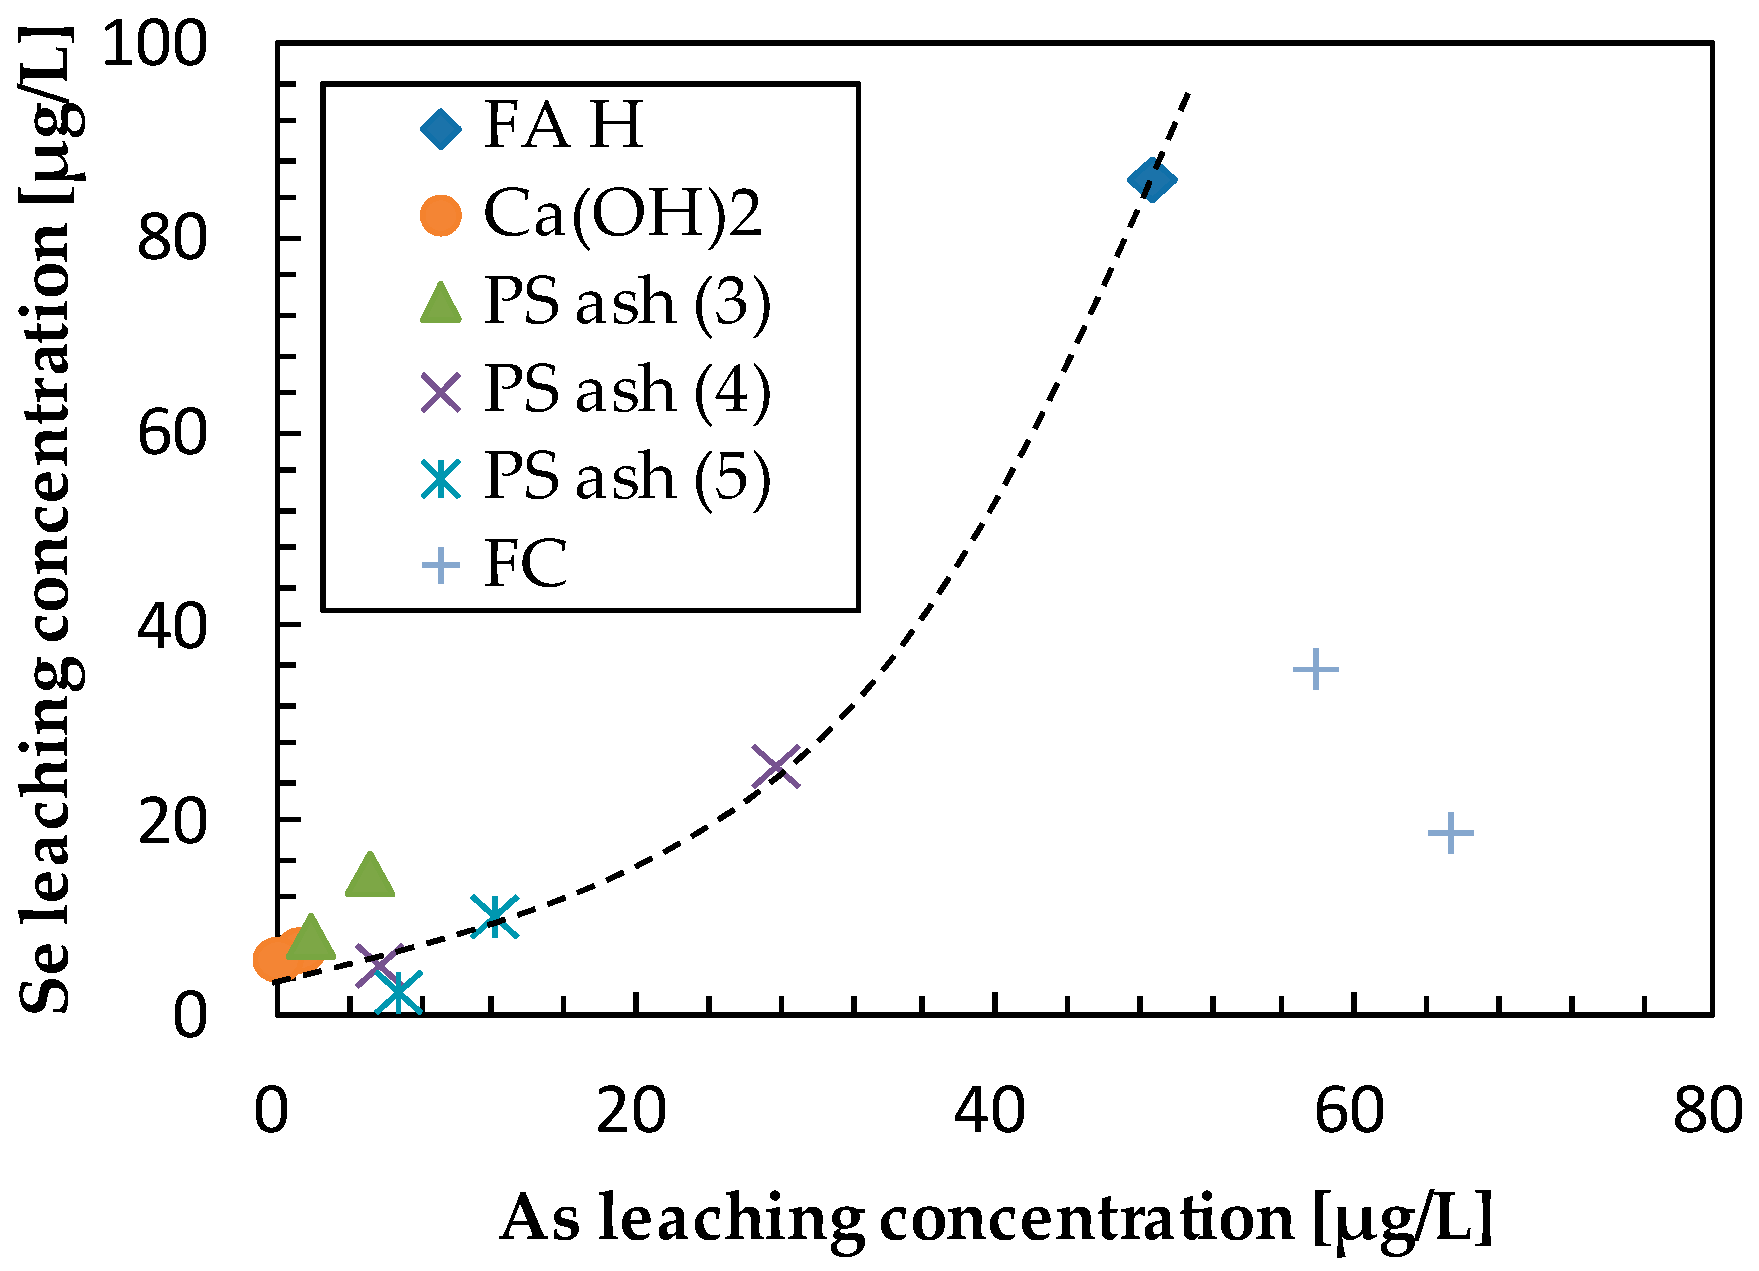
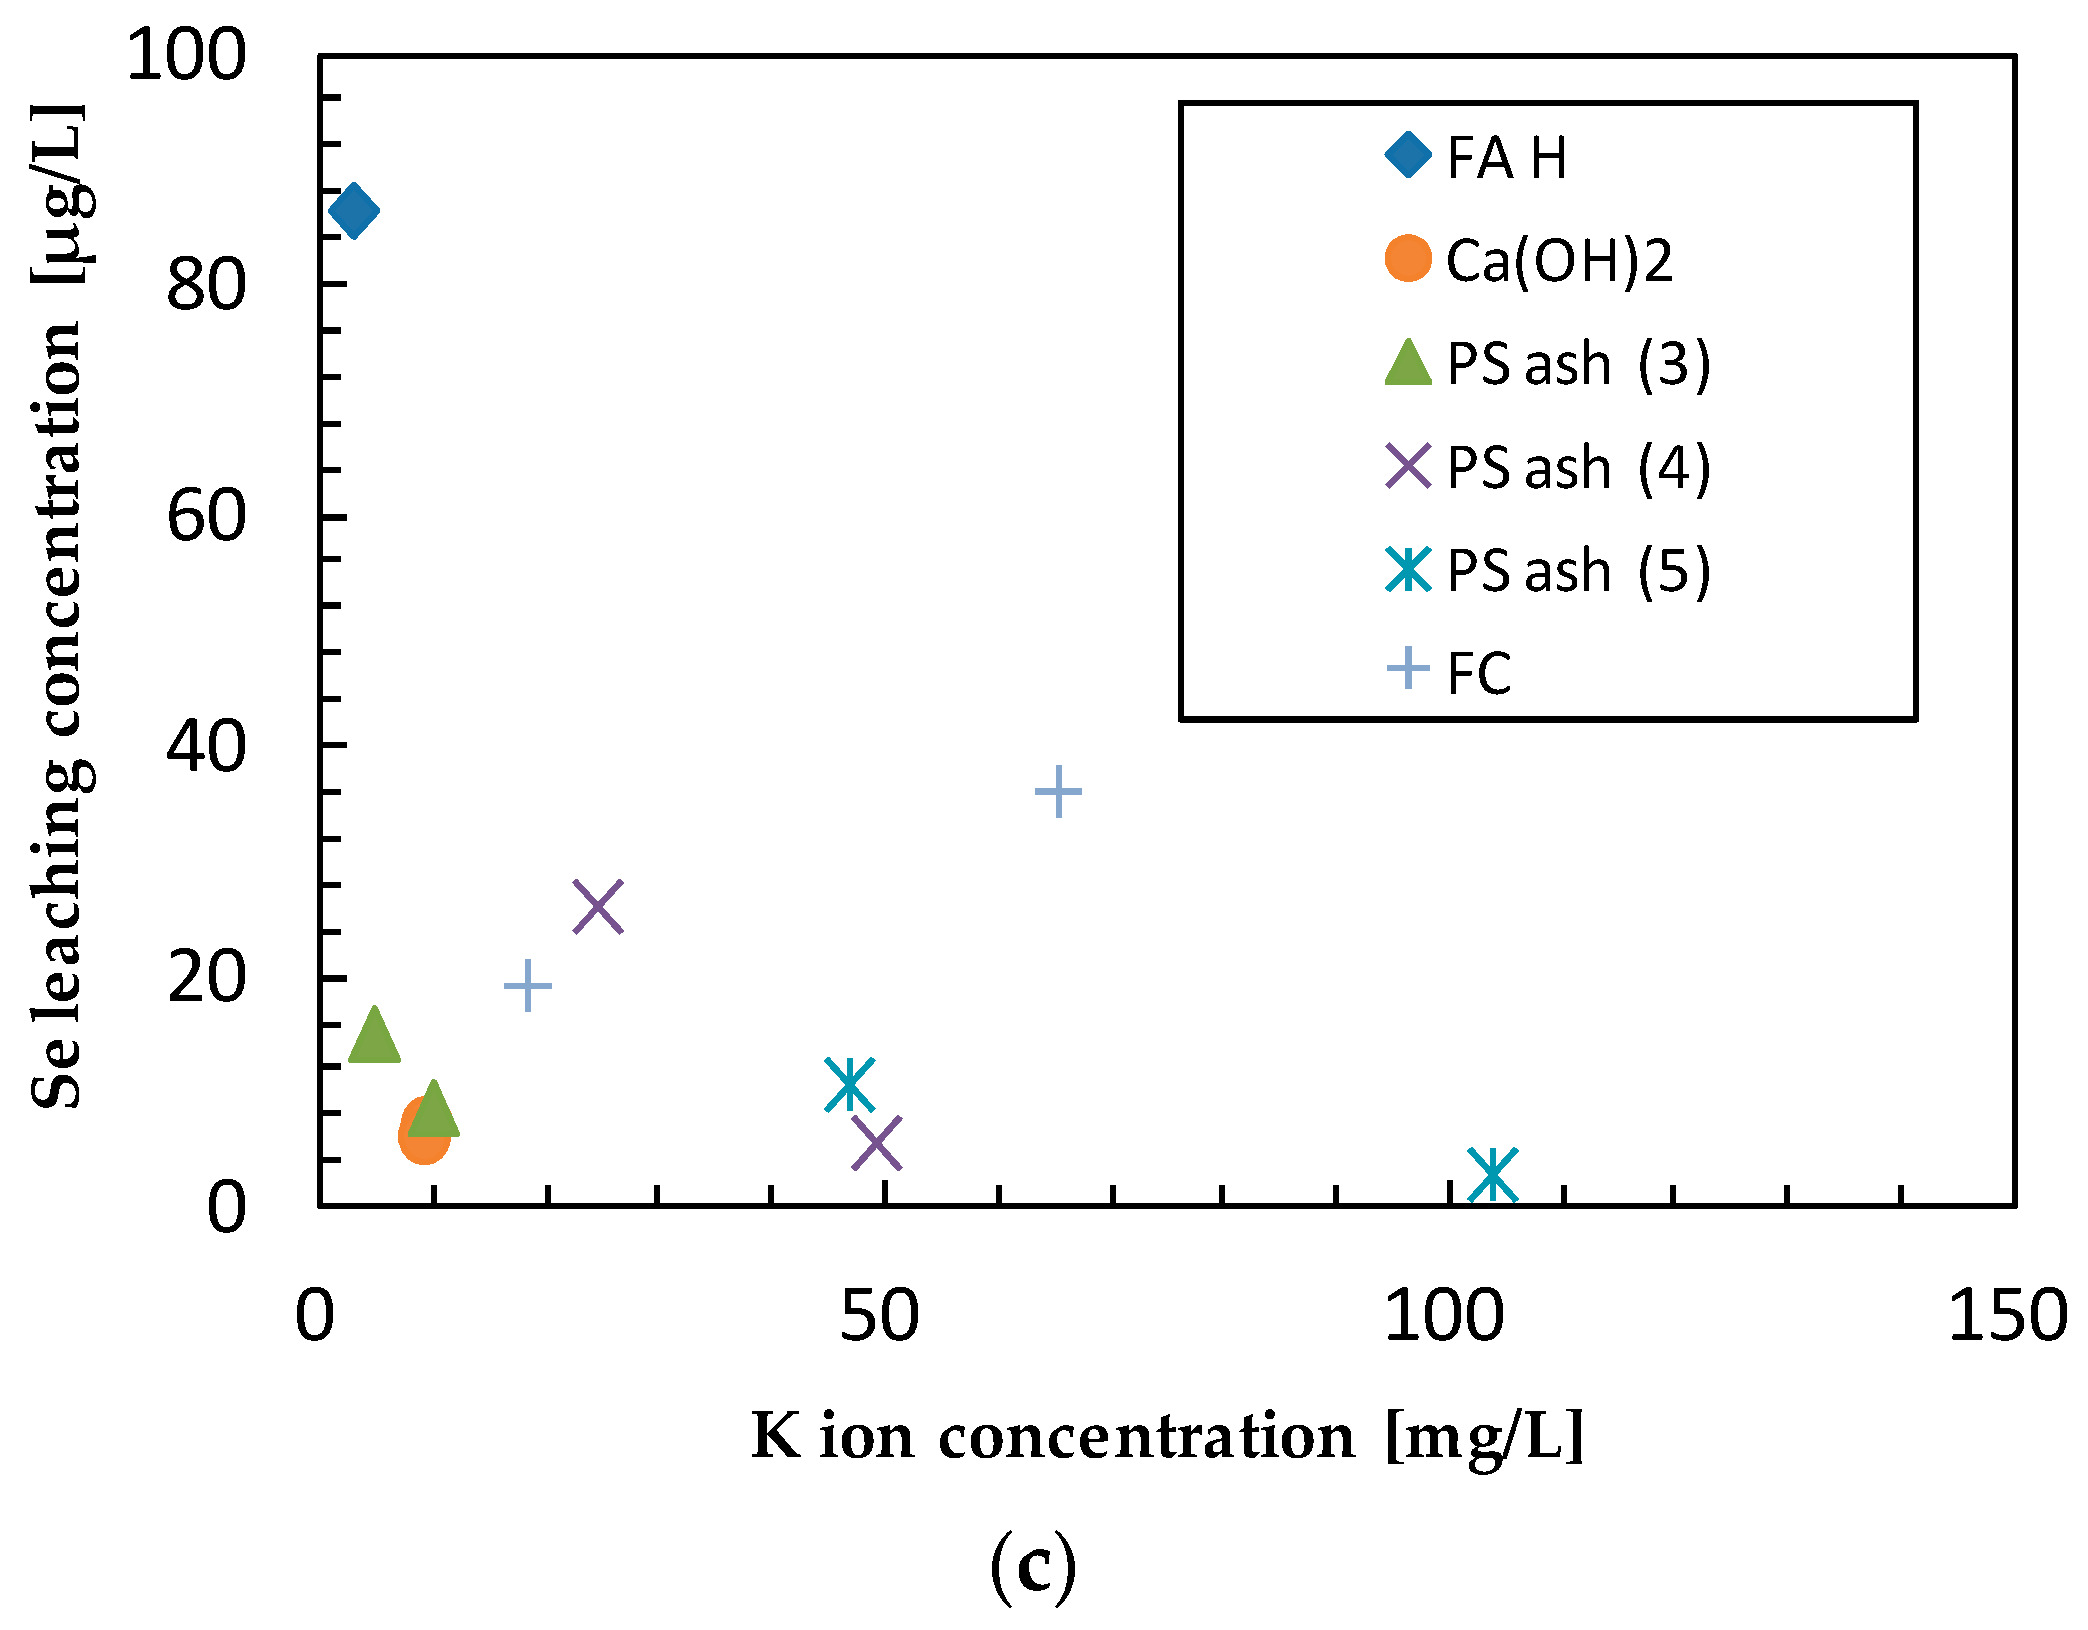
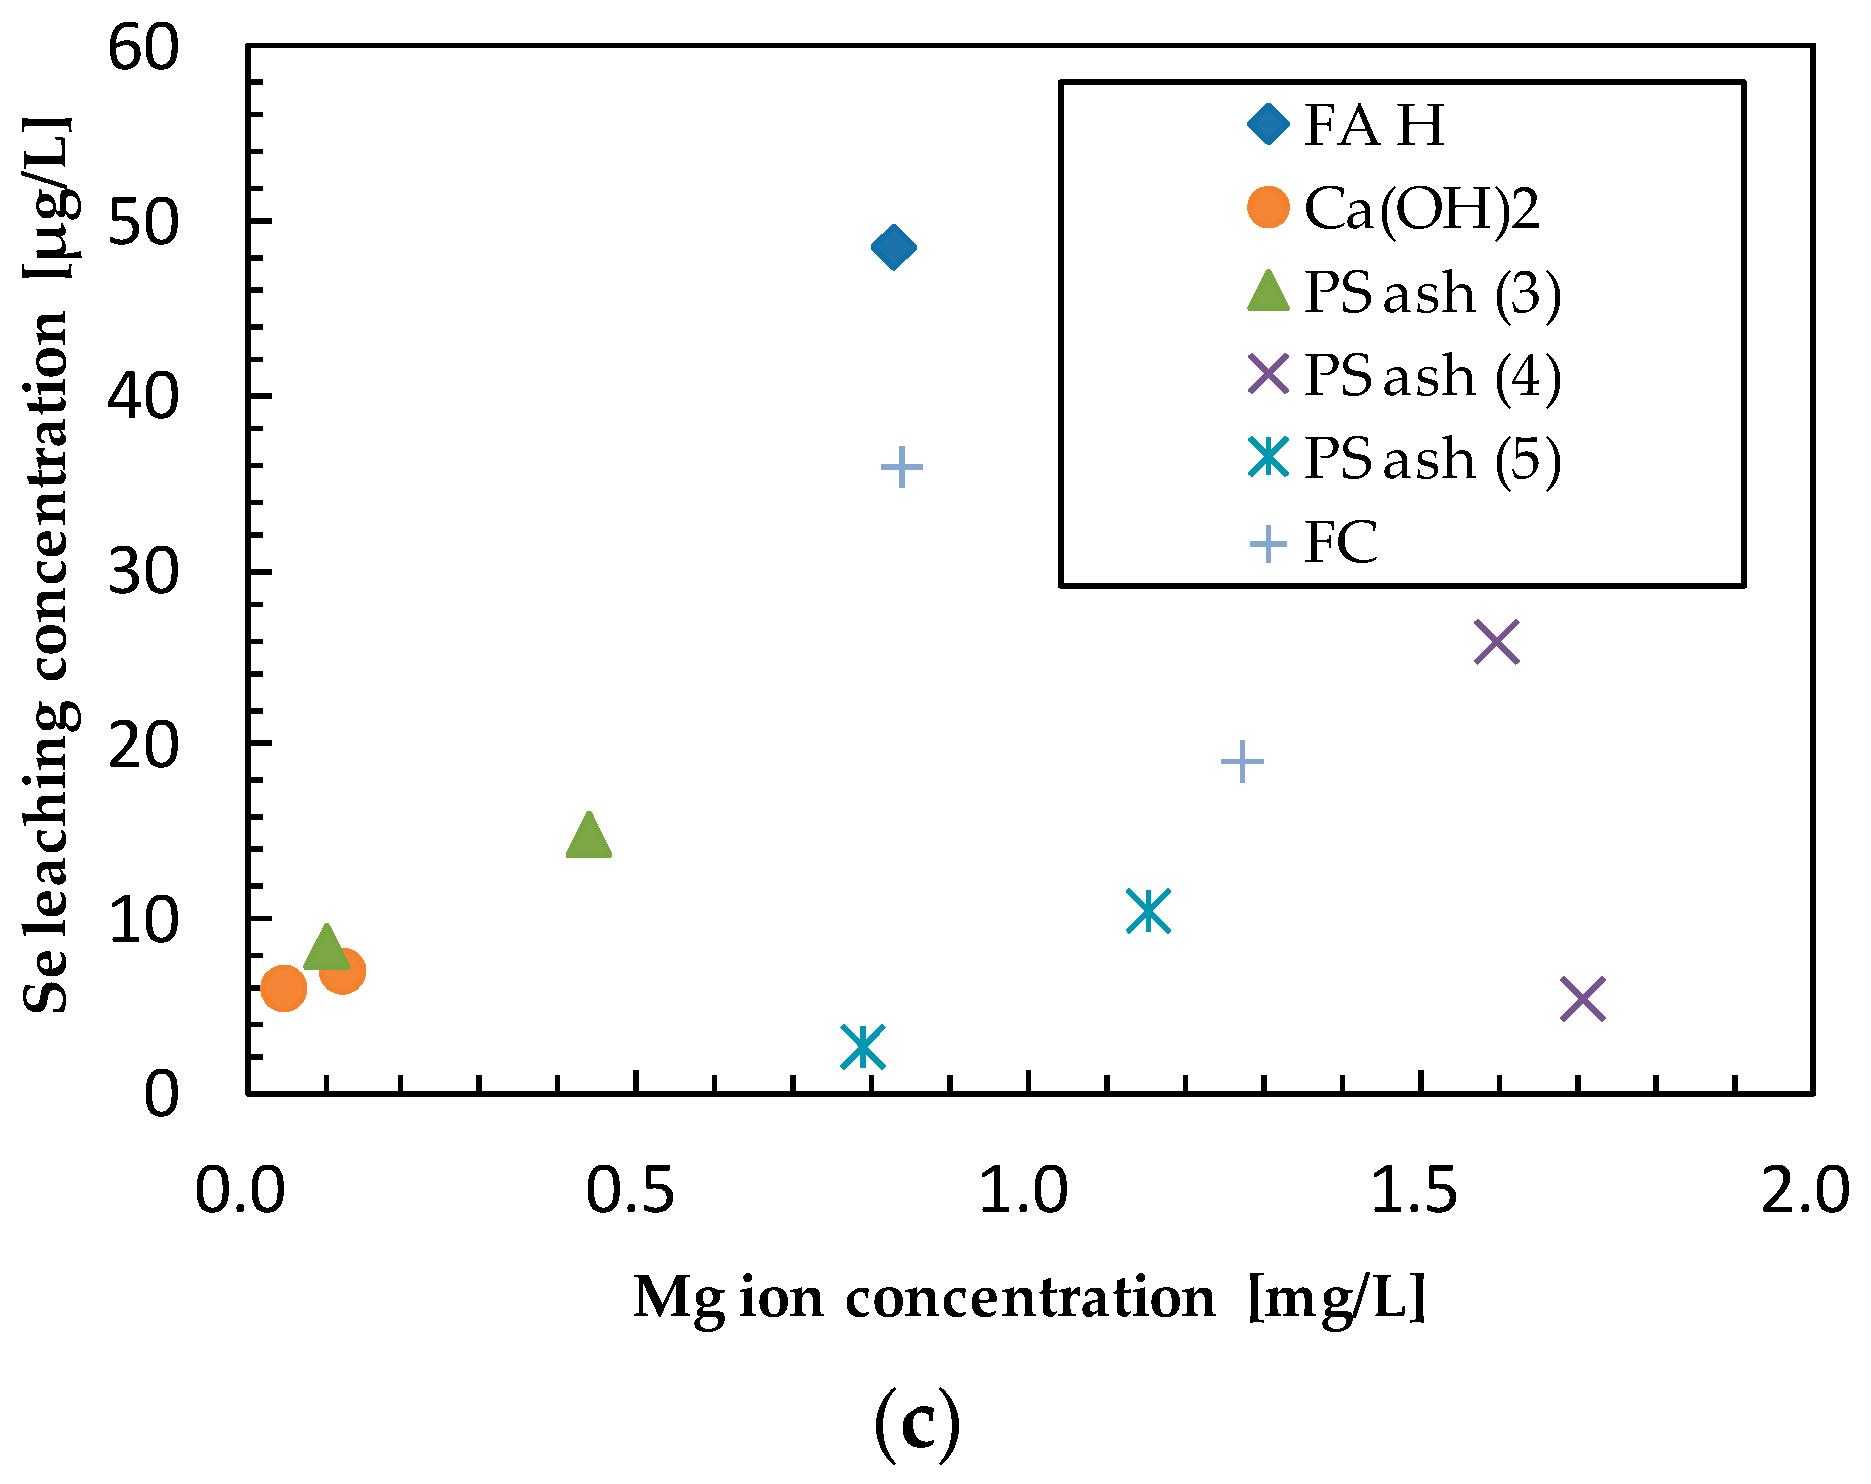
3.4. Effect of Additives on Selenium Leaching
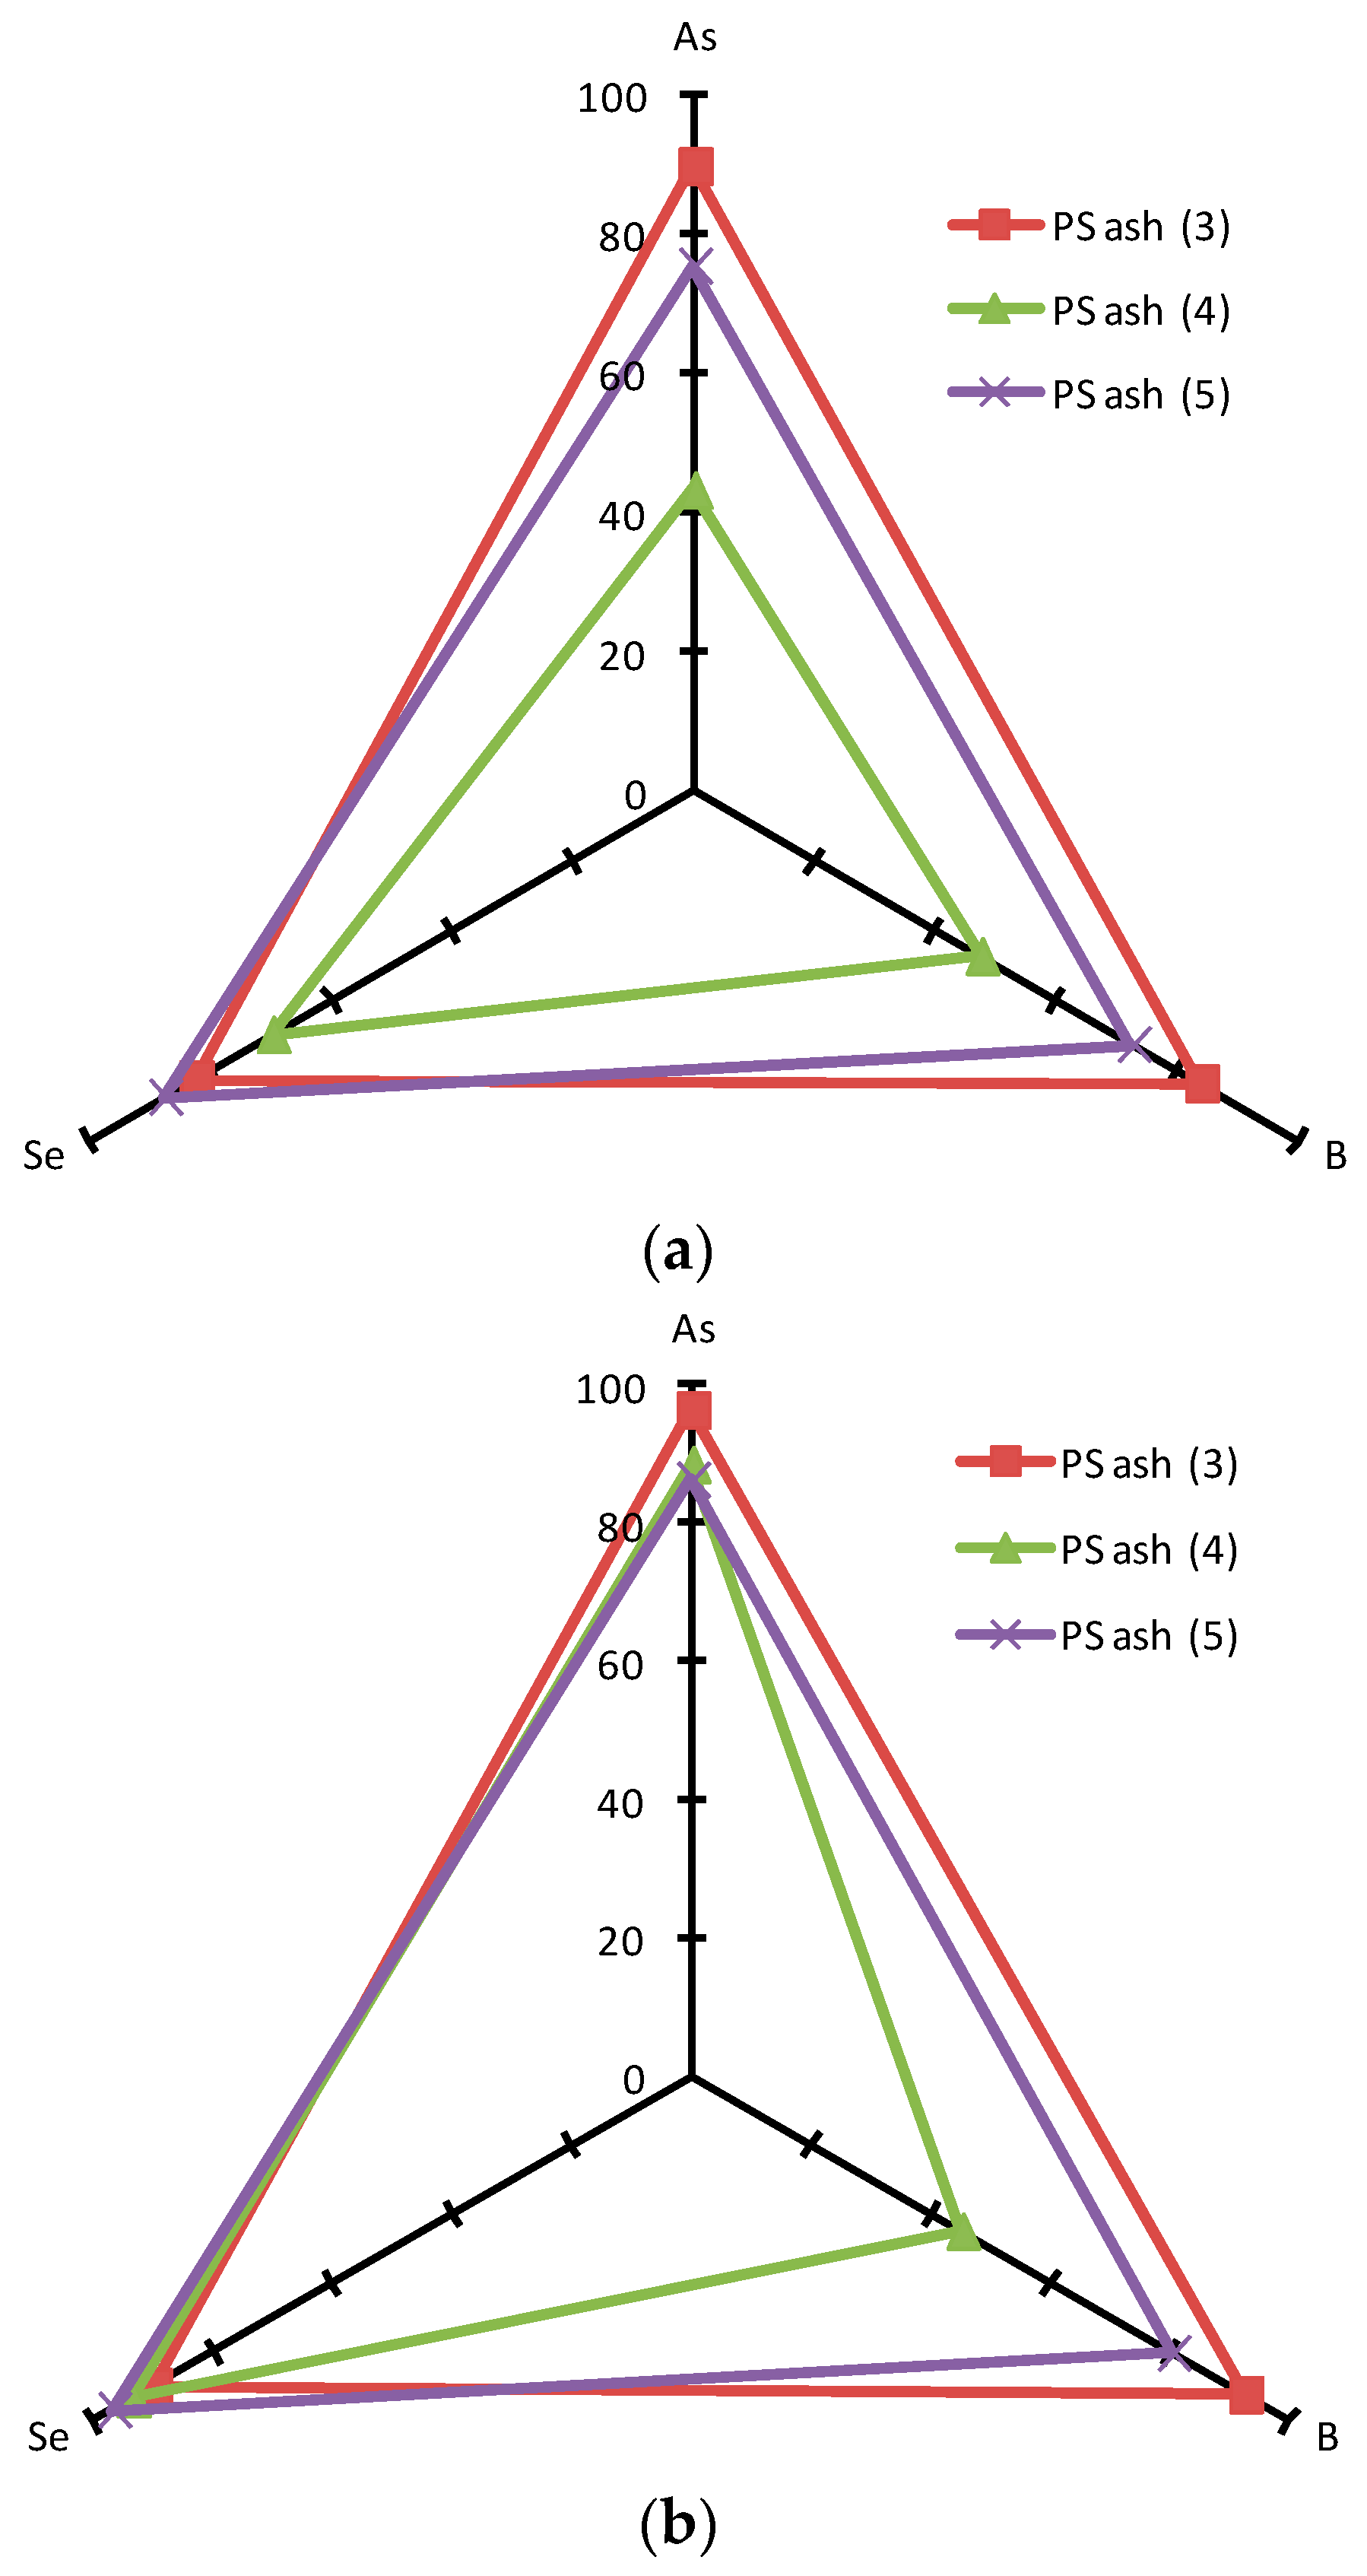
3.5. Comprehensive Evaluation of Leaching Suppression Materials
4. Conclusions
Acknowledgments
Author Contributions
Conflicts of Interest
Appendix A


References
- Merrick, D. Trace Elements from Coal Combustion: Emission; IEA Coal Research: London, UK, 1987. [Google Scholar]
- World-Wide Coal Combustion Products Network (WWCCPN). Available online: http://www.wwccpn.org/ (accessed on 31 March 2017).
- Jones, D.R. The Leaching of Major and Trace Elements from Coal Ash. In Environmental Aspects of Trace Elements in Coal; Swaine, D.J., Goodarzi, F., Eds.; Kluwer Academic Publishers: Dordrecht, The Netherlands, 1995; Volume 228, pp. 221–262. [Google Scholar]
- Baykal, G.; Edincliler, A.; Saygili, A. Highway embankment construction using fly ash in cold regions. Resour. Conversat. Recycl. 2004, 42, 209–222. [Google Scholar] [CrossRef]
- Edil, T.B.; Acosta, H.A.; Benson, C.H. Stabilizing soft fine-grained soils with fly ash. J. Mater. Civ. Eng. ASCE 2006, 18, 283–294. [Google Scholar] [CrossRef]
- Tastan, E.O.; Edil, T.B.; Benson, C.H.; Aydilek, A.H. Stabilization of organic soils with fly ash. J. Geotech. Geoenviron. Eng. ASCE 2011, 137–139, 819–833. [Google Scholar] [CrossRef]
- Bargagli, R. The elemental composition of vegetation and the possible incidence of soil contamination of samples. Sci. Total Environ. 1995, 176, 121–128. [Google Scholar] [CrossRef]
- Kondo, H.; Ishiguro, Y.; Ohno, K.; Nagase, M.; Toba, M.; Takagi, M. Naturally occurring arsenic in the groundwaters in the southern region of Fukuoka prefecture, Japan. Water Res. 1999, 33, 1967–1972. [Google Scholar] [CrossRef]
- Wegman, D.H.; Eisen, E.A.; Hu, X.; Woskie, S.R.; Smith, R.G.; Garabrant, D.H. Acute and chronic respiratory effects of sodium borate particulate exposures. Environ. Health Perspect. 1994, 102, 119–128. [Google Scholar] [CrossRef] [PubMed]
- U.S. Environmental Protection Agency (U.S. EPA). EPA’s Report on the Environment (Roe); U.S. EPA: Washington, DC, USA, 2008; EPA/600/R-07/045F (NTIS PB2008-112484).
- Jiao, F.; Ninomiya, Y.; Zhang, L.; Yamada, N.; Sato, A.; Dong, Z. Effect of coal blending on the leaching characteristics of arsenic in fly ash from fluidized bed coal combustion. Fuel Process. Technol. 2012, 106, 769–775. [Google Scholar] [CrossRef]
- Iwashita, A.; Sakaguchi, Y.; Nakajima, T.; Takanashi, H.; Ohki, A.; Kambara, S. Leaching characteristics of boron and selenium for various coal fly ashes. Fuel 2005, 84, 479–485. [Google Scholar] [CrossRef]
- Wang, T.; Wang, J.; Tang, Y.; Shi, H.; Ladwig, K. Leaching characteristics of arsenic and selenium from coal fly ash: Role of Calcium. Energy Fuel 2009, 23, 2959–2966. [Google Scholar] [CrossRef]
- Van der Hoek, E.E.; Bonouvrie, P.A.; Comans, R.N.J. Sorption of As and Se on mineral components of fly ash: Relevance for leaching processes. Appl. Geochem. 1994, 9, 403–412. [Google Scholar] [CrossRef]
- Van der Hoek, E.E.; Commans, R.N.J. Modelling As and Se leaching from acidic fly ash by sorption on iron (hydr) oxide in the fly ash matrix. Eniron. Sci. Technol. 1996, 30, 517–523. [Google Scholar] [CrossRef]
- Hartuti, S.; Kambara, S.; Takeyama, A.; Hanum, F.F. Leaching Characteristic of Arsenic in Coal Fly Ash. J. Mater. Sci. Eng. B 2017, 7, 19–26. [Google Scholar] [CrossRef][Green Version]
- Bothe, J.V., Jr.; Brown, P.W. Arsenic Immobilization by Calcium Arsenate formation. Environ. Sci. Technol. 1999, 33, 3806. [Google Scholar] [CrossRef]
- Parks, J.L.; Novak, J.; MacPhee, M.; Itle, C.; Edwards, M. Effect of Ca on As release from ferric and alum residuals. J. Am. Water Works Assoc. 2003, 95, 108–118. [Google Scholar]
- Warren, C.J.; Dudas, M.J. Leaching behavior of selected trace elements in chemically weathered alkaline fly ash. Sci. Total Environ. 1988, 76, 229–246. [Google Scholar] [CrossRef]
- Gitari, W.M.; Fatoba, O.O.; Petrik, L.F.; Vadapalli, W.R.K. Leaching characteristics of selected South African fly ashes: Effect of pH on the release of major and trace species. J. Environ. Sci. Health Part A 2009, 44, 206–220. [Google Scholar] [CrossRef] [PubMed]
- Quina, M.J.; Bordado, J.C.M.; Quinto-Ferreira, R.M. The influence of pH on the leaching behavior of inorganic components from municipal solid waste APC residues. Waste Manag. 2010, 29, 2483–2493. [Google Scholar] [CrossRef] [PubMed]
- Jankowski, J.; Colin, R.W.; French, D.; Groves, S. Mobility of trace elements from selected Australian fly ashes and its potential impact on aquatic ecosystems. Fuel 2006, 85, 243–256. [Google Scholar] [CrossRef]
- Mudd, G.M.; Weaver, T.R.; Kodikara, J. Environmental geochemistry of leachate from leached brown coal ash. J. Environ. Eng. 2004, 130, 1514–1526. [Google Scholar] [CrossRef]
- Johnson, C.A.; Kaeppeli, M.; Brandenberger, S.; Ulrich, A.; Bauman, W. Hydrological and geochemical factors affecting leachate composition in municipal solid waste incinerator bottom ash. Part II. The geochemistry of leachate from Landfill Lostorf, Switzerland. J. Contam. Hydrol. 1999, 40, 239–259. [Google Scholar] [CrossRef]
- Kato, M.; Hari, T.; Saito, S.; Shibukawa, M. Determination of free lime in steelmaking slags by use of ethylene glycol extraction/ICP-AES and thermogravimetry. Tetsu-to-Hagane 2014, 100, 340–345. [Google Scholar] [CrossRef][Green Version]
- Zelic, J.; Rusic, D.; Krstulovic, R. Kinetic analysis of thermal decomposition of Ca(OH)2 formed during hydration of commercial Portland cement by DSC. J. Therm. Anal. Cal. 2002, 67, 613–622. [Google Scholar]
- Lu, H.; Khan, A.; Smirniotis, P.G. Relationship between structural properties and CO2 capture performance of CaO-based sorbents obtained from different organometallic precursors. Ind. Eng. Chem. Res. 2008, 47, 6216–6220. [Google Scholar] [CrossRef]
- Killingley, J.; McEvoy, S.; Dokumcu, C.; Stauber, J.; Dale, L. Trace Element Leaching from Fly Ash from Australian Power Stations. End of Grant Report, Australian Coal Association Research Program, Project C8051, CSIRO Division of Energy Technology; Cooperative Research Centre for Black Coal Utilisation: Newcastle, Australia, 2000; p. 98. [Google Scholar]
- Elseewi, A.A.; Page, A.L.; Grimm, S.R. Chemical characterization of fly ash aqueous systems. J. Environ. Qual. 1980, 9, 424–428. [Google Scholar] [CrossRef]
- Hollis, J.F.; Keren, R.; Gal, M. Boron release and sorption by fly ash as affected by pH and particle sizes. J. Environ. Qual. 1988, 17, 181–185. [Google Scholar] [CrossRef]
- Cetin, B.; Aydilek, A.H. pH and fly ash type effect on trace metal leaching from embankment soils. Resour. Conserv. Recycl. 2013, 80, 107–117. [Google Scholar] [CrossRef]
- Izquierdo, M.; Koukouzas, N.; Touliou, S.; Panopoulos, K.; Querol, X.; Itskos, G. Geochemical controls on leaching of lignite-fired combustion by-products from Greece. Appl. Geochem. 2011, 26, 1599–1606. [Google Scholar] [CrossRef]
- Morar, D.; Aydilek, A.H.; Seagren, E.A.; Demirkan, M.M. Metal leaching from fly ash–sand reactive barriers. J. Environ. Eng. ASCE 2012, 138, 815–825. [Google Scholar] [CrossRef]
- Solen-Tishmack, J.K.; McCarthy, G.J.; Docktor, B.; Eylands, K.E.; Thompson, J.S.; Hassett, D.J. High-calcium coal combustion by-products: Engineering properties, ettringite formation, and potential application in solidification and stabilization of selenium and boron. Cem. Concr. Res. 1995, 25, 658–670. [Google Scholar] [CrossRef]
- Cervera, M.L.; Arnal, M.C.; de la Guardia, M. Removal of heavy metals by using adsorption on alumina or chitosan. Anal. Bioanal. Chem. 2003, 375, 820–825. [Google Scholar]
- Su, T.; Guan, X.H.; Gu, G.W.; Wang, J.M. Adsorption characteristics of As(V), Se(IV) and V(V) onto activated alumina: Effects of pH, surface loading, and ionic strength. J. Colloid Interface Sci. 2008, 326, 347–353. [Google Scholar] [CrossRef] [PubMed]
- Cornell, R.M.; Schwertmann, U. The Iron Oxides: Structure, Properties, Reactions, Occurrences and Uses, 2nd ed.; Wiley-VCH: Weinheim, Germany, 2003. [Google Scholar]


| Sample | FAH (1s) 1 | PS Ash 3 | PS Ash 4 | PS Ash 5 | FC | ||
|---|---|---|---|---|---|---|---|
| Ash Composition | SiO2 | [%] | 59.25 | 31.47 | 44.21 | 42.36 | 23.31 |
| Al2O3 | 25.63 | 12.40 | 22.23 | 19.80 | 13.87 | ||
| TiO2 | 1.99 | 0.38 | 2.56 | 2.11 | 0.06 | ||
| Fe2O3 | 7.49 | 5.13 | 2.63 | 5.56 | 2.33 | ||
| CaO | 2.05 | 46.31 | 18.77 | 19.51 | 59.18 | ||
| MgO | 0.79 | 3.28 | 3.42 | 3.30 | 0.96 | ||
| Na2O | 0.60 | 0.24 | 0.95 | 0.41 | 0.03 | ||
| K2O | 1.56 | 0.20 | 2.09 | 1.99 | 0.25 | ||
| P2O5 | 0.18 | 0.18 | 1.75 | 1.54 | 0.00 | ||
| MnO | - | 0.03 | 0.05 | 0.06 | 0.04 | ||
| V2O5 | 0.03 | 0.01 | 0.02 | 0.02 | 0.02 | ||
| SO3 | 0.42 | 0.36 | 1.31 | 3.33 | 0.00 | ||
| pH of the leachate | 10.38 | 13.72 | 12.71 | 12.26 | 7.28 | ||
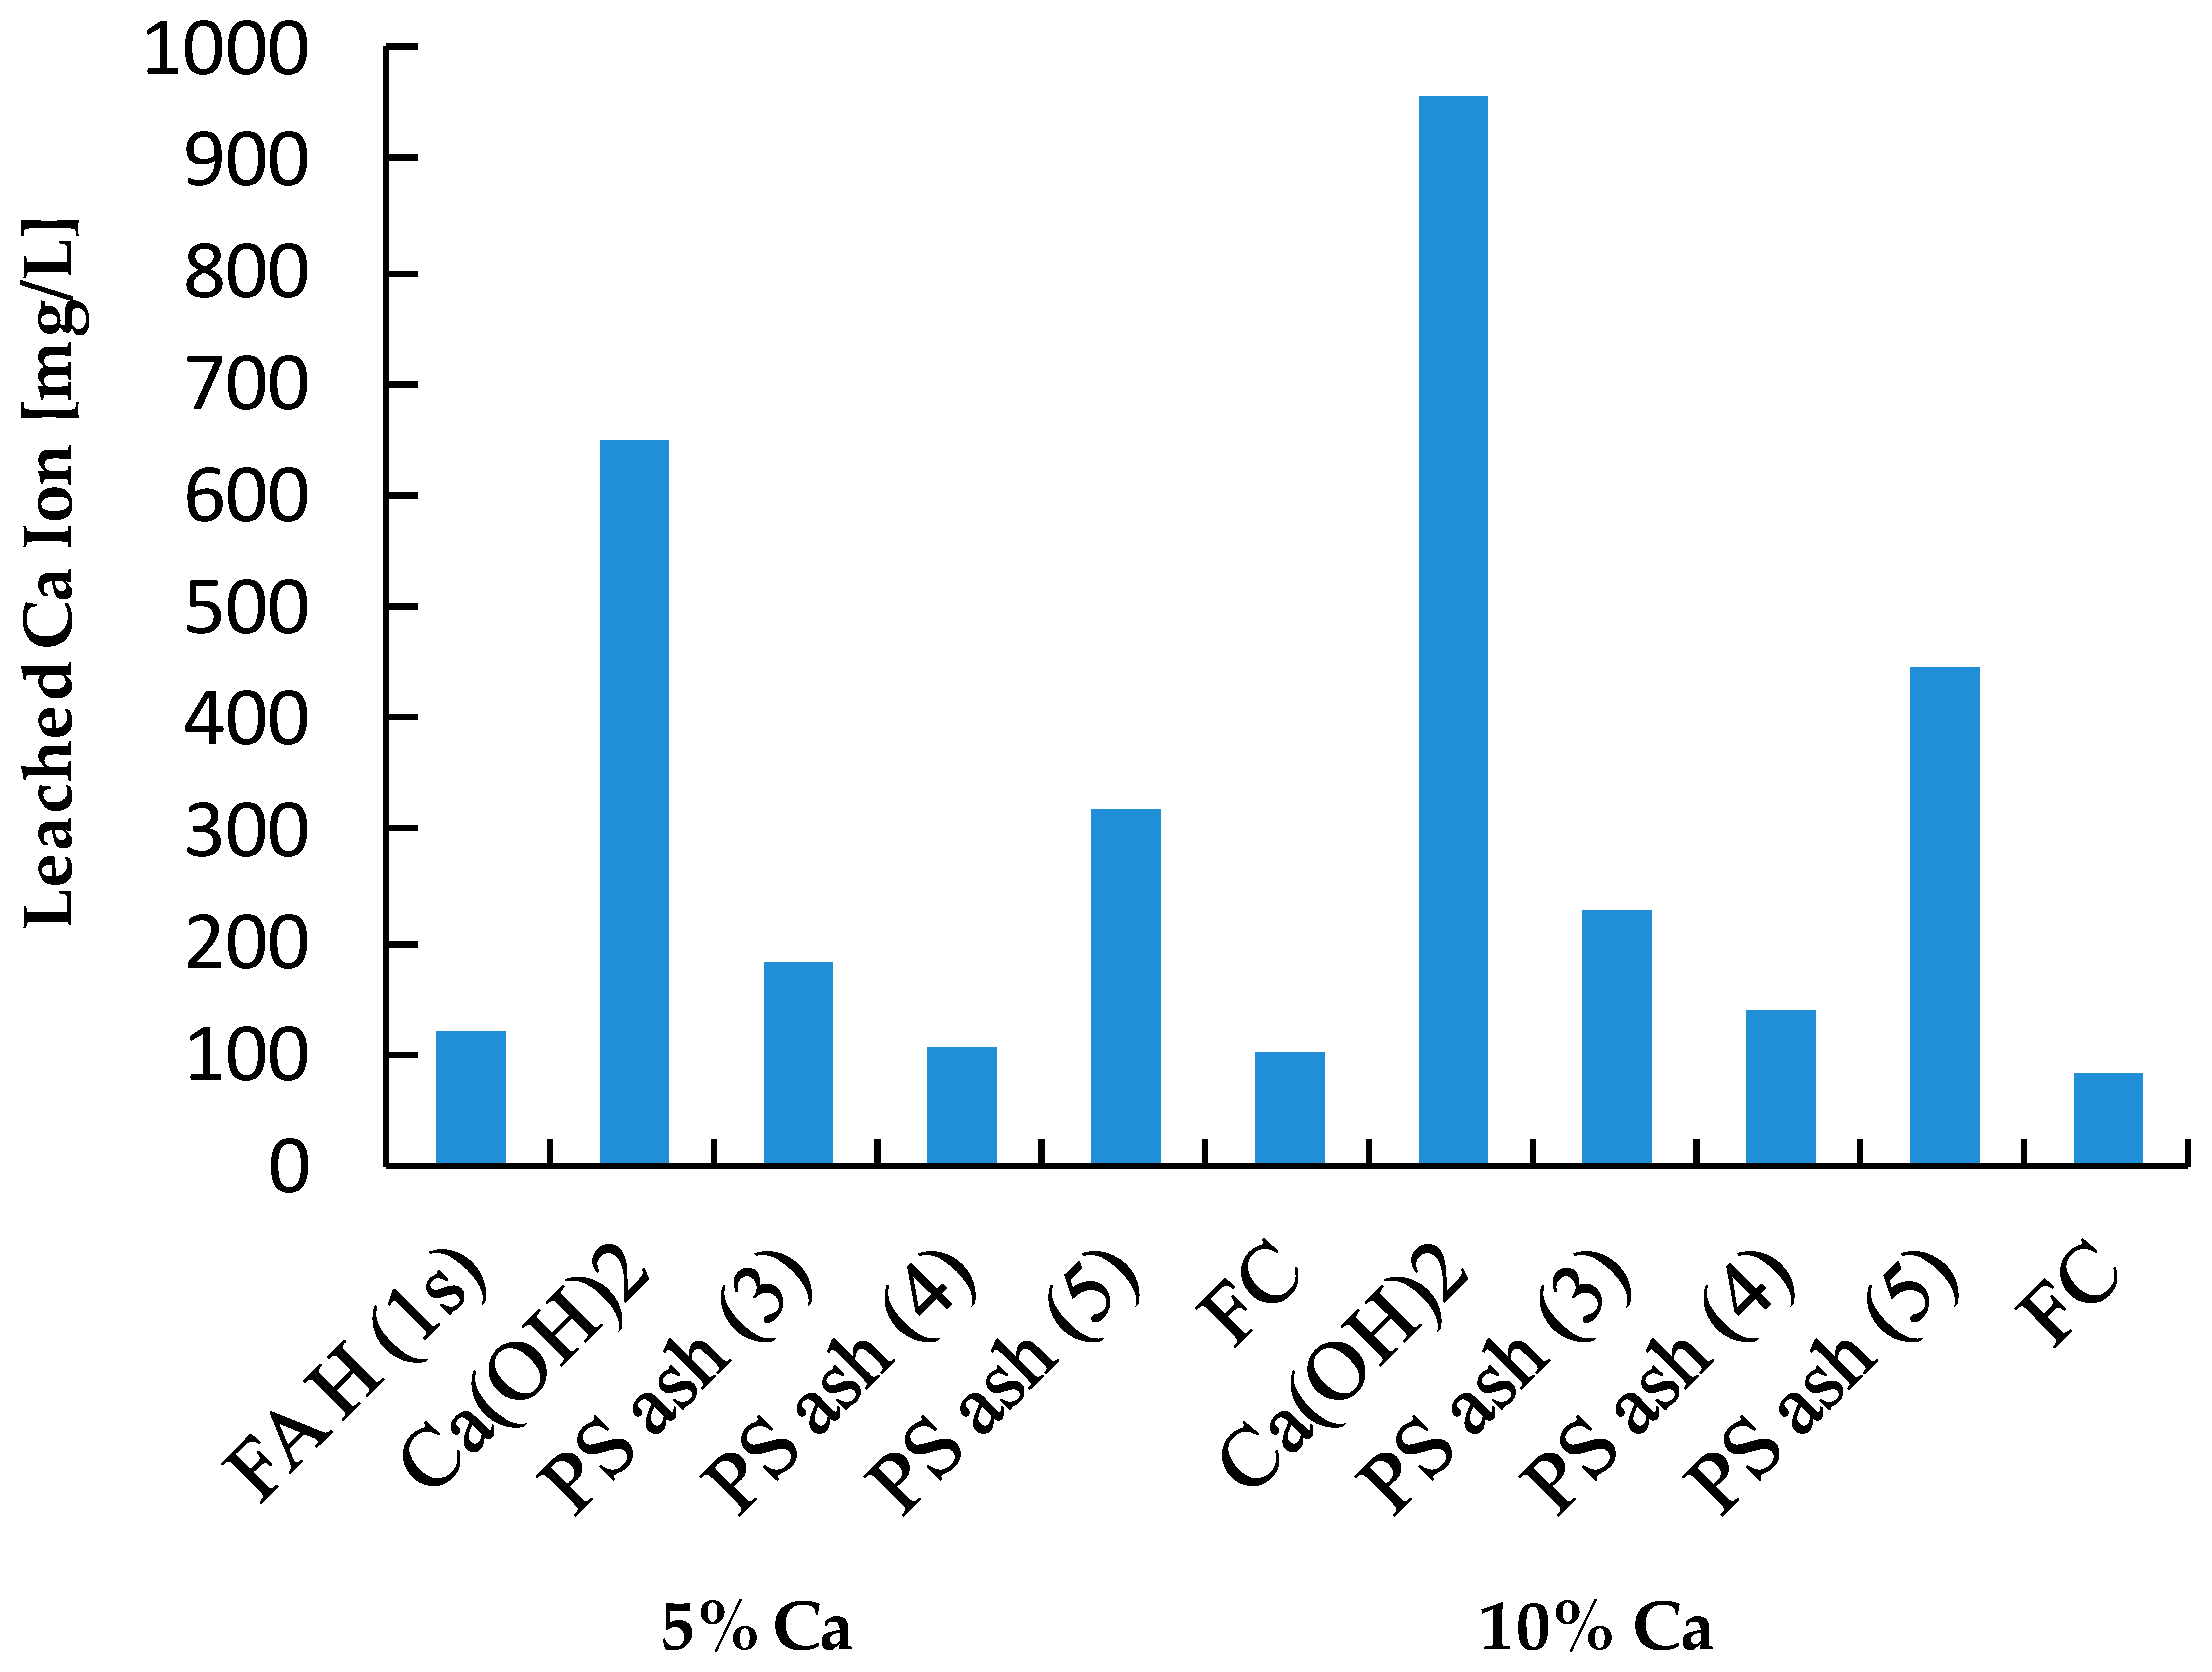
| Leached Ca Ion | [mg/L] | 121 | 1405 | 246.5 | 597 | 15.45 | |
| Leaching Concentration | As | [µg/L] | 48.66 | ||||
| B | [mg/L] | 5.39 | |||||
| Se | [µg/L] | 86.9 | |||||
| Sample | Ca (wt%) | As leach. conc. 1 (µg/L) | L.I.R 2 (%) | B leach. conc. (mg/L) | L.I.R (%) | Se leach. conc. (µg/L) | L.I.R (%) | Final pH |
|---|---|---|---|---|---|---|---|---|
| FA H (1s) | 1.46 | 48.66 | 0.0 | 5.39 | 0.0 | 86.39 | 0.0 | 10.38 |
| Ca(OH)2 | 5 | 1.26 | 97.4 | 0.10 | 98.1 | 7.15 | 91.7 | 12.86 |
| PS Ash 3 | 5 | 5.12 | 89.5 | 0.87 | 83.9 | 15.00 | 82.6 | 11.58 |
| PS Ash 4 | 5 | 27.71 | 43.1 | 2.83 | 47.5 | 26.04 | 69.9 | 10.46 |
| PS Ash 5 | 5 | 12.06 | 75.2 | 1.48 | 72.6 | 10.60 | 87.7 | 10.63 |
| FC | 5 | 57.75 | −18.7 | 5.55 | −3.0 | 36.04 | 58.3 | 9.66 |
| Ca(OH)2 | 10 | 0.00 | 100.0 | 0.10 | 98.2 | 6.16 | 92.9 | 12.98 |
| PS Ash 3 | 10 | 1.84 | 96.2 | 0.41 | 92.4 | 8.57 | 90.1 | 11.94 |
| PS Ash 4 | 10 | 5.66 | 88.4 | 2.96 | 45.1 | 5.54 | 93.6 | 10.62 |
| PS Ash 5 | 10 | 6.71 | 86.2 | 1.06 | 80.3 | 2.80 | 96.8 | 10.51 |
| FC | 10 | 65.29 | −34.2 | 5.34 | 1.0 | 19.19 | 77.8 | 9.23 |
© 2017 by the authors. Licensee MDPI, Basel, Switzerland. This article is an open access article distributed under the terms and conditions of the Creative Commons Attribution (CC BY) license (http://creativecommons.org/licenses/by/4.0/).
Share and Cite
Hartuti, S.; Fadhillah Hanum, F.; Takeyama, A.; Kambara, S. Effect of Additives on Arsenic, Boron and Selenium Leaching from Coal Fly Ash. Minerals 2017, 7, 99. https://doi.org/10.3390/min7060099
Hartuti S, Fadhillah Hanum F, Takeyama A, Kambara S. Effect of Additives on Arsenic, Boron and Selenium Leaching from Coal Fly Ash. Minerals. 2017; 7(6):99. https://doi.org/10.3390/min7060099
Chicago/Turabian StyleHartuti, Sri, Farrah Fadhillah Hanum, Akihiro Takeyama, and Shinji Kambara. 2017. "Effect of Additives on Arsenic, Boron and Selenium Leaching from Coal Fly Ash" Minerals 7, no. 6: 99. https://doi.org/10.3390/min7060099
APA StyleHartuti, S., Fadhillah Hanum, F., Takeyama, A., & Kambara, S. (2017). Effect of Additives on Arsenic, Boron and Selenium Leaching from Coal Fly Ash. Minerals, 7(6), 99. https://doi.org/10.3390/min7060099