
Relating the Mineralogical Characteristics of Tampakan Ore to Enargite Separation


1
Julius Kruttschnitt Mineral Research Centre, The University of Queensland, Indooroopilly, QLD 4068, Australia
2
CSIRO, Mineral Resources, Clayton, VIC 3168, Australia
*
Author to whom correspondence should be addressed.
Minerals 2017, 7(5), 77; https://doi.org/10.3390/min7050077
Submission received: 11 March 2017
/
Revised: 5 May 2017
/
Accepted: 9 May 2017
/
Published: 12 May 2017
Abstract
:The mineralogical characteristics of enargite-bearing copper ores from the Tampakan deposit have been investigated as the means to understanding the separation of enargite from other copper sulphides (chalcopyrite and bornite). It was found that a separation of these minerals was possible after grinding the ore samples to a P80 of 90 microns; enargite tends to be ground more readily than the other copper sulphide minerals present in ore samples tested, and consequently, it mostly reported to the fine size fractions.
1. Introduction
Enargite (Cu3AsS4) is an important copper mineral due to the amount of copper it contains and, also, the detrimental environmental impact associated with its arsenic content [1,2,3]. High financial penalties are imposed by smelters to treat copper concentrates containing greater than 0.2% of arsenic and the rejection limit for smelters is 0.5% of arsenic [4]. One accepted method is to produce two products by flotation; one high copper/low arsenic, which can be treated safely by smelting and a second product, high arsenic/low copper, which can be treated safely by special pyro- or hydro-metallurgical routes. These latter processes will also deliver the arsenic in a manageable product [5,6]. Recent research studies have been focused on the possibility for separation of arsenic-bearing copper minerals (enargite and tennantite) from other copper sulphides using froth flotation [5,6,7,8,9]. Controlled pulp potential (Eh) flotation was found to be a prospective approach to promote the separation of the arsenic-copper minerals from the other copper sulphides due to the strong Eh dependence of arsenic mineral flotation [5,6,7,8,10,11,12,13,14,15]. However it has been identified that the efficiency of the separation strongly depends on the mineralogical characteristics of the ore samples [6,16,17,18,19]. The mineralogy and the liberation of ore are the important factors affecting the separation efficiency of the beneficiation process. The aim of this research was to find any possible ways which can be used to enhance the separation of enargite from other copper sulphides. In this regard we looked at the mineralogical characteristics of enargite-bearing copper ores in terms of mineral liberation, size distribution, and mineral grain size.
High recovery and grade are the ultimate goals for all mineral processing plants and these are influenced by the liberation of minerals of interest in the ground ore samples [20,21]. The minerals of interest are ground to a degree of liberation determined to be suitable for the subsequent separation process [22]. The ore being broken consists of mineral grains and the main characteristics that influence ore breakage and mineral liberation are the mineral grain sizes and bonding between the grains [20,23]. This kind of liberation by comminution, which is being influenced by ore texture and grain boundaries, is called non-random breakage [24]. Different types of non-random breakage have been identified such as preferential breakage, selective breakage, differential breakage, etc. [25,26]. Preferential breakage of the valuable mineral over that of the gangue minerals in a feed is beneficial as it provides the opportunity for more efficient separation in flotation processes with minimum energy use [27].
2. Materials and Methods
The ore samples used in this study were supplied from the Tampakan copper-gold deposit located in the SE part of Mindanao in the Philippines. This porphyry copper deposit is estimated to have 1340 million tonnes of ore with an average grade of 0.66% Cu and 0.27 g/t Au. It also has significant levels of arsenic as enargite (Cu3AsS4) [7,28].
A composite of several high arsenic-containing drill core intersections for a high-arsenic sample (HAS), and a composite of some low arsenic-containing drill core intersections for a low-arsenic sample (LAS), were selected to provide a range of arsenic levels. The HAS and the LAS samples were treated as individual ore samples, and were measured and analysed individually.
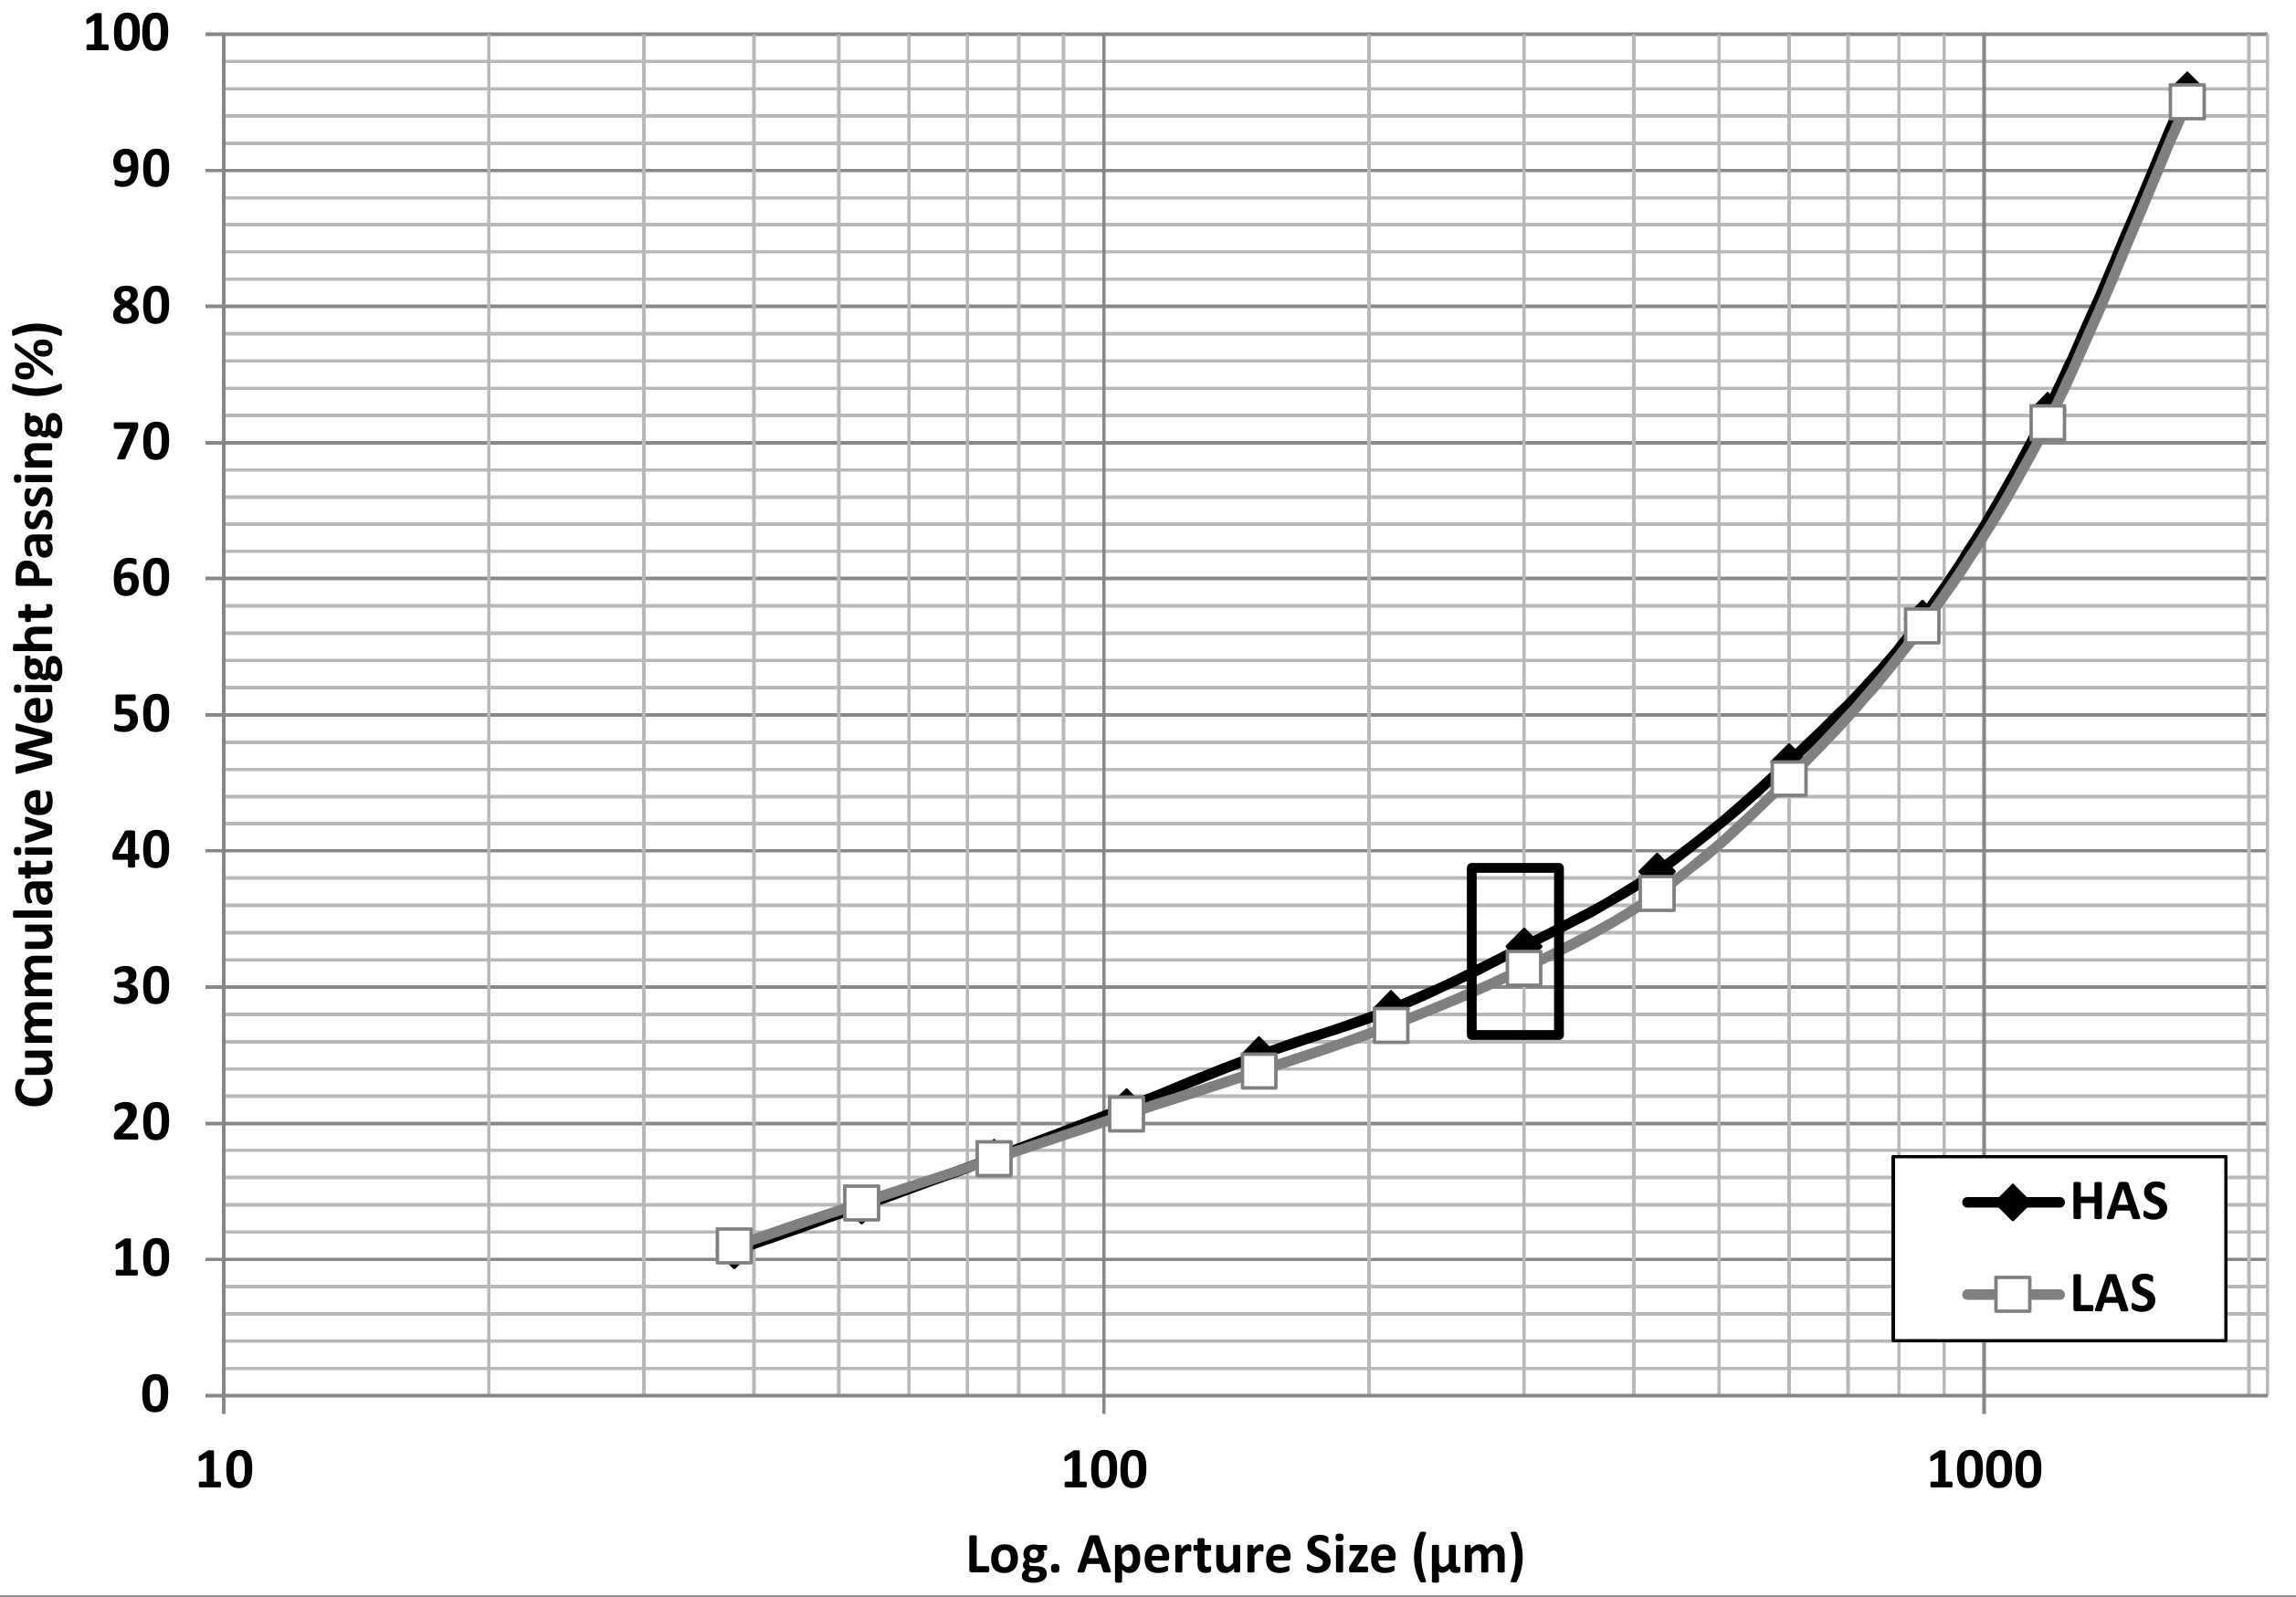
The HAS and the LAS drill core samples were crushed to −1.7 mm, homogenised, and split into replicate sub-samples of approximately 500 g mass using a rotary splitter. A sub-sample of HAS and LAS ore samples was sieved into different size intervals and the size fraction (−425/+300 µm) was chosen for mineralogical analysis using a MLA (mineral liberation analyser). This size fraction was chosen in order to preserve the texture in the HAS and the LAS ore samples and maximise the number of particles to be measured. The size distribution of the samples after crushing and the selected size fraction for the MLA analysis are presented in Figure 1. The HAS and the LAS samples show a similar size distribution after crushing. Figure 2 and Figure 3 present examples of the MLA images of different particles in the −425/+300 µm size fraction of the HAS and the LAS ore samples. The MLA analysis on these ore samples (−425/+300 µm) indicated that there are similarities in terms of mineral content and liberation; however, there are some differences in the proportions of minerals present.
Sub-samples of HAS and LAS crushed ore samples were ground in a laboratory ball mill to achieve a P80 of 90 µm. Sub-samples of the HAS and LAS ground samples (mill products) were sized using a combination of wet and dry sieving and cyclosizing, and each size fraction was analysed using ICP-AES (inductively-coupled plasma atomic emission spectrophotometry) and MLA. The method of MLA measurement was the MLA XBSE technique (X-ray backscattered electron image), which uses the back-scattered electron image to define each grain in the polished section and identify the minerals in each grain from its characteristic X-ray spectrum [29,30].
The raw data files generated from the measurements of the feed samples were analysed using MLA Dataview software (FEI, Hillsboro, OR, USA). The data collected for each size fraction were combined according to their mass proportions as follows: +106, −106 + 53, −53 + 32, −32 + 11, and −11 µm. It should be mentioned that the cyclosizer cut sizes for the samples have been determined using the measured solids SG (Specific Gravity) of the samples, cycle time, water temperature, and a rotameter reading, as per standard operating procedure.
3. Results
3.1. Chemical Analysis
The head assay results showed that the arsenic in the HAS sample is practically two times higher than that for the LAS, assaying about 230 ppm, confirming that a range of arsenic values were present in the samples received. The copper assay was slightly greater in the HAS sample compared to the LAS sample (0.64% vs. 0.57%).
The calculated elemental assays from the MLA data have been compared to the size-by-size chemical assay data for quality control purposes. The plotted elemental assay for Cu, Fe, S, and As from MLA and ICP-AES for both the HAS and the LAS samples on a size-by-size basis are shown in Figure 4. The data shows excellent agreement for copper, iron, sulphur, and arsenic assays between the two techniques that confirmed the high quality of the MLA measurement on the samples. It was observed that the error in the measurements from the MLA data is increasing in the very low assay minerals.
3.2. Mineralogy Characteristics on the Ground Products
MLA analysed a total of 935,172 grains within 420,158 particles for the HAS and 865,319 grains within 470,168 particles for the LAS sample (Table 1).
3.2.1. Modal Mineralogy
The overall modal mineralogy (the weight percent of minerals present in the ore sample) of the HAS and the LAS samples is summarised in Table 2. The main copper minerals are bornite (Cu5Fe2S4) and chalcopyrite (CuFeS2), which represent about 75% of the copper in each ore. The remaining copper is present as enargite (Cu3AsS4), digenite (Cu9S5), covellite (CuS), and tetrahedrite ((Cu,Fe)12Sb4S13). The dominance of chalcopyrite and bornite as the major copper minerals, with only small proportions of the total copper present in other minerals simplifies the investigation of the ore, since it is reasonable to assume that chalcopyrite and bornite alone will best describe the copper mineral response in liberation. Hence, the copper sulphide minerals, except enargite, are presented as one group, named NECu (non-enargite copper minerals).
It can be seen that the major difference between the two samples is the proportion of the gangue minerals. The sulphide gangue consists of pyrite with 5.36% and 3.30% in the HAS and the LAS samples, respectively. Quartz, muscovite, pyrophyllite, diaspore, and kaolinite are the major non-sulphide gangue minerals (NSG). The results show that the total amount of phyllosilicates, which include muscovite, kaolinite, and pyrophyllite in the LAS sample, is higher than that in the HAS sample, 36.2 vs. 23 wt %, respectively. Muscovite content is about four times higher (28.7%) in the LAS sample than in the HAS sample, however, the LAS sample contains less pyrophyllite and little kaolinite compared to the HAS sample. The amount of diaspore in the HAS is greater than that in the LAS sample as well.
3.2.2. Mineral Distributions
The weight and gangue mineral distributions in the HAS and the LAS samples in the different size fractions are presented in Figure 5 and Figure 6. It can be seen that the mass distribution for the HAS and the LAS samples (left-hand graphs) have similar trends; the major proportion of each sample (ca. 30%) reports to the −106 + 53 µm size fraction and the size fraction +106 µm has the lowest proportion of sample mass (ca. 13%). The major proportion of the phyllosilicates reported to the −11 µm size fraction in both samples and pyrite is mostly (about 70%) present in the medium-sized range (−106 + 53 and −53 + 32 µm) in both samples.
The right-hand graphs in Figure 5 and Figure 6 present the distributions of NECu and enargite in both samples. The distribution of NECu show similar trends in both samples, as shown by the graph of NECu distribution across the various particle size fractions.
Figure 7 shows the NECu and enargite distribution in the HAS and the LAS samples. In both samples, the +106 µm fraction contains the lowest proportion of NECu and enargite with less than 13%. It can be seen that NECu minerals are mostly distributed in medium-sized fractions (−106 + 53 and −53 + 32 µm) in both samples. In contrast, the proportion of enargite in the very fine size fraction −11 µm is relatively high in both samples; 21% in the HAS and 17% in the LAS sample.
By comparing the distributions of enargite and NECu in different size fractions, it can be seen the amount of enargite in the fine size is noticeably greater than the amount of NECu. The proportion of NECu is higher than that of enargite in the coarser size fractions (+106, −106 + 53, and −53 + 32 µm), while in the finer size fractions (−32 + 11 and −11 µm) enargite distribution is greater than NECu. This trend is similar in both the HAS and the LAS samples. It shows that enargite tends to be ground more readily than the other copper sulphide minerals. The tendency for enargite to grind readily has been noted earlier [7].
This is believed that sulphide minerals often undergo selective or preferential breakage (both forms of non-random breakage) during comminution, resulting in an increased concentration of sulphides in finer, higher-grade particles [20]. However, in terms of enargite particles, the difference in size-by-size mineral distribution between enargite and NECu minerals is assumed to occur because enargite is being broken preferentially when these ores were ground.
Preferential breakage occurs when crack branching happens more often in one mineral than in the others, which results in a higher amount of that mineral in the finer sizes after the breakage event [22,25]. Many researchers have used the variation of mineral content with size to indicate the occurrence of preferential breakage. Fandrich, et al. [26] noted that higher average volumetric grades of the coarser product sizes, compared to the finer product sizes is an indication of the presence of preferential breakage. King and Schneider [25] stated that the occurrence of preferential breakage can be identified by plotting the size-by-size mineral assay which will indicate if a higher proportion of the mineral fractures preferentially to the finer sizes.
3.2.3. Mineral Liberation
Daniel [31] recommended the potential application of mineral liberation analysis extracted by MLA data. Stephenson [32] identified preferential breakage by using the cumulative liberation yield and suggested that the preferential breakage could be identified when the proportion of particles containing the mineral of interest in a particular size fraction exceeds a preset level of liberation.
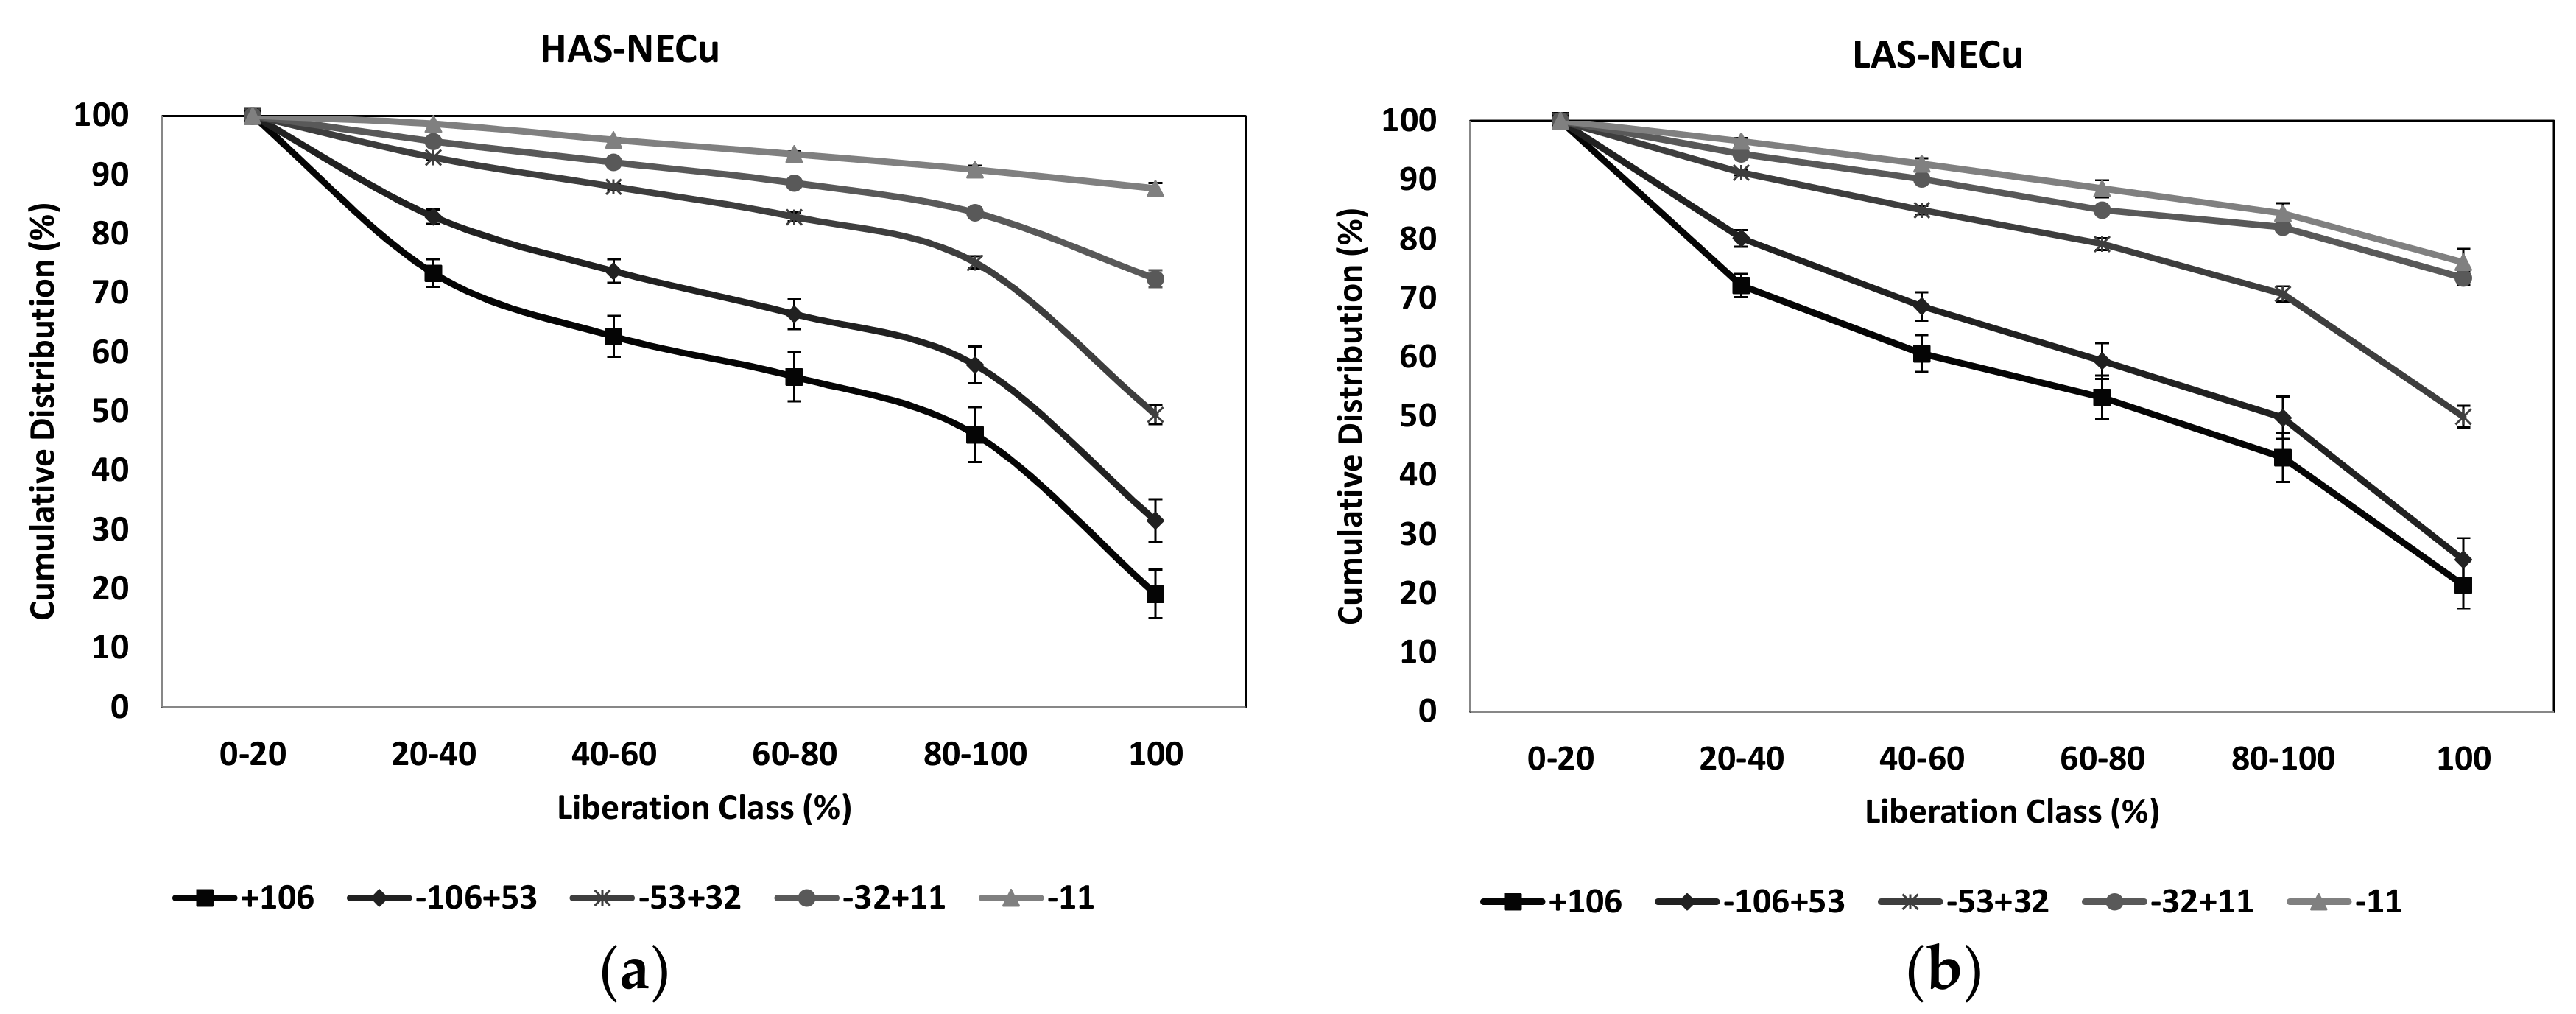
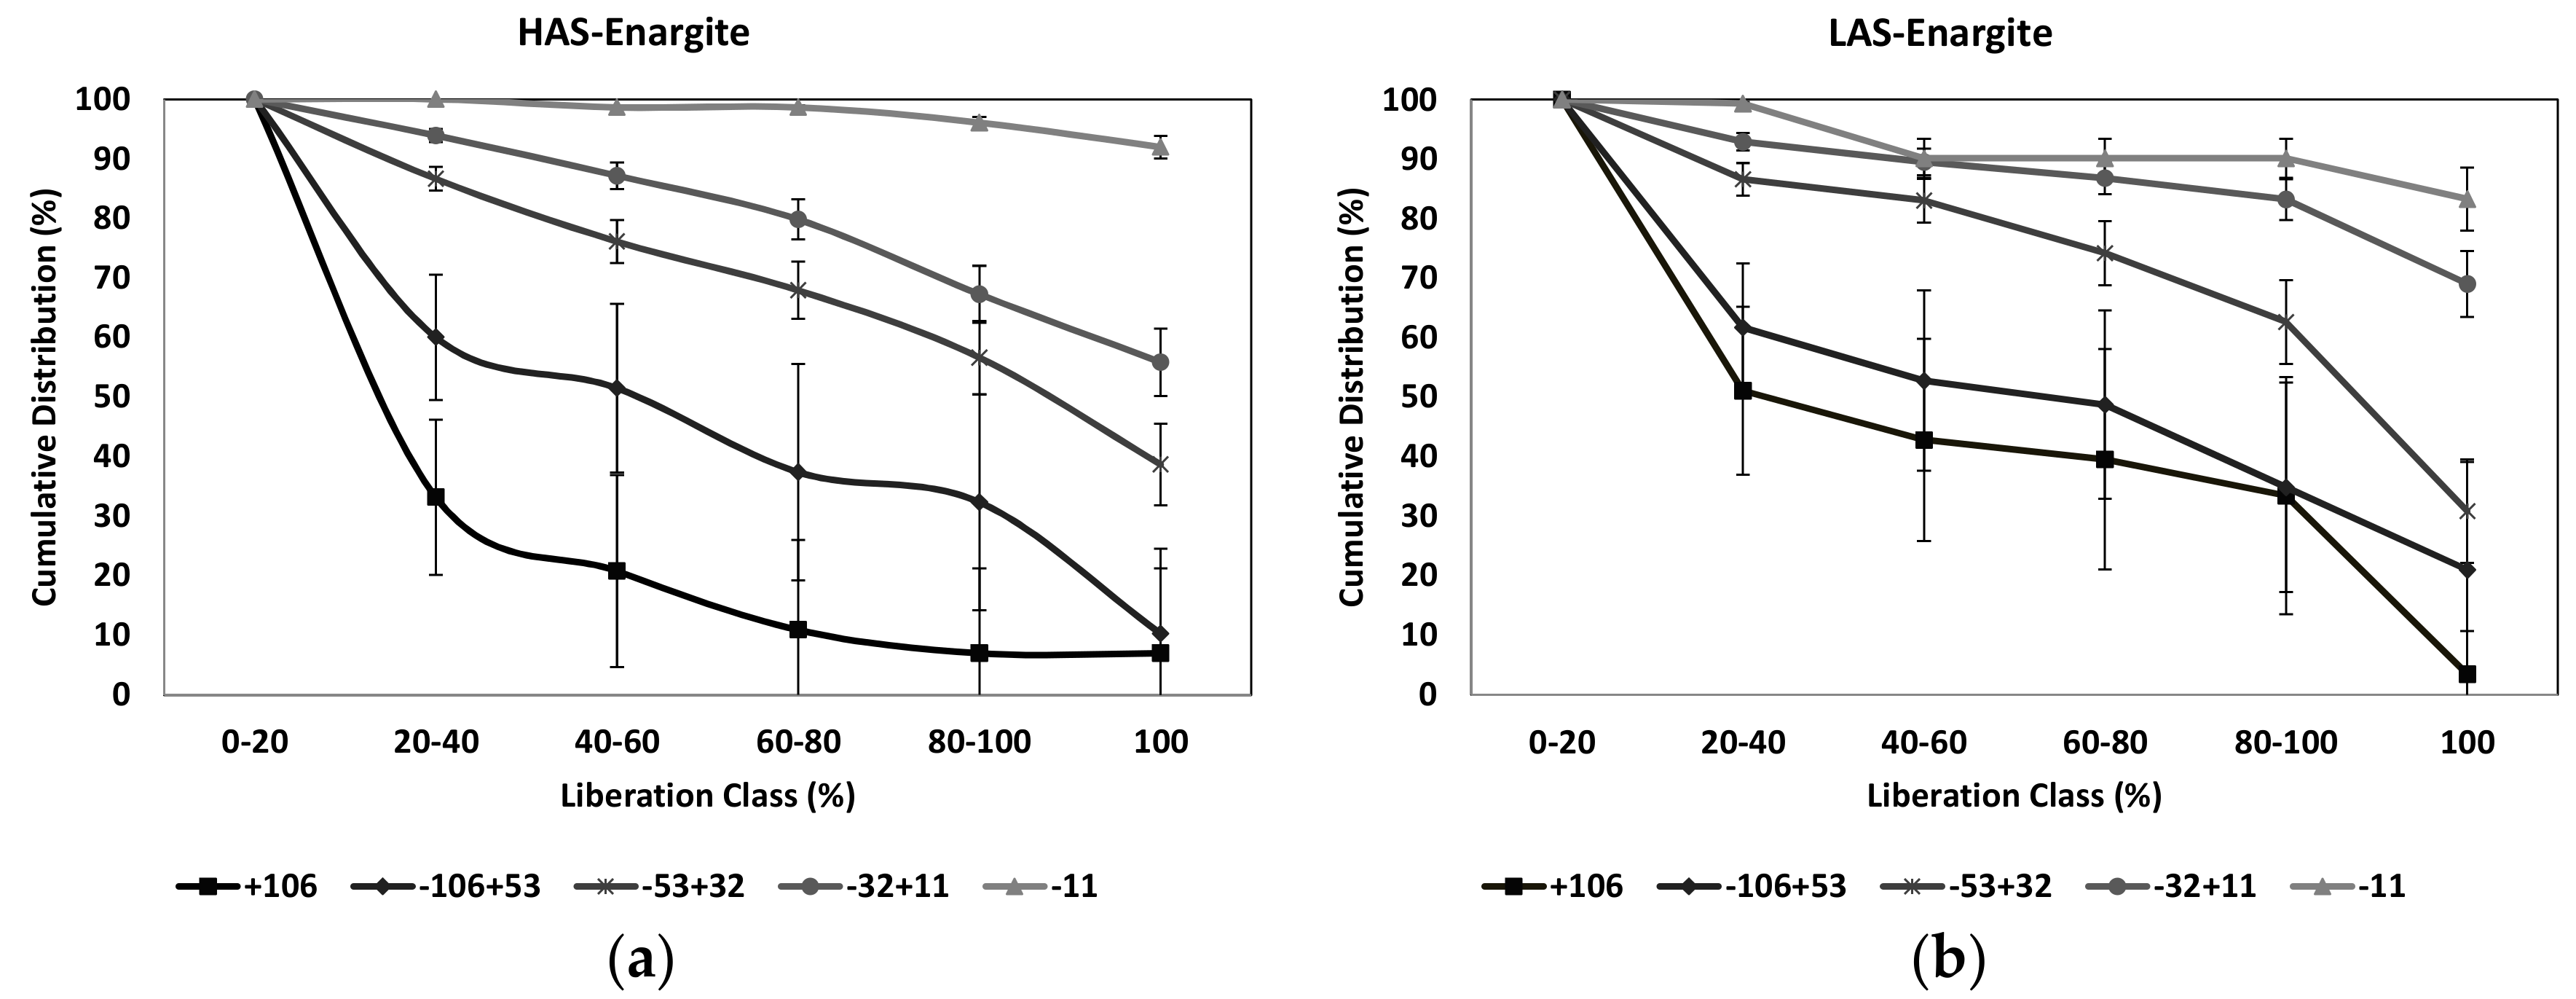
The liberation distributions for combined non-enargite copper minerals (NECu) and enargite-bearing particles are shown in Figure 8 and Figure 9. These results were obtained from MLA analyses of size fractions of ground samples of the HAS and the LAS samples. The liberation distribution data are plotted as cumulative curves or cumulative liberation yield curves. The confidence limits were calculated using Equation (1) developed by Leigh, et al. [33] to assist in comparisons of these data:
YC is the cumulative liberation yield at composition C expressed as a proportion, N0 is the number of particles with the composition less than C, and N1 is the number of particles with the composition at least C. The confidence limits on YC were then calculated using Equation (2) [34]:
In general, the liberation distribution of NECu and enargite in each of the particle size fractions follows a similar trend across both samples and increases as the particle size decreases. The cumulative liberation distribution of enargite shows that the confidence limits for the size fractions +106 and −106 + 53 µm are relatively wide due to the small numbers of particles containing enargite in these size fractions. In contrast, for the smaller size fractions the number of particles measured in each composition class increased to a level where the confidence limits were sufficiently narrow.
The shape of the different curves is related to the amount of the 100% liberation class. If the number of particles in the 100% liberation class is low, the curve shows a sharp increase toward the 80–100% liberation class; however, curves with a higher starting point show a smoother rise. The liberation data show that the liberation of the minerals increases as the particle size decreases, and in the finest size fraction, −11 µm, more than 90% of the mineral grains are fully liberated.
3.2.4. Mineral Association
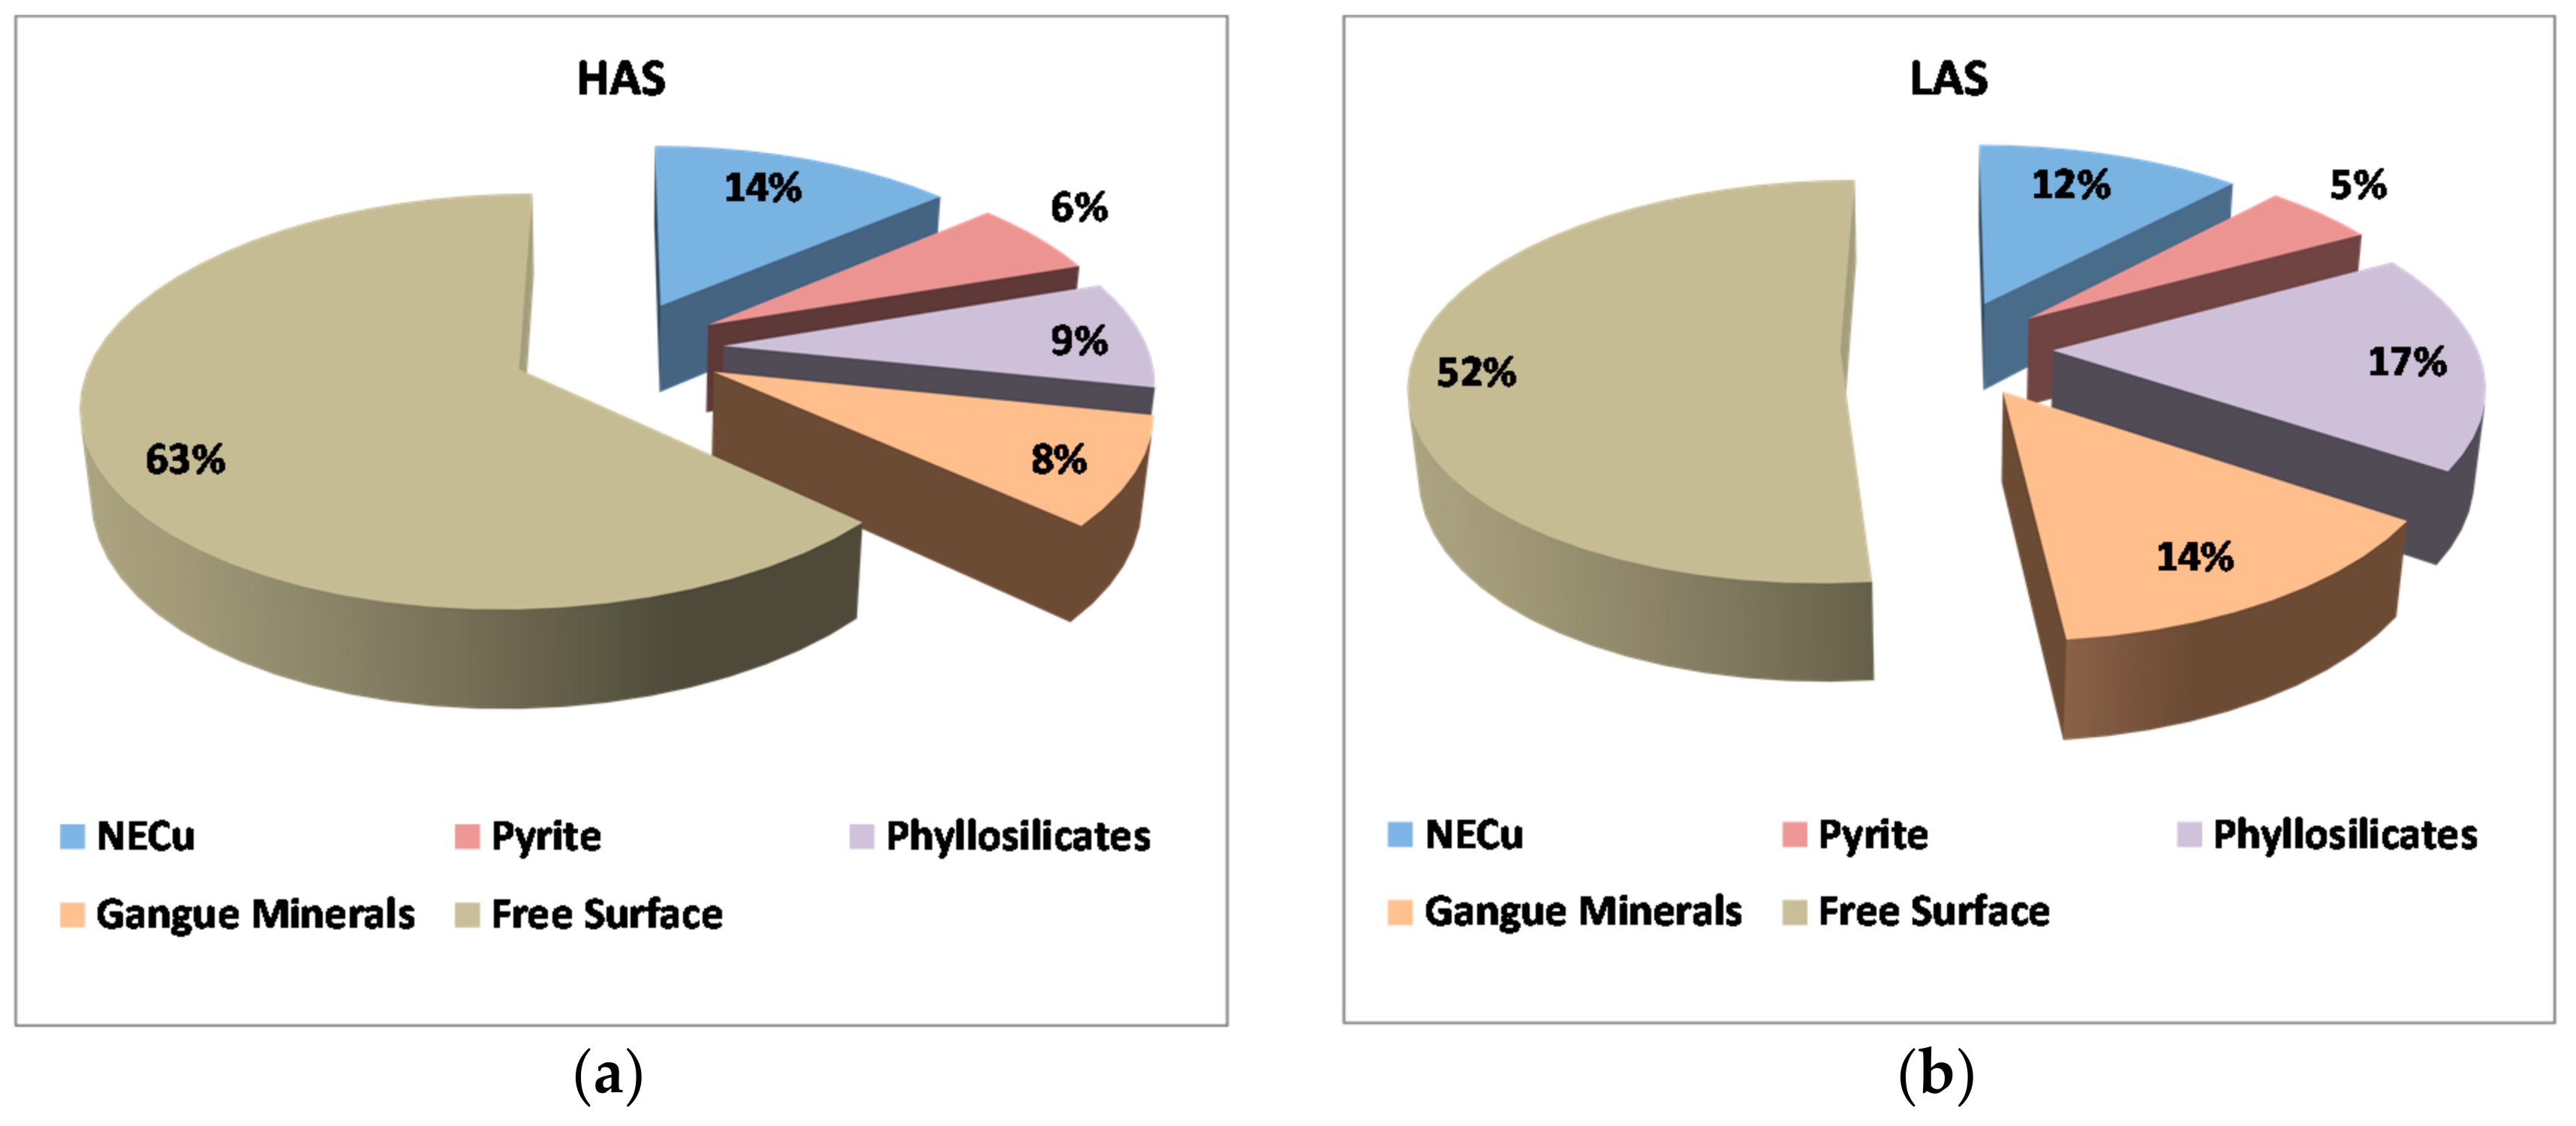
Figure 10 shows the mineral association of enargite in the HAS and the LAS samples. The results indicate that enargite was associated mainly with NECu (14%) in the HAS sample while, in the LAS sample, enargite was mostly associated with phyllosilicates (17%), followed by gangue minerals (14%) and, to a lesser extent, with NECu (12%). However, 63% and 52% of the enargite showed free surfaces, i.e., the proportion of the total surface of enargite that was exposed and ready for flotation.
3.2.5. Mineral Grain Size Distribution
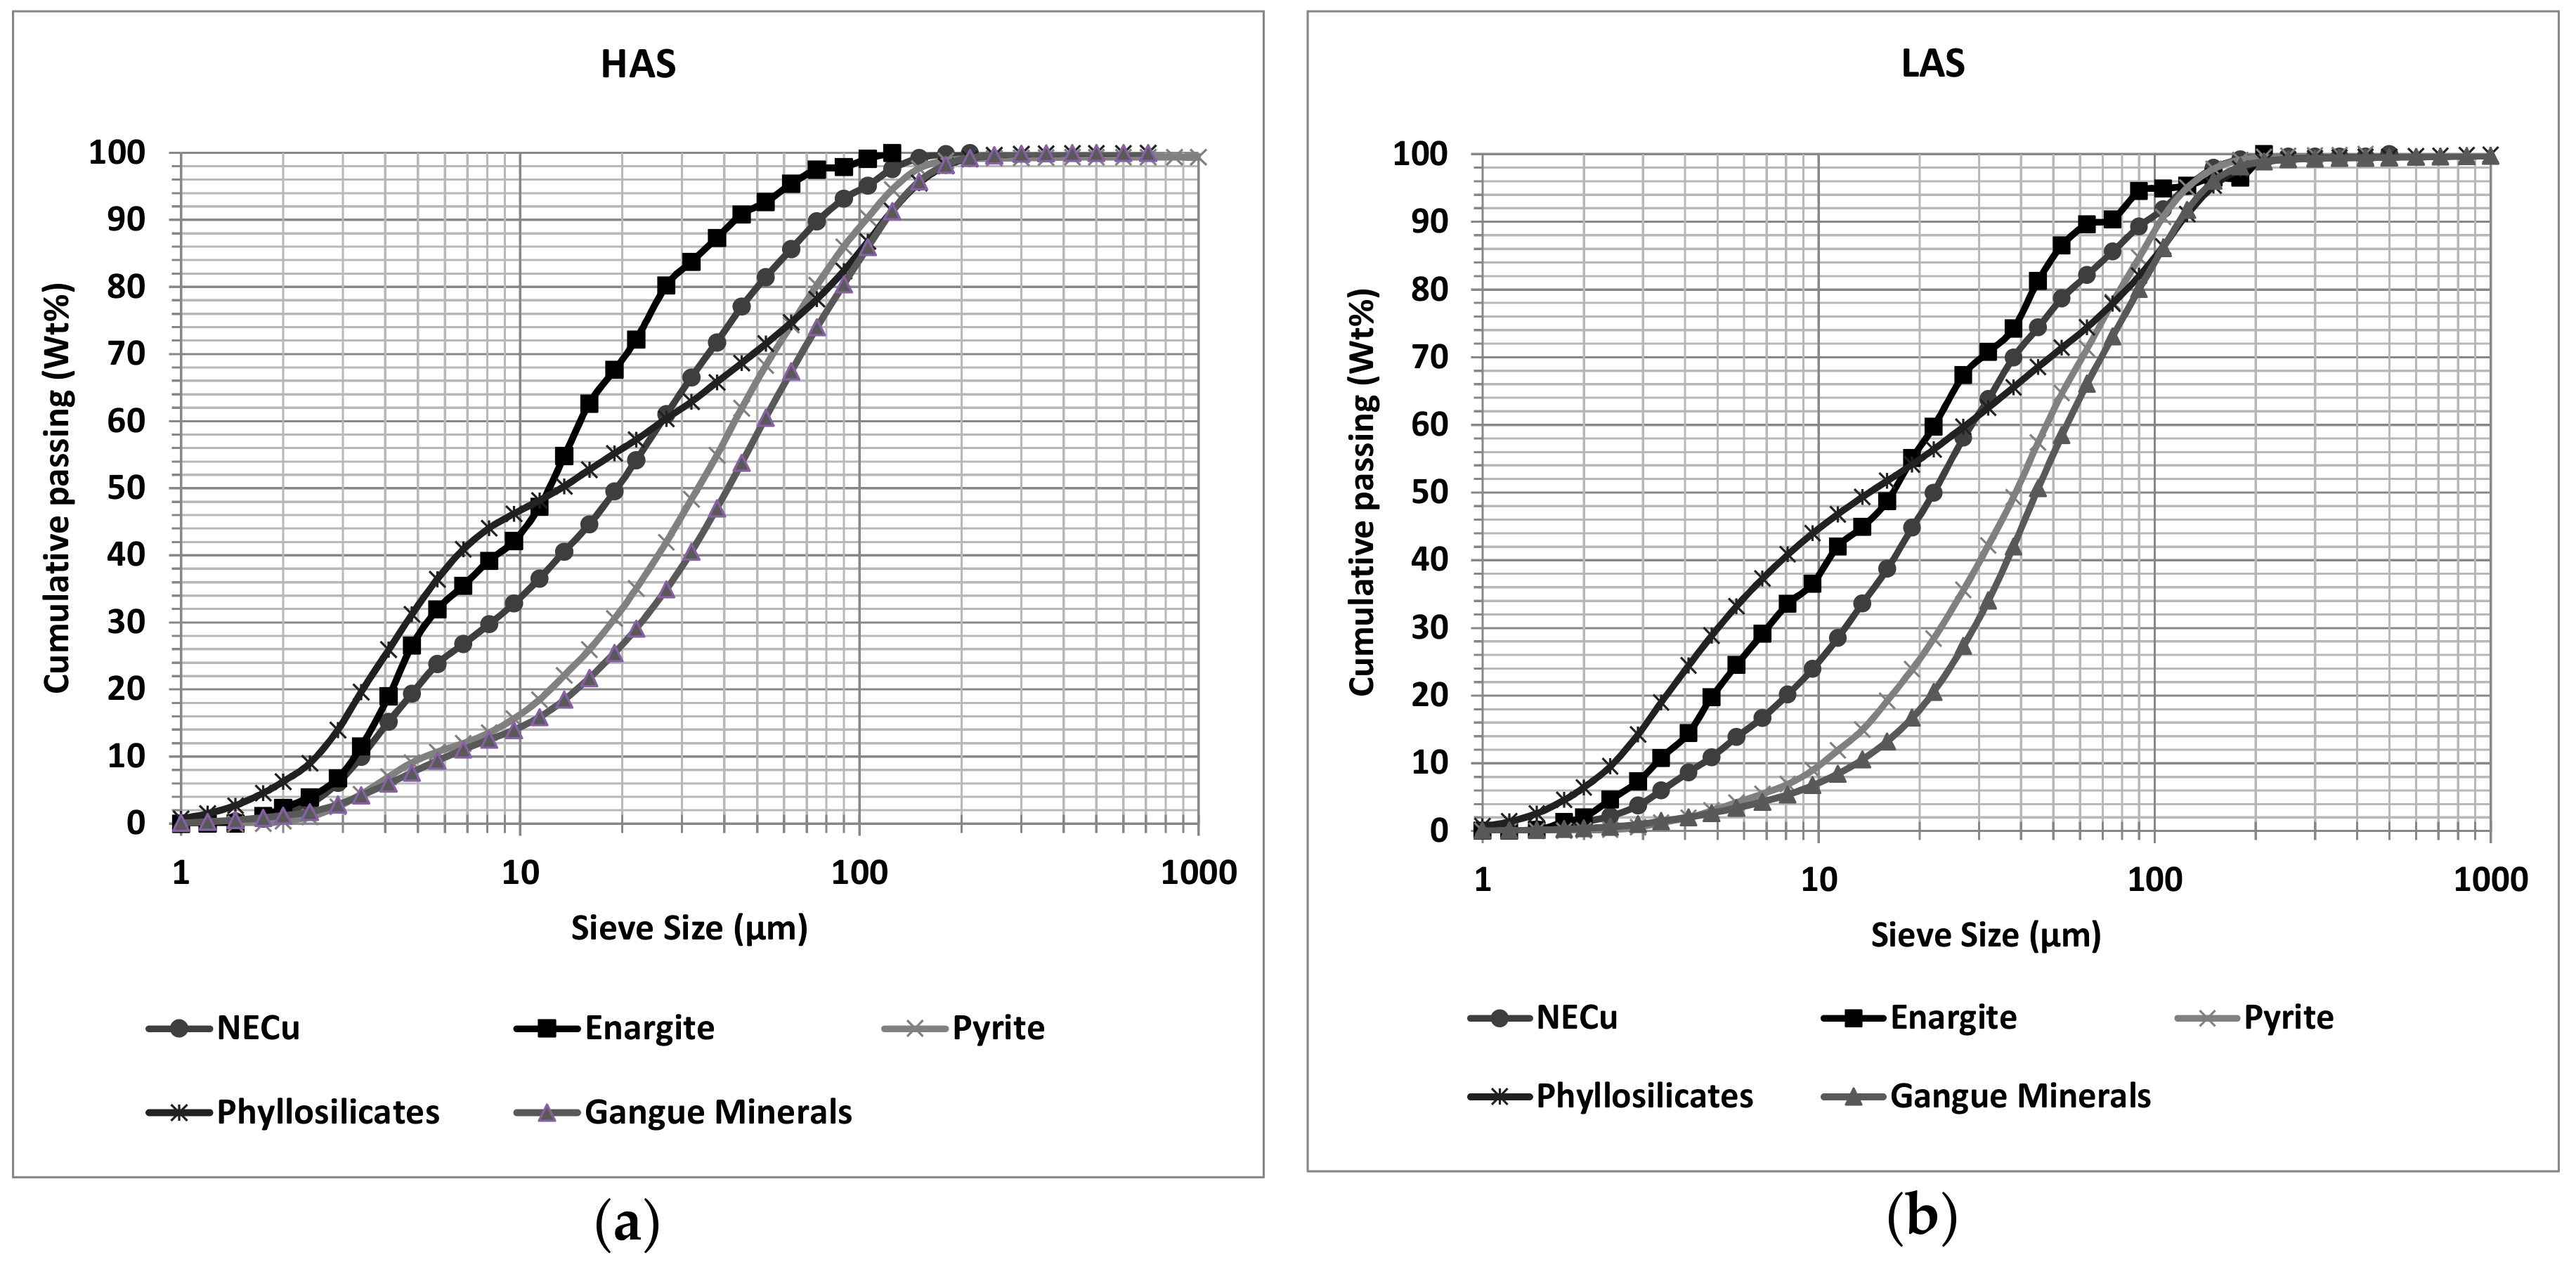
Grain size data, as produced by MLA measurement, are one of the critical mineralogical factors that influence the processing of the ores and the efficiency of the process [21]. The ore needs to be ground to such a degree that desirable minerals are liberated from the other non-sulphide minerals to achieve an efficient separation of the minerals of interest. This information can be used to determine a suitable grind size to maximise the recovery and to avoid over-grinding [16]. Mineral grain size data for NECu, enargite, pyrite, phyllosilicates, and gangue minerals were obtained for the HAS and the LAS samples by MLA analysis as shown in Figure 11.
The grain size distribution of the HAS and the LAS samples are generally similar. It can be seen that the slope of the graphs changed at around 8 µm. Hence, the data below this point has no physical meaning.
The graphs indicate that the grindability of the minerals follows the order: gangue minerals > pyrite > NECu > enargite, of which gangue mineral is the hardest. The P80 grain size of the gangue mineral is 90 µm, the phyllosilicate group is 80 µm, and pyrite is 70 µm for both samples. The P80 grain size of NECu is 48 and 53 µm in the HAS and the LAS sample respectively. Interestingly the grain size distribution of enargite is seen to be lower than other copper minerals. The P80 grain size of enargite is 27 and 44 µm in the HAS and the LAS samples, respectively. Comparing the P50 of minerals shows that the P50 of enargite is 12 and 16 µm in the HAS and the LAS samples, respectively. This indicates that fine grinding might be required to obtain the necessary degree of liberation. The difference between the NECu and the enargite grain size distribution can be attributed to the strong cleavage exhibited by the enargite. It should be mentioned that enargite displays perfect cleavage along (110) [35].
4. Discussion
As discussed in the introduction section, previous studies have identified some strategies that can be applied to separate arsenic-bearing copper minerals by flotation using single mineral systems. However, there is no reliable framework to overcome the arsenic challenge in industry due to the lack of work on real ore systems. This section attempts to point out the most important mineralogical attributes based on the results of this study and combine the above results in the development of a flowsheet capable of treating high-arsenic (in the form enargite) ores. It should be mentioned that this proposed flowsheet is an initial conception and would require further investigation to adjust or confirm, preferably on Tampakan ore. A brief description of each step follows, summarising some of the main findings of the mineralogical characterisation of the HAS and the LAS ore samples.
The size-by-size weight distribution of the HAS and the LAS samples showed similar trends in both samples, where the amount of fine (−11 µm) particles was noticeably greater for enargite than for NECu (non-enargite copper minerals). On the other hand, enargite has a perfect cleavage. This indicates that enargite tended to be ground more readily than the other copper sulphide minerals. Moreover, the mineral grain size data showed that enargite had the finest grain size distribution compared to other copper minerals in both samples. It can be concluded preferential breakage through enargite grains caused its accumulation in the finest size fractions.
The fine grain size of enargite can also be an indication that fine grinding would be required to achieve sufficient levels of enargite liberation. Considering the degree of liberation of enargite and other minerals, it can be concluded that further grinding firstly increases the proportion of non-sulphide gangue minerals (especially phyllosilicates) at −11 µm, causing more problems in the processing of these ores, and more importantly decreases the amount of valuable minerals in medium-sized fractions, which are the most floatable size fractions.
It was also observed that more than half of the phyllosilicates reported to the finest size fraction. Therefore, a desliming stage can also be an option to remove the phyllosilicate fines prior to the flotation process. However, as mentioned above, a noticeable amount of enargite (17% in the LAS and 21% in the HAS samples) and also NECu (13% in both samples) reported to the finest size fraction −11 µm. Hence removing this size fraction without further treatment also means losing copper and increasing the arsenic content of the tailing, which represents an unacceptable environmental risk. It would, therefore, be more beneficial to include a fine treatment stage after desliming stage to recover the enargite and NECu fines from −11 µm size fraction. It can be further treated to recover copper from enargite and other copper sulphides and the safe disposal of arsenic. Moreover, removing enargite in the first stage of the process means early elimination of arsenic from flotation concentrate, which reduces the penalty imposed by smelters.
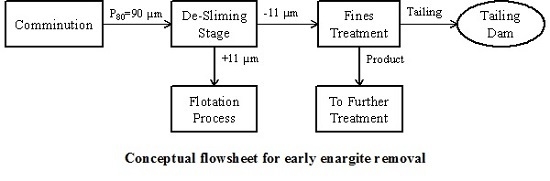
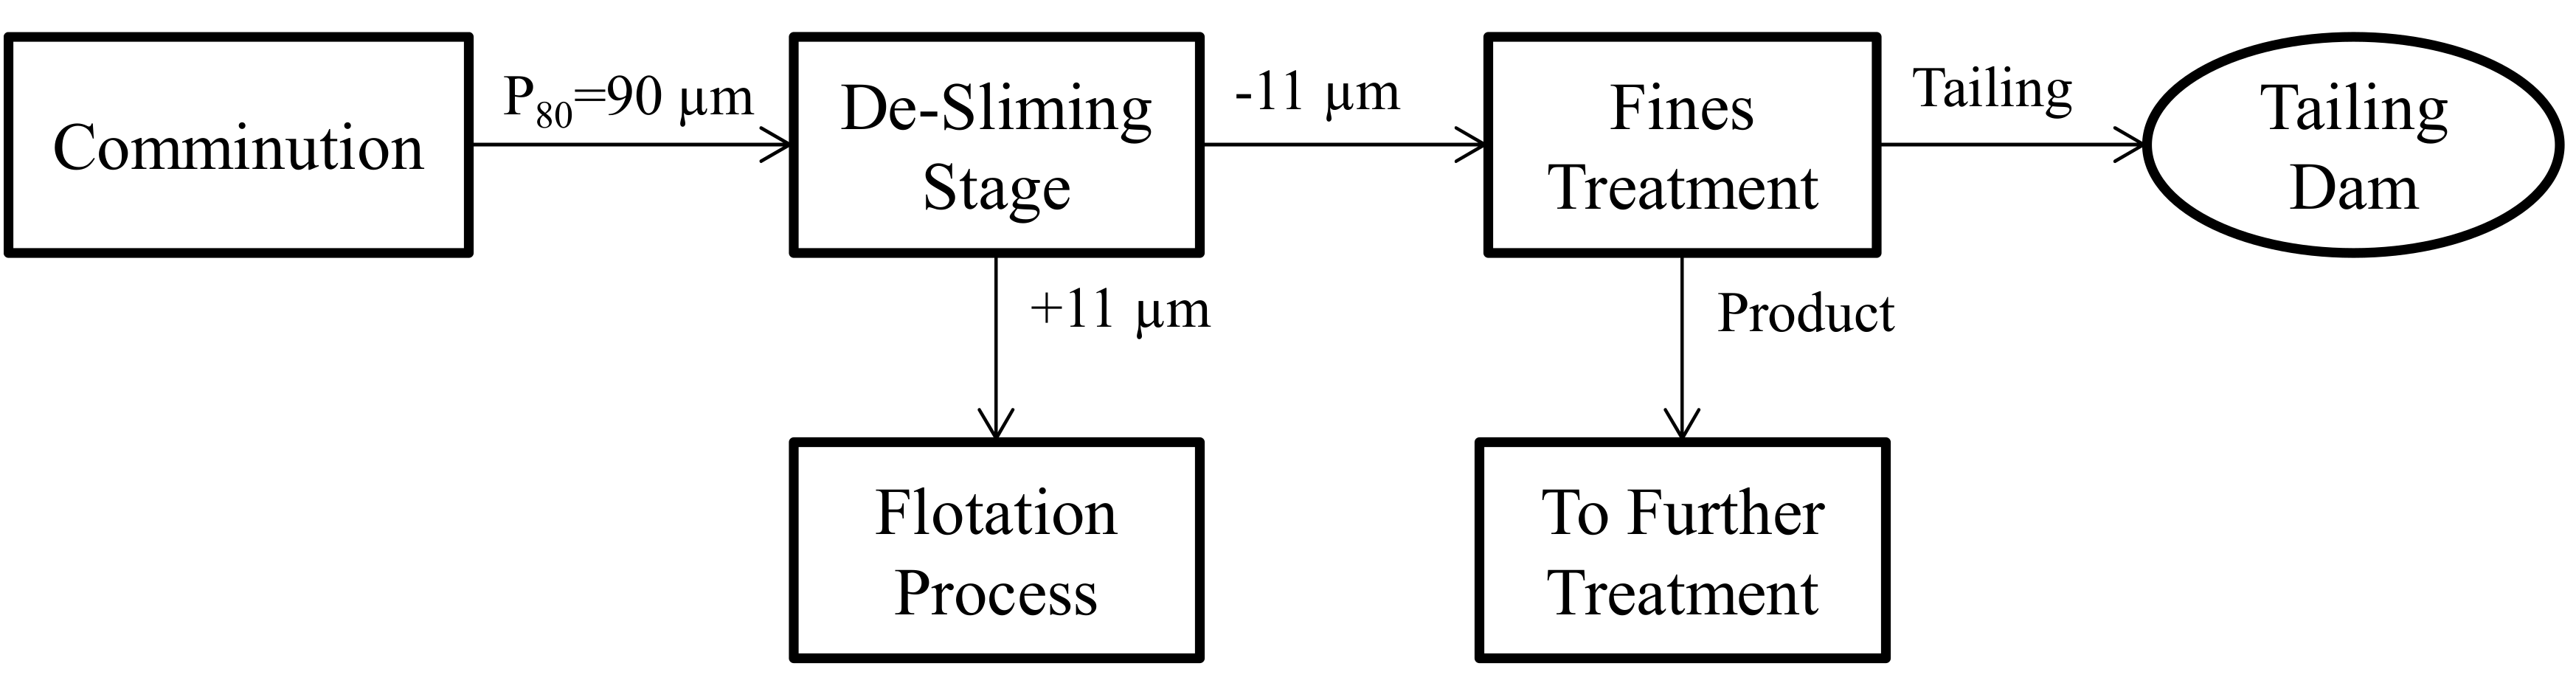
A conceptual flowsheet combining these features for early removal of enargite from the Tampakan ore is presented in Figure 12. The key differences between this flowsheet and that proposed by Senior, et al. [7] are:
- A desliming stage prior to the flotation process, where fine fraction −11 µm can be separated from the ground flotation feed.
- A fines treatment stage, where enargite and any remaining NECu minerals can be separated from the fine gangue minerals and further treated to recover the copper and safely store the arsenic.
- The +11 µm flotation feed passes to the normal flotation process which can follow the method proposed by Senior, et al. [7].
The proposed flowsheet for early removal of arsenic from the flotation feed would include the following benefits:
- The separation of the fine fraction (−11 µm) from ground product reduces the arsenic content of the flotation process feed. In addition, the fine fraction (−11 µm) consisted of the phyllosilicates, which can cause slime problems during flotation process. The removal of such slimes improves metal recovery in the coarse stage flotation process.
- The product of the fines treatment stage will have a significant copper and arsenic content since enargite itself contains 48.3% copper and the product also contains other copper minerals. The treatment of this product will recover the valuable minerals. On the other hand, the separation of the fine enargite in this treatment stage also improves industry environmental performance by excluding arsenic from the rejectable tailing.
5. Conclusions
Comprehensive mineralogical analyses were performed on HAS (high-arsenic sample) and LAS (low-arsenic sample) samples from the Tampakan deposit. It was found that enargite tended to be ground more readily than the other copper sulphide minerals present in the HAS and the LAS samples tested, and it mostly reported to the fine size fractions. This phenomena can be related to the preferential grinding of enargite, which needs further work to confirm.
A modified flowsheet for the treatment of arsenic-bearing copper ores, based on the early removal of arsenic at the concentrator, has been proposed. The proposed flowsheet comprises two key steps. In the first stage, the pulp is deslimed to separate the −11 µm material from the flotation feed. In the second stage, a fines treatment step is suggested to separate enargite and NECu minerals from fine gangue minerals. The modified flowsheet would require further investigation to adjust or confirm.
Acknowledgments
The authors would like to express their gratitude to staff of MLA facility at the Julius Kruttschnitt Mineral Research Centre (JKMRC). They would like also to thank CSIRO Minerals and JKMRC/SMI for funding this project.
Author Contributions
Maedeh Tayebi-Khorami, Emmanuel Manlapig, and Elizaveta Forbes conceived and designed the experiments; Maedeh Tayebi-Khorami performed the experiments; Maedeh Tayebi-Khorami analyzed the data; Maedeh Tayebi-Khorami, Emmanuel Manlapig, and Elizaveta Forbes contributed materials/analysis tools; Maedeh Tayebi-Khorami wrote the paper.
Conflicts of Interest
The authors declare no conflict of interest. The founding sponsors had no role in the design of the study; in the collection, analyses, or interpretation of data; in the writing of the manuscript, and in the decision to publish the result.
References
- Chatterjee, A.; Das, D.; Mandal, B.K.; Chowdhury, T.R.; Samanta, G.; Chakraborti, D. Arsenic in ground-water in 6 districts of West-Bengal, India—The biggest arsenic calamity in the world. 1. Arsenic species in drinking-water and urine of the affected people. Analyst 1995, 120, 643–650. [Google Scholar] [CrossRef]
- Cordova, R.; Gomez, H.; Real, S.G.; Schrebler, R.; Vilche, J.R. Characterization of natural enargite aqueous solution systems by electrochemical techniques. J. Electrochem. Soc. 1997, 144, 2628–2636. [Google Scholar] [CrossRef]
- Plackowski, C.; Bruckard, W.J.; Nguyen, A.V. Surface characterisation, collector adsorption and flotation response of enargite in a redox potential controlled environment. Miner. Eng. 2014, 65, 61–73. [Google Scholar] [CrossRef]
- Wilson, P.C.; Chanroux, C. Revenue, calculation and marketing; copper. In Cost Estimation Handbook for the Australian Mining Industry; The Australian Institute of Mining and Metallurgy: Parkville, Australia, 1993; pp. 325–368. [Google Scholar]
- Bruckard, W.J.; Davey, K.J.; Jorgensen, F.R.A.; Wright, S.; Brew, D.R.M.; Hague, N.; Vance, E.R. Development and evaluation of an early removal process for the beneficiation of arsenic-bearing copper ores. Miner. Eng. 2010, 23, 1167–1173. [Google Scholar] [CrossRef]
- Smith, L.K.; Bruckard, W.J. The separation of arsenic from copper in a northparkes copper-gold ore using controlled-potential flotation. Int. J. Miner. Process. 2007, 84, 15–24. [Google Scholar] [CrossRef]
- Senior, G.D.; Guy, P.J.; Bruckard, W.J. The selective flotation of enargite from other copper minerals—A single mineral study in relation to beneficiation of the tampakan deposit in the philippines. Int. J. Miner. Process. 2006, 81, 15–26. [Google Scholar] [CrossRef]
- Bruckard, W.J.; Kyriakidis, I.; Woodcock, J.T. The flotation of metallic arsenic as a function of PH and pulp potential—A single mineral study. Int. J. Miner. Process. 2007, 84, 25–32. [Google Scholar] [CrossRef]
- Smith, L.K.; Davey, K.J.; Bruckard, W.J. The Use of Pulp Potential Control to Separate Copper and Arsenic—An Overview Based on Selected Case Studies. In Proceedings of the XXVI International Mineral Processing Congress (IMPC), New Delhi, India, 24–28 September 2012. [Google Scholar]
- Menacho, J.M.; Aliaga, W.; Valenuela, R.; Ramos, V.; Olivares, I. Selective flotation of enargite and chalcopyrite. Minerals 1993, 48, 33–39. [Google Scholar]
- Yen, W.T.; Tajadod, J. Selective Flotation of Enargite and Chalcopyrite. In Proceedings of the XXI International Mineral Processing Congress (IMPC), Rome, Italy, 23–27 July 2000; Massacci, P., Ed.; Elsevier Science: Amsterdam, The Netherlands, 2000; pp. B8A-49–B8A-55. [Google Scholar]
- Kantar, C. Solution and flotation chemistry of enargite. Colloids Surf. A 2002, 210, 23–31. [Google Scholar] [CrossRef]
- Guo, H.; Yen, W.T. Selective flotation of enargite from chalcopyrite by electrochemical control. Miner. Eng. 2005, 18, 605–612. [Google Scholar] [CrossRef]
- Haga, K.; Tongamp, W.; Shibayama, A. Investigation of flotation parameters for copper recovery from enargite and chalcopyrite mixed ore. Mater. Trans. 2012, 53, 707–715. [Google Scholar] [CrossRef]
- Haga, K.; Tongamp, W.; Shibayama, A. Separation of Enargite from Cu-Concentrate. In Proceedings of the XXVI International Mineral Processing Congress (IMPC), New Delhi, India, 24–28 September 2012. [Google Scholar]
- Kappes, R.; Brosnahan, D.; Gathje, J. Characterisation of copper flotation products utilizing the jkmrc/fei mineral liberation analyser (MLA). In Proceedings of the SME Annual Meeting, Denver, CO, USA, 25–28 February 2007; pp. 1–9. [Google Scholar]
- Kappes, R.; Brosnahan, D.; Gathje, J. Utilizing mineral liberation analysis (mla) to determine pyrite, arsenopyrite and arsenian pyrite floatabilities for carlin trend ores. In Proceedings of the SME Annual Meeting, Denver, CO, USA, 22 February 2009. [Google Scholar]
- Kappes, R.; Gathje, J. The Metallurgical Development of an Enargite-Bearing Deposit. In Proceedings of the XXV International Mineral Processing Congress (IMPC), Brisbane, Australia, 6–10 September 2010. [Google Scholar]
- Long, G. Production of a Low Arsenic Copper Concentrate from a Vms Ore; The University of Queensland, Julius Kruttschnitt Mineral Research Centre: Indooroopilly, Australia, 2014. [Google Scholar]
- Evans, C. Development of a Methodology to Estimate Flotation Separability from Ore Microtexture; The University of Queensland, Julius Kruttschnitt Mineral Research Centre: Indooroopilly, Australia, 2010. [Google Scholar]
- Zhou, J.; Gu, Y.; Zhou, H.Y. Process Mineralogy and Applications in Mineral Processing. In Proceedings of the XXIV International Mineral Processing Congress (IMPC), Beijing, China, 24–28 September 2008; Wang, D.Z., Sun, C.Y., Wang, F.L., Zhang, L.C., Han, L., Eds.; Science Press: Beijing, China; pp. 107–117. [Google Scholar]
- Mariano, R.A.; Evans, C.L.; Manlapig, E. Definition of random and non-random breakage in mineral liberation—A review. Miner. Eng. 2016, 94, 51–60. [Google Scholar] [CrossRef]
- Petruk, W. Applied Mineralogy in the Mining Industry; Elsevier Science BV: Amsterdam, The Netherlands, 2000. [Google Scholar]
- Leißner, T.; Hoang, D.H.; Rudolph, M.; Heinig, T.; Bachmann, K.; Gutzmer, J.; Schubert, H.; Peuker, U.A. A mineral liberation study of grain boundary fracture based on measurements of the surface exposure after milling. Int. J. Miner. Process. 2016, 156, 3–13. [Google Scholar] [CrossRef]
- King, R.P.; Schneider, C.L. Mineral liberation and the batch comminution equation. Miner. Eng. 1998, 11, 1143–1160. [Google Scholar] [CrossRef]
- Fandrich, R.G.; Bearman, R.A.; Boland, J.; Lim, W. Mineral liberation by particle bed breakage. Miner. Eng. 1997, 10, 175–187. [Google Scholar] [CrossRef]
- Runge, K.; Tabosa, E.; Jankovic, A. Particle size distribution effects that should be considered when performing flotation geometallurgical testing. In Proceedings of the Second AusIMM International Geometallurgy Conference, Brisbane, Australia, 30 September–2 October 2013. [Google Scholar]
- Rohrlach, B.; Madera, A.; Watt, R. Geology, alteration, and mineralisation of the tampakan copper deposit. In Proceedings of the PACRIM ‘99 Congress, Bali, Indonesia, 10–13 October 1999; pp. 517–525. [Google Scholar]
- Fandrich, R.; Gu, Y.; Burrows, D.; Moeller, K. Modern SEM-based mineral liberation analysis. Int. J. Miner. Process. 2007, 84, 310–320. [Google Scholar] [CrossRef]
- Gu, Y. Automated scanning electron microscope based mineral liberation analysis—An introduction to jkmrc/fei mineral liberation anlayser. J. Miner. Mater. Charact. Eng. 2003, 21, 33–41. [Google Scholar]
- Daniel, M. Energy Efficient Mineral Liberation Using Hpgr Technology; University of Queensland, School of Engineering: Brisbane, Australia, 2007. [Google Scholar]
- Stephenson, I. The Downstream Effects of High Pressure Grinding Rolls Processing; University of Queensland: Brisbane, Australia, 1997. [Google Scholar]
- Leigh, G.M.; Sutherland, D.N.; Gottlieb, P. Confidence limits for liberation measurements. Miner. Eng. 1993, 6, 155–161. [Google Scholar] [CrossRef]
- Napier-Munn, T. Statistical Methods for Mineral Engineers: How to Design Experiments and Analyse Data; Julius Kruttschnitt Mineral Research Centre: Indooroopilly, Australia, 2014; Volume 5. [Google Scholar]
- Lattanzi, P.; Da Pelo, S.; Musu, E.; Atzei, D.; Elsener, B.; Fantauzzi, M.; Rossi, A. Enargite oxidation: A review. Earth Sci. Rev. 2008, 86, 62–88. [Google Scholar] [CrossRef]
Figure 1.
Size distribution of the HAS and the LAS samples after crushing and the −425/+300 µm fraction selected for MLA analysis.
Figure 1.
Size distribution of the HAS and the LAS samples after crushing and the −425/+300 µm fraction selected for MLA analysis.

Figure 2.
MLA image showing the locking of enargite (red) in the −425/+300 µm size fraction of the HAS sample.
Figure 2.
MLA image showing the locking of enargite (red) in the −425/+300 µm size fraction of the HAS sample.
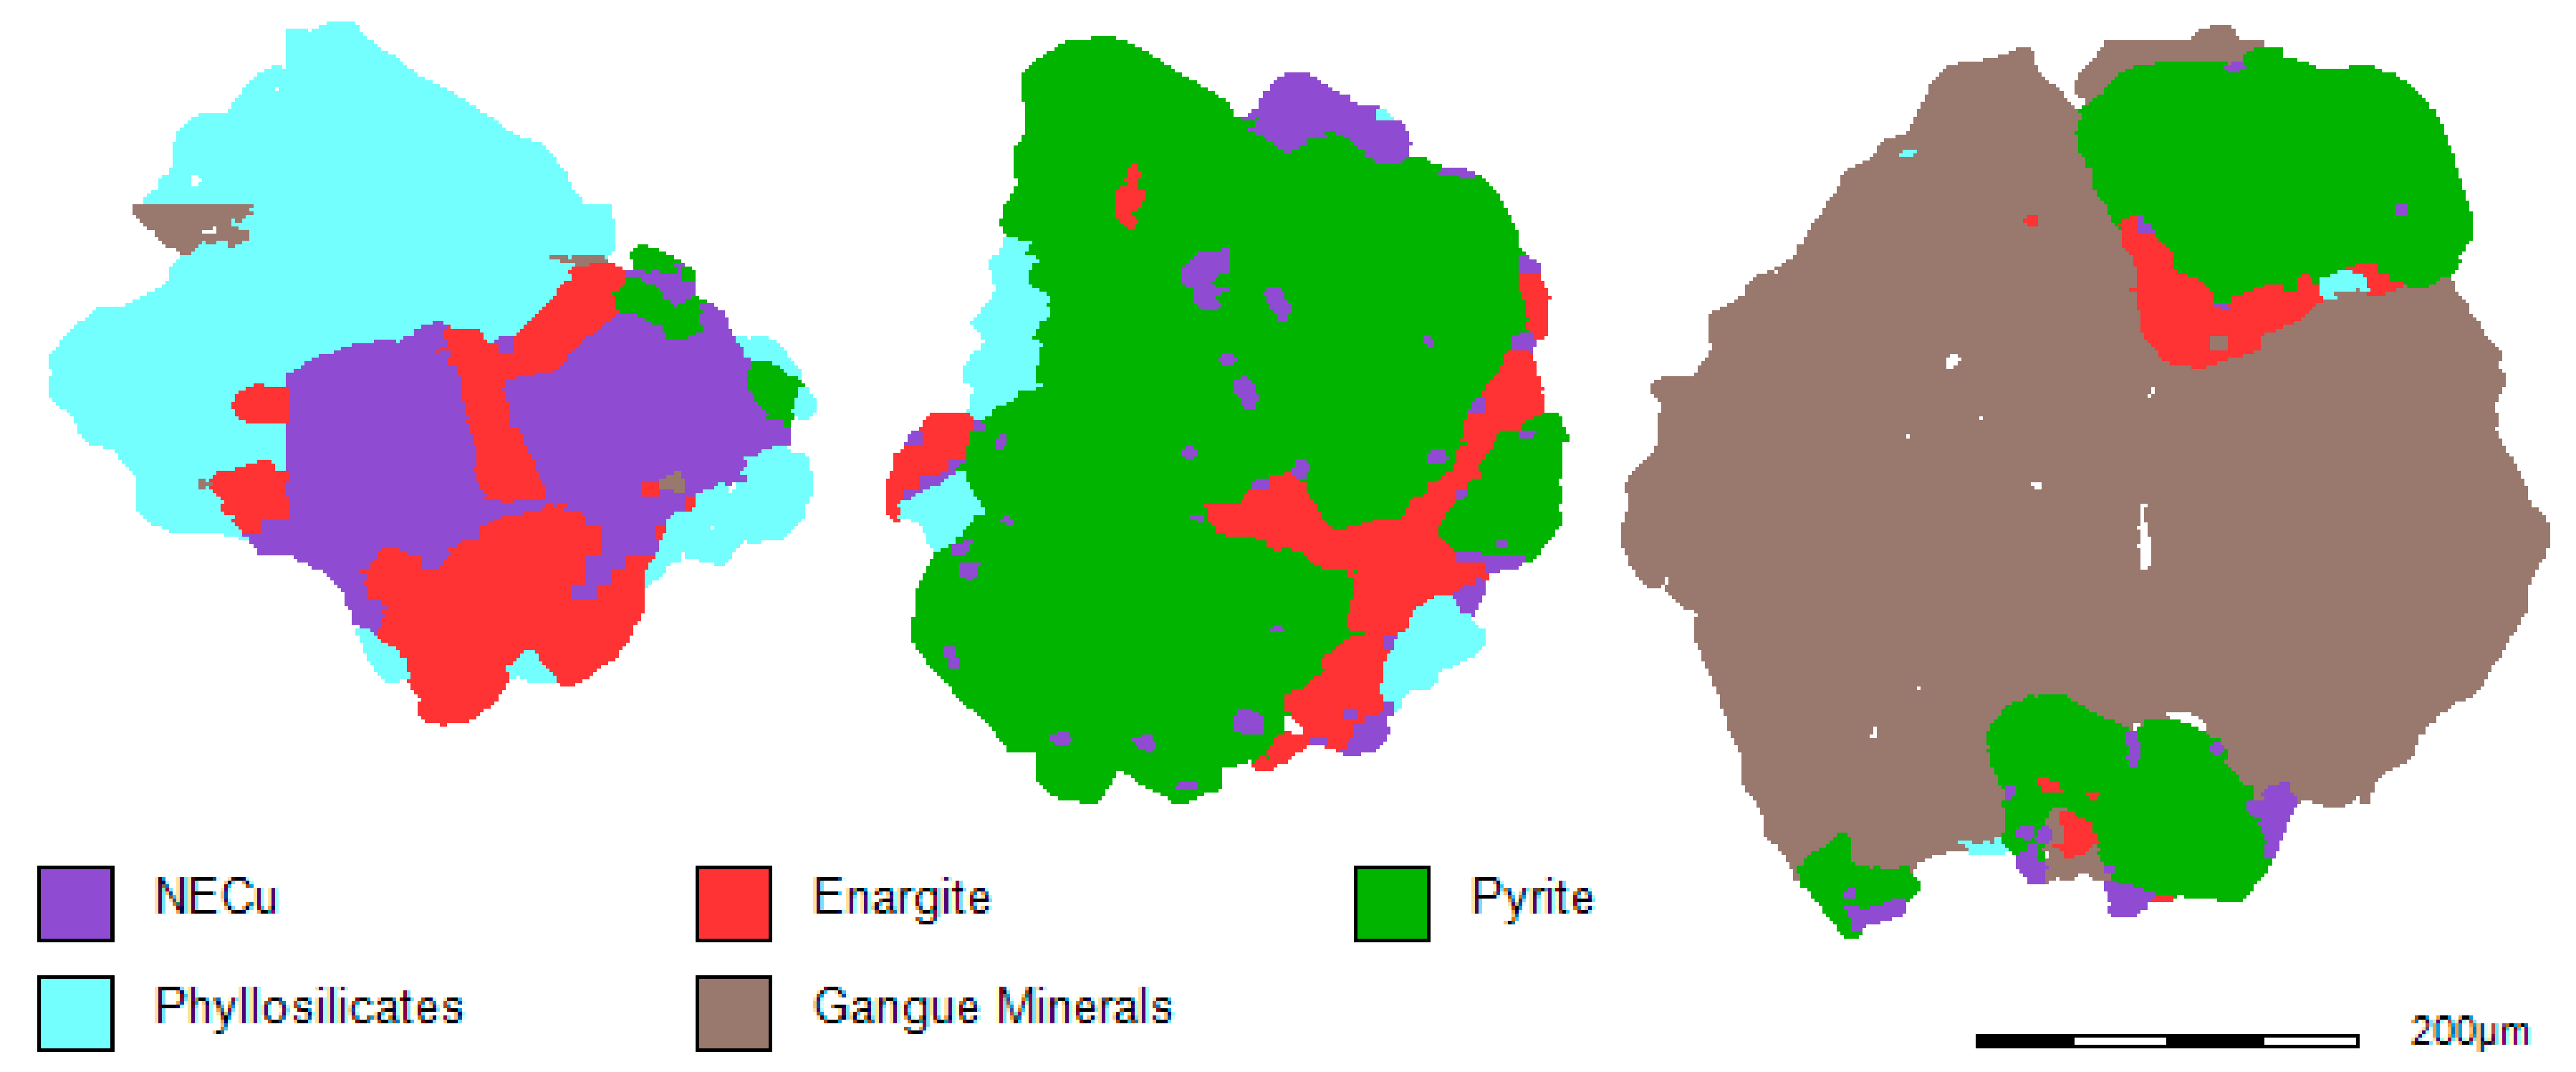
Figure 3.
MLA image showing the locking of enargite (red) in the −425/+300 µm size fraction of the LAS sample.
Figure 3.
MLA image showing the locking of enargite (red) in the −425/+300 µm size fraction of the LAS sample.
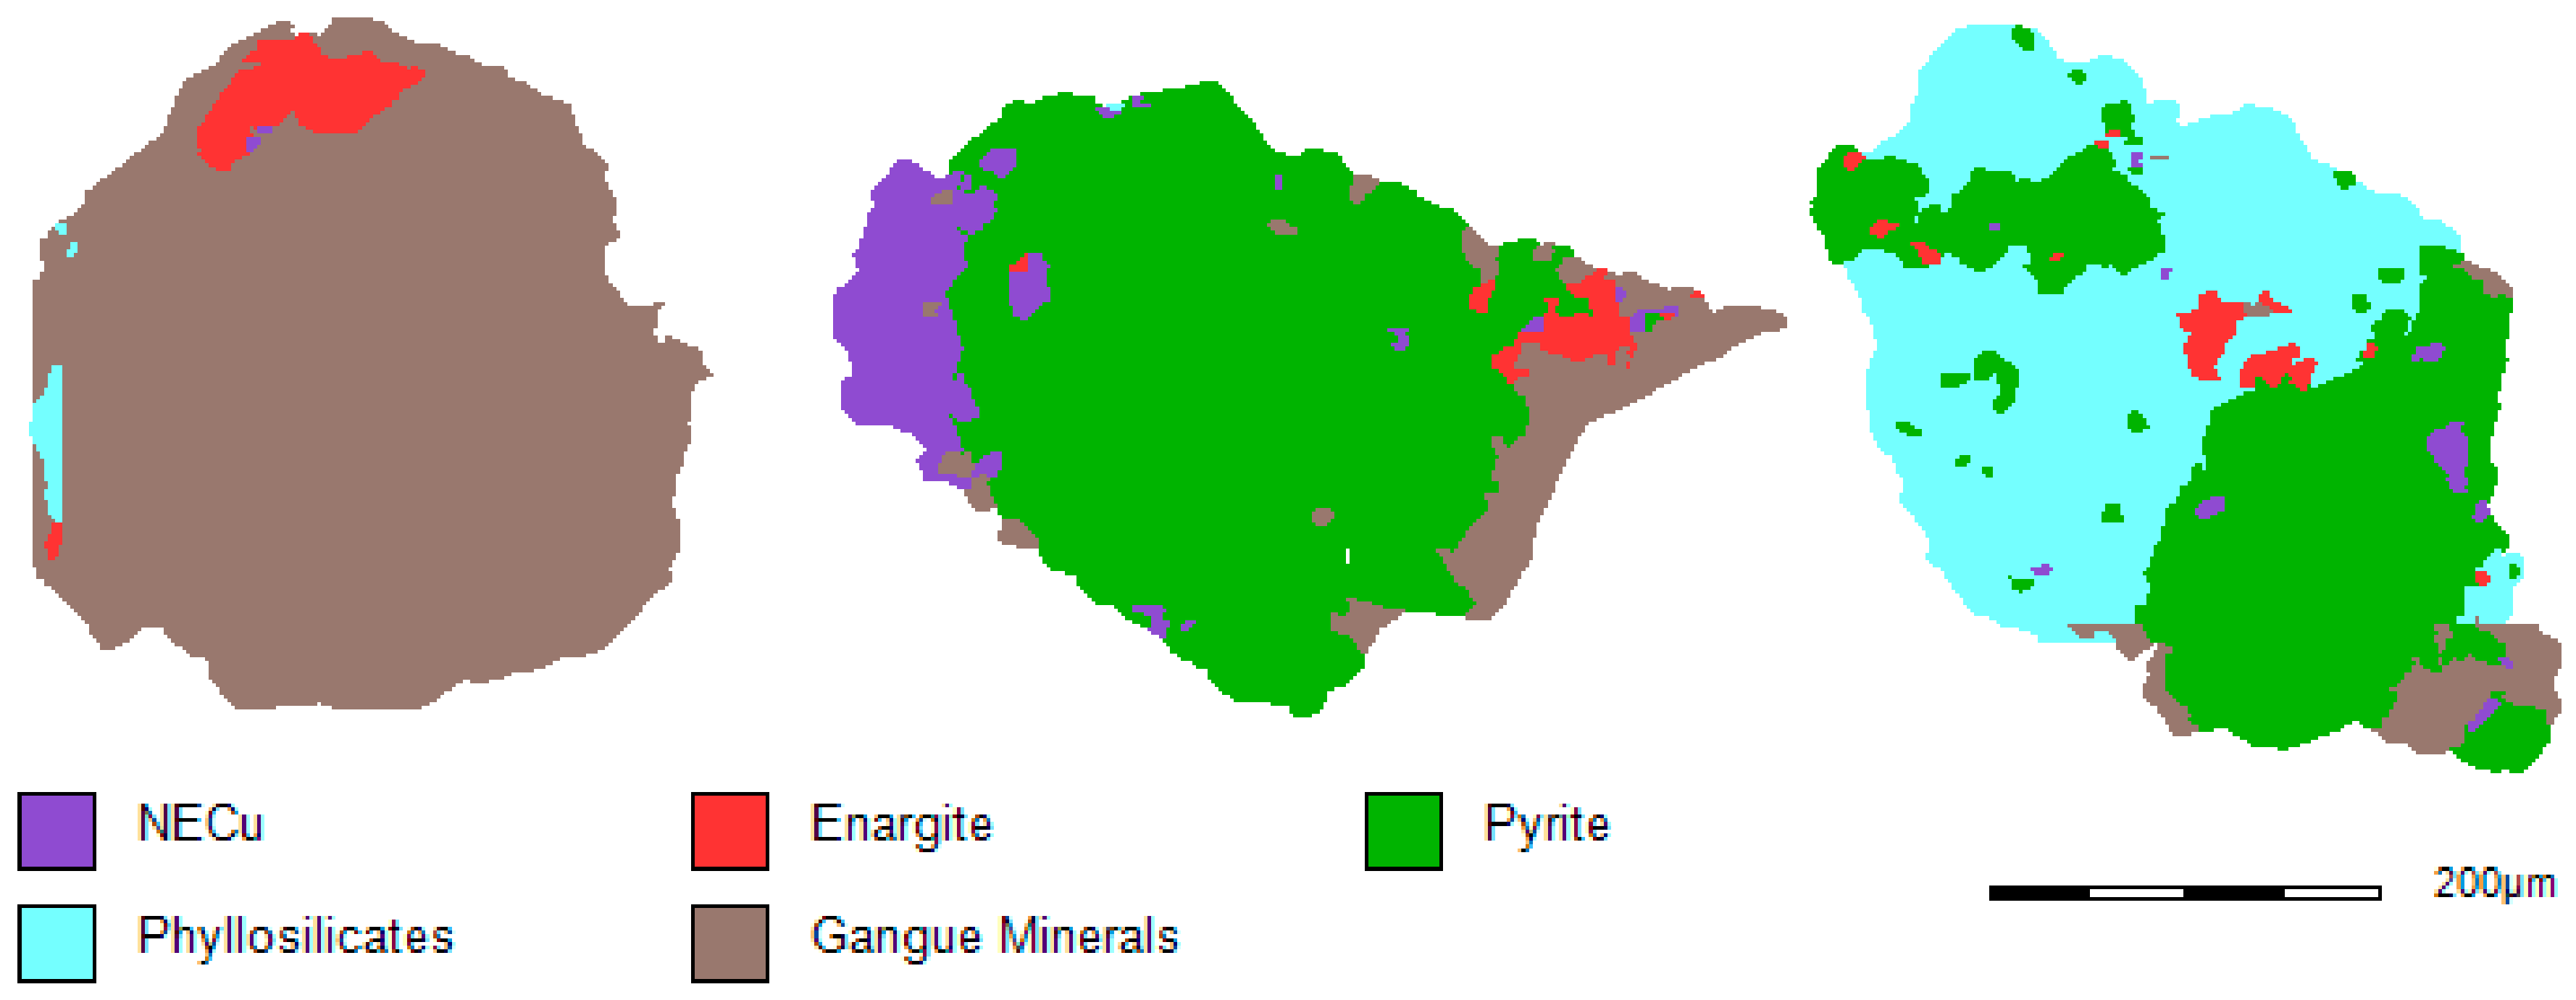
Figure 4.
Comparison between grade of Cu, Fe, S, and As from ICP-AES and the calculated grade from MLA.
Figure 4.
Comparison between grade of Cu, Fe, S, and As from ICP-AES and the calculated grade from MLA.
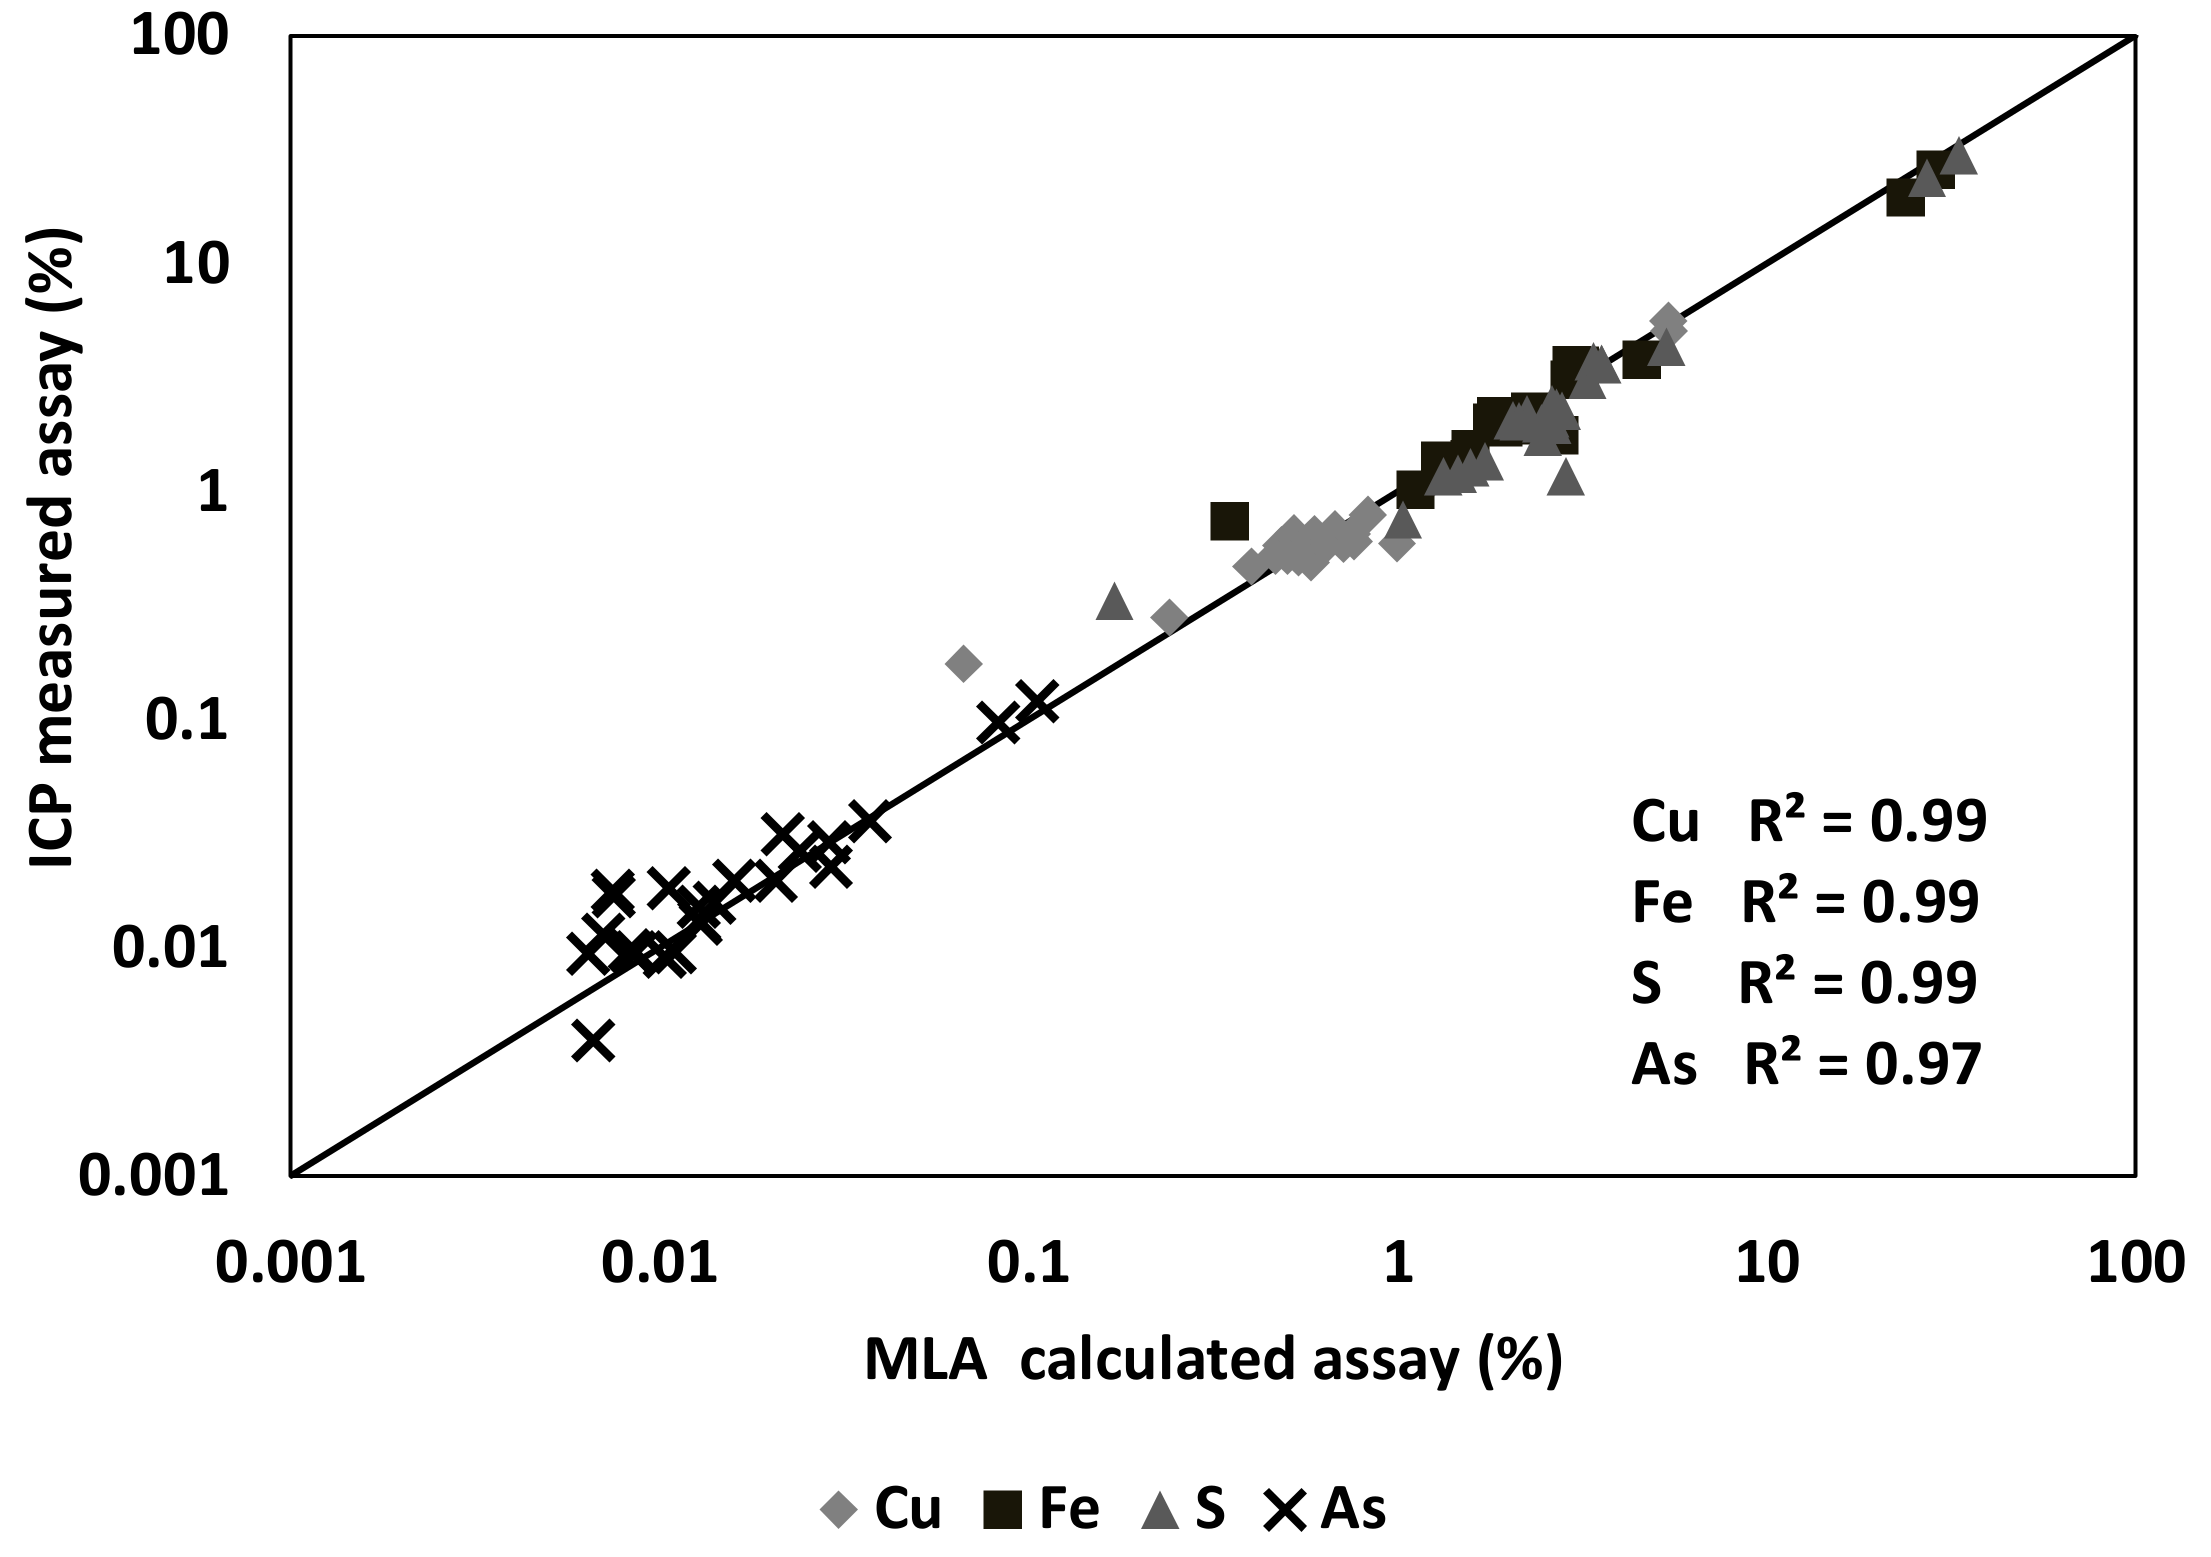
Figure 5.
Size-by-size mineral distribution of the HAS sample (% by weight).
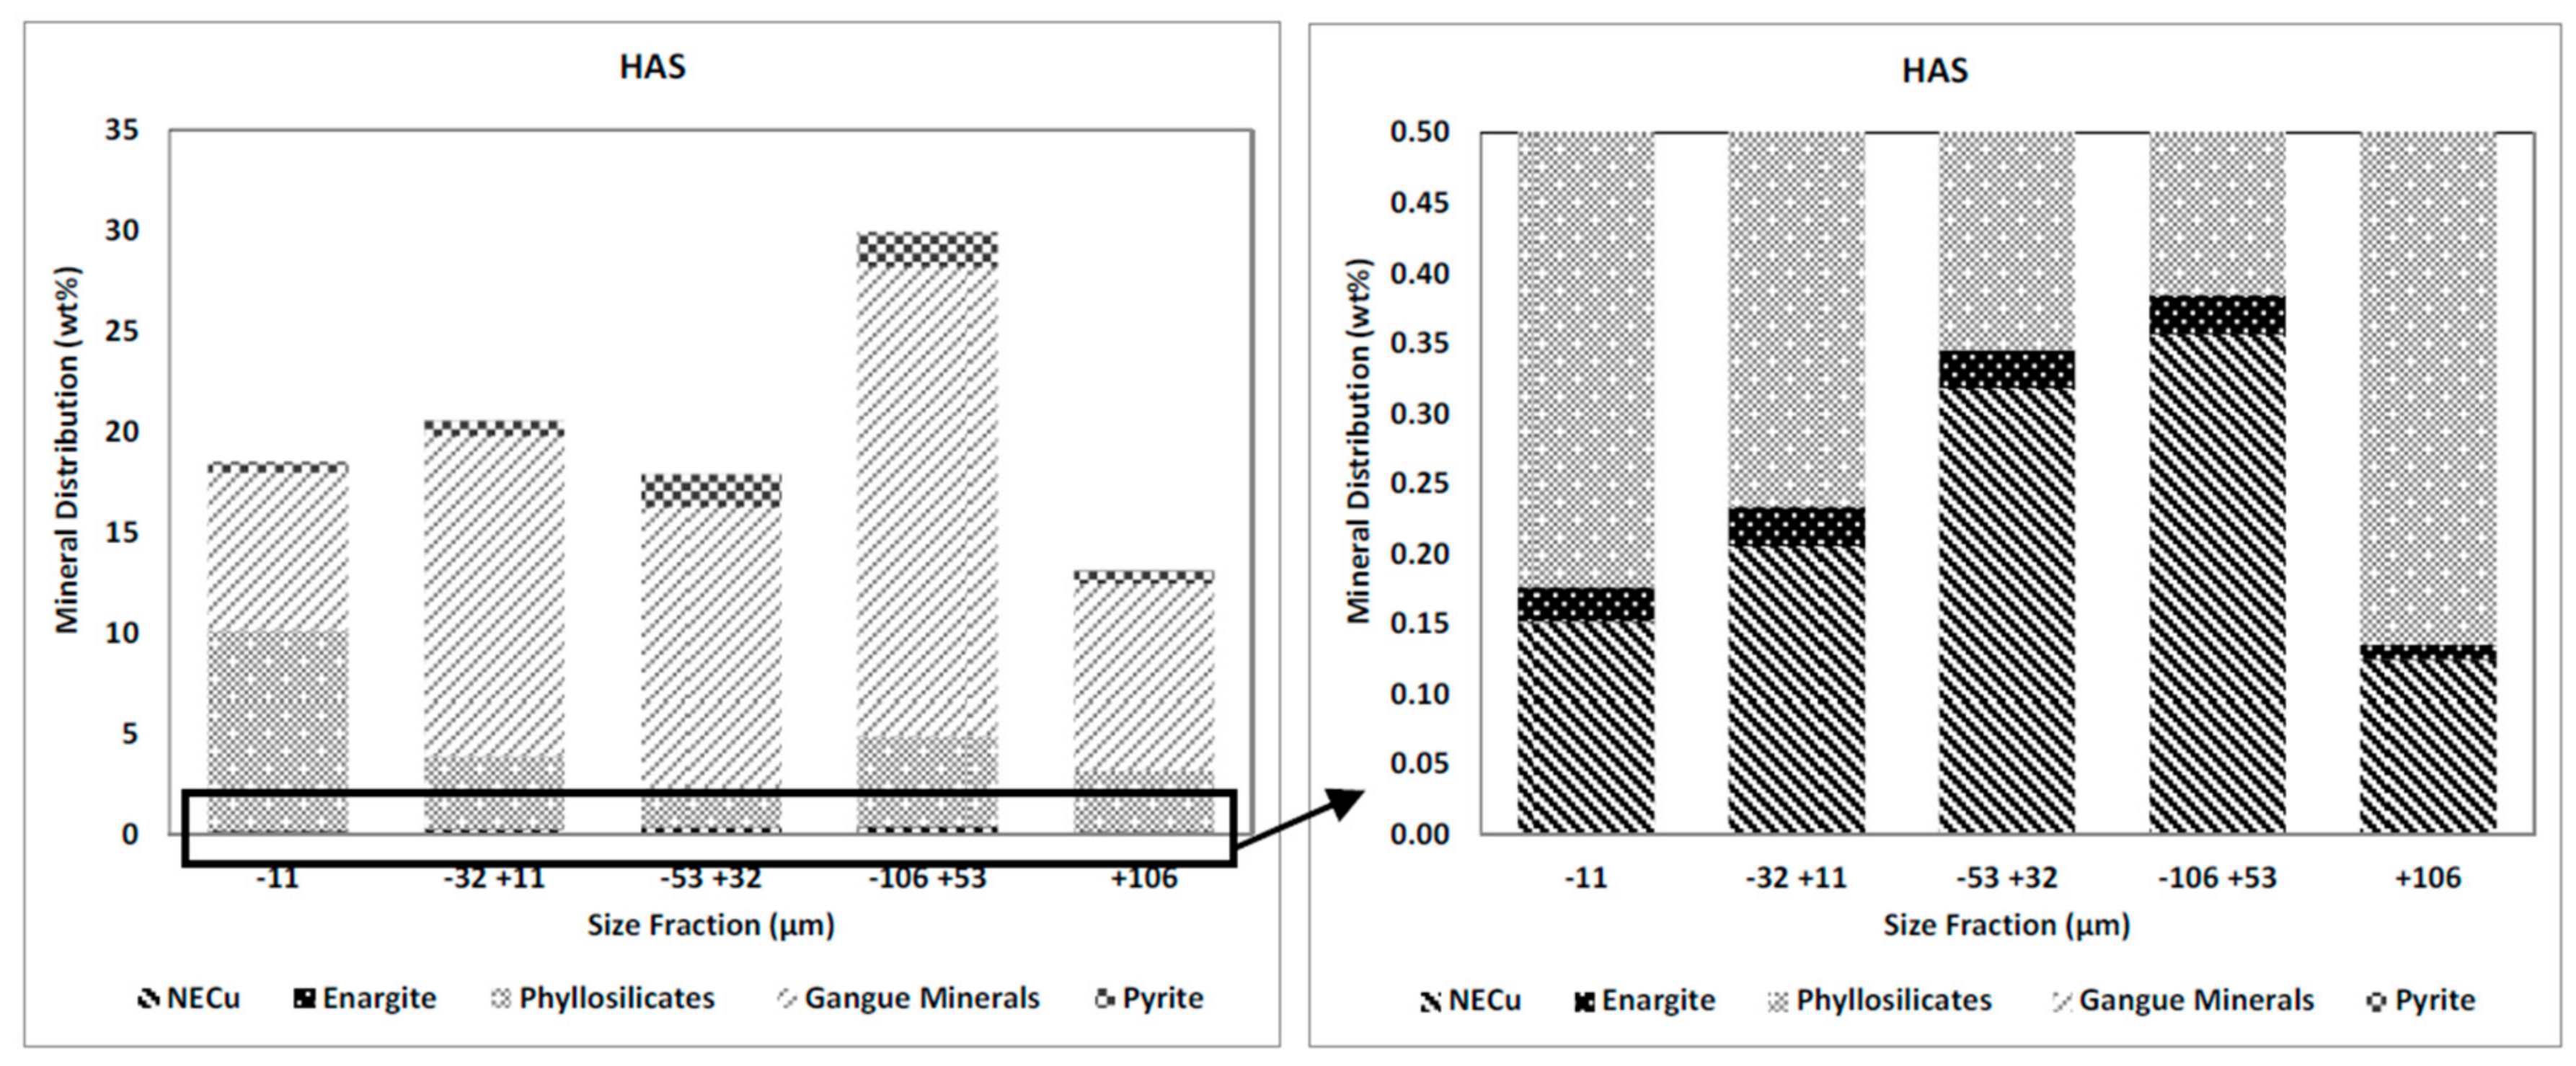
Figure 6.
Size-by-size mineral distribution of the LAS sample (% by weight).
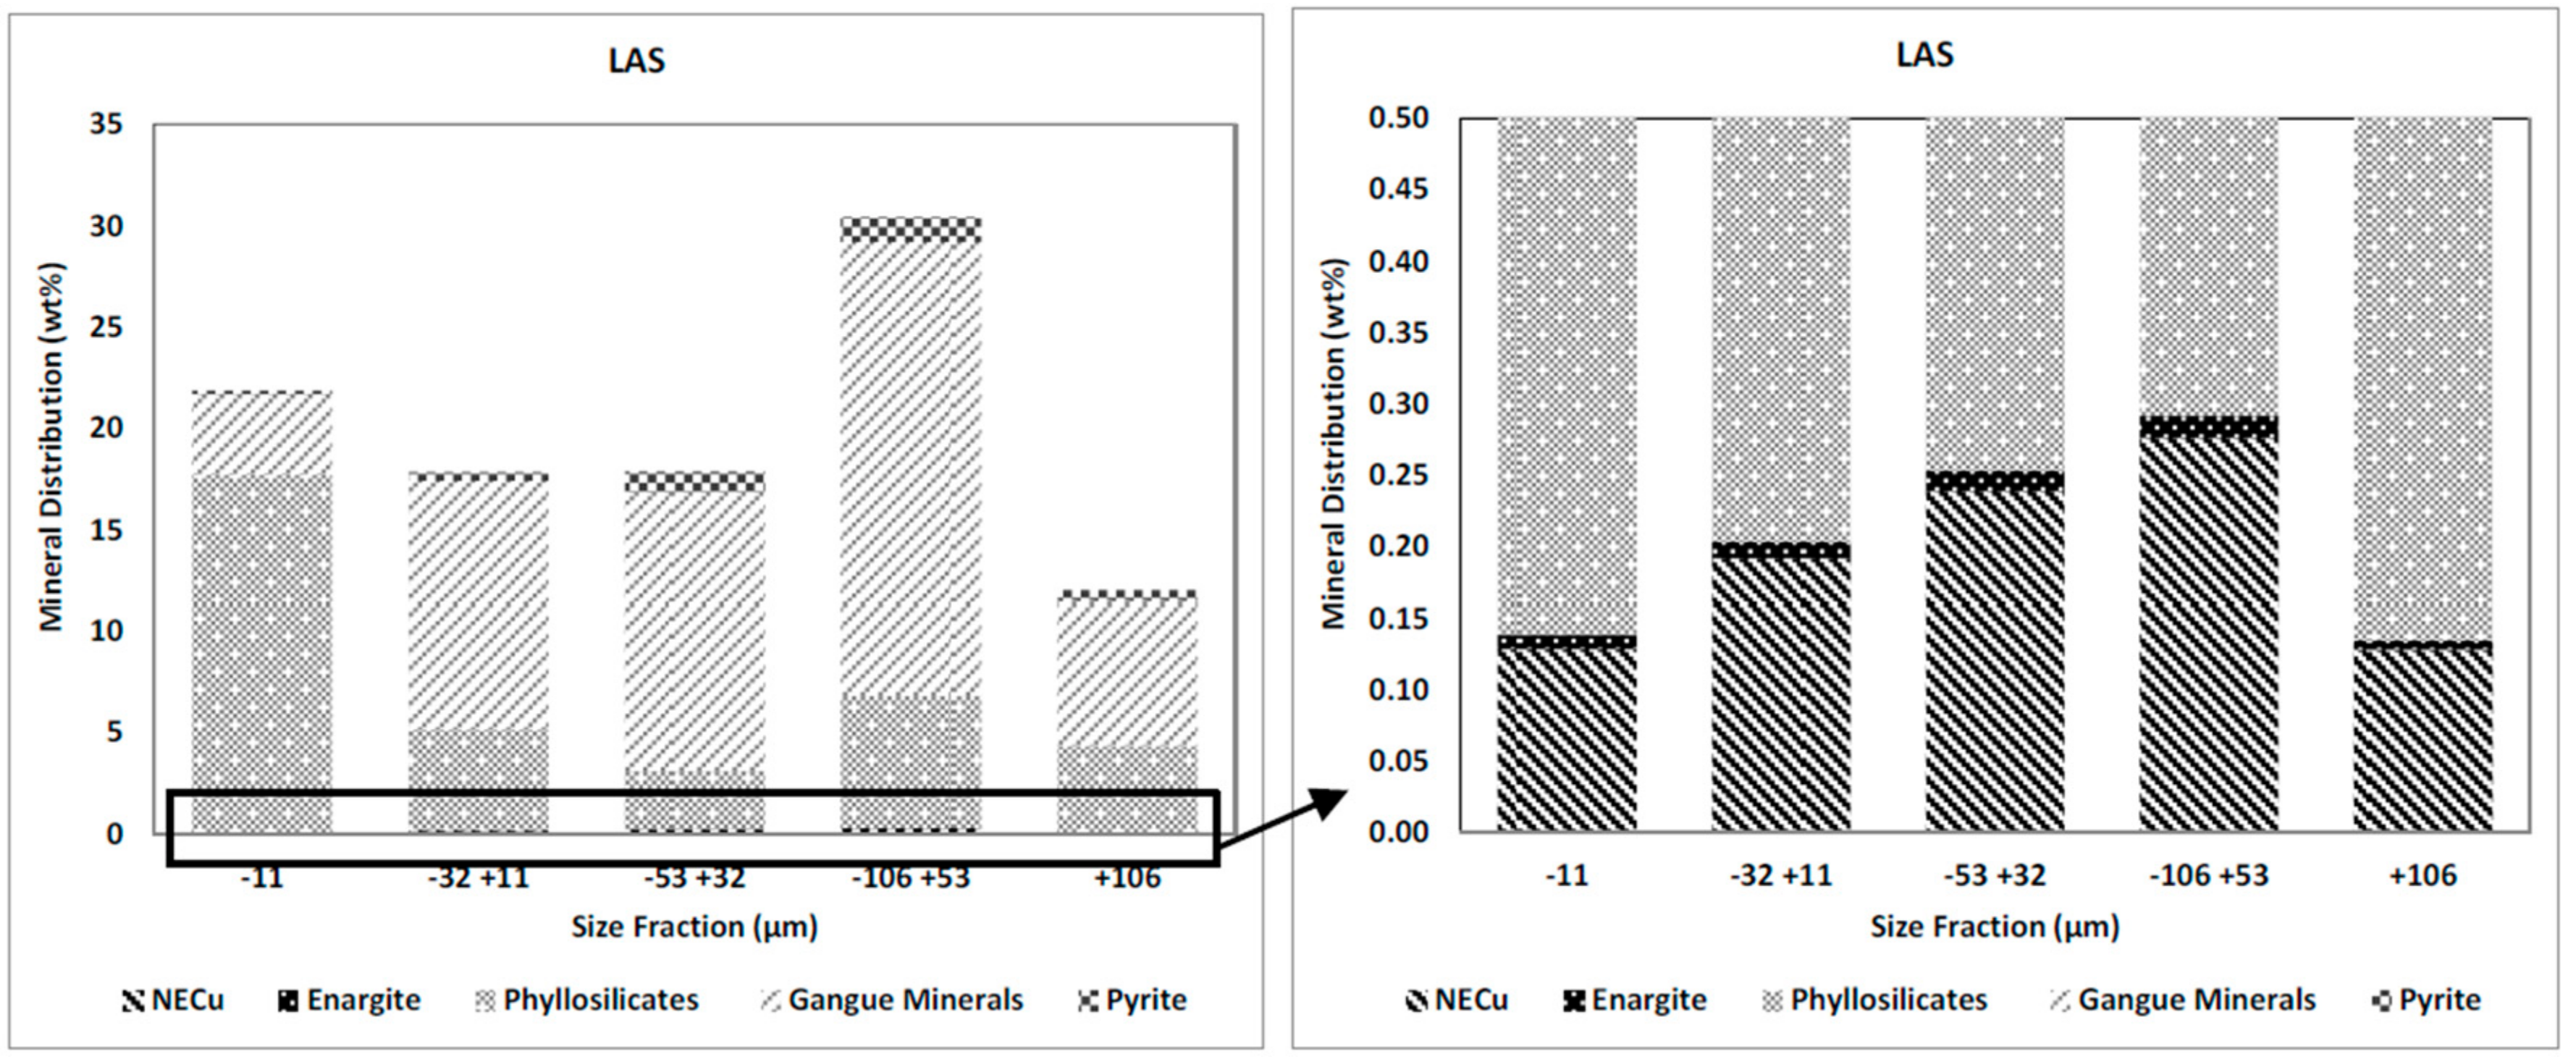
Figure 7.
Size-by-size NECu and enargite distributions in the HAS sample (a) and the LAS sample (b) (% by weight).
Figure 7.
Size-by-size NECu and enargite distributions in the HAS sample (a) and the LAS sample (b) (% by weight).

Figure 8.
Mineral liberation by particle composition for NECu minerals in different size fractions in the HAS sample (a) and the LAS sample (b).
Figure 8.
Mineral liberation by particle composition for NECu minerals in different size fractions in the HAS sample (a) and the LAS sample (b).

Figure 9.
Mineral liberation by particle composition for enargite in different size fractions in the HAS sample (a) and the LAS sample (b).
Figure 9.
Mineral liberation by particle composition for enargite in different size fractions in the HAS sample (a) and the LAS sample (b).

Figure 10.
Mineral association for enargite in the HAS sample (a) and the LAS sample (b).

Figure 11.
Grain size distributions for the HAS sample (a) and the LAS sample (b).

Figure 12.
Conceptual flowsheet.

Table 1.
Number of particles and grains measured (NECu: Non-Enargite Copper Minerals).
| Sample | High-Arsenic Sample (HAS) | Low-Arsenic Sample (LAS) | ||
|---|---|---|---|---|
| Mineral Group | Particle Count | Grain Count | Particle Count | Grain Count |
| NECu | 21,775 | 52,954 | 21,020 | 62,116 |
| Enargite | 3444 | 5297 | 4314 | 8181 |
| Others | 394,939 | 876,921 | 444,834 | 795,022 |
| Total | 420,158 | 935,172 | 470,168 | 865,319 |
Table 2.
Overall modal mineralogy of the HAS and the LAS ore samples (% by weight).
| Component | Major Mineral | Nominal Formula | HAS | LAS | |
|---|---|---|---|---|---|
| Non-Enargite Copper Minerals (NECu) | Main Copper Minerals | Chalcopyrite | CuFeS2 | 0.39 | 0.32 |
| Bornite | Cu5Fe2S4 | 0.58 | 0.48 | ||
| Other Copper Minerals | Digenite | Cu9S5 | 0.02 | 0.06 | |
| Covellite | CuS | 0.06 | 0.03 | ||
| Tetrahedrite | (Cu,Fe)12Sb4S13 | 0.11 | 0.08 | ||
| Copper-Arsenic Mineral | Enargite | Cu3AsS4 | 0.12 | 0.06 | |
| Sulphide Gangue | Pyrite | FeS2 | 5.4 | 3.3 | |
| Non-Sulphide Gangue (NSG) | Phyllosilicate | Muscovite | KAl3Si3O10(F,OH)2 | 5.7 | 28.7 |
| Pyrophyllite | Al2Si4O10(OH)2 | 12.8 | 6.6 | ||
| Kaolinite | Al2Si2O5(OH)4 | 4.5 | 0.9 | ||
| Other Gangue Minerals | Quartz | SiO2 | 59.3 | 56.0 | |
| Diaspore | AlO(OH) | 7.3 | 1.7 | ||
| Others | Various | 3.8 | 1.8 | ||
| Total | 100.0 | 100.0 | |||
© 2017 by the authors. Licensee MDPI, Basel, Switzerland. This article is an open access article distributed under the terms and conditions of the Creative Commons Attribution (CC BY) license (http://creativecommons.org/licenses/by/4.0/).
Share and Cite
MDPI and ACS Style
Tayebi-Khorami, M.; Manlapig, E.; Forbes, E. Relating the Mineralogical Characteristics of Tampakan Ore to Enargite Separation. Minerals 2017, 7, 77. https://doi.org/10.3390/min7050077
AMA Style
Tayebi-Khorami M, Manlapig E, Forbes E. Relating the Mineralogical Characteristics of Tampakan Ore to Enargite Separation. Minerals. 2017; 7(5):77. https://doi.org/10.3390/min7050077
Chicago/Turabian StyleTayebi-Khorami, Maedeh, Emmanuel Manlapig, and Elizaveta Forbes. 2017. "Relating the Mineralogical Characteristics of Tampakan Ore to Enargite Separation" Minerals 7, no. 5: 77. https://doi.org/10.3390/min7050077
Note that from the first issue of 2016, this journal uses article numbers instead of page numbers. See further details here.