
Study of the Effect of Sodium Sulfide as a Selective Depressor in the Separation of Chalcopyrite and Molybdenite


1
School of Resource and Environmental Engineering, Wuhan University of Technology, 122 Luoshi Road, Wuhan 430070, China
2
Mining Engineering Department, University of Khartoum, Khartoum 11111, Sudan
*
Author to whom correspondence should be addressed.
Minerals 2017, 7(4), 51; https://doi.org/10.3390/min7040051
Submission received: 19 December 2016
/
Revised: 21 March 2017
/
Accepted: 27 March 2017
/
Published: 30 March 2017
(This article belongs to the Special Issue Flotation in Mineral Processing)
Abstract
:Two kinds of collectors, sodium butyl xanthate and kerosene, and a depressor, sodium sulfide, were used in this research. The study applied flotation tests, pulp potential measurements, contact angle measurements, adsorption calculations, and Fourier Transform Infrared Spectroscopy (FTIR) analyses to demonstrate the correlation between reagents and minerals. For xanthate collectors, the best flotation responses of chalcopyrite and molybdenite were obtained at pH = 8, and, for kerosene, these were obtained at pH = 4. The flotation of molybdenite seemed to be less influenced by xanthate than by kerosene, while that of chalcopyrite showed the opposite. The optimum concentration of sodium sulfide for separation was 0.03 mol/L, which rejected 83% chalcopyrite and recovered 82% molybdenite in the single mineral flotation. Pulp potential measurements revealed that the dixanthogen and xanthate were decomposed and desorbed, respectively, from the mineral surface in a reducing environment. The contact angle measurement and adsorption calculation conformed to the flotation response, indicating that few functions of the xanthate and sodium sulfide on the molybdenite flotation were due to their low adsorption densities. The FTIR results further clarified that the xanthate ion was adsorbed on chalcopyrite by forming cuprous xanthate and dixanthogen; however, on molybdenite the adsorption product was only dixanthogen. After conditioning with sodium sulfide, the chalcopyrite surface became clean, but the molybdenite surface still retained slight peaks of dixanthogen. Meanwhile, the possible mechanism was expounded in this research.
1. Introduction
Molybdenite (MoS2), the main occurrence state of molybdenum resources, is generally associated with chalcopyrite (CuFeS2) [1,2]. Since molybdenite is a valuable mineral, its collection and purification are of crucial importance, which requires more attention to research on the collector and depressor [3].
Molybdenite is a natural hydrophobic mineral, cleaved by the rupture of the weak bond of S–S [4], exposing a large slice of the sulfur hydrophobic face, which interacts with water only via dispersion forces [5]. However, the element distribution on the chalcopyrite surface accords to its chemical formula [6]. Cuprous/copper and ferric ions are known as the hydrophilic [7], resulting in less hydrophobicity of chalcopyrite surfaces. Due to the big difference between these two minerals, molybdenite can be recovered from a copper-bearing molybdenite ore by removing 99% of the copper [8].
Common sulfide mineral collectors such as xanthates and thiophosphates are known to adsorb onto molybdenite but are not necessarily effective for molybdenite flotation. In molybdenite flotation, the collector generally used is non-polar oil obtained from petroleum [9], such as kerosene and diesel oil. From this, one can conclude that molybdenite must have different surface properties with other sulfide minerals [10]. Therefore, the collector’s selection may provide an auxiliary way to separate molybdenite from chalcopyrite.
As molybdenite has better inherent floatability, most beneficiation plants prefer to float molybdenite and reject chalcopyrite to tailings. Lots of mineral treatment operations have paid attention to the depressants of chalcopyrites, such as the reductant (e.g., sodium sulfide, sodium hydrosulfide, Nokes, and sodium cyanide) [11,12,13], the oxidant (e.g., potassium permanganate and potassium dichromate) [14,15,16], and some organic depressors (e.g., chitosan and thioglycolic acid) [17,18]. The reductant is demonstrated to desorb the collector from the mineral surface in a reduced condition or even form hydrophilic species. The oxidant generally oxidizes the mineral surface and causes it to be hydrophilic. These organic depressors are declared to be hydrophilic and cover the mineral surface to prevent the adsorption of collectors. Although these reagents have a universal depression to sulfide minerals, molybdenite and chalcopyrite can successfully be separated due to their different surface properties, which determine the sensitivities of minerals to the depressor.
In this study, two collectors, sodium butyl xanthate and kerosene, were tested to find their different behaviors in the flotation of molybdenite and chalcopyrite under various conditions. Sodium sulfide, a simple depressor, was also applied in this investigation to report the optimum dosage for the selective flotation. Pulp potential and contact angle measurements were combined to demonstrate the flotation response. The Brunauer-Emmett-Teller (BET) measurement, ultraviolet spectrophotometer (UV), and inductively coupled plasma-optical emission spectrophotometry (ICP-OES) were used to calculate the reagent ion adsorption capacity and density on the mineral surface. The surface properties before and after conditioning with reagents were also analyzed by Fourier Transform Infrared Spectroscopy (FTIR) measurements.
2. Experimental
2.1. Minerals and Reagents
Pure minerals of chalcopyrite (Cp) and molybdenite (Mot), both obtained from Guangxi, China, were employed as experimental samples in this study. To ensure high-purity samples, large pieces of the chalcopyrite and molybdenite were individually broken, and unwanted substances (gangue minerals) were removed by tweezers under an optical microscope. X-ray diffraction (XRD) analyses indicated that most impurities in chalcopyrite were quartz, while the impurities in molybdenite were undetected (Figure 1). Chemical analyses showed that chalcopyrite contained 32.02% Cu, 29.13% Fe, 33.16% S, and 3.63% SiO2 and that molybdenite contained 58.88% Mo and 40.03% S. In addition, the chemical analysis method for Cu, Fe, S, and Si was titration, while for Mo it was carried out with UV. The mineral samples were ground and powdered manually in an agate mortar, which had high hardness, and it was difficult to contaminate the sample surface. Then they were screened to −100 + 45 μm for flotation tests and adsorption measurements. The BET specific surface areas of these size fractions of chalcopyrite and molybdenite were 0.31 and 0.57 m2/g, respectively, determined by an Autosorb-iQ analyzer (Quantachrome, Boynton Beach, FL, USA).
The collectors used in this investigation were sodium butyl xanthate (SBX) and kerosene, and the forther used was terpenic oil. Sodium chloride was added to maintain the ionic strength of the solution constant at 5 × 10⁻³ mol/L. Sodium sulfide (Na2S·9H2O) was used as the depressor. Hydrochloric acid and sodium hydroxide were added for pH adjustments. Sodium butyl xanthate, kerosene, and terpenic oil were industrial grade chemicals. Other reagents mentioned were of analytical grade. Stock aqueous solutions of sodium sulfide and sodium butyl xanthate were prepared daily. De-ionized water was used throughout this research work.
2.2. Laboratory Flotation Tests
All flotation tests were conducted at 5% solids by weight in a 100 mL microflotation cell. Mineral suspensions were prepared by single minerals at 22 °C in the presence of air. The flotation machine (Rock, Hanging Cell, Wuhan, China) operated at 1200 rpm and a flow rate of 0.6 dm3 per minute. Surface treated plexiglass cell walls and the impeller could effectively reduce the material loss by adhesion during high-speed stirring. Five minutes was allowed for the conditioning of each reagent. After 5 min flotation, both the concentrates and tailings were collected and dried to calculate mineral recovery (weighed by an analytical balance for which sensitivity is 0.0001 g). All tests were carried out in triplicate, and the average was taken to draw the figure. Obviously, if the result was not as expected or had big error compared to others, it would have been discarded.
To fully understand the mineral flotation responses in different pHs and different collectors, flotation tests were carried out at various pHs from 2 to 13 with SBX or kerosene. 100 g/t SBX or 40 g/t kerosene and 25 g/t terpenic oil were added in sequence before adjusting the pH values. The dosages were chosen by flotation tests, which are not presented in this paper. The dosages are 100 g/t SBX and 40 g/t kerosene, which could get full recoveries of chalcopyrite and molybdenite, respectively, in these microflotation tests. Although terpenic oil has certain floatability to sulfide minerals, this dosage of 25 g/t is insufficient for it to be an effective collector but enough to improve the solution surface activity. Flotation kinetic tests were carried out at pH = 11 with or without collectors during the flotation time from 0 to 5 min. The reagent addition steps were the same as with the former. The aeration purged was air in these flotation tests.
Selective flotation tests and pulp potential measurements were carried out at various sodium sulfide concentrations from 10−6 to 10−1 mol/L with different collectors. After adding the mineral sample to a 5 × 10⁻³ mol/L NaCl aqueous solution, the collector (SBX or kerosene), the depressor (sodium sulfide), and the frother (terpenic oil) were added in sequence then adjusted the pH to 11. During the condition of each reagent, the mineral suspensions were opened to the atmosphere. After that, in the beginning of the flotations and measurements, the suspensions were purged with nitrogen. The pulp potential was measured by a smooth platinum electrode relative to a saturated calomel electrode and recorded during the flotation time. The results were reported on a hydrogen scale by adding 0.2415 V. Since sulfide ions are well known to poison Pt electrodes. causing a sluggish response and erroneous readings [19], electrodes were cleaned with 10% diluted hydrochloric acid and deionized water. The electrode system was calibrated using a standard ferric-ferrous solution [20].
2.3. Contact Angle Measurements
The bulk molybdenite and chalcopyrite crystals used in this research were cut along with the cleavage plane as flat shapes using a scalpel and a stainless steel saw, then exposed for polishing with #800 to #2000 emery paper. Contact angle measurements were carried out at various concentrations of sodium sulfide from 10−6 to 10−1 mol/L with or without collectors. After conditioning with various concentrations of sodium sulfide for 5 min, the solution advancing and receding contact angle of the flat mineral surfaces was immediately measured by the sessile drop method [21]. All measurements were performed in triplicate.
2.4. Adsorption Measurements
The adsorption components in the flotation were butyl xanthate ions, kerosene, and sulfide ions. Kerosene is an oily collector, and it was very easy to adhere to the vessel surface in this research, whether the vessel was made of glass, plexiglass, or plastic. Therefore, the adsorption of kerosene was not presented because of its big error.
An ultraviolet spectrophotometer was used to measure the concentration of SBX remaining in the solution before and after contact with the sample. The characteristic peak of xanthate appears at a wavelength of 301 nm [22]. Standard solutions of various concentrations of SBX, 0.5, 1, 2, 3, 4 and 5 g/L, were used to attain the standard linear equation, then referred to the absorption intensity of the solution to calculate the concentration of xanthate remaining in the solution. An inductively coupled plasma-optical emission spectrometer (Perkin Elmer, Model Optima 4300 DV, Waltham, MA, USA) was used to quantify the element S in the solution before and after contact with the sample. Since few sulfur-containing anions are released from mineral samples and the oxidization of the sulfide reagent is maintained at a lower level, the total element S can be regarded as S2− from sodium sulfide. The solution was then introduced into the plasma formed in the quartz torch by an alumina injector (1.2 mm internal diameter (ID)). The formulas for calculating the adsorption capacity and adsorption density are listed below.
- AC—The adsorption capacity, mg.
- Cb—The ion concentration in the solution before contact with the sample, mg/L.
- Ca—The ion concentration in the solution after contact with the sample, mg/L.
- V—The volume of the solution measured, L.
- SBET—The BET specific surface area, m2/g.
- m—The mass of the sample, g.
- AD—The adsorption density, mg/m2.
2.5. FTIR Measurements
For the measurements of SBX adsorbed on mineral surfaces without contact with sodium sulfide, 5 g each pure sample and 100 g/t SBX were filled with deionized water to keep the final volume at 100 mL; the pH was adjusted to 11 and then stirred for 5 min using a magnetic stirrer. Similarly, for the measurements of SBX adsorbed on mineral surfaces with sodium sulfide added, 5 g of each pure sample and 100 g/t SBX were filled with 0.1 mol/L sodium sulfide solution to keep the final volume at 100 mL; the pH was also adjusted to 11, then stirred for 5 min using a magnetic stirrer. All reacted solid samples were filtered out and water-washed to get rid of the remainder solution on the mineral surface and dried using a vacuum pump with a Buchner funnel.
The adsorption of the chemical agent was assessed by utilizing attenuated total reflection (ATR) Fourier transforms infrared (FTIR) spectroscopy. The ATR accessory was outfitted with a diamond crystal as the reflection component. The spectrometer was supplied with a purgative system employing dried air to minimize the consequence of the lab wetness caused by water on the sample reading. The spectra was measured by spreading the solid sample directly onto the diamond crystal, which required only a small amount of sample. Samples did not undergo any treatment before measurement; the samples were more sensitive to the adsorbent component.
3. Results and Discussion
3.1. Laboratory Flotation Tests
Figure 2 presents the flotation response of chalcopyrite and molybdenite as a function of pH by adding SBX or kerosene. With the addition of kerosene as a collector, the flotation recoveries of chalcopyrite and molybdenite both increased and then decreased as the pH increased. Their maximum recoveries appeared at pH = 3–4. This can be explained by the zeta potential of the minerals. Non-polar oily collectors prefer to adsorb on zero field strength materials, depending on the value assigned to water molecules or clusters at the interface [23]. Thus it could be predicted that best flotation recoveries of these two minerals using kerosene appeared at their points of zero charge (PZCs). The PZC of chalcopyrite is in the low acidic pH = 2–3 region [24,25]. However, zeta potential measurements for molybdenite give very negative values over the whole pH range [26,27]. It is due to the anisotropic surfaces of molybdenite that both the charges of the faces and of the edges contribute to the overall zeta potential of molybdenite particles. Parreira and Schulman [28] used very pure paraffin wax instead of the face of molybdenite and found that the PZC of molybdenite hydrophobic faces seemed to be situated around pH = 4. Therefore, the maximum recovery conforms to the PZC of the mineral.
With the increasing pH, the zeta potentials of chalcopyrite and molybdenite became more and more negative, and hydrophilic metal hydroxides began to generate on the mineral surfaces, causing the recovery decrease. The recovery of molybdenite was 20%–30% higher than that of chalcopyrite, with kerosene used as a collector in the whole pH range. This indicates that kerosene is a better collector for molybdenite, compared with chalcopyrite. When the collector addition was SBX, with increasing pH, chalcopyrite recoveries were raised to the maximum at pH = 8, then were prominently reduced in high alkaline conditions. However, molybdenite recoveries showed different tendencies. Two peaks of the recovery curve appeared at pH = 3 and 8, and the maximum recovery was obtained at the latter. The low recoveries refer to the instability and weak hydrolysis of SBX in acidic environments. Under this condition, sodium butyl xanthate can react with hydrogen ions to form butyl xanthate acid, which can easily be decomposed to carbon disulfide and butanol [29]. Once the pH increases to alkaline, butyl xanthate ions (BX−) become relatively stable in the solution and react with the mineral surfaces to form hydrophobic species [30]. In high alkaline conditions, however, hydroxide species can block the adsorption process of xanthate with metal ions [31]. The maximum recoveries of both minerals appeared at pH = 8 and confirmed those mechanisms. Additionally, the peak of molybdenite recoveries at pH = 3 was responsible for the PZC of the hydrophobic face. The recoveries of molybdenite were also shown to be 0%–5% higher than those of chalcopyrite using SBX in whole pH ranges but still 3%–10% lower than those of molybdenite using kerosene as a collector. The collector contrast test indicates that the SBX is a better collector for chalcopyrite flotation, while kerosene is better for molybdenite.
Figure 3 presents the flotation behavior of chalcopyrite and molybdenite as a function of flotation time treated with different collectors at pH = 11. As shown in Figure 3a, chalcopyrite recoveries increased dramatically from 0 to 2 min flotation and tended to be stable after 4 min flotation, indicating that 5 min flotation is enough to get full chalcopyrite recoveries. Under these conditions, chalcopyrite flotation using SBX as a collector showed the best recovery at 80% compared with the use of kerosene (63% recovery) or collectorless (44% recovery). It indicates that both SBX and kerosene can significantly improve chalcopyrite flotation. Kerosene can only physically adsorb on the chalcopyrite surface because it has no active group. BX− can react with cuprous and copper ions exposed on chalcopyrite surfaces to form CuBX and Cu(BX)2 [32], which refers to chemical adsorption. Moreover, the dispersibility of SBX is better than kerosene in an aqueous solution; it has more opportunities to contact chalcopyrite particles. Thus, chalcopyrite showed a better flotation response using SBX as a collector. In the case of molybdenite flotation, shown in Figure 3b, 5 min flotation could reach maximum recoveries by adding kerosene or none of the collectors but is almost insufficient when using SBX. This is because xanthates are weak collectors for molybdenite and molybdenite is commonly floated with the addition of non-polar oily collectors [33]. Castro and Mayata [34] have found that fine particles of molybdenite (6.8 μm) practically do not respond to an increase in xanthate doses, but with coarse particles (51.7 μm) flotation recoveries are significantly enhanced. The results suggest that xanthate effectively improves the flotation of molybdenite only in large particle sizes, which have a higher degree of inherent hydrophobic given by the large faces/edges ratio. Moreover, Castro [33] has summarized that no insoluble metal xanthate has been detected on molybdenite, indicating that xanthate ions cannot chemically adsorb on molybdenite surfaces. However, in the presence of dissolved oxygen, semi-conducting minerals (sulfides) are able to electro-catalytically oxidize xanthate ions to form non-polar dimmer molecules (dixanthogen), which adsorb on the faces sites of minerals [35,36]. Therefore, the effective flotation response is mainly attributed to non-polar oily collectors (i.e., kerosene and dixanthogen). As the oxidation reaction of xanthate needs time to complete, 5 min for molybdenite flotation with the addition of SBX as a collector was not enough to meet the maximum recovery. Although SBX and kerosene both improve molybdenite floatability, kerosene is a better collector for molybdenite flotation. Comparing the results from Figure 3a,b, molybdenite had stronger inherent floatability, regardless of the collector used in the flotation, and the recovery of molybdenite always showed a better response than that of chalcopyrite, which is consistent with the result in Figure 2.
The flotation behavior and the pulp potential of chalcopyrite treated with different dosages of sodium sulfide and 100 g/t SBX or 40 g/t kerosene used as the collector at pH = 11 are plotted in Figure 4. According to the hydrolytic equilibrium of sodium sulfide in aqueous solution, the main role of sulfur-containing anions is hydrosulfide. Optimum chalcopyrite flotation was obtained with sodium sulfide added at about 10−4 mol/L, indicating that a small amount of sodium sulfide addition could improve chalcopyrite flotation. It seems that hydrosulfide prefers to react with metal ions dissolved from chalcopyrite or its oxidized species, resulting in xanthate to more effectively float chalcopyrite particles [37], and it also can be explained by the sulfur induced flotation of chalcopyrite, i.e., the HS− ion is oxidized to hydrophobic S0 by redox reactions and adsorbs on chalcopyrite surface to make it more floatable [38,39]. As Chander [40] reveals that platinum electrodes respond to changes in the hydrosulfide ion concentration in solution, the pulp potential in this study changed a little in the low sodium sulfide addition (Figure 4b). Chalcopyrite flotation drastically fell with the addition of sodium sulfide from 5 × 10⁻³ to 3 × 10⁻² mol/L. The edge of the depression coincides with the drop in pulp potential. The poor flotation response when the sulfide added is greater than 5 × 10⁻³ mol/L and is directly related to a cathodic shift in potential below the value required for copper butyl xanthate formation. Under reducing conditions, the mineral surface is free of exchangeable oxide species and highly negatively charged as a result of a high adsorption density of hydrosulfide ions [41]. These phenomena were generated by the competitive adsorption of hydrosulfide ions and butyl xanthate ions with cuprous/copper ions on the chalcopyrite surface. Figure 4b also shows a difference; the flotation response with kerosene added was still at a lower level, even though its pulp potential was higher. According to the results in Figure 3, kerosene is not a suitable collector for chalcopyrite; its efficiency is astricted by the dispersibility in aqueous solution. Further, kerosene does not show the oxidation-reduction quality in this condition; it seems not to be affected by the change of Eh. This opinion agrees with the flotation behavior in large doses of sodium sulfide. With 10−1 mol/L sodium sulfide added, the pulp potential was mainly controlled by the hydrosulfide ion, resulting in the similar Eh (about −390 mV) value for different collectors, but their recoveries were against their effectiveness shown in the high Eh lever. It can be clarified by the physical motion of collector shapes, i.e., the kerosene drop and the butyl xanthate ion. During violent stirring, the drop has a greater kinetic energy to break through the electrical double layer, and it directly contacts with particles or cocoons the particle, leading to more floatable chalcopyrite (see Figure 5).
Actually, the breakthrough phenomenon rarely occurs since the chalcopyrite recovery is still very low. The hard breakthrough may be caused by the multilayer adsorption of hydrosulfide ions on mineral surfaces, which were thick and strongly charged negatively, to prevent chalcopyrite particles from contacting with collectors. Hence, depression began due to the negatively charged surface, multilayer adsorption of hydrosulfide ions, and reducing potentials, all of which impede collector adsorption.
The flotation response of molybdenite (a) and its Eh (b) at pH = 11 under various concentrations of sodium sulfide with the addition of 100 g/t SBX or 40 g/t kerosene as a collector are given in Figure 6. The molybdenite recovery seemed unchangeable in a low dose of added sodium sulfide (less than 10−4 mol/L), and a sharp drop occurred when the added sulfide concentration was more than 5 × 10⁻³ mol/L. This is similar to the flotation response of chalcopyrite, but the descent rate of molybdenite was much less than that of chalcopyrite. The pulp potential also showed the same trend. However, there is a remarkable difference between the kerosene and SBX molybdenite flotation recoveries, using kerosene as a collector, were stable (about 87%) in the sulfide dose range from 10−4 to 5 × 10⁻³ mol/L but decreased by about 5% when using SBX. These results may be caused by the unique structure of molybdenite crystals. According to the literature [33], molybdenite has anisotropic surface properties, i.e., (1) hydrophobic faces formed by the break of weak S–S bonds and (2) hydrophilic edges generated by the rupture of strong covalent Mo–S bonds, which resulted in the large faces/edges ratio. Non-polar oil, such as kerosene and dixanthogen, can adsorb on the faces to enhance its hydrophobicity. The edges that contain Mo atoms could not react with collectors, but only release MoO42− or HMoO4− in aqueous solution. The main hydrosulfide ion consumption must have taken place at the Mo atom on the edges. In this case, molybdenite still shows better recoveries than chalcopyrite in the same condition. Moreover, the dixanthogen oxidized by xanthates is decomposed when the Eh is decreased lower than its formation potential value (about 180 mV at pH = 11 [42]) by adding a certain amount of sodium sulfide, resulting in the lower molybdenite recovery compared with the use of kerosene. From the recovery curves in Figure 4 and Figure 6, it can be concluded that the optimum dose of sodium sulfide added is 3 × 10⁻² mol/L, which not only depresses chalcopyrite flotation effectively but also reduces the losses of molybdenite recovery greatly. Further, the best reagent condition for molybdenite-chalcopyrite flotation and separation is using kerosene in the bulk flotation to obtain high molybdenite recovery and applying xanthate with sodium sulfide in the selective flotation to reject more chalcopyrite.
3.2. Contact Angle Measurements
Figure 7 presents the contact angles of chalcopyrite (a) and molybdenite faces (b) at pH = 11 as a function of sulfide concentrations with or without collectors. As shown in Figure 7a, the contact angle of chalcopyrite increased a little when the sulfide concentration was 10−4 mol/L, then dramatically dropped in the range from 10−3 to 3 × 10⁻² mol/L, and at last slowly decreased to a relatively stable value at 0.1 mol/L, which agreed with the flotation responses in Figure 4a. The contact angle conditioned with kerosene was lower in the beginning and higher in the end with the sulfide dose increase, in contrast to the contact angle conditioned with SBX, which conformed to the result in Figure 4a. The untreated chalcopyrite sample has a contact angle at 73°, in accordance with the test by Tsuyoshi Hirajima [16], which reveals that the measurement is reliable and reproducible. Obviously, the chalcopyrite contact angle conditioned with SBX was approximately equal to that of the collectorless sample in the sulfide concentration of 0.1 mol/L. It indicates that xanthate ions must be fully desorbed to the aqueous solution from the chalcopyrite surface in order for them not to affect the adsorption density of hydrosulfide. As shown in Figure 7b, the contact angle curves of molybdenite faces by adding amounts of collectors were constant at a lower sulfide concentration (<10−3 mol/L) but were vastly reduced when the sulfide concentration continuously increased, which showed the same trend with molybdenite flotation (Figure 6a). The contact angle of untreated molybdenite faces is 81°, which is consistent with the measurement of Arbiter et al. [43]; molybdenite faces have a contact angle from 70° to 90° by different polishing operations. In contrast to the condition without collector, the molybdenite faces reaction with SBX had bigger contact angles, even though the sulfide concentration increased to 0.1 mol/L, which is different from the behavior of chalcopyrite. It indicates that certain amounts of xanthate ions still exist or adsorb on molybdenite surfaces. The adsorption capacity and density were calculated to clarify the phenomenon in the next part.
3.3. Adsorption Measurements
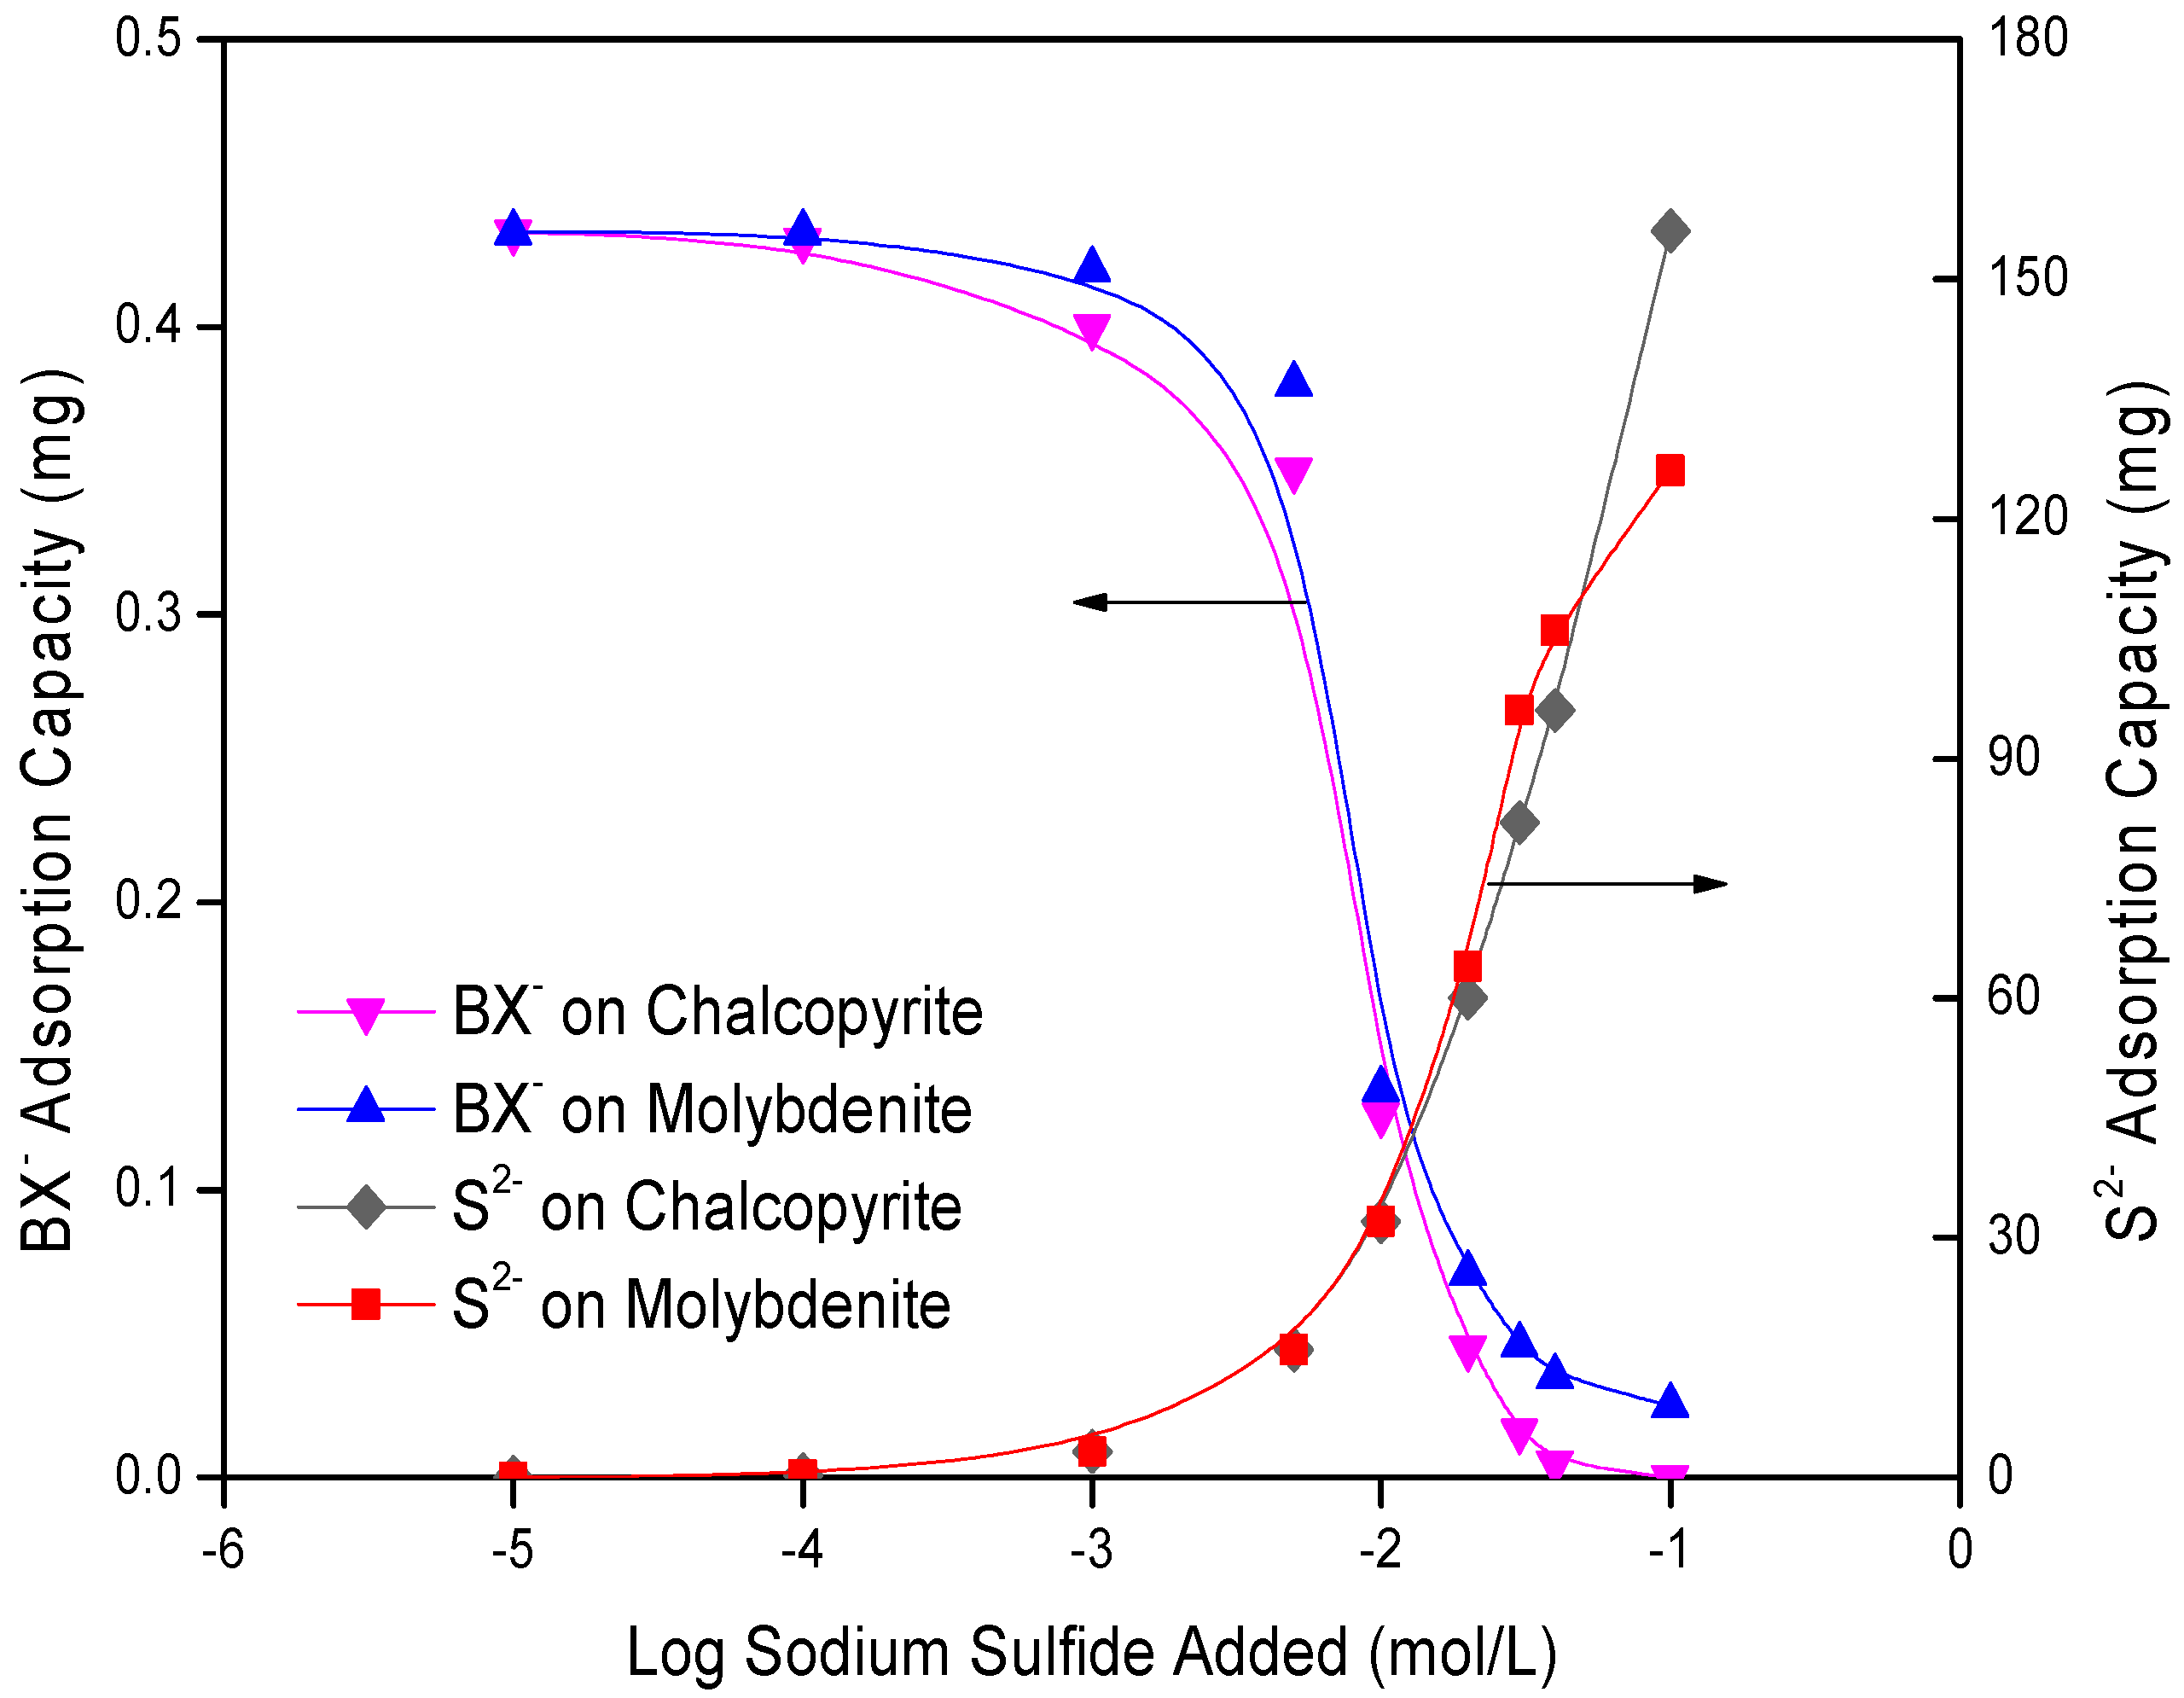
Figure 8 exhibits the adsorption capacities of BX− and S2− on chalcopyrite and molybdenite surfaces treated with different dosages of sodium sulfide. The left axle belongs to the butyl xanthate ion adsorption capacity, which showed that BX− ions completely adsorbed on molybdenite and chalcopyrite surfaces at 10−5 mol/L sulfide, i.e., almost no BX− ions were detected in the residual solution. After that, the BX− on chalcopyrite dropped faster than on molybdenite with the sulfide concentration increase. Finally, BX− still remained in small amounts on molybdenite but disappeared on chalcopyrite. These performances prove that high sodium sulfide concentration could seriously destroy the adsorption of xanthate on sulfide minerals, especially on chalcopyrite. The complete desorption on chalcopyrite at 0.1 mol/L sulfide agrees with the contact angle results in Figure 7a. Thus, the incomplete desorption on molybdenite may be due to the larger specific surface area, the better inherent floatability, or the unique layered structure. BET measurements showed that molybdenite samples were about twice the surface area of chalcopyrite samples, which suggested that molybdenite had stronger adsorbability, according to the concept of higher adsorption capacities occurring on larger surface areas [44]. The better inherent floatability of molybdenite predicts that it would be more attractive to the non-polar group of chemicals [45]. The unique layered structure of molybdenite may allow the collector or its branch to diffuse as molybdenite is a layered modified material [46]. The sulfide (hydrosulfide) ion adsorption capacity marked in the right axle showed that sulfide completely adsorbed on chalcopyrite and molybdenite and obtained the same absorption capacities when the sulfide concentration was less than 0.01 mol/L. Then molybdenite had a little more sulfide coating than chalcopyrite in the sulfide concentration range from 0.01 to 0.04 mol/L, while having fewer sulfide coverages than chalcopyrite when the sulfide was added to 0.1 mol/L. It seems that sulfide (hydrosulfdie) does not tend to adsorb on molybdenite in high sulfide concentrations. The BX− and S2− adsorption densities are also calculated and presented in Figure 9. The density of butyl xanthate adsorbed on molybdenite is much less than that of chalcopyrite in a sulfide dosage lower than 0.02 mol/L. In contrast, with the sulfide dosage continuously increasing, the BX− adsorption density on molybdenite was shown to be a little higher than that of chalcopyrite, which clearly explained the flotation responses of chalcopyrite and molybdenite with SBX in the high sulfide concentration, in which molybdenite retains its floatability. Different from the BX− adsorption density, the S2− density adsorbed on chalcopyrite was always higher than on the molybdenite in the same concentrations, and the gap between these two adsorption densities became greater as the sulfide dosage increased. It also indicated less depression of sodium sulfide on molybdenite.
3.4. FTIR Measurements
Figure 10 demonstrates the FTIR spectrum of sodium butyl xanthate, which is industrial grade. The spectrum is enlarged to reveal the details of the characteristic peaks of xanthate in the range of 1400–800 cm−1. According to the literatures [47,48], the spectral peak at 1069.18 cm−1 assigns to the C=S stretching vibration of SBX. The intense peak at 1112.40 cm−1 symbolizes to the C–O–C symmetric stretching vibration, and that at 1162.52 cm−1 refers to the C–O–C asymmetric stretching vibration of SBX. The peaks detected at 1021.64 and 1040 cm−1 are attributed to the C=S stretching vibration in (BX)2. The peak at 1212.42 cm−1 also assigns to the C–O–C symmetric stretching vibration, and the 1260.92 and 1245.07 cm−1 peaks correspond to C–O–C asymmetric stretching vibration in (BX)2. Evidently, the C=S vibration peak of (BX)2 shifted toward lower wavenumbers as the C–O–C vibrations moved toward higher wavenumbers, compared to those of SBX. It indicates that the SBX collector has been oxidized and contains (BX)2 [49]. Although the SBX was partly oxidized, it did not influence the adsorption measurement. In the chalcopyrite suspension, the copper ion could react with BX− in solution to form unstable Cu(BX)2, which in turn dissociated into CuBX and (BX)2, as shown in the following equation [31]:
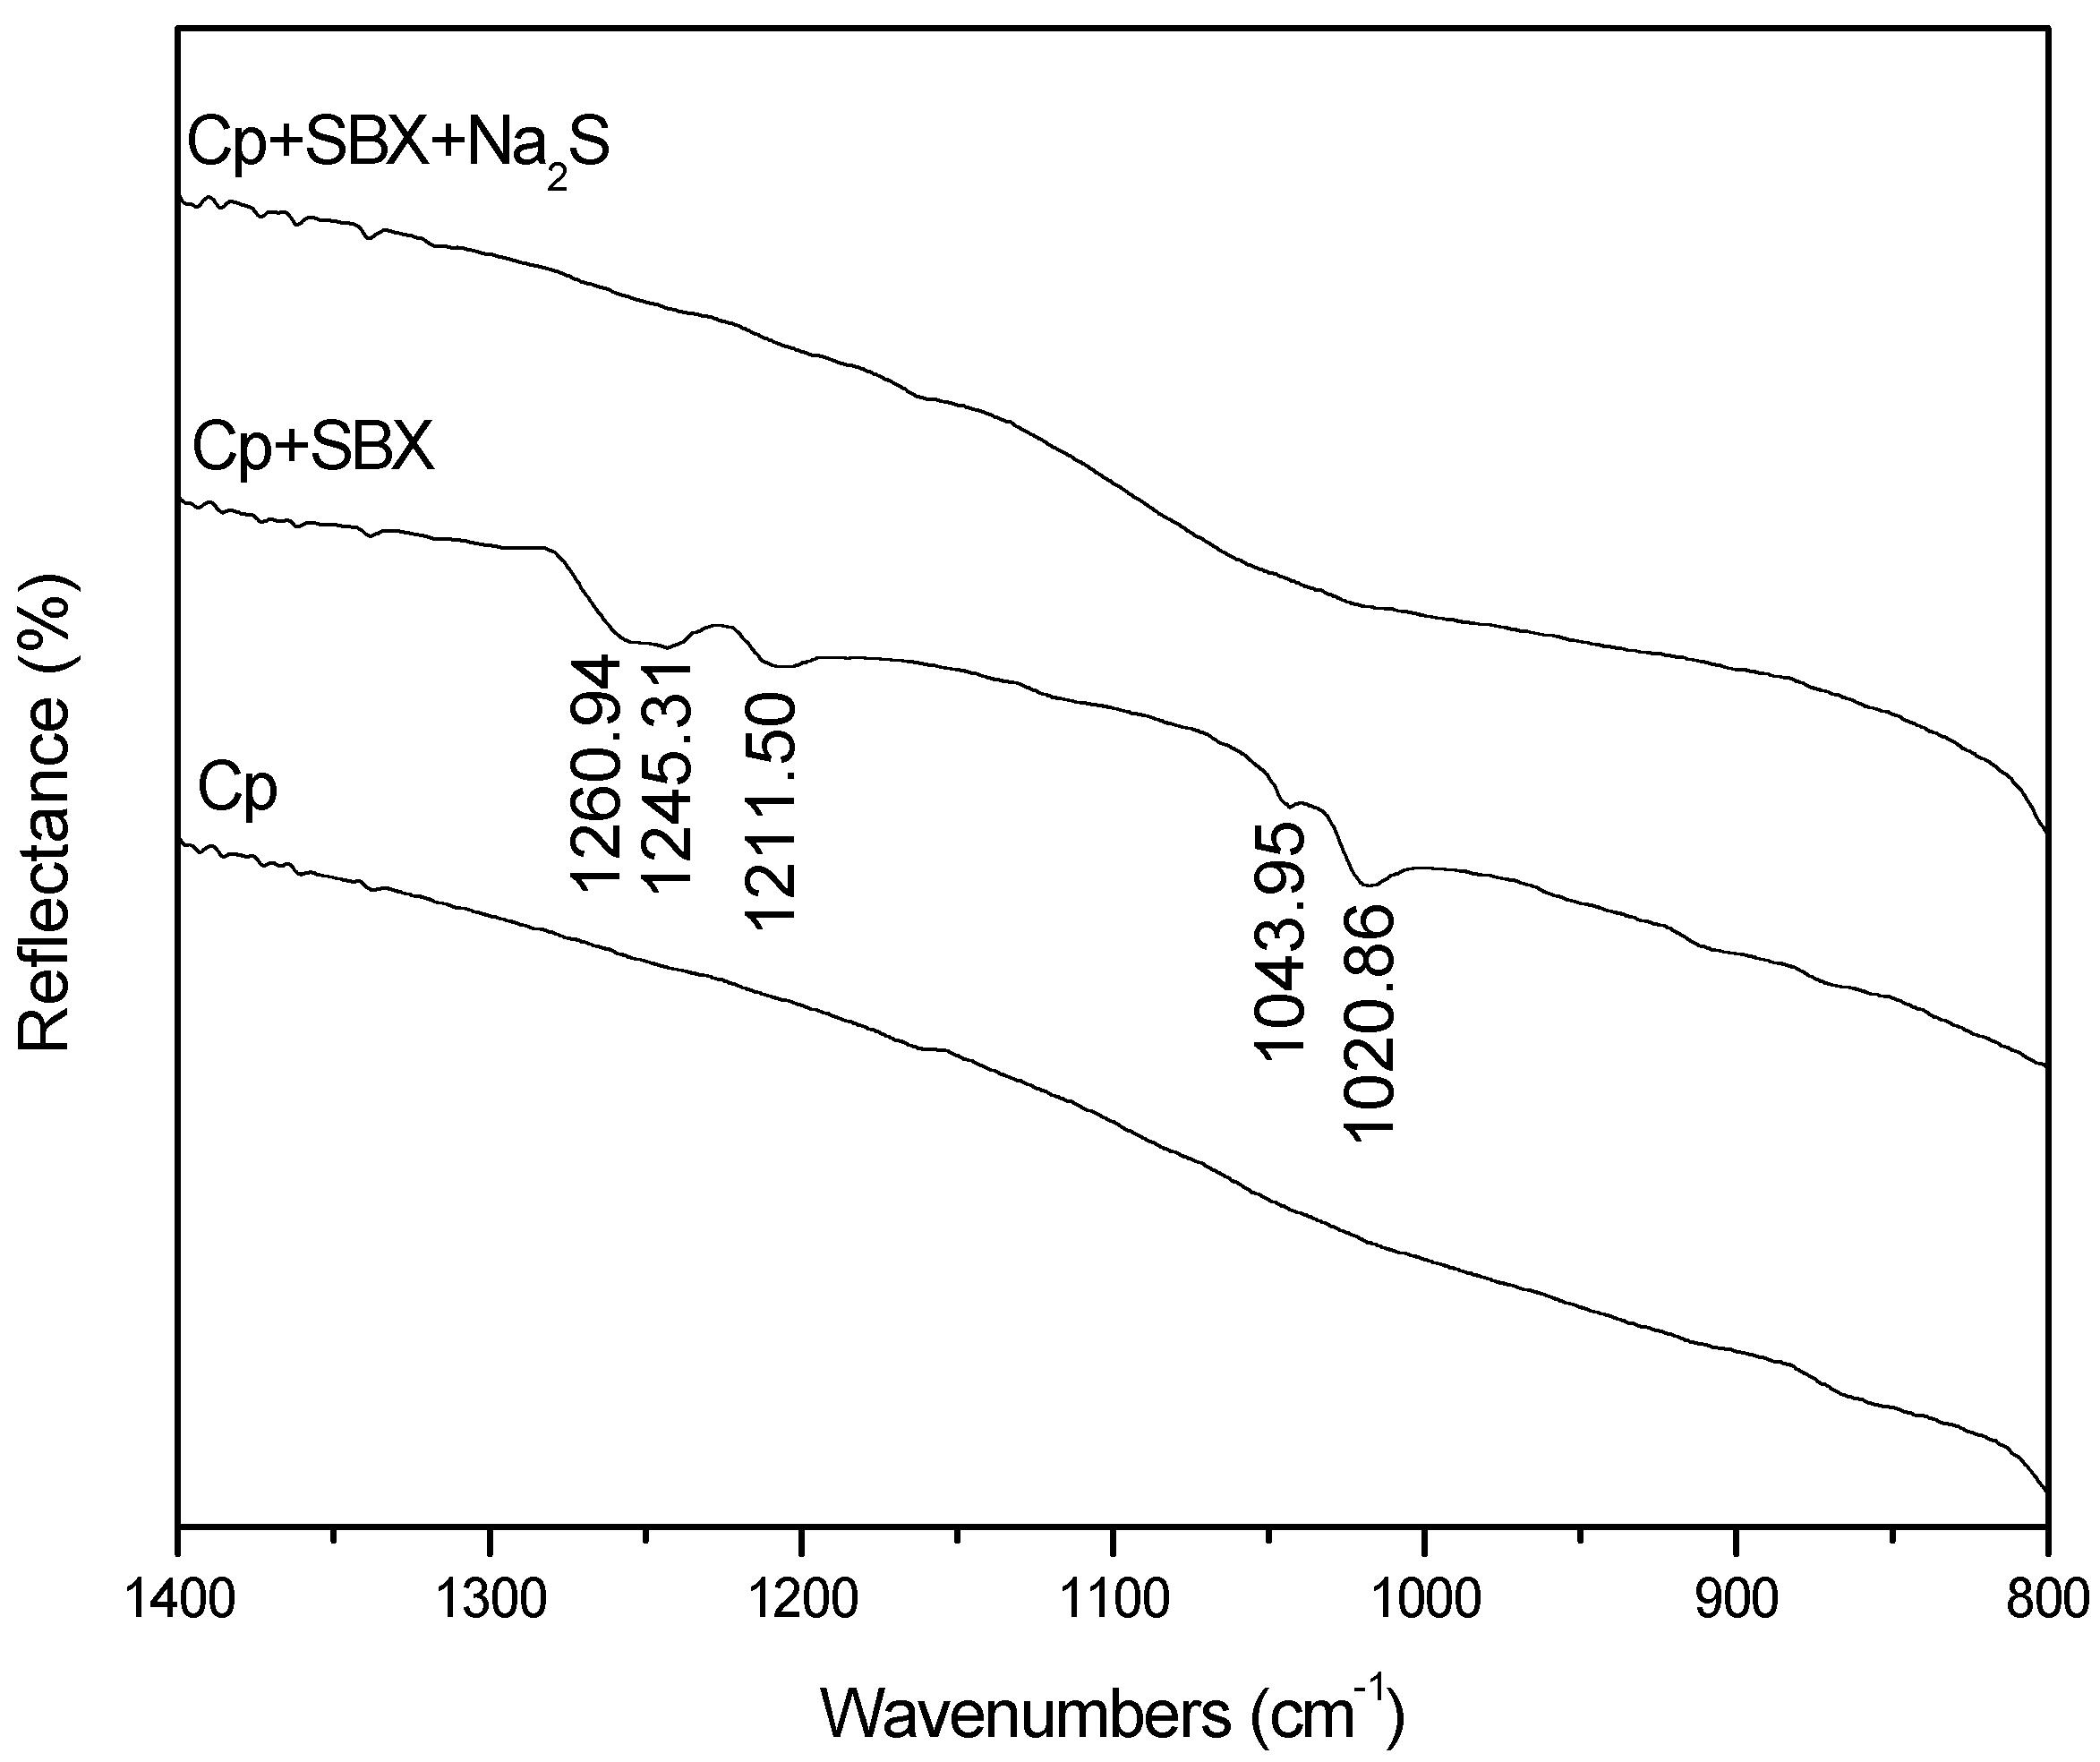
The FTIR spectrum of chalcopyrite before and after conditioning with SBX and Na2S is presented in Figure 11. No vibration peak was found in the FTIR spectrum of the unprocessed chalcopyrite sample. After conditioning with SBX for 5 min, five visible absorption peaks were detected on the chalcopyrite surface. The weak intensities of these peaks may be due to the less reagent dosage and limited reaction time. The C=S vibration peak of CuBX shifts toward lower wavenumbers, while the C–O–C vibration shifts toward higher wavenumbers, compared with those of butyl xanthate, due to the coordinated structure of CuBX [47]. It reveals that 1043.95 cm−1 is due to the C=S stretching of CuBX, which shifts from 1069.18 to 1043.95 cm−1. Also, the peak at 1211.50 cm−1 and the broad peak containing 1260.94 and 1245.31 cm−1 are attributed to the C–O–C symmetric and asymmetric stretching of (BX)2, respectively. The peak at 1020.86 cm−1 corresponds to the C=S stretching vibration in (BX)2. No obvious shift (less than 20 cm−1) occurring during the adsorption of (BX)2 indicates that (BX)2 physically adsorbs on the chalcopyrite surface [50]. After conditioning with Na2S for 5 min, all absorption peaks disappeared, indicating that sodium sulfide could decompose the products, CuBX and (BX)2, on the chalcopyrite surface. Two equations can be used to explain the mechanism.
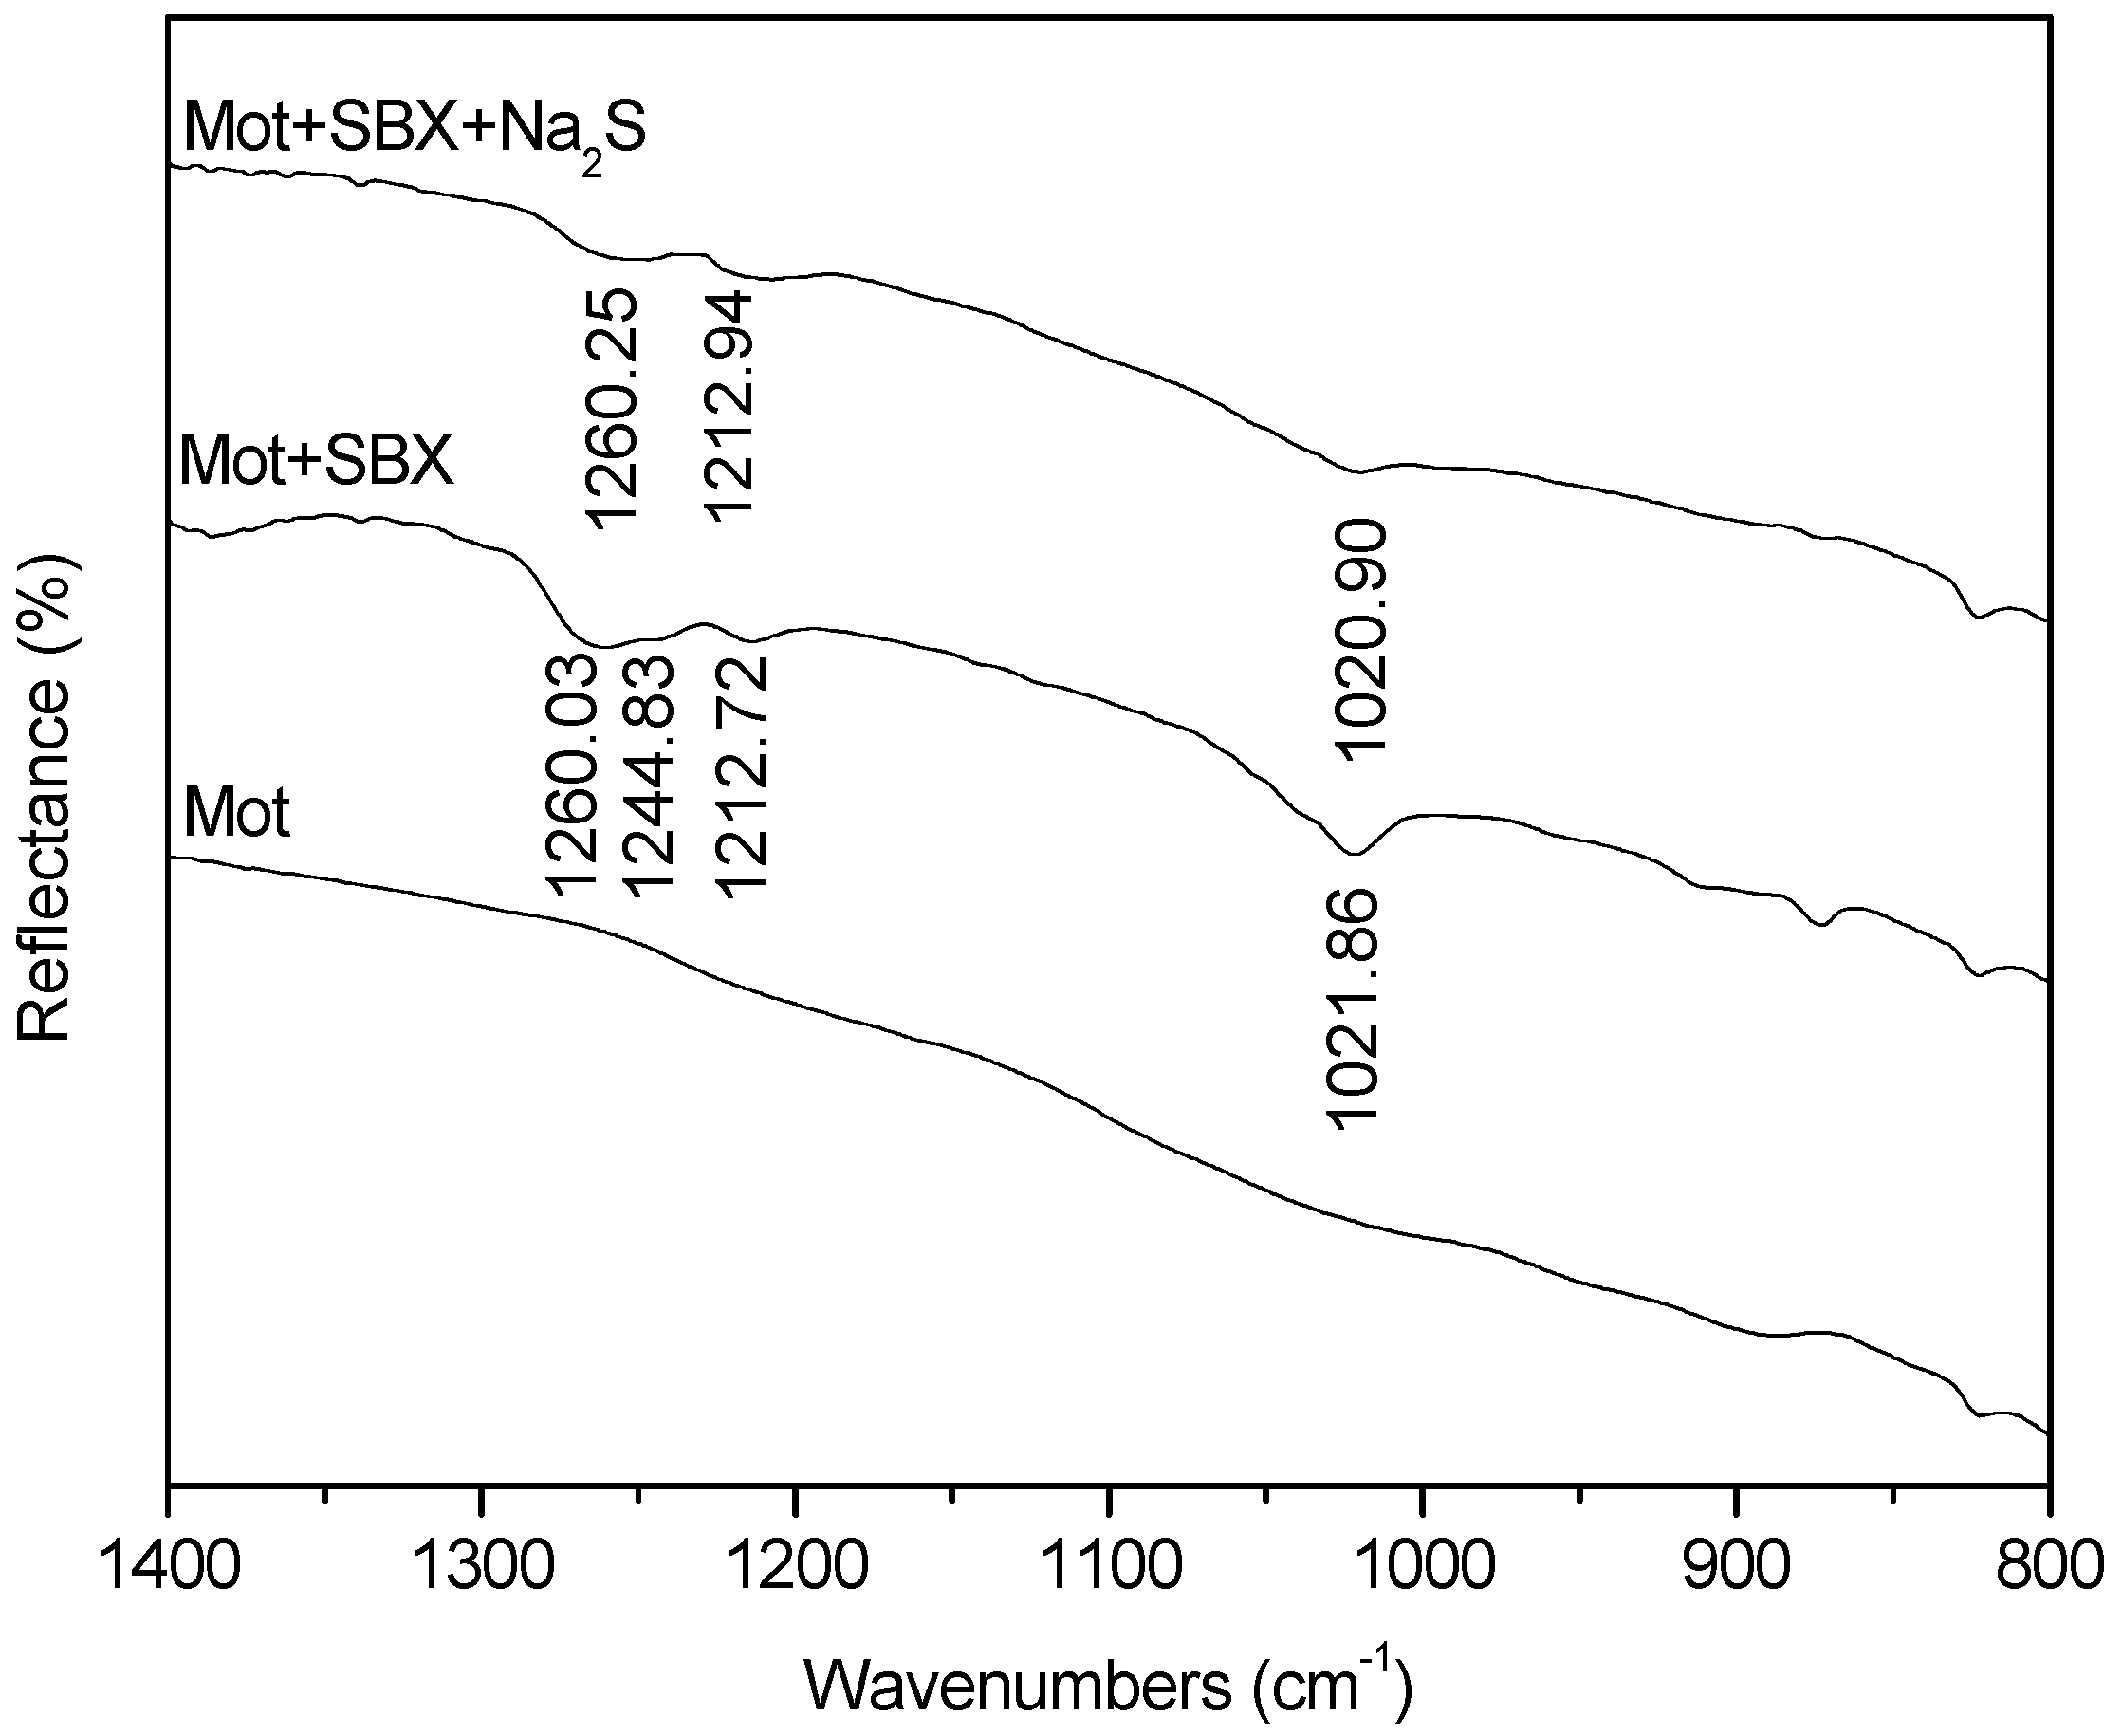
The FTIR spectrum of the molybdenite surface before and after conditioning with SBX and Na2S is shown in Figure 12. Similarly, no vibration peak was detected by the FTIR spectrum for the untreated molybdenite sample. After conditioning with SBX, the characteristic peaks of (BX)2 were exposed on the mineral surface. However, peaks of BX− were not found, maybe due to its low intensity. Then, after conditioning with sodium sulfide, the intensities of these peaks were reduced but did not disappear, suggesting the difference with chalcopyrite [51]. The (BX)2 physically adsorbed on the surface of molybdenite, and it was very easy for it to be desorbed by sodium sulfide. This was surprising because (BX)2 is relative stable on molybdenite surfaces. Probably it happened as a result of the larger specific surface area, the better inherent floatability, or the unique layered structure of molybdenite, which have been illustrated in Figure 8.
4. Conclusions
Flotation tests in various pHs showed that molybdenite had better floatability than chalcopyrite in the whole pH range. The collector, kerosene, had an optimal condition at pH = 4 to get maximum mineral flotation recovery, which was determined by the PZC of the mineral. The best condition for SBX was at pH = 8, which was responsible for the stability of SBX and the mineral surface property. Flotation kinetics indicated that SBX efficiently improved the mineral flotation, and it was not directly to float molybdenite instead of forming dixanthogen first. Kerosene gave a high recovery of molybdenite but seemed not to be effective for chalcopyrite because of its less inherent hydrophobic surface area.
The flotation response, after adding various dosages of sodium sulfide, presented the same trend with chalcopyrite and molybdenite., The recovery remained unchanged or slightly increased under the low concentration of sodium sulfide (less than 0.001 mol/L) and then sharply dropped as the sulfide concentration became higher than 0.01 mol/L. Differently, the molybdenite showed less sensitivity to sodium sulfide and still reported a high recovery when chalcopyrite was fully depressed. The pulp potential measured by a smooth Pt/calomel electrode system revealed that the depression occurring at high sulfide concentrations was due to the strong reducing environment; the mineral surface was free of exchangeable oxide species and highly charged negatively as a result of the high adsorption density of hydrosulfide ions. Kerosene, as a non-polar oil, still renders a little floatability to chalcopyrite in high sulfide dosages. Moreover, the contact angle measurement completely agreed with the flotation response. As a consequence, the optimum concentration for separation chalcopyrite and molybdenite was 0.03 mol/L. The bulk flotation using kerosene as a collector could achieve high molybdenite recovery, while using xanthate and high doses of sodium sulfide could reject more chalcopyrite.
The adsorption capacities and densities of BX− and S2− on minerals were calculated, and it was found that more xanthate ions adsorbed on molybdenite but showed fewer densities due to the large BET surface area. Further, the S2− prefered to adsorb on the chalcopyrite surfaces in multiple layers, which always had a larger density than S2− adsorbtion on molybdenite. The FTIR results corresponded with the adsorption measurement, indicating that BX− chemically adsorbed on chalcopyrite to form CuBX and (BX)2 but physically adsorbed on molybdenite and only formed (BX)2. After reaction with sodium sulfide, all xanthate peaks disappeared on chalcopyrite but remained in part on molybdenite due to the larger specific surface area, the better inherent floatability, or the unique layered structure of molybdenite.
Acknowledgments
The authors are grateful for the support of the Resource and Environmental Engineering School, Wuhan University of Technology (WUT), China.
Author Contributions
Huiqing Peng supported the experiment; Di Wu conceived, designed, and performed the experiment and analyzed the data; Wen Luo, Xuexiang Bie, and Wenya Jiao contributed reagents/materials/analysis tools; and Di Wu and Mohamed Abdalla wrote the paper.
Conflicts of Interest
The authors declare no conflict of interest.
References
- Song, S.; Zhang, X.; Yang, B.; Lopez-Mendoza, A. Flotation of molybdenite fines as hydrophobic agglomerates. Sep. Purif. Technol. 2012, 98, 177–181. [Google Scholar] [CrossRef]
- Wada, M.; Majima, H.; Takeda, R.; Takeshita, S.; Hirose, K. Studies on the flotation of molybdenite. Bull. Res. Inst. Miner. Dress. Metall. Tohoku Univ. 1962, 17, 69–82. [Google Scholar]
- Triffett, B.; Veloo, C.; Adair, B.J.I.; Bradshaw, D. An investigation of the factors affecting the recovery of molybdenite in the kennecott utah copper bulk flotation circuit. Miner. Eng. 2008, 21, 832–840. [Google Scholar]
- Gaudin, A.; Miaw, H.; Spedden, H. Native Floatability and Crystal Structure. In Proceedings of the Second International Congress of Surface Activity; Butterworths: London, UK, 1957. [Google Scholar]
- Laskowski, J.; Kitchener, J.A. The hydrophilic—Hydrophobic transition on silica. J. Colloid Interface Sci. 1969, 29, 670–679. [Google Scholar] [CrossRef]
- Siebentritt, S.; Igalson, M.; Persson, C.; Lany, S. The electronic structure of chalcopyrites—Bands, point defects and grain boundaries. Prog. Photovolt. Res. Appl. 2010, 18, 390–410. [Google Scholar]
- Merker, R.L.; Zisman, W.A. Competitive adsorption from solution between hydrophobic and hydrophilic molecules and ions. J. Phys. Chem. 2002, 56, 399–404. [Google Scholar] [CrossRef]
- Nokes, C.M. Process for Recovery of Molybdenite from Copper Sulfide-Molybdenite Flotation Concentrates. U.S. Patent 2,811,255, 29 October 1957. [Google Scholar]
- Simpson, W.W. Effect of Potassium Ethylxanthate Degradation on Flotation of Chalcopyrite and Molybdenite; The United States Department of the Interior: Washington, DC, USA; p. 8.
- Chander, S.; Fuerstenau, D.W. On the natural floatability of molybdenite. Trans. AIME 1972, 252, 62–69. [Google Scholar]
- Bulatovic, S.M. Handbook of Flotation Reagents: CHEMISTRY, Theory and Practice: Flotation of Sulfide Ores; Elsevier: Amsterdam, The Netherlands, 2007; p. 685. [Google Scholar]
- Ansari, A.; Pawlik, M. Floatability of chalcopyrite and molybdenite in the presence of lignosulfonates. Part II. Hallimond tube flotation. Miner. Eng. 2007, 20, 609–616. [Google Scholar] [CrossRef]
- Pearse, M.J. An overview of the use of chemical reagents in mineral processing. Miner. Eng. 2005, 18, 139–149. [Google Scholar] [CrossRef]
- Barker, L.M.; Young, O.E. Flotation Recovery of Molybdenite. U.S. Patent 2,664,199, 29 December 1953. [Google Scholar]
- Curtis, C.H. Process of Purifying Molybdenite Concentrates. U.S. Patent 2,238,250, 15 April 1941. [Google Scholar]
- Hirajima, T.; Mori, M.; Ichikawa, O.; Sasaki, K.; Miki, H.; Farahat, M.; Sawada, M.; Mori, M.; Ichikawa, O.; Miki, H. Selective flotation of chalcopyrite and molybdenite with plasma pre-treatment. Miner. Eng. 2014, 66, 102–111. [Google Scholar]
- Li, M.; Wei, D.; Liu, Q.; Liu, W.; Zheng, J.; Sun, H. Flotation separation of copper–molybdenum sulfides using chitosan as a selective depressant. Miner. Eng. 2015, 83, 217–222. [Google Scholar] [CrossRef]
- Fu, J.G.; Zhong, H.; Ou, L.M. Application of thioglycolic acid in molybdenite-copper sulphide separation. Min. Metall. Eng. 2002, 22, 36–38. [Google Scholar]
- Natarajan, K.A.; Iwasaki, I. Behavior of platinum electrodes as redox potential indicators in some systems of metallurgical interest. Trans. AIME 1970, 247, 317–324. [Google Scholar]
- Light, T.S. Standard solution for redox potential measurements. Anal. Chem. 1972, 44, 1038–1039. [Google Scholar] [CrossRef]
- Staicopolus, D.N. The computation of surface tension and of contact angle by the sessile-drop method. J. Colloid Sci. 1962, 17, 439–447. [Google Scholar] [CrossRef]
- He, X.; Cao, L.; Zhan, W.; Ren, Y. UV spectrophotometric measurement of butyl xanthate in water. Environ. Pollut. Control 2007, 29, 552–554. [Google Scholar]
- Healy, T.W.; Fuerstenau, D.W. The isoelectric point/point-of zero-charge of interfaces formed by aqueous solutions and nonpolar solids, liquids, and gases. J. Colloid Interface Sci. 2007, 309, 183–188. [Google Scholar] [CrossRef] [PubMed]
- Liu, R.; Sun, W.; Yuehua, H.U.; Wang, D. Surface chemical study of the selective separation of chalcopyrite and marmatite. Int. J. Min. Sci. Technol. 2010, 20, 542–545. [Google Scholar] [CrossRef]
- Mangalam, V.; Khangaonkar, P.R. Zeta-potential and adsorption studies of the chalcopyrite-sodium diethyl dithio carbamate system. Int. J. Miner. Process. 1985, 15, 269–280. [Google Scholar] [CrossRef]
- Chander, S.; Wie, J.M.; Fuerstenau, D.W. On the Native Floatability and Surface Properties of Naturally Hydrophobic Solids. In Advances in Interfacial Phenomena of Particulate/Solution/Gas Systems; American Institute of Chemical Engineers: New York, NY, USA, 1975; pp. 183–188. [Google Scholar]
- Valdivieso, A.L. A Study of the Electrokinetics and Flotation Properties of Talc and Molybdenite. Master’s Thesis, South Dakota School of Mines and Technology, Rapid City, SD, USA, 1980. [Google Scholar]
- Parreira, H.C.; Schulman, J.H. Streaming potential measurements on paraffin wax. Adv. Chem. 1961, 33, 160–171. [Google Scholar]
- Iwasaki, I.; Cooke, S.R.B. The decomposition of xanthate in acid solution. J. Am. Chem. Soc. 1958, 80, 285–288. [Google Scholar] [CrossRef]
- Sheikh, N.; Leja, J. Precipitation and stability of copper ethyl xanthate in hot acid and alkaline solutions. J. Colloid Interface Sci. 1974, 47, 300–308. [Google Scholar] [CrossRef]
- Popov, S.R.; Vučinić, D.R. The ethylxanthate adsorption on copper-activated sphalerite under flotation-related conditions in alkaline media. Int. J. Miner. Process. 1990, 30, 229–244. [Google Scholar]
- Lee, K.; Archibald, D.; Mclean, J.; Reuter, M.A. Flotation of mixed copper oxide and sulphide minerals with xanthate and hydroxamate collectors. Miner. Eng. 2009, 22, 395–401. [Google Scholar]
- Castro, S.; Lopez-Valdivieso, A.; Laskowski, J.S. Review of the flotation of molybdenite. Part I: Surface properties and floatability. Int. J. Miner. Process. 2016, 148, 48–58. [Google Scholar] [CrossRef]
- Castro, S.H.; Mayta, E. A kinetics approach to the effect of particle size on the flotation of molibdenite. In Proceedings of the IV Meeting of the Southern Hemisphere on Mineral Technology, and III Latin-American Congress on Froth Flotation; University of Concepción: Bío Bío Region, Chile, 1994; pp. 331–344. [Google Scholar]
- Afenya, P.M. Adsorption of xanthate and starch on synthetic graphite. Int. J. Miner. Process. 1982, 9, 303–319. [Google Scholar] [CrossRef]
- Allison, S.; Finkelstein, N. A Study of the Products of Reaction between Galena and Aqueous Xanthate Solutions; National Institute for Metallurgy: Johannesburg, South Africa, 1971.
- Nagaraj, D.R.; Gorken, A. Potential controlled flotation and depression of copper sulphides and oxides using hydrosulphide in non-xanthate systems. Can. Metall. Q. 1991, 30, 203–213. [Google Scholar] [CrossRef]
- Yoon, R.H. Collectorless flotation of chalcopyrite and sphalerite ores by using sodium sulfide. Int. J. Miner. Process. 1981, 8, 31–48. [Google Scholar] [CrossRef]
- Luttrell, G.H.; Yoon, R.H. The collectorless flotation of chalcopyrite ores using sodium sulfide. Int. J. Miner. Process. 1984, 13, 271–283. [Google Scholar] [CrossRef]
- Chander, S. A brief review of pulp potentials in sulfide flotation. Int. J. Miner. Process. 2003, 72, 141–150. [Google Scholar] [CrossRef]
- Herrera-Urbina, R.; Sotillo, F.J.; Fuerstenau, D.W. Effect of sodium sulfide additions on the pulp potential and amyl xanthate flotation of cerussite and galena. Int. J. Miner. Process. 1999, 55, 157–170. [Google Scholar] [CrossRef]
- Hu, Y.; Sun, W.; Wang, D. Electrochemistry of Flotation of Sulphide Minerals; Springer: Berlin/Heidelberg, Germany, 2009; pp. 142–166. [Google Scholar]
- Fuchs, O. Advances in interfacial phenomena of particulate/solution/gas systems; application to flotation research. Colloid Polym. Sci. 1977, 255, 499–501. [Google Scholar] [CrossRef]
- Lercher, J.A. Adsorption methods for the assessment of the specific surface area, the pore size distribution and the active sites of heterogeneous catalysts. Stud. Surf. Sci. Catal. 1999, 123, 543–566. [Google Scholar]
- Shchukin, E.D.; Amelina, E.A.; Parfenova, A.M. Influence of the nature of non-polar phase on the mechanical stability of adsorption layers of hydrocarbon and fluorocarbon surfactants at the interface between their aqueous solutions and non-polar media. Colloids Surf. A Physicochem. Eng. Asp. 2001, 176, 35–51. [Google Scholar] [CrossRef]
- Brown, N.M.D.; Cui, N.; Mckinley, A. An XPS study of the surface modification of natural mos 2 following treatment in an rf-oxygen plasma. Appl. Surf. Sci. 1998, 134, 11–21. [Google Scholar] [CrossRef]
- Zhang, Y.; Cao, Z.; Cao, Y.; Sun, C.; Zhang, Y.; Cao, Z.; Cao, Y.; Sun, C. Ftir studies of xanthate adsorption on chalcopyrite, pentlandite and pyrite surfaces. J. Mol. Struct. 2013, 1048, 434–440. [Google Scholar] [CrossRef]
- Mielczarski, J.A.; Cases, J.M.; Barres, O. In situ infrared characterization of surface products of interaction of an aqueous xanthate solution with chalcopyrite, tetrahedrite, and tennantite. J. Colloid Interface Sci. 1996, 178, 740–748. [Google Scholar] [CrossRef]
- Chandra, A.P.; Puskar, L.; Simpson, D.J.; Gerson, A.R. Copper and xanthate adsorption onto pyrite surfaces: Implications for mineral separation through flotation. Int. J. Miner. Process. 2012, 114, 16–26. [Google Scholar] [CrossRef]
- Wang, X.H. Interfacial electrochemistry of pyrite oxidation and flotation: II. FTIR studies of xanthate adsorption on pyrite surfaces in neutral pH solutions. J. Colloid Interface Sci. 1995, 171, 413–428. [Google Scholar] [CrossRef]
- Gerson, A.R.; Smart, R.S.C.; Li, J.; Kawashima, N.; Weedon, D.; Triffett, B.; Bradshaw, D. Diagnosis of the surface chemical influences on flotation performance: Copper sulfides and molybdenite. Int. J. Miner. Process. 2012, 106, 16–30. [Google Scholar] [CrossRef]
Figure 1.
X-ray diffraction (XRD) analyses of pure minerals, (a) chalcopyrite and (b) molybdenite.
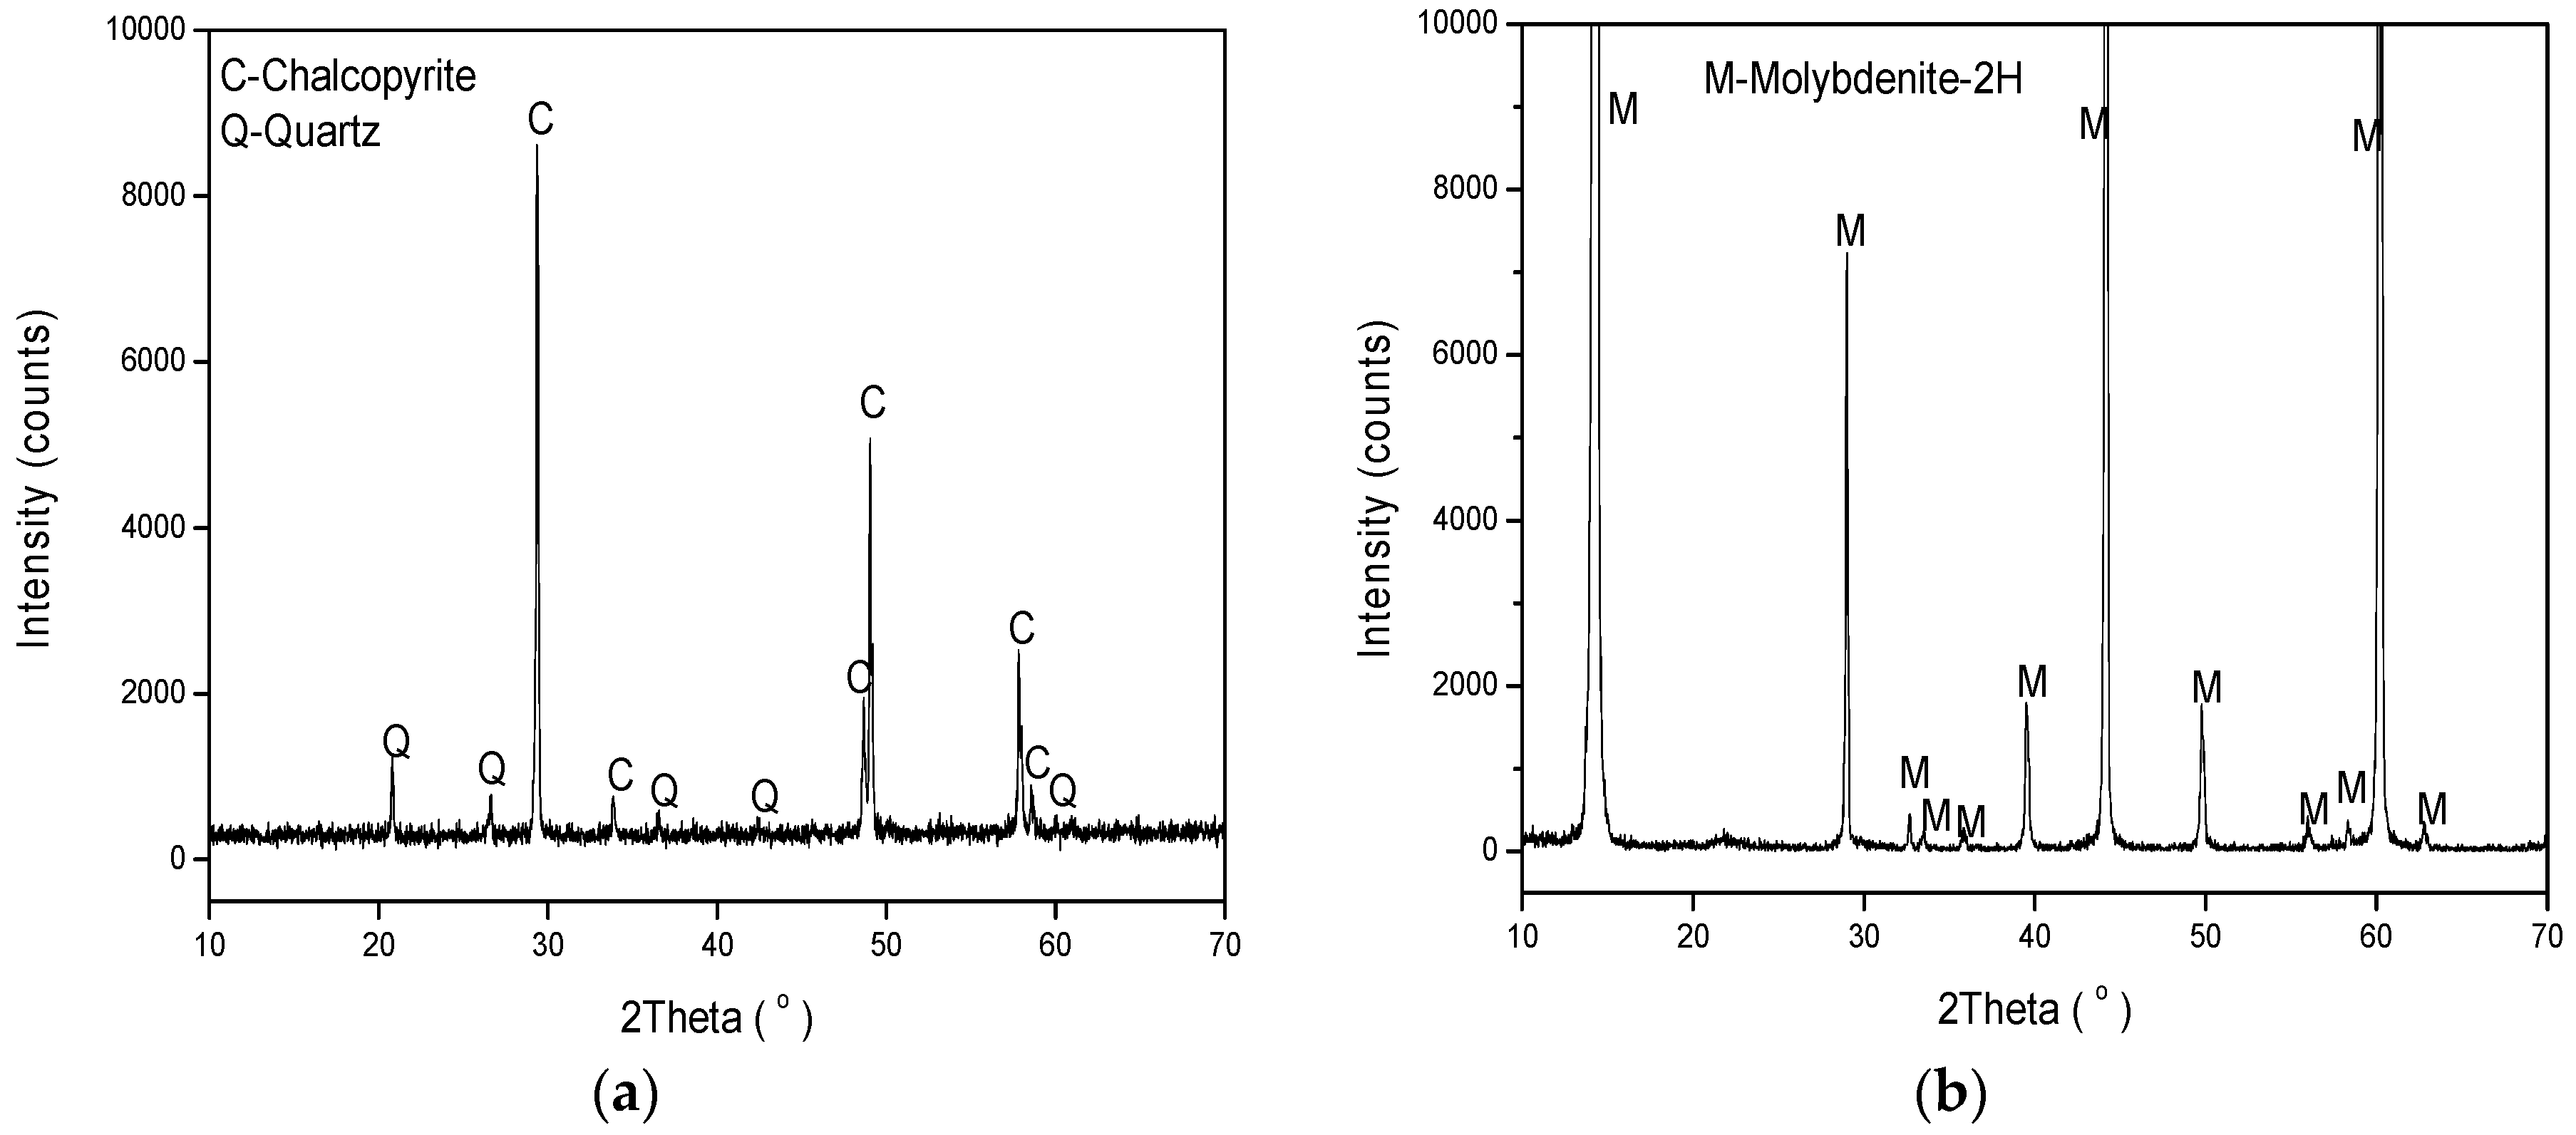
Figure 2.
Flotation recoveries of chalcopyrite and molybdenite as a function of pH by adding sodium butyl xanthate (SBX) (100 g/t) or kerosene (40 g/t) and opening to the atmosphere.
Figure 2.
Flotation recoveries of chalcopyrite and molybdenite as a function of pH by adding sodium butyl xanthate (SBX) (100 g/t) or kerosene (40 g/t) and opening to the atmosphere.
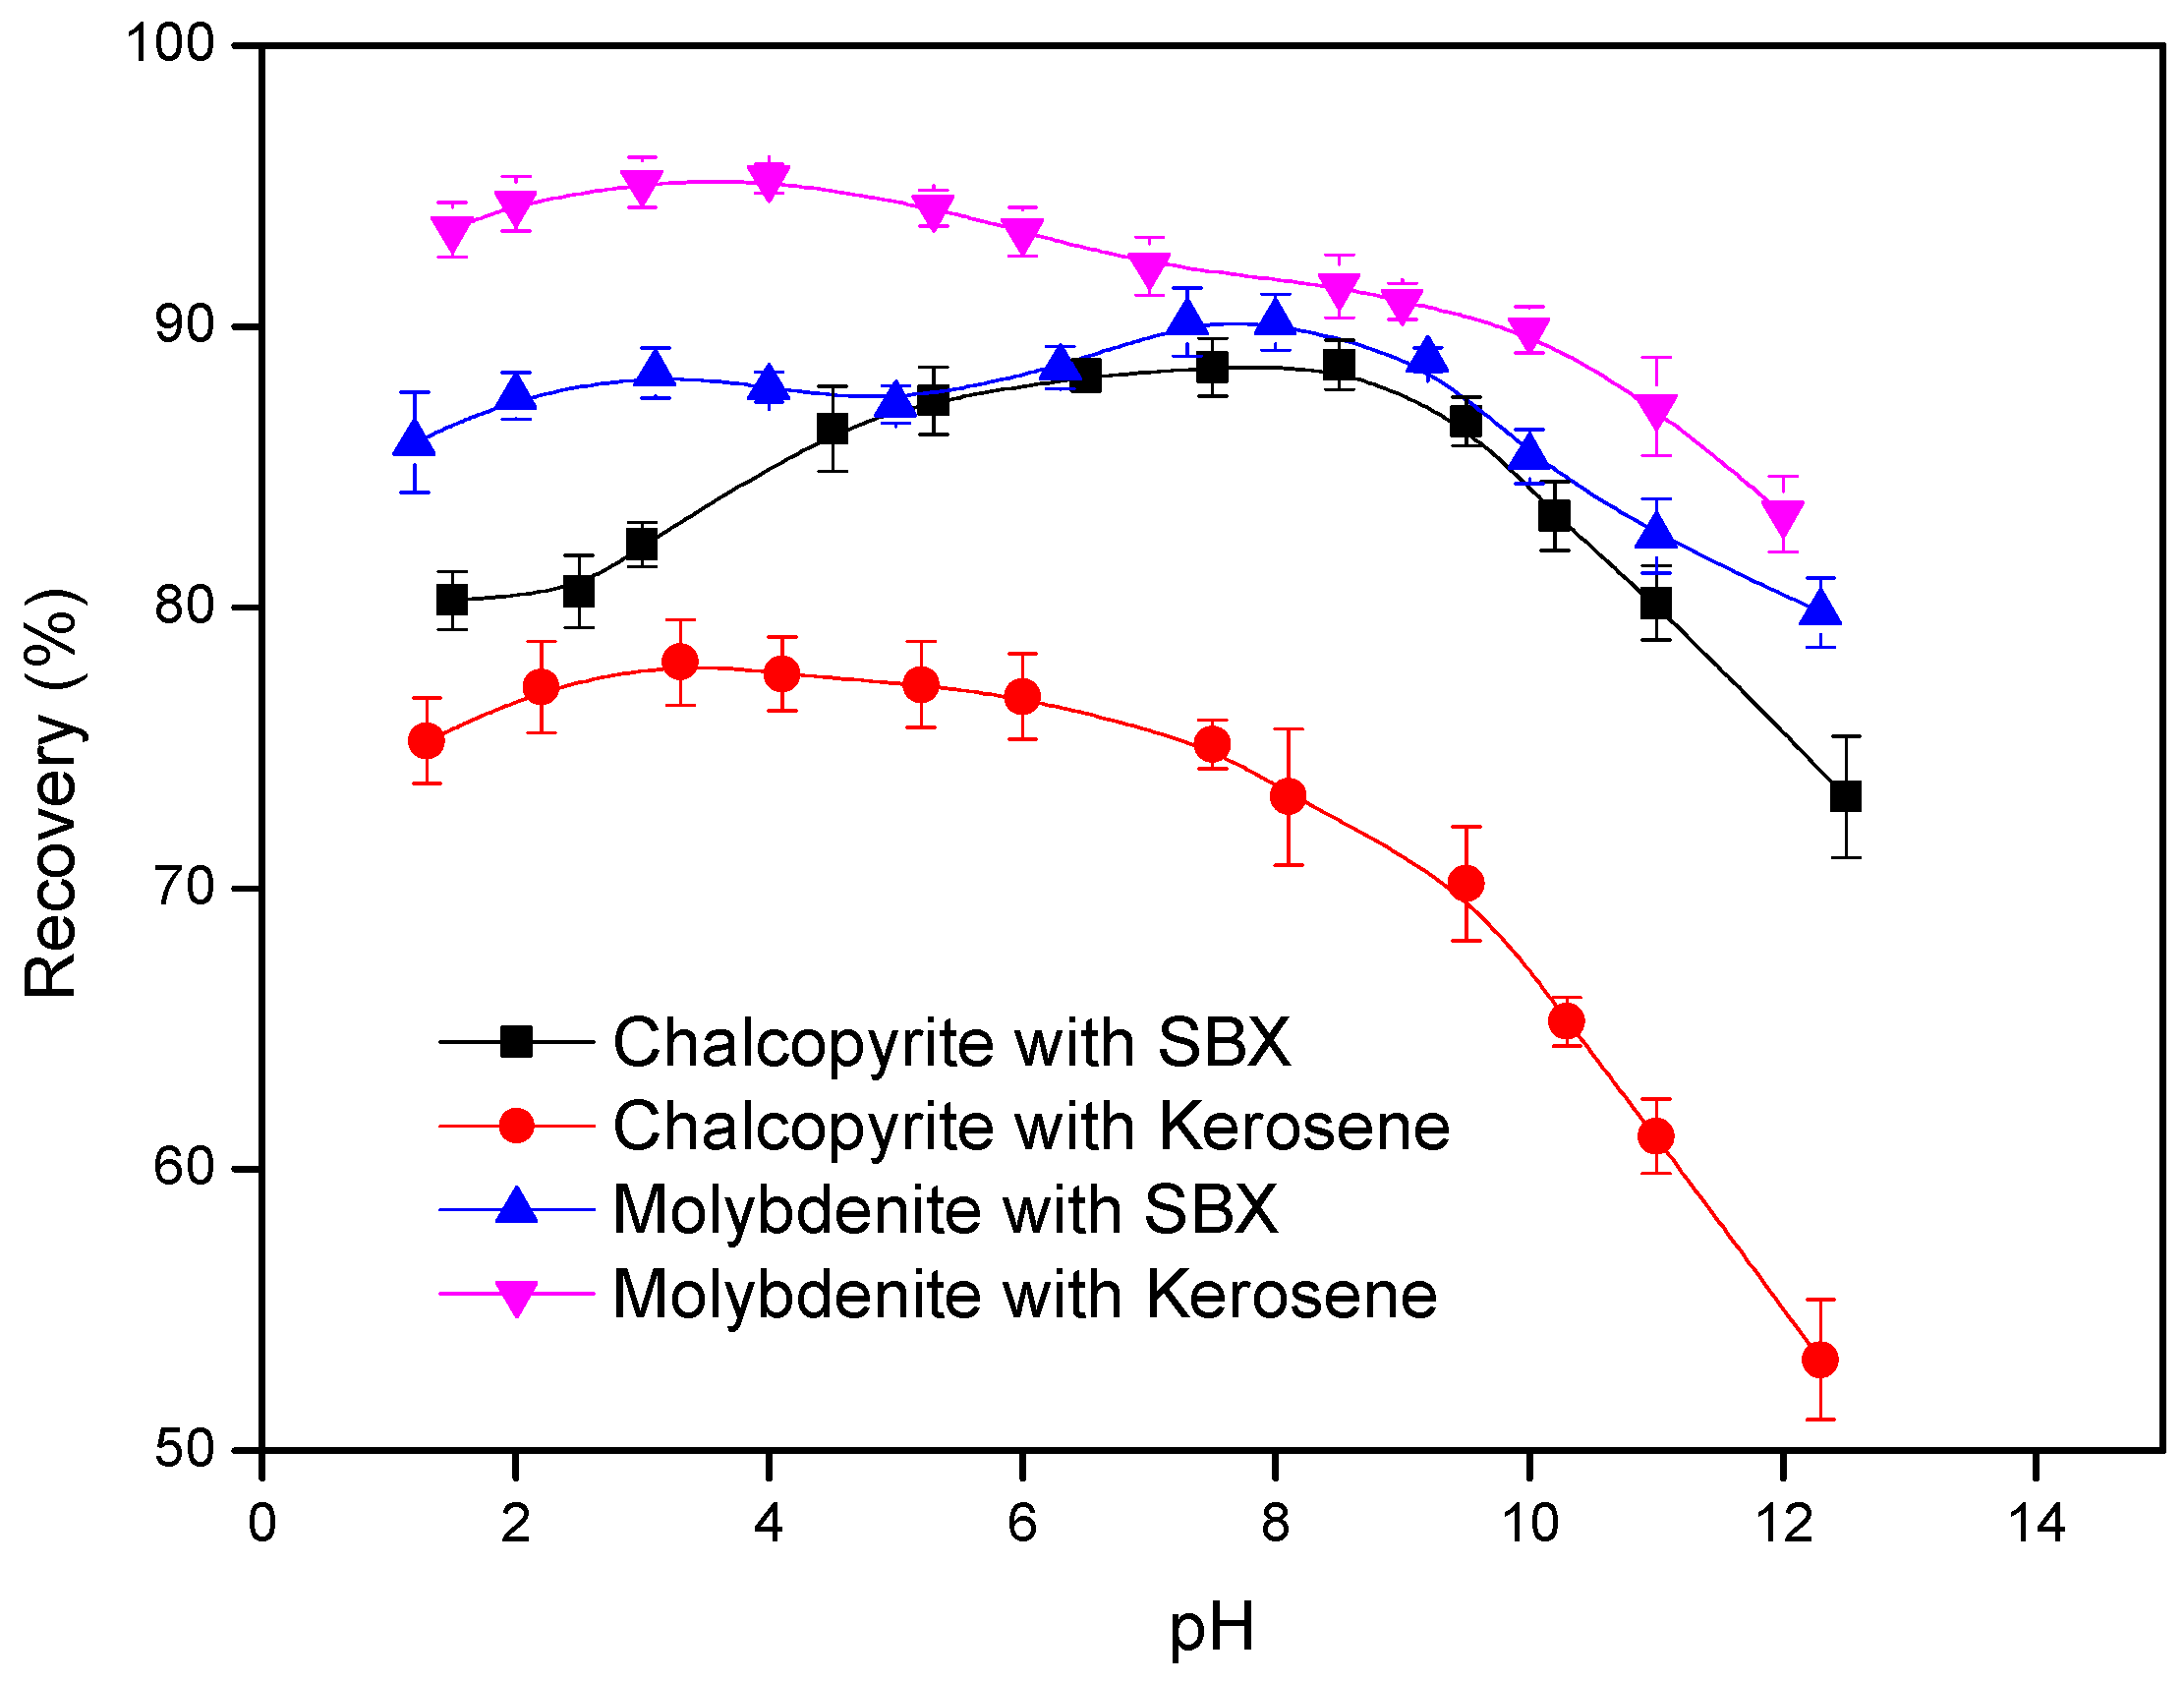
Figure 3.
Flotation recoveries of (a) chalcopyrite and (b) molybdenite at pH = 11 as a function of flotation time open to atmosphere with a collector: SBX (100 g/t), kerosene (40 g/t), or collectorless.
Figure 3.
Flotation recoveries of (a) chalcopyrite and (b) molybdenite at pH = 11 as a function of flotation time open to atmosphere with a collector: SBX (100 g/t), kerosene (40 g/t), or collectorless.
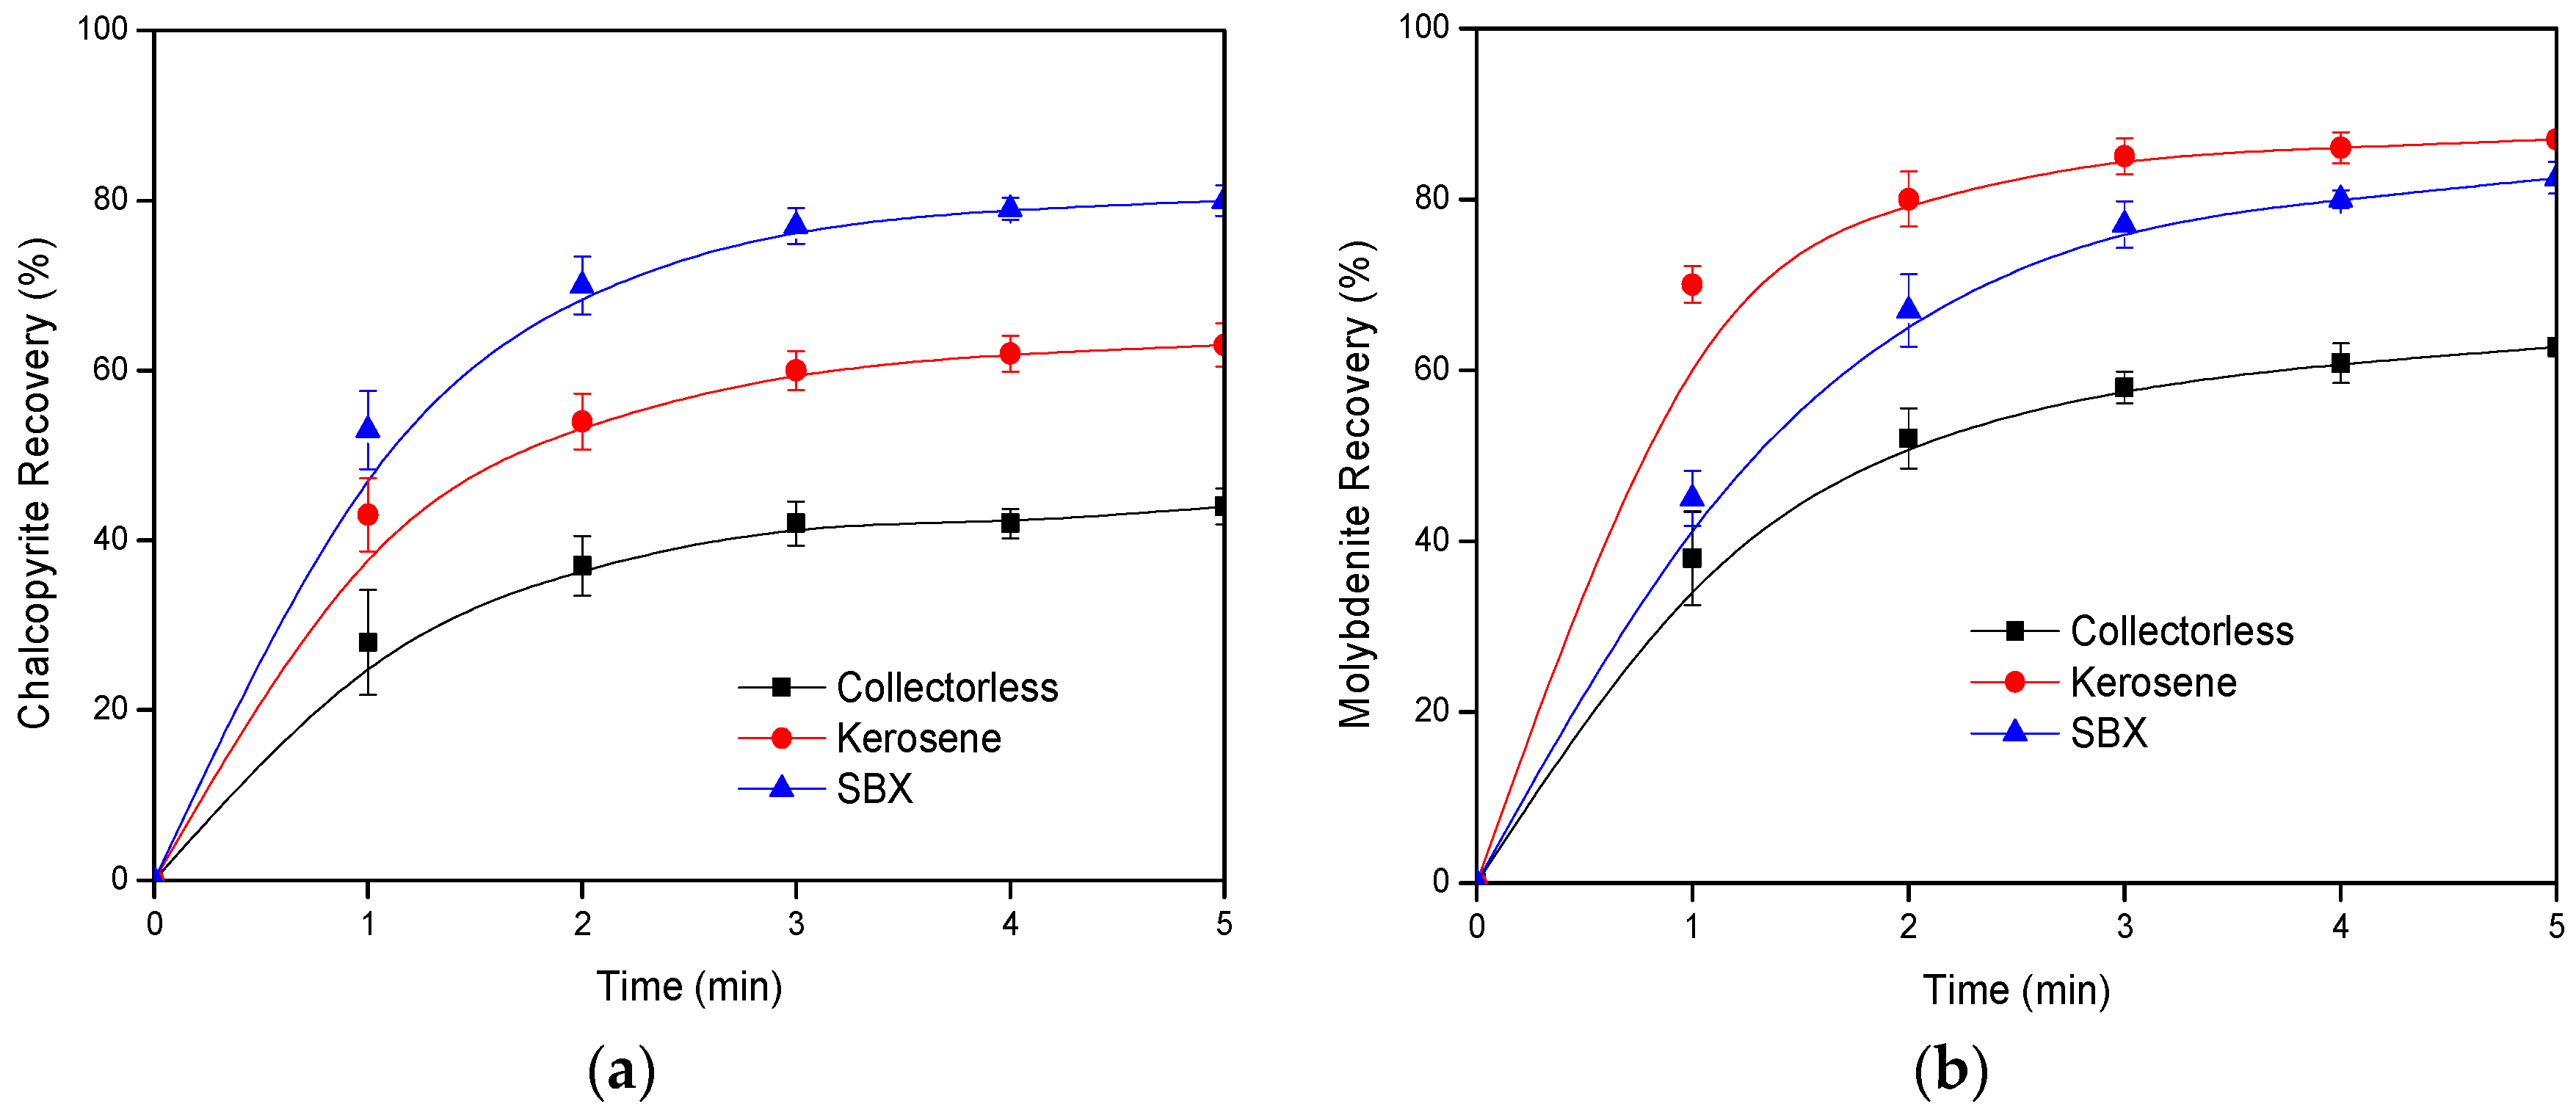
Figure 4.
(a) The flotation recovery of chalcopyrite at pH = 11 as a function of added sodium sulfide with 100 g/t SBX or 40 g/t kerosene added in 5 × 10⁻³ mol/L NaCl; (b) The Eh of the system under the same conditions.
Figure 4.
(a) The flotation recovery of chalcopyrite at pH = 11 as a function of added sodium sulfide with 100 g/t SBX or 40 g/t kerosene added in 5 × 10⁻³ mol/L NaCl; (b) The Eh of the system under the same conditions.
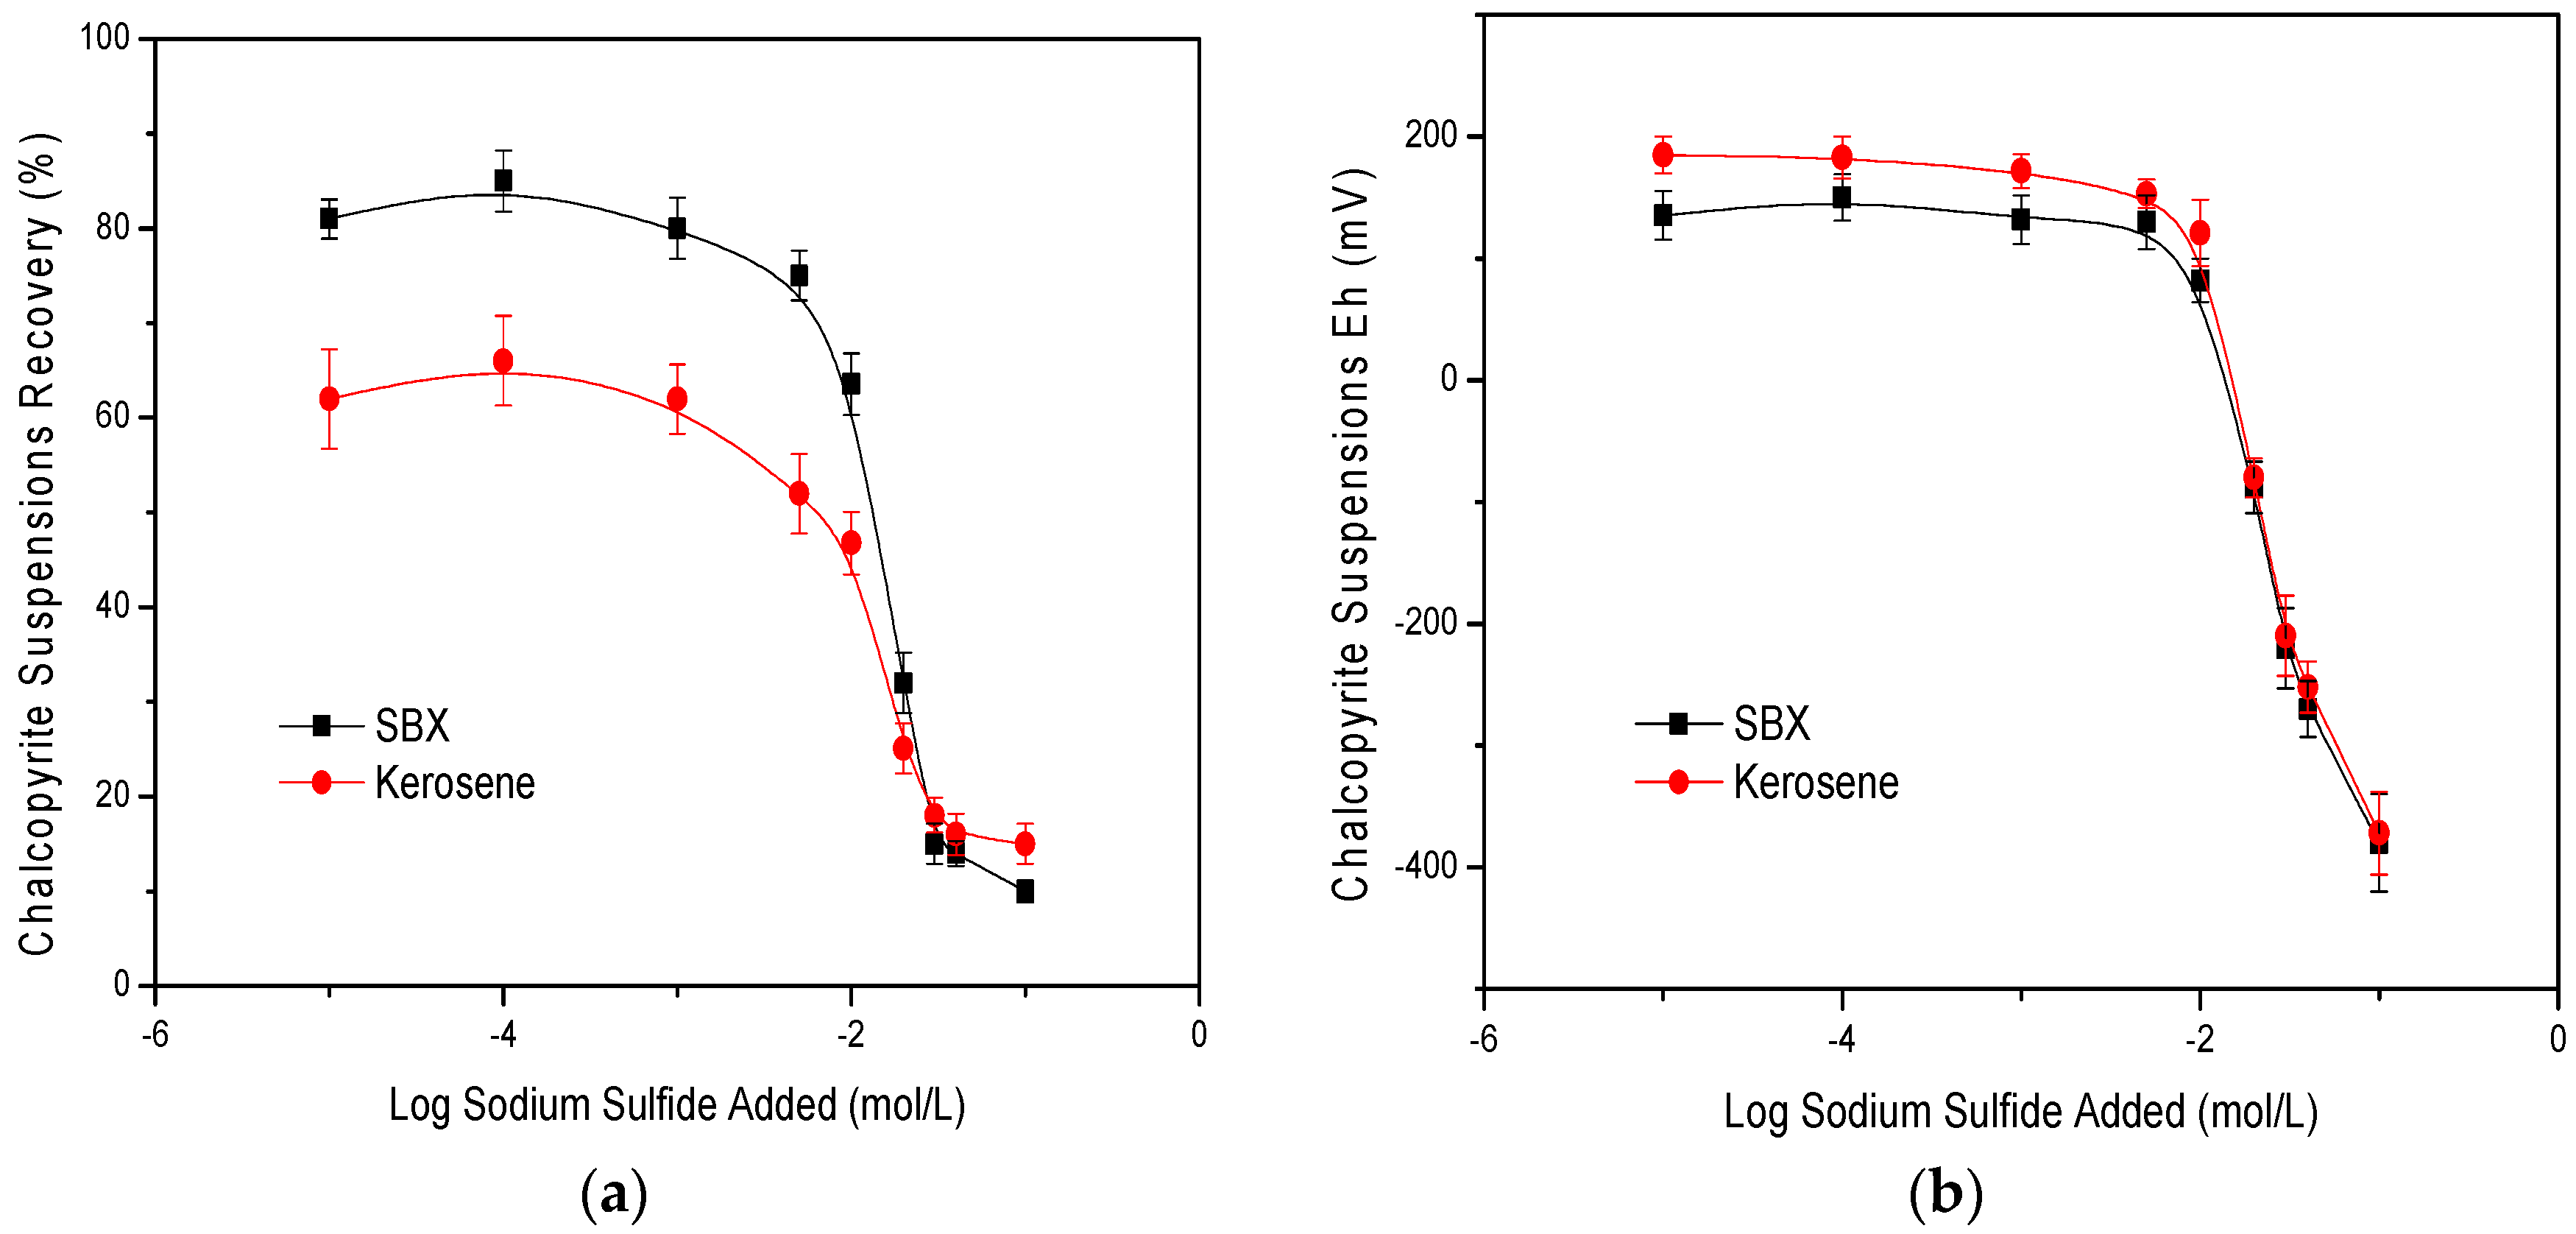
Figure 5.
Physical motions of the kerosene drop and BX− ions meeting with the mineral particle during violent stirring.
Figure 5.
Physical motions of the kerosene drop and BX− ions meeting with the mineral particle during violent stirring.
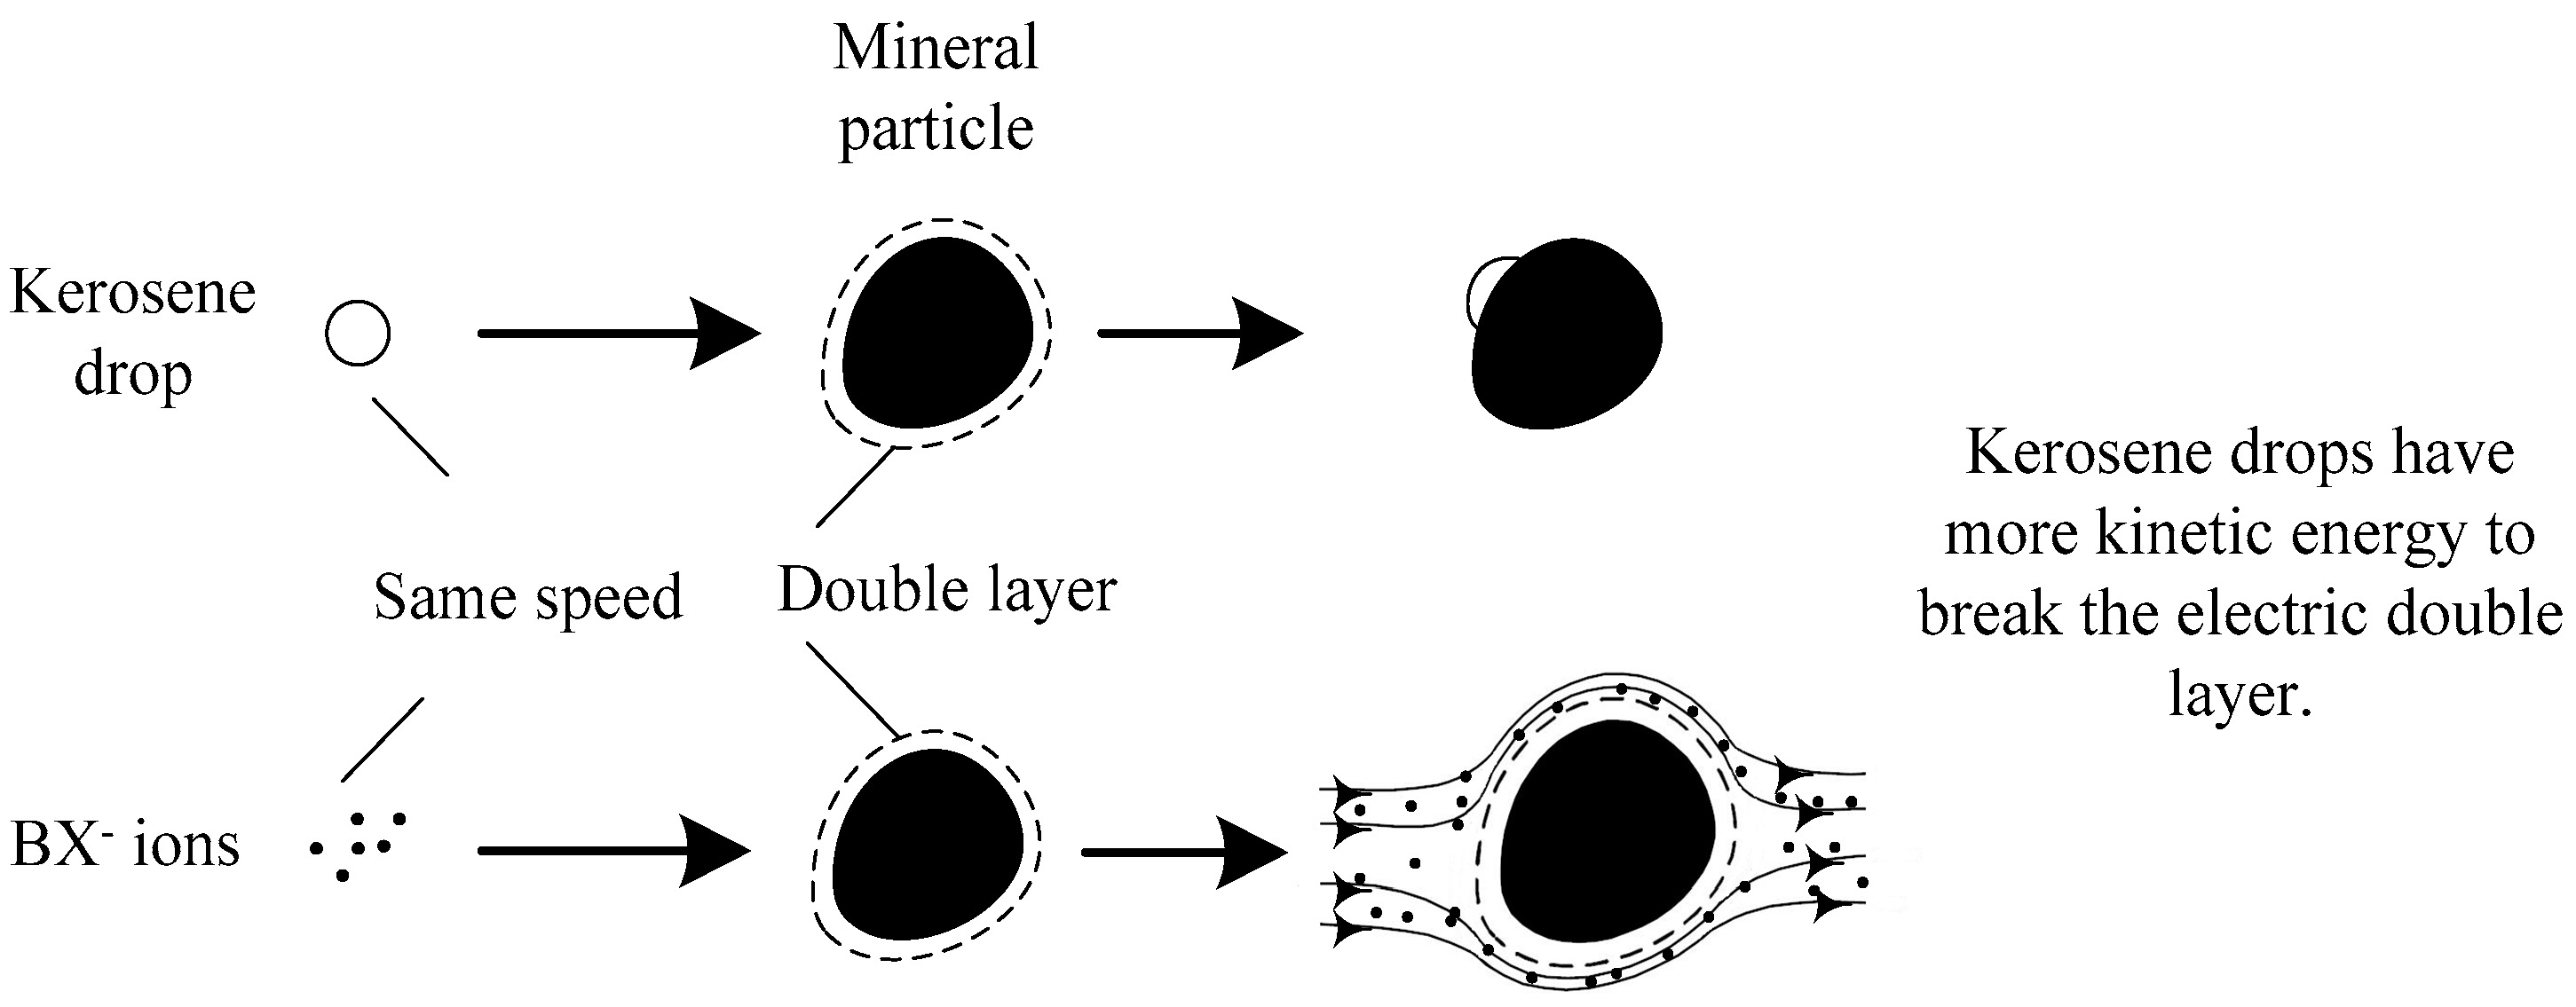
Figure 6.
(a). The flotation recovery of molybdenite at pH = 11 as a function of added sodium sulfide with 100 g/t SBX or 40 g/t kerosene added in 5 × 10⁻³ mol/L NaCl; (b) The Eh of the system under the same conditions.
Figure 6.
(a). The flotation recovery of molybdenite at pH = 11 as a function of added sodium sulfide with 100 g/t SBX or 40 g/t kerosene added in 5 × 10⁻³ mol/L NaCl; (b) The Eh of the system under the same conditions.
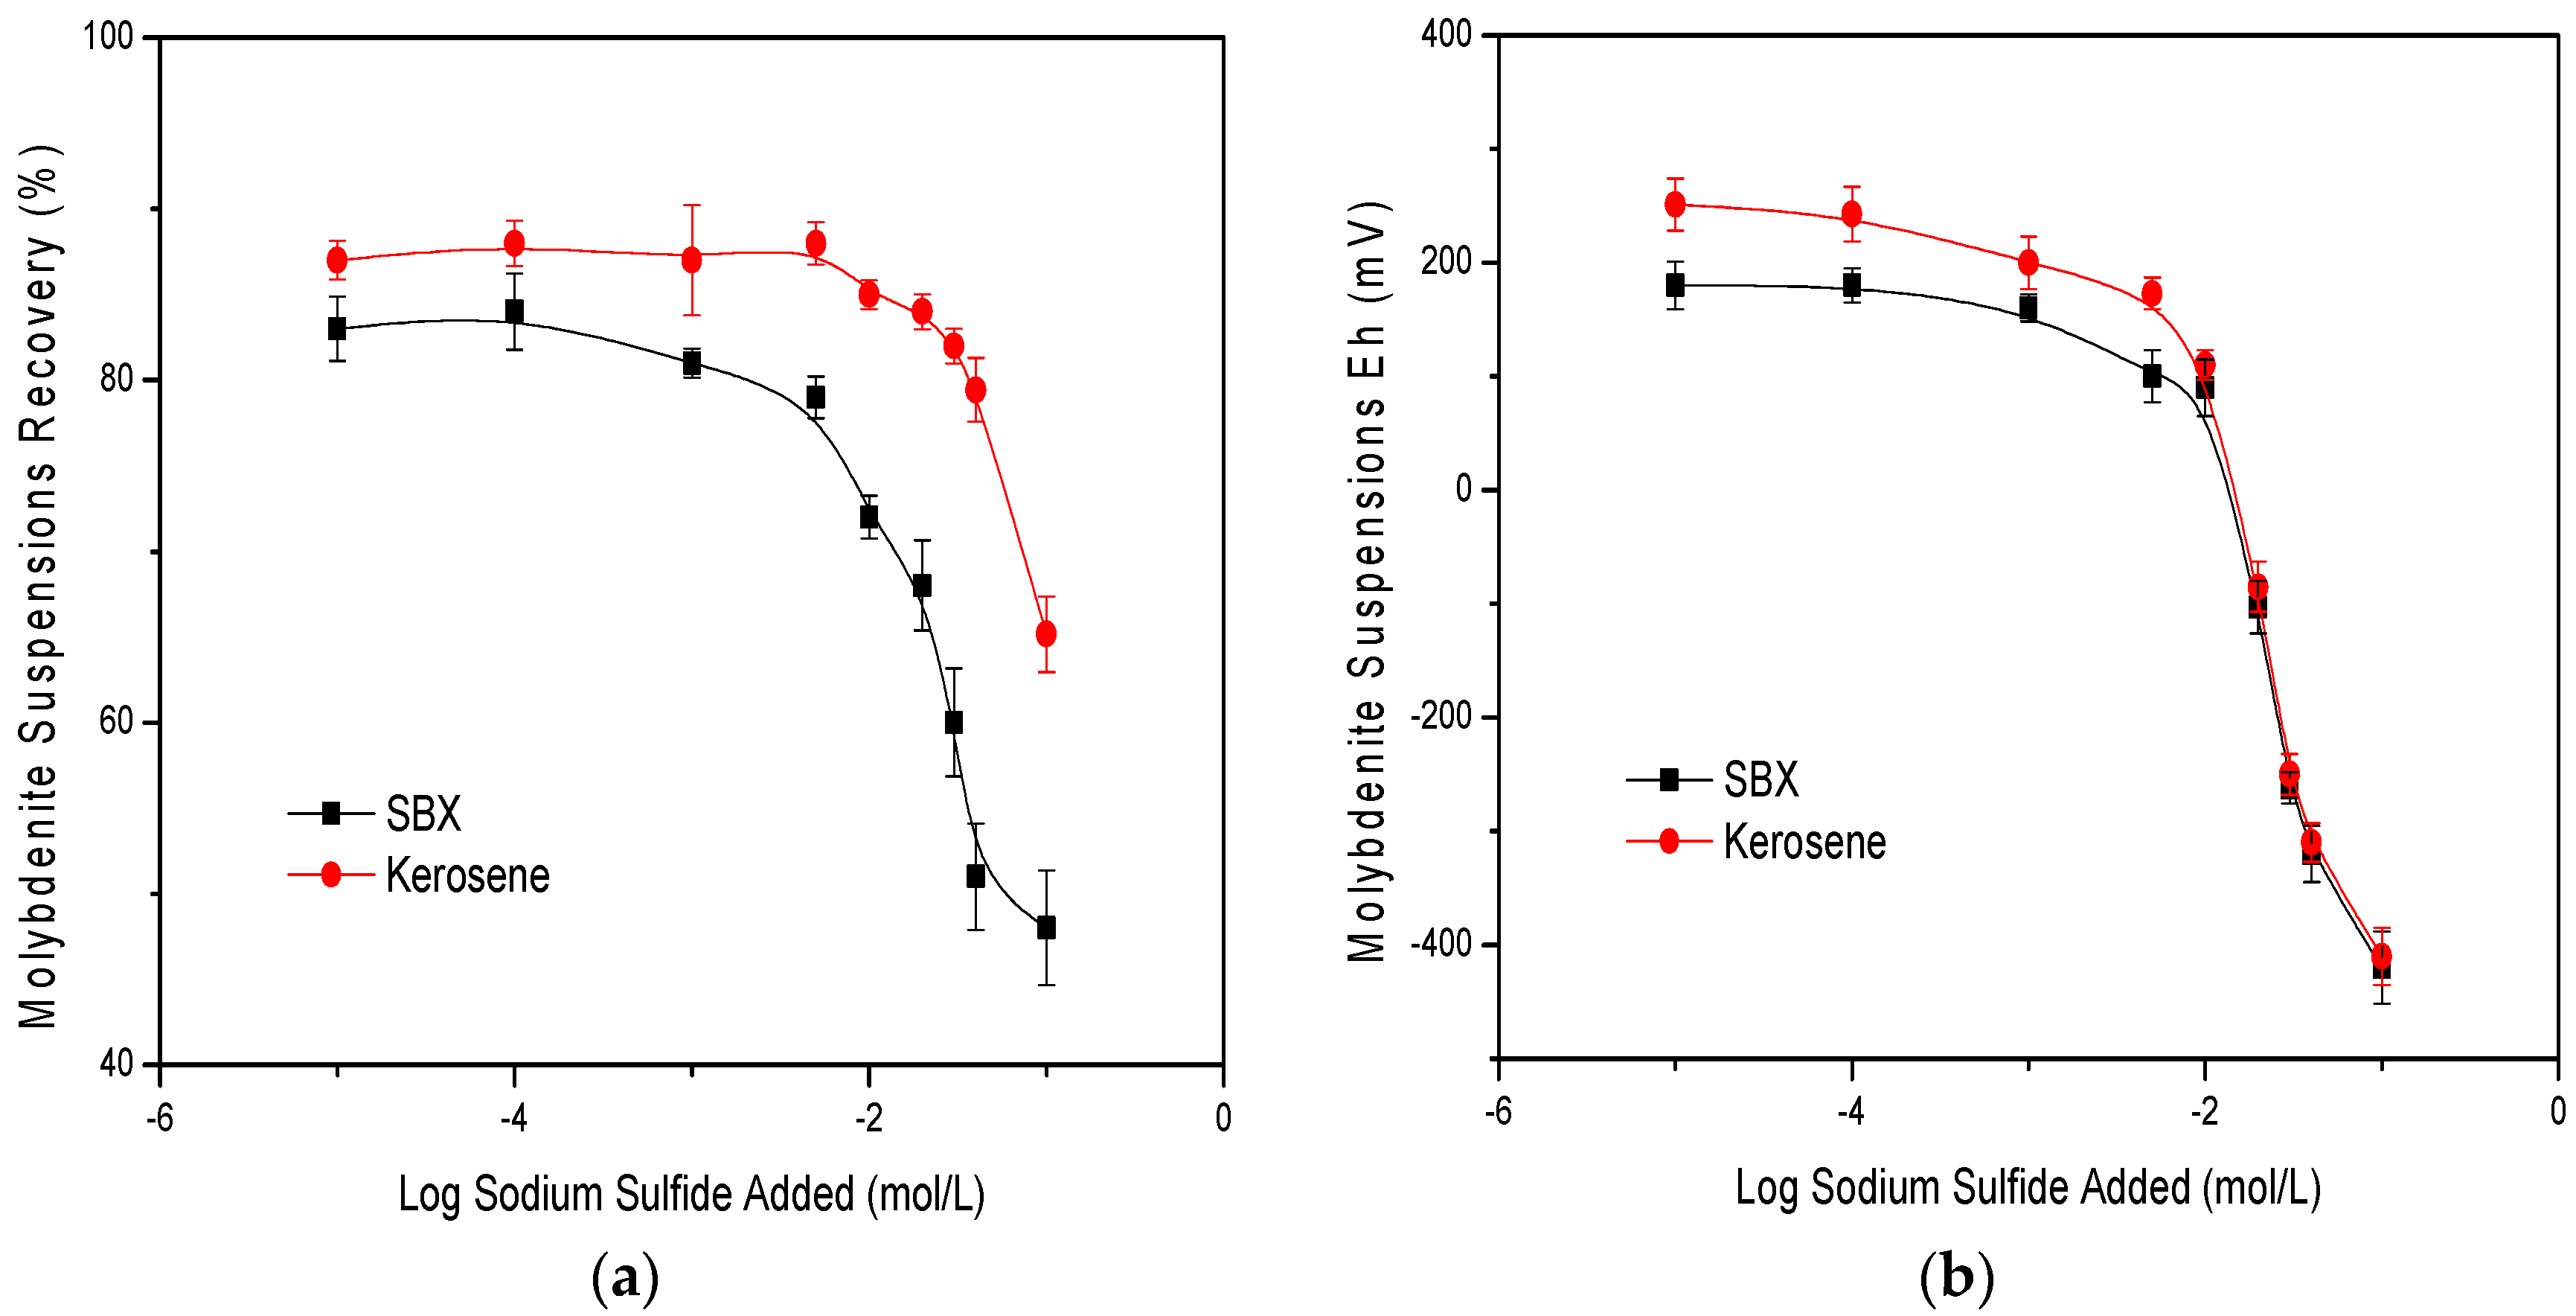
Figure 7.
(a) The contact angles of chalcopyrite and (b) molybdenite faces at pH = 11 as a function of added sodium sulfide with 100 g/t SBX, 40 g/t kerosene or collectorless.
Figure 7.
(a) The contact angles of chalcopyrite and (b) molybdenite faces at pH = 11 as a function of added sodium sulfide with 100 g/t SBX, 40 g/t kerosene or collectorless.
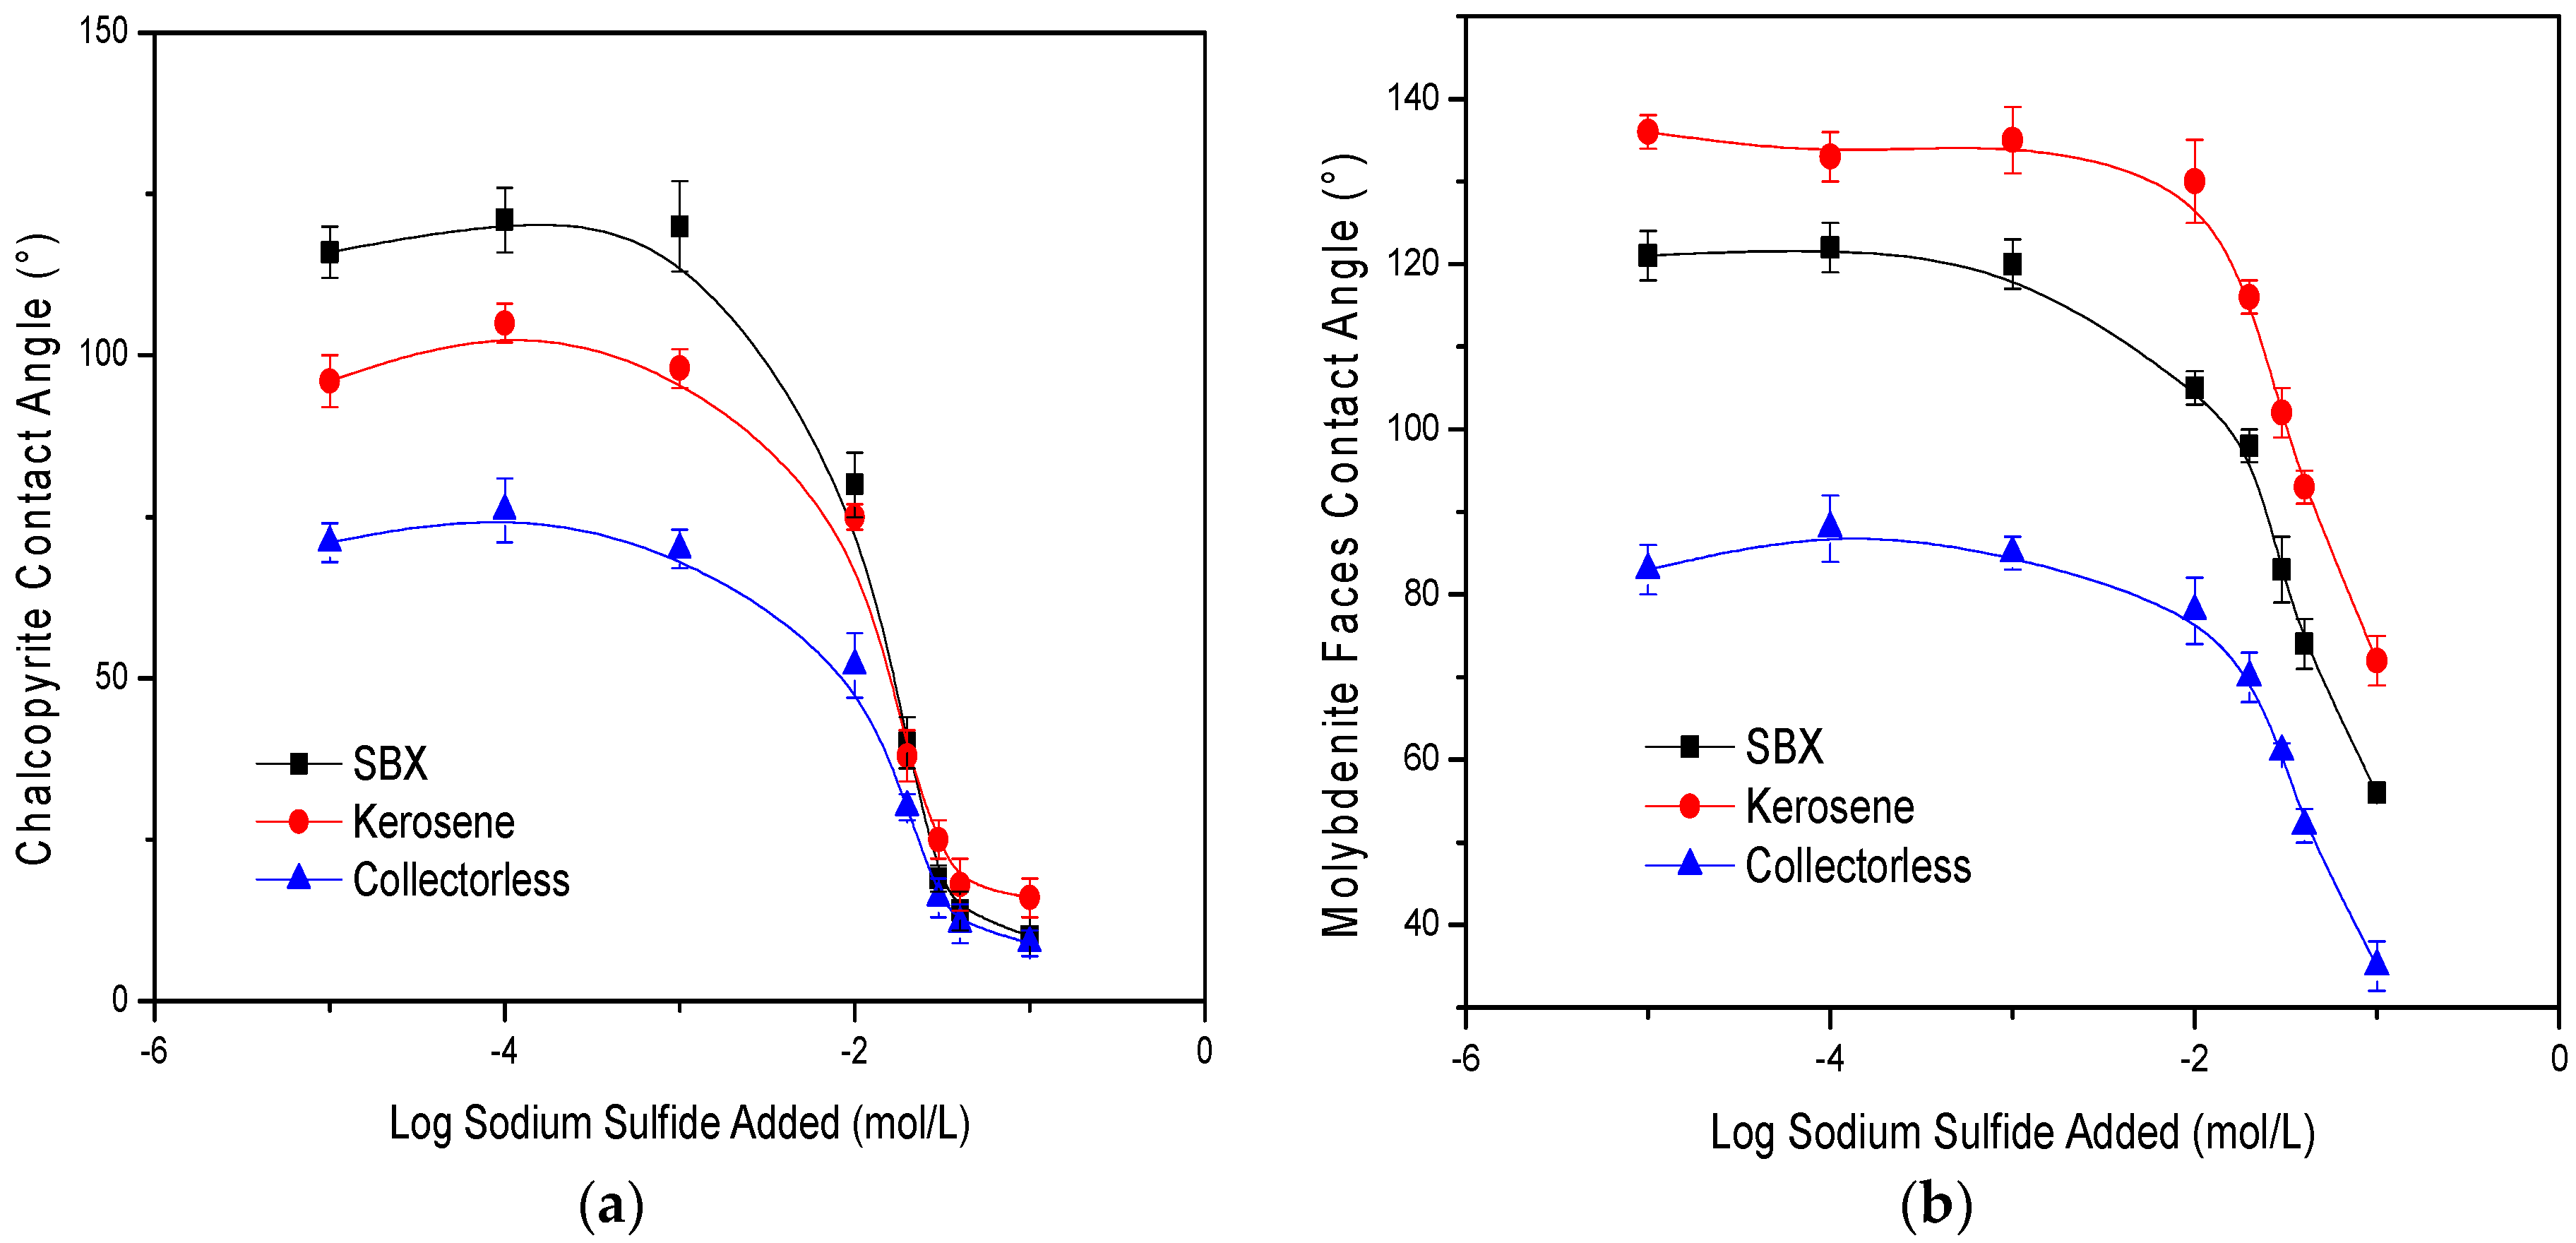
Figure 8.
The adsorption capacities of BX− and S2− on chalcopyrite and molybdenite surfaces at pH = 11 as a function of various dosages of sodium sulfide added in the presence of 100 g/t SBX and 40 g/t kerosene, respectively, and opened to the atmosphere.
Figure 8.
The adsorption capacities of BX− and S2− on chalcopyrite and molybdenite surfaces at pH = 11 as a function of various dosages of sodium sulfide added in the presence of 100 g/t SBX and 40 g/t kerosene, respectively, and opened to the atmosphere.
Figure 9.
The adsorption densities of BX− and S2− on chalcopyrite and molybdenite surfaces at pH = 11 as a function of various dosages of sodium sulfide added in the presence of 100 g/t SBX and 40 g/t kerosene, respectively, and opened to the atmosphere.
Figure 9.
The adsorption densities of BX− and S2− on chalcopyrite and molybdenite surfaces at pH = 11 as a function of various dosages of sodium sulfide added in the presence of 100 g/t SBX and 40 g/t kerosene, respectively, and opened to the atmosphere.
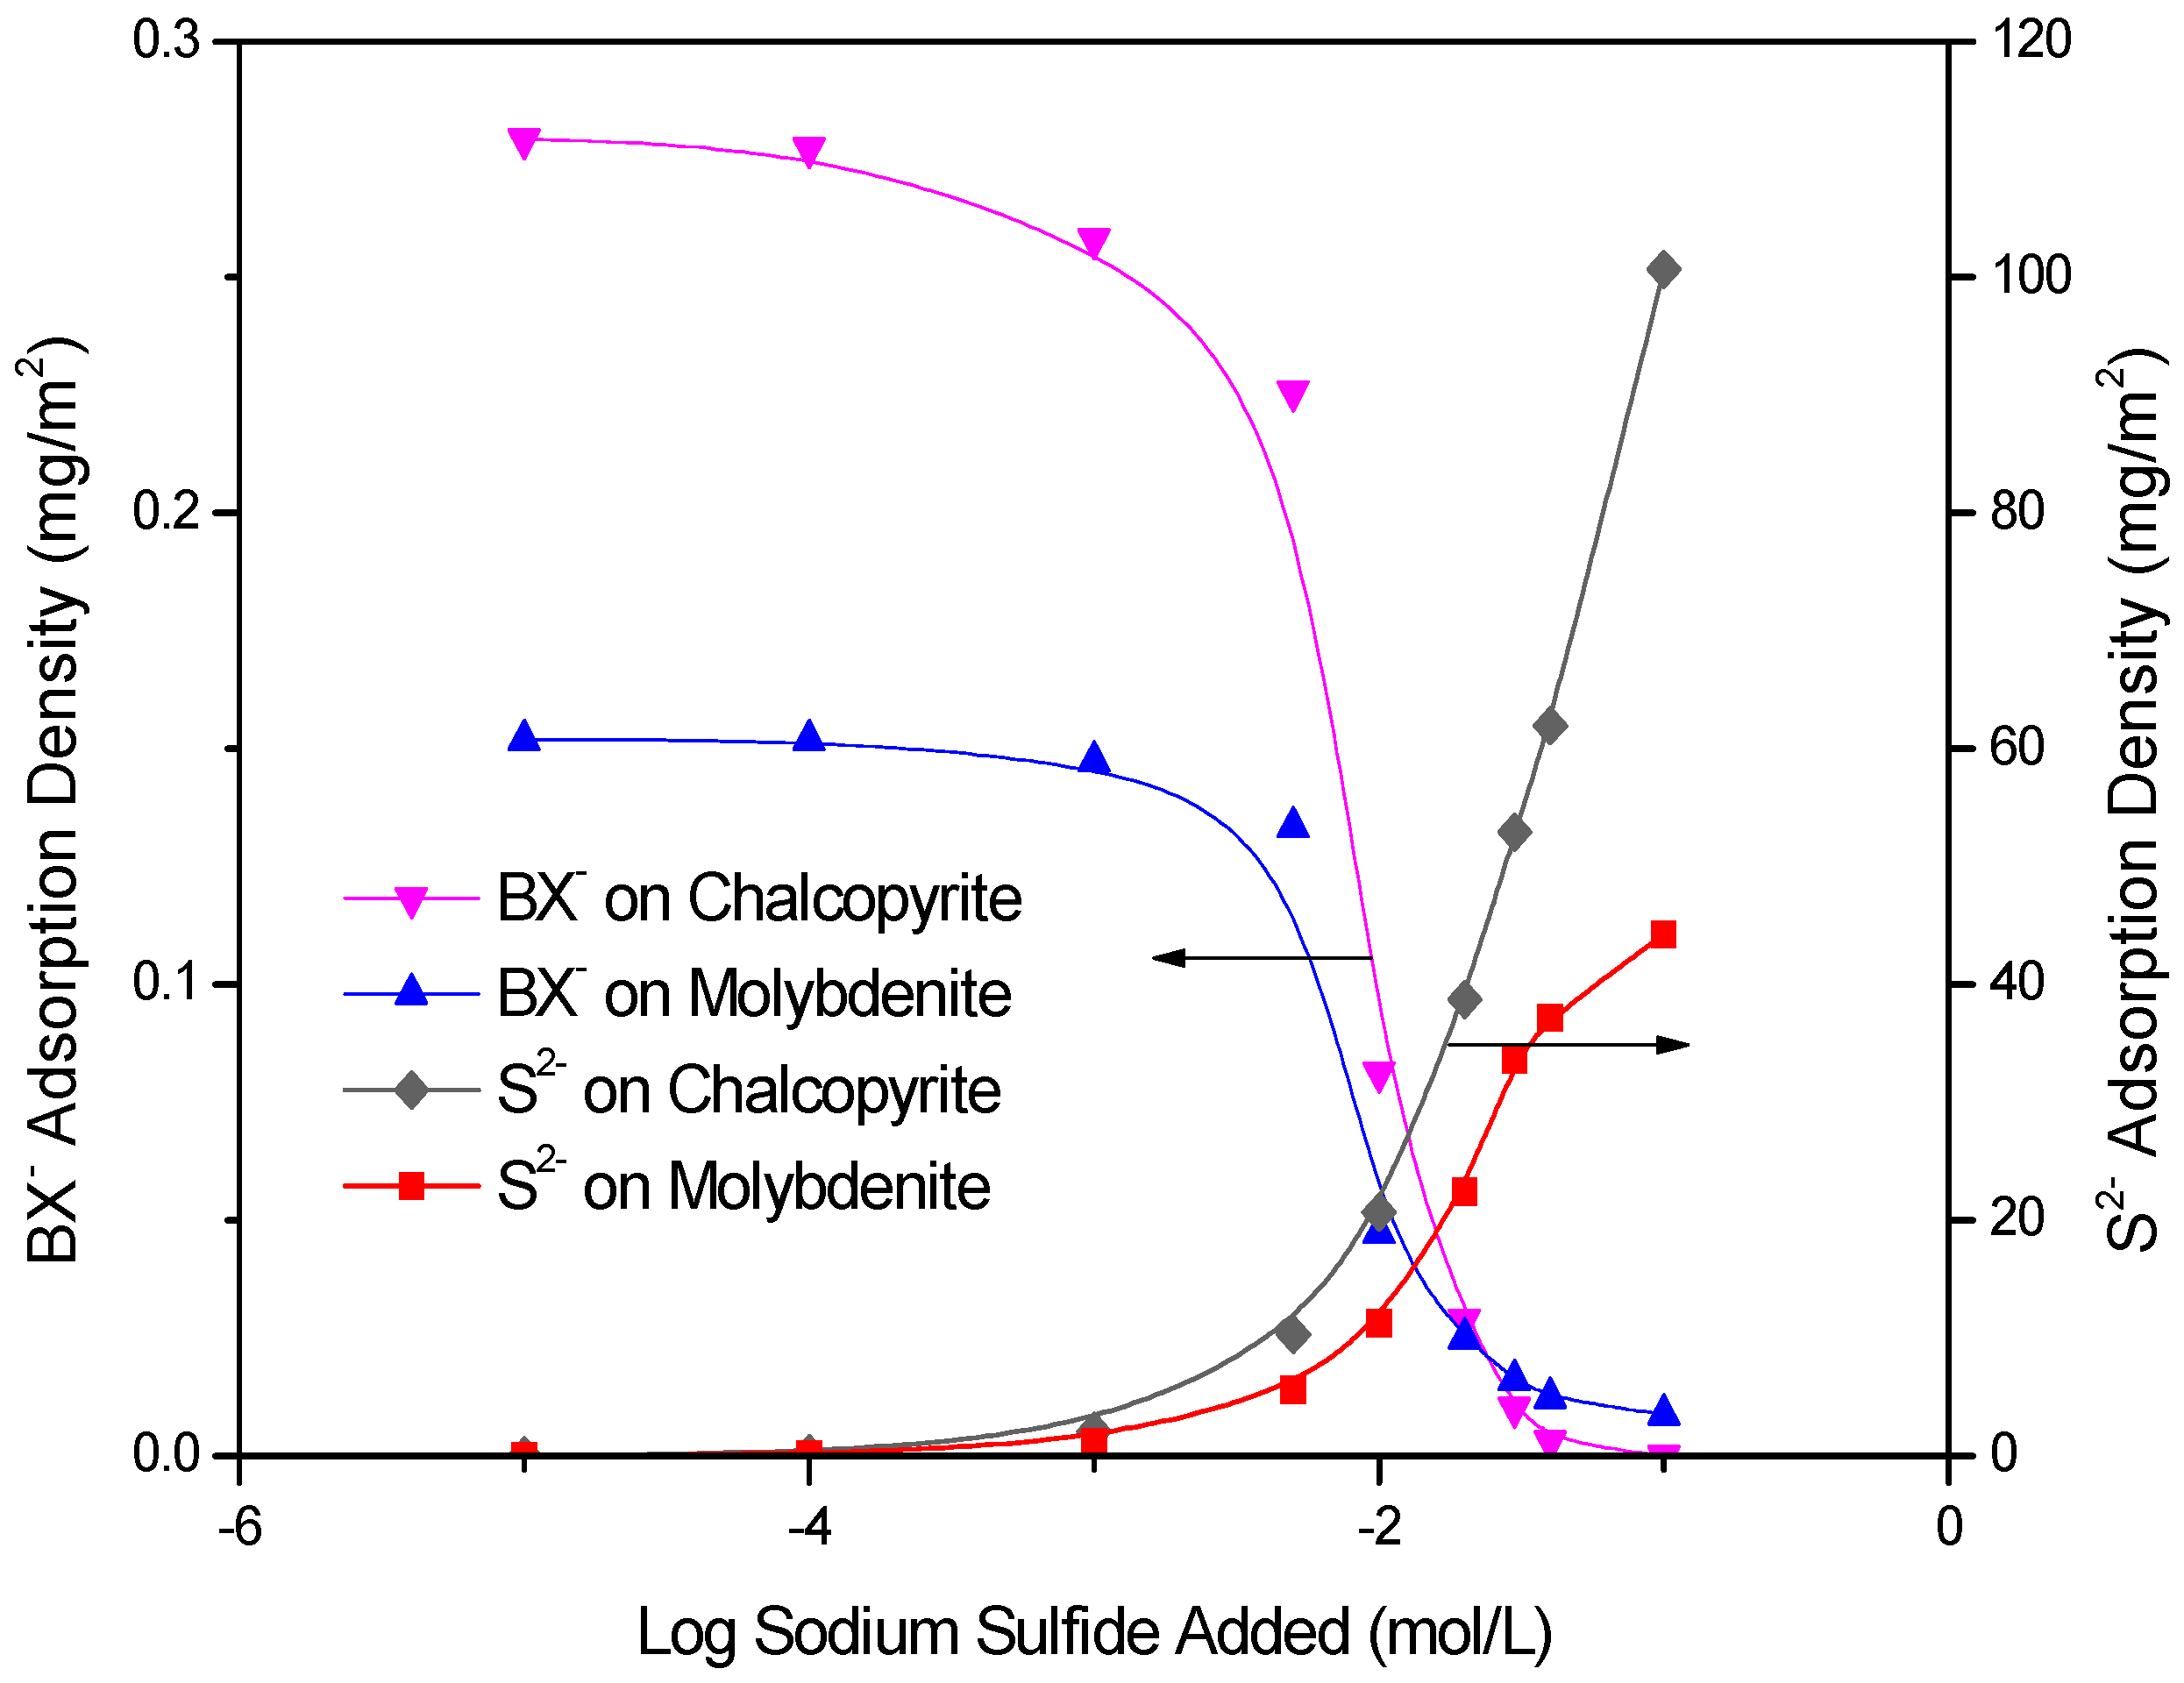
Figure 10.
The Fourier transforms infrared (FTIR) spectrum of sodium butyl xanthate powder in room temperature.
Figure 10.
The Fourier transforms infrared (FTIR) spectrum of sodium butyl xanthate powder in room temperature.
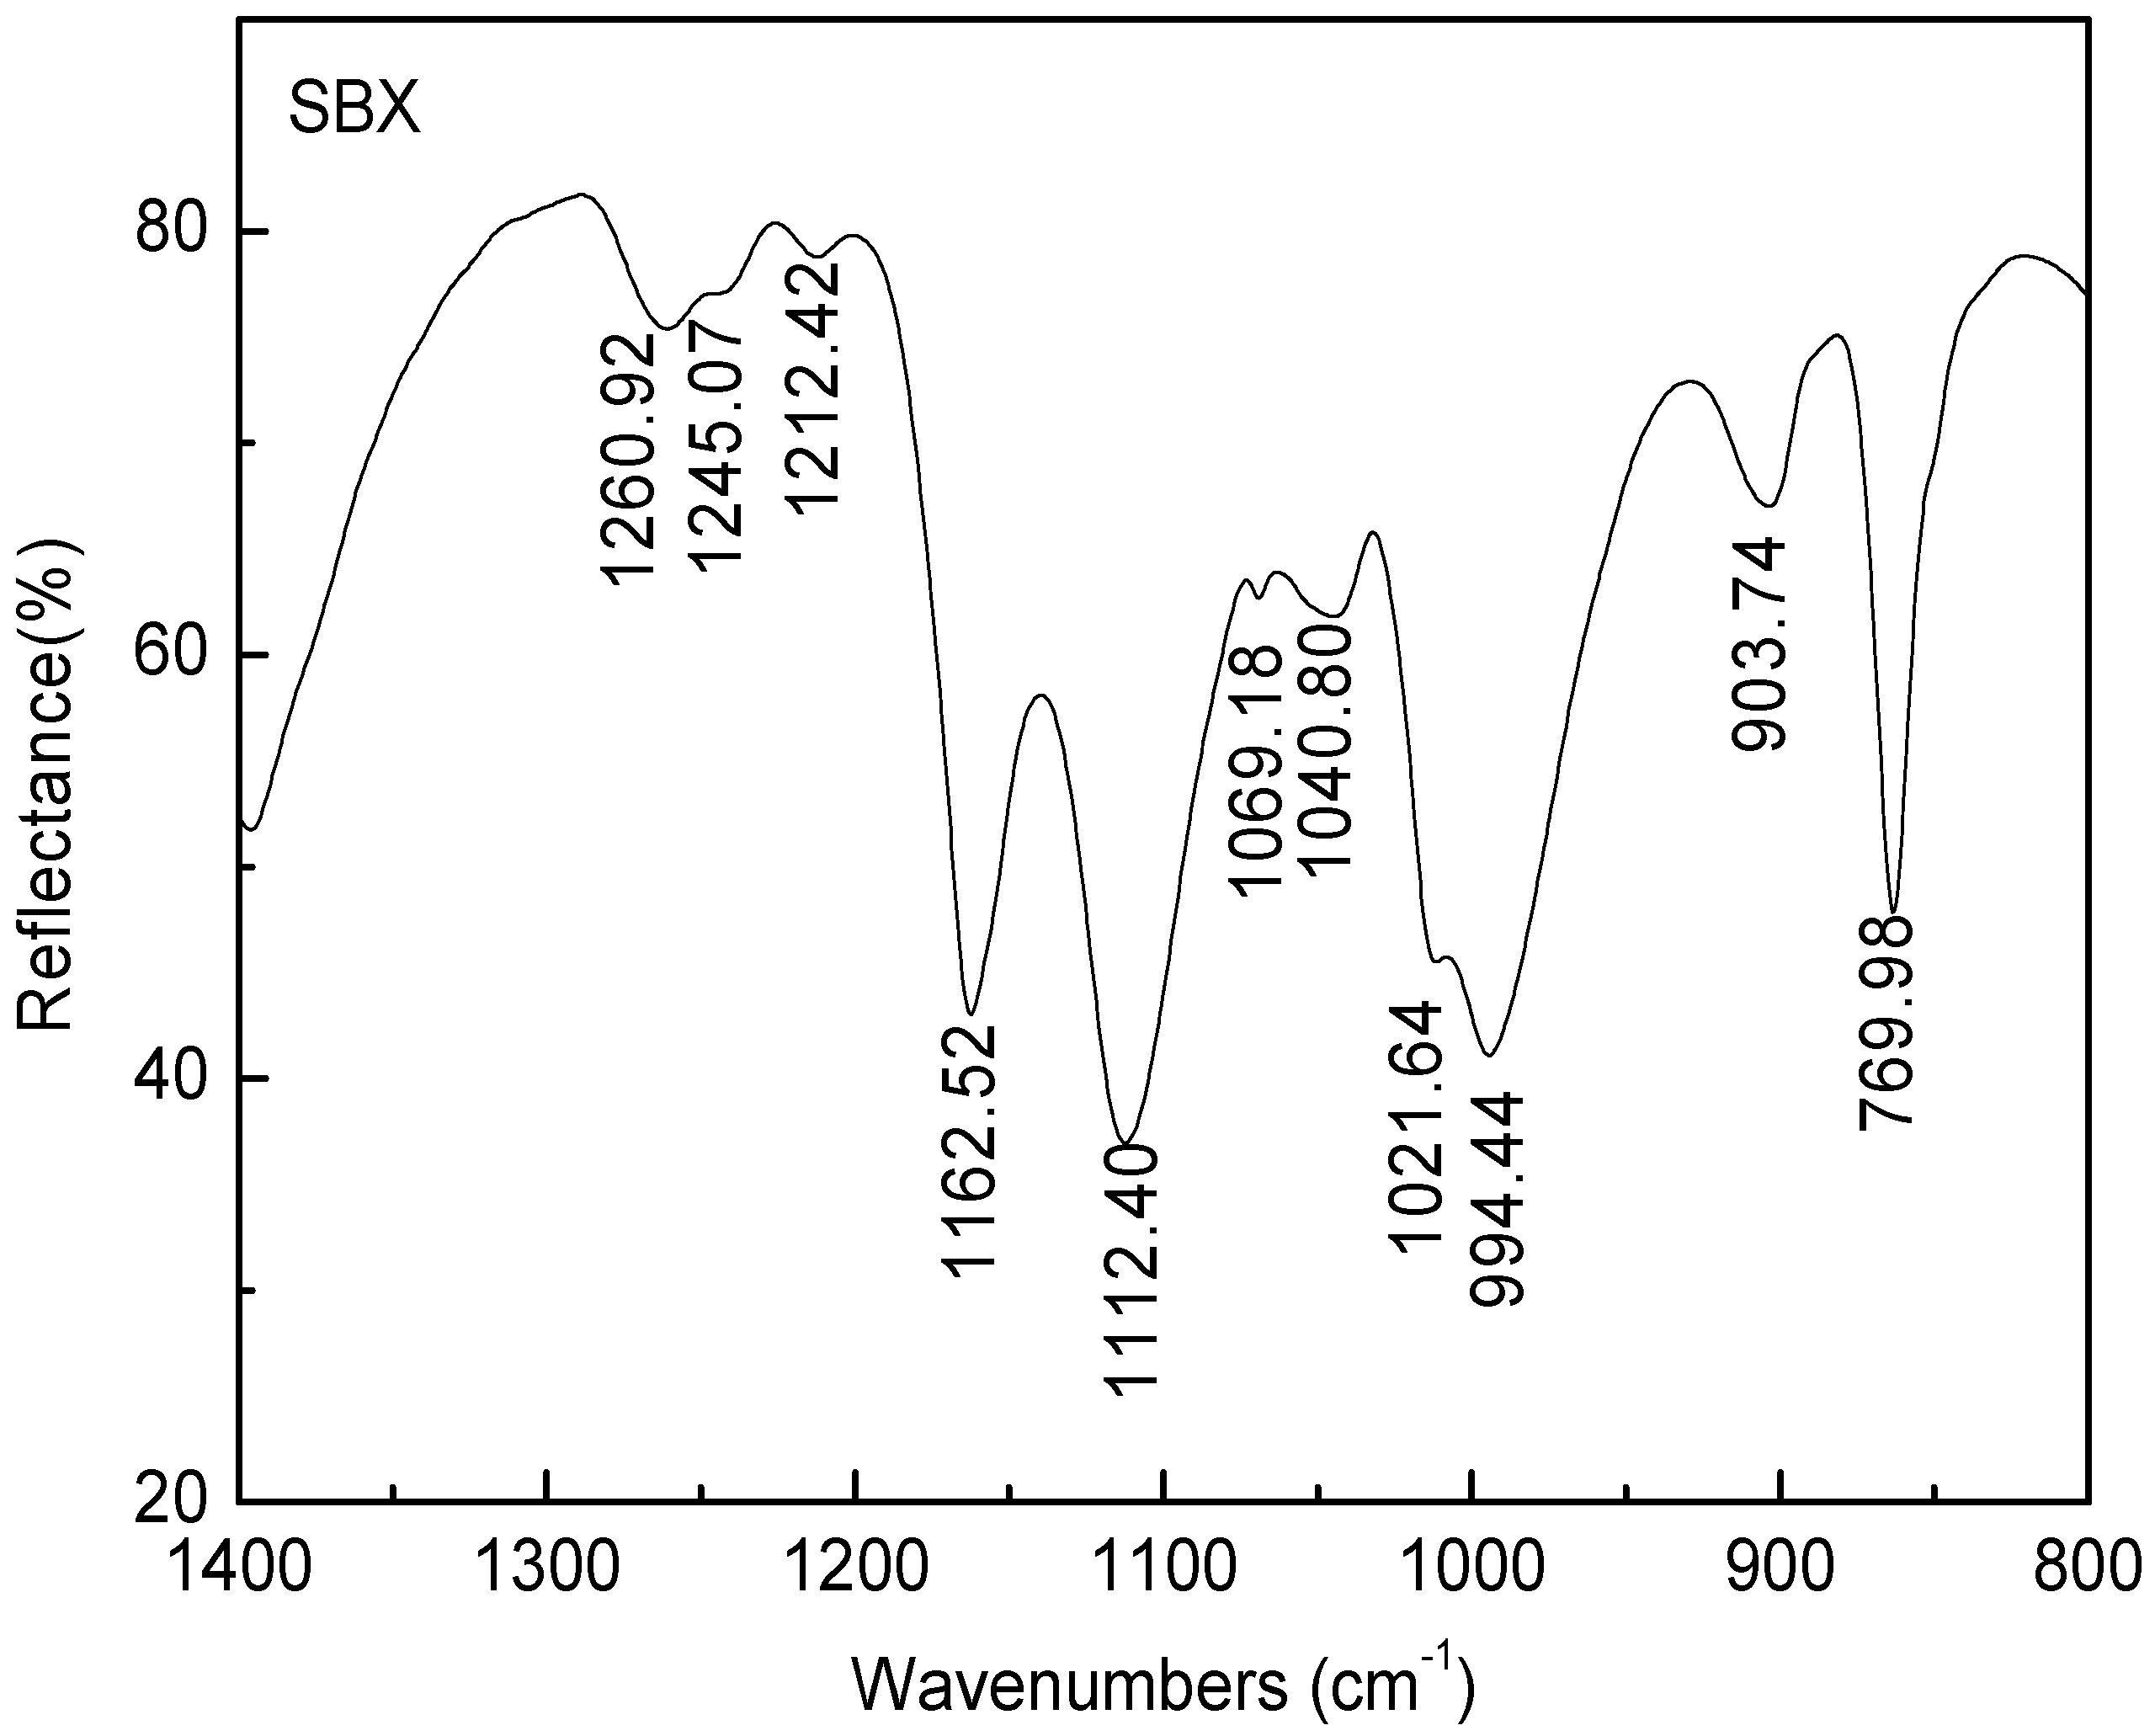
Figure 11.
The FTIR spectrum of chalcopyrite surface under different conditions: untreated chalcopyrite, chalcopyrite with 100 g/t SBX, and chalcopyrite with 100 g/t SBX in the presence of 0.1 mol/L sodium sulfide.
Figure 11.
The FTIR spectrum of chalcopyrite surface under different conditions: untreated chalcopyrite, chalcopyrite with 100 g/t SBX, and chalcopyrite with 100 g/t SBX in the presence of 0.1 mol/L sodium sulfide.

Figure 12.
The FTIR spectrum of molybdenite surface under different conditions: untreated molybdenite, molybdenite with 100 g/t SBX, molybdenite with 100 g/t SBX in the presence of 0.1 mol/L sodium sulfide.
Figure 12.
The FTIR spectrum of molybdenite surface under different conditions: untreated molybdenite, molybdenite with 100 g/t SBX, molybdenite with 100 g/t SBX in the presence of 0.1 mol/L sodium sulfide.
© 2017 by the authors. Licensee MDPI, Basel, Switzerland. This article is an open access article distributed under the terms and conditions of the Creative Commons Attribution (CC BY) license (http://creativecommons.org/licenses/by/4.0/).
Share and Cite
MDPI and ACS Style
Peng, H.; Wu, D.; Abdalla, M.; Luo, W.; Jiao, W.; Bie, X. Study of the Effect of Sodium Sulfide as a Selective Depressor in the Separation of Chalcopyrite and Molybdenite. Minerals 2017, 7, 51. https://doi.org/10.3390/min7040051
AMA Style
Peng H, Wu D, Abdalla M, Luo W, Jiao W, Bie X. Study of the Effect of Sodium Sulfide as a Selective Depressor in the Separation of Chalcopyrite and Molybdenite. Minerals. 2017; 7(4):51. https://doi.org/10.3390/min7040051
Chicago/Turabian StylePeng, Huiqing, Di Wu, Mohamed Abdalla, Wen Luo, Wenya Jiao, and Xuexiang Bie. 2017. "Study of the Effect of Sodium Sulfide as a Selective Depressor in the Separation of Chalcopyrite and Molybdenite" Minerals 7, no. 4: 51. https://doi.org/10.3390/min7040051
Note that from the first issue of 2016, this journal uses article numbers instead of page numbers. See further details here.