Article

Use of Spent Zeolite Sorbents for the Preparation of Lightweight Aggregates Differing in Microstructure

1
Department of Geotechnical Science, Faculty of Civil Engineering and Architecture, Lublin University of Technology, Nadbystrzycka 40, 20-618 Lublin, Poland
2
Department of Physical Chemistry of Porous Materials, Institute of Agrophysics, Polish Academy of Sciences, Doświadczalna 4, 20-290 Lublin, Poland
*
Author to whom correspondence should be addressed.
Minerals 2017, 7(2), 25; https://doi.org/10.3390/min7020025
Submission received: 9 January 2017 / Revised: 10 February 2017 / Accepted: 12 February 2017 / Published: 17 February 2017

Abstract

:
Lightweight aggregates (LWAs) made by sintering beidellitic clay deposits at high temperatures, with and without the addition of spent zeolitic sorbents (clinoptilolitic tuff and Na-P1 made from fly ash) containing diesel oil, were investigated. Mineral composition of the aggregates determined by X-ray diffraction was highly uniformized in respect of the initial composition of the substrates. The microstructure of the LWAs, which were studied with a combination of mercury porosimetry, microtomography, nitrogen adsorption/desorption isotherms and scanning electron microscopy, was markedly modified by the spent zeolites, which diminished bulk densities, increased porosities and pore radii. The addition of zeolites decreased water absorption and the compressive strength of the LWAs. The spent Na-P1 had a greater effect on the LWAs’ structure than the clinoptilolite.

1. Introduction

Lightweight aggregates (LWAs) are building materials, produced from different minerals (including ordinary soil clay, perlite, vermiculite, and natural and synthetic zeolites) by rapid sintering/heating at high temperatures up to 1300 °C [1]. To achieve expanded material appropriately, two conditions are necessary: the presence of substances that release gases at high temperature, and a plastic phase with adequate viscosity, which is able to trap the released gases [2]. The expanded clay aggregates are non-flammable and highly resistant to chemical, biological and weather conditions. Their highly porous structure is represented mainly by closed pores surrounded by glassy coatings, which are formed during the thermal transformation of clay minerals. As a consequence, LWAs have relatively low particle and bulk densities, low thermal conductivity and sound dampening characteristics [3,4,5,6,7,8], thereby allowing them to have broad applications in the construction industry, geotechnics, gardening and agriculture [4,5,9,10,11,12,13,14,15,16].
Much effort has been recently invested to reuse different kinds of waste materials, in order to avoid their disposal in landfills and paying additional environmental taxes, as well as to reduce production costs [17,18]. Many waste materials, such as combustion ashes [19], waste glass [15], sewage or industrial sludge [20,21,22,23], incinerator bottom ash [24], mining residues, heavy metal sludge, washing aggregate sludge [4], polishing residue, lignite coal fly ash [25,26], spent adsorbents [27,28] and contaminated mine soil [29], have been used as additives for the production of LWAs. Some of these materials can contribute to the foaming or bloating that occurs during LWAs’ sintering, thus increasing their porosity.
Among their wide industrial and environmental applications [30,31,32,33], zeolite minerals have recently been described as very efficient sorbents, especially for the cleanup of oil land spills [34,35,36,37,38,39]; however, significant amounts of waste materials are produced in parallel. According to our knowledge, waste zeolitic sorbents containing petroleum products have not yet been considered for LWA production. As evidenced by several research studies, the mineral composition and organic amendments to the substrate can determine the physical properties of LWAs. Therefore, we hypothesized that the addition of waste zeolites will modify the structure of the standard clay-based LWAs towards higher porosity, which will differ depending on the zeolite used.

2. Materials and Methods

2.1. Substrates

The starting materials for LWA preparation were beidellitic clay deposit (Budy Mszczonowskie, Poland) and two spent zeolitic sorbents: a natural clinoptilolitic tuff (Socirnica, Ukraine) [40] and the synthetic Na-P1 obtained by hydrothermal conversion of fly ash with sodium hydroxide, according to Wdowin et al. [41]. Both zeolites were dried at 105 °C, milled in a rotary mill to < 0.1 mm diameter and enriched to their maximum sorption capacities (25% w/w for the tuff and 50% w/w for Na-P1) with the diesel fuel Verva ON taken from the Orlen petrol station. The sorption capacities were measured by soaking the zeolites in the fuel drop by drop and weighing.

2.2. Lightweight Aggregates Preparation

90 g (90% w/w) of the clay samples were admixed with 10 g (10% w/w) of the spent sorbents, carefully homogenized and wetted with water (around 40 mL/100 g of the dry mass) (drop by drop at the end) in order to obtain plastic masses at the plastic limit state, according to ASTM D 4318 [42]. From these masses, granules of around 15 mm were formed by hand, air-dried at room temperature for 24 h, then at 50 °C for 2 h and finally at 105 °C for 12 h. The dry granules were placed into the SM-2002 “Czylok” laboratory furnace, subjected to heating up to 1170 °C with 5 °C·min−1 temperature increase, sintered at 1170 °C for 30 min and left in the furnace overnight for cooling to approximately 100 °C. The cooled LWAs were stored in closed vessels. The aggregates prepared from the natural clay deposit will be abbreviated further as CLAY, with those admixed with the clinoptilolitic tuff as CLIN and those with Na-P1 as NAP1.

2.3. Methods of Characterization

All measurements described below were performed in triplicate and all data presented further are averages from these replicates.

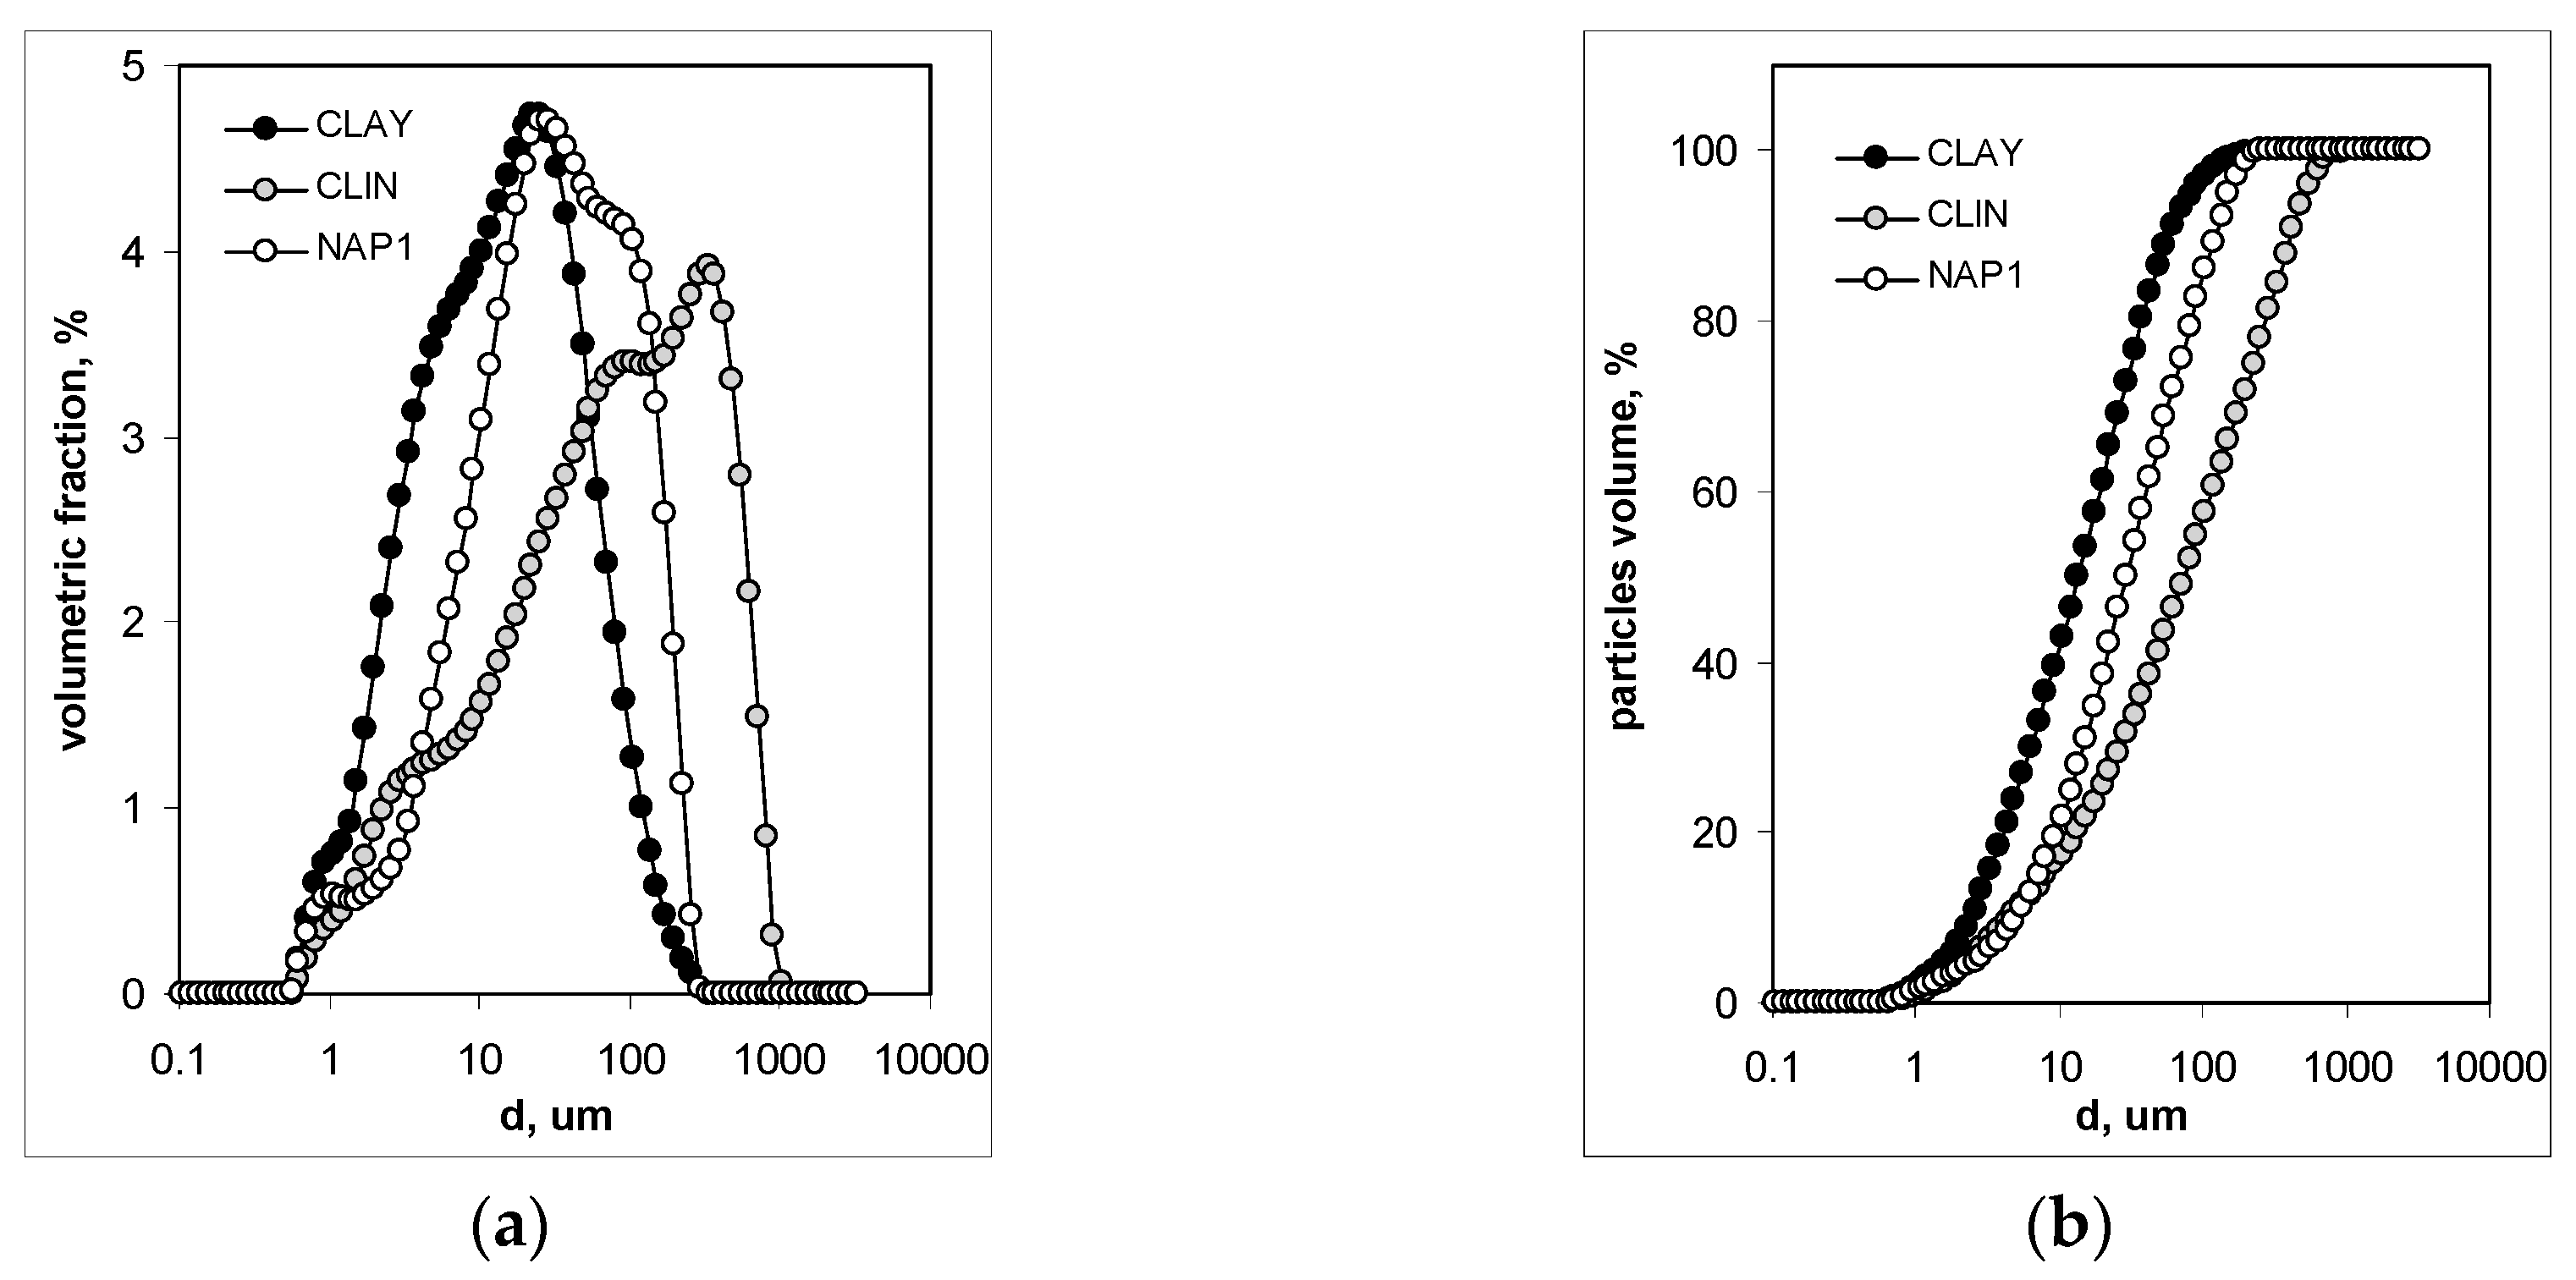
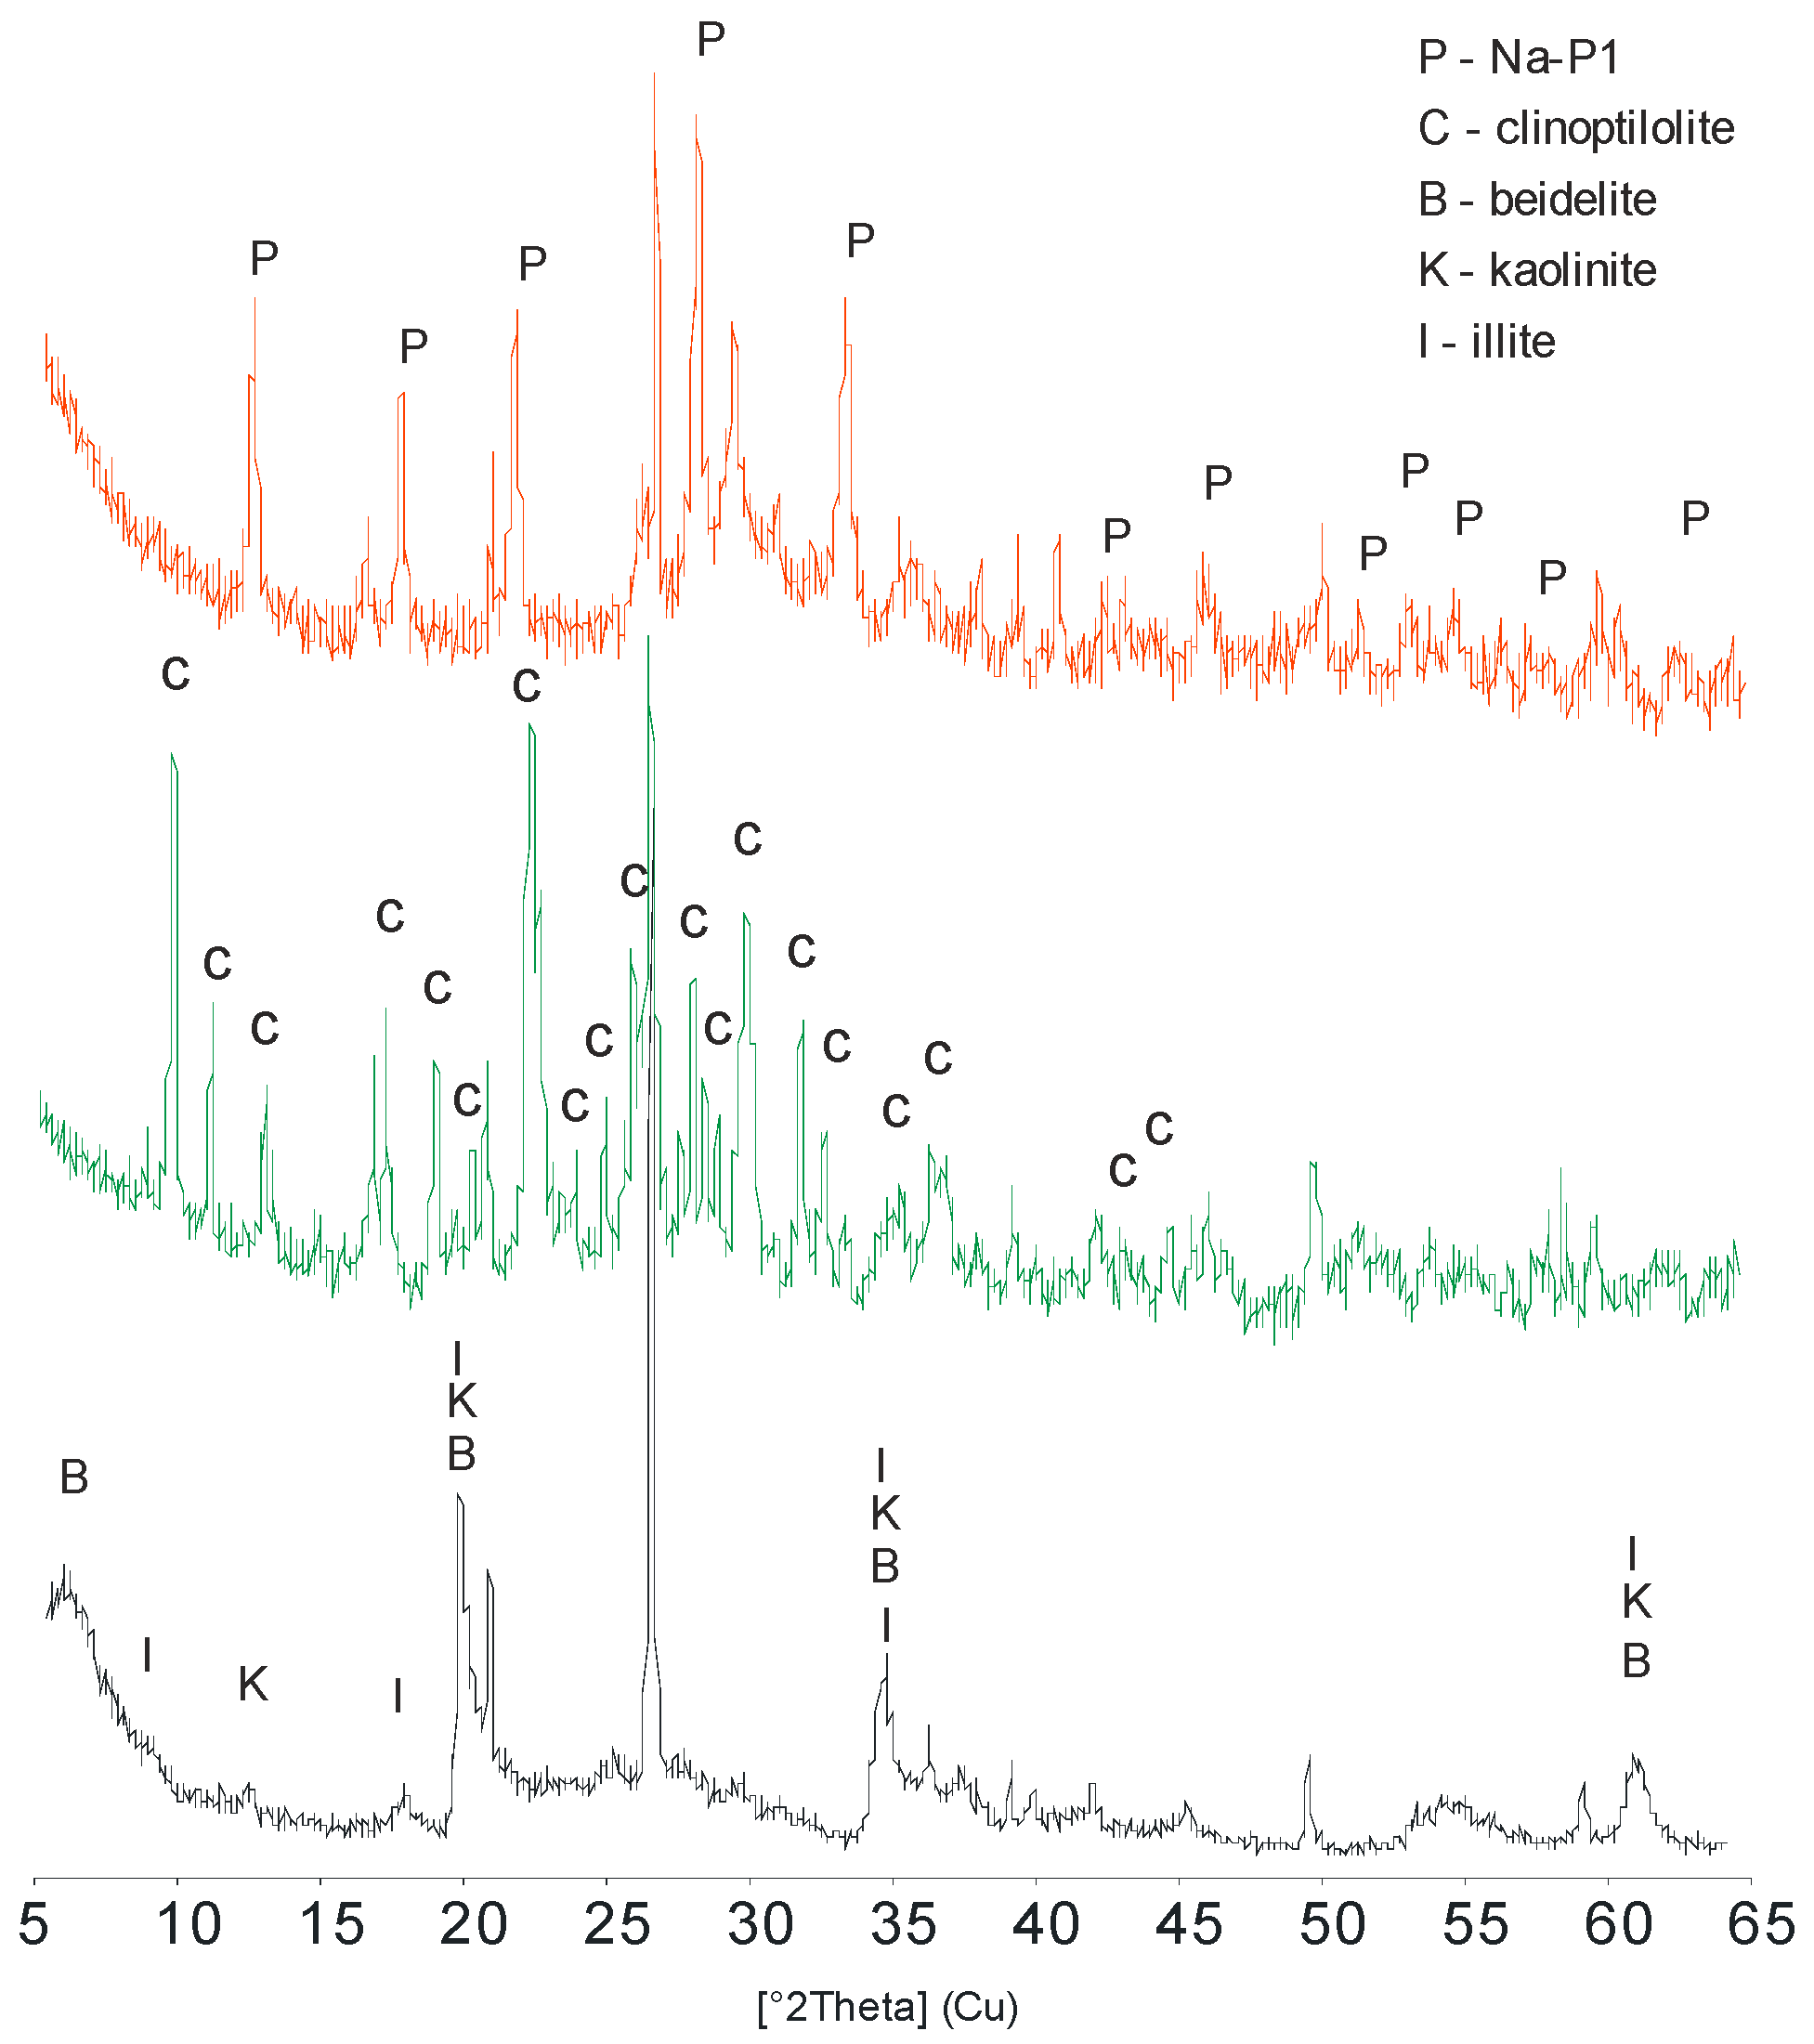
2.3.1. Mineralogical and Physical Properties

Mineralogical composition of the substrates and the obtained LWAs was examined by X-ray diffraction analysis using a X’pert PROMPD spectrometer with a PW 3050/60 goniometer (Panalytical, Almelo, The Netherlands), Cu lamp and graphite monochromator within a 2θ range of 5°–65°. Identification of the mineral phases was based on the JCPDS-ICDD database.
Solid phase density (SPD) was measured by water pycnometry for finely crushed (<0.1 mm) aggregates.
The particle density (BD) of the aggregates was estimated from their volume (measured by immersion in mercury) and mass (weighing).
Water absorption WA24h was determined after soaking LWAs for 24 h in water and weighing according to EN-ISO 1097-6 [43].
The compressive strength Ca, being the force necessary to pass a piston for a certain depth into a cylinder filled with the studied material, was determined according to UNE-EN 13055-1/AC:2004-10-22 [44].
The freezing resistance F of the aggregates, which express the percentage loss of the mass of the aggregate soaked in water and subjected to 10 cycles of freezing-thawing (−17.5 and 20 °C, respectively) was determined by the UNE-EN 12697-2:1999 standard [45].
The laser diffraction method was applied in order to measure the particle size distribution of the initial materials subjected to 300 W of ultrasonication for 1 min using a Mastersizer 2000 with a Hydro G dispersion unit provided by Malvern UK. When obscuration after adding the sample to the measuring system exceeded 10%–20%, it was lowered by using the procedure that ensures there is no discrimination of any fraction [46]. For the solid phase, the refraction index was taken as 1.52 and the absorption index as 0.1; for water, the refraction index was taken as 1.33.

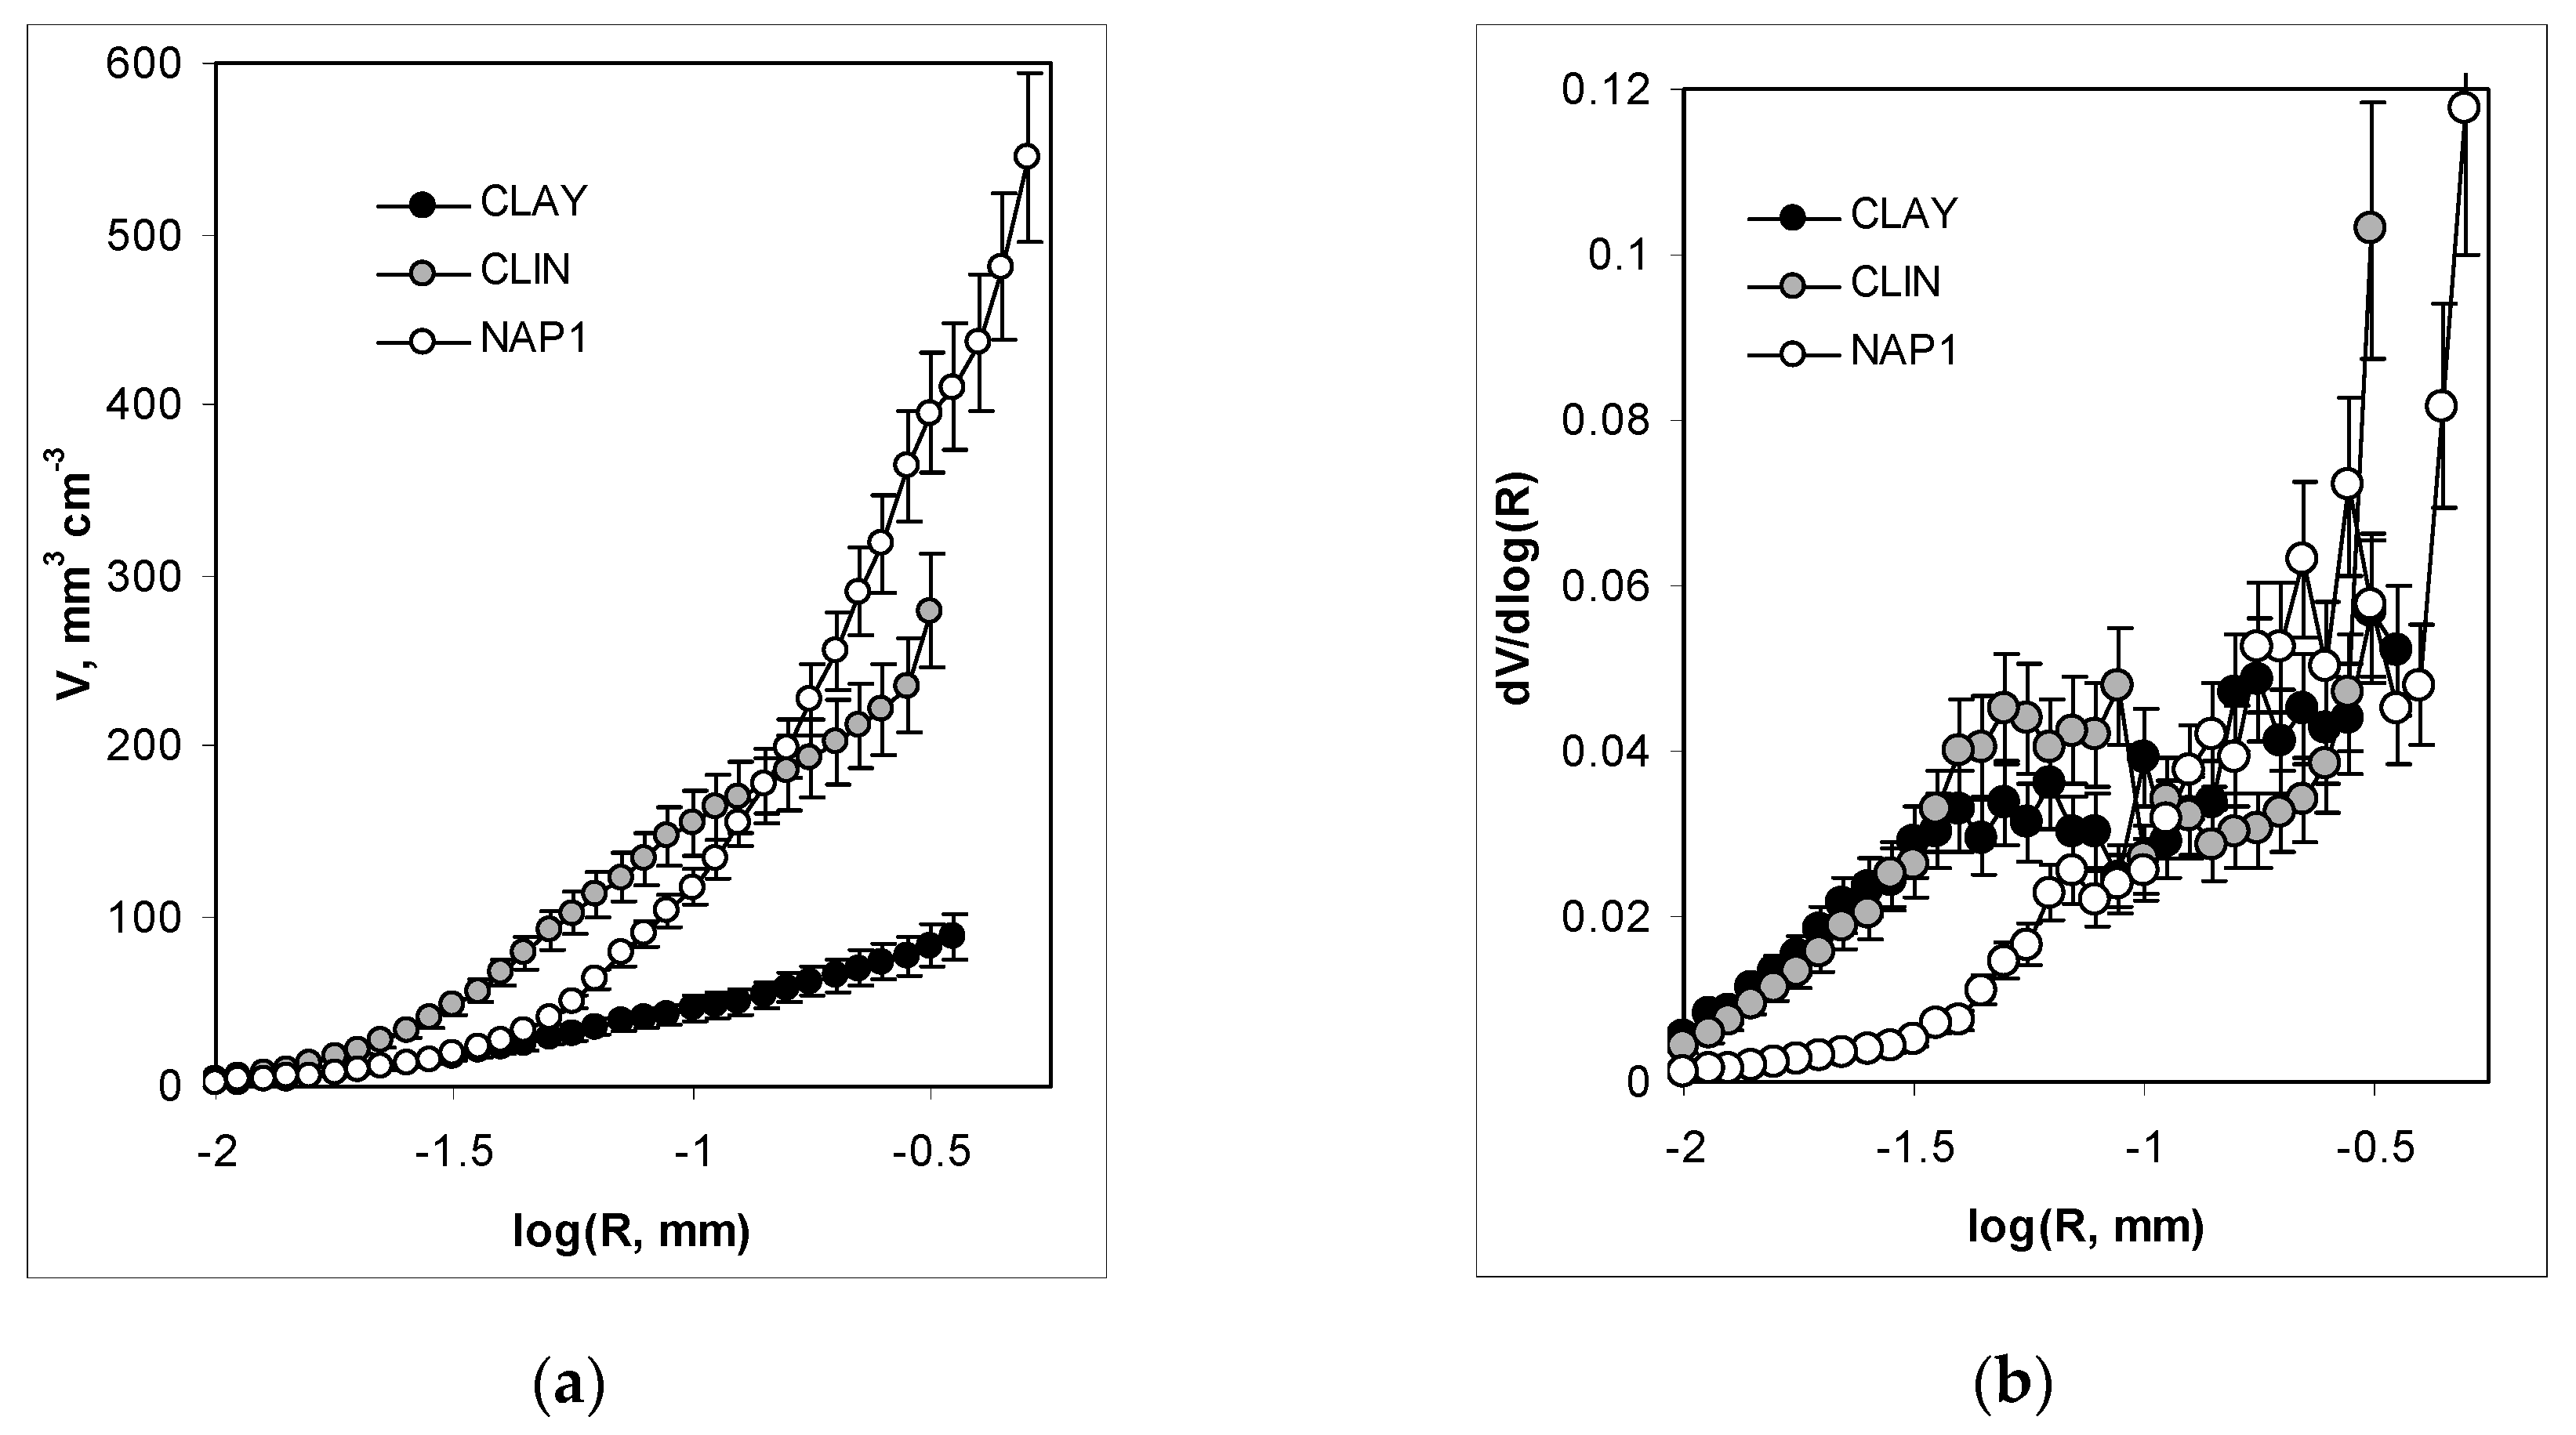
2.3.2. Structural Characteristics

X-ray computational microtomography was applied for 3D scanning of the studied LWAs using a Nanotom S device (General Electrics, Frankfurt, Germany). The X-ray source with a molybdenum target, operated at a cathode current of 230 µA and a 60 kV voltage was used for X-ray generation. The scanning process consisted of two stages: an initial pre-scan and a main measurement scan. Prior to the final measurement scan, each sample was subjected to a short 40 min pre-scan in order to heat it up and reach thermal stability, which was maintained further during the main scan lasting 150 min. The scanned specimens were dry, so the only effect of heating by X-rays on the measurement could have been caused by the thermal elongation of the sample holder. The pre-scan eliminated this problem. During the main scan, 2400 2D cross-sectional images were acquired with a spatial resolution (voxel size) of about 0.0063 mm and then used for 3D porous space reconstruction. The resulting 3D 16 bit grey-level images represent the spatial structure of specimens. Image analysis techniques were used for further processing. Initially, the bit depth of images was reduced from 16 to 8 bit. After that, a 3D median filter including a uniform kernel with a diameter equal to 3 px was used for noise reduction. The next step was the thresholding procedure, which utilized the Otsu algorithm. Threshold images had a 1 bit color depth with black areas representing pores. These preprocessing steps were performed using ImageJ software. For further analysis, Avizo software was used. The 3D watershed-based segmentation algorithm and then the labelling algorithm were used to separate the connected pores into individual ones. Geometrical characteristics of the pores including equivalent diameter (a diameter of the sphere with the same volume as a pore), volume, surface and fractal dimension of pores according to the maximal ball method [47] were calculated from three 3D images.
Mercury intrusion porosimetry (MIP) tests were performed for pressures ranging from about 0.1 to 200 MPa (pore radii ranged from about 10.0 to 3.8 × 10⁻³ µm). The intrusion volumes were measured at stepwise increasing pressures, which allowed for equilibration at each pressure step. The maximum deviations between the mercury intrusion volumes were no higher than 6.9% and occurred mainly at low pressures (largest pores). The volume of mercury V [m3·kg-1] intruded at a given pressure P [Pa] gave the pore volume that can be accessed. The intrusion pressure was translated into an equivalent pore radius R [m] following the Washburn equation:
P = −A·σm·cosαm/R
where σm is the mercury surface tension (0.485 N·m−1), αm is the mercury/solid contact angle (taken as 141.3° for all studied materials) and A is a shape factor (equal to 2 for the assumed capillary pores). The total range for the pore radii in the mercury intrusion curve was divided into sections in steps of 0.1 log(R).
Knowing the dependence of V vs. R, a normalized pore size distribution, χ(R), was calculated and expressed in the logarithmic scale [48]:
χ(R) = 1/Vmax·dV/dlog(R).
By knowing χ(R), the average pore radius, Rav, was calculated from:
Rav = ∫R·χ(RdR
If a range of pore sizes, wherein the pore volume depends on a power of the pore radius, could be found, this was interpreted in terms of pore surface fractal behavior. In this case, the dependence of log(dV/dR) against logR was plotted and, from the slope of its linear part, the fractal dimension of ·pore surface D was derived according to Pachepsky et al. [49]:
Ds = 2 − slope
To define the linear range of fractality, the Yokoya et al. [50] procedure was applied. According to this procedure the measure of the linearity L for the set of the points in a x-y plane is:
L = (4σ2xy + (σyy − σxx)2)1/2·(σyy + σxx)−1
where σxx, σyy and σxy are the variances of x-coordinates, y-coordinates and the covariance between x and y coordinate sets, respectively.
The L value falls between 0 (for uncorrelated and random points) and 1 (for points on a straight line). To separate out the linearity range, the value of L is computed for the first three points, then for the first four, five and so on until the value of L increases. The end of the linearity range is within the points after which the value of L begins to decrease. From the estimated linearity range, the two first and/or two last points were rejected if this caused an increase in the linear regression coefficient between the considered data.
The apparent solid phase skeletal densities of the samples SSD (which are lower than true solid phase densities due to the residence of the finest pores in the solid phase that are not filled by mercury at its highest pressure) and the total surface of MIP available pores S(MIP) were calculated by the porosimetric data analysis program provided by the equipment manufacturer.
Nitrogen adsorption isotherms were measured at the temperature of liquid nitrogen using ASAP 2020MP manufactured by Micromeritics (Norcross, GA, USA).
The scanning electron microscope (SEM) images of the tested materials were taken using an FEI Quanta 250 FEG microscope equipped with the energy dispersion scattering EDS-EDAX system for chemical composition analysis(FEI, Hilsboro, OR, USA). From three SEM images, the sizes of the finest pores were estimated using the Aphelion 4.0.10 image analysis package and the Vogel and Roth procedure [51].

3. Results and Discussion

3.1. Mineralogical and Physical Properties

Figure 1 illustrates the particle size distribution of the initial materials.
The clay material is composed of the finest particles with an average diameter of 58 μm, followed by NaP1 with a similar average diameter of 52 μm. The largest particles occur in natural clinoptilolitic tuff, for which the average diameter is 178 μm.
The main mineral components of the raw clay material were around 51% of beidellite (dhkl 15.15, 4.44, 2,59 and 1.49 Å), 24% of quartz, 9% of kaolinite (dhkl 7.14, 4.48 and 4.36 Å), 7% of illite (dhkl 10.01, 5.02, 4.48, 3.34, 2.59 and 1.49 Å), 7% of feldspars (dhkl 3.19, 3.68 and 4.22 Å) and less than 2% of iron hydroxides (Figure 2). The main mineral component of the clinoptilolitic tuff was clinoptilolite as recognized by dhkl = 8.95, 7.94, 3.96 and 3.90 Å XRD reflections. The presence of the Na-P1 phase in the product of fly ash conversion was confirmed by dhkl = 7.10, 5.01, 4.10 and 3.18 Å.
The XRD patterns of LWAs obtained from the clay and a mixture of clay and spent zeolitic sorbents are shown in Figure 3.
An extremely high degree of uniformization of the mineral composition of the sintered substrates is observed in the XRD spectra of the LWAs produced from different materials. The main mineral components of all LWAs are mullite (dhkl 3.39, 5.41, 3.42 and 2.21 Å) and quartz (3.34, 4.25 and 1.81 Å). The presence of mullite is an effect of the melting of the original clay minerals (beidellite, illite, kaolinite) [52]. One can observe that iron hydroxides were transformed into well-defined hematite (dhkl 2.70 and 2.51 Å), while the feldspars remained intact. Apart from the defined mineral phases, a significant contribution of an amorphous glassy phase can be distinguished by the rise in the background line within the range 15°–30° 2θ, which was the highest for LWAs admixed with Na-P1.
The physical properties of the studied LWAs are shown in Table 1. The solid phase density decreases slightly due to the spent sorbents addition, whereas the particle density decreases markedly, indicating the effect of the spent zeolites on the aggregates’ expansion. Despite the decrease in particle density suggesting much larger porosity, the water absorption decreases for all LWAs produced with spent sorbents admixtures. Taking into account the similar mineral composition of the LWAs, resulting most probably in similar surface properties (wettability/hydrophobicity) of the aggregates material, the above differences may be connected to differences in the pore system, particularly in the amount of closed pores unavailable for water. According to Hung and Hwang [53], a particle with isolated pores or a vitrified surface tends to absorb less water than one having connected or open pores. Water absorption of the studied LWAs containing the spent sorbents is markedly lower than for several commercial ones as stated by their manufacturers, such as Lytag (17.55%), Arlita (20%) and Leca (30.3%).
Lower water absorption may have technological advantages for building purposes. The frost resistance test showed that all LWAs lost not more than 1% mass after freezing that indicates their high resilience against variations in climate conditions. The aggregate grains did not show any occurrence of cracks after the test, probably because water penetrating the grains has not filled their whole pore space, meaning that it did not cause any visible aggregate damage after freezing. The compressive strength of the studied LWAs significantly decreased after the addition of spent sorbents. However, their mechanical resistance is still higher than that of some commercially available LWAs, such as Lytag (0.43 MPa), Leca (0.09 MPa) [54] or Leca Weber (0.75 MPa) (Saint-Gobain Construction Products Poland) and markedly higher than 0.44 MPa, which is the internationally accepted standard for solid waste materials used for land levelling [55].

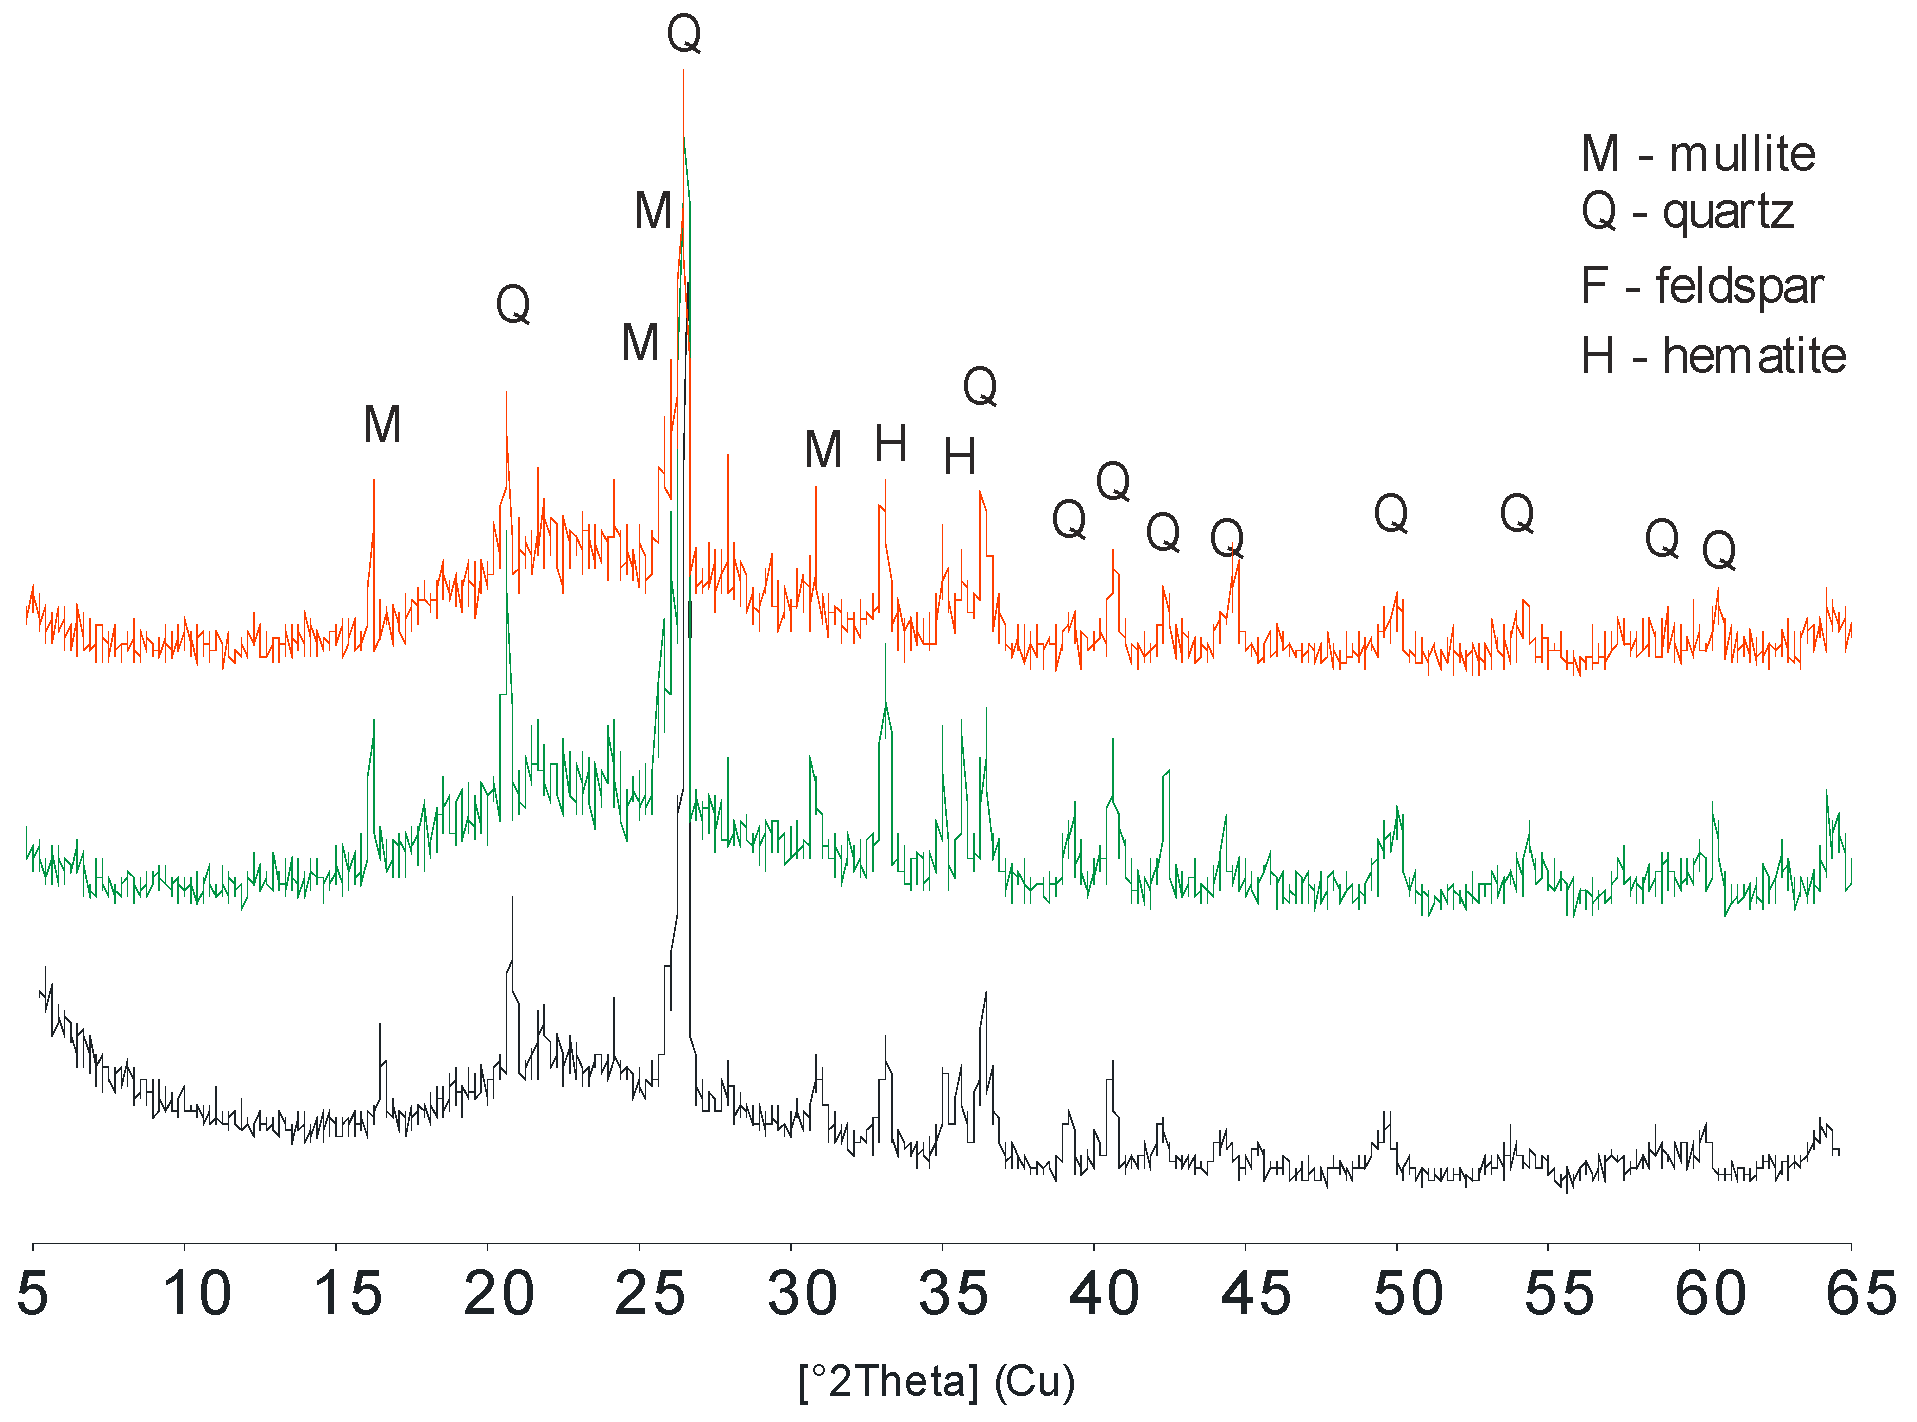
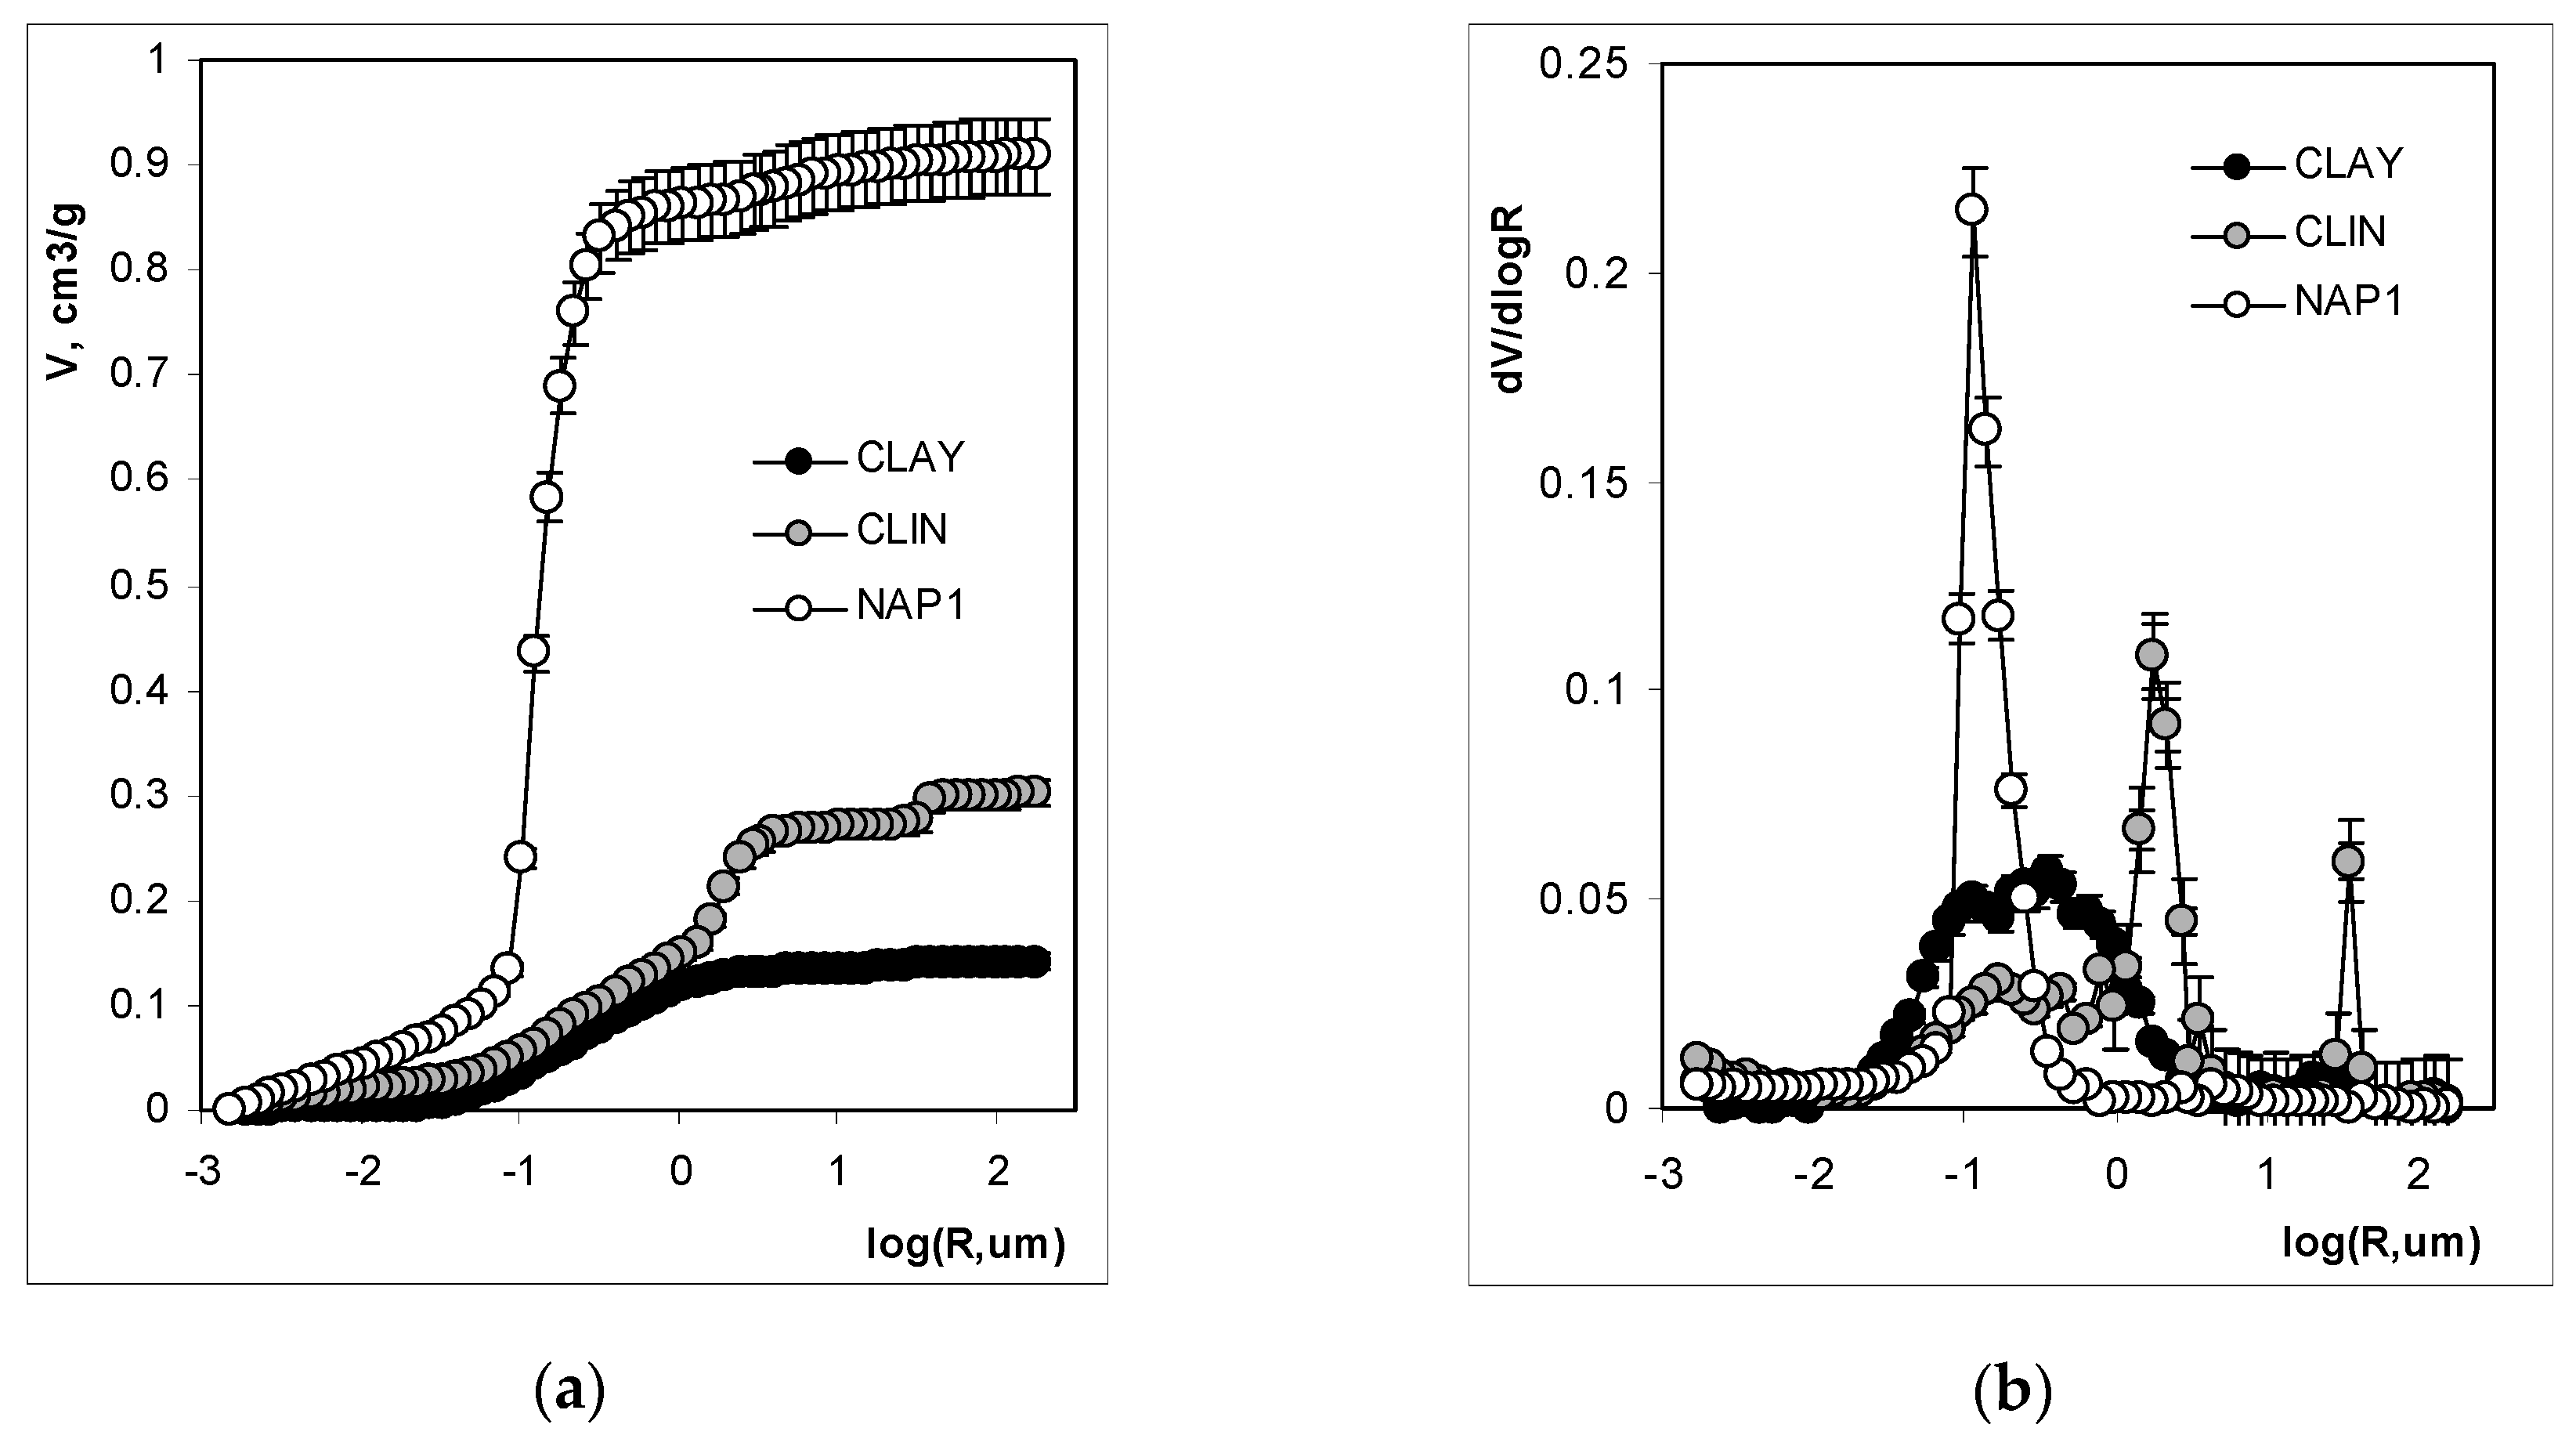
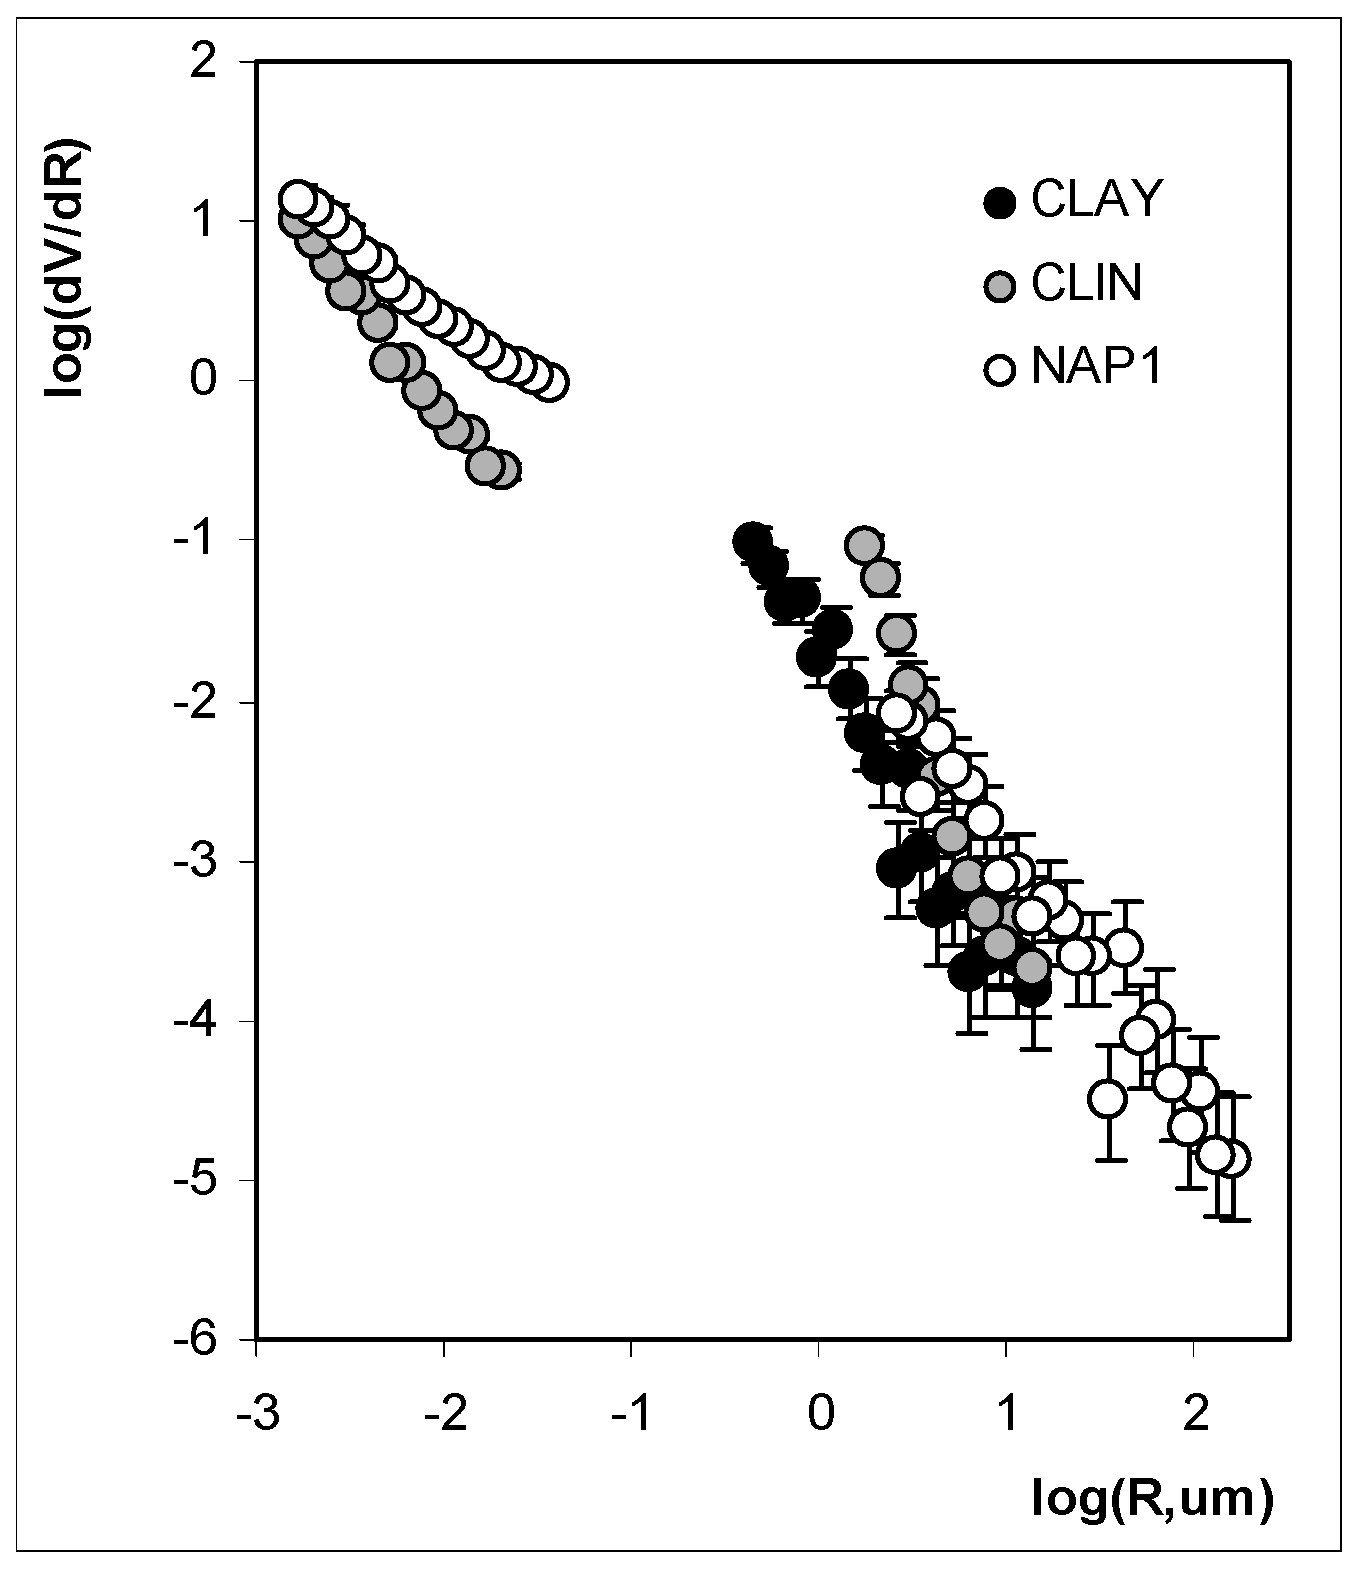
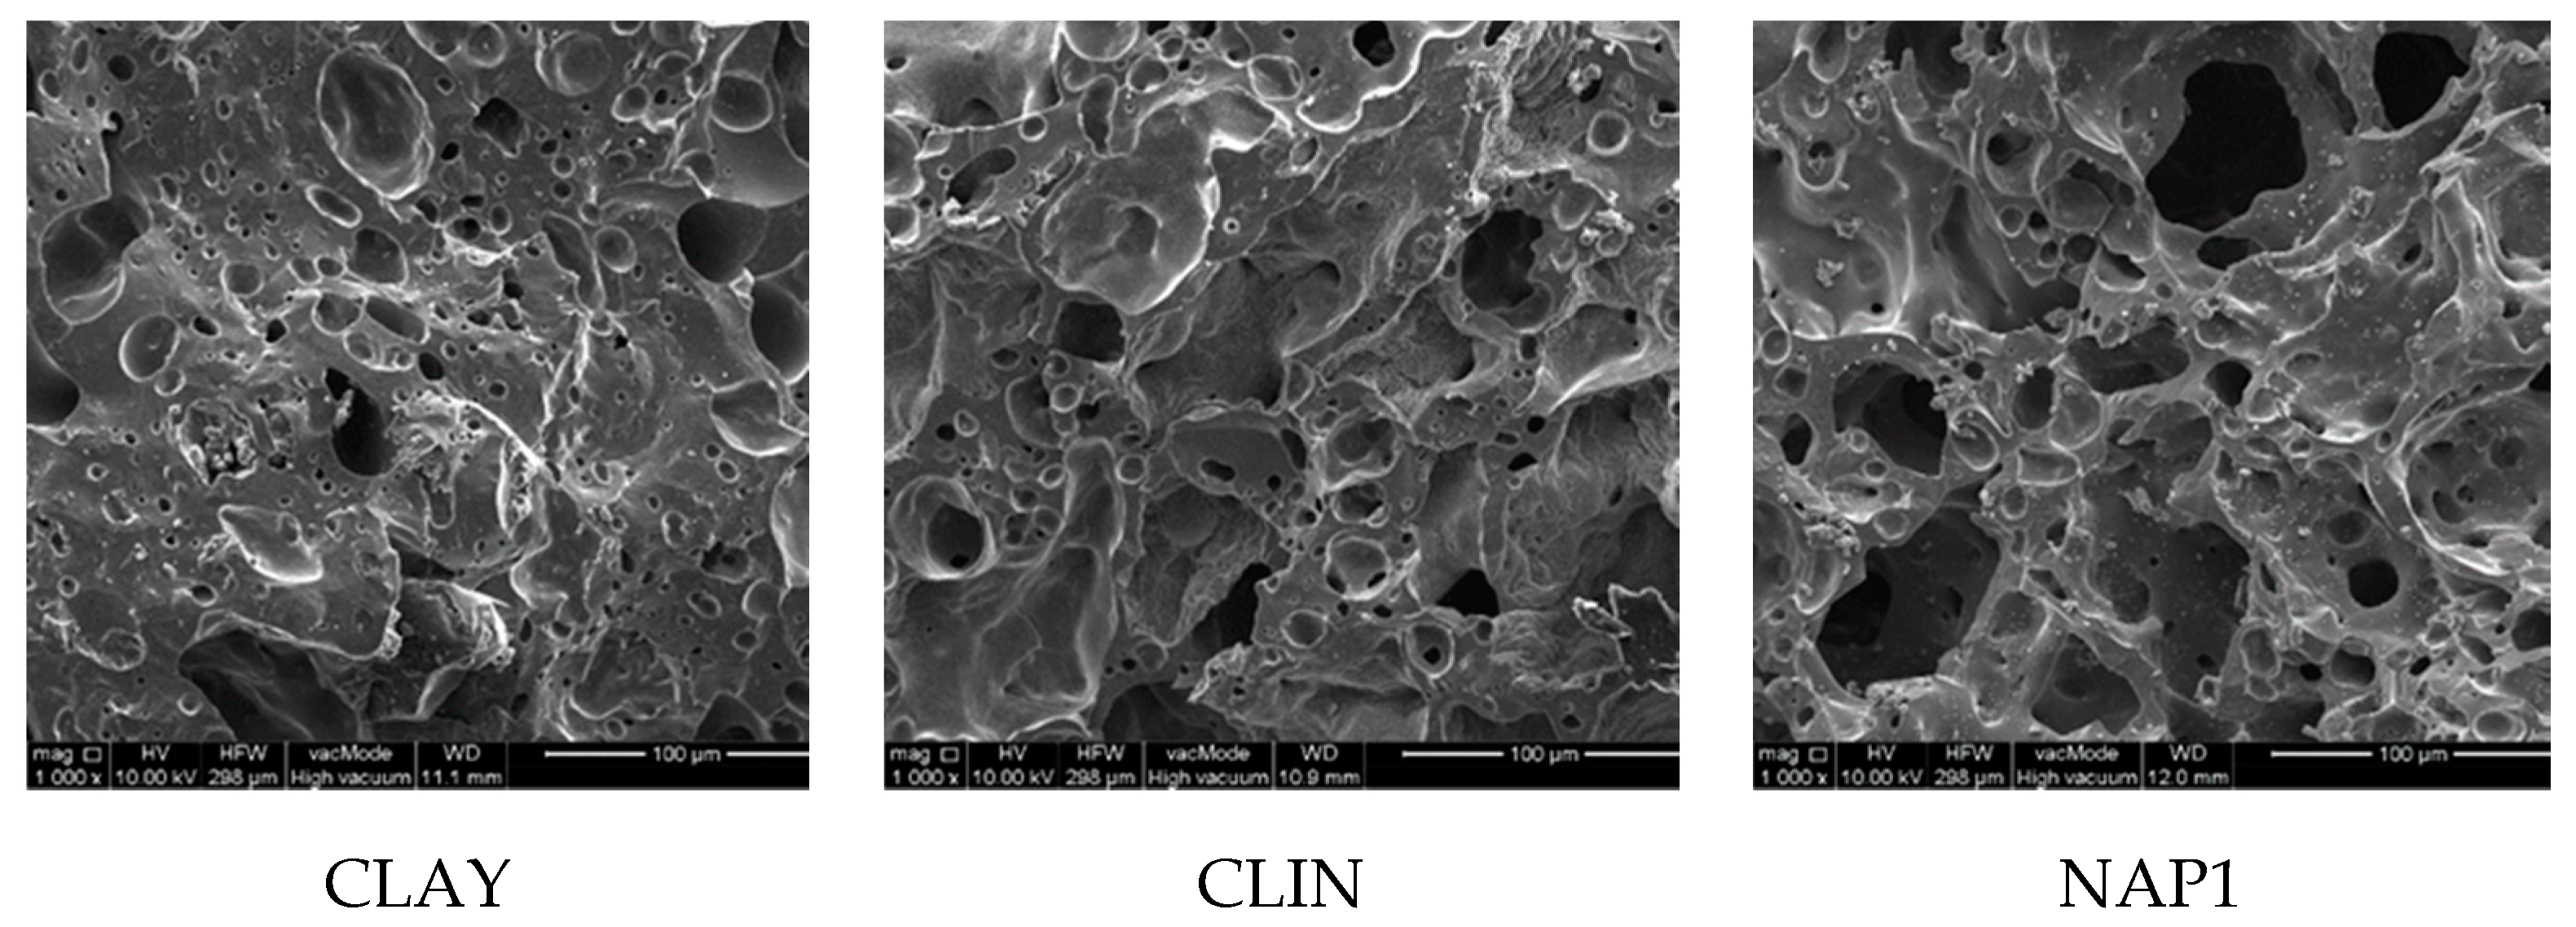
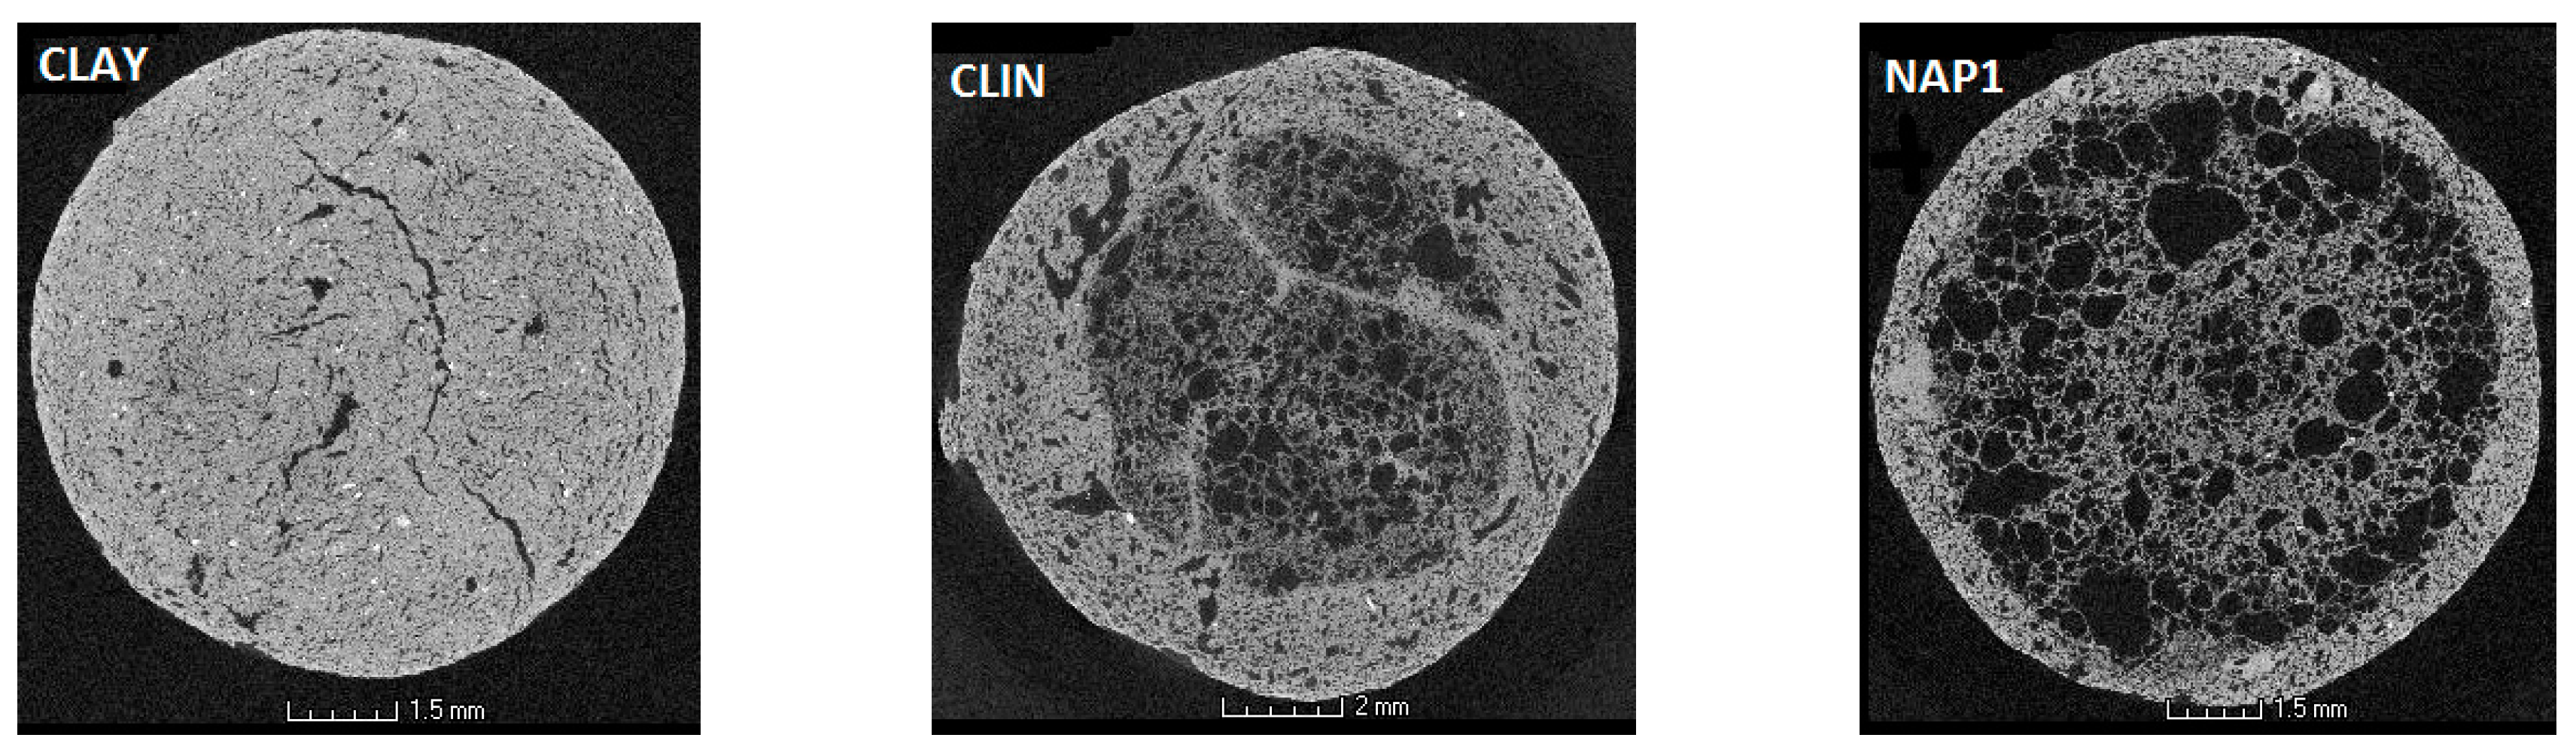
3.2. Structure Characteristics

Exemplary microtomography cross sections of the studied LWAs are presented in Figure 4, wherein quite different porous structures of the studied materials are seen.
On the external surfaces of both aggregates containing the diesel oil, a well-developed vitrified layer is seen. However, Gonzáles-Corrochano et al. [5] did not observe the formation of such a layer in LWAs manufactured with used motor oil. The visual analysis of the scans reveals that the LWAs have thick, dense areas, which extend throughout the whole CLAY aggregate, while being limited to the external layer for CLIN and NAP1, for which it is the thinnest. Most probably the thickness of this layer depends on the oil content. More oil evolves more gases during sintering and the resulted more porous structure reduces the number and increases the distance of connections between the molten solid thus its condensation is limited to smaller external space. It is also possible that more time is needed to decompose more oil what provides less time for solid condensation.
Calculated from 3D scans, the pore volume vs. pore radius dependencies and pore size distribution functions are presented in Figure 5.
As it is seen in Figure 5a,b, the LWA with used Na-P1 develops the largest pores and the largest pore volumes, particularly in the range of large pores. The volume of small pores is similar for NAP1 and CLAY, whereas CLIN possesses the largest volume of these pores. Pore size distribution functions (Figure 5b) show that CLIN aggregates contain the highest amount of pores lower than 0.1 mm, whereas the lowest amount of these pores is found in NAP1 aggregates.
MIP curves relating the intruded mercury (pore) volume to the logarithm of the pore radius and the normalized pore size distribution functions for the studied materials are presented in Figure 6. It is worth noting that the mercury extrusion branches (data not shown) were, in all cases, practically parallel to the log(R)-axis, indicating that practically all the mercury is accumulated in the pore voids and that the amount of the necks (channels) connecting these voids is negligible.
The volume of intruded mercury (Figure 6a) is the lowest for the LWA containing only the original clay deposit, the intermediate for that enriched with the spent clinoptilolite, and the highest for the material containing spent NaP1. The pore size distributions for CLAY and NaP1 are unimodal (Figure 6b). One broad peak is noted for CLAY with the maximum located at around 0.32 µm (logR ~ 0.5), while one narrow peak is found for NaP1 with maximum at R ~ 0.16 μm. Three peaks on the pore size distributions (PSD) function of CLIN are present: two narrow peaks at 32 and 2.5 μm, and one broad peak at around 0.16 μm. In contrast, Korat et al. [10] observed only bimodal MIP pore size distributions (peaks with maximum values between 0.1 and 1 µm, above 10 µm, and up to 100 µm) for LWAs prepared from fly ash obtained from coal combustion and silica sludge.
Comparing the pore size distribution functions derived from MIP and microtomography, one can see that MIP measurements allocate the sizes of almost the entire volume of the pores towards an underestimation of the large pores and an overestimation of the small pores. This phenomenon, as summarized by Korat et al. [10], appears to be rather intrinsic than accidental, which derives from the lack of direct accessibility for most of the pore volume (including air voids) to the mercury surrounding the specimen. Furthermore, in the case of highly porous structures, errors can also be made due to the breaking of the inner pore’s walls, which then give distorted results.
Fractal plots for the studied materials are illustrated in Figure 7. As a rule, the fractal behaviour of the porosity of natural objects occurs in a limited range of pore dimensions (called upper and lower cut-offs) [49].
The geometrical irregularities and roughness of the pore surface have an essential influence on the value of the fractal dimensions, which, for porous solids, may vary from 2 to 3. The lower limiting value of 2 corresponds to a perfectly regular pore surface, whereas the upper limiting value of 3 relates to the maximum allowed pore surface complexity [49]. The linearity ranges of log-log plots of dV/dR vs. dR can be found for the studied aggregates. One linearity range is found for CLAY in the range of large pores. NAP1 and CLIN exhibit two ranges of linearity: one for large pores and the second for narrow pores.
However, the slopes of the linear log-log plots are very high in all cases, such that the calculated fractal dimensions of the pore surfaces are larger than 3 in all cases except for narrow pores of NAP1 (see Table 2 below). This may result from the specific structure of the aggregates. The large pore voids are accessible through markedly narrower entrances, therefore the volume of mercury forced into a large pore is attributed to the radius of the entrance and not to the radius of the void, falsifying the location of pore volume. In fractal dimension calculations a cylindrical pore model was applied assuming that the pore is a long capillary having the radius of the entrance. It is far from reality and leads to rapid increase of pore volume with pore (entrance) radius. Having such high increase in pore volume V vs. radius R dependence the cylindrical pore model calculates high dV/dR values that gives fractal dimension D values higher than 3.
Extremely low nitrogen adsorption and the calculated surface areas of the produced LWAs, which are less than 1 m2/g (see Table 2), indicate that either the vitrified layer produced during heating has an extremely flat surface or the closed intra-aggregate pores are not available for nitrogen molecules.
SEM microphotographs of the obtained LWAs presented in Figure 8 show differences in the finest pores’ structure of the aggregates. LWA prepared from clay is characterized by a compact texture, with the smallest pores being oval and frequently elongated. Aggregates with the admixtures of spent zeolites have pores of larger sizes, being the largest ones for NAP1. The placement of the pores is rather irregular.
The pore parameters of the pore system derived from microtomography, MIP and SEM experiments are summarized in Table 2.
All methods applied give the highest pore volumes and porosities for NAP1 and the lowest for CLAY aggregates. As a rule, MIP measures significantly higher pore volumes and porosities than microtomography. The measuring range of microtomography starts from ~6 µm upwards, while it runs from ~4 nm to ~14 µm for MIP; at the first glance, it does not seem possible that MIP registers larger porosities. However, mercury can invade the whole aggregate interior through narrow entrances to the large pores, thereby filling all large pores inside. Therefore one can state that the total porosity values measured by microtomography are more reliable than these derived from MIP. LWAs made from the clay deposit have the smallest porosity and the highest particle density, whereas LWAs containing spent clinoptilolite and NaP-1 zeolites have larger porosity and smallest particle density that may be due to the presence of the oil in the spent zeolites.
Organic substances produce additional gases during the sintering process, which contribute to the formation of pore beads and the creation of more porous structure of the aggregate [56]. However, similarly low densities (0.7–0.9) were achieved by Volland and Brötz [3] for sand sludge LWAs admixed with 20–40% of heulanditic zeolite rock. Such low bulk densities (from 0.95 to 0.7) were also achieved by Mun [57] for LWAs admixed with different doses of a sewage sludge. Kourti and Cheeseman [26] found that sintering 60:40 lignite coal fly ash with waste glass mixes produced LWAs with a mean density of 1.35 g·cm−3, thereby suggesting that heat treatment of organic material containing substrates gives smaller bulk densities and higher porosities of the resulting LWAs than using organic-derived fly ashes coming from similar organic material. It is worth noting that practically the same bulk densities of the aggregates are measured by mercury intrusion and from the LWA volume and mass (Table 2), indicating that the amount of very fine pores being unavailable for mercury is very small in all LWAs studied. The solid phase (skeletal) density is the highest for CLAY and the smallest for CLIN aggregates. It could be possible that the presence of residual carbon formed from no oxidized oil additions diminished the solid phase density; however, no carbon could be detected in the LWAs studied. The finest close pores are possibly responsible for the above effect. The fractal dimensions calculated from microtomography data are rather high, indicating the complex pore buildup, of which the least diversified is found in the CLAY aggregate. All microtomography fractal dimensions fall within the range between 2 and 3, therefore it is likely that microtomography provides a more realistic picture of the LWAs’ fractal pore structure than MIP. This may be due either to the application of the spherical pore model for microtomography data elaboration (instead of cylindrical pore spaces model in MIP) or more probably to a failure of the MIP application in describing LWAs’ pore size distribution.

4. Conclusions

Although the addition of spent zeolite sorbents increased the amount of the amorphous glassy phase in the LWAs, their mineral composition stayed intact, as evidenced by the XRD results. The addition of spent zeolites has fostered a decrease in the particle density, which in turn has involved a decrease in the mechanical resistance. A decrease in water absorption also occurred. The pore structure of LWAs prepared from a clay deposit was strongly modified by the addition of spent zeolites, depending on the composition of the starting mixture. All the methods applied measured the same tendencies of changes in pore volumes and porosities of LWAs due to the addition of spent zeolites. The porosity of the LWAs prepared from a clay deposit was the lowest and the addition of spent NaP1 resulted in the highest porosity of the obtained LWAs. An increase in porosity may also be connected with the amount of the oil present within the added zeolites: with more oil addition the more porous structure is formed. Changes in the average pore radius measured by microtomography and MIP did not run parallel with the pore volume changes. Only the dominant pore radius measured by SEM increased to a similar degree as the porosity.
The reuse (addition) of the spent zeolitic sorbents containing petroleum waste to produce LWAs is a novel method dedicated to this kind of waste utilization. Furthermore, it leads to very advantageous properties of the resulting LWAs (high porosity, low water sorption, enough mechanical resistance, high freezing resistance), indicating their applicability in geotechnics, building construction and agriculture.

Acknowledgments

This research was financed within the statutory funds No. S12/II/B/2017. Funding Body: Ministry of Science and Higher Education (Republic of Poland).

Author Contributions

Wojciech Franus conceived and designed the experiment, performed and analysed the XRD and SEM data, and prepared the manuscript. Grzegorz Jozefaciuk performed and interpreted MIP and MT data, formulated main conclusions and translated the manuscript. Lidia Bandura prepared the ceramic materials, collected literature, took part in manuscript preparation, and provided manuscript formatting. Małgorzata Franus prepared the ceramic materials, performed physical and mechanical properties measurements, provided XRD and SEM interpretation, prepared the manuscript.

Conflicts of Interest

The authors declare no conflict of interest. The founding sponsors had no role in the design of the study; in the collection, analyses, or interpretation of data; in the writing of the manuscript, and in the decision to publish the results.

References

  1. Sokolova, S.N.; Vereshagin, V.I. Lightweight granular material from zeolite rocks with different additives. Constr. Build. Mater. 2010, 24, 625–629. [Google Scholar] [CrossRef]
  2. Riley, C.M. Relation of chemical properties to the bloating of clays. J. Am. Ceram. Soc. 1951, 41, 74–80. [Google Scholar] [CrossRef]
  3. Volland, S.; Brötz, J. Lightweight aggregates produced from sand sludge and zeolitic rocks. Constr. Build. Mater. 2015, 85, 22–29. [Google Scholar] [CrossRef]
  4. González-Corrochano, B.; Alonso-Azcárate, J.; Rodas, M. Characterization of lightweight aggregates manufactured from washing aggregate sludge and fly ash. Resour. Conserv. Recycl. 2009, 53, 571–581. [Google Scholar] [CrossRef]
  5. González-Corrochano, B.; Alonso-Azcárate, J.; Rodas, M.; Luque, F.J.; Barrenechea, J.F. Microstructure and mineralogy of lightweight aggregates produced from washing aggregate sludge, fly ash and used motor oil. Cem. Concr. Compos. 2010, 32, 694–707. [Google Scholar] [CrossRef] [Green Version]
  6. Fronczyk, J.; Radziemska, M.; Mazur, Z. Copper removal from contaminated groundwater using natural and engineered limestone sand in permeable reactive barriers. Fresenius Environ. Bull. 2015, 24, 228–234. [Google Scholar]
  7. Topçu, I.B.; Işikdaǧ, B. Effect of expanded perlite aggregate on the properties of lightweight concrete. J. Mater. Process. Technol. 2008, 204, 34–38. [Google Scholar] [CrossRef]
  8. Mouli, M.; Khelafi, H. Performance characteristics of lightweight aggregate concrete containing natural pozzolan. Build. Environ. 2008, 43, 31–36. [Google Scholar] [CrossRef]
  9. Kockal, N.U.; Ozturan, T. Characteristics of lightweight fly ash aggregates produced with different binders and heat treatments. Cem. Concr. Compos. 2011, 33, 61–67. [Google Scholar] [CrossRef]
  10. Korat, L.; Ducman, V.; Legat, A.; Mirtič, B. Characterisation of the pore-forming process in lightweight aggregate based on silica sludge by means of X-ray micro-tomography (micro-CT) and mercury intrusion porosimetry (MIP). Ceram. Int. 2013, 39, 6997–7005. [Google Scholar] [CrossRef]
  11. Fragoulis, D.; Stamatakis, M.G.; Chaniotakis, E.; Columbus, G. Characterization of lightweight aggregates produced with clayey diatomite rocks originating from Greece. Mater. Charact. 2004, 53, 307–316. [Google Scholar] [CrossRef]
  12. Sengul, O.; Azizi, S.; Karaosmanoglu, F.; Tasdemir, M.A. Effect of expanded perlite on the mechanical properties and thermal conductivity of lightweight concrete. Energy Build. 2011, 43, 671–676. [Google Scholar] [CrossRef]
  13. González-Corrochano, B.; Alonso-Azcárate, J.; Rodas, M.; Barrenechea, J.F.; Luque, F.J. Microstructure and mineralogy of lightweight aggregates manufactured from mining and industrial wastes. Constr. Build. Mater. 2011, 25, 3591–3602. [Google Scholar] [CrossRef] [Green Version]
  14. González-Corrochano, B.; Alonso-Azcárate, J.; Rodas, M. Effect of prefiring and firing dwell times on the properties of artificial lightweight aggregates. Constr. Build. Mater. 2014, 53, 91–101. [Google Scholar] [CrossRef]
  15. Wei, Y.L.; Lin, C.Y.; Ko, K.W.; Wang, H.P. Preparation of low water-sorption lightweight aggregates from harbor sediment added with waste glass. Mar. Pollut. Bull. 2011, 63, 135–140. [Google Scholar] [CrossRef] [PubMed]
  16. Go, C.G.; Tang, J.R.; Chi, J.H.; Chen, C.T.; Huang, Y.L. Fire-resistance property of reinforced lightweight aggregate concrete wall. Constr. Build. Mater. 2012, 30, 725–733. [Google Scholar] [CrossRef]
  17. Ducman, V.; Mirtic, B. The applicability of different waste materials for the production of lightweight aggregates. Waste Manag. 2009, 29, 2361–2368. [Google Scholar] [CrossRef] [PubMed]
  18. Moreira, A.; António, J.; Tadeu, A. Lightweight screed containing cork granules: Mechanical and hygrothermal characterization. Cem. Concr. Compos. 2014, 49, 1–8. [Google Scholar] [CrossRef]
  19. Sarabèr, A.; Overhof, R.; Green, T.; Pels, J. Artificial lightweight aggregates as utilization for future ashes—A case study. Waste Manag. 2012, 32, 144–152. [Google Scholar] [CrossRef] [PubMed]
  20. Quina, M.J.; Bordado, J.M.; Quinta-Ferreira, R.M. Recycling of air pollution control residues from municipal solid waste incineration into lightweight aggregates. Waste Manag. 2014, 34, 430–438. [Google Scholar] [CrossRef] [PubMed]
  21. Franus, M.; Barnat-Hunek, D. Analysis of physical and mechanical properties of lightweight aggregate modified with sewage sludge. Proc. ECOpole 2015, 9, 33–39. [Google Scholar]
  22. Franus, M.; Barnat-Hunek, D.; Wdowin, M. Utilization of sewage sludge in the manufacture of lightweight aggregate. Environ. Monit. Assess. 2016, 188, 10–23. [Google Scholar] [CrossRef] [PubMed]
  23. Suchorab, Z.; Barnat-Hunek, D.; Franus, M.; Łagód, G. Mechanical and physical properties of hydrophobized lightweight aggregate concrete with sewage sludge. Materials 2016, 9, 317. [Google Scholar] [CrossRef]
  24. Cheeseman, C.R.; Makinde, A.; Bethanis, S. Properties of lightweight aggregate produced by rapid sintering of incinerator bottom ash. Resour. Conserv. Recycl. 2005, 43, 147–162. [Google Scholar] [CrossRef]
  25. Anagnostopoulos, I.M.; Stivanakis, V.E. Utilization of lignite power generation residues for the production of lightweight aggregates. J. Hazard. Mater. 2009, 163, 329–336. [Google Scholar] [CrossRef] [PubMed]
  26. Kourti, I.; Cheeseman, C.R. Properties and microstructure of lightweight aggregate produced from lignite coal fly ash and recycled glass. Resour. Conserv. Recycl. 2010, 54, 769–775. [Google Scholar] [CrossRef]
  27. Verbinnen, B.; Block, C.; van Caneghem, J.; Vandecasteele, C. Recycling of spent adsorbents for oxyanions and heavy metal ions in the production of ceramics. Waste Manag. 2015, 45, 407–411. [Google Scholar] [CrossRef] [PubMed]
  28. Franus, W.; Franus, M.; Latosińska, J.; Wójcik, R. The use of spent glauconite in lightweight aggregate production. Bol. Soc. Esp. Cerám. Vidr. 2011, 50, 193–200. [Google Scholar] [CrossRef]
  29. González-Corrochano, B.; Alonso-Azcárate, J.; Rodas, M. Effect of thermal treatment on the retention of chemical elements in the structure of lightweight aggregates manufactured from contaminated mine soil and fly ash. Constr. Build. Mater. 2012, 35, 497–507. [Google Scholar] [CrossRef]
  30. Misaelides, P. Application of natural zeolites in environmental remediation: A short review. Microporous Mesoporous Mater. 2011, 144, 15–18. [Google Scholar] [CrossRef]
  31. Woszuk, A.; Franus, W. Properties of the Warm Mix Asphalt involving clinoptilolite and Na-P1 zeolite additives. Constr. Build. Mater. 2016, 114, 556–563. [Google Scholar] [CrossRef]
  32. Wdowin, M.; Franus, W.; Panek, R. Preliminary results of usage possibilities of carbonate and zeolitic sorbents in CO2 capture. Fresenius Environ. Bull. 2012, 21, 3726–3734. [Google Scholar]
  33. Radziemska, M.; Fronczyk, J. Level and contamination assessment of soil along an expressway in an ecologically valuable Area in central Poland. Int. J. Environ. Res. Public Health 2015, 12, 13372–13387. [Google Scholar] [CrossRef] [PubMed]
  34. Bandura, L.; Franus, M.; Józefaciuk, G.; Franus, W. Synthetic zeolites from fly ash as effective mineral sorbents for land-based petroleum spills cleanup. Fuel 2015, 147, 100–107. [Google Scholar] [CrossRef]
  35. Franus, M.; Wdowin, M.; Bandura, L.; Franus, W. Removal of environmental pollutions using zeolites from fly ash: A review. Fresenius Environ. Bull. 2015, 24, 854–866. [Google Scholar]
  36. Bandura, L.; Franus, M.; Panek, R.; Woszuk, A.; Franus, W. Characterization of zeolites and their use as adsorbents of petroleum substances. Przemysl Chemiczny 2015, 94, 323–327. [Google Scholar]
  37. Bandura, L.; Panek, R.; Rotko, M.; Franus, W. Synthetic zeolites from fly ash for an effective trapping of BTX in gas stream. Microporous Mesoporous Mater. 2016, 223, 1–9. [Google Scholar] [CrossRef]
  38. Szala, B.; Bajda, T.; Matusik, J.; Zięba, K.; Kijak, B. BTX sorption on Na-P1 organo-zeolite as a process controlled by the amount of adsorbed HDTMA. Microporous Mesoporous Mater. 2015, 202, 115–123. [Google Scholar] [CrossRef]
  39. Muir, B.; Bajda, T. Organically modified zeolites in petroleum compounds spill cleanup—Production, efficiency, utilization. Fuel Process. Technol. 2016, 149, 153–162. [Google Scholar] [CrossRef]
  40. Franus, W.; Dudek, K. Clay minerals and clinoptilolite of Variegated Shales Formation of the Skole Unit, Polish Flysch Carpathians. Geol. Carpathica 1999, 50, 23–24. [Google Scholar]
  41. Wdowin, M.; Franus, M.; Panek, R.; Badura, L.; Franus, W. The conversion technology of fly ash into zeolites. Clean Technol. Environ. Policy 2014, 16, 1217–1223. [Google Scholar] [CrossRef]
  42. American Society for Testing and Materials. Standard Test Method for Liquid Limit, Plastic Limit, and Plasticity Index of Soils; ASTM D 4318; American Society for Testing and Materials: West Conshohocken, PH, USA, 2010. [Google Scholar]
  43. BSI Standards Publication. Test for Mechanical and Physical Properties of Aggregates. Part 6: Determination of Particle Density and Water Absorption; BS EN 1097-6:2013; British Standards Institute: London, UK, 2013. [Google Scholar]
  44. European Committee for Standardization. Lightweight aggregates—Part 1: Lightweight Aggregates for Concrete, Mortar and Grout; EN 13055-1/AC; European Committee for Standardization: Brussels, Belgium, 2004. [Google Scholar]
  45. European Committee for Standardization. Test for Thermal and Weathering Properties of Aggregates. Part 2: Magnesium Sulfate Test; EN 12697-2:1999; European Committee for Standardization: Brussels, Belgium, 1999. [Google Scholar]
  46. Ryżak, M.; Bieganowski, A. Determination of particle size distrubution of soil using laser diffraction-comparison with areometric method. Int. Agrophys. 2010, 24, 177–181. [Google Scholar]
  47. Dong, H.; Blunt, M.J. Pore-network extraction from micro-computerized-tomography images. Phys. Rev. E. 2009, 80, 1–11. [Google Scholar] [CrossRef] [PubMed]
  48. Sridharan, A.; Venkatappa Rao, G. Pore size distribution of soils from mercury intrusion porosimetry data. Soil Sci. Soc. Am. Proc. 1972, 36, 980–981. [Google Scholar] [CrossRef]
  49. Pachepsky, Y.A.; Polubesova, T.A.; Hajnos, M.; Sokolowska, Z.; Jozefaciuk, G. Fractal parameters of pore surface area as influences by simulated soil degradation. Soil Sci. Soc. Am. J. 1995, 59, 68–75. [Google Scholar] [CrossRef]
  50. Yokoya, N.; Yamamoto, K.; Funakubo, N. Fractal-based analysis and interpolation of 3D natural surface shapes and their application to terrain modeling. Comput. Vis. Graph. Image Process. 1989, 46, 284–302. [Google Scholar] [CrossRef]
  51. Vogel, H.J.; Roth, K. Quantitative morphology and network representation of soil pore structure. Adv. Water Resour. 2001, 24, 233–242. [Google Scholar] [CrossRef]
  52. Lee, W.E.; Souza, G.P.; McConville, C.J.; Tarvornpanich, T.; Iqbal, Y. Mullite formation in clays and clay-derived vitreous ceramics. J. Eur. Ceram. Soc. 2008, 28, 465–471. [Google Scholar] [CrossRef]
  53. Hung, M.-F.; Hwang, C.-L. Study of fine sediments for making lightweight aggregate. Waste Manag. Res. 2007, 25, 449–456. [Google Scholar] [CrossRef] [PubMed]
  54. Gunning, P.J.; Hills, C.D.; Carey, P.J. Production of lightweight aggregate from industrial waste and carbon dioxide. Waste Manag. 2009, 29, 2722–2728. [Google Scholar] [CrossRef] [PubMed]
  55. Stegemann, J.A.; Côté, P.L. A proposed protocol for evaluation of solidified wastes. Sci. Total Environ. 1996, 178, 103–110. [Google Scholar] [CrossRef]
  56. Chang, F.C.; Lo, S.L.; Lee, M.Y.; Ko, C.H.; Lin, J.D.; Huang, S.C.; Wang, C.F. Leachability of metals from sludge-based artificial lightweight aggregate. J. Hazard. Mater. 2007, 146, 98–105. [Google Scholar]
  57. Mun, K.J. Development and tests of lightweight aggregate using sewage sludge for nonstructural concrete. Constr. Build. Mater. 2007, 21, 1583–1588. [Google Scholar] [CrossRef]
Figure 1. Particle size (diameter) distributions for the initial materials (a) and cumulative volume (scaled to 100%) versus particle diameter plot (b).
Minerals 07 00025 g001
Figure 2. X-ray diffraction (XRD) patterns of the original clay deposit (black), clinoptilolitic tuff (green) and zeolite Na-P1 (red).
Minerals 07 00025 g002
Figure 3. XRD patterns of the lightweight aggregates (LWAs): CLAY (black), CLIN (green) and NAP1 (red).
Minerals 07 00025 g003
Figure 4. Exemplary 2D cross-sectional images derived from microtomography for the studied materials. Black areas: pores; white areas: solid.
Minerals 07 00025 g004
Figure 5. Pore volume vs. pore radius dependencies (a) and normalized pore size distribution functions; (b) derived from microtomography scans. The points show average results, while the error bars show differences between the average and the experimental replicates.
Minerals 07 00025 g005
Figure 6. MIP curves (a) and normalized pore size distribution functions; (b) for the studied aggregates. The points show average results, while the error bars show maximum differences between the average and the experimental replicates.
Minerals 07 00025 g006
Figure 7. Fractal plots for the studied materials. The points show average results, while the error bars show maximum differences between the average and the experimental replicates.
Minerals 07 00025 g007
Figure 8. Representative scanning electron microscope microphotographs (SEM) of the studied aggregate sections.
Minerals 07 00025 g008
Table 1. Physical parameters of the LWAs.
ParameterCLAYCLINNAP1
Solid phase density SPD, g·cm−32.712.632.59
Particle density BD, g·cm−31.741.270.76
Water absorption WA24, %2010.0011.5
Frost resistance F, %<1<1<1
Compressive strength Ca, MPa3.41.561.41
Table 2. Pore parameters of the studied LWAs.
Pore ParameterUnitCLAYCLINNAP1
Data from microtomography
Total pore volume cm3·g−10.0440.2230.719
Average pore radius µm130120250
Porosity (v/v)%8.727.954.5
Fractal dimension /-2.662.742.74
Data from MIP
Total pore volume cm3·g−10.1410.3010.909
Total Pore Aream2·g−13.916.741.7
Average pore radius µm2.375.270.99
Particle density g·cm−31.771.300.74
Solid skeletal density SSDg·cm−32.352.142.23
Porosity (v/v)%25.039.266.9
Fractal dimension for large pores/-3.563.513.61
Fractal dimension for narrow pores/-N/a3.52.91
Data from SEM
Pore area (volume)%172331
Dominant pore radius µm3540

