The Force of Crystallization and Fracture Propagation during In-Situ Carbonation of Peridotite
by
 , ,
, ,
Reinier Van Noort
1,2,* ,
,
Timotheus K. T. Wolterbeek
1,
Martyn R. Drury
3,
Michael T. Kandianis
4 and
Christopher J. Spiers
1 1
HPT-Laboratory, Department of Earth Sciences, Utrecht University, P.O. Box 80021, 3508 TA Utrecht, The Netherlands
2
Department of Environmental Technology, Institute for Energy Technology, Instituttveien 18, 2007 Kjeller, Norway
3
Department of Earth Sciences, Utrecht University, P.O. Box 80021, 3508 TA Utrecht, The Netherlands
4
Shell Innovation, Research and Development, Houston, TX 77082-3101, USA
*
Author to whom correspondence should be addressed.
Minerals 2017, 7(10), 190; https://doi.org/10.3390/min7100190
Submission received: 29 August 2017
/
Revised: 25 September 2017
/
Accepted: 6 October 2017
/
Published: 11 October 2017
(This article belongs to the Special Issue Carbon Capture and Storage via Mineral Carbonation)
Abstract
:Subsurface mineralization of CO2 by injection into (hydro-)fractured peridotites has been proposed as a carbon sequestration method. It is envisaged that the expansion in solid volume associated with the mineralization reaction leads to a build-up of stress, resulting in the opening of further fractures. We performed CO2-mineralization experiments on simulated fractures in peridotite materials under confined, hydrothermal conditions, to directly measure the induced stresses. Only one of these experiments resulted in the development of a stress, which was less than 5% of the theoretical maximum. We also performed one method control test in which we measured stress development during the hydration of MgO. Based on microstructural observations, as well as XRD and TGA measurements, we infer that, due to pore clogging and grain boundary healing at growing mineral interfaces, the transport of CO2, water and solutes into these sites inhibited reaction-related stress development. When grain boundary healing was impeded by the precipitation of silica, a small stress did develop. This implies that when applied to in-situ CO2-storage, the mineralization reaction will be limited by transport through clogged fractures, and proceed at a rate that is likely too slow for the process to accommodate the volumes of CO2 expected for sequestration.
1. Introduction
Mineralization by direct reaction of CO2 with a suitable mineral phase is an emerging strategy for carbon sequestration that has received significant attention (e.g., [1,2,3,4,5,6,7,8,9,10,11]). While not as widely considered as CO2 injection and storage within subsurface reservoirs (e.g., [12]), the storage of carbon dioxide as a solid can occur when CO2 is brought into direct contact with magnesium-rich silicate minerals (e.g., olivines, serpentines and pyroxenes). These mineral phases react vigorously with CO2 to release magnesium, silicon, aluminum and iron among other components that can reprecipitate as solid carbonates, binding CO2 in the process.
Several technologies that utilize mineral carbonation are under consideration as strategies to reduce the input of CO2 to the atmosphere. Some of these approaches involve mining and processing olivine and serpentine for reaction with CO2 [13], whereas other routes propose sequestering carbon dioxide within the subsurface by injecting CO2 and water into ultramafic rock bodies that are rich in magnesium silicate minerals [14,15,16,17]. Efforts to sequester CO2 in ultramafic rocks at depths of 1–3 km may benefit from elevated subsurface temperatures and injection pressures that exceed hydrostatic levels, as these conditions promote natural weathering reactions and hasten carbonation kinetics [14]. The dissolution of magnesium silicate minerals and the precipitation of carbonate phases may also be spurred by the energy released from the carbonation reaction itself via a “self-heating effect” [14,18]. A principal challenge of achieving the geological storage of CO2 in ultramafic massifs, however, is the characteristic low porosity and permeability of these rocks [19]. To bind CO2 as a solid within the magnesium silicate mineral matrix, open space and permeability must be created by fracturing the rock in the subsurface. The storage of significant quantities of CO2 would also require fractures to be generated continuously either by stimulation or via alternate means.
In 2008, Kelemen and Matter [14] proposed that sufficient space for the storage of CO2 as a solid could be generated if fractures were induced by the expansion in solid volume that accompanies the precipitation of carbonate phases during the reaction of CO2 with magnesium silicates. Other investigators have considered similar scenarios [20,21,22], where the stress originating from volume expansion can be described as a force of crystallization (e.g., [23]). If such stresses were to exceed the stress required to fracture the confining rock, surface area would be created consequent to the expansion in volume, thereby allowing more extensive storage of CO2 within the host rock matrix.
Using the thermodynamic model presented in [24], plus free energy of formation data from [25] and [26], we estimate that the force of crystallization resulting from olivine carbonation could reach levels upwards of several GPa under idealized conditions. The actual forces required to initiate reaction-induced fracture, however, have yet to be demonstrated experimentally. In this paper, we review existing data on the strength of peridotites and serpentinites to assess the forces required for reaction-induced fracture propagation, and report experimental results aimed at directly measuring the stress development resulting from the carbonation of a simulated fracture in a peridotite sample under in-situ, confined conditions. As our experiments were unable to reproducibly show the production of significant reaction-induced stress, we discuss possible inhibitions to the development of a force of crystallization in carbonating cracks by contrasting these results with that from one hydrothermal experiment involving MgO single crystals (periclase), wherein a force was observed. We then conclude by considering the implications of our results for the geological storage of carbon in ultramafic rocks.
2. Background
2.1. Mechanical Properties of (Ultra)Mafic Rocks
To evaluate the fluid pressures and stresses that will lead to the fracture of peridotite during mineral carbonation, data relating to failure criteria for magnesium silicate minerals under in-situ conditions are required. Information of this sort, such as the uniaxial tensile strength (T0) of ultramafic and mafic rocks under (upper-)crustal temperature conditions is sparse in the open literature. The available values of T0 for ultramafic rocks and values for gabbros and Columbia River Basalt are given in Table 1. The tensile strength of fresh peridotite lies in the range 50–280 MPa ([27]). However, a small percentage of serpentinization (10%–15%) has been shown to significantly weaken peridotite rock [28], and the tensile strength of serpentinite or serpentinized peridotite is thus likely to be significantly lower, i.e., 2–50 MPa (see Table 1).
Relatively few experimental studies are available on the fracture toughness or subcritical crack growth parameters of ultramafic rocks or their constituent mineral phases. Relevant data and estimates for ultramafic and mafic rocks are given in Table 2. Information relating to the shear failure envelopes over a range of temperature and confining pressure conditions for a variety of mafic and ultramafic rocks have been reported in the literature. A compilation of available data is given in Figure 1, which provides typical failure envelopes for dunite, peridotite, various serpentinites, and other (mafic) rocks (from [28,32,33]). A failure criterion based on Byerlee’s law (with μ = 0.85 and S0 = 0 at low confining pressure, and μ = 0.6 and S0 = 50 MPa at higher confining pressure) is also added [28,32]. Typical literature values for the uniaxial compressive strength (C0), cohesive shear strength (S0) and internal friction coefficient (μ) of various ultramafic and mafic rocks are summarized in Table 3.
Elastic constants of peridotites, dunites and serpentinites, and of their constituent minerals, have been measured at a range of pressures and temperatures using a variety of techniques ranging from static and dynamic mechanical testing to wave velocity measurements. Typical data are shown in Table 4, which include isotropic average values as well as values for single crystals.
2.2. Previous Work on the Mechanical Effects of Mineral Replacement Reactions
Mineral replacement reactions wherein a less stable (more soluble) mineral phase is replaced by a more stable (less soluble) phase, involving a change in solid volume, and associated reaction-induced cracking have been the focus of several recent experimental (e.g., [47,48,49,50]), modelling (e.g., [22,51,52]) and field studies (e.g., [21]).
Various models have focused on fracture patterns generated during mineral reactions involving a ~10% reduction in solid volume (e.g., [51,52]). The discrete element models predict a sharp reaction front, which is similar in character to fronts reported in experimental studies, behind which a network of cracks spreads through the material, the spacing of the cracks being strongly dependent on the diffusion coefficient of the volatile [52]. Other models reveal that an anisotropic stress field may give rise to a morphological instability of the reaction front (i.e., fingering—[51]). An extension of the model of [52] was reported by [22] to simulate reaction-induced fracturing during the replacement of leucite by analcime (i.e., with an increase in molar volume). Under a low vertical stress—1% of the Young’s modulus—this model model predicts similar structures to those observed by [49], with the reaction causing a solid volume increase, generating local stress changes and causing fracturing. The reaction-induced fractures formed good pathways for further fluid infiltration [22]; notably, in these models, the reaction was assumed to proceed at a set rate, regardless of, for example, the local stress field.
Such connected fracture patterns have been reported in naturally serpentinized dunite (e.g., [20,21]), where serpentinization may drive a reaction-driven hierarchical fragmentation process, which is similar in geometry and fracture length distribution [21] to results of the simulation studies mentioned above. The observations reported by [21] thus suggest that, under natural conditions, the volume increase associated with the serpentinization of olivine-rich rock can indeed lead to fracturing.
2.3. The Force of Crystallization during Peridotite Carbonation
The principal reactions expected during carbonation of peridotites by injection of CO2 plus water (or brine) are listed in Table 5 (e.g., see [53,54,55,56,57,58]), along with the associated net changes in solid and total volume calculated for a temperature of 423 K and a hydrostatic pressure of 50 MPa. These data show that the main CO2-mineralizing reactions (Reactions R.1, R.3, R.4, and R.6, Table 5) are characterized by large changes in solid/fluid volume. Net solid volume changes fall in the range −1% to +84% when all solid reaction products precipitate, and in the range −24% to +63% when dissolved silica does not precipitate as SiO2, but instead is removed by advection (see also Table 5). By contrast, when the combined volume change of the solid and fluid taken together is considered under closed system conditions, volumetric reductions of 5% to 29% result.
The closed system volume changes (i.e., including changes in fluid volume) imply that reaction within and around a fluid-filled hydrofracture that is sealed for fluid transport will lead to a reduction in the combined solid and fluid volume, such that the fluid pressure in the fracture decreases until chemical equilibrium is reached. This process will bring about a reduction in fracture aperture and in fracture-normal stresses to values below those characterizing the initial, fluid-filled hydrofracture. Under open system conditions, however, where fluid flows through a (hydro-)fracture at a given pressure, the large driving force for reaction, coupled with the large net increase in solid volume, will lead to progressive filling of the fracture with the precipitating product phases. As the open space becomes filled, supersaturation of product phases in the solution relative to an unstressed reference state may drive precipitation to occur under stress, thus leading to internal stressing of the fracture. This reaction-stressing, or “force of crystallization” effect (e.g., see [23]), is seemingly the opposite of the compaction and deformation mechanism known as pressure solution (e.g., [59,60,61]), where a stress leads to an increase in the solubility of a solid. Stress arising from crystallization can drive the propagation of single, isolated fractures within fresh rock by increasing the internal normal stress on the fracture walls. Microcrack propagation into, and rock disaggregation at fracture walls may also be enhanced through this process. In a densely fractured body of rock, on the other hand, self-stressing of mineralizing fractures may lead to increasing mean normal stresses throughout the rock volume, and progressive closing of open fractures and pathways. In principle, the stress generated will increase until the product phases approach equilibrium with the reactants.
On this basis, the stresses generated by carbonation and possibly by hydration reactions along fractures under open system conditions could have important implications for subsurface CO2 mineralization by injection into peridotites. If large enough, such reaction-driven stresses could influence not only the evolution of the in-situ stress state, but also the pressures needed for hydrofracturing, the evolution of the hydrofracture network, the orientation of hydrofractures (horizontal versus vertical), the evolution of the transport properties of the fracture network, and the extent of any uplift phenomena. Estimating the magnitude of reaction-generated stresses therefore forms a key step in evaluating the concept of CO2-mineralization by injection into peridotites.
2.4. Thermodynamic Model for Force of Crystallization Development during Peridotite Carbonation
The maximum stresses generated by each possible peridotite carbonation reaction can be estimated by inserting the free energy of reaction at the relevant conditions into the model presented in [24]. This predicts the (effective) normal stress that must be applied to the reactant and product phases to negate the free energy change of reaction in the unstressed state, i.e. to suppress the reaction, and obtain thermodynamic equilibrium [62,63,64].
Using the stress relation from [24], the maximum effective normal stress () that can be generated by the replacement of peridotite wall rock within a fracture by carbonation or hydration products that fill the reacting fracture, thereby pressurizing the dissolving wall rock, is:
Here, is the free energy change of reaction at pressure P and temperature T, and and are the molar volumes of the solid products and reactants, respectively, with and being the corresponding stoichiometric coefficients (here written positive for both reactants and products).
When dissolution takes place in an open fracture, and precipitation and the build-up of normal stress take place in a nearby closed fracture, then the wall rock is not stressed, and the maximum effective stress needed to inhibit precipitation becomes:
The above models for mineral deposition in a fracture (Equation (2)) and mineral replacement within a fracture (Equation (1)) can be used to calculate maximum normal stresses arising from these two scenarios by reactions R.1–R.6 (Table 5) at a variety of in-situ temperatures and a fluid pressure of 50 MPa. The free energy of reaction () values obtained for each reaction are shown in Table 6, along with the other maximum effective stresses calculated with the model. Values for the free energy of reaction () were obtained from the free energies of formation of the solid phases at standard pressure and at the various temperatures considered, by linear interpolation in temperature of the values given by [25]. No correction for pressure was made, as the effect was less than a few percent of the total energy of formation of the solids. Values for the free energy of formation of water at the temperatures and pressures considered were obtained from interpolation of free energy values at high temperatures and at 50 MPa pressure, given by [26]. The free energies of formation of CO2 at standard pressure were likewise obtained by interpolation of values given by [26] and then corrected for pressure using the equation of state for CO2 given by [65]. No correction was made for the energy of mixing of CO2 and water in these preliminary calculations, as this is expected to make only a minor difference to the results. Room temperature molar volumes of the solid phases were obtained from [25]. Our calculations show that very large effective stresses can be generated by both carbonation and hydration reactions in peridotite (and indeed by all reactions considered). Maximum effective stresses generated are of the order of 100 MPa to 10 GPa, i.e., well in excess of most relevant rock strength values (Table 1, Table 2 and Table 3). Note also that the maximum effective stresses generated increase towards lower temperatures.
It is essential to note that this model assumes that reaction can only be inhibited by reaching equilibrium through the build-up of stress. It thus assumes (a) that sufficient reactant material is available to prevent the reaction from going to completion before the maximum stress is attained, (b) that precipitation occurs under confined conditions, i.e., that free expansion is prevented, (c) that transport of reactants (such as CO2) to fresh reactant mineral surfaces is not limited by precipitation, and (d) likewise that a fluid phase remains present throughout the system, and thus that solutes are freely transported to precipitate in load-bearing grain boundaries [66,67]. Moreover, our model does not address the actual rate of reaction-induced stress development, as it is to be expected that attainment of the maximum stress will only occur once a sufficient level of rock material dissolves and reprecipitates within the fracture. Furthermore, the local roughness of the fracture wall will limit the effectiveness of stress development on the larger scale, as stresses are concentrated at the contact points. Fracture permeability might also be lost entirely before the maximum stress develops. To evaluate what processes might occur under in-situ conditions at actual rock surfaces, we conducted a series of experiments on relevant materials to assess the rate of stress development in ultramafic rocks and discuss the relevance of the stress model along with our experimental results.
3. Experimental Method
3.1. Hydrothermal Carbonation Experiments
To determine whether a force of crystallization would result from peridotite carbonation, and at what rate this force might develop during in-situ peridotite carbonation, we performed experiments to directly measure the stress resulting from the carbonation of a simulated fracture in a peridotite sample under confined conditions. A complete list of the force of crystallization experiments performed, with experimental conditions, is given in Table 7. The setup used is illustrated in Figure 2. Note that this is the same setup as was successfully used by Wolterbeek et al. [24] to measure a force of crystallization resulting from the hydration of CaO. In our experiments, the sample consisted of (a) a layer of powdered peridotite, (b) one or more thin discs of solid peridotite, or (c) a layer of powdered peridotite on top of a thin peridotite disc. To simulate a loaded fracture, these samples were sandwiched between titanium pistons, in a titanium liner placed inside a larger pressure vessel. Titanium was used for the liner and pistons to minimize corrosion and contamination of the fluid. During experiments R0801–R0804, a flat-ended titanium inner piston (rectangular in a cross-section along its axis) was used. In experiments R0805–R0808, a beveled Teflon ring was located on a conically edged inner piston (see Figure 2b) to prevent sample material from flowing into the space between the inner piston and the liner wall. In experiments R0809–R0817, this was replaced by a Teflon sealing ring placed around the piston near the (flat-ended) piston.
Åheim dunite (85% olivine, 10% orthopyroxene, minor chlinochlore and magnesite—see also [52]) was used as the solid reactant phase in most experiments, as this dunite was relatively unserpentinized and thus had a high olivine content. In experiment R0806, a sample of Oman peridotite A30 (51% olivine, 3% orthopyroxene, ~46% serpentine—see [68]) was used. However, in experiments R0814-R0816, monticellite (an olivine-like silicate of calcium and magnesium—CaMgSiO4) was used in order to speed up reaction kinetics. At low temperatures, monticellite dissolves roughly 2 orders of magnitude faster than forsterite [69]. Dolomite precipitation due to monticellite carbonation was likewise expected to be considerably faster than magnesite precipitation. Demineralized water was added to all experiments except experiment R0807, in which a solution of hydrochloric acid in demineralized water with an initial pH of 1 was used in an attempt to increase initial dissolution, and experiment R0808, in which a solution containing 0.5 M NaHCO3 and 1.0 M NaCl was used to increase precipitation rates during mineral carbonation in similar systems (following [3]).
When setting up an experiment, the sample was first loaded into the titanium liner, and a pre-determined amount of aqueous fluid was added. Then the titanium upper piston was slid into the liner, and the entire assembly was placed inside the larger, internally heated stainless steel pressure vessel, which was in turn placed in an Instron 8562 servo-controlled loading frame. Next, the system was pressurized using CO2 boosted to the required pressure using argon via a gas separator. Subsequently, the system was heated to the desired temperature and pressure (393–458 K/120–185 °C, and 15–30 MPa). In experiments R0801–R0808, a valve near the setup was closed to keep the CO2-pressure at the desired value with a minimal system volume. As the CO2-pressure was somewhat sensitive to leakage along the O-rings, later experiments were performed with the CO2-pressure constantly boosted by a large volume of argon via the gas separator.
In most experiments, after CO2-addition and heating, the loading frame was kept in position-control, meaning that the piston was held at a fixed position with an initial piston load of ~7.5–10 kN (though experiment R0801 was set up with a lower starting load of ~5 kN). This allowed for direct measurement of any additional force exerted on the piston due to expansion of the sample. In contrast, experiment R0805 was performed under load-control, with a total load of up to ~10 kN, resulting in an effective axial stress on the sample of ~73 MPa at 15 MPa fluid pressure, neglecting O-ring friction. As in this experiment the load exerted on the sample was kept constant, changes in the length of the sample, i.e., expansion or compaction of the simulated CO2-mineralizing crack, could be measured directly. In experiments R0805, R0807–R0811, R0813, R0814 and R0816, a layer of ultra-fine dunite or monticellite powder was pre-compacted dry, at room temperature, inside the titanium liner to a load of 550 MPa in order to decrease the starting porosity before testing the response to CO2-mineralization.
Experimental durations varied from ~5 to 23 days. Upon ending an experiment, the setup was first cooled to room temperature, after which the CO2-pressure was released. Towards the end of some experiments, technical failure resulted in piston withdrawal—and hence rapid unloading followed by pressure release—before cooling could take place. After a test was ended, the sample was removed and studied optically. Selected samples were analyzed using microprobe, scanning electron microscope (SEM), X-ray diffraction (XRD) and/or thermogravimetric analysis (TGA) techniques.
In order to establish unconfined reaction progress under conditions otherwise similar to those of the force of crystallization experiments (124 °C, 27 MPa), one unconfined powder carbonation experiment (R0721A) was performed on crushed Åheim Dunite in the cold-seal vessel apparatus described by [68]. This experiment had a duration of 7 days.
3.2. Permeability Measurements
The permeabilities of reacted powder samples R0802 and R0816 were measured after the force of crystallization experiments using an argon gas permeametry method. A sample of A30 Oman Peridotite with ~46% serpentinization (see [68]) was also tested. For sample R0802 and the A30 peridotite, the sample to be measured was glued into a plastic disc-shaped holder using Agomet P76 epoxy. Then this disc-assembly was placed between a set of pistons and confined inside a rubber jacket. To prevent cracking of the sample due to sample removal, experiment R0816 was performed with an open bore in the lower piston of the force of crystallization apparatus, allowing the sample permeability to be measured inside the titanium inner vessel. A confining pressure of ~1 MPa was applied to prevent gas transport between the sample disc and the rubber jacket. The low pressure end of the apparatus was open to the atmosphere via a horizontally placed glass capillary, in which a small volume of water was displaced by the argon gas flowing through the sample. A differential pressure transducer was used to ensure that pressure changes due to capillary effects and friction remained negligible. This allowed the argon flow rate through the sample to be measured accurately. A large gas volume on the upstream side of the apparatus ensured a constant differential pressure in the range of 0.04–0.22 MPa. Both the upstream and downstream pressures were monitored using pressure transducers. The permeability was calculated using Darcy’s law, assuming constant up- and downstream pressures. Upstream pressure changes during our measurements accounted for changes in pressure difference over the sample of a few percent at most, while downstream pressures remained constant. Argon densities and viscosities were obtained from the National Institute of Standards and Technology standard reference Database 23. The density and viscosity of argon in the sample were approximated by assuming the density and viscosity at the average pressure. These approximations allow for an order of magnitude estimate of the sample permeability.
3.3. Hydrothermal Hydration Experiment on MgO
A final hydrothermal experiment, R0901, was performed to measure a force resulting from the hydration of MgO under hydrothermal conditions (165 °C, 17 MPa). The aim of this experiment was to verify that the apparatus functioned properly and as expected, i.e., that a force from reaction-induced stress could be measured. In this experiment, the MgO sample was placed directly in the steel pressure vessel, i.e., without the titanium inner vessel and pistons. The sample used consisted of 8.03 g of high-purity and ultrafine granular MgO obtained from UBE Industries Ltd. After inserting the sample into the vessel, it was pre-compressed for 25 min at room temperature and 160 MPa to homogenize the MgO single crystal powder and to decrease the starting porosity of the granular MgO aggregate before testing its response to hydration. The MgO single crystal aggregate was then unloaded before demineralized water (~5–15 mL) was injected into the pore fluid system, and the system was pressurized to 17 MPa using argon via the gas separator. Next, the setup was heated to the test temperature of 165 °C, after which the piston was moved back into contact with the sample, starting the measurement.
4. Results
4.1. Mechanical Data
In total, we performed 17 experiments aimed at studying the development of a force of crystallization in a simulated carbonating peridotite fracture configuration (see Table 7). Only one of these experiments showed any evidence for the development of a reaction-induced stress, and only after correction of the load signal for changes (decreases) in the pore (CO2) pressure due to small leaks (experiment R0803 on a 2 mm disc and 1 mm layer of powder, see Figure 3). In this case, after an induction period of ~6 days the stress on the sample increased steadily, over a period of 8 days, from 40 to 69 MPa—which is <5% of the expected maximum stress (see Table 6). The other experiments, including R0817, which could be considered a replicate of experiment R0803, did not show any significant development of a reaction-induced stress within the experiment durations (up to 23 days), under the conditions investigated, and neither was any expansion of the sample measured during experiment R0805 (performed at constant load).
4.2. Optical Observations
Our experiments on powdered samples all resulted in the formation of an indurated, solid disc, suggesting that dissolution and (re-)precipitation did take place. Optical study of the initially coarser-grained samples (R0801, R0802) showed the aggregates to consist of white porous matrices containing glassy green fragments. In samples R0803, R0809–R0812 and R0817, this aggregate material was strongly adhered to the dunite disc that acted as a crack wall during the experiment. The disc samples used in experiments R0804 and R0806 showed discoloration to yellow (R0804) or red (R0806), similar to equivalent samples reacted under similar PT-conditions in cold-seal vessel experiments (see [68]). In experiment R0806, the simulated “crack” between the bottom two discs had healed, strongly attaching the discs to one another, and cracks in the top disc that were induced when the sample was loaded into the assembly had similarly healed.
4.3. XRD Data
To assess the degree to which carbonation had occurred, powder XRD analyses were performed on the starting materials (Åheim Dunite and Monticellite), and on samples R0801 and R0805. Furthermore, TGA analyses were performed on Åheim dunite starting material and on sample R0801. The XRD and TGA on sample R0801 and R0805 (see Table 8 and Table 9) showed a decrease in olivine contents from approximately 85% (in the starting material) to 72% and 64%, respectively. Samples R0801 and R0805 further showed increases in the magnesite content from an initial 0–3% to up to 28% and 13% in 12 and 22 days, respectively. The carbonation experiment performed on an unconfined crushed Åheim Dunite sample in the cold-seal vessel apparatus described by [68] showed that under conditions similar to those in the force of crystallization experiments, after a duration of 7 days, unconfined carbonation resulted in a strongly indurated sample. XRD and TGA analyses of this sample showed a decrease in sample olivine content to 59%, and an increase in magnesite content to 13–17%. Crystalline SiO2 was not detected in the samples analyzed.
4.4. Electron Beam Observations
Microprobe and SEM studies were performed on polished sections through samples R0801, R0803, R0805, R0810, R0812, R0813 and R0817, and on rough, fractured surfaces through samples R0803, R0810 and R0817. All reacted samples studied show dissolution of olivine as well as precipitation of magnesite, and in certain samples a silica-enriched phase in the pore space and on the dissolving olivine grain walls.
In describing the microprobe and SEM results, we will first consider the samples that did not show a force of crystallization. The relatively thick (~6 mm) and non-pre-compacted sample R0801 had a high porosity, which was partly filled with MgCO3-precipitate, and a silica-enriched phase (Figure 4). Precipitation had also occurred on the surface of dissolving olivine grains (Figure 4a). A gradient was observed in the density of the precipitate phase, which occurred more densely near the top of the sample (near the CO2-access point). The images of samples R0805, R0810 (Figure 5), R0812 (Figure 6), R0813 (Figure 7) and R0817 (Figure 8) show a considerably more dense (compacted), and finer-grained olivine framework with very low initial porosity. This initial porosity is almost entirely filled with a dense precipitate phase, and the remaining porosity is very low (<~5%). Note that, while sample R0812 was not pre-compacted, the micrographs do show a very dense olivine framework, likely as a result of the starting grain-size distribution (Figure 6). Interestingly, in samples R0805, R0810, R0812 and R0813 the precipitated magnesite was very fine-grained, and precipitated silica was not observed. Fractured surface imaging of sample R0810 showed that magnesite precipitated in sample R0810 as very small (<1 μm), spherical grains occurring along (olivine) grain surfaces (Figure 5b), and as a dense chaotic mass inside the pore spaces. A separate silica phase was not observed on the fractured surfaces. Due to the small grain size, grain boundaries between magnesite grains could not be accurately observed in this sample. In contrast, fractured surface imaging of sample R0817 (performed under the same conditions, and with the same starting grain size as R0803) showed the formation of magnesite as reasonably large (~5 μm), well-developed rhombohedral grains (see Figure 8c,e). Furthermore, silica precipitated as small (<1 μm) spheres, often occurring along planar features in the sample, such as original olivine grain surfaces, and often interconnecting to form porous sheets.
Turning to the single experiment that provided evidence consistent with the development of a force of crystallization, the microstructure of sample R0803 (see Figure 9), which had a similar starting porosity and starting grain size, but a thinner powder layer relative to the material used in experiment R0801, exhibited characteristics also found in R0801. However, the precipitate phase filled the pore space between the olivine grains more completely in sample R0803 relative to the precipitate in sample R0801, amounting to a tightly cemented, solid aggregate with very little remaining porosity. Fractured surface imaging of sample R0803 (Figure 9e–h) further showed that magnesite had precipitated as well-developed rhombohedral grains, >10 μm in size. Silica precipitation was also more prevalent than in sample R0817, and again occurred as small (<1 μm) spheres, generally forming along planar features in the sample, such as original olivine grain surfaces. Further growth of these spheres often resulted in the formation of porous silica sheets (Figure 9e). The contacts between magnesite grains and these silica sheets were relatively open (Figure 9g).
4.5. Permeability Measurements
Post-mortem permeability measurements were attempted on two powdered Åheim Dunite samples tested in the force of crystallization experiments (R0802 and R0816). Our permeability measurements on the relatively porous, non-pre-compacted sample R0802 gave values for the argon permeability in the range 0.87−1.5 × 10⁻¹⁶ m2 (87–150 μD) at room temperature. The measurement made on sample R0816 was performed keeping the sample inside the titanium inner vessel to prevent sample cracking. The argon permeability in this case was only 6−9 × 10⁻¹⁹ m2 (600–900 nD) after pre-compaction and 21 days of reaction. Note that all reported permeabilities are average (bulk) values, acquired by assuming the sample to be homogeneous. Also note that the existence of fractures through samples R0802 and R0816 cannot be excluded, so the measured bulk permeability represents a maximum value. For comparison, the permeability of a disc of intact A30 Oman Peridotite was approximately 8 × 10⁻²¹ m2 (~8 nD).
4.6. Results of the MgO Experiment
One additional experiment (R0901) was performed to study the hydration of a granular aggregate of periclase (MgO) under hydrothermal conditions (165 °C, 17 MPa). Figure 10 shows the evolution of the vertical stress measured on the sample with time. After a rapid increase in the measured force up to 15 MPa over the first four hours, the increase in force gradually slows down to a constant rate reached after about ~20 h. A slow increase in force continues for most of the duration of the 258 h duration of the experiment, which ultimately produced a maximum stress of 33.9 MPa. Direct measurement of the expansion of the sample (resulting from elastic displacement of the top piston relative to the vessel) indicated a total maximum expansion of ~70 μm. Photomicrographs of the reacted sample show that reaction resulted in hierarchical cracking of the sample with different sets of reaction fractures at roughly 90° angles to each other (Figure 11). Although narrow fractures that underwent reaction with water were observed throughout the sample, the reaction and associated fracturing occurred mainly in the top few mm of the sample, near to the water injection point. Reaction of the MgO monocrystalline powder occurred most completely in zones along these fractures, resulting in the formation of a hydrous product phase that is more than likely magnesium hydroxide. The high concentration of fractures undergoing hydration in the top of the MgO crystalline aggregate reveals that the transport of fluid into the sample was slow compared to the rate of reaction. This result suggests that transport limitations within the MgO hydration experiment coincided with lower rates of force development.
5. Discussion
Estimates from our thermodynamic model (see [24]) show that the solid volume increase occurring during the carbonation of olivine (to form magnesite and silica) has the potential to result in a significant force of crystallization (typically 300–3000 MPa for reactions at 423 K/150 °C—see Table 6), provided that sufficient reaction progress and fluid supersaturation are achieved, while impinging grain contacts remain accessible to diffusive transport [67,69,70]). Such forces may result in the propagation and initiation of (micro-)cracks, i.e., to reaction-driven fracturing, providing fresh rock surface for dissolution and space for product precipitation, and is therefore seen as a crucial element for enabling the in-situ mineralization of CO2 by olivine-carbonation in peridotite bodies [14,71,72,73]. However, the development of a force of crystallization was directly measured in only one of our carbonation experiments that made use of crushed peridotite to simulate the mineralization of CO2 within fractures.
A single hydrothermal experiment on the hydration of MgO did reveal the development of a significant reaction-induced stress, equivalent to 33.9 MPa, over the course of 11 days, demonstrating that our experimental apparatus was able to detect the onset of stress originating from a reaction. However, this peak stress is considerably lower than the maximum value of up to 1.6 GPa estimated for these conditions by the thermodynamic model of [24] (see Table 6). The discrepancy between the observations and a model of the relevant reactions may have arisen from the reliance of the thermodynamic model on the assumption that all reactions would proceed until the free energy change of the reaction driving it is negated by a stress-induced change in the chemical potentials of the solid phases—i.e., the model neglects potential mechanisms that would slow reaction progress, such as fracture or pore clogging that would render the transport of reactants more sluggish, or exceedingly slow reaction kinetics, for example due to changes in fluid composition, that could arrest the development of a reaction induced stress altogether.
To explain why a reaction-induced force, although measurable in the MgO hydration experiment, was not reproducibly observed in our carbonation experiments, we propose the following hypotheses:
- As a result of precipitation-induced changes in sample porosity and pore-connectivity (i.e., permeability), CO2 transport into the olivine-bearing samples was increasingly inhibited. This would imply that the rates of dissolution and precipitation became controlled by a slow, diffusion-limited transport process, which slowed the rate of force development to the extent that no force of crystallization was measurable within the duration of our experiments.
- As our carbonation experiments progressed, the rate of olivine dissolution decreased due to changes in fluid composition and pH to the extent that the formation of carbonation products was too slow to build up an observable force of crystallization within the experimental duration.
- Precipitation of product phases occurring at the margin of grain-to-grain contacts, i.e., marginal grain boundary healing, might have prevented precipitation within grain boundaries, thereby preventing the development of a force of crystallization within our carbonating crushed peridotite samples (e.g., see [74]).
In what follows, we assess each of these claims for consistency with our experimental results. We also discuss why a reaction-induced force was observed during the MgO hydration experiment (R0901) and in one of our carbonation experiments (R0803), and further consider whether the latter is more representative of the force of crystallization phenomenon or an artifact.
5.1. Hypothesis 1—Restriction of CO2 Transport into the Samples
Post-mortem permeability measurements were performed on two powdered Åheim Dunite samples tested in the force of crystallization experiments (R0802 and R0816). The overall (maximum) argon permeability of sample R0816 was only 6−9∙10−19 m2 (600–900 nD). The permeability of sample R0802, which was not pre-compacted, was 0.87−1.50∙10−16 m2, which is 2–3 orders of magnitude higher. The measurement on sample R0816 is taken to indicate a decrease in permeability compared to the starting powder layer of similar or larger magnitude. This result is consistent with the proposed occurrence of significant clogging and an associated decrease in the transport properties of our (pre-compacted) samples, and of carbonating fractures in peridotite, due to precipitation.
In addition to these permeability measurements, the microstructures of reacted powdered Åheim Dunite samples R0801, R0803, R0805, R0810, R0812 and R0813 were studied using SEM and microprobe. Considering first the samples that did not show a force of crystallization, the gradient in precipitation density observed in the relatively thick (~6 mm) and non-pre-compacted sample R0801 (which is similar to sample R0802—see also Figure 4) suggests that precipitation deeper in this sample was limited by the transport of CO2 through the sample. The images of samples R0805, R0810 (Figure 5), R0812 (Figure 6), R0813 (Figure 7) and R0817 (Figure 8) reveal a very dense microstructure, with very little porosity (<~5%). The dense nature of these samples is consistent with the claim that reaction progress may have been controlled by restrictions on CO2-transport.
Like samples R0805, R0810, R0812 and R0813, sample R0803 shows a relatively dense precipitate cementing the pore space between the olivine grains. In contrast, however, this precipitate consisted of relatively well-developed, rhombohedral magnesite crystals, >10 μm in size, and small (<1 μm) spheres of silica precipitated in grain boundaries, often interconnecting to form porous sheets (Figure 9e). A similar microstructure was observed in sample R0817, though with smaller magnesite crystals and with less extensive silica precipitation. The differences in the microstructure and composition of the precipitated phases between samples R0801, R0803 and R0817, and samples R0805, R0810, R0812 and R0813 suggest that, in samples R0803 and R0817, the open nature of the silica-magnesite grain contacts, as well as the porous nature of the silica sheets, may have enabled CO2-transport, and hence the carbonation reaction, to continue over a longer duration. The implication is that, in sample R0803, CO2 penetration continued long enough to enable the development of a force of crystallization. In sample R0817, although CO2 transport progressed to some extent, the movement of CO2 into the sample was halted by precipitation before any force developed.
5.2. Hypothesis 2—The Olivine Carbonation Rate is Too Slow
As olivine dissolution proceeds, changes in the fluid chemistry (especially fluid pH) can considerably slow down further dissolution. To test whether the development of a force of crystallization was prevented in our experiments by slow reaction kinetics, two force of crystallization experiments (R0814 and R0815) were performed using monticellite (CaMgSiO4) as an analogue material replacing peridotite. As monticellite dissolves approximately 2 orders of magnitude faster than olivine [69], if the reaction (dissolution/precipitation) rate was the limiting factor for force of crystallization development in our olivine experiments, reaction progress should be about 100× faster using monticellite. As a force of crystallization did not develop in the experiments using monticellite, it is implied that either the olivine reaction kinetics are so slow that a 100× increase is insufficient to result in a force of crystallization in our experiments, or that the reaction (dissolution and precipitation) kinetics are not the inhibiting factor in this system.
As a further test, we performed one cold-seal vessel experiment on crushed Åheim Dunite (R0721A—see [68]) to evaluate reaction progress under conditions similar to those of the force of crystallization experiments, though unconstrained. XRD and TGA analyses of the reaction products of experiment R0721A showed that the overall reaction rate of sample R0721A is considerably slower than expected by assuming dissolution rates reported by [75]. However, despite being unconstrained, the carbonation reaction resulted in a strongly cemented sample. Furthermore, larger overall changes in mineral composition occurred in the more open samples (R0721A and R0801) compared to the less open samples (R0805). These observations do not support limitation by reaction kinetics, but do support the hypothesis of reaction-inhibition by restriction of transport of solutes through the samples, especially in thicker samples.
5.3. Hypothesis 3—Grain Boundary Healing Prevented Force of Crystallization Development
To test the hypothesis that grain boundary healing prevented the development of the force of crystallization, an attempt was made to study grain boundary development in our samples in the SEM, mainly on fractured surfaces of sample R0803, which did show evidence for a force of crystallization, and samples R0810 and R0817, which did not (see Figure 5b, Figure 8c–e and Figure 9e–h). Due to the size of the precipitated magnesite grains (<1 μm), grain boundaries could not be observed in sample R0810. In samples R0803 and (to a lesser degree) R0817, however, magnesite grains were considerably larger (>10 μm and ~5 μm, respectively), and contacts between magnesite grains and silica sheets, and between the silica sheets themselves, were often observed to be relatively open. These relatively open grain contacts between the magnesite grains and the silica sheets, which are formed if silica precipitates before magnesite precipitation inhibits transport through the sample entirely, may have been a critical factor enabling transport through, and precipitation in grain boundaries, and therefore enabling the development of a force of crystallization. However, a force of crystallization did not develop in R0817, even though this sample contains similar microstructures as R0803.
5.4. Forces Observed in Experiment R0803
An important issue to be resolved is why a force of crystallization was observed in experiment R0803, especially since our attempts to reproduce this result were unsuccessful. Here, we explore several hypotheses that might explain why the force of crystallization did indeed develop in experiment R0803, and why this particular sample was uninhibited by the transport limitations characteristic of our other experiments with olivine.
An important difference between sample R0803 and the samples reacted thereafter was the starting microstructure. In later experiments, a finer-grained starting material was used to increase the peridotite surface area and speed up the overall rate of reaction. Furthermore, in some experiments, this material was pre-compressed strongly to reduce starting porosity to very low values. Experiment R0803 thus had a relatively open and coarse-grained starting microstructure, and this may have been an important factor allowing a force of crystallization to develop. With lower olivine surface area, magnesite supersaturation would have built up more slowly, limiting nucleation so that a coarser-grained magnesite phase (i.e., less magnesite surface area) could precipitate. As more precipitation was required to inhibit the transport of solutes through this sample, the carbonation process could continue for longer periods, resulting in the precipitation of silica along with magnesite. We propose that the contacts between these two phases remained relatively open due to surface energy effects that promoted contact wetting (e.g., see Figure 9g). In turn, this allowed the precipitation of magnesite to occur in confined spaces at these grain contacts, which resulted in the development of a force of crystallization.
This proposal appears unable to withstand extensive scrutiny, when considering that a force of crystallization did not develop in experiment R0817 even though it was performed using starting material and conditions that were nearly equivalent to those of experiment R0803. While microstructural analysis (Figure 8) did show that similar microstructures developed in R0817 as in R0803 (Figure 9), in R0817 the microstructures appear less well-developed, with somewhat smaller magnesite grains. One potential difference between experiments R0803 and R0817 is found in the unintended pore fluid pressure variations that occurred during experiment R0803 as a result of small leaks. As these leakages drove large fluctuations in the CO2-pressure over the course of some initial experiments (including R0803), it is possible that these pressure perturbations may have influenced the nucleation and growth of reactant phases (especially carbonates), which may have led to the creation of a microstructure that enabled the development of a force of crystallization. Additionally, because CO2-pressure was regulated within our experiments in accord with a loading frame setting configured to maintain a fixed load, the load on the sample fluctuated with changes in CO2-pressure. Such fluctuations in pressure and/or load on the sample may have also promoted the development of a force of crystallization in experiment R0803. Gratier etal [76] theorized that CO2-pressure variations may have been a key factor in the development of a force of crystallization by carbonate precipitation during travertine vein formation, and a similar mechanism may have operated in our experiment. On the other hand, significant CO2-pressure fluctuations necessitating pressure corrections also occurred during several other experiments, and it is therefore unlikely that pressure fluctuations alone would have driven the development of a force of crystallization in R0803.
An explanation for the development of a force of crystallization in experiment R0803, and for the lack of such a force in the other olivine carbonation experiments, is that regions surrounding points of contact between (porous) silica sheets and magnesite grains allowed R0803 to be more supportive of solute transport, which enabled precipitation to occur within grain boundaries. This may have also occurred during the hydration of MgO under hydrothermal conditions where, notably, a reaction induced stress developed before the onset of a transport limitation and the hydration reaction itself was the rate limiting process. In the other samples, solute transport through the sample and the precipitation of product phases in loaded grain boundaries was likely inhibited by a combination of grain boundary healing and pore filling precipitation. Various studies on pressure solution and grain boundary healing have shown that the presence of contacts between dissimilar materials can lead to enhanced pressure solution and an inhibition of grain boundary healing [74,77,78,79,80]. It is therefore possible that, while transport limitation is important, the main mechanism preventing the development of a force of crystallization during our peridotite carbonation experiments was grain boundary healing driven by surface energetic factors (see [74]) that promoted the elimination of space between mineral grains.
5.5. Implications for In-Situ CO2-Mineralization in Peridotite
Thermodynamic modeling has shown that extremely large effective stresses, falling mainly in the range 300–3000 MPa at 423 K (150 °C), could occur during in-situ CO2-mineralization in peridotites as a result of a force of crystallization effect. These effective stresses correspond to total normal stresses far in excess of the effective lithostatic pressure (30–70 MPa) anticipated in a peridotite body at depths of 1–3 km. This indicates that the force of crystallization has the potential to propagate fractures in the rock, which would create both space and surface area that would support progressive carbonation.
Our results have important implications for in-situ storage of CO2 in peridotite bodies. The development of a force of crystallization in our experiments was inhibited by transport restrictions of CO2 and other solutes within our samples. These restrictions will also occur during in-situ CO2-storage. Consequently, the rate of transport through low-permeability zones, and the distance over which slow transport must take place, will become the limiting factors for CO2-mineralization and force of crystallization development. The development of a stress through dissolution-precipitation will then require significantly longer times than our experimental duration of up to 3 weeks, and as such, in-situ CO2-mineralization and fracture propagation will be subject to a variety of processes that are unaccounted by thermodynamic models.
This implies that as (diffusive) transport into pores and grain boundaries becomes the rate-limiting step in the carbonation process, a force of crystallization can develop, but on an extended time scale. Information about possible maximum values for the time scales might be derived from, for instance, natural serpentinization rates (e.g., [53,81]). Alternatively, a rough estimate of the minimum time required to develop a force of crystallization sufficient to extend a mineralizing fracture by distances of the order of one meter can be made as follows:
Consider a fracture network into which, after (hydro-)fracturing with CO2-enriched water, CO2 is pumped continuously, at a CO2-pressure of 30 MPa and a temperature of 393 K (120 °C). To continuously advance a mineralized crack tip in steps of one meter, the precipitation of sufficient product would be required to fill up a one meter long crack segment to the point where a force of crystallization would develop. Provided this can occur, one could assume that pure forsterite olivine dissolves and both magnesite and silica precipitate, so that the solid volume increases by a factor (see Table 5). The minimum length scale over which the necessary components must diffuse to fill 1 m of advancing crack is of the order of . If the crack aperture is , and the crack width is , and a cuboid crack shape is assumed, then the volume of precipitate () that must be deposited is given by:
Note that this assumes that olivine (forsterite) dissolves locally, so that the volume of precipitation required is equal to the volume of the crack plus the volume of dissolved olivine (). Dividing the dissolved olivine volume by the molar volume of olivine, gives the amount of olivine dissolved (in moles):
For 2 moles of MgCO3 to precipitate per mole of dissolved forsterite (Mg2SiO4), 2 moles of CO2 would be required to diffuse into the fracture. The rate of diffusion of a solute (such as H2CO3) through a bulk fluid () is given (in mol m−2·s−1):
where is the diffusion coefficient (m2·s−1), and is the H2CO3-concentration gradient (mole m−3/m). Following this, the amount of CO2 required to fill the crack () is given:
Furthermore, the rate with which CO2 diffuses through the crack is given ( in mole s−1):
Combining the above two equations, we find that the time required to diffuse the CO2 for sufficient precipitation into the fracture is:
If we assume that H2CO3 has a diffusion coefficient similar to that of dissolved ions such as Na+ and Cl− (~1 × 10⁻⁹ m2·s−1 at room temperature, with an activation energy of ~15 kJ·mol−1) and we assume a maximum concentration gradient that is equal to the concentration of dissolved CO2 (1320 mol·m−3), it would take ~300 years to spread open a 1 m crack in a rock with an initial crack length of 1 m. If we further consider the diffusion pathway to contain a precipitate, with an (interconnected) porosity of ~5%, this would slow down diffusion by a factor 20, so that the time required becomes ~6000 years. This figure is roughly one order of magnitude slower than the timescales given by, for instance, [81] of 50–500 years for one meter of serpentinization of the shallow mantle (i.e., at higher temperatures), and by [53] of ~1000 years to fully serpentinize one meter of peridotite at 300 °C.
This estimate indicates that the in-situ mineralization of CO2 in peridotite bodies will take 300–6000 years to proceed by one meter, which will limit the volume of CO2 that can ultimately be sequestered in the subsurface. We note that [72] explicitly states that all possible negative feedbacks, such as transport-inhibition due to precipitation, are neglected in their model for reaction-induced cracking during serpentinization and carbonation. However, our experiments (reported here and in [68]) demonstrate that (a) pH-increases leading to lower dissolution rates, (b) transport inhibition by the precipitation of product phases, (c) grain boundary healing, and (d) lack of “self-heating” all negatively impact the amount of CO2 that can be sequestered in subsurface ultramafic rocks. Considering these results and the above analysis, it is apparent that, while reaction-induced fracturing may occur, the process will be very slow, likely occurring at rates more characteristic of natural processes than those proposed in recent investigations of mineral carbonation. Recently, [82] reported 95% mineralization after 2 years of CO2 injected into a porous basaltic rock formation. This relatively rapid conversion may appear to be at odds with our estimate. However, it should be noted that, when considering the force of crystallization in mineralizing fractures in non-permeable non-porous rocks, transport through the fracture becomes the limiting factor as this becomes inhibited by precipitation. In contrast, during the injection of CO2 into permeable porous basaltic rocks reported by [82], the total amount of precipitation was likely insufficient to fill up the available pore space, and hence no such inhibition occurred.
6. Conclusions
To assess the rate of stress development in peridotites, we performed carbonation experiments on simulated fractures in peridotite to quantify the magnitude of stress developed as a result of olivine-carbonation. A significant force of crystallization was not observed to develop during the carbonation of olivine within experimental durations in all but one experiment; however, the development of a reaction-driven stress was observed during the hydration of MgO under hydrothermal conditions.
On the basis of permeability measurements and microstructural evidence, we determined that the inhibition of CO2 transport and the movement of other solutes into grain boundaries within the samples limited the precipitation of product phases in such boundaries and prevented the development of a force of crystallization in our experiments. The evidence suggests that both sample-scale transport restrictions such as pore clogging and grain boundary blocking occurred in most samples, but an evaluation of sample microstructure suggests that in sample R0803 the occurrence of a precipitated silica-phase resulted in open contacts between magnesite and silica, which prevented grain boundary healing and its associated transport restrictions. This enabled precipitation in the open, load-bearing contacts, resulting in a force of crystallization in this lone experiment. The occurrence and location of silica-precipitation could therefore be an important factor determining whether, and how fast, a force of crystallization develops in nature as well.
Based on the above insights, development of a force of crystallization will be favored in reacting systems containing contacts between solid phases with strongly dissimilar surface energies. Furthemore, the potential for force development is enhanced if the solid phases present (especially product phases) are hydrophilic (i.e., have low solid-liquid interfacial energy and hence high wettability). This means that the development of a force of crystallization can be promoted by choosing a reacting system with drastically different reactants and products or by adding minerals or other solid phases that have high solid-solid interfacial energies with the reactant and/or product phases, and that are highly wetting. The presence of such a phase (amorphous silica) was the most likely explanation for the occurrence of a force of crystallization in olivine carbonation experiment R0803.
Our results have important implications for in-situ storage of CO2 in peridotite bodies. The development of a force of crystallization in our experiments was inhibited by transport restrictions resulting from clogging due to grain boundary healing and filling of porosity. These processes should also be expected during in-situ CO2-storage, and consequently the rate of transport through low-permeability zones, and the distance over which slow transport must take place, will become the limiting factors for CO2-mineralization and force of crystallization development. Using rigorous but simple estimates based on the experimental results, we conclude that the in-situ mineralization of CO2 in peridotite bodies may take 300–6000 years to proceed by one meter, and is thus likely to be too slow to accommodate expected volumes of CO2 for sequestration.
Acknowledgments
This research was funded by Shell Game Changer. The authors would like to thank Elizabeth Endler for her helpful insights towards improving this manuscript.
Author Contributions
Reinier van Noort and Christopher J. Spiers conceived and designed the experiments. Reinier van Noort performed the experiments. Reinier van Noort, Christopher J. Spiers, Timotheus K. T. Wolterbeek and Michael T. Kandianis analyzed the data. Martyn R. Drury contributed the rock samples used in this study. Reinier van Noort, Timotheus K. T. Wolterbeek, Michael T. Kandianis and Christopher J. Spiers wrote the paper.
Conflicts of Interest
The authors declare no conflict of interest.
References
- Lackner, K.S.; Butt, D.P.; Wendt, C.H. Progress on binding CO2 in mineral substrates. Energy Convers. Manag. 1997, 38, S259–S264. [Google Scholar] [CrossRef]
- Lackner, K.S. Climate Change: A Guide to CO2 Sequestration. Science 2003, 300, 1677–1678. [Google Scholar] [CrossRef] [PubMed]
- O’Connor, W.K.; Dahlin, D.C.; Nilsen, D.N.; Walters, R.P.; Turner, P.C. Carbon dioxide sequestration by direct mineral carbonation with carbonic acid. In Proceedings of the 25th International Technical Conference on Coal Utilization & Fuel systems, Clearwater, FL, USA, 6–9 March 2000. [Google Scholar]
- O’Connor, W.K.; Dahlin, D.C.; Nilsen, D.N.; Gerdemann, S.J.; Rush, G.E.; Penner, L.R.; Walters, R.P.; Turner, P.C. Continuing studies on direct aqueous mineral carbonation for CO2 sequestration. In Proceedings of the 27th International Technical Conference On Coal Utilization & Fuel Systems, Clearwater, FL, USA, 4–7 March 2002; p. 617. [Google Scholar]
- O’Connor, W.K.; Dahlin, D.C.; Rush, G.E.; Dahlin, C.L.; Collins, W.K. Carbon dioxide sequestration by direct mineral carbonation: Process mineralogy of feed and products. Miner. Metall. Proccess. 2002, 19, 95–101. [Google Scholar]
- O’Connor, W.K.; Dahlin, D.C.; Rush, G.E.; Gerdemann, S.J.; Penner, L.R.; Nilsen, D.N. Aqueous Mineral Carbonation—Mineral Availability, Pretreatment, Reaction Parametrics, and Process Studies; Albany Research Center: Albany, OR, USA, 2004. [Google Scholar]
- Gerdemann, S.J.; Dahlin, C.L.; O’Connor, W.K.; Penner, L.R. Carbon Dioxide Sequestration by Aqueous Mineral Carbonation of Magnesium Silicate Minerals; Albany Research Center: Albany, OR, USA, 2003. [Google Scholar]
- Gerdemann, S.J.; O’Connor, W.K.; Dahlin, D.C.; Penner, L.R.; Rush, H. Ex situ aqueous mineral carbonation. Environ. Sci. Technol. 2007, 41, 2587–2593. [Google Scholar] [CrossRef] [PubMed]
- Park, A.-H.A.; Fan, L.-S. CO2 mineral sequestration: Physically activated dissolution of serpentine and pH swing process. Chem. Eng. Sci. 2004, 59, 5241–5247. [Google Scholar] [CrossRef]
- McKelvy, M.J.; Chizmeshya, A.V.G.; Squires, K.; Carpenter, R.W.; Béarat, H. A Novel Approach to Mineral Carbonation: Enhancing Carbonation While Avoiding Mineral Pretreatment Process Cost; Arizona State University: Tempe, AZ, USA, 2005. [Google Scholar]
- Khoo, H.H.; Tan, R.B.H. Life cycle evaluation of CO2 recovery and mineral sequestration alternatives. Environ. Prog. 2006, 25, 208–217. [Google Scholar] [CrossRef]
- Kharaka, Y.K.; Cole, D.R.; Hovorka, S.D.; Gunter, W.D.; Knauss, K.G.; Freifeld, B.M. Gas-water-rock interactions in Frio Formation following CO2 injection: Implications for the storage of greenhouse gases in sedimentary basins. Geology 2006, 34, 577–580. [Google Scholar] [CrossRef]
- Sanna, A.; Uibu, M.; Caramanna, G.; Kuusik, R.; Maroto-Valer, M.M. A review of mineral carbonation technologies to sequester CO2. Chem. Soc. Rev. 2014, 43, 8049–8080. [Google Scholar] [CrossRef] [PubMed] [Green Version]
- Kelemen, P.B.; Matter, J.R. In situ carbonation of peridotite for CO2 storage. Proc. Natl. Acad. Sci. USA 2008, 105, 17295–17300. [Google Scholar] [CrossRef]
- Andreani, M.; Luquot, L.; Gouze, P.; Godard, M.; Hoisé, E.; Gibert, B. Experimental Study of Carbon Sequestration Reactions Controlled by the Percolation of CO2-Rich Brine through Peridotites. Environ. Sci. Technol. 2009, 43, 1226–1231. [Google Scholar] [CrossRef] [PubMed]
- Hövelmann, J.; Austrheim, H.; Jamtveit, B. Microstructure and porosity evolution during experimental carbonation of a natural peridotite. Chem. Geol. 2012, 334, 254–265. [Google Scholar] [CrossRef]
- Zhu, W.; Fusseis, F.; Lisabeth, H.; Xing, T.; Xiao, X.; De Andrade, V.; Karato, S.-I. Experimental evidence of reaction-induced fracturing during olivine carbonation. Geophys. Res. Lett. 2016, 43, 9535–9543. [Google Scholar] [CrossRef]
- Fyfe, W.S. Heats of Chemical Reactions and Submarine Heat Production. Geophys. J. Int. 1974, 37, 213–215. [Google Scholar] [CrossRef]
- Dewandel, B.; Lachassagne, P.; Boudier, F.; Al-Hattali, S.; Ladouche, B.; Pinault, J.-L.; Al-Suleimani, Z. A conceptual hydrogeological model of ophiolite hard-rock aquifers in Oman based on a multiscale and a multidisciplinary approach. Hydrogeol. J. 2005, 13, 708–726. [Google Scholar] [CrossRef]
- O’Hanley, D.S. Solution to the volume problem in serpentinization. Geology 1992, 20, 705–708. [Google Scholar] [CrossRef]
- Iyer, K.; Jamtveit, B.; Mathiesen, J.; Malthe-Sørenssen, A.; Feder, J. Reaction-assisted hierarchical fracturing during serpentinization. Earth Planet. Sci. Lett. 2008, 267, 503–516. [Google Scholar] [CrossRef]
- Jamtveit, B.; Putnis, C.V.; Malthe-Sørenssen, A. Reaction induced fracturing during replacement processes. Contrib. Mineral. Petrol. 2009, 157, 127–133. [Google Scholar] [CrossRef]
- Weyl, P.K. Pressure solution and the force of crystallization—A phenomenological theory. J. Geophys. Res. 1959, 64, 2001–2025. [Google Scholar] [CrossRef]
- Wolterbeek, T.K.T.; van Noort, R.; Spiers, C.J. Reaction-induced casing expansion: Potential for wellbore leakage mitigation. Acta Geotech. 2017, 17, 1–26. [Google Scholar] [CrossRef]
- Robie, R.A.; Hemingway, B.S. Thermodynamic Properties of Minerals and Related Substances at 298.15 K and 1 Bar (105 Pascals) Pressure and at Higher Temperatures; U.S. Geological Survey: Washington, DC, USA, 1995.
- Chase, M.W., Jr. (Ed.) NIST-JANAF Thermochemical Tables, 4th ed.; American Institute of Physics: Woodbury, NY, USA, 1998. [Google Scholar]
- He, H.; Jin, S.; Jing, F.; Ahrens, T.J. Characteristic of dynamic tensile fracture in augite-peridotite. In Shock Compression of Condensed Matter; Schmidt, S.C., Tao, W.C., Eds.; AIP Press: New York, NY, USA, 1995; pp. 593–596. [Google Scholar]
- Escartín, J.; Hirth, G.; Evans, B. Strength of slightly serpentinized peridotites: Implications for the tectonics of oceanic lithosphere. Geology 2001, 29, 1023–1026. [Google Scholar] [CrossRef]
- Mambetov, S.; Mosinets, V. Kinetics of the propagation of fractures in the process of explosive breaking of rocks. J. Min. Sci. 1965, 1, 232–239. [Google Scholar] [CrossRef]
- Lama, R.D.; Vutukuri, V.S. Handbook on Mechanical Properties of Rocks, 2nd ed.; Trans Tech Publications: Zürich, Switzerland, 1978. [Google Scholar]
- Schultz, R.A. Limits on strength and deformation properties of jointed basaltic rock masses. Rock Mech. Rock Eng. 1995, 28, 1–15. [Google Scholar] [CrossRef]
- Lockner, D.A. Rock Failure. In Rock Physics and Phase Relations: A Handbook of Physical Constants; Ahrens, T.J., Ed.; American Geophysical Union: Washington, DC, USA, 1995; pp. 127–147. [Google Scholar]
- Paterson, M.S.; Wong, T.-F. Experimental Rock Deformation—The Brittle Field; Springer: Berlin, Germany, 2005; p. 347. [Google Scholar]
- Atkinson, B.K. Subcritical crack growth in geological materials. J. Geophys. Res. 1984, 89, 4077–4114. [Google Scholar] [CrossRef]
- Demartin, B.; Hirth, G.; Evans, B. Experimental Constraints on Thermal Cracking of Peridotite at Mid-Ocean Ridges; American Geophysical Union Fall Meeting Abstracts: San Francisco, CA, USA, 2002. [Google Scholar]
- Jaeger, J.C.; Cook, N.G.W.; Zimmerman, R.W. Fundamentals of Rock Mechanics, 4th ed.; Blackwell Publishing: Malden, MA, USA, 2007. [Google Scholar]
- Atkinson, B.K. (Ed.) Fracture Mechanics of Rocks; Academic Press Inc.: London, UK, 1987; p. 534. [Google Scholar]
- Deer, W.A.; Howie, R.A.; Zussman, J.; Chang, L.L.Y. Rock-Forming Minerals: Volume 1A: Orthosilicates, 2nd ed.; The Geological Society: London, UK, 1997. [Google Scholar]
- Ashby, M.F.; Sammis, C.G. The damage mechanics of brittle solids in compression. Pure Appl. Geophys. 1997, 133, 489–521. [Google Scholar] [CrossRef]
- Schellart, W.P. Shear test results for cohesion and friction coefficients for different granular materials: Scaling implications for their usage in analogue modelling. Tectonophysics 2000, 324, 1–16. [Google Scholar] [CrossRef]
- Moore, D.E.; Lockner, D.A.; Summers, R.; Shengli, M.; Byerlee, J.D. Strength of chrysotile-serpentinite gouge under hydrothermal conditions: Can it explain a weak San Andreas fault? Geology 1996, 24, 1041–1044. [Google Scholar] [CrossRef]
- Simmons, G.; Wang, H. Single Crystal Elastic Constants and Calculated Aggregate Properties: A Handbook, 2nd ed.; The M.I.T. Press: Cambridge, MA, USA, 1971. [Google Scholar]
- Dewandel, B.; Boudier, F.; Kern, H.; Warsi, W.; Mainprice, D. Seismic wave velocity and anisotropy of serpentinized peridotite in the Oman ophiolite. Tectonophysics 2003, 370, 77–94. [Google Scholar] [CrossRef]
- Song, I.; Suh, M.; Woo, Y.-K.; Hao, T. Determination of the elastic modulus set of foliated rocks from ultrasonic velocity measurements. Eng. Geol. 2004, 72, 293–308. [Google Scholar] [CrossRef]
- Hilairet, N.; Daniel, I.; Reynard, B. P–V Equations of State and the relative stabilities of serpentine varieties. Phys. Chem. Miner. 2006, 33, 629–637. [Google Scholar] [CrossRef]
- Carmichael, R.S. (Ed.) Handbook of Physical Properties of Rocks; CRC Press: Boca Raton, FL, USA, 1982. [Google Scholar]
- Putnis, A. Mineral replacement reactions: From macroscopic observations to microscopic mechanisms. Mineral. Mag. 2002, 66, 689–708. [Google Scholar] [CrossRef]
- Putnis, C.V.; Tsukamoto, K.; Nishimura, Y. Direct observations of pseudomorphism: Compositional and textural evolution at a fluid-solid interface. Am. Mineral. 2005, 90, 1909–1912. [Google Scholar] [CrossRef]
- Putnis, C.V.; Geisler, T.; Schmid-Beurmann, P.; Stephan, T.; Giampaolo, C. An experimental study of the replacement of leucite by analcime. Am. Mineral. 2007, 92, 19–26. [Google Scholar] [CrossRef]
- Putnis, A.; Putnis, C.V. The mechanism of reequilibration of solids in the presence of a fluid phase. J. Solid State Chem. 2007, 180, 1783–1786. [Google Scholar] [CrossRef]
- Jamtveit, B.; Hakon, A.; Malthe-Sørenssen, A. Accelerated hydration of the Earth’s deep crust induced by stress perturbations. Nature 2000, 408, 75–78. [Google Scholar] [CrossRef] [PubMed]
- Malthe-Sørenssen, A.; Jamtveit, B.; Meakin, P. Fracture Patterns Generated by Diffusion Controlled Volume Changing Reactions. Phys. Rev. Lett. 2006, 96, 245501–245504. [Google Scholar] [CrossRef] [PubMed]
- Macdonald, A.H.; Fyfe, W.S. Rate of serpentinization in seafloor environments. Tectonophysics 1985, 116, 123–135. [Google Scholar] [CrossRef]
- Janecky, D.R.; Seyfried, W.E., Jr. Hydrothermal serpentinization of peridotite within the oceanic crust: Experimental investigations of mineralogy and major element chemistry. Geochim. Cosmochim. Acta 1986, 50, 1357–1378. [Google Scholar] [CrossRef]
- Guthrie, G.D.J.; Carey, J.W.; Bergfeld, D.; Byler, D.; Chipera, S.; Ziock, H.J.; Lackner, K.S. Geochemical Aspects of the Carbonation of Magnesium Silicates in an Aqueous Medium; Los Alamos National Laboratory: Los Alamos, NM, USA, 2001. [Google Scholar]
- Evans, B.W. The Serpentinite multisystem revisited: Chrysotile is metastable. Int. Geol. Rev. 2004, 46, 479–506. [Google Scholar] [CrossRef]
- Hansen, L.D.; Dipple, G.M.; Gordon, T.M.; Kellet, D.A. Carbonated serpentinite (listwanite) at Atlin, British Columbia: A geological analogue to carbon dioxide sequestration. Can. Mineral. 2005, 43, 225–239. [Google Scholar] [CrossRef]
- Chen, Z.-Y.; O’Connor, W.K.; Gerdemann, S.J. Chemistry of aqueous mineral carbonation for carbon sequestration and explanation of experimental results. Environ. Prog. 2006, 25, 161–166. [Google Scholar] [CrossRef]
- Sorby, H.C. On the direct correlation of mechanical and chemical forces. Proc. R. Soc. Lond. 1863, 12, 538–550. [Google Scholar] [CrossRef]
- Lehner, F.K. Thermodynamics of rock deformation by pressure solution. In Deformation Processes in Minerals, Ceramics and Rocks; Barber, D.J., Meredith, P.G., Eds.; Unwin Hyman: London, UK, 1990; pp. 296–333. [Google Scholar]
- Lehner, F.K. A model for intergranular pressure solution in open systems. Tectonophysics 1995, 245, 153–170. [Google Scholar] [CrossRef]
- Ostapenko, G.T. Excess pressure on the solid phases generated by hydration (according to experimental data on the hydration of periclase). Translated Geokhimikiya+ 1976, 6, 824–844. [Google Scholar]
- Kelemen, P.B.; Matter, J.; Streit, E.E.; Rudge, J.F.; Curry, W.B.; Blusztajn, J. Rates and mechanisms of mineral carbonation in peridotite: Natural processes and recipes for enhanced, in situ CO2 capture and storage. Annu. Rev. Earth Planet. Sci. 2011, 39, 545–576. [Google Scholar] [CrossRef]
- Kelemen, P.B.; Hirth, G. Reaction-driven cracking during retrograde metamorphism: Olivine hydration and carbonation. Earth Planet. Sci. Lett. 2012, 345, 81–89. [Google Scholar] [CrossRef]
- Span, R.; Wagner, W. A new equation of state for carbon dioxide covering the fluid region from the triple-point temperature to 1100 K at pressures up to 800 MPa. J. Phys. Chem. Ref. Data 1996, 25, 1509–1596. [Google Scholar] [CrossRef]
- Correns, C.W. Growth and dissolution of crystals under linear pressure. Discuss. Faraday Soc. 1949, 5, 267–271. [Google Scholar] [CrossRef]
- Scherer, G.W. Crystallization in pores. Cem. Concr. Res. 1999, 29, 1347–1358. [Google Scholar] [CrossRef]
- Van Noort, R.; Spiers, C.J.; Drury, M.R.; Kandianis, M.T. Peridotite dissolution and carbonation rates at fracture surfaces under conditions relevant for in situ mineralization of CO2. Geochim. Cosmochim. Acta 2013, 106, 1–24. [Google Scholar] [CrossRef]
- Westrich, H.R.; Cygan, R.T.; Casey, W.H.; Zemitis, C.; Arnold, G.W. The dissolution kinetics of mixed-cation orthosilicate minerals. Am. J. Sci. 1993, 293, 869–893. [Google Scholar] [CrossRef]
- Correns, C.W.; Steinborn, W. Experimente zur Messung und Erklärung der sogenannten Kristallisationskraft. Zeitschrift für Kristallographie—Cryst. Mater. 1939, 101, 117–133. [Google Scholar] [CrossRef]
- Putnis, A.; Janssen, A.; Jamtveit, B.; Putnis, C.V. Reaction-induced fracturing during replacement reactions. Geochim. Cosmochim. Acta 2009, 73, 1061. [Google Scholar]
- Rudge, J.F.; Kelemen, P.B.; Spiegelman, M. A simple model of reaction-induced cracking applied to serpentinization and carbonation of peridotite. Earth Planet. Sci. Lett. 2010, 291, 215–227. [Google Scholar] [CrossRef]
- Plumper, O.; Royne, A.; Magraso, A.; Jamtveit, B. The interface-scale mechanism of reaction-induced fracturing during serptentinization. Geology 2012, 40, 1103–1106. [Google Scholar] [CrossRef]
- Van Noort, R.; Visser, H.J.M.; Spiers, C.J. Influence of grain boundary structure on dissolution controlled pressure solution and retarding effects of grain boundary healing. J. Geophys. Res. 2008, 113, B03201. [Google Scholar] [CrossRef]
- Olsen, A.A. Forsterite Dissolution Kinetics: Applications and Implications for Chemical Weathering; Virginia Polytechnic Institute and State University: Blacksburg, VA, USA, 2007. [Google Scholar]
- Gratier, J.-P.; Frery, E.; Deschamps, P.; Røyne, A.; Renard, F.; Dysthe, D.; Ellouz-Zimmerman, N.; Hamelin, B. How travertine veins grow from top to bottom and lift the rocks above them: The effect of crystallization force. Geology 2012, 40, 1015–1018. [Google Scholar] [CrossRef]
- Hickman, S.H.; Evans, B. Kinetics of pressure solution at halite silica interfaces and intergranular clay films. J. Geophys. Res. 1995, 100, 13113–13132. [Google Scholar] [CrossRef]
- Visser, H.J.M. Mass Transfer Processes in Crystalline Aggregates Containing a Fluid Phase; Utrecht University: Utrecht, The Netherlands, 1999. [Google Scholar]
- Zubtsov, S.; Renard, F.; Gratier, J.-P.; Guiguet, R.; Dysthe, D.K.; Traskine, V. Experimental pressure solution compaction of synthetic halite/calcite aggregates. Tectonophysics 2004, 385, 45–57. [Google Scholar] [CrossRef] [Green Version]
- Van Noort, R.; Spiers, C.; Peach, C. Effects of orientation on the diffusive properties of fluid-filled grain boundaries during pressure solution. Phys. Chem. Miner. 2007, 34, 95–112. [Google Scholar] [CrossRef]
- Skelton, A.; Whitmarsh, R.; Arghe, F.; Crill, P.; Koyi, H. Constraining the rate and extent of mantle serpentinization from seismic and petrological data: Implications for chemosynthesis and tectonic processes. Geofluids 2005, 5, 153–164. [Google Scholar] [CrossRef]
- Matter, J.M.; Stute, M.; Snæbjörnsdottir, S.Ó.; Oelkers, E.H.; Gislason, S.R.; Aradottir, E.S.; Sigfusson, B.; Gunnarsson, I.; Sigurdardottir, H.; Gunnlaugsson, E.; et al. Rapid carbon mineralization for permanent disposal of anthropogenic carbon dioxide emissions. Science 2016, 352, 1312–1314. [Google Scholar] [CrossRef] [PubMed]
Figure 1.
(a) Shear failure data for various ultramafic and mafic rocks with representative curves and a failure envelope based on Byerlee’s law (with μ = 0.85 and S0 = 0 at low confining pressure, and μ = 0.6 and S0 = 50 MPa at higher confining pressure) (figure from [32]), plus shear failure data for (antigorite-chrysotile) serpentinites (from [33]). (b) Shear failure data for various ultramafic rocks presented by [28]. Data reported for Horoman Dunite (HD), Balsam Gap Dunite (BD), Kükes Dunite, oceanic serpentinite (OS), and Spruce Pine Dunite (SD). L and C are the serpentine phases Lizardite and Chrysotile, ? is an unreported phase (figure from [28]).
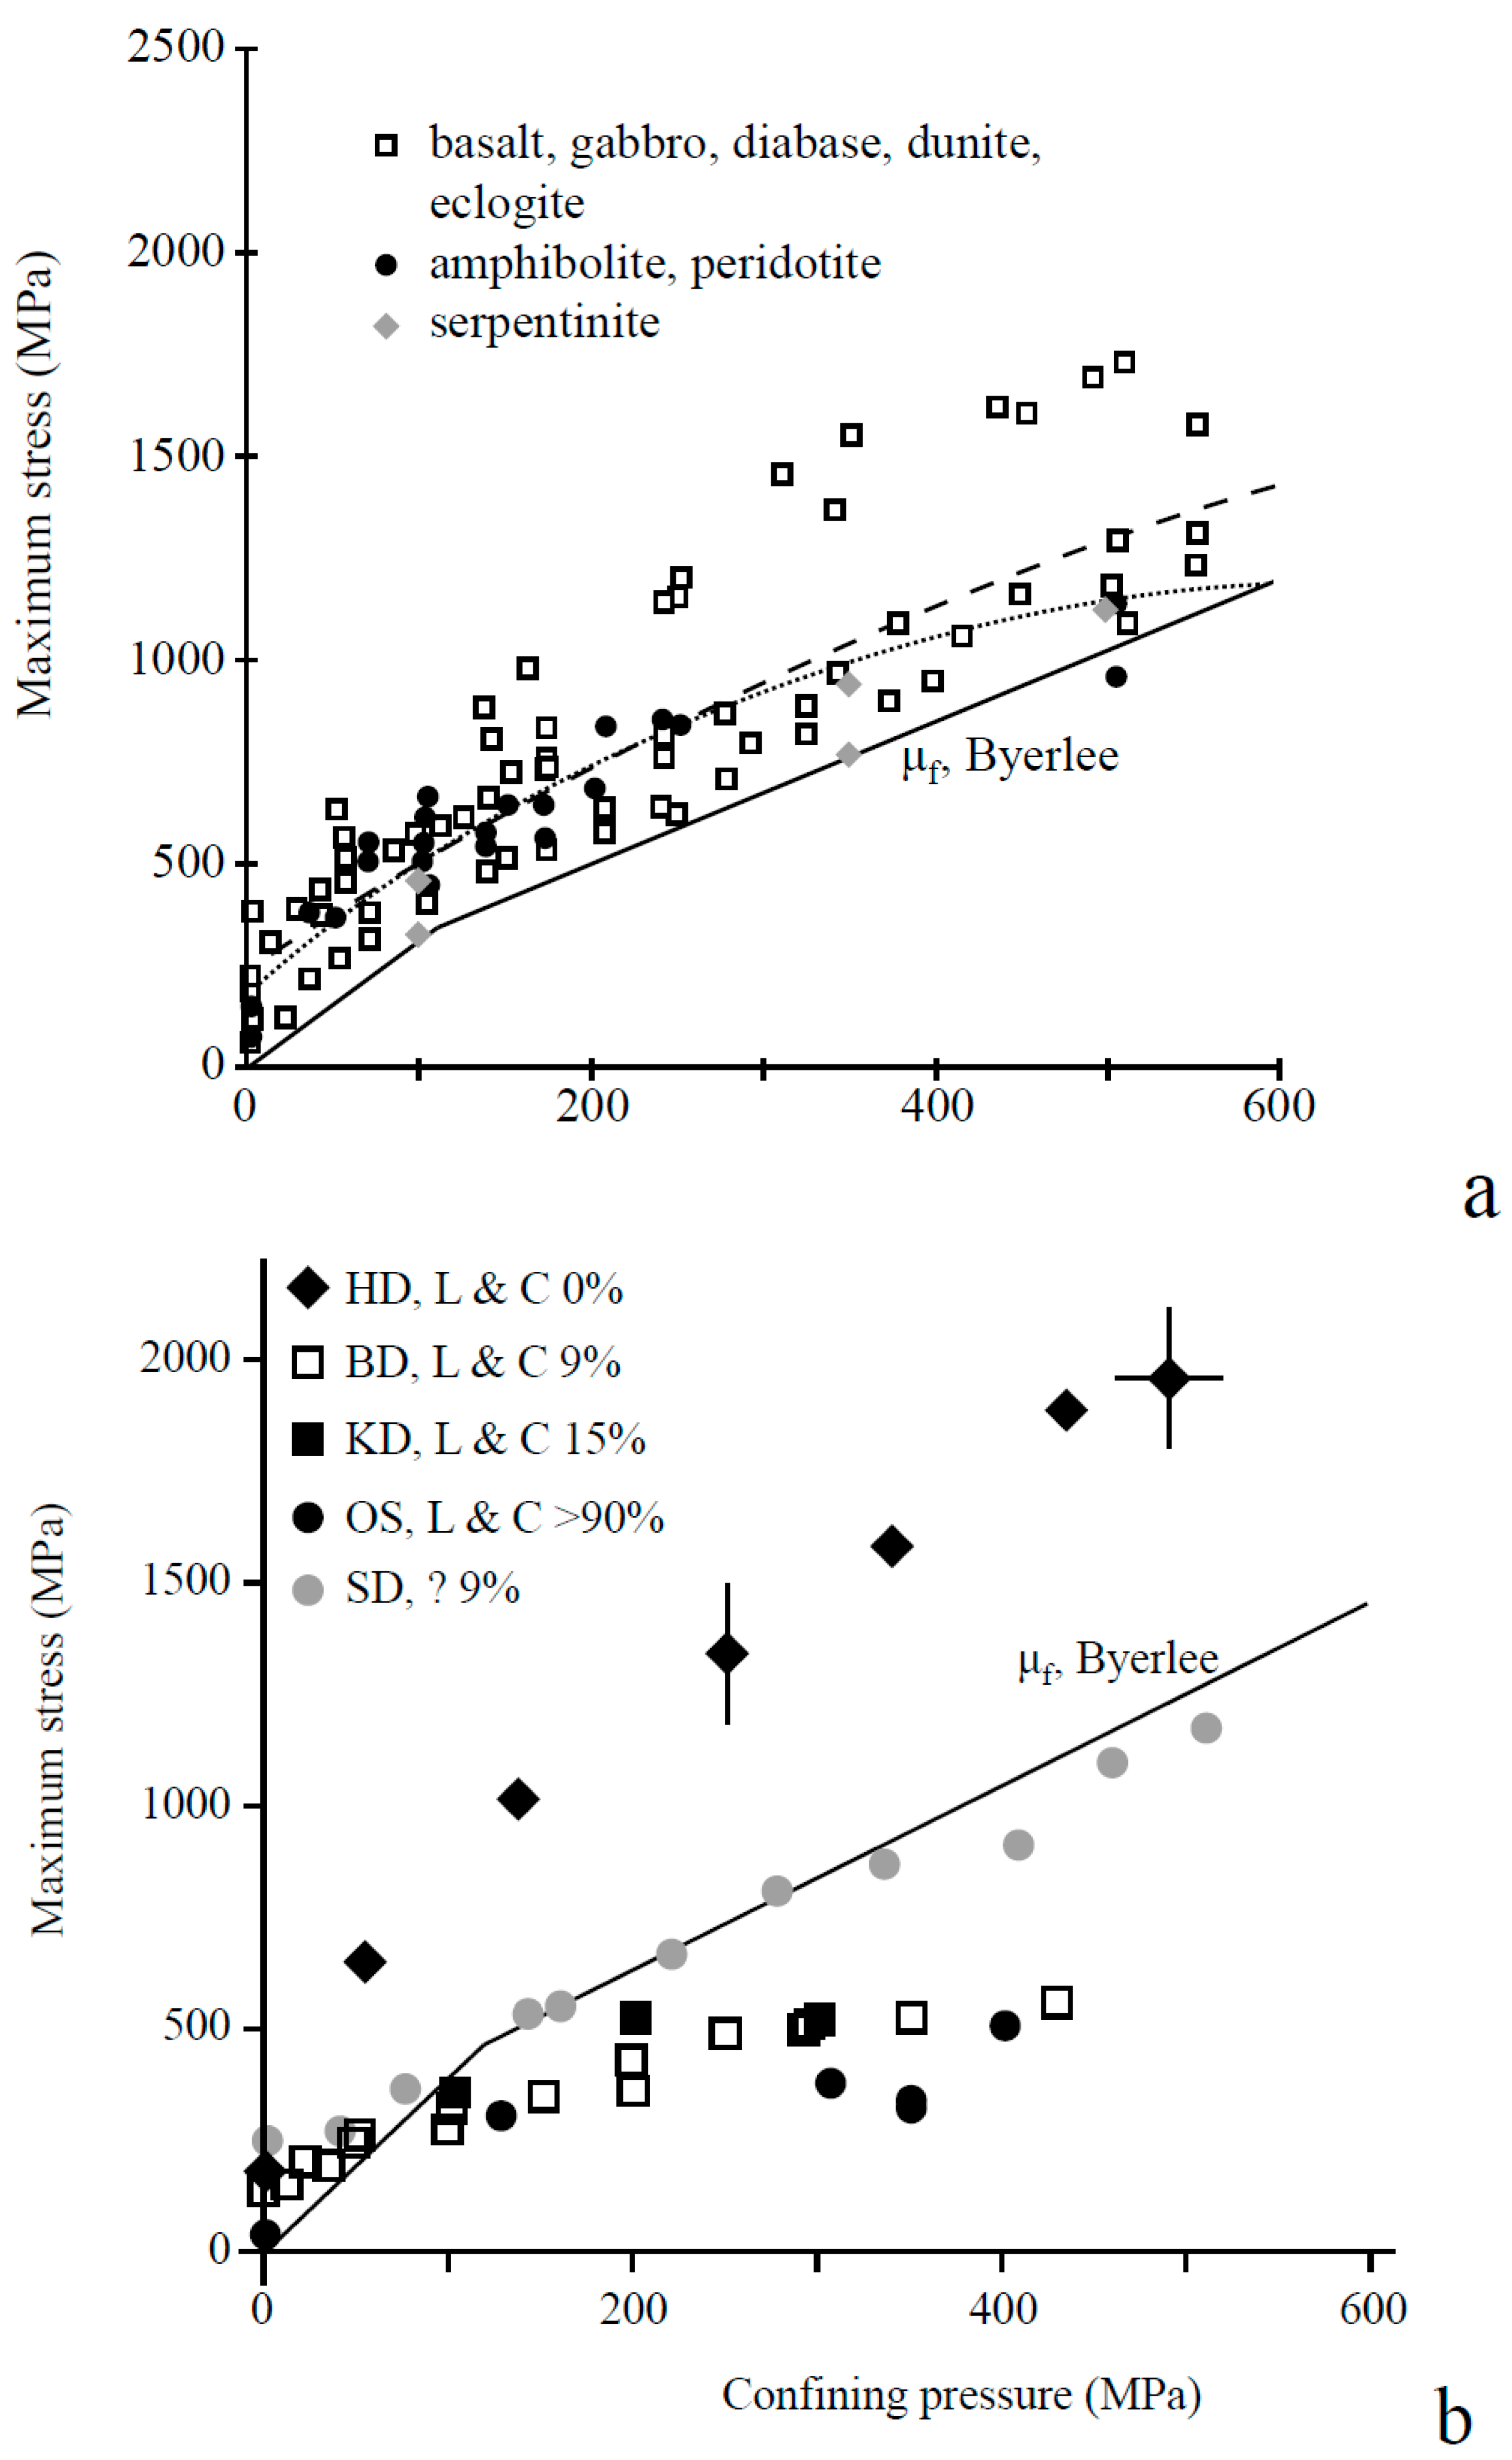
Figure 2.
A simple schematic representation of the setup used in the force of crystallization experiments. (a) The entire apparatus in general, with the titanium liner as used in the initial experiments. (b) The titanium liner, piston and sample assembly as used in experiments R0805–R0808. (c) The titanium liner, piston and sample assembly as used in experiments R0809–R0815. In experiment R0816 a different lower piston, with a fluid inlet, was used. Note that the apparatus is not drawn precisely to scale. The width of the inner piston is 10 mm. The outer width of the titanium liner is 19 mm.
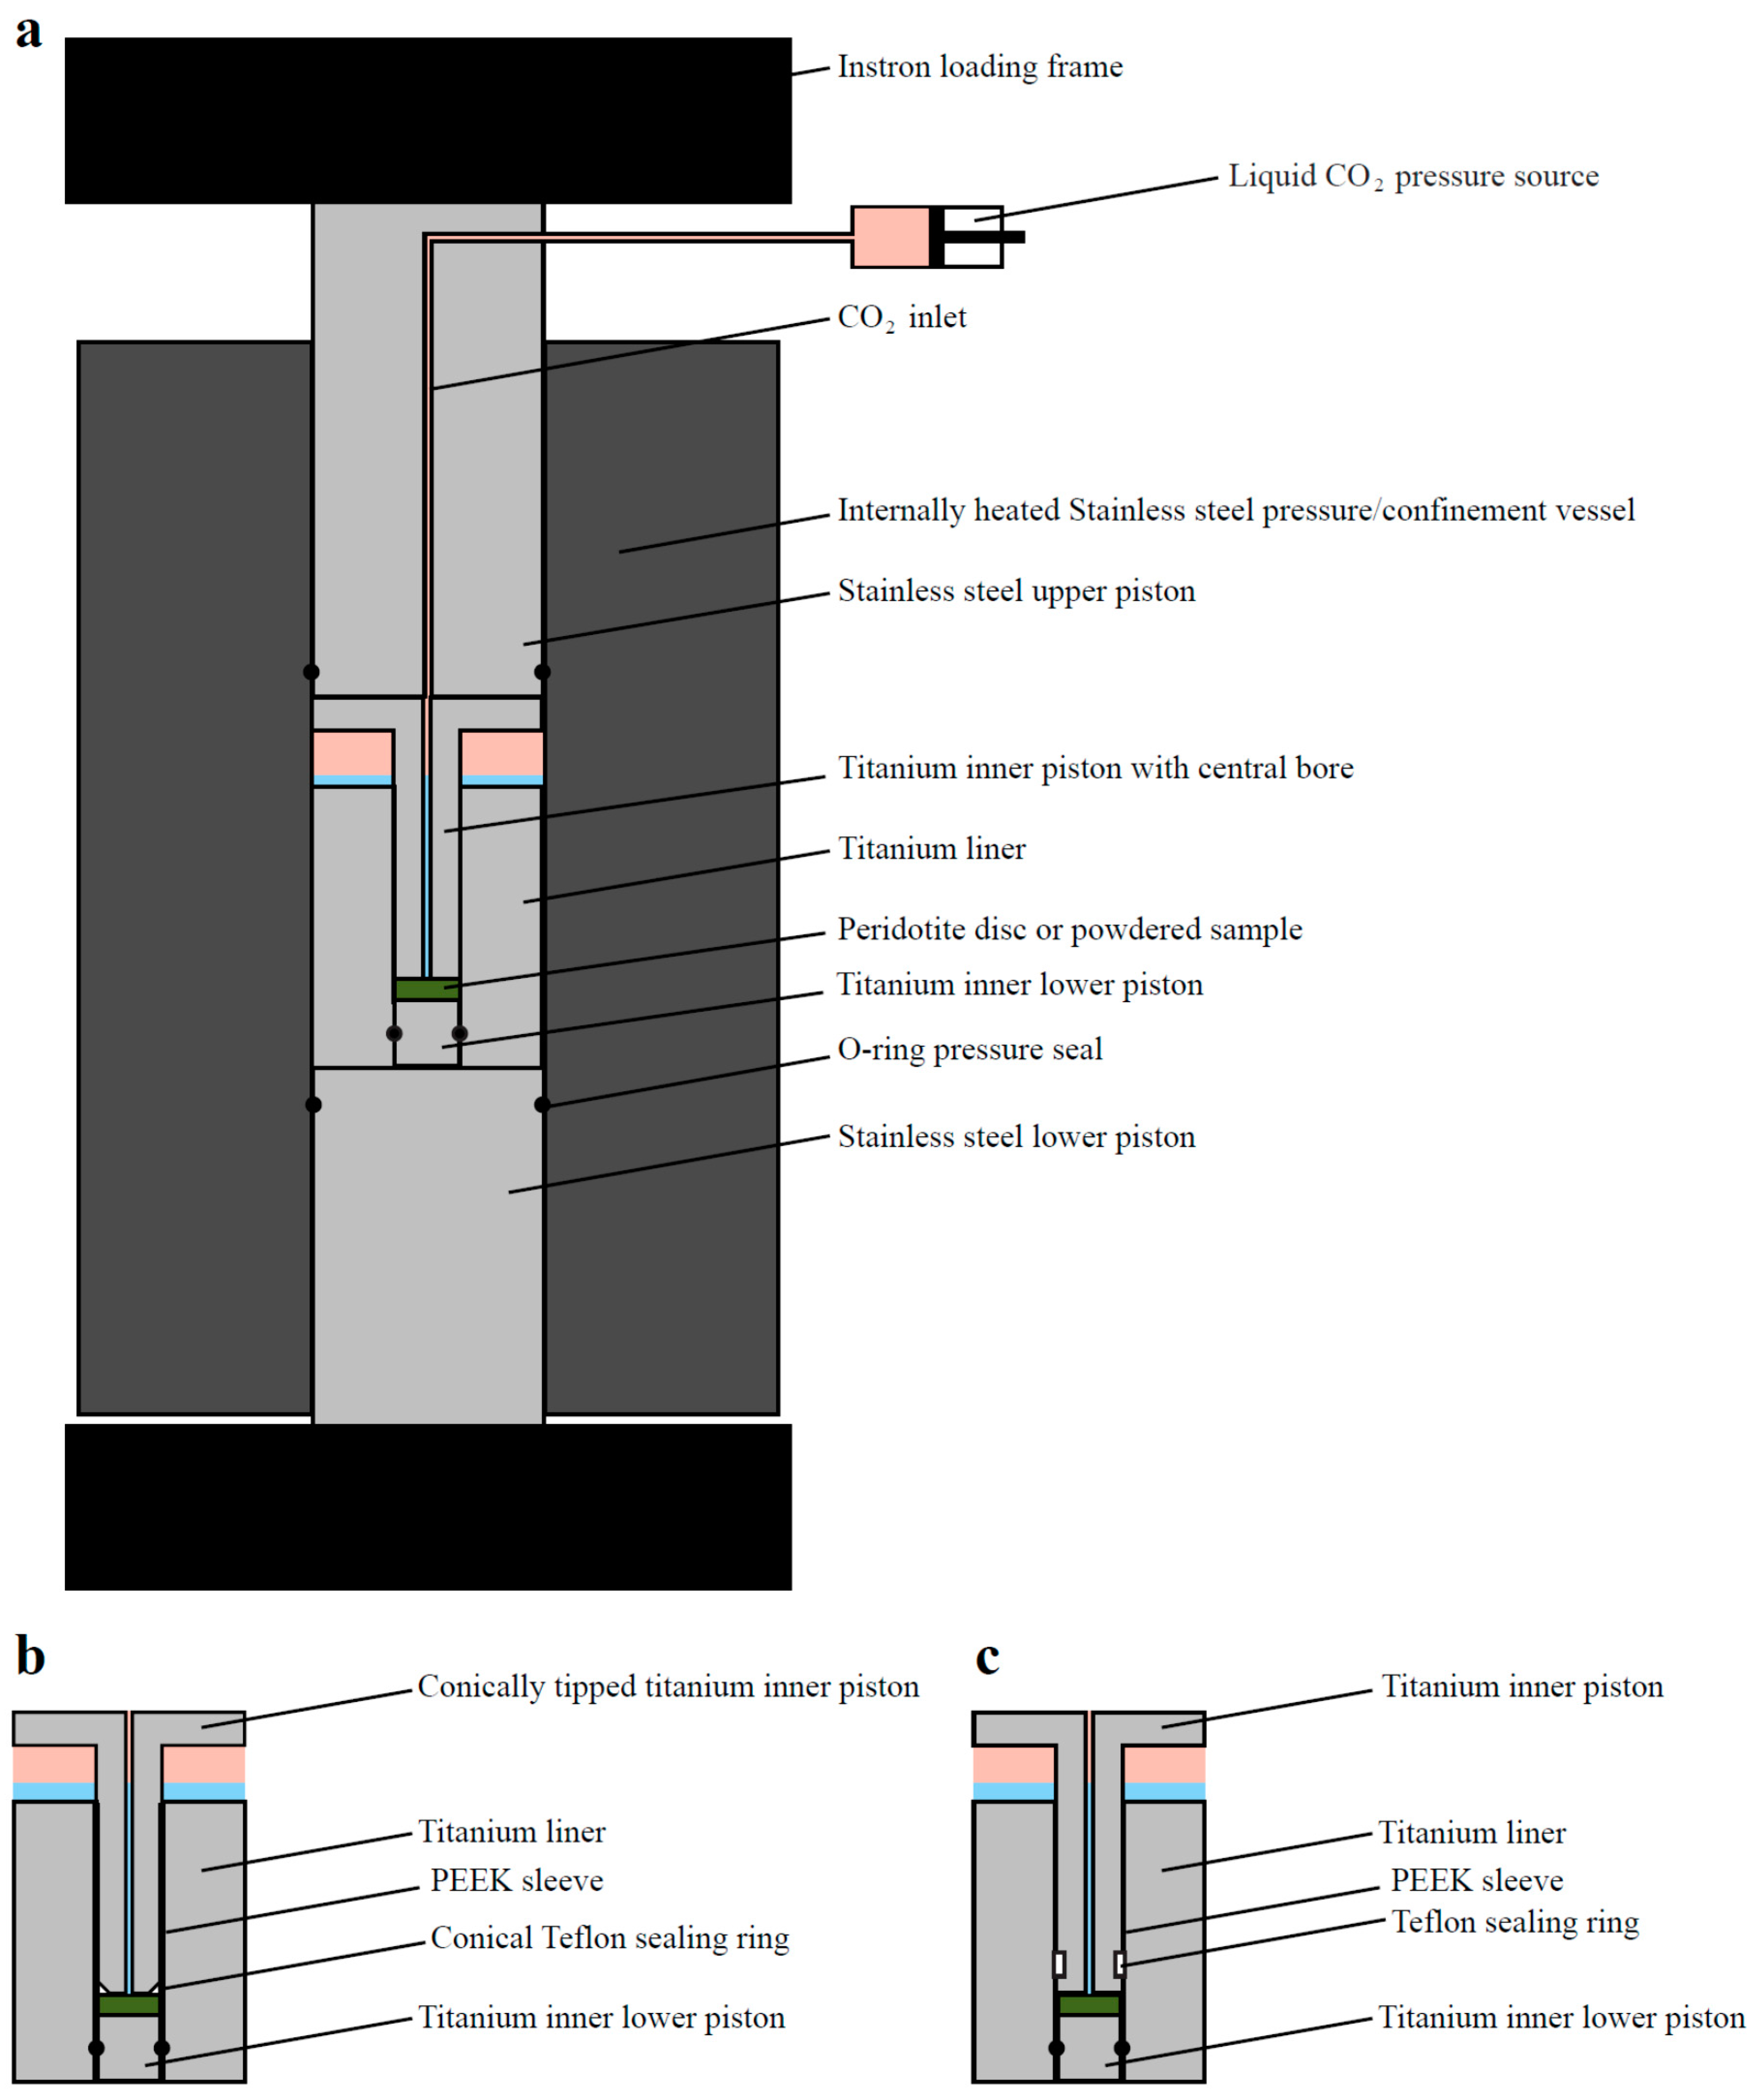
Figure 3.
The change in stress on sample R0803 vs. time, after correction for changes in CO2-pressure.
Figure 3.
The change in stress on sample R0803 vs. time, after correction for changes in CO2-pressure.

Figure 4.
Microprobe (a) and SEM (b,c) images of reacted powder sample R0801. All images show a framework of olivine grains, with magnesite precipitating as very small grains and rough grain aggregates in the free pore space and on the olivine grain surfaces. In (a), notice the dissolution of olivine behind the precipitated layer of magnesite and silica (lighter areas in the precipitated layer) on the olivine grain surface, suggesting that dissolution continued after this layer was precipitated on the original grain surface. Images (b,c) show representative microstructures from the top and the bottom of the sample respectively, illustrating that magnesite precipitation was more prevalent at the top of the sample, leading to a much lower sample porosity there.

Figure 5.
(a) Polished section SEM BSE micrograph showing a typical microstructure for reacted powder sample R0810. Note the very low porosity of the magnesite cement phase closely surrounding the olivine grains. (b) Fractured surface micrograph of sample R0810, showing very fine-grained magnesite precipitation probably formed along a grain surface.

Figure 6.
Polished section SEM micrograph showing a typical microstructure for reacted powder sample R0812. A (magnesite) cement phase closely surrounds the (relatively fine) olivine grains, resulting in a very low sample porosity.
Figure 6.
Polished section SEM micrograph showing a typical microstructure for reacted powder sample R0812. A (magnesite) cement phase closely surrounds the (relatively fine) olivine grains, resulting in a very low sample porosity.

Figure 7.
Polished section SEM micrograph showing a typical microstructure for reacted powder sample R0813. Note again the very low sample porosity with a cement phase closely surrounding the olivine grains. Due to sample preparation, R0813 contained some pre-existing cracks which during the experiment were filled with magnesite (dark gray). Open cracks in the sample were caused by removing the sample from the titanium vessel. The larger gray areas in the sample are grains of (hydro-)magnesite that were added to the starting material.
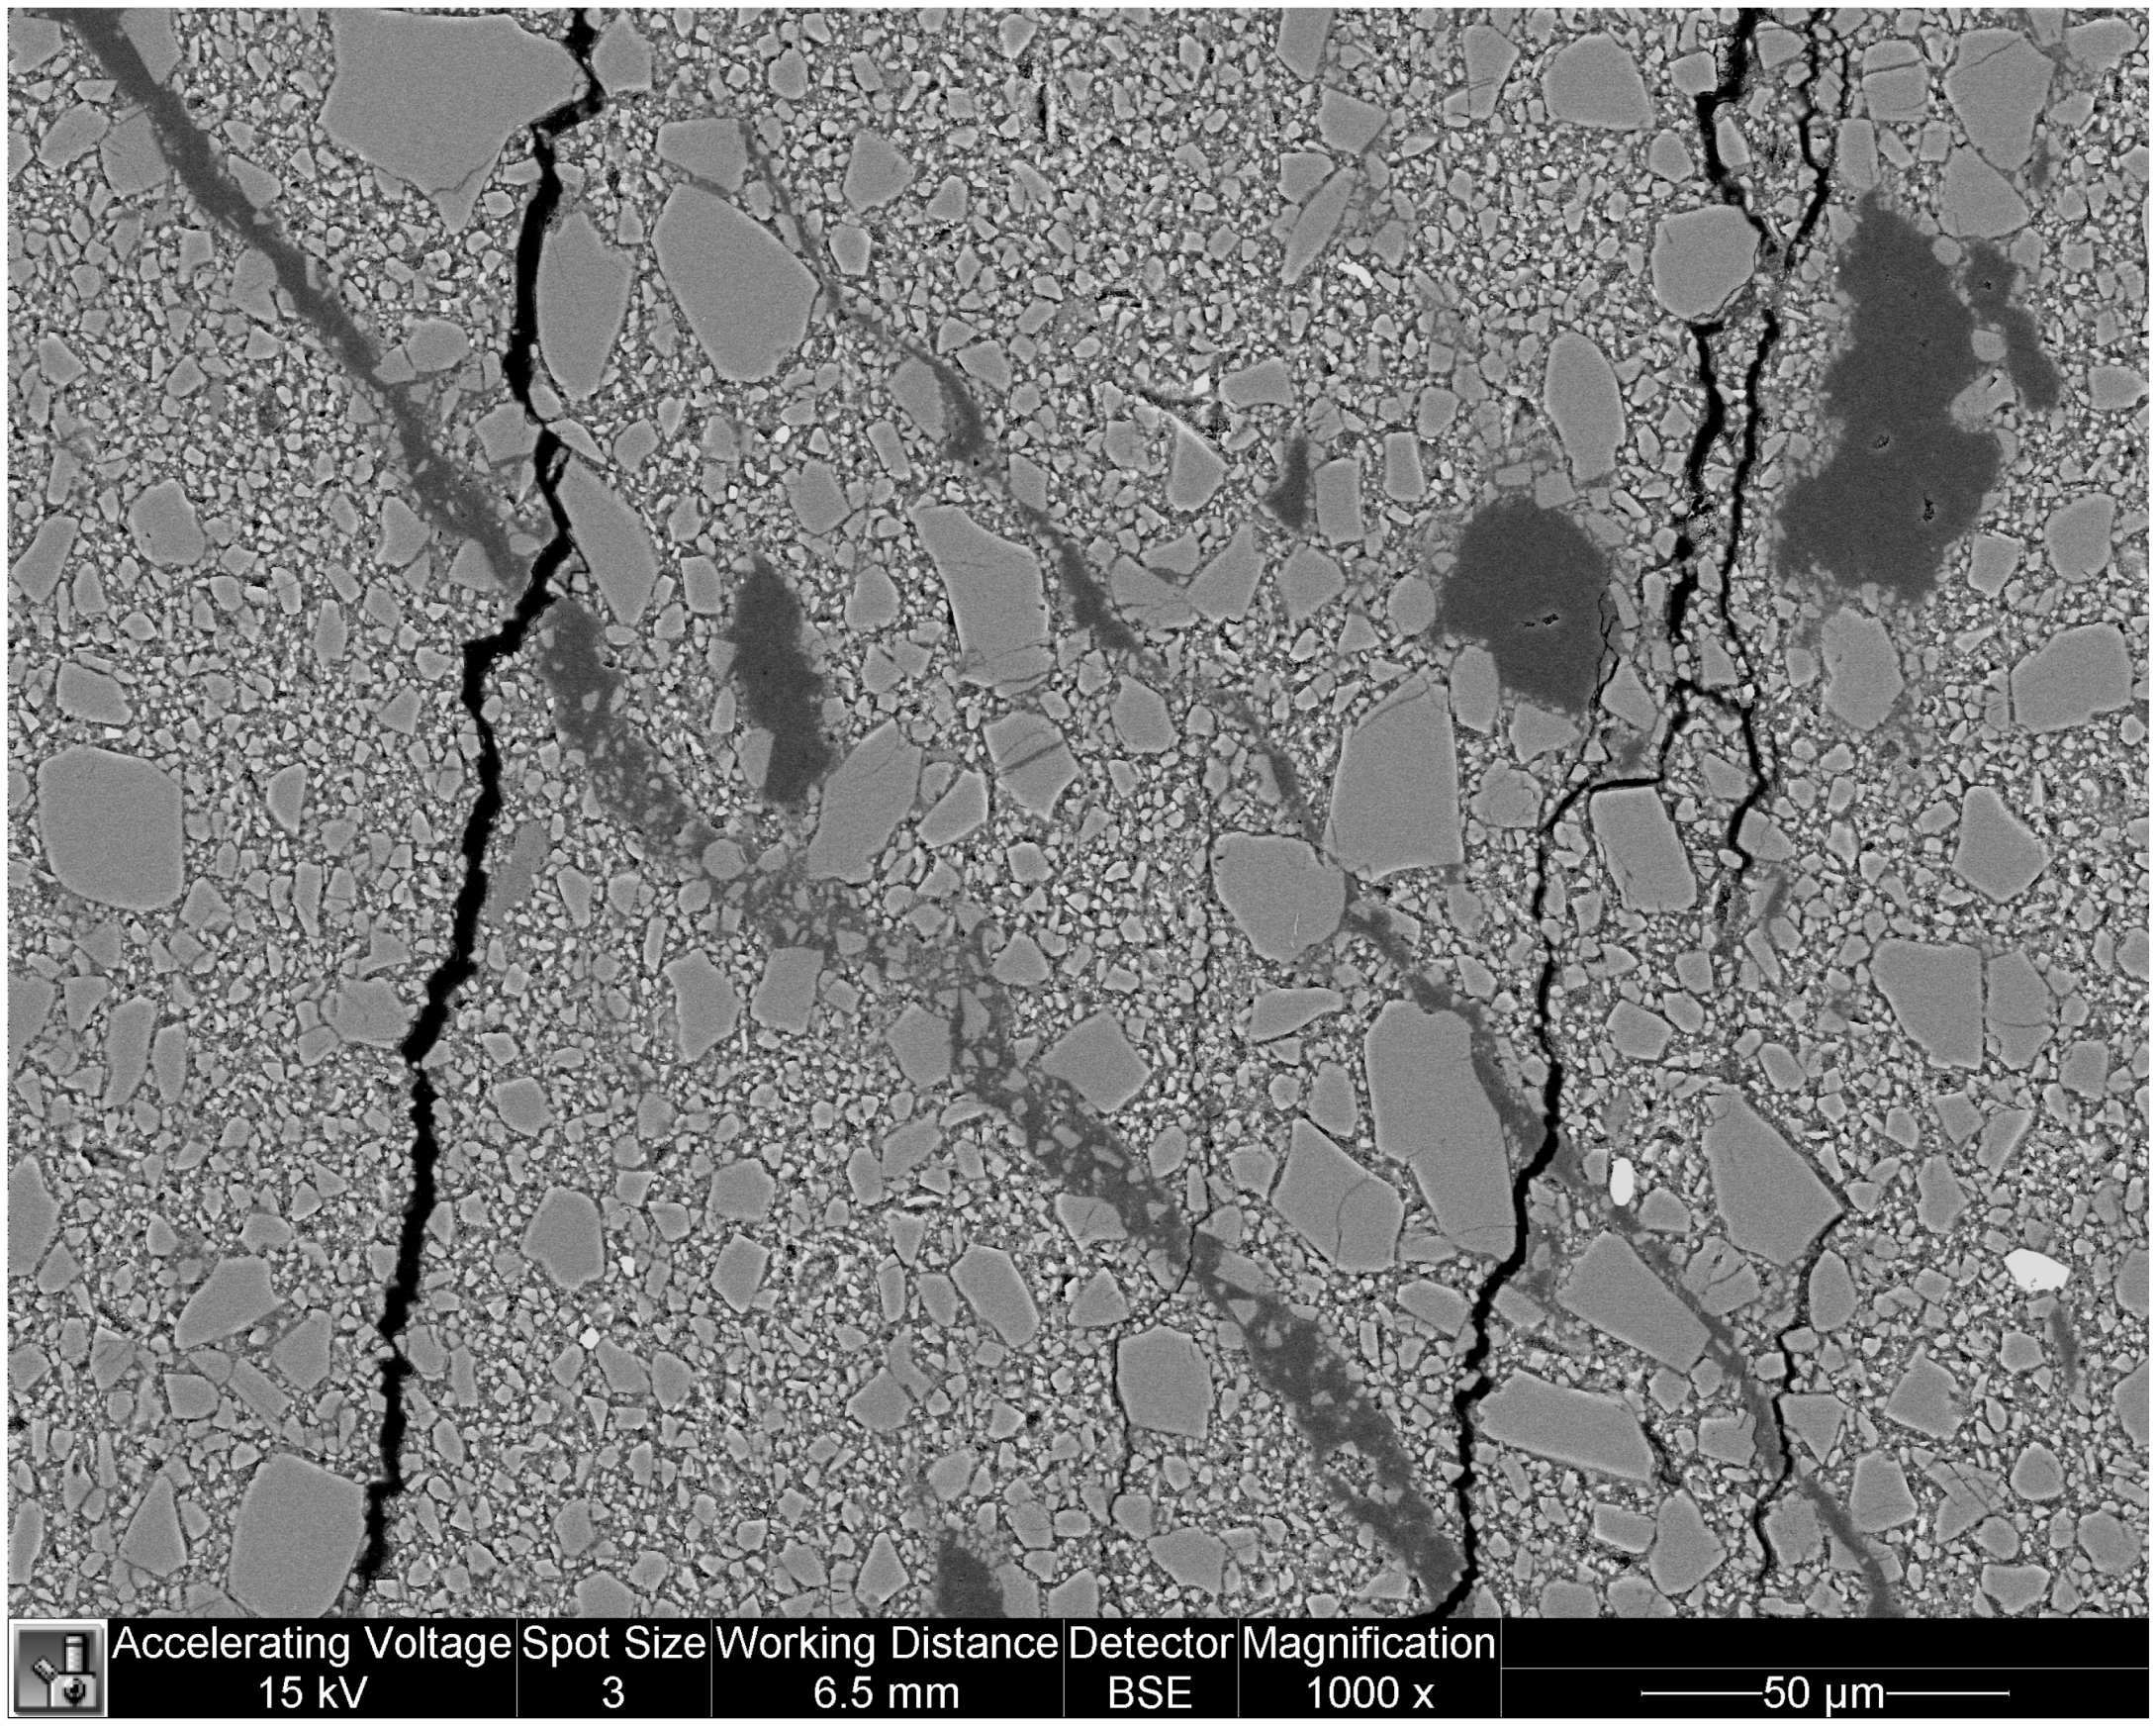
Figure 8.
(a,b) SEM BSE micrographs of a polished section through the reacted powder layer of sample R0817. Note the very low porosity of the magnesite cement phase closely surrounding the olivine grains. In (b), also note the silica-enriched layer near the dissolving olivine surface (center of image). (c–e) Fractured surface micrographs of sample R0817. (c,d) Silica micro-grains forming sheets along olivine grain surfaces. In (c), also note the ~5 μm cubic magnesite crystals. (e) Growing magnesite crystals ~5 μm in size, with some silica micro-spheres.
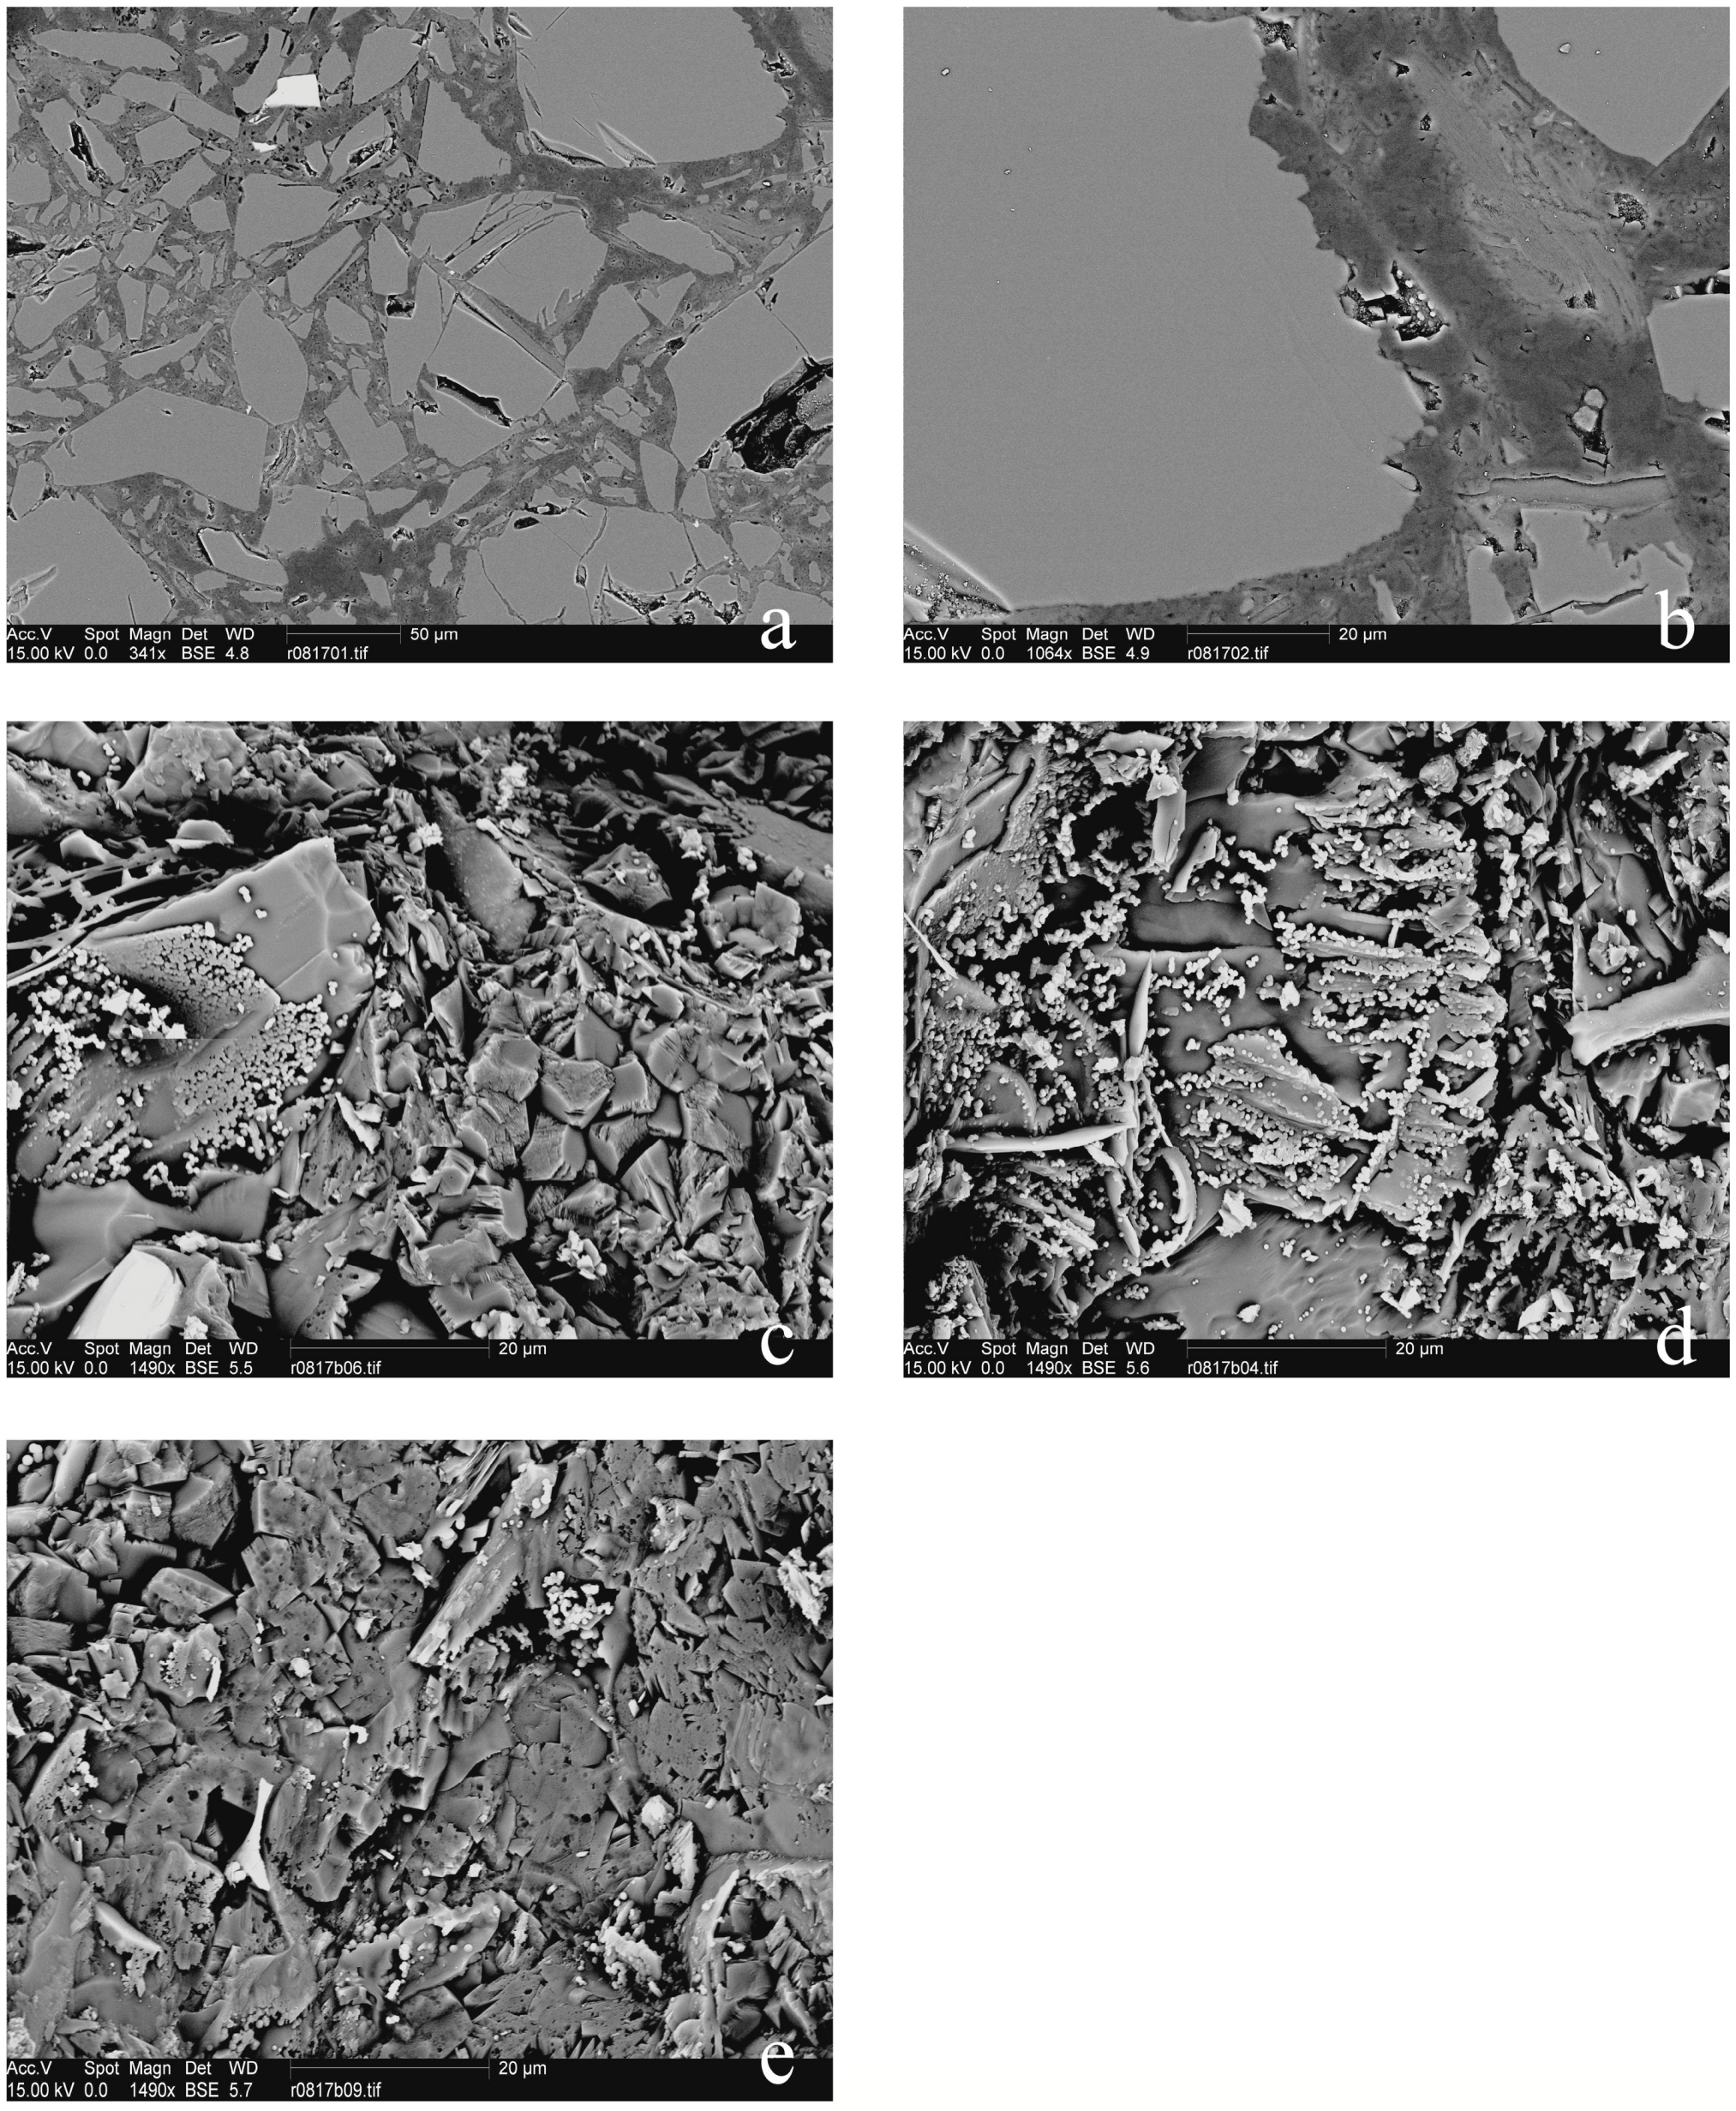
Figure 9.
(a–d) SEM micrographs of a polished thin section of reacted powder sample R0803, showing an overview (a) and close-up images (b–d) of the sample microstructure. Note the very low porosity of the magnesite cement phase closely surrounding the remaining olivine grains. In (d), note the the silica rim (light band) around a now-dissolved olivine grain. (e–h) Fractured surface micrographs. (e,f) Silica micro-grains forming sheets along olivine grain surfaces. (g) A cubic magnesite grain against a silica sheet. Note the (somewhat) open contact between the magnesite and the silica. (h) Magnesite grain boundaries.

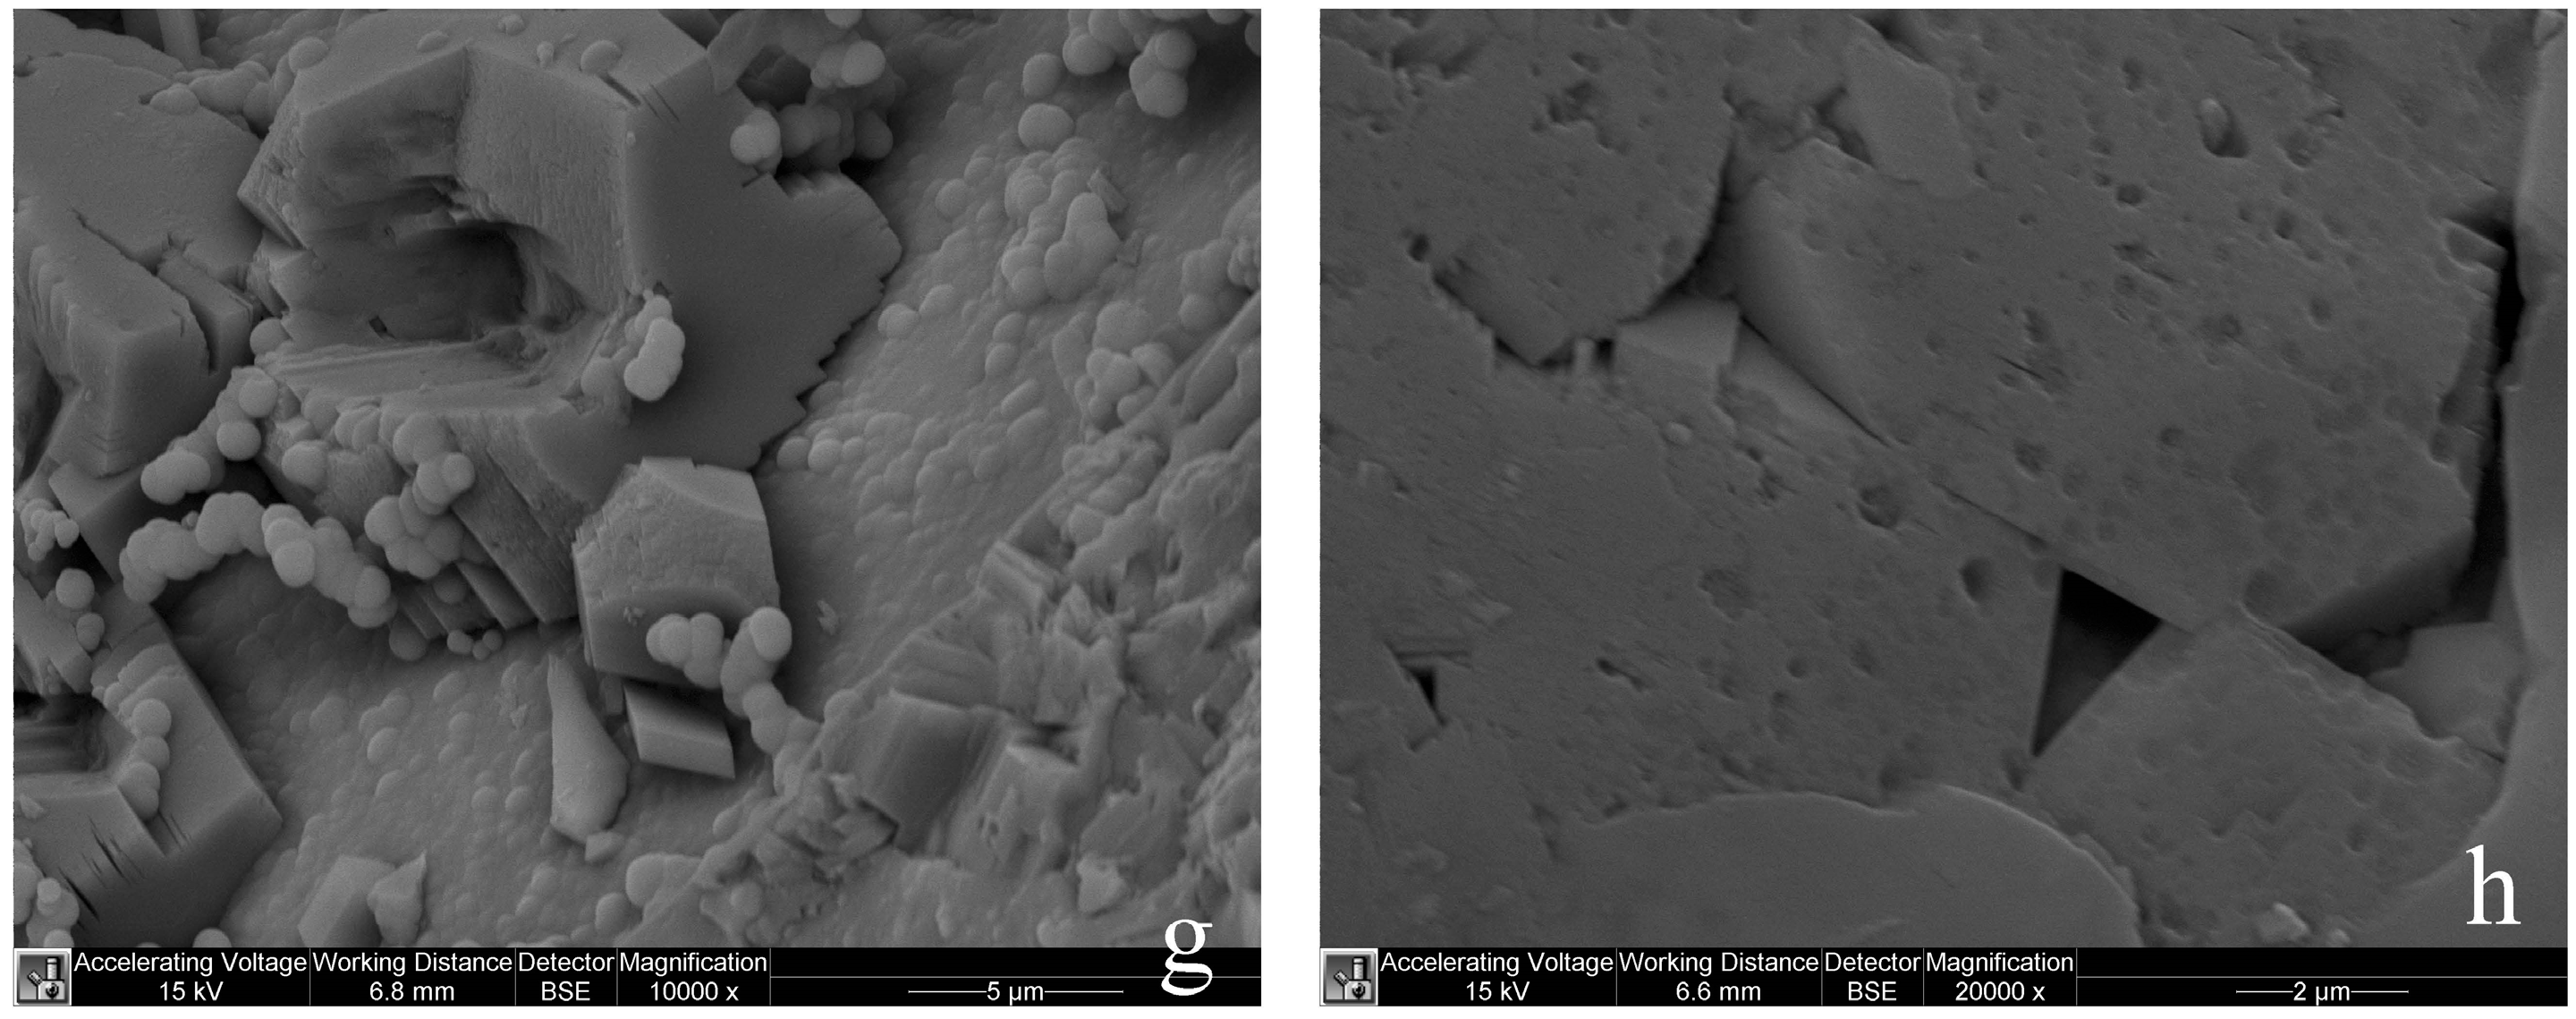
Figure 10.
Measured reaction-induced vertical stress resulting from the hydration of periclase (MgO) at 165 °C and 17 MPa fluid pressure. The stress given is the effective stress.
Figure 10.
Measured reaction-induced vertical stress resulting from the hydration of periclase (MgO) at 165 °C and 17 MPa fluid pressure. The stress given is the effective stress.
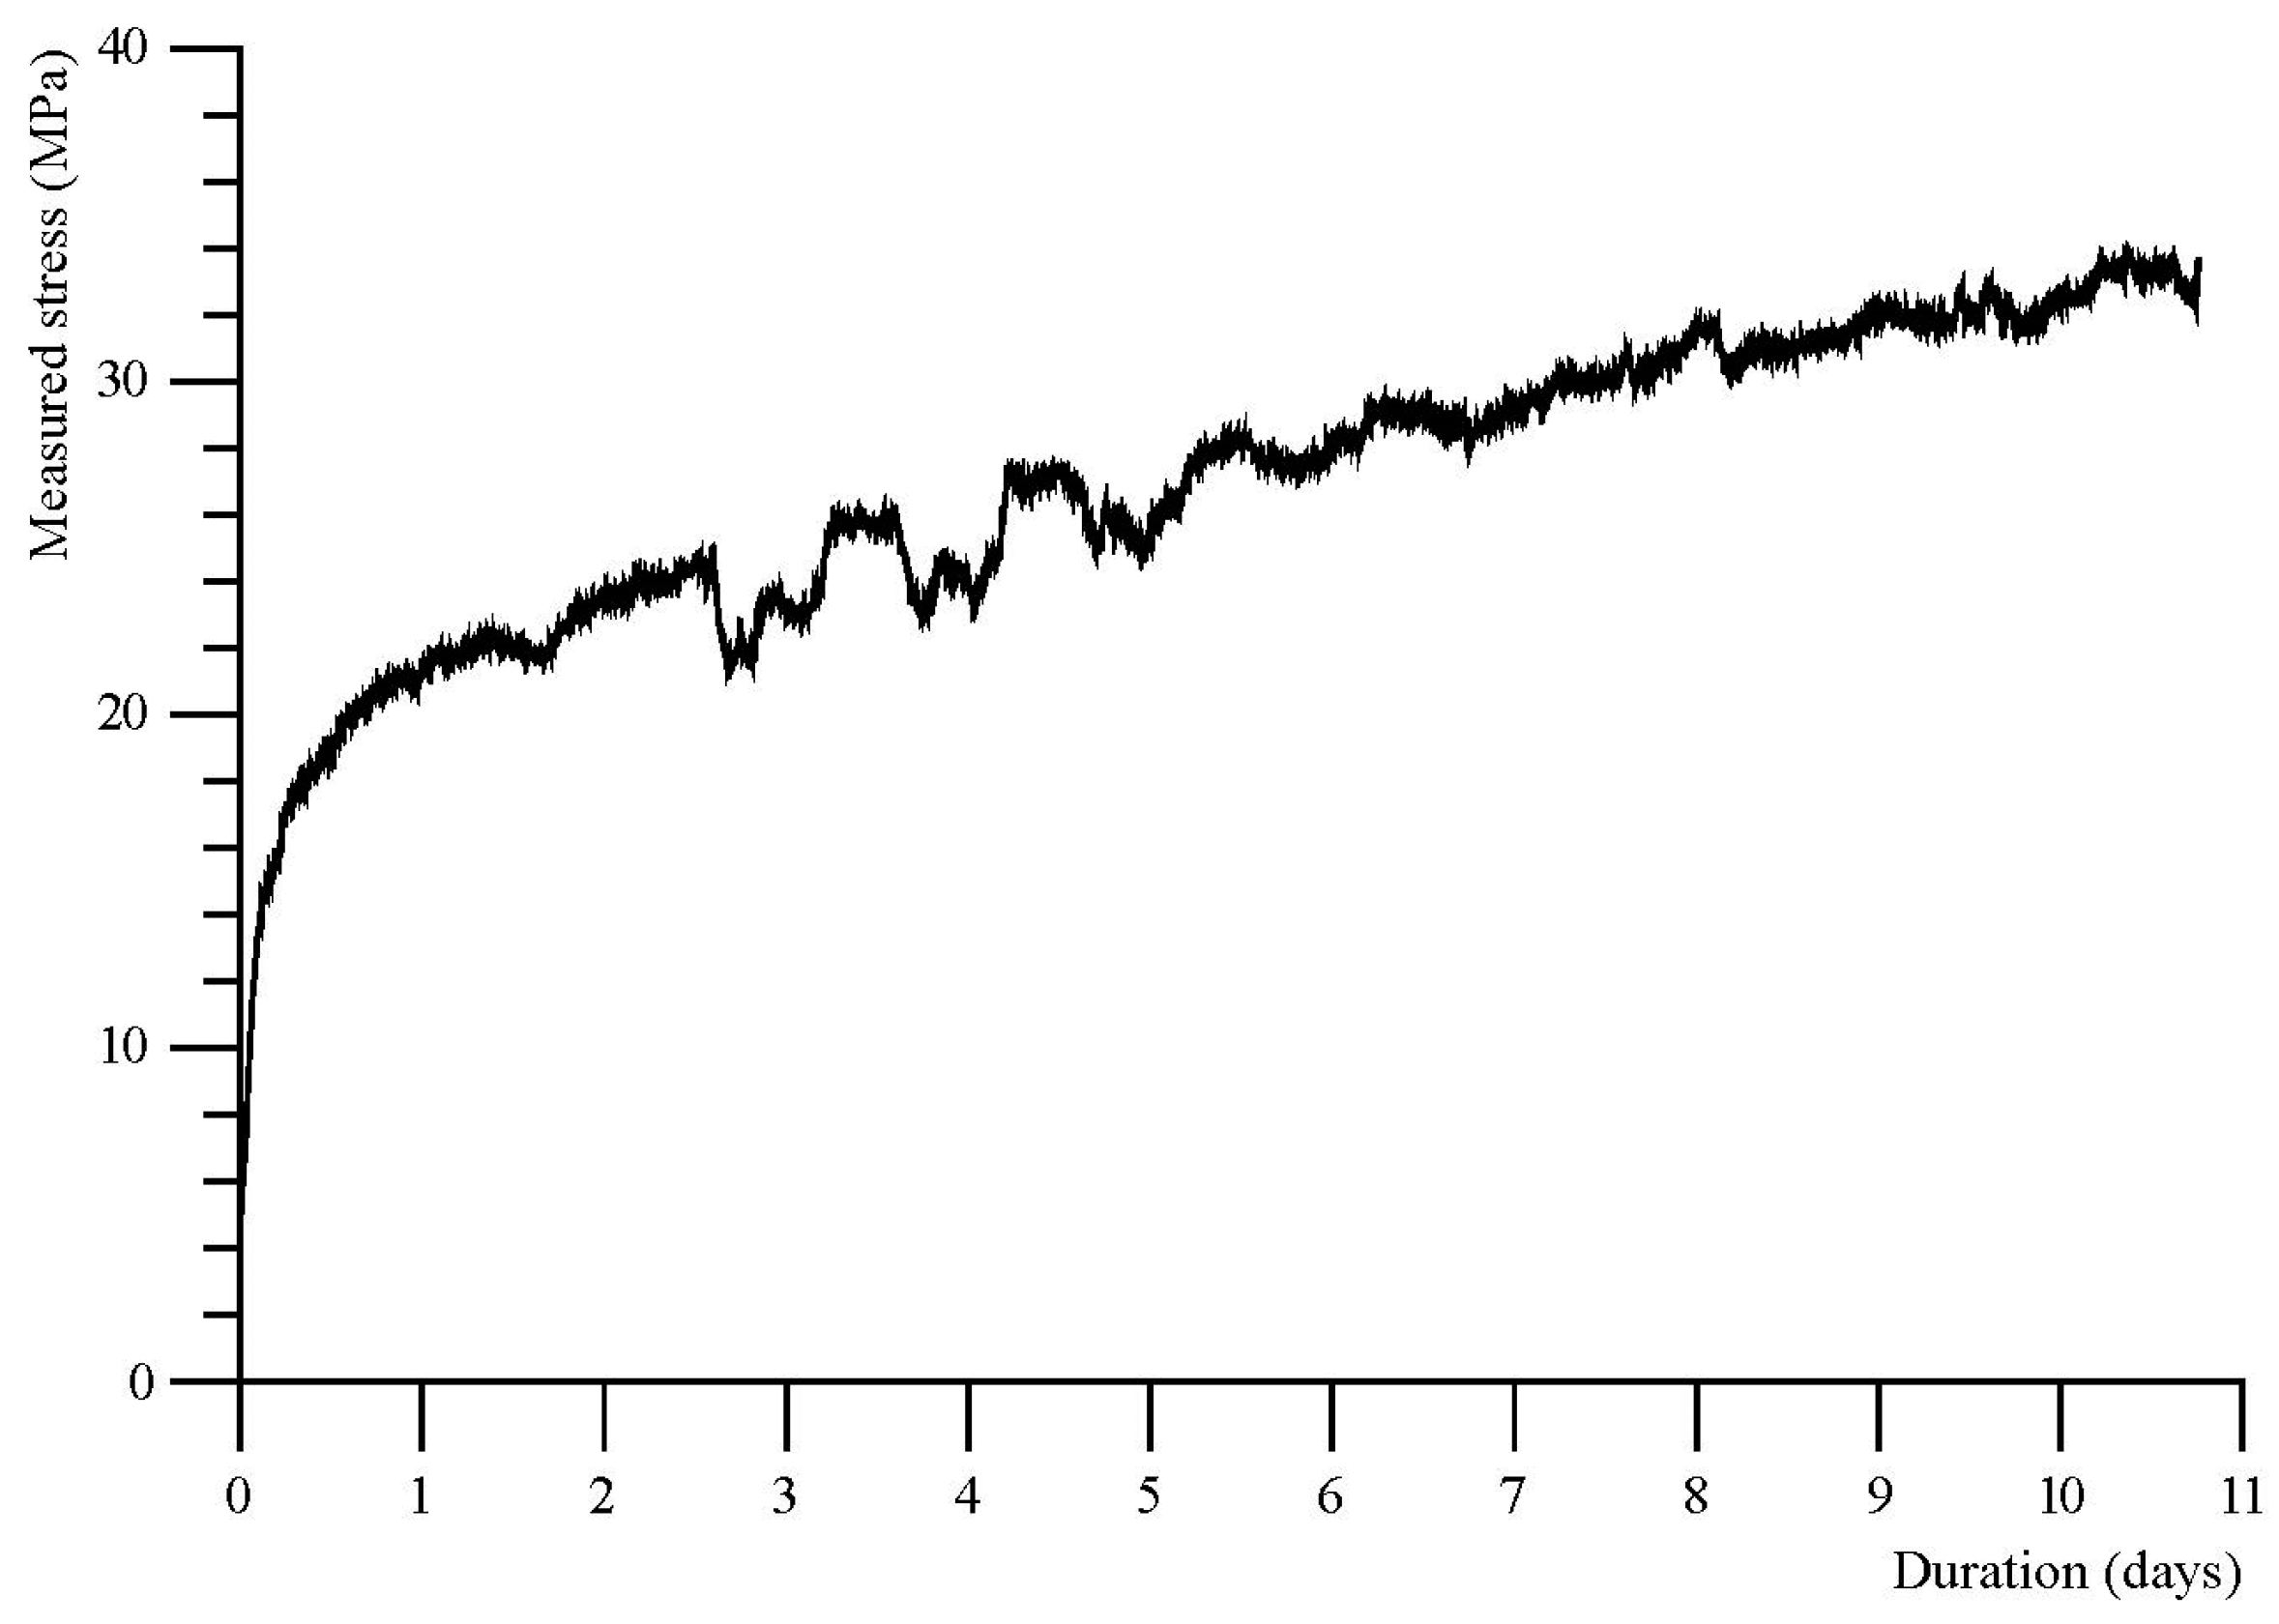
Figure 11.
Photomicrographs of R0901, an aggregate of MgO single crystals, after its hydration under hydrothermal conditions. Fluid interpenetration occurred from the top of the image. (a) Image taken under cross-polarized light, ~4 mm below the top surface of the sample. This image shows the typical hierarchical pattern of reaction fractures that formed in the sample, especially close to the fluid interpenetration front. Note the (thin) reacted rims (lighter colored) along the cracks. (b) Image taken under plane-polarized light, ~1 mm from the top surface of the sample. Note the ~200 μm wide reaction rims (light) along the fractures.


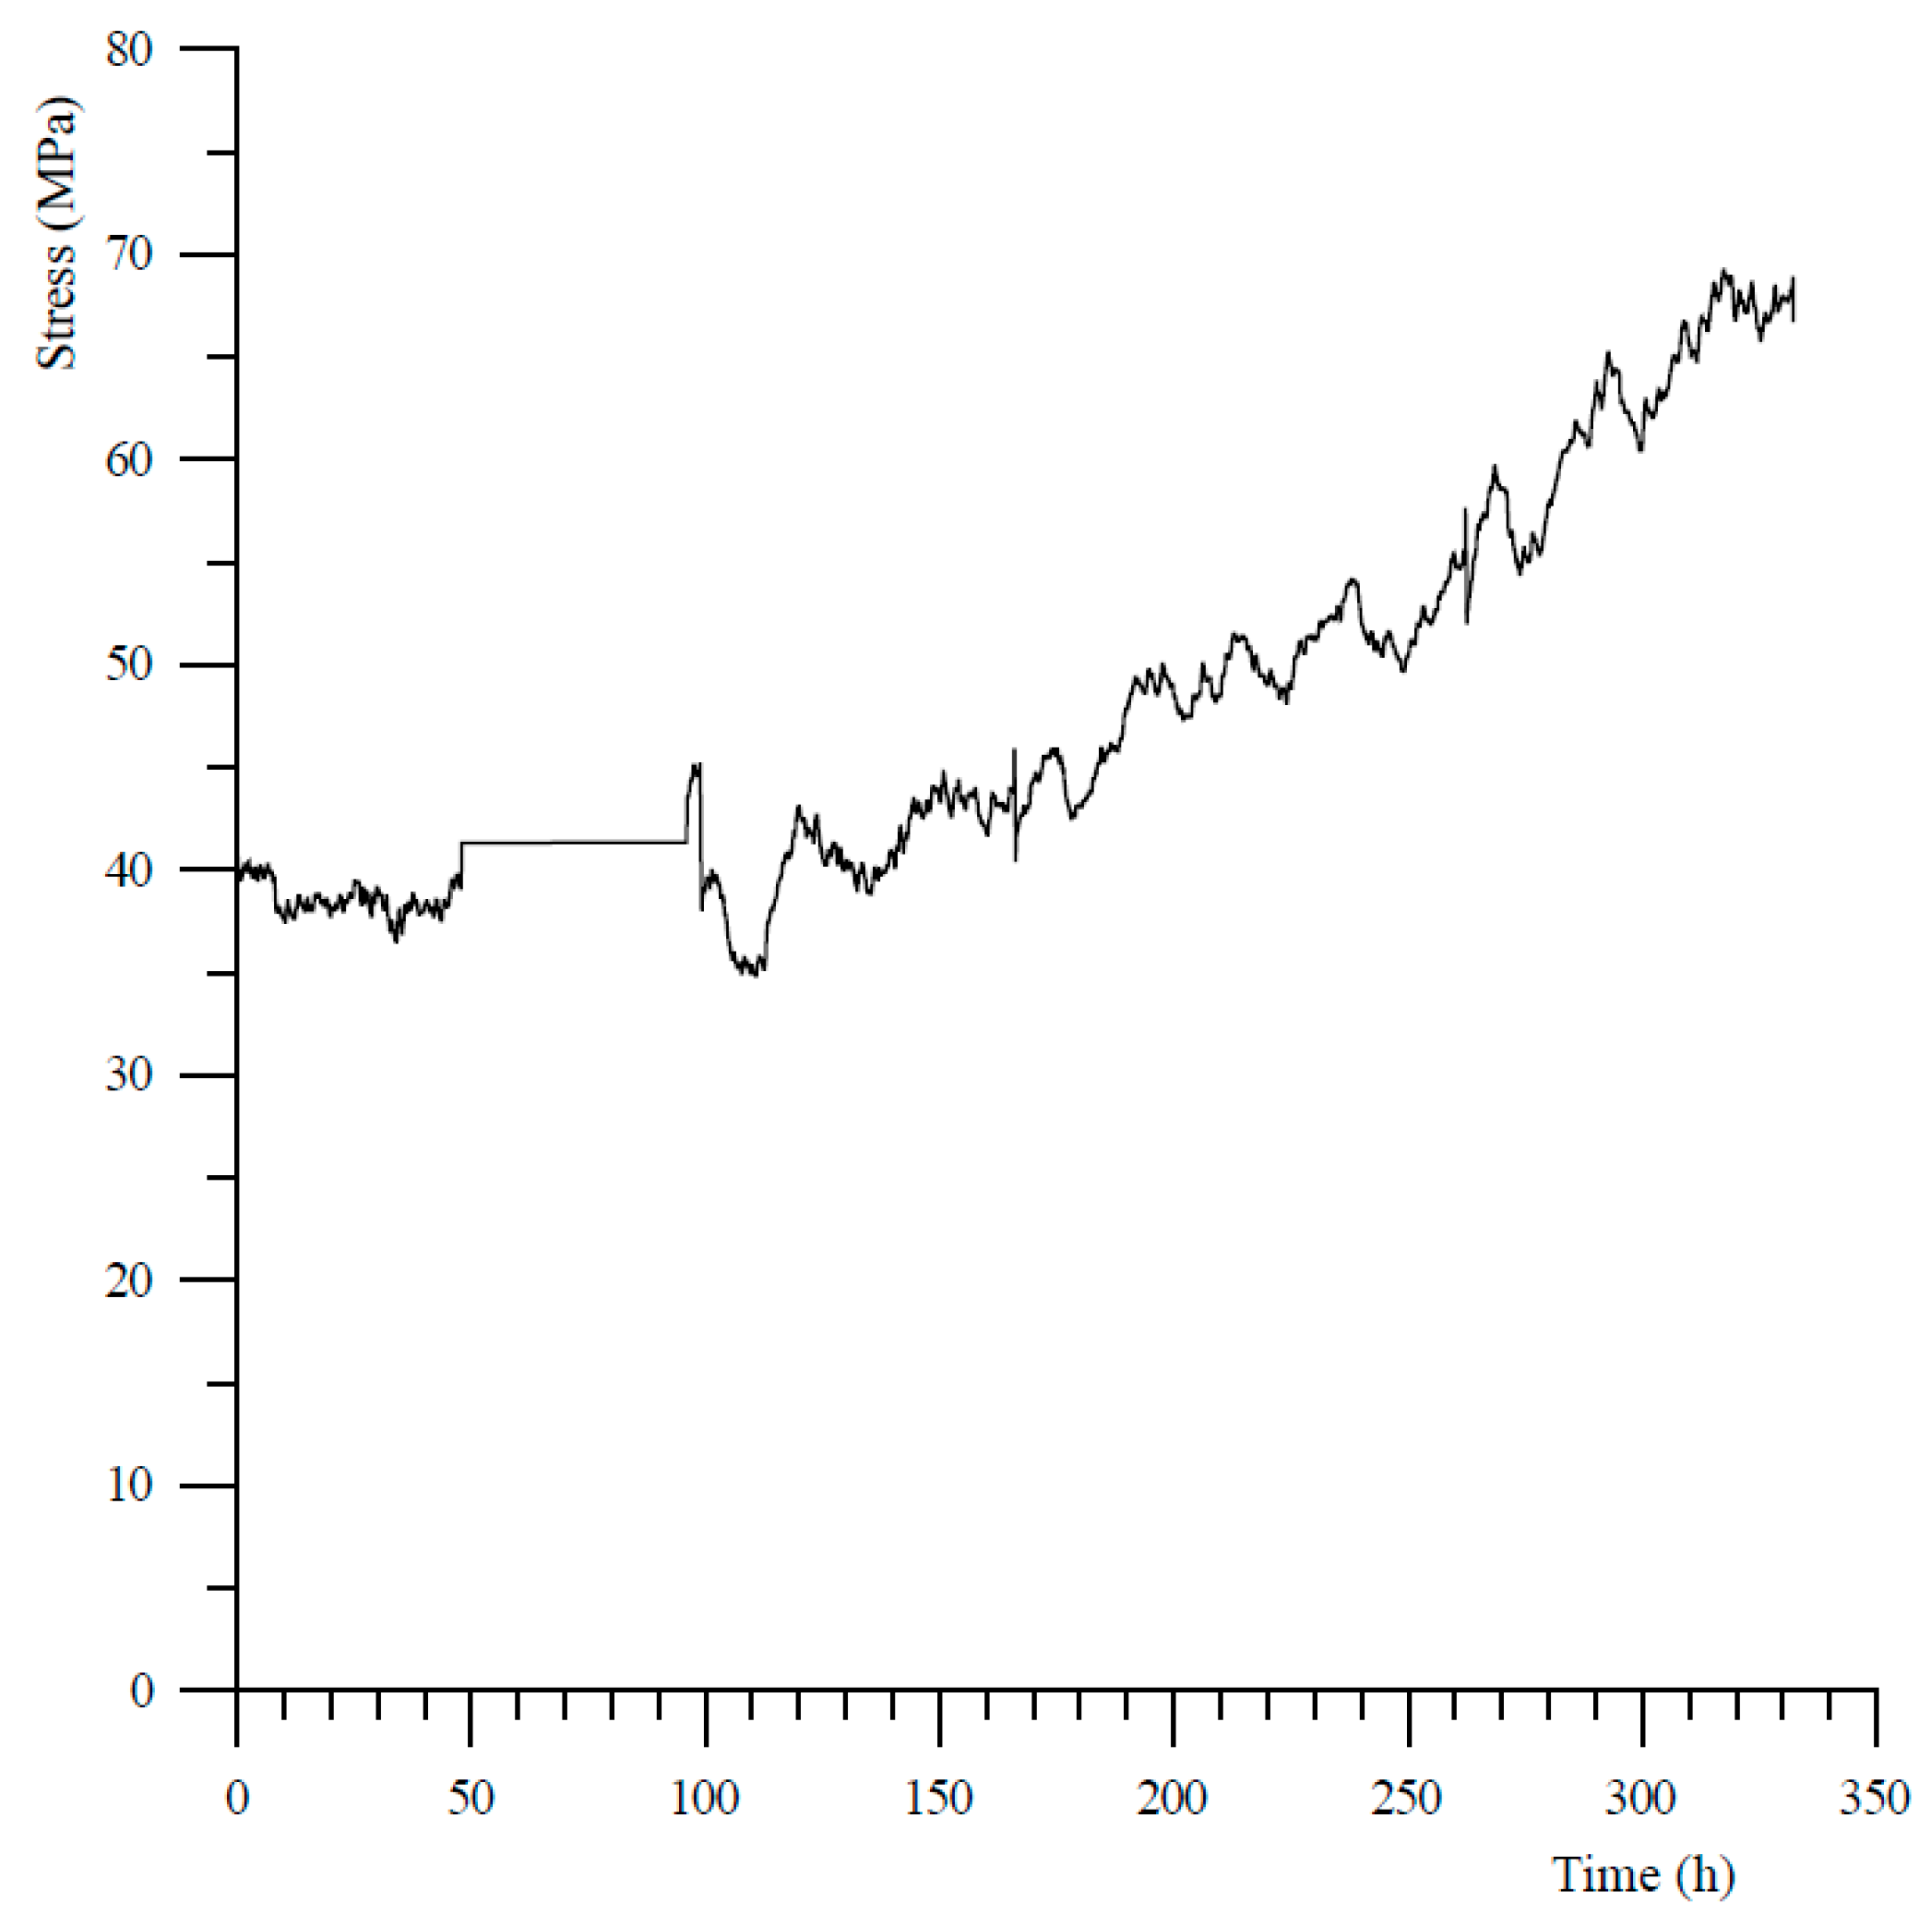
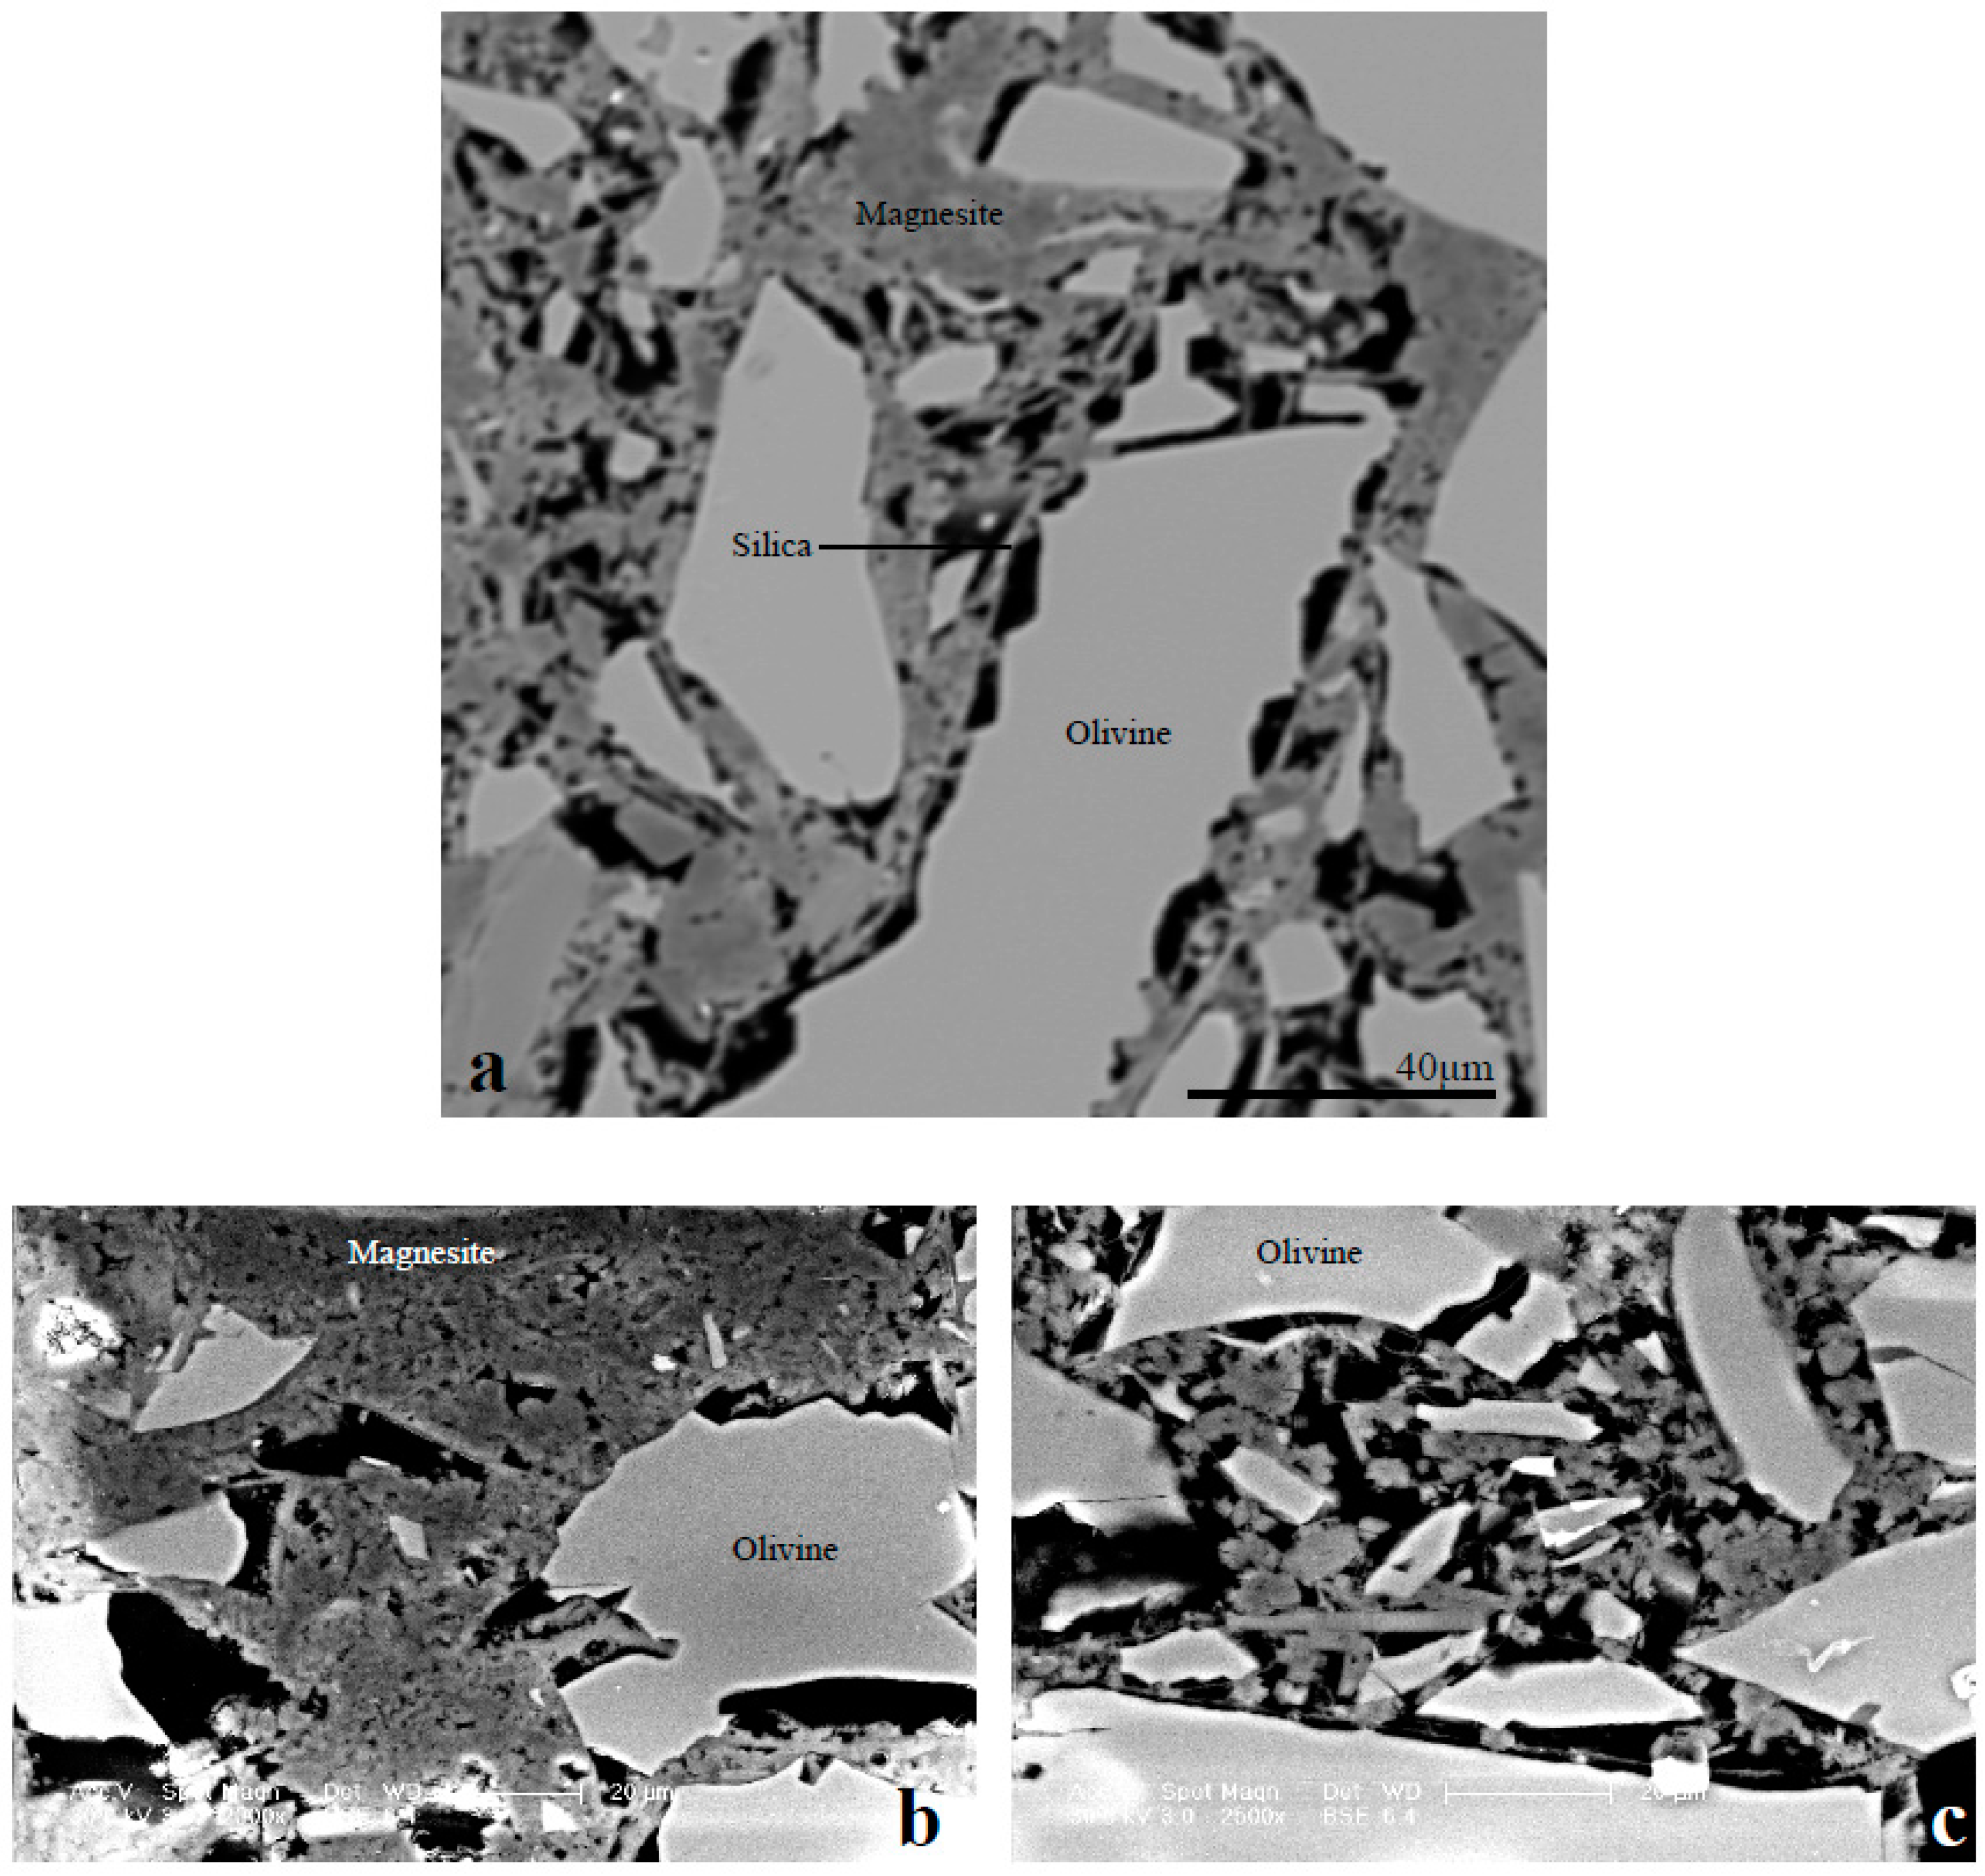
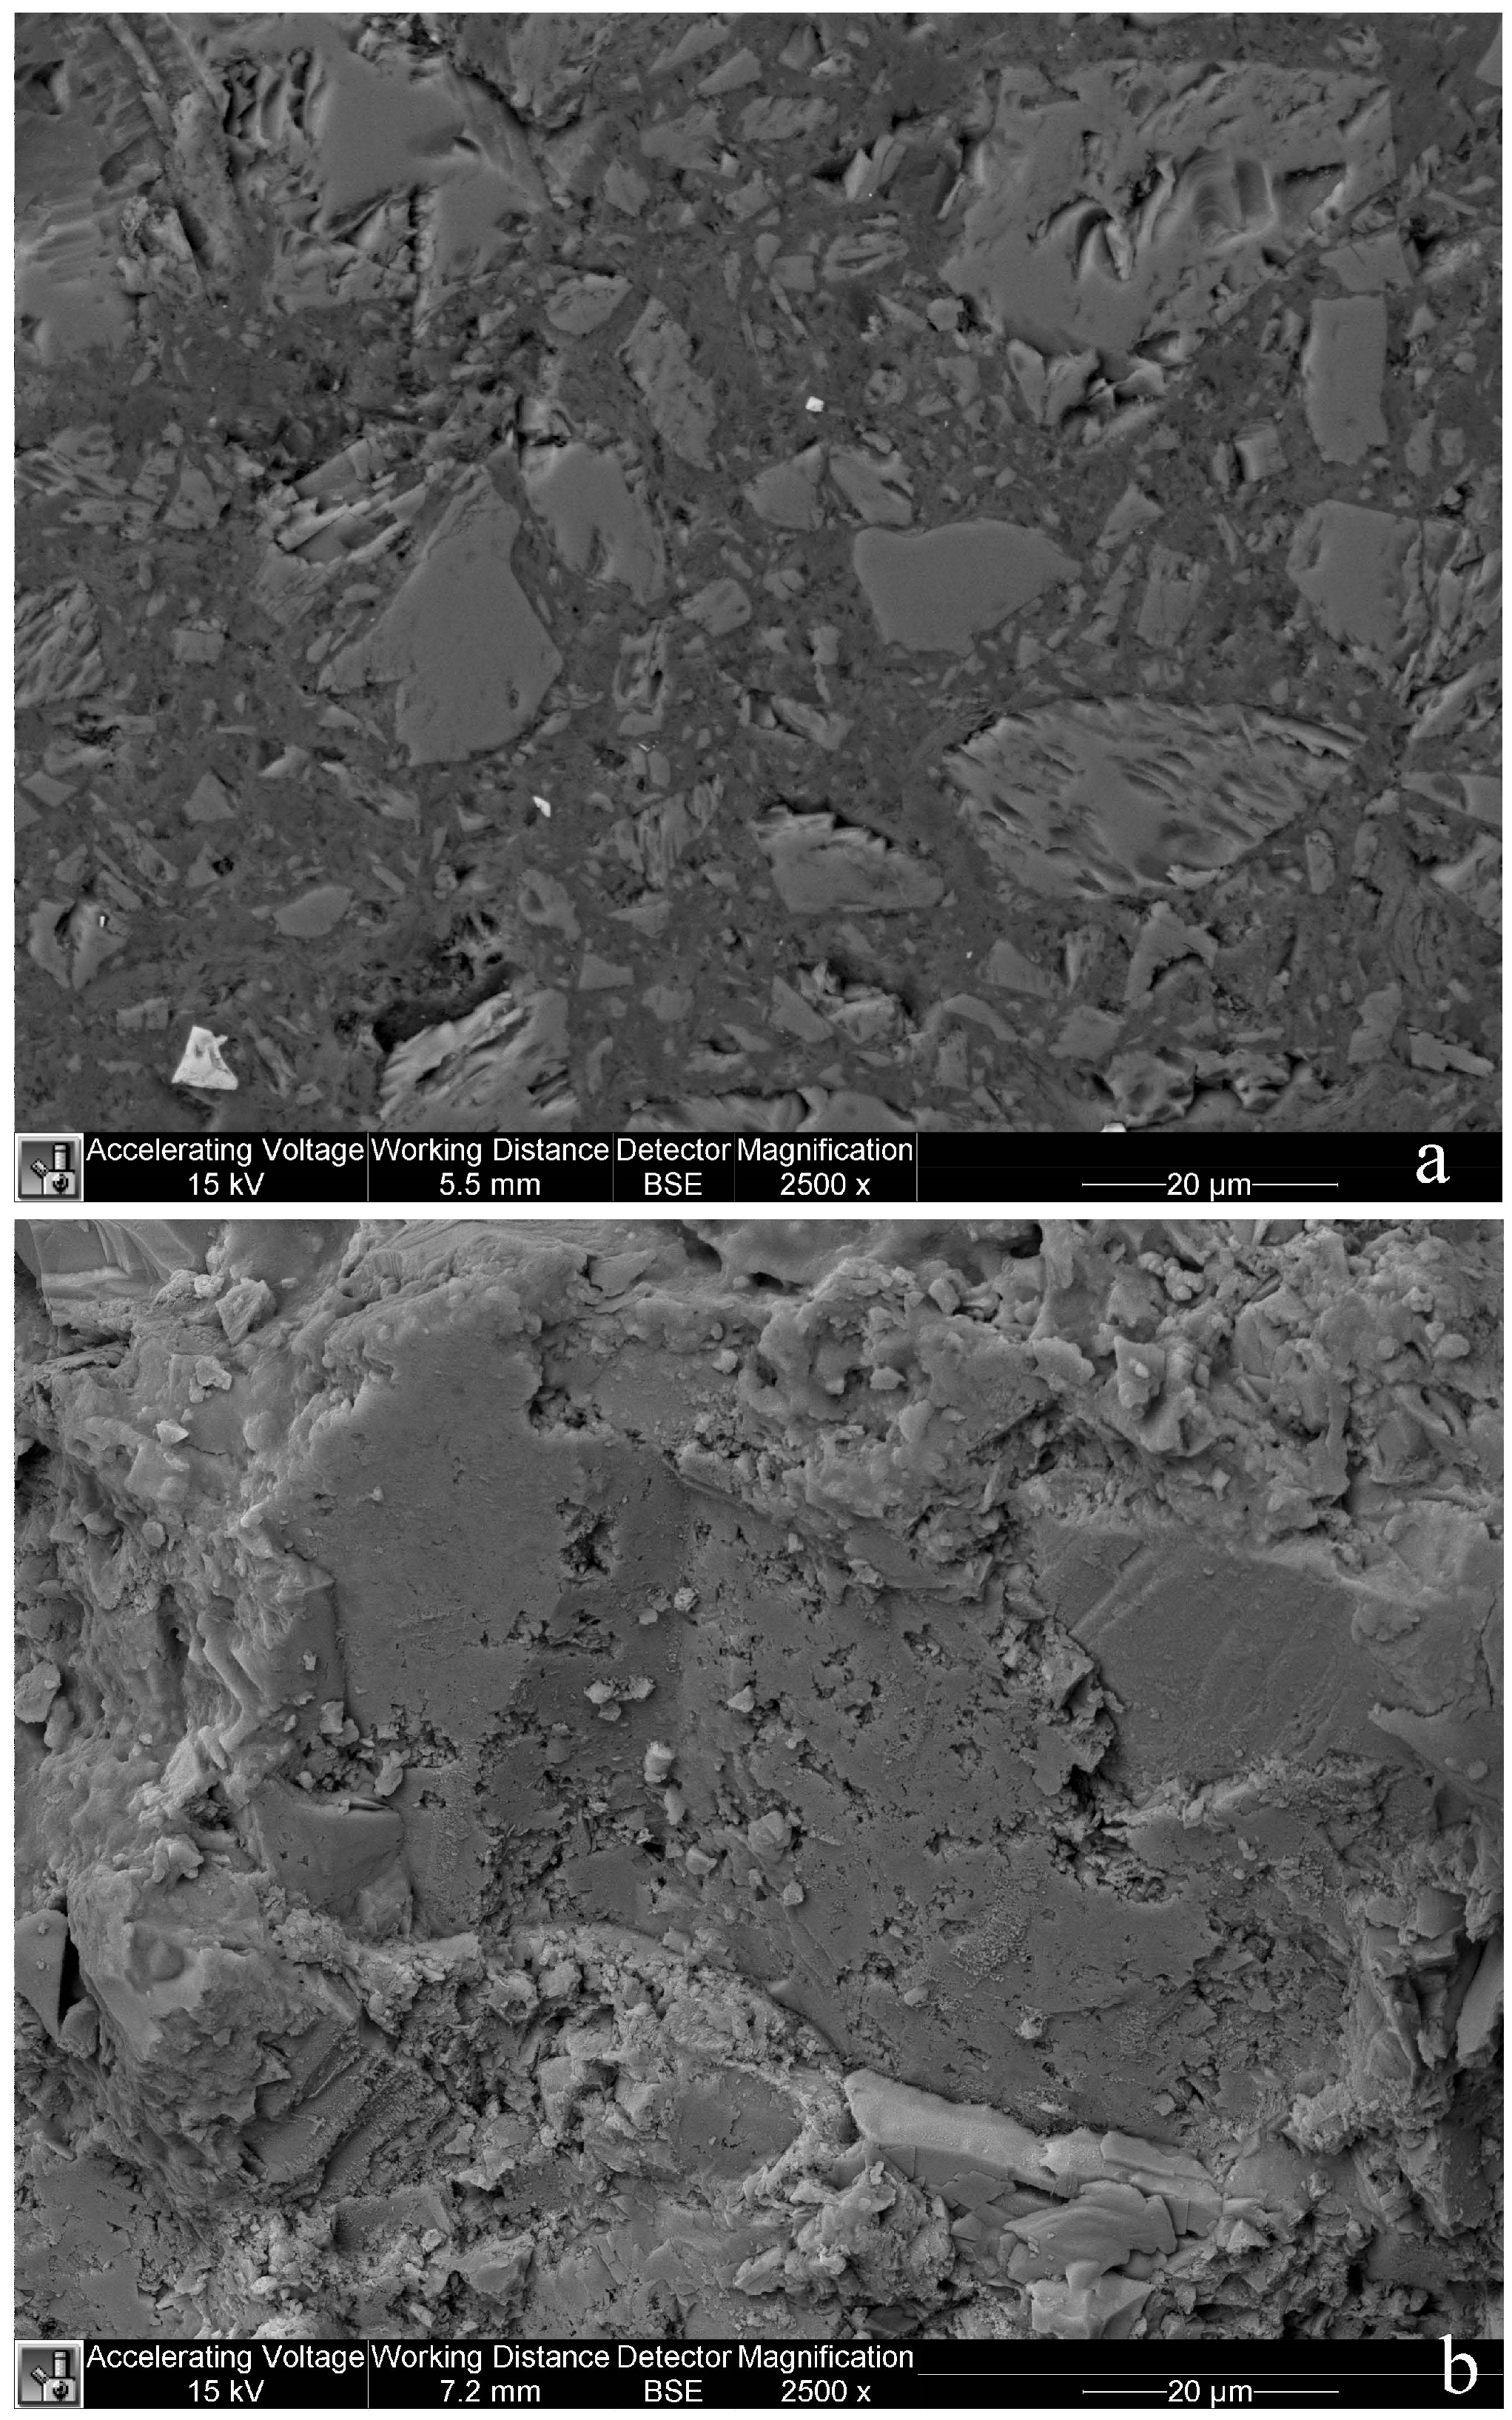
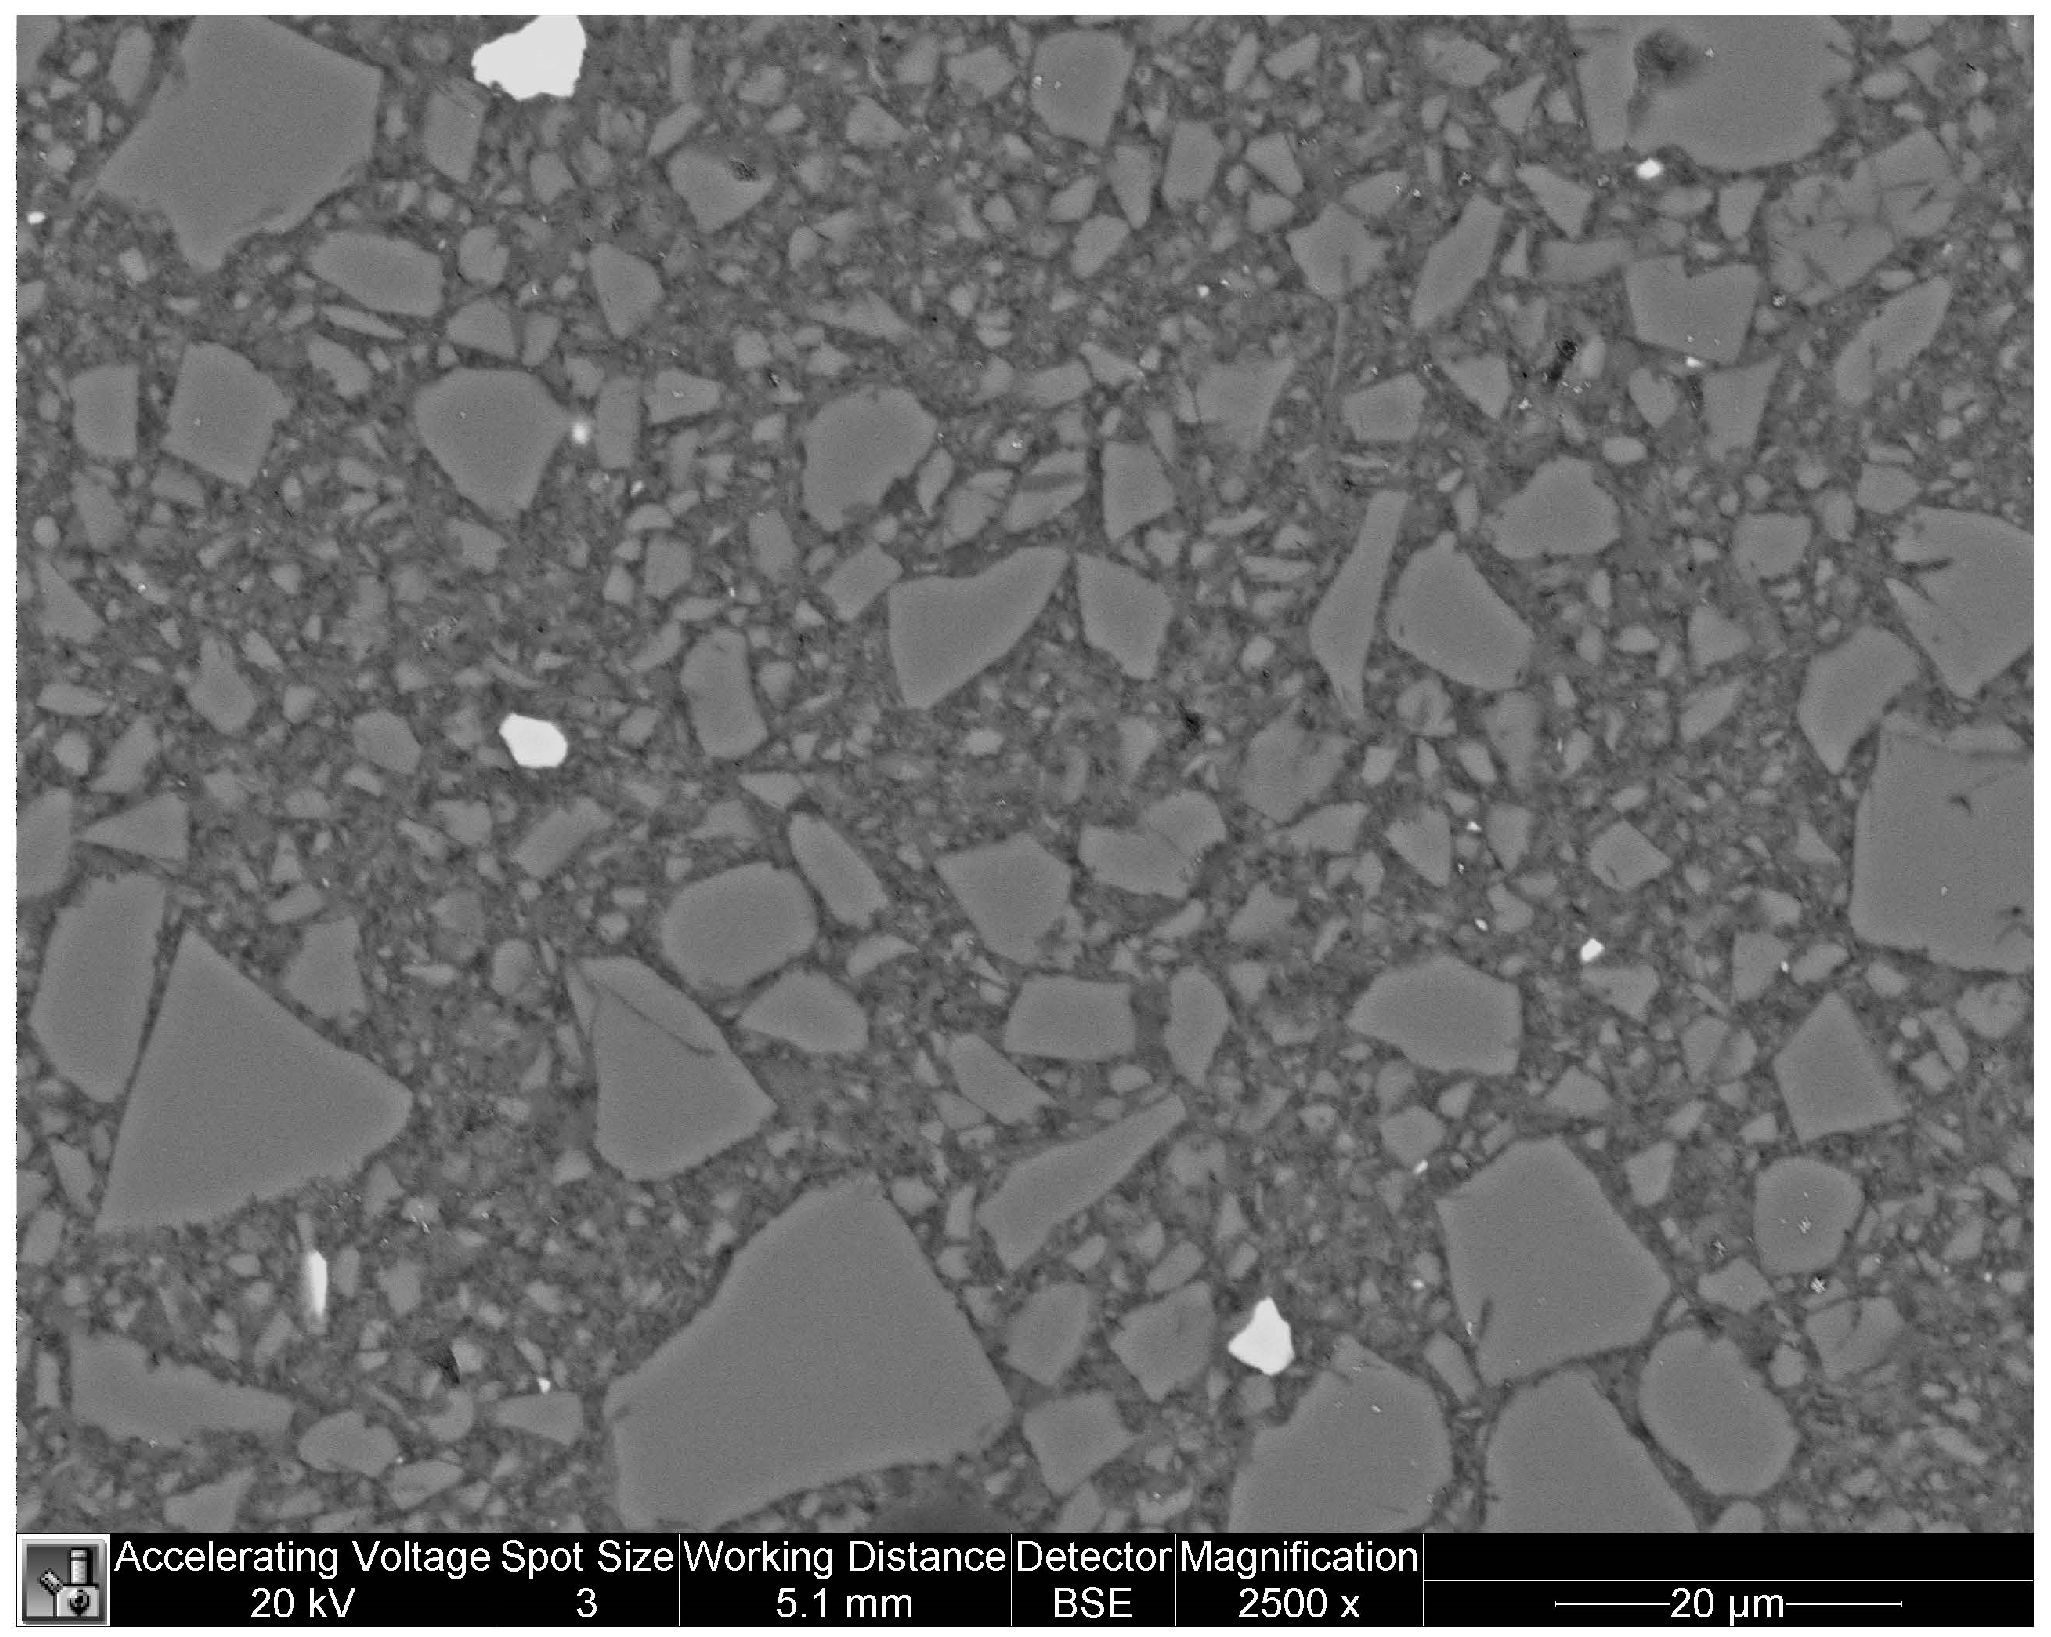
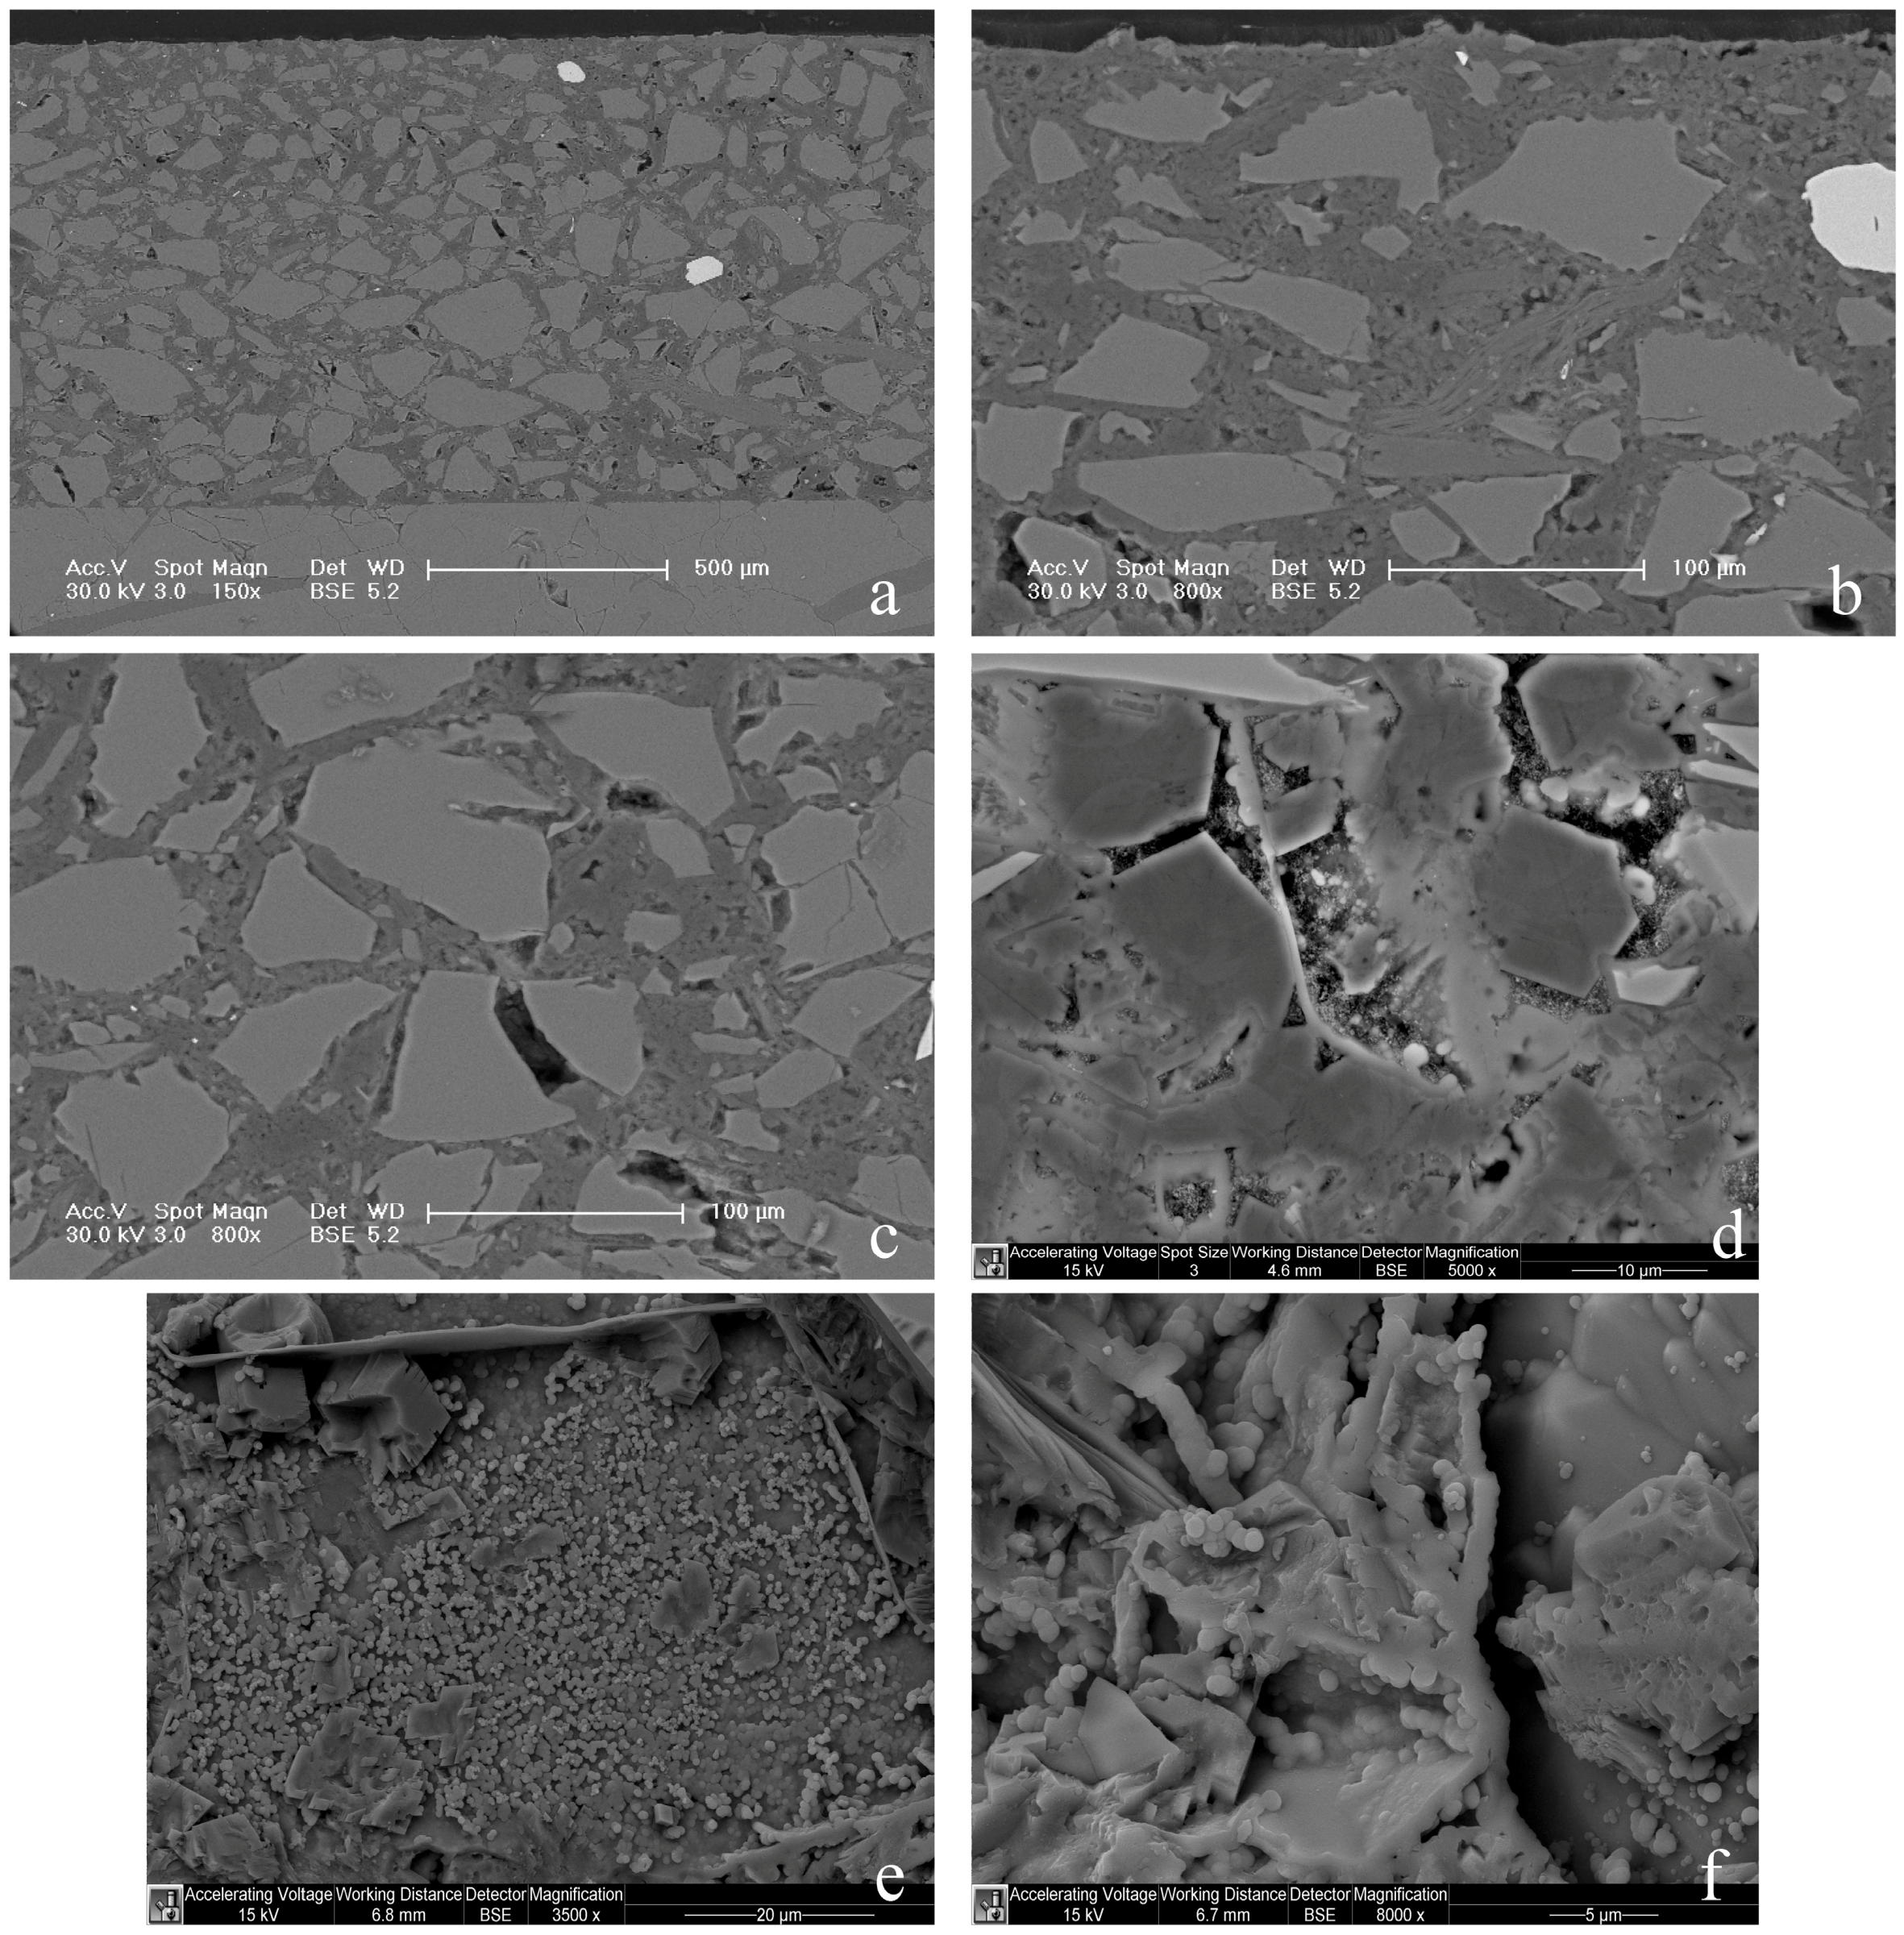
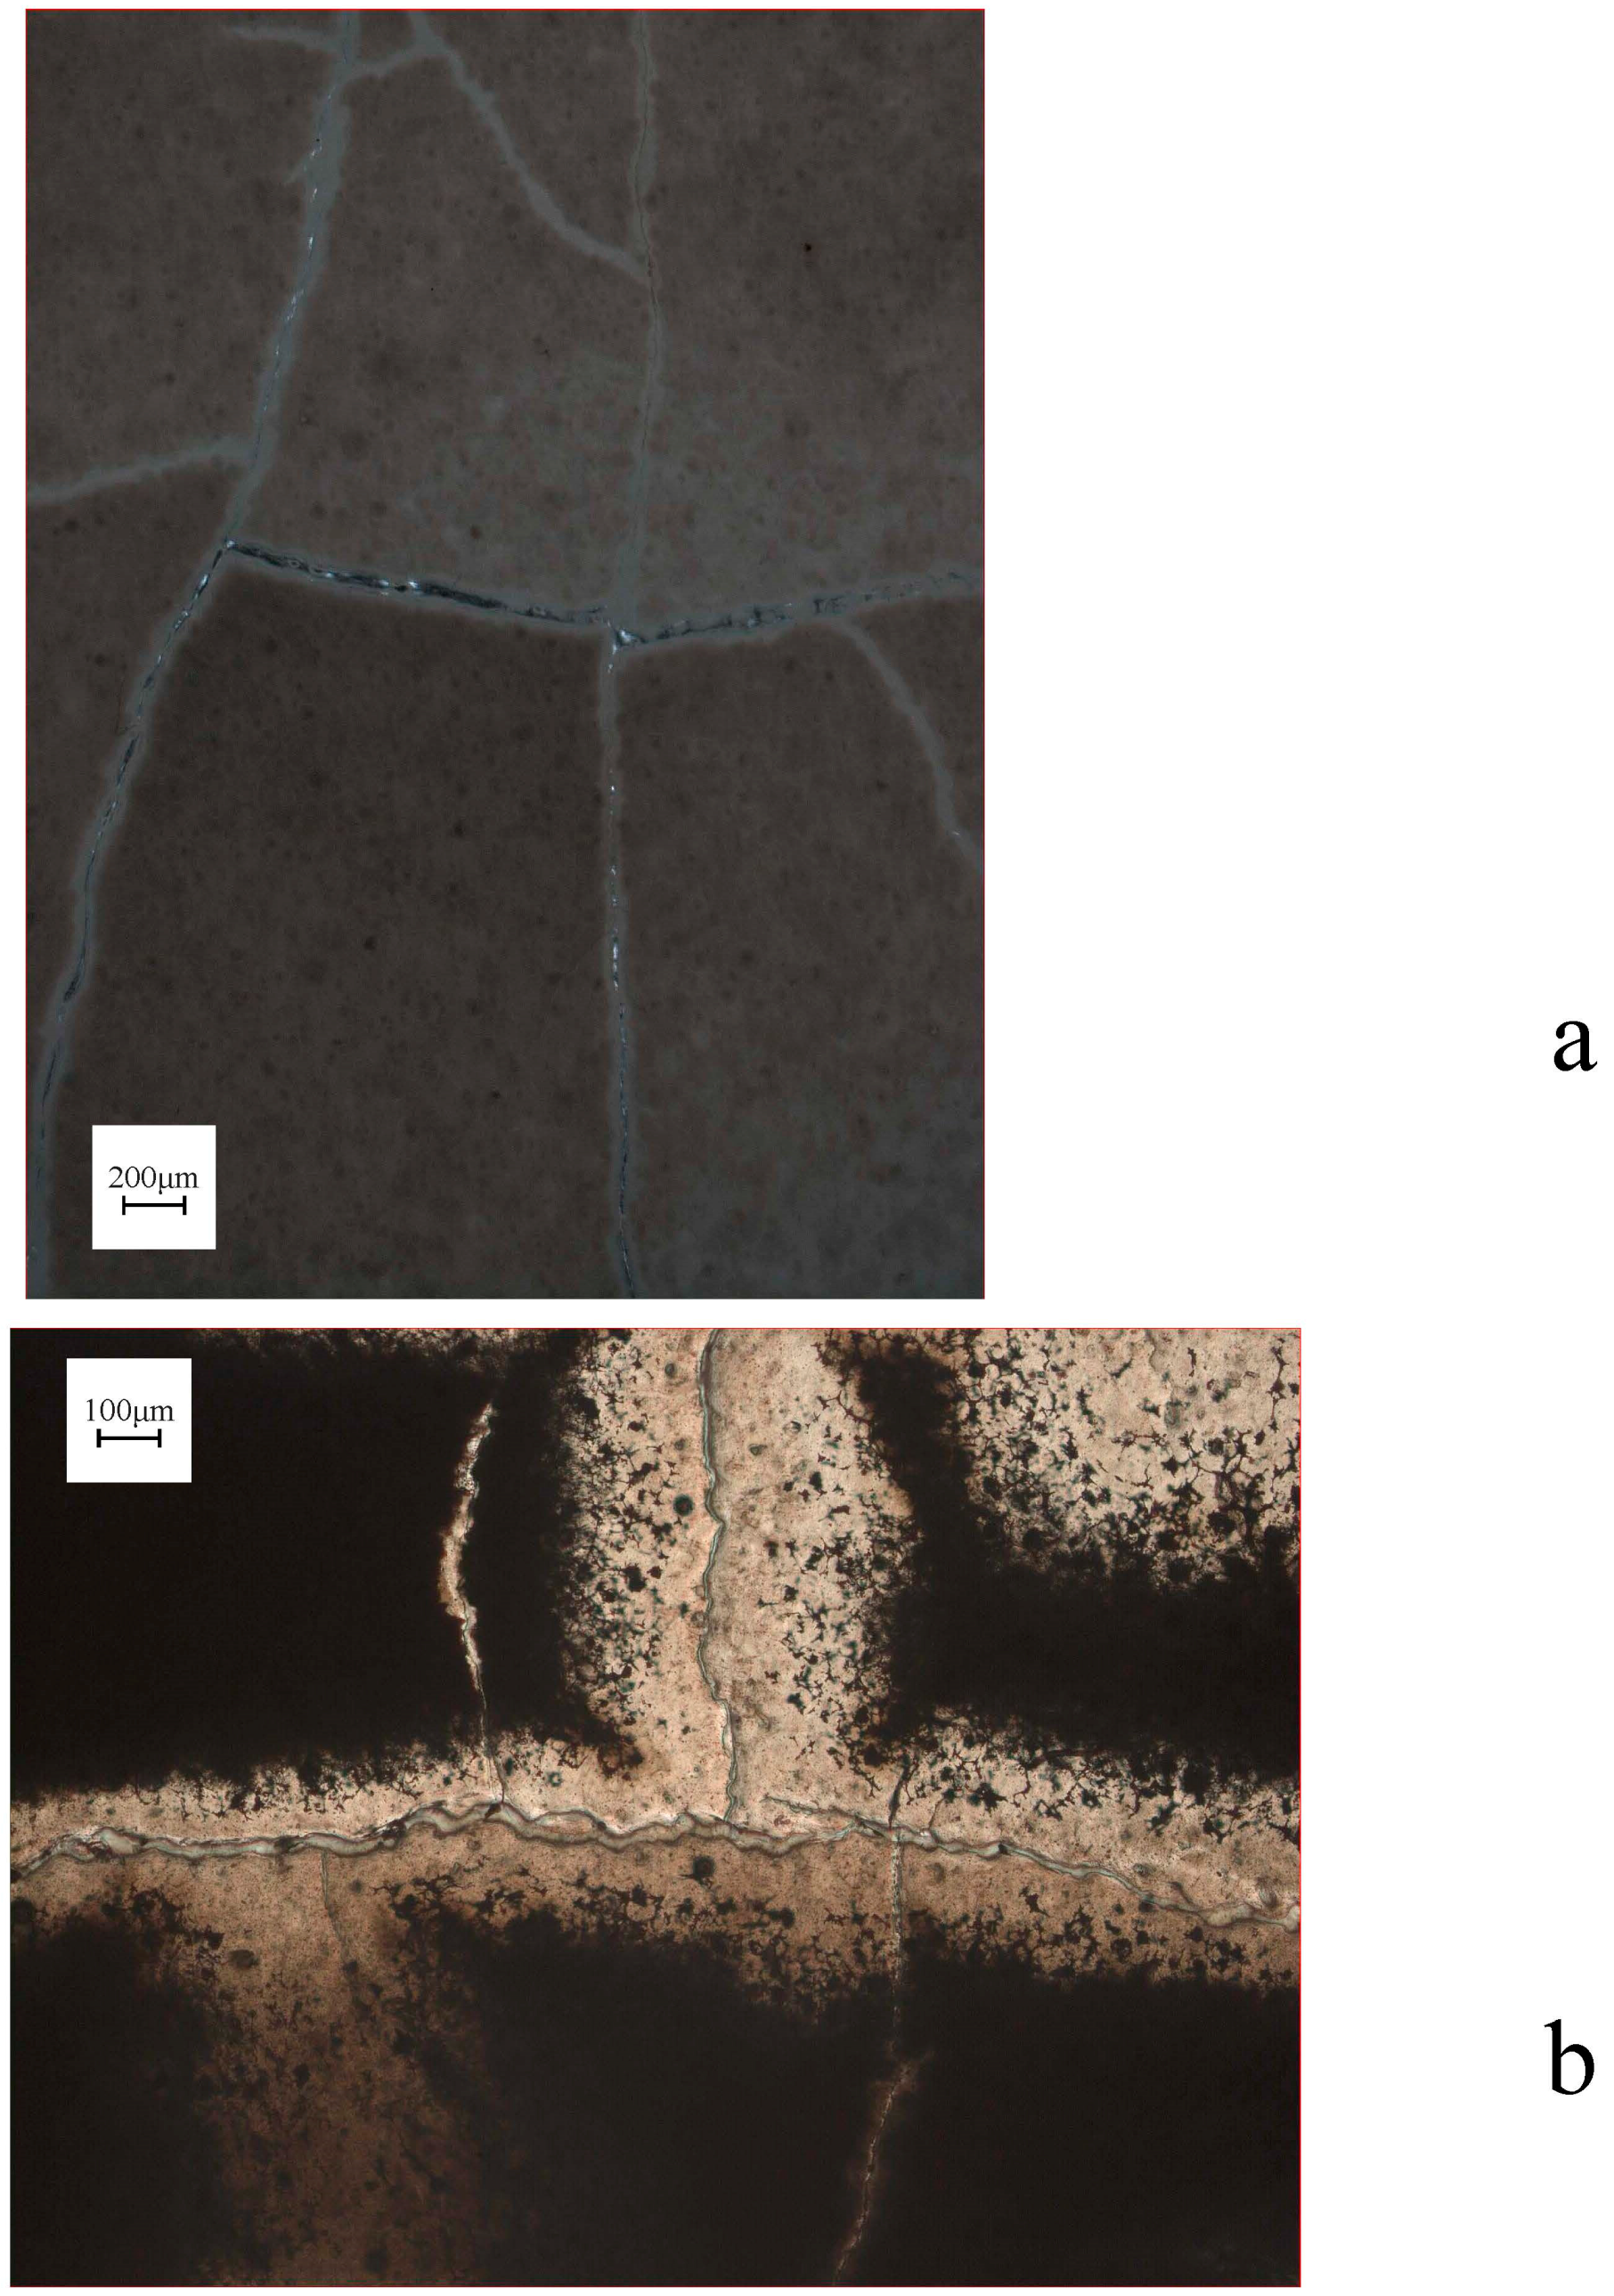
Table 1.
Literature data on uniaxial tensile strength () for peridotite, serpentinite, gabbro and Columbia River Basalts.
Table 1.
Literature data on uniaxial tensile strength () for peridotite, serpentinite, gabbro and Columbia River Basalts.
| Rock | (MPa) | Reference |
|---|---|---|
| Baoxing Augite-peridotite | 49.2–284.6 | [27] |
| Serpentinite | 2.3 | [29] |
| Gabbro (gneissic, diorite) | 13.79 | [30] |
| Gabbro | 16.41 | [30] |
| Pyroxenite (fresh) | 22.75 | [30] |
| Pyroxenite (moderately altered) | 18.62 | [30] |
| Pyroxenite (heavily altered) | 13.79 | [30] |
| Pyroxenite (garnet) | 15.17 | [30] |
| Magnesite | 17.1 | [30] |
| Columbia River Basalts | ||
| Grande Ronde. WA. Utanum flow | 11.9 | [31] |
| Grande Ronde. WA. Pomona flow | 19.4 | [31] |
| Grande Ronde. WA. Cohassett flow | 13.6 | [31] |
Table 2.
Literature data on fracture toughness and subcritical crack growth parameters , Δ and for various mafic and ultramafic rocks. and are the temperature and pressure at which measurements were made (RT is room temperature). Presumably, unspecified temperatures are room temperature, and unspecified pressures are atmospheric pressure.
| Rock/Mineral | (K) | (Mpa) | MPa·m1/2 | Subcritical Crack Growth Parameters | Reference | ||
|---|---|---|---|---|---|---|---|
| Δ(kJ·mol−1) | |||||||
| Olivine (010) Fo88 | RT | - | 0.59 | - | - | - | [34] |
| Olivine (001) Fo88 | RT | - | 0.73 | - | - | - | [34] |
| Hot-pressed olivine | - | - | 0.65–0.75 | - | - | - | [35] |
| Dunite | - | - | 3.5 | - | - | - | [36] |
| Dunite | RT | - | 3.74 | - | - | - | [37] |
| Serpentinized dunite | RT | - | 1.39 | - | - | - | [37] |
| Black Gabbro (in vacuum) | 293 | 0 | 2.71–3.03 | - | - | - | [37] |
| Black Gabbro (in vacuum) | 373 | 0 | 2.84–3.42 | - | - | - | [37] |
| Black Gabbro (in vacuum) | 473 | 0 | 2.58–3.06 | - | - | - | [37] |
| Black Gabbro (in air) | 293 | 0.1 | - | - | - | 54–58 | [37] |
| Black Gabbro (in water) | 293 | 0.1 | - | - | - | 29–36 | [37] |
| Whin Sill dolerite (in air) | 293 | 0.1 | 3.26–3.32 | - | - | 31 | [37] |
| Whin Sill dolerite (in water) | 293–353 | 0.1 | - | - | 30–46 | 29 | [37] |
Table 3.
Values from the literature for the uniaxial compressive strength (), cohesive shear strength () and internal friction coefficient () of various ultramafic and mafic rocks, including Columbia River Basalts.
Table 3.
Values from the literature for the uniaxial compressive strength (), cohesive shear strength () and internal friction coefficient () of various ultramafic and mafic rocks, including Columbia River Basalts.
| Rock/Mineral | C0 (GPa) | S0 (GPa) | μ | Reference |
|---|---|---|---|---|
| Forsterite | - | 0.177 | - | [38] |
| Horoman Dunite | - | - | 0.6 | [39] |
| Peridotite (Thetford, Quebec, olivine + pyroxene + serpentine) | 0.197 | - | - | [30] |
| Gabbro (veined) | 0.126 | - | - | [30] |
| Gabbro (gneissic, diorite) | 0.186 | - | - | [30] |
| Gabbro | 0.311 | - | - | [30] |
| Gabbro | 0.317 | - | - | [30] |
| Gabbro | 0.223 | - | - | [30] |
| Gabbro (meta-) | 0.133 | - | - | [30] |
| Pyroxenite (fresh) | 0.182 | - | - | [30] |
| Pyroxenite (moderately altered) | 0.122 | - | - | [30] |
| Pyroxenite (heavily altered) | 0.059 | - | - | [30] |
| Pyroxenite (garnet) | 0.085 | - | - | [30] |
| Magnesite | 0.137–0.234 | - | - | [30] |
| Serpentinized olivine | - | 0.09 | 0.65 | [40] |
| Serpentinite | - | - | 0.3–0.5 | [33] |
| Chrysotile gouge | - | - | 0.2 | [41] |
| Gabbro | - | 0.038 | 0.18–0.66 | [33,36,40] |
| Columbia River Basalts | ||||
| Grande Ronde, WA, Utanum flow | 0.212 | - | - | [31] |
| Grande Ronde, WA, Pomona flow | 0.356 | - | - | [31] |
| Grande Ronde, WA, Cohassett flow | 0.235 | - | - | [31] |
Table 4.
Literature values for elastic constants for the principal peridotite minerals, and for various ultramafic and mafic rocks. and indicate measurement conditions (RT is room temperature). , , , and are Young’s modulus, Shear modulus, poisson’s ratio, and Bulk modulus, respectively. The temperature derivative of Young’s modulus (d/d) is also given.
| Rock/Mineral | T (K) | P (MPa) | E (GPa) | G (GPa) | ν | K (GPa) | dE/dT (Gpa/K) | Reference |
|---|---|---|---|---|---|---|---|---|
| Olivine (Fo92) | RT | - | 201 | 81 | 0.245 | 131 | −0.03 | [42] |
| Olivine (Fo93) | 298 | - | 197 | 79 | 0.247 | 129 | −0.03 | [42] |
| Olivine (forsterite) | - | - | 216.7 | 86.7 | 0.24 | - | - | [30] |
| Forsterite (Fo100) | 298 | - | 201 | 81 | 0.240 | 129 | −0.03 | [42] |
| Forsterite (Fo100) | 298 | - | 202 | 82 | 0.239 | 129 | −0.03 | [42] |
| Bronzite (En85) | RT | - | 152 | 61 | 0.252 | 102 | - | [42] |
| Dunite (Horoman) | - | - | 150 | 130 | - | - | - | [39] |
| Dunite (New Zealand) | - | - | 152 | 60 | 0.27 | - | - | [30] |
| Dunite (New Zealand) | - | - | 162 | 58 | 0.40 | - | - | [30] |
| Dunite (New Zealand) | - | 400 | 64.7 | - | - | - | - | [30] |
| Dunite (Balsam Gap) | - | 50 | - | 64 | - | - | - | [30] |
| Dunite (Balsam Gap) | - | 400 | - | 67 | - | - | - | [30] |
| Dunite (Balsam Gap) | - | - | 148.4 | 47.6 | - | - | - | [30] |
| Dunite (Balsam Gap) | - | 50 | 65.4 | - | - | - | - | [30] |
| Dunite (Balsam Gap) | - | 400 | 69.4 | - | - | - | - | [30] |
| Dunite (Balsam Gap) | - | - | 68.1 | - | - | - | - | [30] |
| Dunite (Balsam Gap) | - | 400 | 70.6 | - | - | - | - | [30] |
| Dunite (Balsam Gap) | - | 0 | - | - | - | 89.3 | - | [30] |
| Dunite (Balsam Gap) | - | 12 | - | - | - | 91.7 | - | [30] |
| Dunite (Balsam Gap) | - | 60 | - | - | - | 105 | - | [30] |
| Dunite (Balsam Gap) | - | 700 | - | - | - | 127 | - | [30] |
| Dunite (Balsam Gap) | - | 400 | - | - | - | 125 | - | [30] |
| Dunite (Balsam Gap) | - | 400 | - | - | - | 121 | - | [30] |
| Dunite (Twin Sisters) | - | - | 195 | 74 | - | - | - | [30] |
| Dunite (Twin Sisters) | - | - | 140 | 66 | - | - | - | [30] |
| Dunite (Twin Sisters) | - | - | - | 72 | - | - | - | [30] |
| Dunite (Twin Sisters) | - | 400 | - | 75.7 | - | - | - | [30] |
| Dunite (Twin Sisters) | - | 400 | - | - | - | 125 | - | [30] |
| Dunite (Moolhock Mine) | - | - | 50.9 | - | - | - | - | [30] |
| Dunite (Moolhock Mine) | - | 1000 | 57.2 | - | - | - | - | [30] |
| Peridotite (Moncha-Tundra Khibiny) | - | - | 164.76 | - | 0.26 | - | - | [30] |
| Peridotite (Thetford, Quebec, ol + py + serp) | - | - | 55.2 | - | - | - | - | [30] |
| Peridotite (Moncha-Tundra) | - | - | 168 | - | 0.26 | - | - | [30] |
| Peridotite (garnet-peridotite) | - | - | 134.7 | - | 0.24 | - | - | [30] |
| Peridotite (Moncha-Tundra) | - | - | 157 | - | - | - | - | [30] |
| 60% Serpentinized (Oman) Harzburgite | RT | 0–600 | - | - | 0.28–0.32 | - | - | [43] |
| Serpentinite (Korean) | 298 | 0–70 | 60–80 | 20–30 | 0.25–0.3 | 50–60 | - | [44] |
| Serpentinite | - | - | 10.6 | - | - | - | - | [29] |
| “Serpentine“ (Talc schist, Alberene) | - | 200 | - | - | - | 55.9 | - | |
| “Serpentine“ (Talc schist, Alberene) | - | 1000 | - | - | - | 73.5 | - | |
| Lizardite (calculated) | - | - | - | - | - | 68.9 | - | [45] |
| Lizardite (calculated) | - | - | - | - | - | 71 | - | [45] |
| Chrysotile (calculated) | - | - | - | - | - | 62.8 | - | [45] |
| Chrysotile (calculated) | - | - | - | - | - | 54.1 | - | [45] |
| Antigorite (calculated) | - | - | - | - | - | 67.3 | - | [45] |
| Antigorite (calculated) | - | - | - | - | - | 62 | - | [45] |
| Magnesite | - | - | 110 | - | - | - | - | [30] |
| Pyroxene | - | - | 149 | - | - | - | - | [30] |
| Gabbro (altered) | - | - | 84.8 | 33.6 | - | - | - | [46] |
| Gabbro (diabase) | - | - | 119 | 44.1 | - | - | - | [46] |
| Columbia River Basalts | ||||||||
| Grande Ronde, WA, Utanum flow | - | - | 71 | - | 0.27 | - | - | [31] |
| Grande Ronde, WA, Pomona flow | - | - | 83 | - | 0.25 | - | - | [31] |
| Grande Ronde, WA, Cohassett flow | - | - | 70 | - | 0.26 | - | - | [31] |
Table 5.
Changes in free energy and estimated changes in solid volume and total volume for the main reactions expected to occur during peridotite hydration/carbonation at constant temperature. Negative volume changes indicate a volume decrease. Changes in Gibbs free energy are given at standard reference conditions (Δ at 298.15 K and 0.1 MPa) and at 423 K (150 °C) and 50 MPa hydrostatic pressure (~1.5 km depth − Δ ). Volume changes given are changes in solid volume only (Δ ), changes in solid volume without precipitation of silica (Δ ), and changes in total volume, including solids and fluids (Δ ). In the latter case, values are given assuming one-phase flow and two-phase flow. Solid molar volumes are not corrected for temperature and pressure. Fluid molar volumes (for total volume changes) are calculated for a saturated CO2 solution at 423 K and 50 MPa.
| No. | Reaction | ΔVsolid (%) | ΔVno SiO2 (%) | ΔVtotal (%) |
|---|---|---|---|---|
| R.1 | Mg2SiO4 + 2CO2 = 2MgCO3 + SiO2 | 84 | 32 | −29/−54 |
| R.2 | 2Mg2SiO4 + 3H2O = Mg3Si2O5(OH)4 + Mg(OH)2 | 58 | - | −5/−5 |
| R.3 | 2Mg2SiO4 + CO2 + 2H2O = Mg3Si2O5(OH)4 + MgCO3 | 63 | - | - |
| R.4 | Mg3Si2O5(OH)4 + 3CO2 = 3MgCO3 + 2SiO2 + 2H2O | 16 | −24 | −22/−45 |
| R.5 | 2Mg3Si2O5(OH)4 + 3CO2 = 3MgCO3 + Mg3Si4O10(OH)2 + 3H2O | −1 | - | - |
| R.6 | Mg(OH)2 + CO2 = MgCO3 + H2O | 16 | - | - |
Table 6.
Free energies of reaction under hydrostatic conditions and maximum effective stress (MPa) generated by confined precipitation in fractures. Calculations were performed assuming either unstressed reactants (outside the confined zone) or stressed reactants (replacement of wallrock in a confined fracture) for the main reactions involved in the carbonation and hydration of peridotite.
| Reaction | 298.15 K | 315 K | 323 K | 373 K | 423 K | 460 K | 545 K |
|---|---|---|---|---|---|---|---|
| 0.1 MPa | 50 MPa | 50 MPa | 50 MPa | 50 MPa | 50 MPa | 50 MPa | |
| R.1 | Mg2SiO4 + 2 CO2 = 2 MgCO3 + SiO2 | ||||||
| ΔGPT (KJ·mol−1) | −72.831 | −92.350 | −90.732 | −79.949 | −68.148 | −58.857 | −36.032 |
| σne (MPa), reactants unstressed | 925.078 | 1172.995 | 1152.445 | 1015.483 | 865.591 | 747.575 | 457.662 |
| σne (MPa), reactants stressed | 2076.151 | 2632.551 | 2586.430 | 2279.047 | 1942.645 | 1677.782 | 1027.129 |
| R.2 | 2 Mg2SiO4 + 3 H2O = Mg3Si2O5(OH)4 + Mg(OH)2 | ||||||
| ΔGPT (kJ·mol−1) | −47.069 | −47.644 | −46.635 | −40.330 | −33.488 | −27.966 | −14.347 |
| σne (MPa), reactants unstressed | 356.233 | 360.584 | 352.948 | 305.230 | 253.447 | 211.652 | 108.580 |
| σne (MPa), reactants stressed | 1049.946 | 1062.768 | 1040.263 | 899.620 | 746.999 | 623.814 | 320.025 |
| R.3 | 2 Mg2SiO4 + CO2 + 2 H2O = Mg3Si2O5(OH)4 + MgCO3 | ||||||
| ΔGPT (kJ·mol−1) | −85.857 | −95.901 | −94.372 | −84.484 | −73.728 | −65.184 | −44.193 |
| σne (MPa), reactants unstressed | 633.541 | 707.652 | 696.372 | 623.405 | 544.041 | 480.990 | 326.098 |
| σne (MPa), reactants stressed | 1780.536 | 1988.821 | 1957.121 | 1752.051 | 1529.000 | 1351.800 | 916.484 |
| R.4 | Mg3Si2O5(OH)4 + 3 CO2 = 3 MgCO3 + 2 SiO2 + 2 H2O | ||||||
| ΔGPT (kJ·mol−1) | −59.805 | −88.799 | −87.092 | −75.414 | −62.568 | −52.529 | −27.871 |
| σne (MPa), reactants unstressed | 462.031 | 686.023 | 672.834 | 582.618 | 483.371 | 405.820 | 215.316 |
| σne (MPa), reactants stressed | 2725.857 | 4047.350 | 3969.534 | 3437.287 | 2851.758 | 2394.230 | 1270.308 |
| R.5 | 2 Mg3Si2O5(OH)4 + 3 CO2 = 3 MgCO3 + Mg3Si4O10(OH)2 + 3 H2O | ||||||
| ΔGPT (kJ·mol−1) | −72.195 | −100.805 | −99.343 | −89.197 | −78.062 | −69.443 | −48.355 |
| σne (MPa), reactants unstressed | 327.770 | 457.662 | 451.024 | 404.962 | 354.406 | 315.276 | 219.536 |
| σne (MPa), reactants stressed | 13,725.227 | 19,164.382 | 18,886.413 | 16,957.610 | 14,840.595 | 13,202.015 | 9192.956 |
| R.6 | Mg(OH)2 + CO2 = MgCO3 + H2O | ||||||
| ΔGPT (kJ·mol−1) | −38.788 | −48.257 | −47.737 | −44.154 | −40.240 | −37.218 | −29.846 |
| σne (MPa), reactants unstressed | 1384.310 | 1722.236 | 1703.691 | 1575.800 | 1436.132 | 1328.273 | 1065.173 |
| σne (MPa), reactants stressed | 11,441.994 | 14,235.118 | 14,081.832 | 13,024.752 | 11,870.327 | 10,978.820 | 8804.174 |
| R.7 | MgO + H2O = Mg(OH)2 | ||||||
| ΔGPT (kJ·mol−1) | −26.994 | −27.251 | −26.991 | −25.141 | −23.112 | −21.501 | −18.969 |
| σne (MPa), reactants unstressed | 1095.988 | 1106.407 | 1095.849 | 1020.737 | 938.358 | 872.968 | 770.175 |
| σne (MPa), reactants stressed | 2017.502 | 2036.682 | 2017.247 | 1878.981 | 1727.336 | 1606.966 | 1417.743 |
Table 7.
A list of all force of crystallization experiments performed, including experimental conditions. Pressures indicated with an asterisk are approximate, unbuffered values. Samples used are Åheim Dunite (ÅD), Oman Peridotite (A30) and Monticellite (Mo). The extra fine Åheim Dunite powder had a grain size of <30 μm.
| Expt. # | Sample | Sample Configuration | Dur (d) | T (°C) | P (MPa) | Notes |
|---|---|---|---|---|---|---|
| R0801 | ÅD | ~6 mm powder layer | 12 | 120 | 15 * | |
| R0802 | ÅD | ~5 mm powder layer | 12 | 120 | 15 * | Ar-permeametry done. |
| R0803 | ÅD | 2 mm disc with ~1 mm powder | 14 | 120 | 15 * | Force of crystallization measured. |
| R0804 | ÅD | ~2 mm disc | 13 | 140 | 16 * | Sample thickness increased slightly. |
| R0805 | ÅD | ~2 mm compressed, extra fine powder | 22 | 140 | 17 * | |
| R0806 | A30 | 3 ~1.5 mm discs | 11 | 190 | 15 * | |
| R0807 | ÅD | ~2 mm compressed, extra fine powder | 8 | 185 | 16 * | pH 1 HCl solution added |
| R0808 | ÅD | ~2 mm compressed, extra fine powder | 7 | 185 | 15 * | NaCl+NaHCO3 added |
| R0809 | ÅD | 2 mm disc with ~1 mm compressed extra fine powder | 5 | 121 | 20 | |
| R0810 | ÅD | 2 mm disc with ~1 mm compressed extra fine powder | 23 | 121 | 20 | |
| R0811 | ÅD | 2 mm disc with ~1 mm compressed extra fine powder | 18 | 121 | 19 | |
| R0812 | ÅD | 2 mm disc with ~1 mm extra fine powder | 19 | 121 | 19 | |
| R0813 | ÅD | ~3 mm compressed, extra fine powder | 21 | 128 | 19 | Ar-permeametry attempted. |
| R0814 | Mo | ~1 mm compressed, extra fine powder | 13 | 131 | 19 | Ar-permeametry attempted. |
| R0815 | Mo | ~2 mm extra fine powder | 16 | 125 | 19 | |
| R0816 | ÅD | ~2 mm compressed, extra fine powder | 21 | 126 | 18 | Ar-permeametry done. |
| R0817 | ÅD | 2 mm disc with ~1 mm powder | 18 | 126 | 18 |
Table 8.
Best-fit mineral compositions derived from XRD-analyses performed on starting materials, reacted samples and precipitates. The uncertainty and detection limit of these analyses are ~±10%.
Table 8.
Best-fit mineral compositions derived from XRD-analyses performed on starting materials, reacted samples and precipitates. The uncertainty and detection limit of these analyses are ~±10%.
| Sample | Material | Mineral | Vol. % |
|---|---|---|---|
| ÅDun | Åheim Dunite starting material | Olivine | 84.6 |
| Enstatite | 10.2 | ||
| Magnesite | 2.6 | ||
| Clinochlore | 2.6 | ||
| RMo | Monticellite starting material | Monticellite | 95.8 |
| Calcite | 4.2 | ||
| R0721A | Reacted, powdered Åheim Dunite | Olivine | 59.4 |
| Lizardite | 8.2 | ||
| Enstatite | 6.2 | ||
| Magnesite | 16.7 | ||
| Clinochlore | 9.5 | ||
| R0801 | Reacted, powdered Åheim Dunite | Olivine | 64.2 |
| Enstatite | 7.0 | ||
| Magnesite | 27.5 | ||
| Clinochlore | 1.3 | ||
| R0805 | Reacted, powdered Åheim Dunite | Olivine | 71.9 |
| Enstatite | 7.3 | ||
| Magnesite | 12.9 | ||
| Clinochlore | 7.8 |
Table 9.
Results of TGA analyses performed on starting materials, reacted samples and precipitates. Whereas the uncertainty in the gravimetric measurement is >±1%, the uncertainty introduced in interpretation of the data is ~±5%.
Table 9.
Results of TGA analyses performed on starting materials, reacted samples and precipitates. Whereas the uncertainty in the gravimetric measurement is >±1%, the uncertainty introduced in interpretation of the data is ~±5%.
| Sample | Material | Peak Temp. | Mineral | Reaction | Conc. (%) |
|---|---|---|---|---|---|
| ÅDun | Åheim Dunite starting material | ~600 | Chlorite | Dehydration | 3.1 |
| R0721A | Reacted, powdered Åheim Dunite | 493 | Magnesite | Decarbonation | 12.7 |
| R0801 | Reacted, powdered Åheim Dunite | ~462 | Magnesite | Decarbonation | 16.6 |
© 2017 by the authors. Licensee MDPI, Basel, Switzerland. This article is an open access article distributed under the terms and conditions of the Creative Commons Attribution (CC BY) license (http://creativecommons.org/licenses/by/4.0/).
Share and Cite
MDPI and ACS Style
Van Noort, R.; Wolterbeek, T.K.T.; Drury, M.R.; Kandianis, M.T.; Spiers, C.J. The Force of Crystallization and Fracture Propagation during In-Situ Carbonation of Peridotite. Minerals 2017, 7, 190. https://doi.org/10.3390/min7100190
AMA Style
Van Noort R, Wolterbeek TKT, Drury MR, Kandianis MT, Spiers CJ. The Force of Crystallization and Fracture Propagation during In-Situ Carbonation of Peridotite. Minerals. 2017; 7(10):190. https://doi.org/10.3390/min7100190
Chicago/Turabian StyleVan Noort, Reinier, Timotheus K. T. Wolterbeek, Martyn R. Drury, Michael T. Kandianis, and Christopher J. Spiers. 2017. "The Force of Crystallization and Fracture Propagation during In-Situ Carbonation of Peridotite" Minerals 7, no. 10: 190. https://doi.org/10.3390/min7100190
Note that from the first issue of 2016, this journal uses article numbers instead of page numbers. See further details here.