Article

Focused Ion Beam and Advanced Electron Microscopy for Minerals: Insights and Outlook from Bismuth Sulphosalts

1
School of Chemical Engineering, The University of Adelaide, Adelaide 5005, SA, Australia
2
FEI Company, Achtseweg Noord 5, P.O. Box 80066, Eindhoven 5600 KA, The Netherlands
3
Adelaide Microscopy, The University of Adelaide, Adelaide 5005, SA, Australia
4
BHP Billiton Olympic Dam, Adelaide 5000, SA, Australia
*
Author to whom correspondence should be addressed.
Minerals 2016, 6(4), 112; https://doi.org/10.3390/min6040112
Submission received: 2 August 2016 / Revised: 27 September 2016 / Accepted: 11 October 2016 / Published: 20 October 2016
(This article belongs to the Special Issue Advances in Mineral Analytical Techniques)

Abstract

:
This paper comprises a review of the rapidly expanding application of nanoscale mineral characterization methodology to the study of ore deposits. Utilising bismuth sulphosalt minerals from a reaction front in a skarn assemblage as an example, we illustrate how a complex problem in ore petrology, can be approached at scales down to that of single atoms. We demonstrate the interpretive opportunities that can be realised by doing this for other minerals within their petrogenetic contexts. From an area defined as Au-rich within a sulphosalt-sulphide assemblage, and using samples prepared on a Focused Ion Beam–Scanning Electron Microscopy (SEM) platform, we identify mineral species and trace the evolution of their intergrowths down to the atomic scale. Our approach progresses from a petrographic and trace element study of a larger polished block, to high-resolution Transmission Electron Microscopy (TEM) and High Angle Annular Dark Field (HAADF) Scanning-TEM (STEM) studies. Lattice-scale heterogeneity imaged in HAADF STEM mode is expressed by changes in composition of unit cell slabs followed by nanoparticle formation and their growth into “veins”. We report a progressive transition from sulphosalt species which host lattice-bound Au (neyite, lillianite homologues; Pb-Bi-sulphosalts), to those that cannot accept Au (aikinite). This transition acts as a crystal structural barrier for Au. Fine particles of native gold track this progression over the scale of several hundred microns, leading to Au enrichment at the reaction front defined by an increase in the Cu gradient (several wt %), and abrupt changes in sulphosalt speciation from Pb-Bi-sulphosalts to aikinite. Atom-scale resolution imaging in HAADF STEM mode allows for the direct visualisation of the three component slabs in the neyite crystal structure, one of the largest and complex sulphosalts of boxwork-type. We show for the first time the presence of aikinite nanoparticles a few nanometres in size, occurring on distinct (111)PbS slabs in the neyite. This directly explains the non-stoichiometry of this phase, particularly with respect to Cu. Such non-stoichiometry is discussed elsewhere as defining distinct mineral species. The interplay between modular crystal structures and trace element behaviour, as discussed here for Au and Cu, has applications for other mineral systems. These include the incorporation and release of critical metals in sulphides, heavy elements (U, Pb, W) in iron oxides, the distribution of rare earth elements (REE), Y, and chalcophile elements (Mo, As) in calcic garnets, and the identification of nanometre-sized particles containing daughter products of radioactive decay in ores, concentrates, and tailings.

1. Introduction

Textural and compositional variation in minerals over large scales of observation provides valuable information that can assist interpretation of how fluid-rock interaction takes place, or how ore deposits are formed. Significant advances in the resolution, imaging, and chemical mapping techniques of current electron microscopes, as well as in-situ sample preparation methods, allow a wide range of petrogenetic topics to be addressed. Despite steady application of Transmission Electron Microscopy (TEM) techniques to mineralogical problems over the past 50 years, it is only within the last 15 years that TEM investigation of minerals in their petrogenetic context has become relatively commonplace. This has largely occurred through the advent of Focused Ion Beam (FIB)-Scanning Electron Microscopy (SEM) techniques, as such dual-beam approaches permit in-situ extraction of small volumes of sample material and preparation of foils for TEM examination. Procedures and problems encountered with applications of FIB-SEM and TEM techniques are discussed at length in a number of key publications [1,2,3,4,5,6,7].
Contemporary FIB-SEM platforms are equipped with X-ray detectors for acquisition of Energy Dispersive Spectra (EDS), and have Scanning Transmission Electron Microscopy (STEM) capabilities, the combination of both allowing for the study of chemical-structural heterogeneity at the sub-micron-scale. In some cases, such a level of detail is sufficient for valuable petrogenetic interpretation [7,8,9]. More often, FIB-SEM instrumentation serves in the selection of slices for TEM-foil preparation. Other applications of dual-beam techniques include FIB-Electron Back Scatter Diffraction (high-resolution micro-structural sample characterisation for small grains, such as the correlation of chemical heterogeneity and lattice distortion in uraninite [10]), and 3D-tomographic imaging (e.g., dealing with porosity, inclusion distribution, or phase intergrowths throughout a sample volume [11,12], or FIB-X-ray microtomography for analysis of tiny fluid inclusions [13]).
In-situ extraction of small volumes of sample material by FIB-SEM has also proven valuable for the characterization of new minerals (e.g., in the case of gratianite [14]). Using microbeam X-Ray synchrotron source spectrometry, such an approach can be applied for crystal-structural characterization where the phase of interest is both fine-grained and intergrown with other minerals of similar composition and/or structure. Slices prepared in-situ by FIB-SEM have also been utilized in other experiments using synchrotron radiation. For example, µ-XANES spectra on FIB-prepared foils have been used to prove the presence of Cu+ in Cu-In-oscillatory zoned sphalerite [15]. The same FIB-prepared slices were also studied in detail and chemically mapped by nanoscale X-ray Fluorescence Spectroscopy. FIB-prepared slices from extra-terrestrial material have been used for high-resolution Secondary Ion Mass Spectroscopy applications (e.g., by nanoSIMS), particularly for the measurement of light element isotopes and their ratios (e.g., [5,16]).
Below, we highlight recent progress in the application of integrated FIB-SEM and TEM microbeam techniques to minerals, introducing the topics that can be addressed by studies that bridge the micron to nanometre scales of observation. We go on to show how recent developments with TEM instrumentation, particularly STEM imaging techniques, allow compositional and structural information to be correlated at an atomic-scale resolution, and why this is important for understanding minerals. To illustrate how advanced electron microscopy can ‘map’ mineral reactions down to the site where this happens, we use an example of bismuth sulphosalts and explore the potential they have for fingerprinting Au enrichment in sulphide ores.

2. Background

2.1. Research Topics Addressed by Integrated FIB-SEM and TEM Microbeam Techniques

Whether from natural or synthetic mineral assemblages, the many opportunities facilitated by FIB-SEM extraction of TEM samples from sites of specific petrogenetic interest is exemplified by the diversity of petrological topics addressed in the literature. These range from biomineralisation [17,18], to rock-forming silicates such as feldspars [11,19,20], natural and synthetic garnets (e.g., [21,22], or minerals of secondary origin such as phosphates and phyllosilicates [23,24,25,26]. Rare materials such as carbonado diamonds and meteorites have also been addressed (e.g., [27,28,29,30,31,32]). Among extra-terrestrial samples, many integrated FIB-SEM and TEM applications have also been combined with nanoSIMS studies (e.g., [5]).
Minerals such as Th-bearing monazite used in geochronology, have attracted interest with respect to phase stabilities relative to the formation of Th-bearing silicates (huttonite or thorite; ThSiO4), as well as how phase relationships down to the nanoscale can impact on isotope systematics (e.g., [33,34]). Uranium-bearing oxides featuring oscillatory chemical zonation (including Pb continually produced from radiogenic decay; e.g., [35]), have been subjected to FIB-TEM studies to assess their reliability for U-Pb dating. Although long-range superstructuring assists incorporation of heavy elements (U, Pb, W, and Mo) in high-U hematite [36], and no lattice scale changes are observed in high-(Pb, REE + Y) uraninite [37], in both cases the oscillatory zoning appears to be a self-induced patterning phenomenon that locks in the daughter isotopes formed during alpha decay events.
In comparison to the examples above, integrated FIB-SEM and TEM studies of sulphide assemblages are relatively scarce. Despite problems encountered for some sulphides during TEM sample preparation on the FIB-SEM platform [7], meaningful results have been shown for a range of sulphides. These include correlation between various polytypes and minor/trace (Cu-In-Fe-Sn-Ag-Cd) element behaviour in ZnS, nanoscale characterisation of symplectitic intergrowths among bismuth sulphosalts [7], and cooling histories interpreted from a range of nanoscale characteristics (superstructures, phase transformation, and lattice-scale intergrowths) among Cu-(Fe)-sulphides [38]. Synchrotron mapping of FIB-SEM samples combined with TEM studies have shown (111)* twinning promoting the incorporation of Ge in Fe-rich sphalerite [39]. Despite the presence of lattice scale defects [40], molybdenite zoned with respect to Re and W shows coherent lattice-scale intergrowths with inclusions of chalcogenide minerals, lending the molybdenite a Pb-Bi-Au-Te-Se trace element signature but without modifying the layer stacking arrangement, i.e., only the 2H molybdenite polytype is present.
Nanoscale inclusions of Platinum Group Minerals (PGM) were found in pyrrhotite and pentlandite, the two main sulphides in the PGE-reefs in the Bushveld Complex, South Africa. Wirth et al. [41] present arguments favouring an orthomagmatic origin for the sulphide assemblages, whereas Junge et al. (2015) [42] document superlattice ordering in pentlandite hosting PGM. Pyrrhotite-group minerals (Fe1−xS; x = 0–0.124) and their transformations are discussed for different meteorites, as well as with respect to hydrothermal dissolution experiments [43,44]. The FIB-TEM approach has also been applied to study nanometric-sized Bi-melt products obtained from hydrothermal experiments aimed at proving the validity of the ‘Bi-Au collector’ at variable redox conditions [45]. Lastly, gold precipitation prompted by devolatilisation processes, was inferred based on the discovery of pore-attached, Au-Te-nanoparticles along the microfracture trails within arsenic-free pyrite [46].

2.2. Advances in Electron Microscopy—STEM Imaging at Atomic Resolution

As seen from the examples above, one mainstream topic in petrogenesis is the fingerprinting of phase transformations and/or mineral reactions down to the smallest scale. A particular issue is whether trace and minor element signatures in minerals, documented via rapidly-expanding Laser Ablation Inductively Coupled Plasma Mass Spectrometry (LA-ICP-MS) studies [47], can be correlated with crystal-structural transformations or lattice defects leading to pores and/or nanoparticle formation. Alternatively, if such signatures are the expression of crystal structures accommodating “exotic” elements within the lattice to form solid solutions, can such lattice-bound “invisible” elements actually be imaged using advanced electron microscopy?
A recent review of the advances in electron microscopy techniques and their applications in materials science [48] highlights the opportunities introduced by STEM imaging relative to High-Resolution (HR)-TEM imaging. In HR-TEM imaging, the electron beam is parallel, while in (most of) STEM applications it is convergent. Importantly, in TEM mode the beam is stationary and illuminates the whole sample at the same time, while in STEM mode the beam is continuously rastering the sample area [49]. Different signals can be recorded from the convergent-beam diffraction pattern formed on the back-focal plane. The High Angle Annular Dark Field (HAADF) detector is placed just above the fluorescent screen to capture (integrate) the diffraction pattern for every probe position. Of these, one of the key imaging modes is HAADF STEM, in which the image contrast is correlated with the atomic mass (the atomic number Z-dependence of the contrast is ~Z2). The application of HAADF STEM imaging for minerals containing elements heavier than in most silicates makes the method perfectly suited for detection of heavy element nanoparticles (NPs), such as gold in pyrite [46,50,51,52,53], uranium nanocrystals in atmospheric aerosols [50,54], or different forms of nanoscale lead in radiogenic zircon [55].
Although the development of STEM techniques started in the 1960s, it is only in the past decade that (S)TEM instruments offer aberration-correction of the probe forming optics. This development unlocked deep sub-Angstrom atomic resolution imaging [48], allowing for a wide range of scientific applications including ore petrology. Alongside the HAADF STEM mode, which can be combined with spectroscopy at high spatial resolution, high-resolution Annular Bright Field (ABF) [48] and integrated Differential Phase Contrast (iDPC) modes [56] have emerged as promising STEM imaging methods, permitting the observation of both light and heavy elements. Examples of ABF STEM applications in ore petrology include the characterisation of Si-magnetite nano-precipitates in Si-bearing magnetite from banded iron formations [57].
Whereas pinpointing the ‘small’ and ‘smallest’ element clusters is acknowledged as one of the most provocative challenges in the material and environmental sciences [48], in ore petrology, “larger” (tens of Å), chemically complex crystal structures are excellent research topics for understanding the fundamental nature of solid solutions and the physical state (lattice bound or nanoparticles) of trace elements incorporated in minerals at the atomic scale.

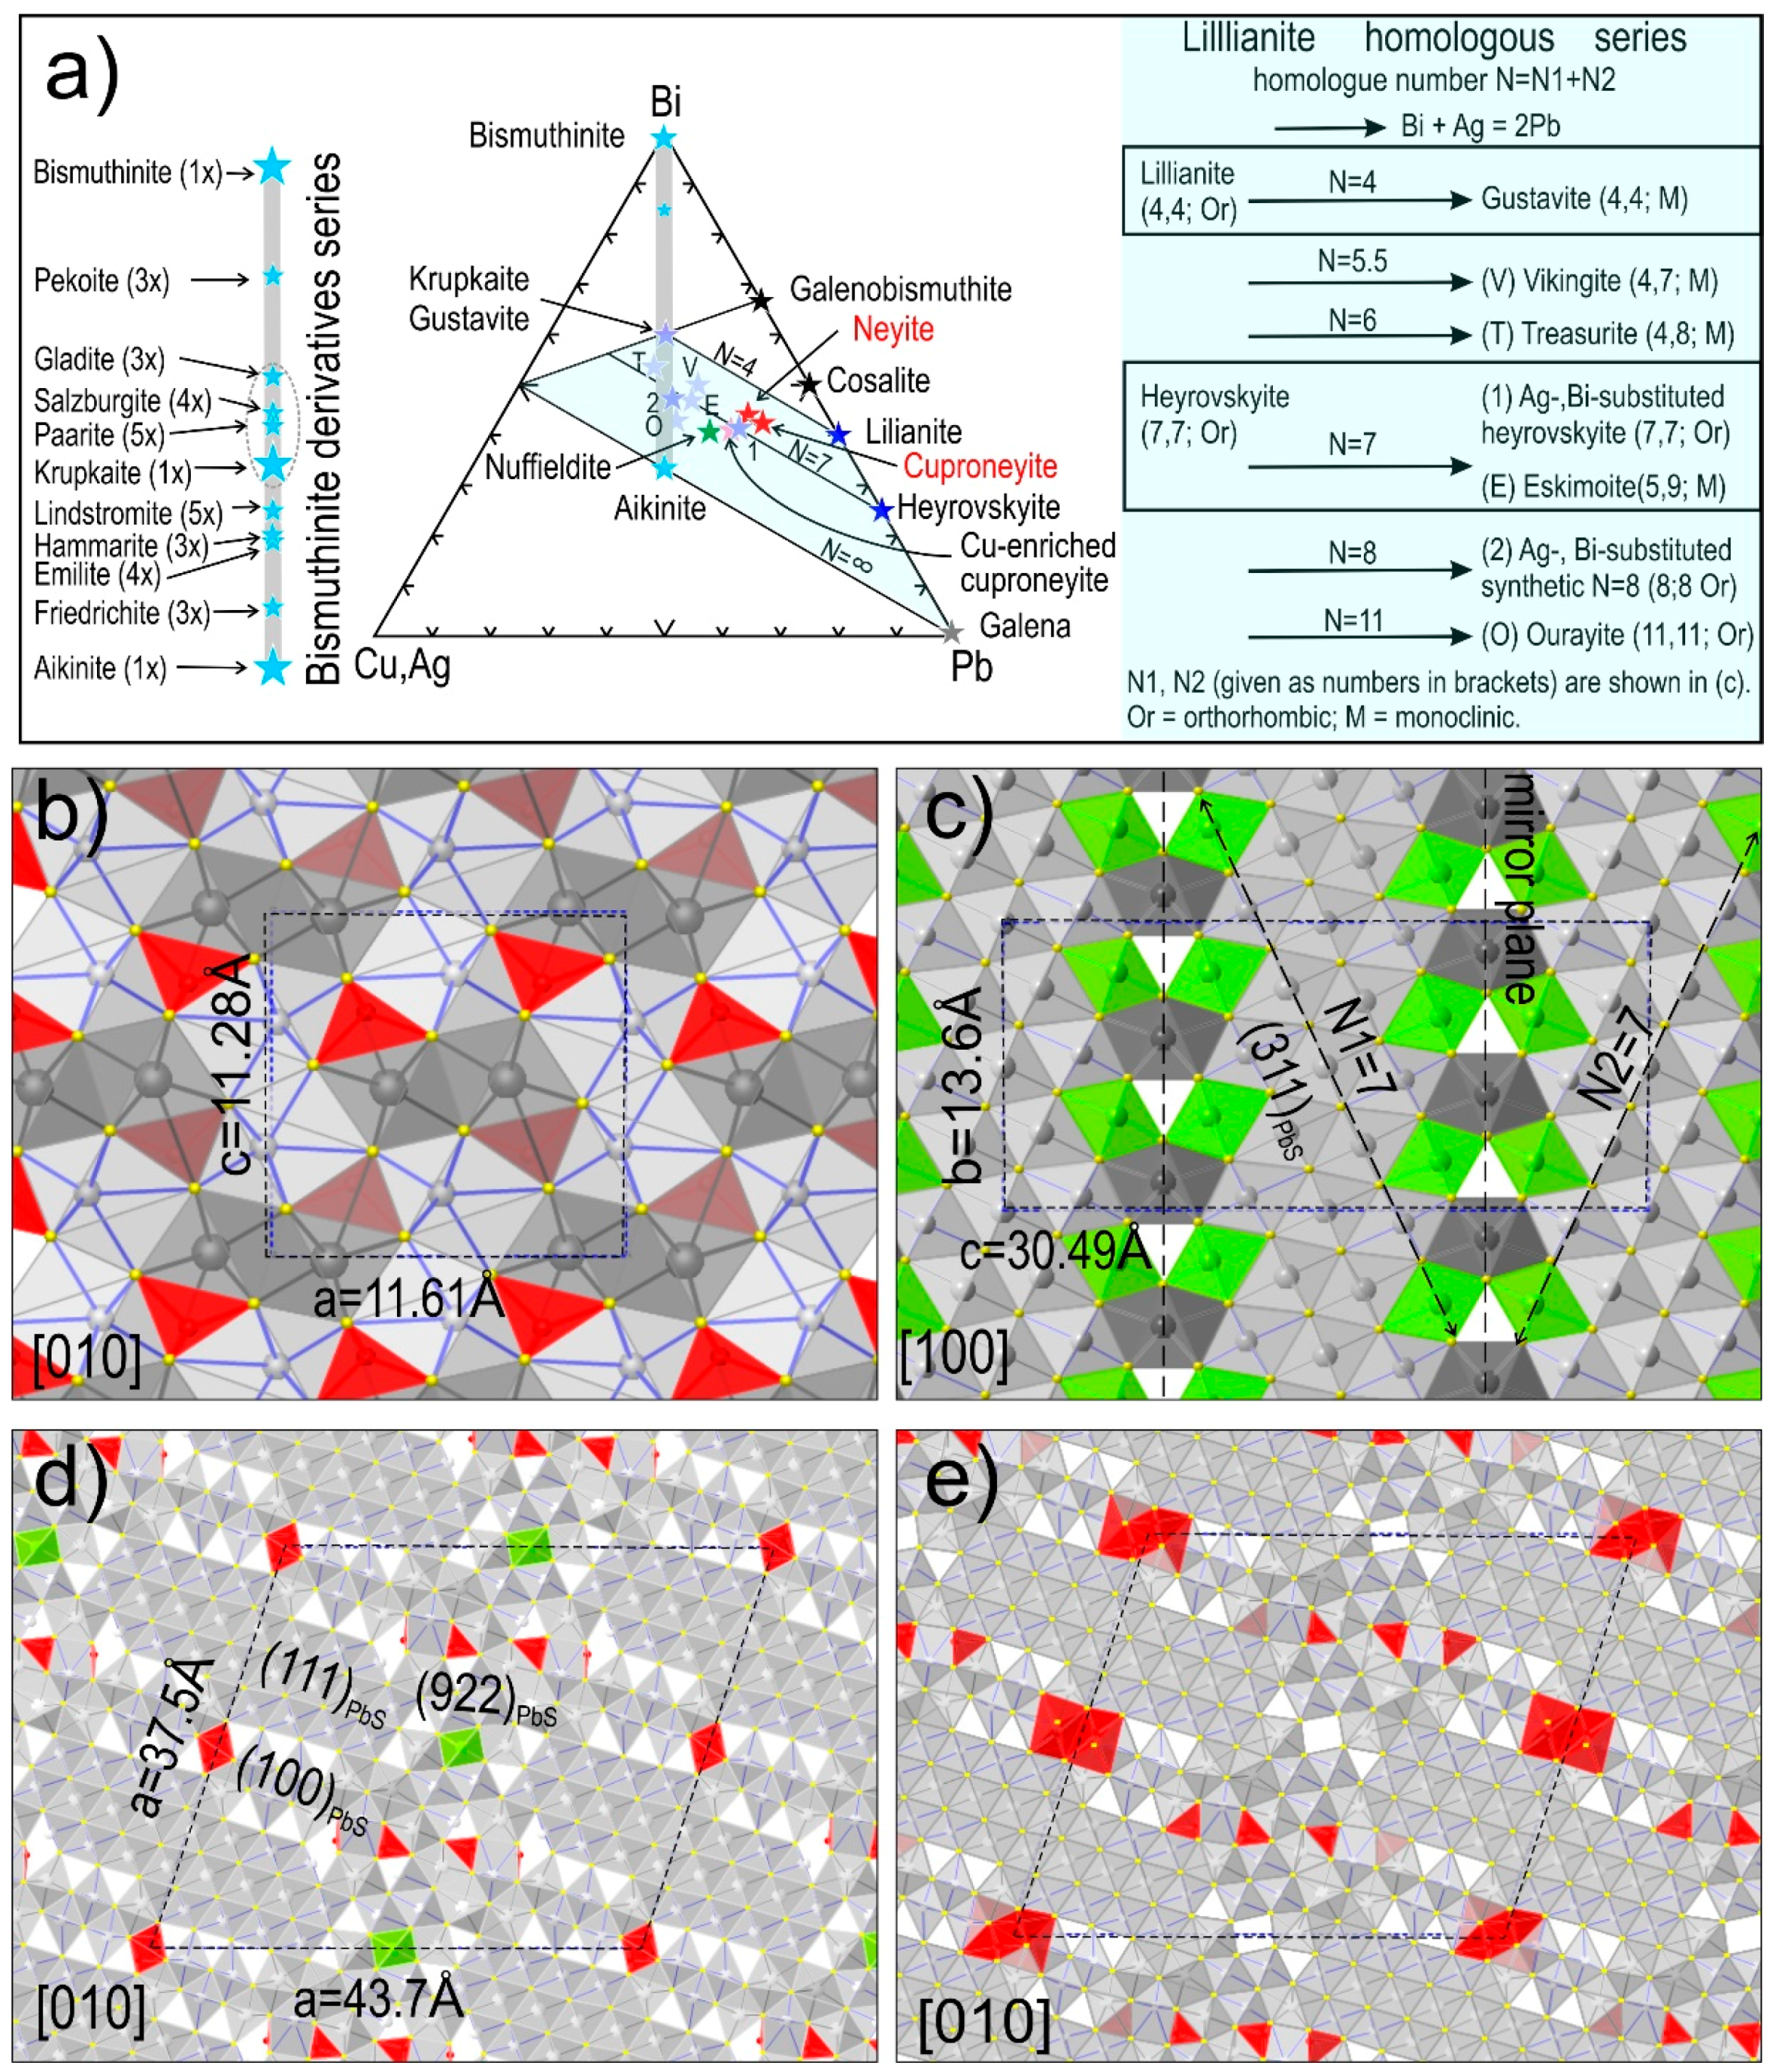
2.3. Modularity of Complex Sulphides—Bismuth Sulphosalts

The modern nomenclature of sulphides and related minerals is based on concepts of crystal structural modularity such as polytypism, polysomatism, and/or homology. These form the basis of their classification into distinct groups or series ([58] and references therein). Polytypes are defined by differences in the stacking arrangements of layers with the same configuration, with no or only very little chemical variation [59]. Polysomatism, as a concept, was introduced to describe silicates (e.g., [60]), based on the idea of ‘fragment-recombination’ for building modular structures [61]. Homology is a comparable formalism applied to sulphosalts (e.g., [58,62]), or to tetradymite and related bismuth chalcogenides [63,64,65]. In contrast to polytypes, homologues are composed of ‘moduli’ (blocks, rods, layers), in turn derived from archetypal, simpler structures (e.g., PbS, SnS, etc.), which are combined in various directions by building operators and/or accretional principles leading to incremental crystal and chemical changes from one homologue to another, throughout any given series [58]. Sulphosalts are a large group of chalcogeno-salts or complex sulphides where one or more of the cations Bi3+, Sb3+, As3+, or Te4+ is associated with one or more metallic cation(s), Me, as essential (intrinsic) constituents with the general formula: (Me+, Me2+, etc.)x[(Bi, Sb, As)3+, Te4+]y[(S, Se, Te)2−]z [62].
Of interest here are those species where Bi is the dominant cation (hereafter called bismuth sulphosalts) that form modular series; their compositions can be plotted in (Cu, Ag)2S-Bi2S3-PbS or simplified (Cu, Ag)-Bi-Pb ternary space (Figure 1a). Defined in the 1970s [66,67], the bismuthinite (Bi2S3)-aikinite (CuPbBiS3) series is represented as a central line drawn vertically downwards from the Bi apex in the (Cu,Ag)-Bi-Pb ternary space (Figure 1a). This series has been revisited by numerous studies dealing with the definition and redefinition of intermediate members, the compositional ranges of series members, and non-stoichiometry ([62], and references therein). The series comprises a range of ordered derivatives CuxPbxBi2−xS3 (x = 0–1) built by modifications of the bismuthinite unit cell by substitution of Bi according to the formula: Bi3+ + vacancy = Pb2+ + Cu+, imposing rigid compositional constraints: atoms per formula unit (a.p.f.u.) values for Pb and Cu are always equal. The stepwise filling of the bismuthinite structure leads to three equally sized cell ribbons (one for each end member and for krupkaite [66]).
This is shown for the fully-substituted structure in aikinite (Figure 1b). Larger members reported so far are 11 Å × n (where n = 3, 4, or 5) superstructures of the parent bismuthinite. Alternative models employed superspace formalism to show that superstructures from the krupkaite-gladite interval (Figure 1a) are interface commensurately modulated structures [68]. Structural disorder has been proven as coherent lattice-scale intergrowths between different members in the bismuthinite series [69,70], matching extensive compositional ranges often reported in natural samples [71], and often from different assemblages in a single locality (e.g., [72,73]).
Of direct relevance to the present work is the lillianite homologous series (Figure 1a,c), which consists of minerals with small modifications to the Bi/Pb ratio generated by polysynthetic twinning on the (311) planes of galena [77]. The lillianite homologous series is a typical accretionary series, in which modularity is expressed by the crystal structural formula: PbN−1−2xBi2+xAgxSN+2; and where N represents the average number (N = N1 + N2) of BiS6 octahedra along the (311)PbS directions (indices refer to the cubic galena unit cell) from the two sides of the mirror planes (Figure 1a,c) [78,79,80]. Silver-rich phases in the series are defined by the coupled substitution: Bi3+ + Ag1+ = 2Pb2+ with compositions plotting along the tie lines as shown in Figure 1a. The series includes lillianite (N = 4; 4L), and heyrovskyite (N = 7; 7L). Gustavite is the Ag-bearing end-member of the same N = 4 homologue. Also reported are Ag-Bi-substituted heyrovskyites (Ag1.31Pb3.37Bi3.32S9; [74], four discrete Ag-rich homologues (Figure 1a,c) [78,79], and a synthetic phase Ag2.25Pb2.5Bi4.25S10 equivalent to N = 8 homologue (8L); [81]). Natural Ag-free specimens are very rare, and are mostly found in young volcanic environments (e.g., [82]). As TEM studies have shown, discrete lillianite homologues and their intergrowths have structures derived from PbS with superstructure reflections along the [311]*PbS direction and equivalent parallel rows [83]. Based on this study, the N homologue number can be calculated from even index satellite reflections (n) along (311)PbS using the relation: n = N1 + N2 + 4.
Many natural specimens show extensive compositional fields that can be explained by the presence of lattice-scale intergrowths among different homologues (e.g., [7,84,85]), and structural disorder. Such observations are comparable with those obtained for synthetic phases, whether Ag-free [83], or Ag-rich [86]. One contentious issue is that Cu is considered incompatible within lillianite homologues [78,79,80], despite being often reported from natural specimens (and is also present in those described here).
Overlapping with the compositional field of substituted lillianite homologues are rare sulphosalts that can accommodate both Ag and Cu, such as neyite and related varieties (Figure 1a). Although the mineral was first described in 1969 [87], the crystal structure of neyite (Ag2Cu6Pb25Bi26S68) was not defined until much later by Makovicky et al. (2001) [75]. The structure is described as one of the largest boxwork types with three types of motifs: (111)PbS interleaved with (100)PbS blocks and separated by corrugated (922)PbS layers (Figure 1d). Although a number of hypothetical structures derived from neyite have been proposed, so far only Cu-rich species were found such as cuproneyite Cu7Pb27Bi25S68, where the independent Ag position in neyite is completely replaced by Cu (Figure 1e; [76]). In addition, other variants are discussed, among which is a “Cu-enriched cuproneyite” (Figure 1a).

3. Approach and Methodology

3.1. Case Study

The case study was selected to demonstrate how an integrated approach between various microbeam techniques can solve a problem in ore mineralogy, and particularly what advantages there are in using advanced electron microscopy such as high-resolution HAADF STEM mode for imaging. The study was carried out on samples from a massive assemblage comprised of different bismuth sulphosalts and galena collected from the deeper part of the Antoniu North Cu orepipe, one of several that make up the Baita Bihor Cu-Mo-Zn-Pb skarn deposit, in Romania [88]. Metal zonation in the Baita Bihor orefield [89] is superimposed by Au-(Ag)-richer ores closely associated with bismuth sulphosalts, lending the otherwise dominant Cu (Mo) orebodies a more polymetallic character [7,14,76]. Previous LA-ICP-MS study of this assemblage (Figure 2a) has shown wide variation in the concentration of Au measured in sulphosalts on either side of a boundary defining changes in sulphosalt speciation (from a few to several thousand ppm [90]). The presence of tiny, clustered inclusions of native gold within microfractures along this boundary (Figure 2b) partially explains such variations. Unusual, however, is the transition from Cu-Ag-bearing Pb-Bi-sulphosalts on one side of the boundary, to aikinite on the other side, with the change taking place along the same lamellae (Figure 2a). Considering that Cu increases across this boundary from 1.5–5.5 wt % to 11 wt %, respectively, the main question addressed here is whether such a ‘front of reaction’ expressed as a steep Cu gradient is also a direct proxy for Au enrichment in the ore, and if so, whether this enrichment process can also be tracked down to the nanoscale.
The present study includes petrographic characterisation of bismuth sulphosalts in terms of textures and composition, combined with LA-ICP-MS trace element mapping of an area close to the reaction front discussed above. This is complemented by FIB-SEM cross-section imaging and nanoscale studies (HR-TEM imaging and electron diffractions) of several FIB-prepared foils obtained from the mapped area (after sample repolishing). In these foils, Au and Cu concentration gradients correlate with compositional changes in the sulphosalts. The TEM foil cut through one of the less common bismuth sulphosalts was also studied using HAADF STEM high-resolution imaging, as well as EDS mapping/profile and spot analyses.

3.2. Methodology

All instrumentation used in this study is housed at Adelaide Microscopy, The University of Adelaide. All work was performed on polished blocks, one-inch in diameter.

3.2.1. Scanning Electron Microscopy

Polished blocks were examined in backscatter electron mode using a FEI Quanta 450 Field Emission Gun scanning electron microscope equipped with a silicon-drift energy-dispersive X-ray spectrometer.

3.2.2. Electron Probe Microanalysis

Quantitative compositional data was obtained on a Cameca SX-Five Electron Probe Microanalyser (EPMA) running Probe Software [91]. Operating conditions were 20 keV accelerating voltage, 20 nA beam current, 40° takeoff angle, and a beam size of 1 μm. We measured the following elements: Cu (Kα), Ag (Lα), Pb (Mα), Cd (Lα), Bi (Mα), Sb (Lα), S (Kα), Te (Lα), and Se (Lα). Iron (Kα) and As (Lα) were also measured but were below minimum detection limits in all analyses (0.03 and 0.04 wt %, respectively). Count times were 20 s for both standards and unknowns. Standards used were chalcopyrite (Cu, Fe), Ag2Te (Ag, Te), galena (Pb), Bi2Se3 (Bi, Se), stibnite (Sb), Ag2Te (Te), Bi2Se3 (Se), CdS (Cd, S), and GaAs (As). Minimum limits of detection (in wt %) were 0.03 (Cu), 0.06 (Ag), 0.10 (Pb), 0.05 (Cd), 0.11 (Bi), 0.03 (Sb), 0.05 (S), 0.03 (Te), and 0.04 (Se). Detection limits were calculated at 99% confidence (3 sigma) taking into account both on peak and background count times, beam current, and the concentration and X-ray intensity of the element in the standard.

3.2.3. Laser Ablation Inductively Coupled Plasma Mass Spectrometry (LA-ICP-MS)

The spatial distribution of trace and minor elements in a selected area of the polished block was carried out via LA-ICP-MS analysis using a Resonetics 193 ArF M-50 Excimer laser ablation system (Resonetics, Nashua, NH, USA) coupled to an Agilent 7700x ICP-MS (Agilent Technologies, Santa Clara, CA, USA). Analysis followed established practices in our laboratory for Pb-bearing ore minerals (e.g., [92]). Utilising a spot size of 14 microns and a laser frequency of 10 Hz, the output energy of the laser was controlled to reach a desired fluence at sample of ~3–4 J/cm2. The following isotopes were mapped: 34S, 55Mn, 56Fe, 59Co, 60Ni, 65Cu, 66Zn, 82Se, 107Ag, 111Cd, 118Sn, 121Sb, 125Te, 197Au, 205Tl, 208Pb, and 209Bi. Bismuth was used for internal calibration for processing the maps. The microanalytical reference material MASS-1 (US Geological Survey) was used as the reference material. Images were compiled and processed using the open-source software package Iolite, an add-in for the data analysis program Igor (WaveMetrics, Portland, OR, USA). Standards were analysed immediately before and after each mapping run to correct for instrument drift, with corrections applied using a linear fit between the two standard sets. The average background intensity for each element was subsequently subtracted from the corresponding raster and the resulting time-resolved intensities were compiled into a 2-D image.

3.2.4. Focused Ion Beam-SEM (FIB-SEM)

Cross-section imaging and TEM sample preparation were performed on a FEI-Helios nanoLab (FEI, Hillsboro, OR, USA) Dual Focused Ion Beam and Scanning Electron Microscope (FIB-SEM) at the University of Adelaide. Procedures outlined by Ciobanu et al. (2011) [7] were followed in extraction and thinning (to <100 nm) of TEM foils by ion beam (Ga+) milling. The TEM foils were attached to Cu grids.

3.2.5. Transmission Electron Microscopy

High-Resolution (HR)-TEM imaging in Bright Field mode (BF) and electron diffraction were performed using a Philips CM200 TEM (Philips, Eindhoven, The Netherlands). The instrument was equipped with a LaB6 source and operated at 200 kV, and utilises a double-tilt holder and a Gatan Orius digital camera (Gatan Inc., Pleasanton, CA, USA). Energy-dispersive X-Ray spectra (EDS) were acquired using an Oxford Instruments X-Max 65T SDD detector (Oxford Instruments, Abingdon, UK) running the Aztec software. Diffraction measurements were performed using DigitalMicrograph™ 3.11.1 (Gatan Inc., Pleasanton, CA, USA) and Winwulff© 1.4.0 software (JCrystalSoft, Livermore, CA, USA). Publicly available data from the American Mineralogist Crystal Structure Database [93] were used for indexing of the electron diffractions.
HAADF STEM imaging and EDS measurements were performed on an ultra-high resolution, probe corrected, FEI Titan Themis S/TEM (FEI, Hillsboro, OR, USA). This was equipped with the X-FEG Schottky source and Super-X EDS geometry. The Super-X detector provides geometrically symmetric EDS detection with an effective solid angle of 0.8 Sr. Probe correction delivered sub-Angstrom spatial resolution and an inner collection angle greater than 50 mrad were used for HAADF experiments using the Fischione HAADF detector. Further details of detector performance are provided in [94].

4. Results

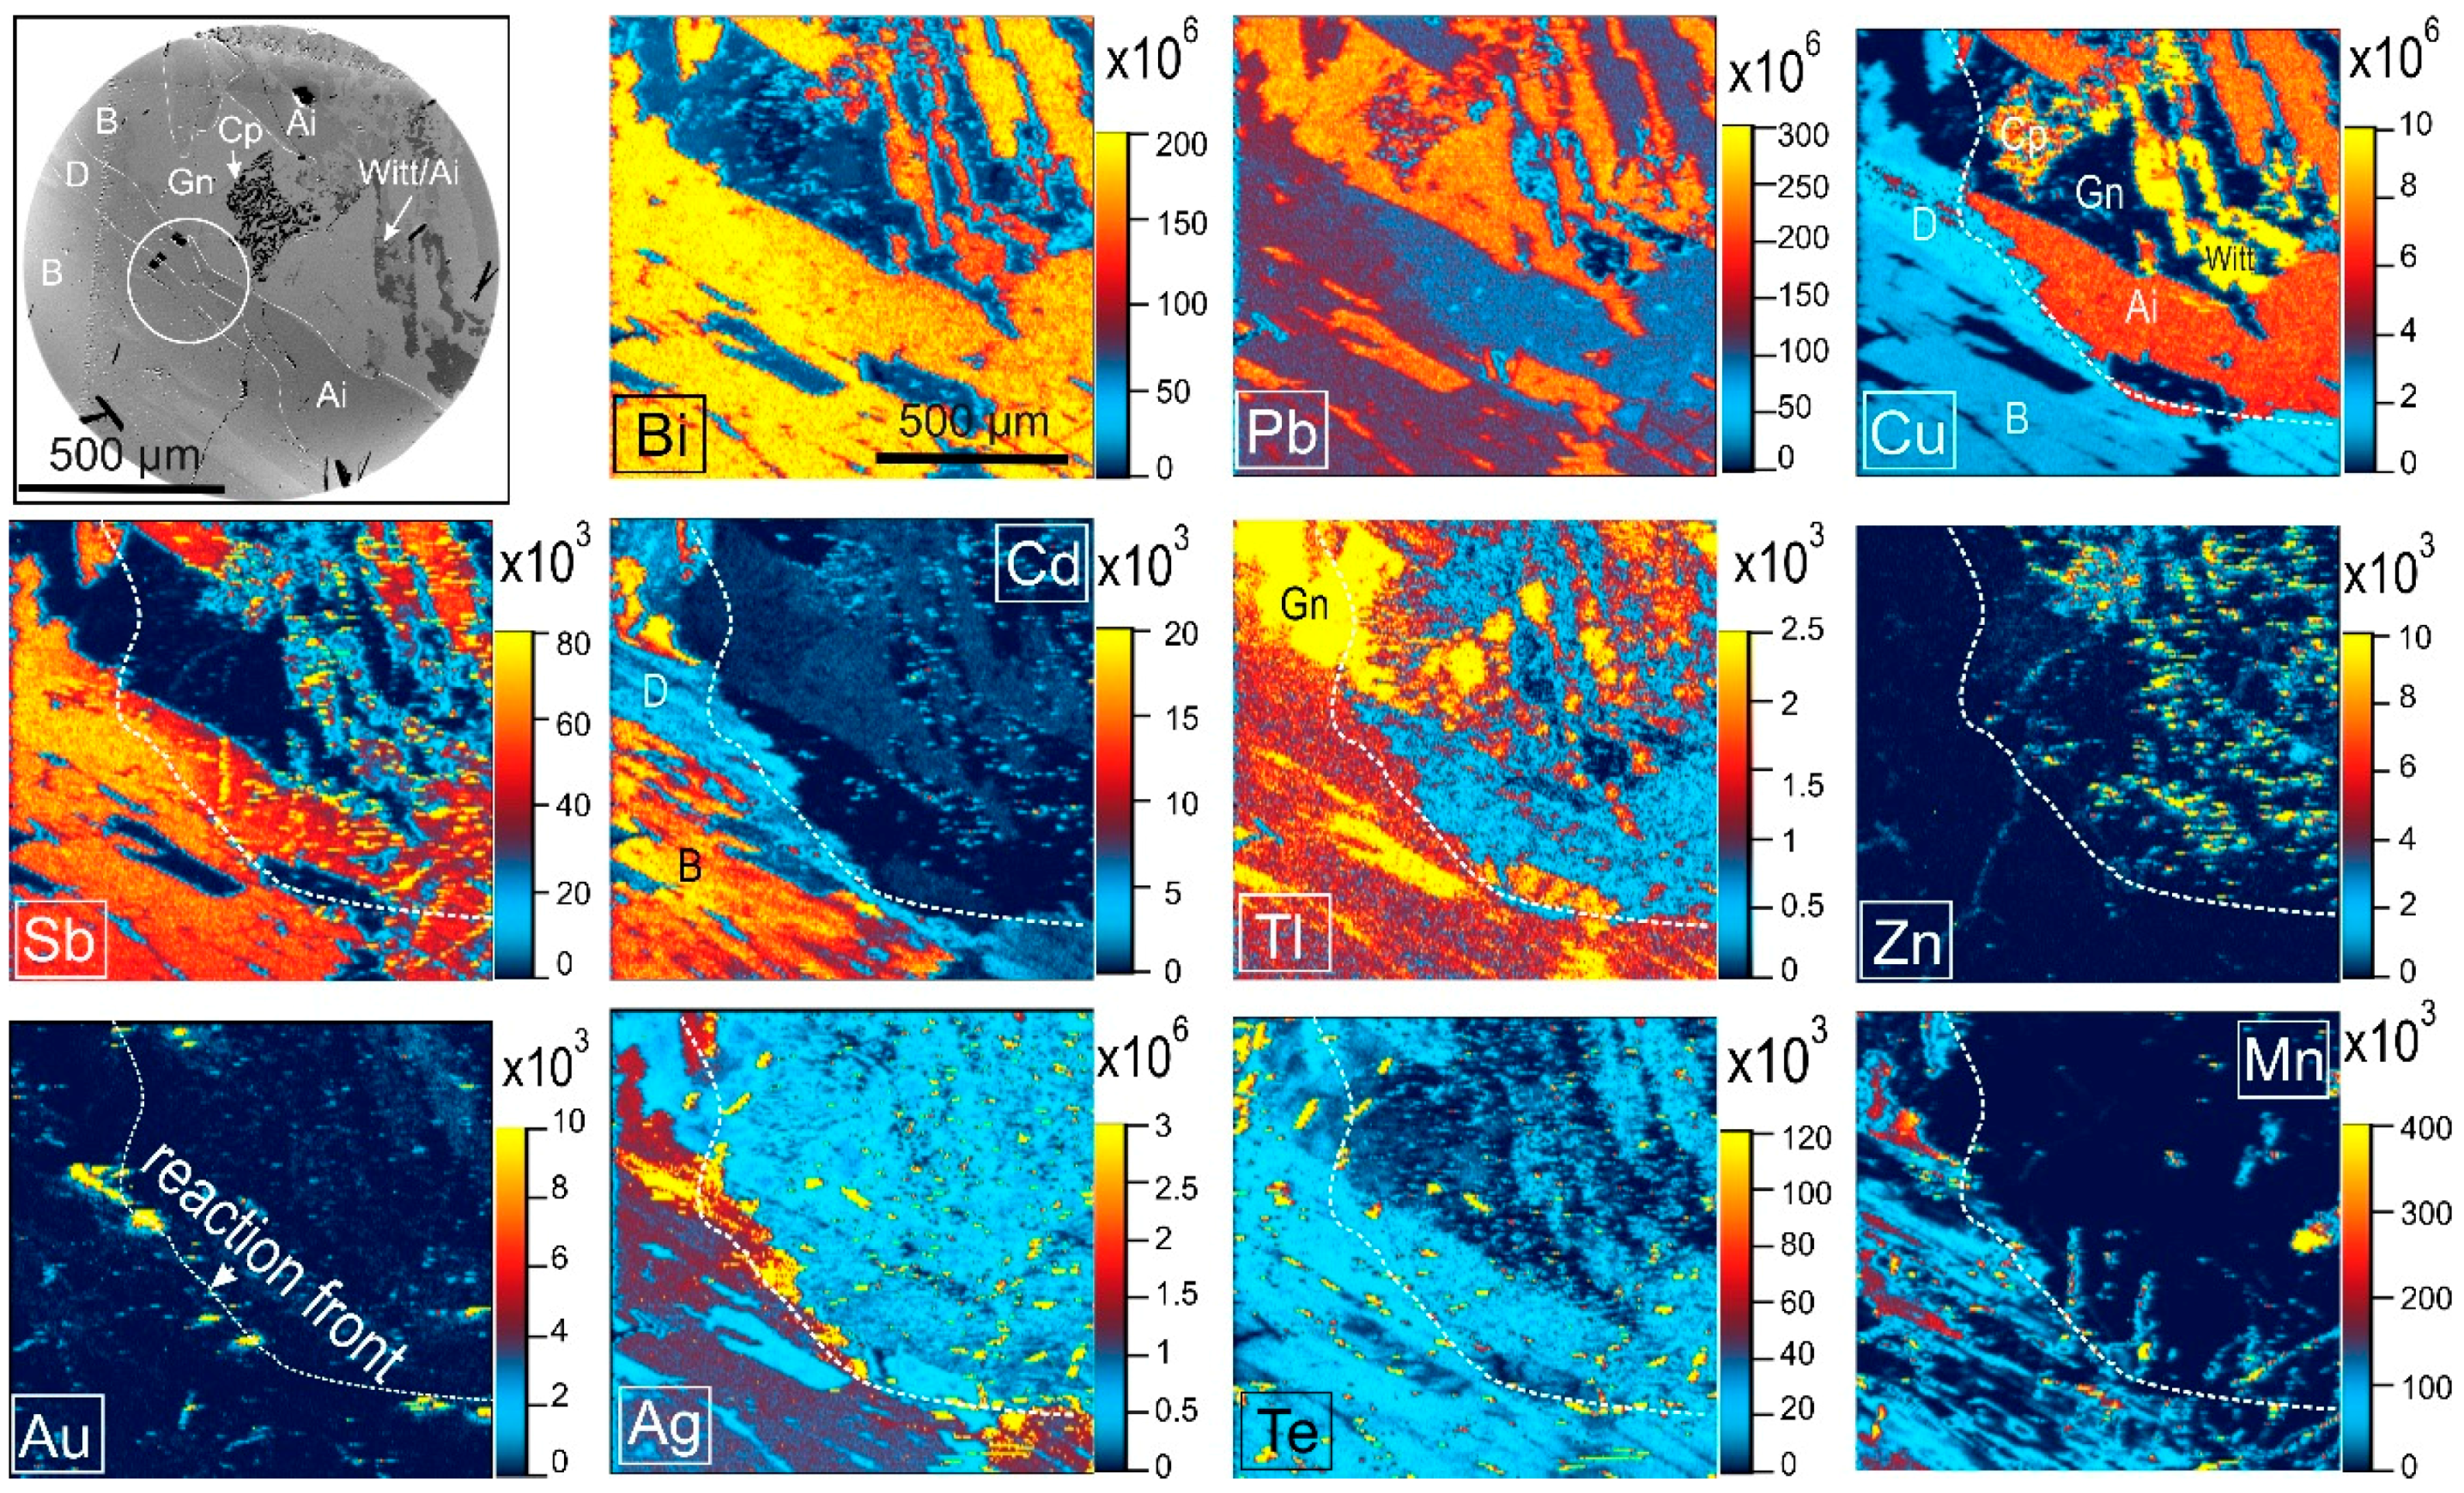
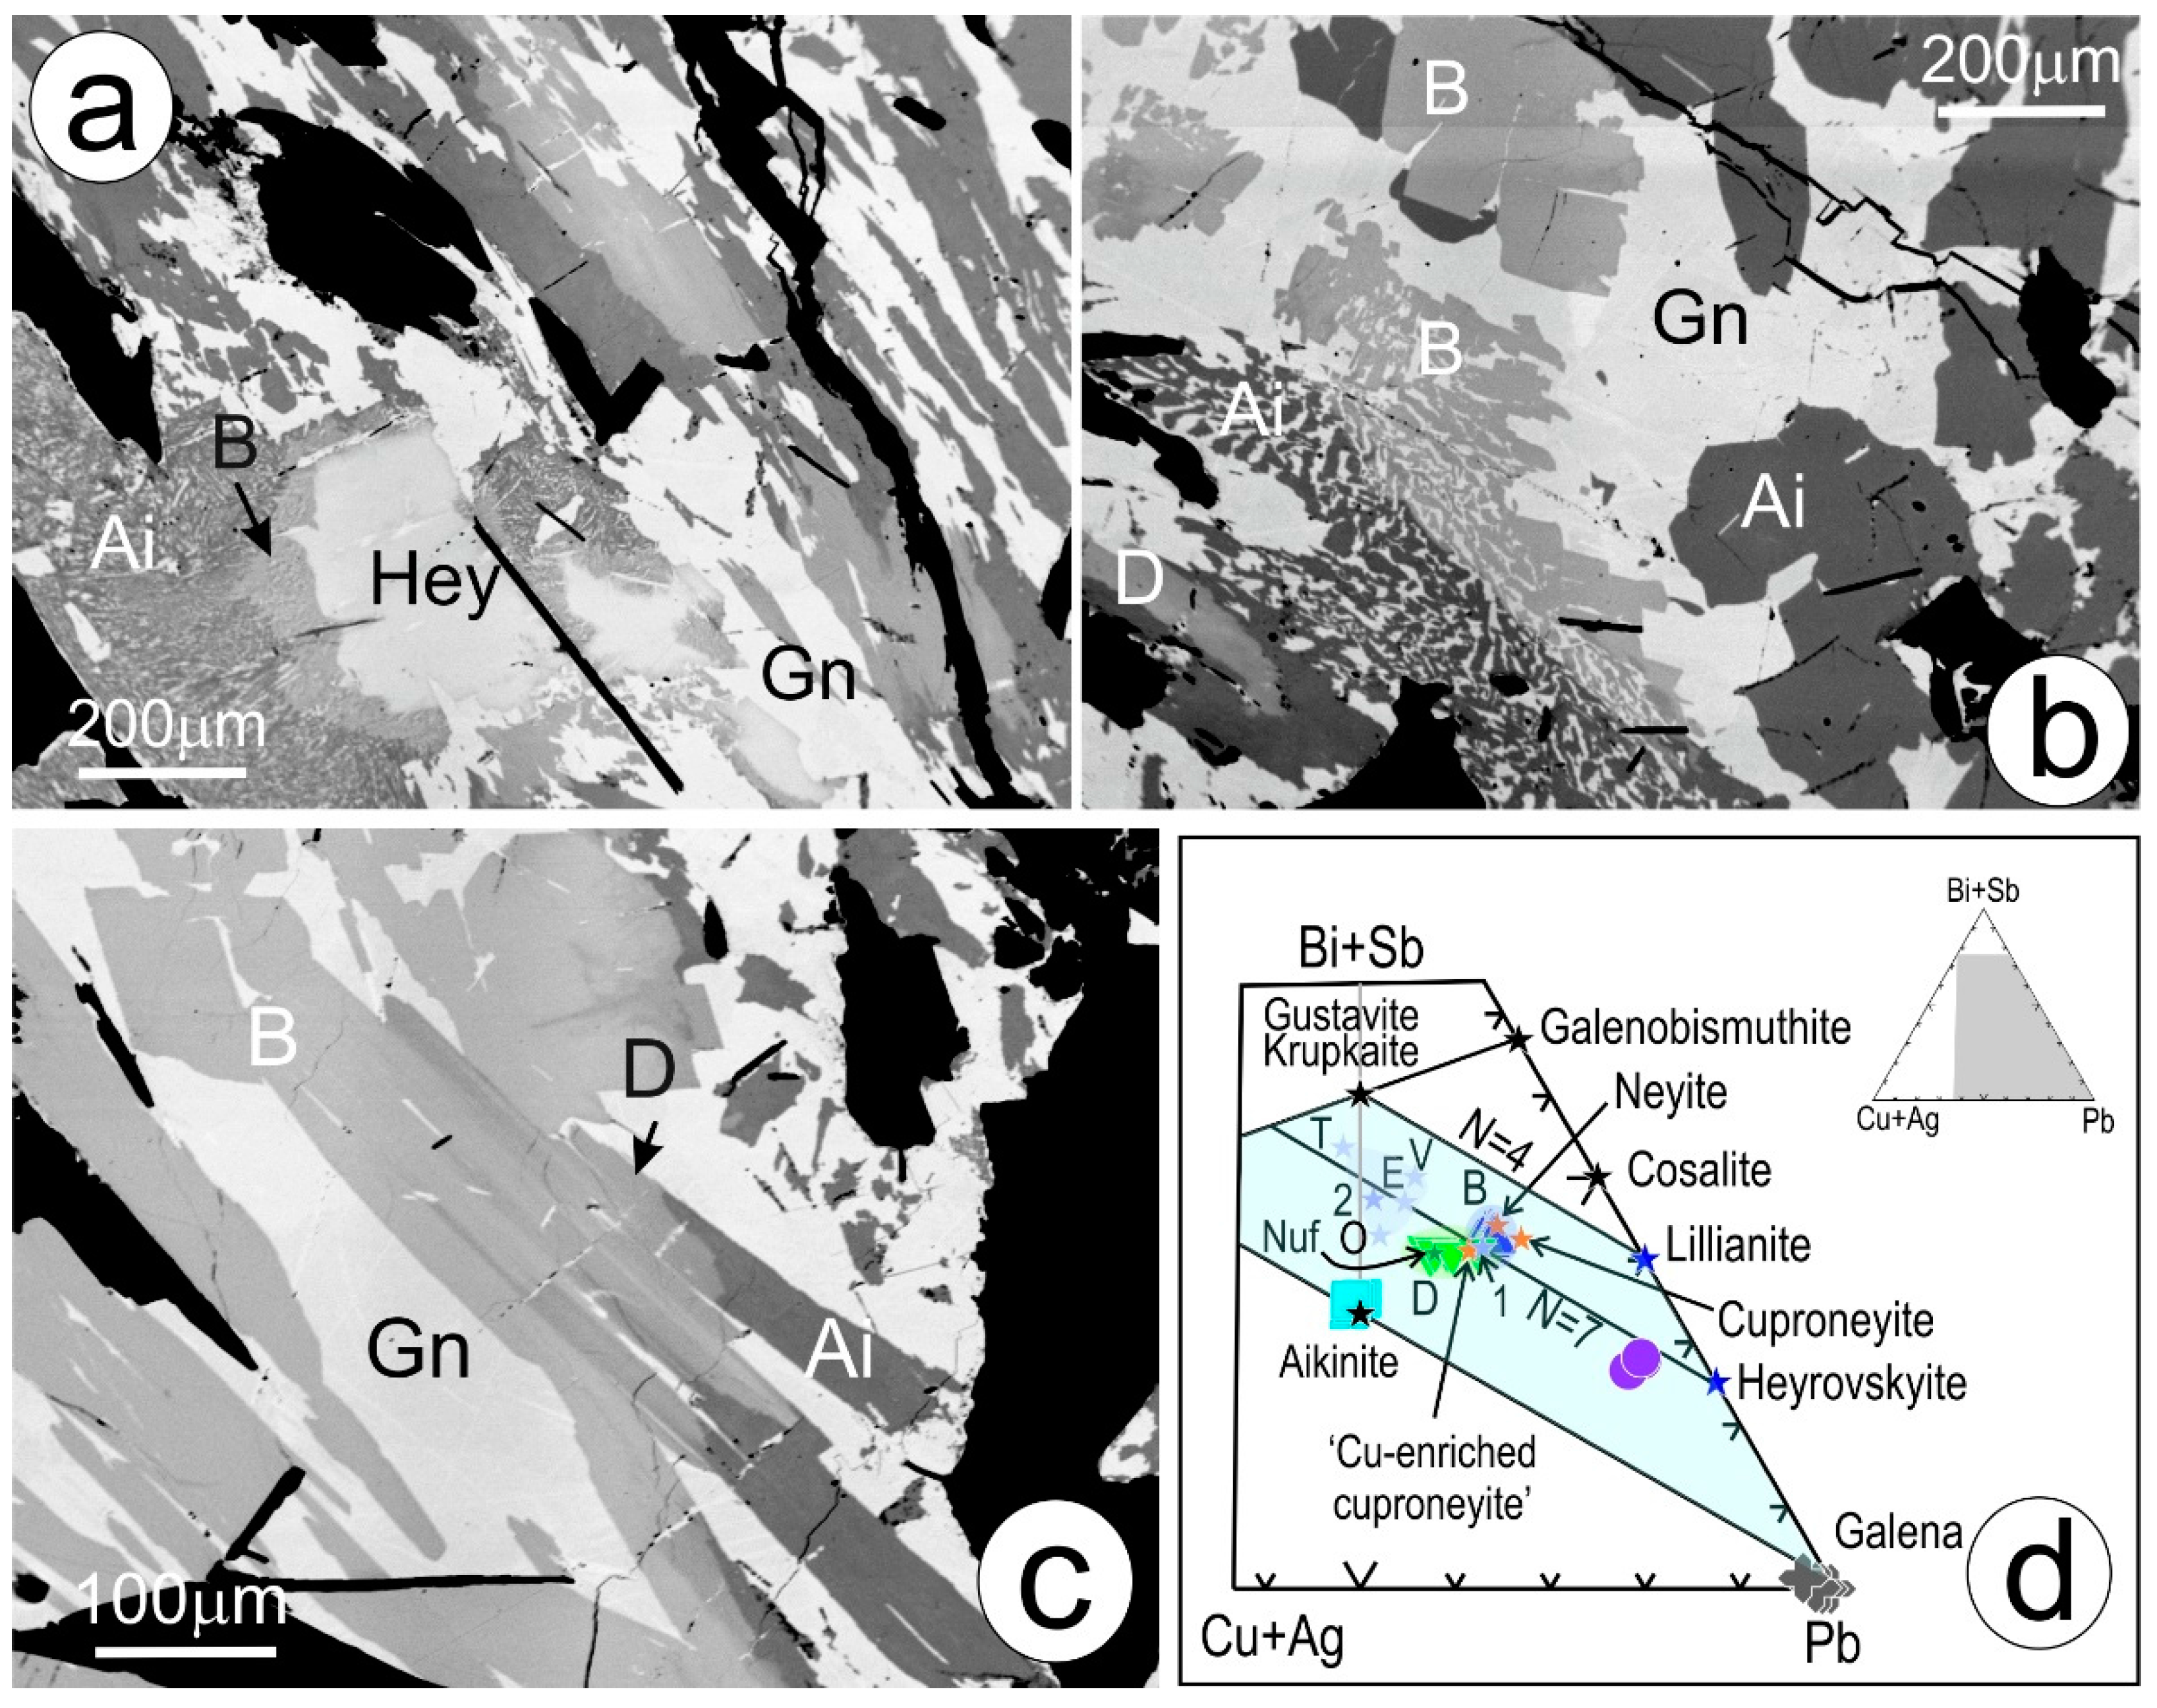
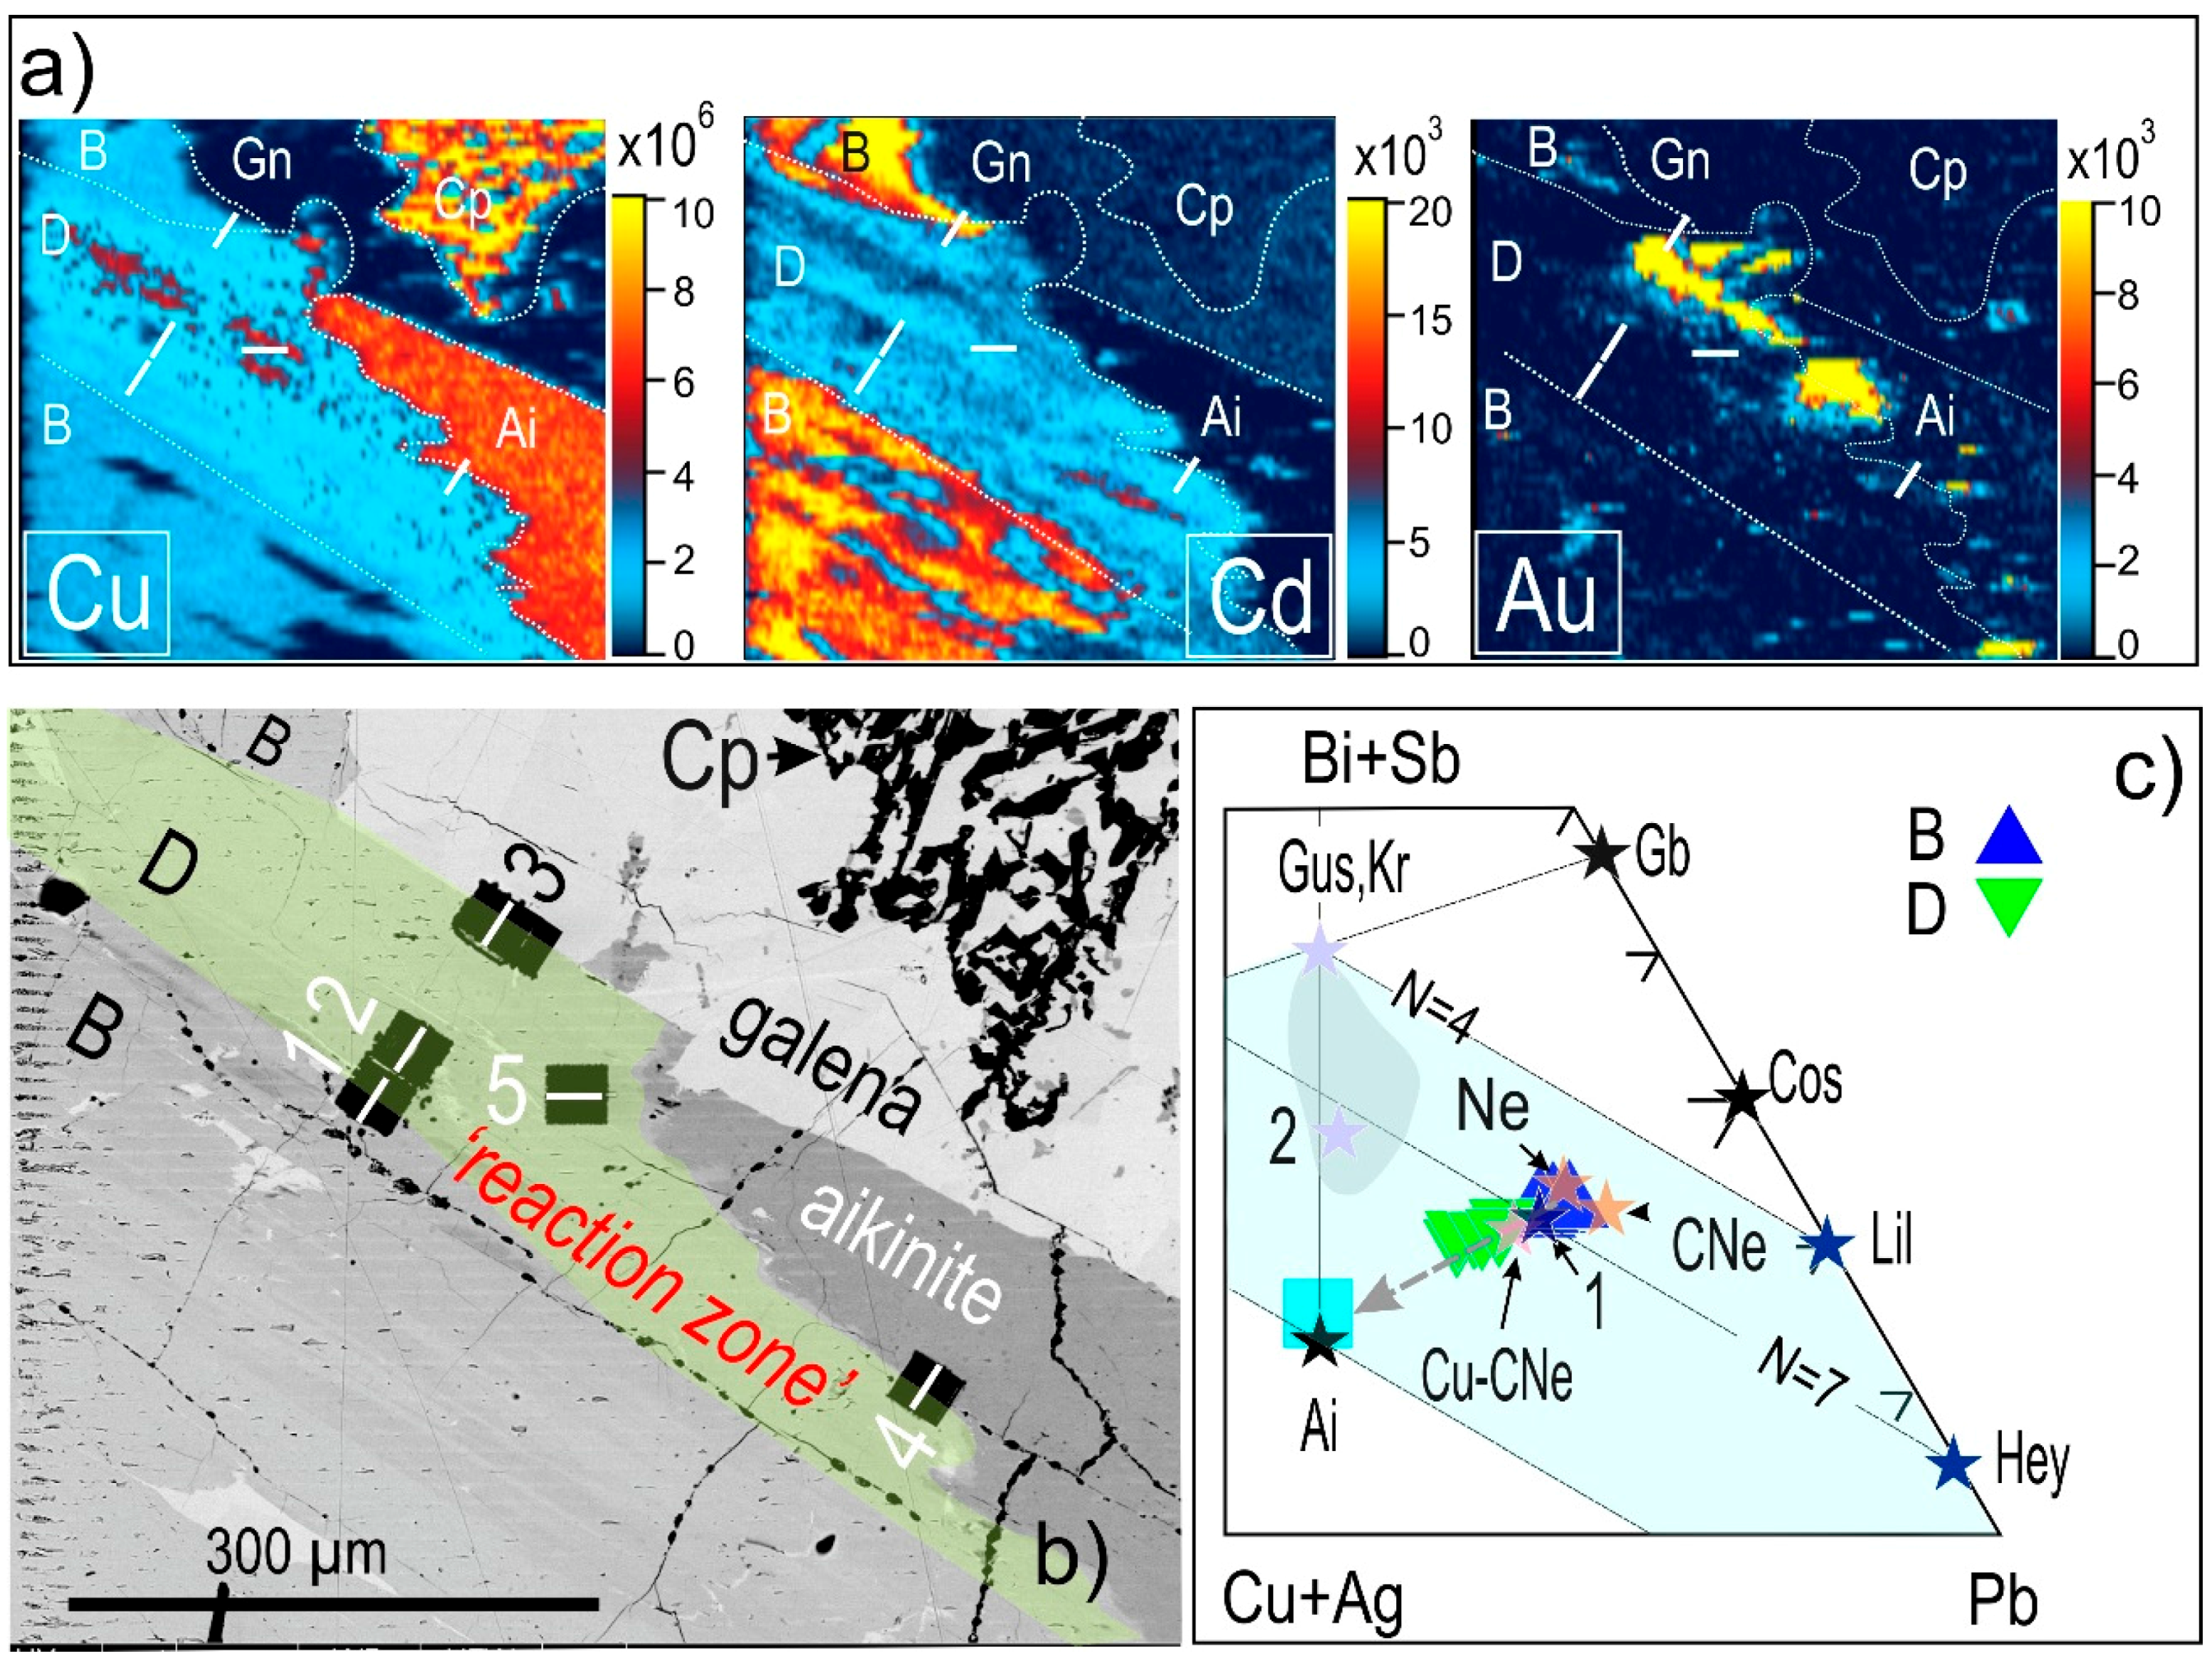
4.1. Bismuth Sulphosalt Associations: Petrography, Composition, and Trace Elements

Hosted within humite skarn, the ore assemblage features intricate intergrowths among sulphosalts, either symplectites between different species and galena, or lamellar intergrowths (Figure 3a–c). Minor ore minerals in this assemblage include chalcopyrite, alabandite, wittichenite and widespread Bi-(Pb)-sulphotellurides and hessite. Mainly due to the Cu increase towards grain contacts with aikinite, subtle compositional variation in the Pb-Bi-sulphosalts is seen in many of the lamellar aggregates throughout the polished block. In contrast, the phases within the symplectites are compositionally relatively homogenous.
Compositional data for the bismuth sulphosalts (Figure 3d; Supplementary Materials Table S1) shows the presence of close to end-member heyrovskyite with the empirical composition (Cu0.08, Ag0.46)0.54Pb5.13Bi2.25(S9.03Te0.03Se0.02)9.08, and aikinite [Cu0.96Ag0.02Pb0.92Bi1.04(S3.05Te0.01Se0.01)3.06]. Respectively, these phases appear as light grey and dark grey on the BSE images (Figure 3a–c). Data obtained from the Pb-Bi-ss with subtle compositional variation (e.g., Figure 3d) form two clusters close to one another, straddling the N = 7 substitution line and the bismuthinite derivatives. These are hereafter termed ‘B’ and ‘D’ for the bright and dark phases, respectively. For comparative purposes, empirical formulae calculated on the basis of 17 apfu (as in heyrovskyite) are [(Cu0.90Ag0.27)1.17(Pb3.27Cd0.01)3.28(Bi3.35Sb0.01)3.36(S9.15Te0.03Se0.02)9.2] for B, and [(Cu1.34Ag0.30)1.64Pb2.97(Bi3.29Sb0.01)3.30(S9.04Te0.03 Se0.02)9.09] for D. If the amount of Cu is considered together with Ag, these compositions are very similar to the Ag-Bi-substituted heyrovskyite [74]. However, the two clusters are also positioned close to the compositional field for neyite (Cu6Ag2Pb25Bi26S68; [75]), cuproneyite (Cu7Pb27Bi25S68), and so-called ‘Cu-enriched’ cuproneyite (Cu11Pb25Bi25S68). The latter two species have been reported in other samples from Baita Bihor [76]. For the sake of comparison with these neyite species, the empirical formulae were calculated on the basis of 127 apfu. These calculations give [Cu6.74Ag2.00(Pb24.41Cd0.06)24.47(Bi25.06Sb0.05)25.11(S68.33Te0.21Se0.14)68.67] and [Cu9.98Ag2.26Pb22.20(Bi24.61Sb0.04)24.65(S67.52Te0.24Se0.13)67.90] for B and D, respectively. Phase D was also calculated on the basis of 129 atoms per formula unit (apfu) to give [Cu10.14Ag2.29Pb22.55(Bi25.00Sb0.04)25.04 (S68.59Te0.25Se0.14)68.97]. In contrast to published data for neyite and its Cu-rich variants, the data in the present study indicates phases that are both Ag- and Cu-bearing. The principal difference lies in the Cu content, which is as much as 1–2 wt % (Supplementary Materials Table S1).
Moreover, the Cu-richer cluster (D) also overlaps with the compositional field of nuffieldite on the same plot. Nuffieldite was initially given as [Pb2Cu(Pb,Bi)Bi2S7] [95], and subsequently revised to [(Pb2Cu1.4(Pb0.4Bi0.4Sb0.2)Bi2S7] [96]. Although nuffieldite is ideally Ag-free, minor amounts of Ag have also been reported, albeit without supporting crystal-structural studies [72]. Minor elements at concentrations measurable by EPMA are Sb (mean 0.06 wt %) in both the D and B phases, and Te and Se throughout all the Bi-ss species (Te ~0.2 wt %; Se ~0.08 wt %), with no preference between the D and B phases. Thus, whereas aikinite, heyrovskyite, and wittichenite are readily identified, EPMA data alone do not allow a discrimination of speciation among the bright and dark Bi-ss within the lamellar intergrowths.
LA-ICP-MS mapping (Figure 4) of an area adjacent to the Au-rich boundary in Figure 2a provides further insight into the phase assemblage, particularly with respect to the distribution of major and trace elements across the “reaction front”, i.e., from the Cu-rich domain (aikinite, chalcopyrite, and wittichenite) to the domain dominated by Pb-Bi-sulphosalts (B and D). Galena is present as a matrix within both domains. While maps for Bi and Pb show little variation and primarily the main sulphosalt-galena association, the diversity of Cu minerals is revealed on the map for that element. Cadmium (below minimum detection limits by EPMA) is preferentially concentrated in B over D, valuable evidence in support of the hypothesis that the two clusters represent distinct Pb-Bi-sulphosalt species. Thallium is preferentially concentrated in galena relative to the Pb-Bi-sulphosalts. Antimony and Zn correlate with one another, occurring as spots of high concentrations within the Cu-domain. Manganese is mostly concentrated within the Pb-Bi-ss domain, both within the sulphosalts and as high-concentration spots. Most importantly, high concentrations of Au trace the “reaction zone”. Silver concentrations correlate with both Au and Te, the latter occurring as high-concentration spots scattered throughout the mapped area.
The combined petrographic and trace element study helped in identifying an area of the polished section in which the diversity of sulphosalt species and trace element distributions are strongly indicative of Au(+Ag) enrichment onto a precursor assemblage. The question addressed is if studied down to the nanoscale, can the changes in sulphosalt speciation and the mutual relationships of sulphosalt species provide unequivocal evidence of how this process takes place?

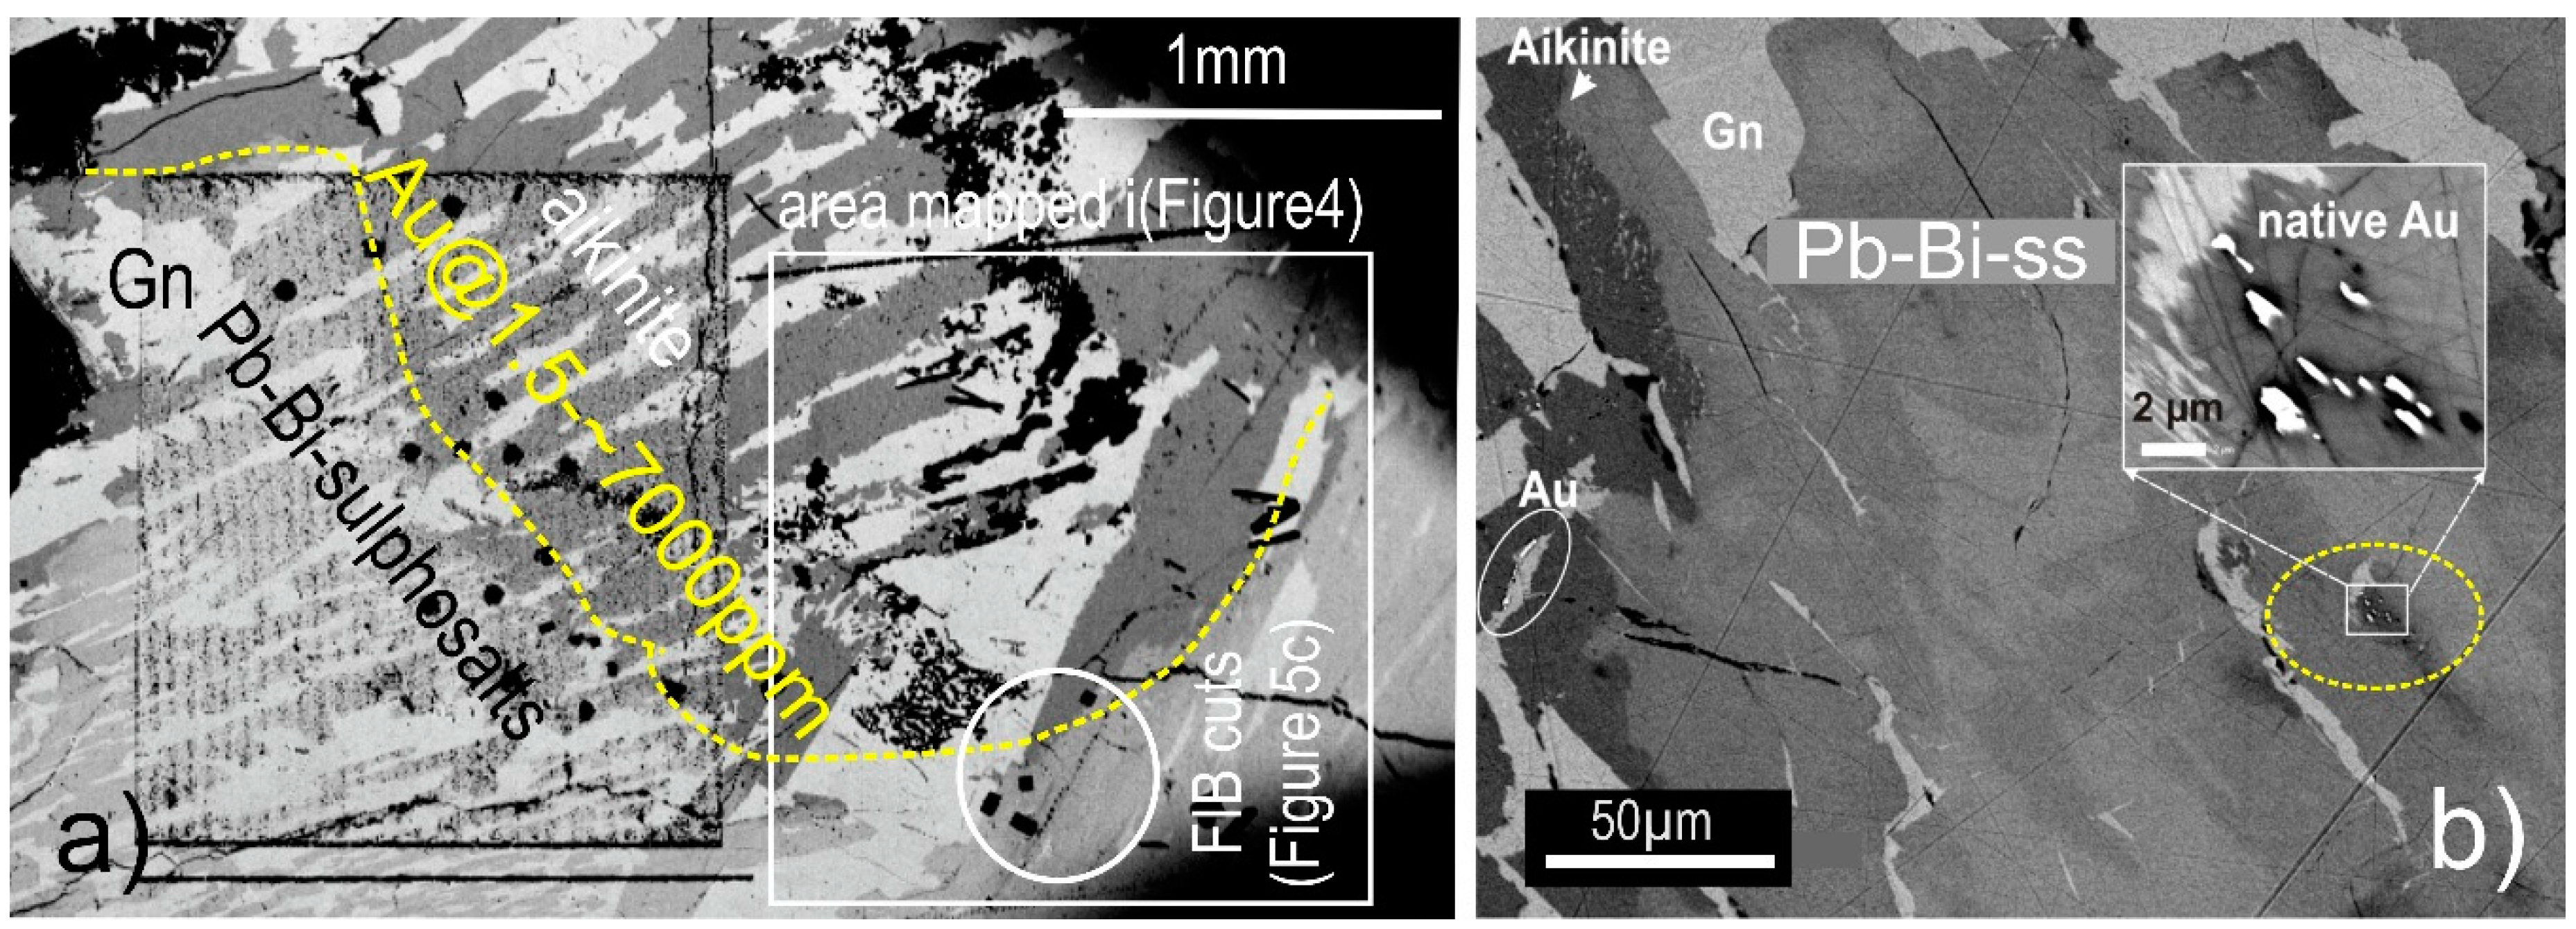
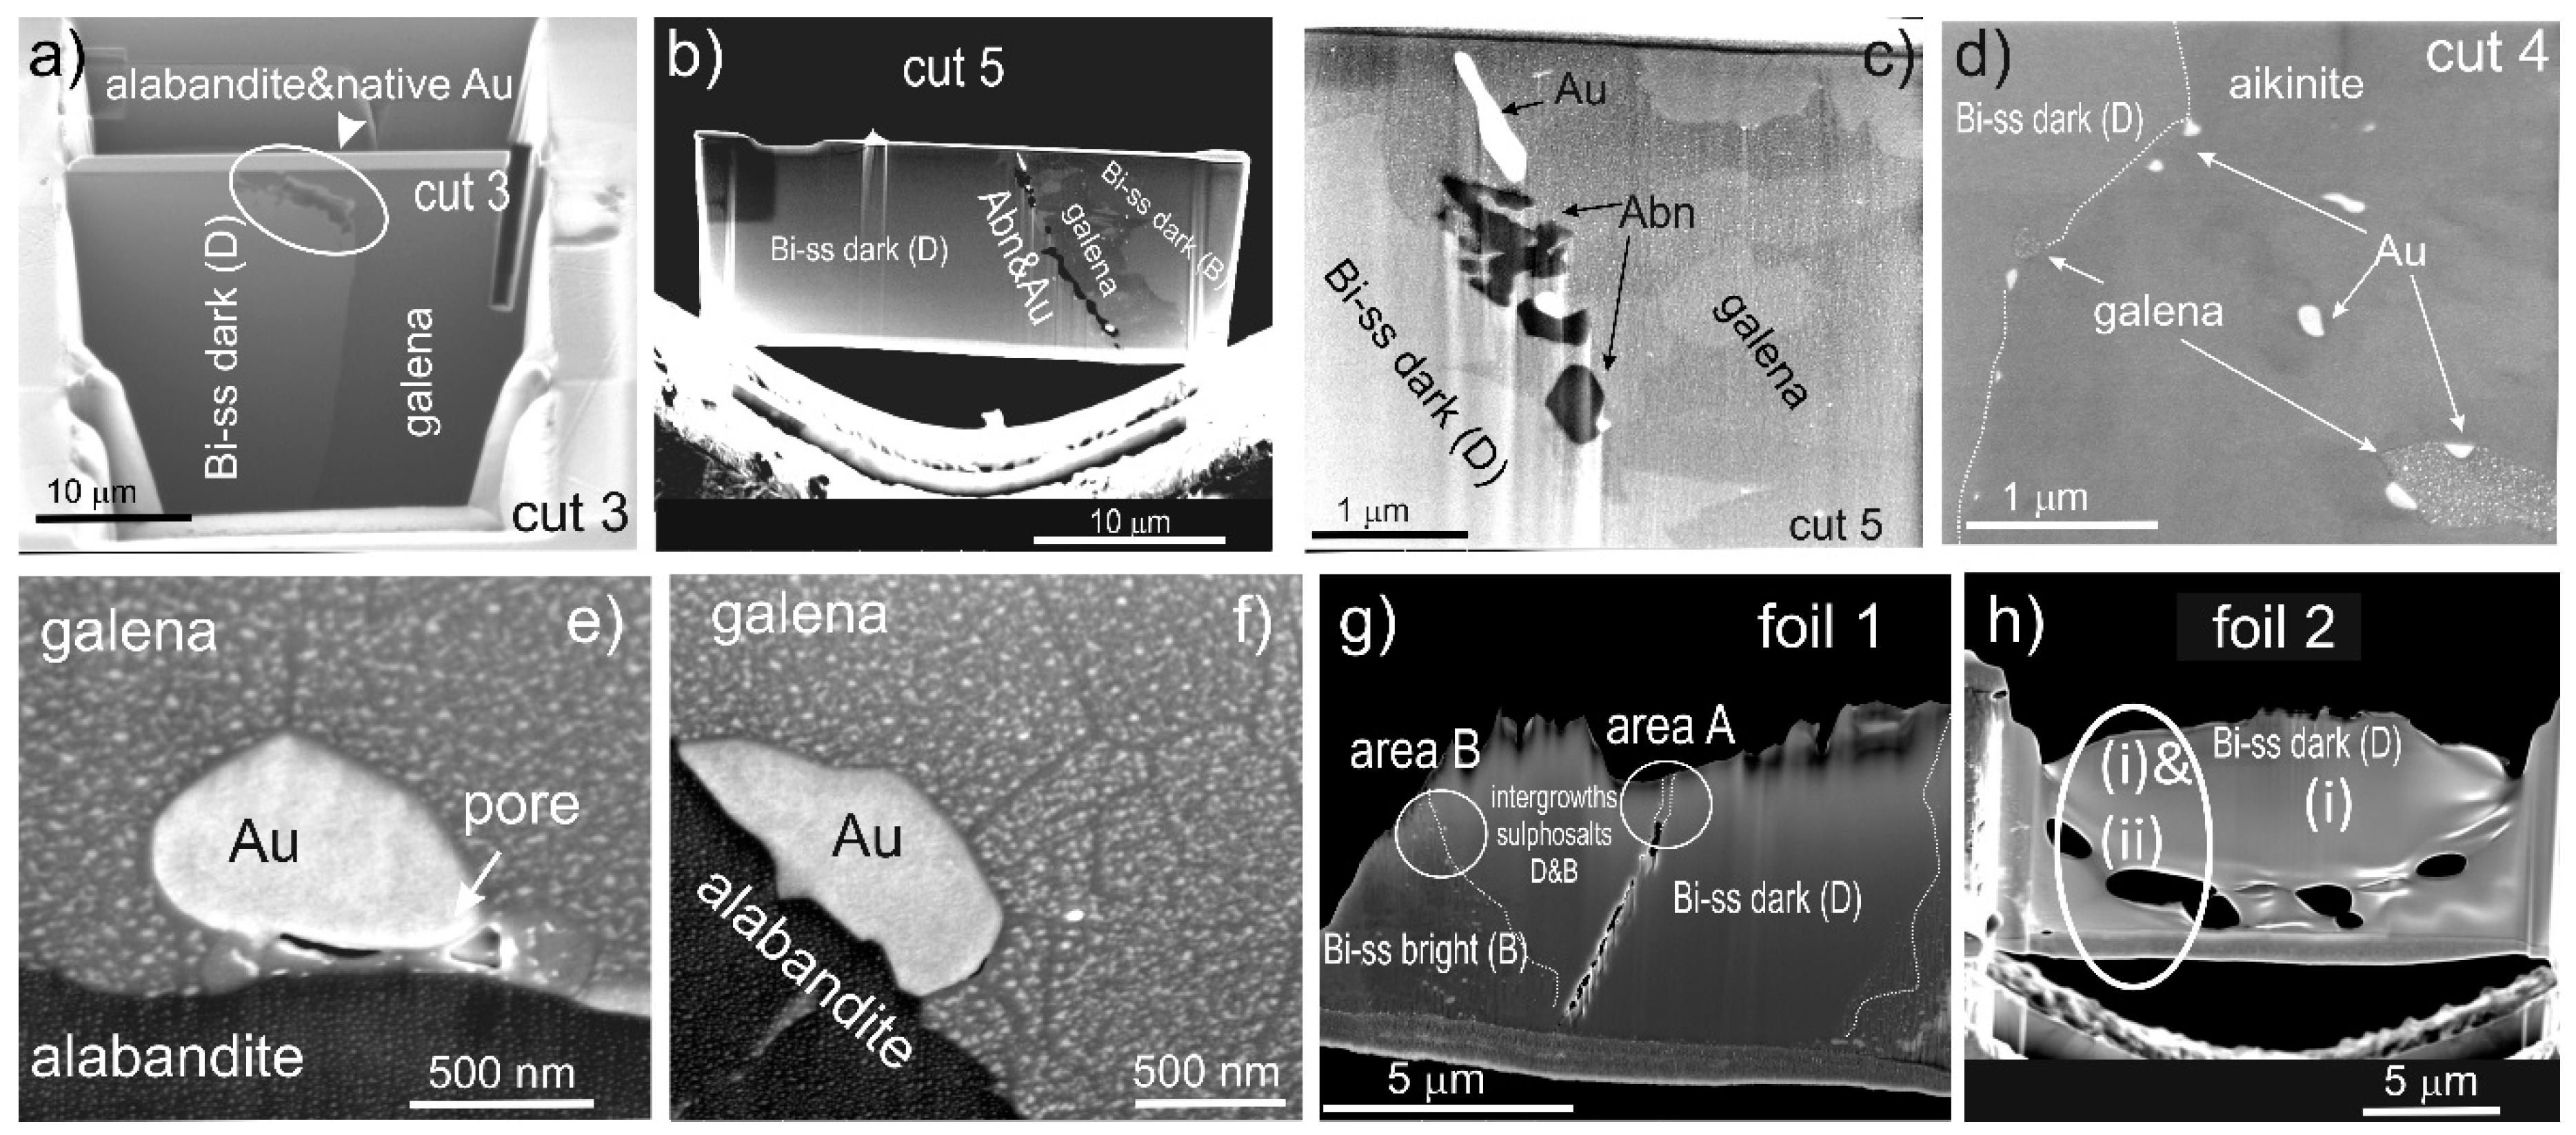
4.2. Native Gold and Bismuth Sulphosalts within the ‘Reaction Front’: FIB-SEM Study

A FIB-SEM study was carried out within a restricted area of the map where changes in the Cu gradient correlate with speciation of Pb-Bi-sulphosalts and enrichment in Au (Figure 5a). FIB cross-sectioning targeted the contacts between different minerals, as well as the Pb-Bi-sulphosalts with variable Cu content (B and D; Figure 5b,c). The compositional plot for EPMA analyses obtained from this area shows a linear trend from the B cluster, through D, and into the field of aikinite (Figure 5c).
FIB-SEM imaging (Figure 6) reveals the presence of particles of native gold, tens to hundreds of nm in size, at contacts with aikinite or galena (Figure 6c,d). Some of the coarser native gold is associated with alabandite (MnS; Figure 6c). Abundant, fine particles of native gold occur within aikinite, particularly at contacts with the Cu-richer Pb-Bi-sulphosalt (phase D; Figure 6d). An abundance of fractures and pores is typical of the association between native gold and sub-µm-scale alabandite (Figure 6a,b), particularly at grain contacts with galena (Figure 6e,f). The boundary between the two Pb-Bi-sulphosalts is along a microfracture (Figure 6g), but without traceable Au at the resolution of the FIB-SEM. The TEM foil prepared from the Cu-richer Pb-Bi-sulphosalt (phase D) is entirely homogenous at this scale of observation (Figure 6h). Although the contacts between different minerals can be very sharp (Figure 6a), they are often characterised by unusual, sub-µm size grains of galena, either when approaching the fractures, or as inclusions within the aikinite (Figure 6c,d). From the above observations, we draw attention to the fact that the studied assemblages show the effects of fluid-induced dissolution. This is expressed by the presence of pores and fractures, and (re)precipitation within the host sulphide-sulphosalt assemblage leading to nucleation of new phases such as alabandite (see the correlation with Mn map in the section above) and fine particles of native gold. Both Mn and Au could have been mobilised out of the host sulphide-sulphosalt minerals, thus explaining the (re)distribution of trace elements as well as trapping of these elements within the same area, e.g., as alabandite. The map for Au shows this element occurs along aikinite grain contacts, and in the abundance of fine particles of native gold, within the aikinite itself. The bismuthinite derivative crystal structure is less accommodating of lattice-bound Au compared to the Pb-Bi-sulphosalts (see also Discussion).
Difficulties experienced in the preparation of “clean and thin” TEM foils from sulphide/ sulphosalt assemblages using FIB-SEM techniques are also illustrated here. All the FIB cuts that include fractures and inclusions could not be thinned as were as the more homogenous material (FIB cut 2). The presence of coarser inclusions also contributed to the difficulty in preparing an evenly thin foil. Galena interacts with Ga ions under FIB milling (white dotted precipitates on Figure 6c–f), allowing for the rapid discrimination of the galena against other minerals in the assemblage which display no such reaction. Of the five TEM foils prepared, those from FIB cuts 1 and 2 were far better and thinner for TEM study. However, even in the latter case, torsion of the foil leading to holes during the last stage of thinning, adds to the challenge of achieving suitable samples for TEM study (Figure 6h).

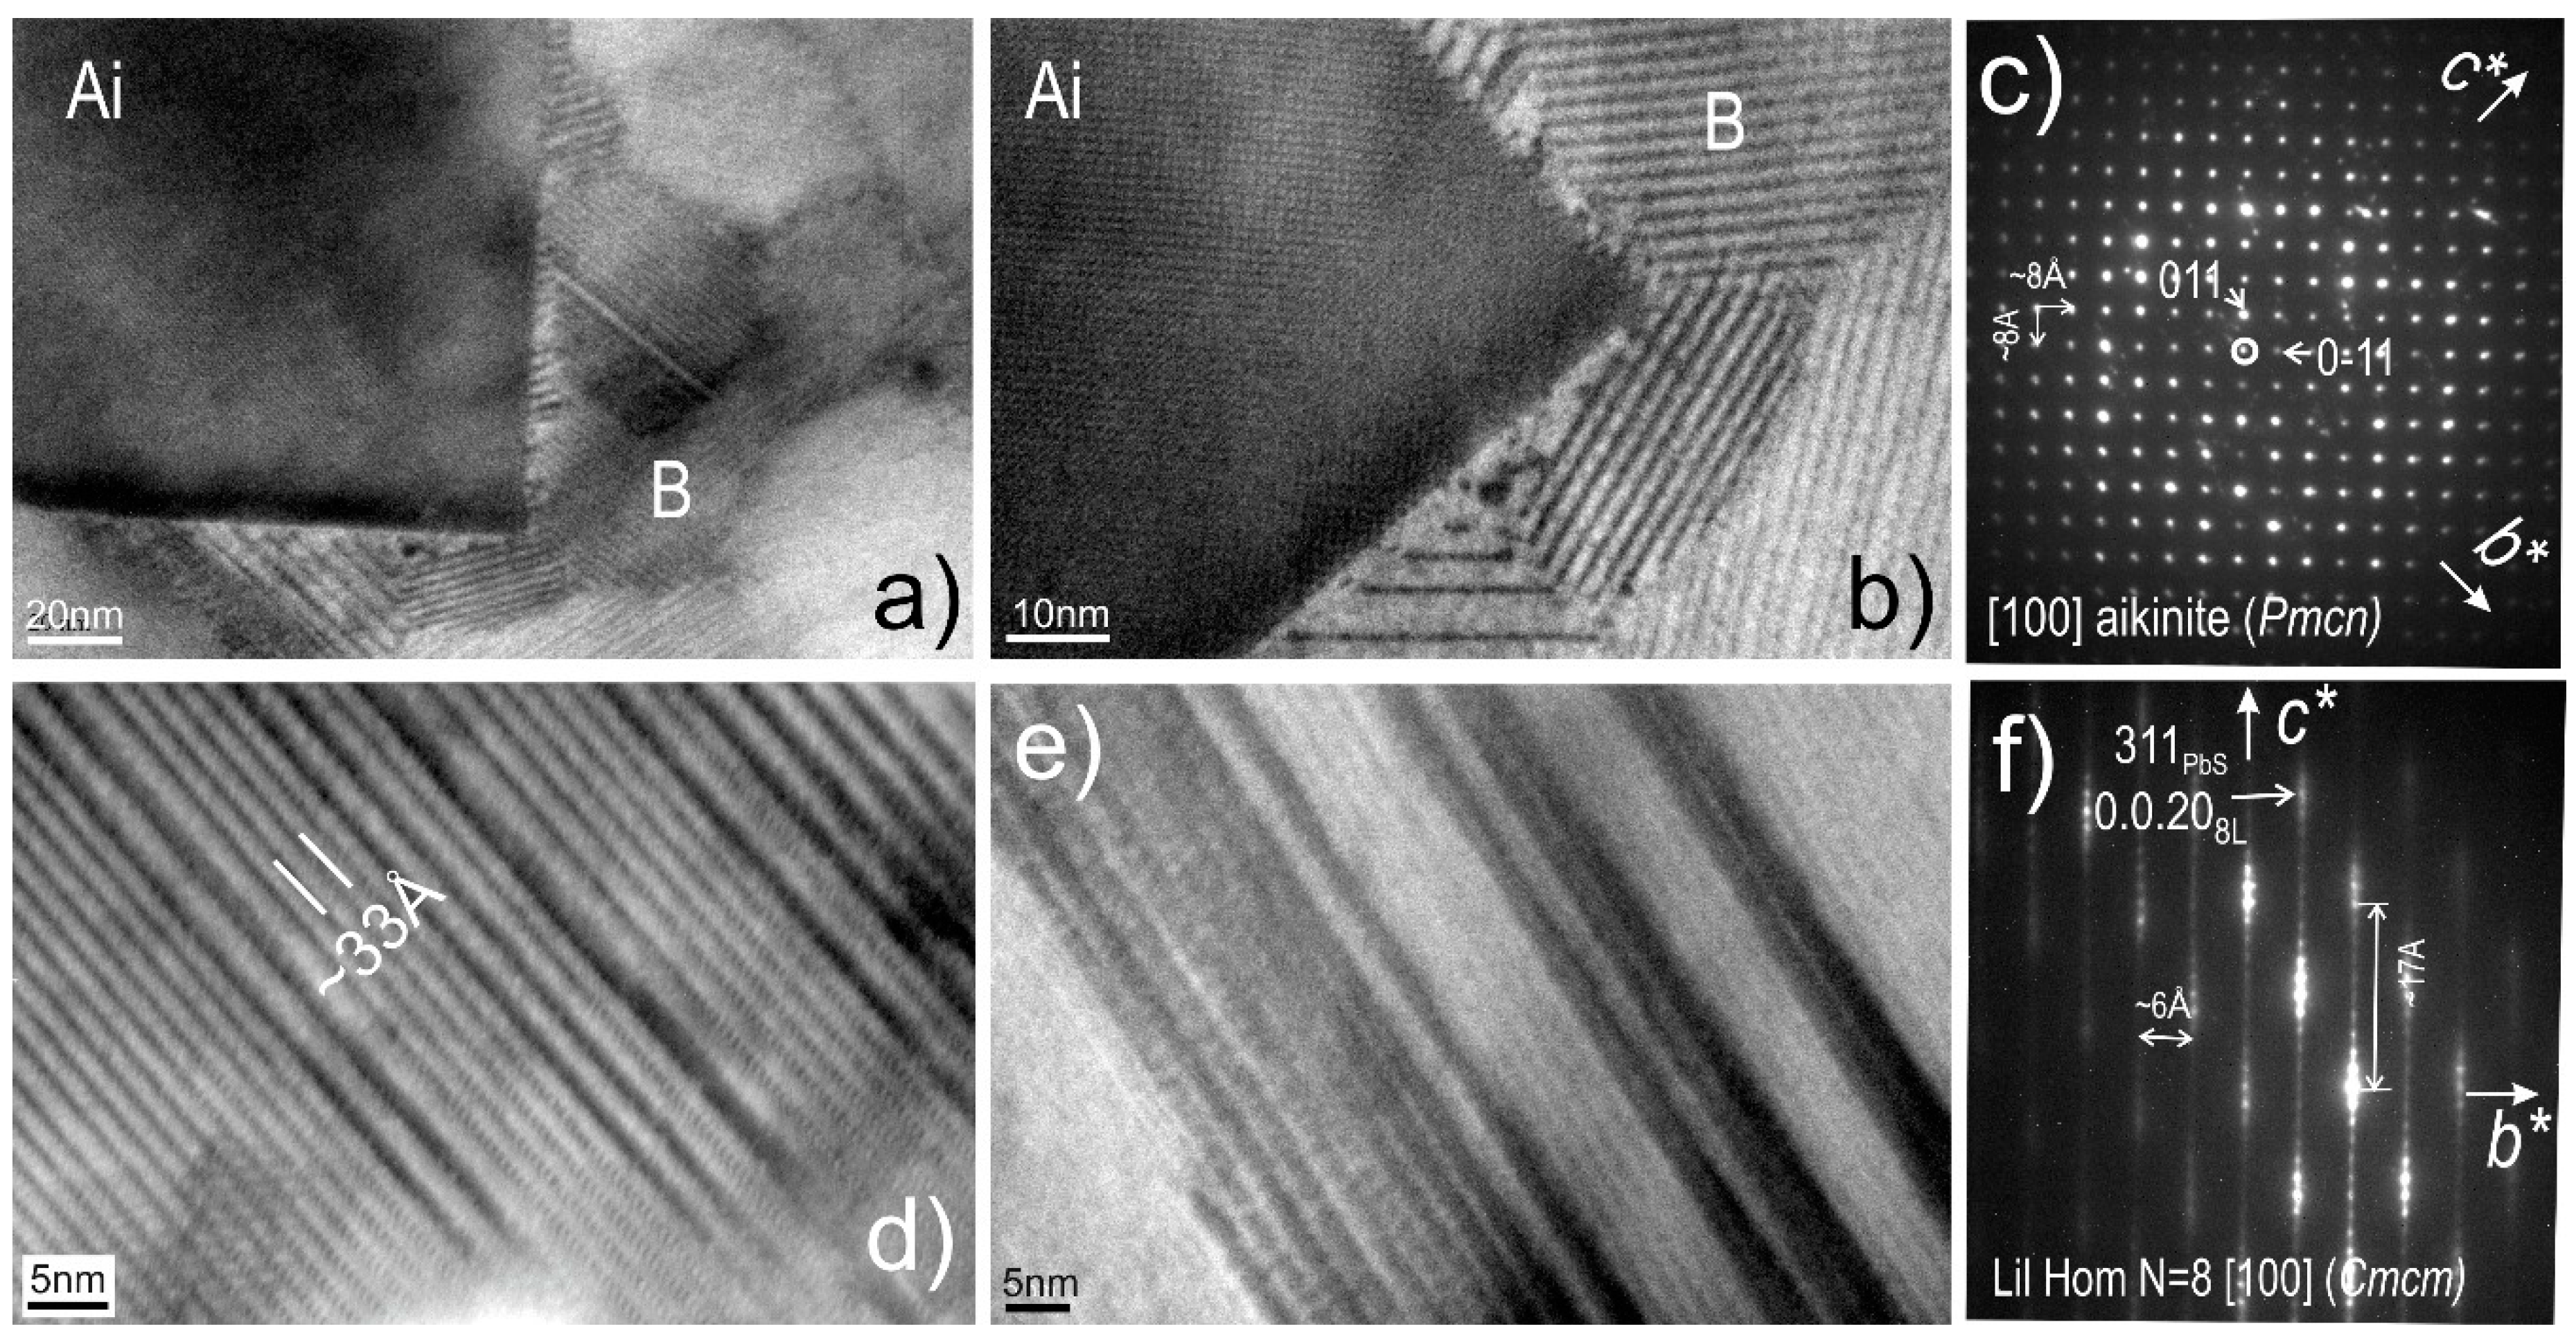
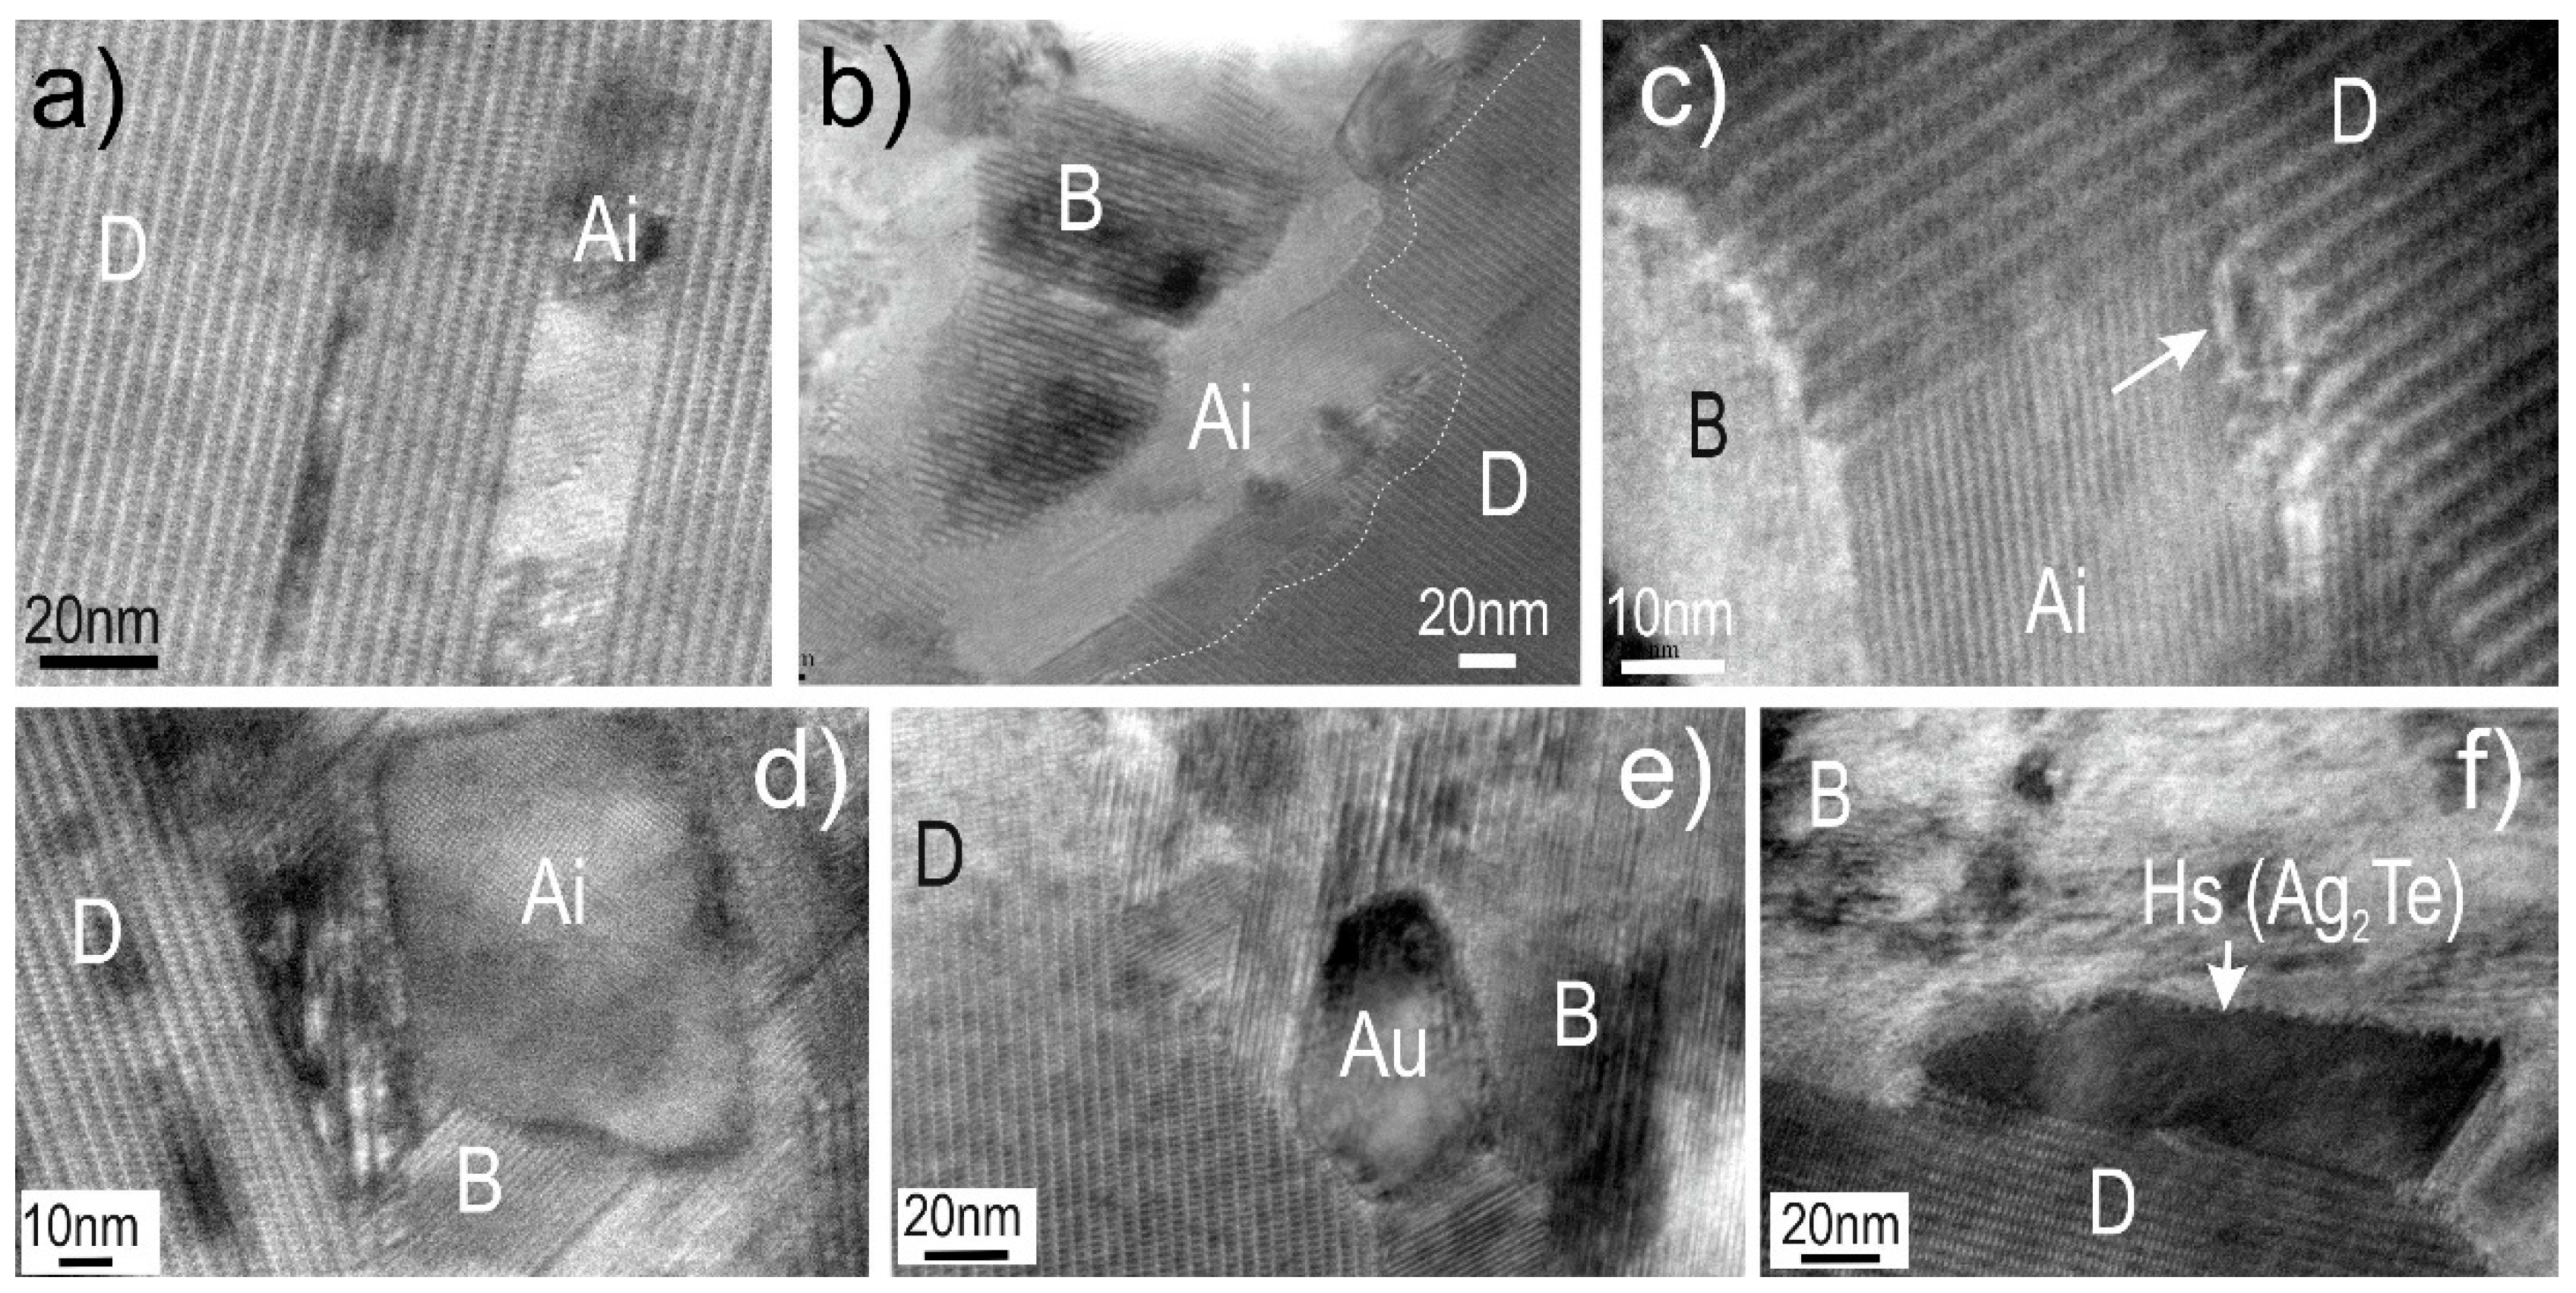
4.3. Bismuth Sulphosalts Down to the Nanoscale: TEM Study

The combined TEM, HAADF STEM, and EDS study of foils 1 and 2 allows identification of three distinct bismuth sulphosalts: (cupro)neyite, Ag-Bi-substituted lillianite of higher order homology (dominantly N = 8; 8L) and nanometer-scale grains of aikinite. These minerals are intricately intergrown down to the nanoscale, while chemical heterogeneity is also observed in the neyite. All three sulphosalts were present in foil 1, forming distinct assemblages (domain B and filling a fracture in A), whereas lillianite homologues were absent in foil 2. In addition, fine particles of Au and hessite were also present in foil 1.
Aikinite is identified from HR-TEM imaging and Selected Area of Electron Diffractions (SAED) obtained from some of the coarser, square-shaped grains (a few hundred nm in size), where the spacings at ~8 Å on the [100] zone axis and the absence of satellite reflections along b* indicate one of the two primitive cells in the bismuthinite derivative series with Pmcn symmetry (Figure 7a–c). This space group was recently redefined for members of the series ([68], and references therein) initially considered in the Pnma space group (e.g., [66]). Although this phase could also be the end-member bismuthinite, the EDS spectra (see below) shows this is a Pb-(Cu)-bearing bismuthinite derivative. Aikinite occurs within a sub-µm-sized aggregate of lillianite homologues showing domains of twinning and typical irregular twin-related blocks (Figure 7d–e) with strong background contrast [83].
The lillianite homologue is identified as a higher-order homologue with N = 8 [81], based upon satellite reflections along the c* axis (N1 + N2 + 4 = n, where n is the number of satellites with an even index between the main reflections on c*; SAED in Figure 7f). EDS spectra (see below) shows this is a Ag-substituted phase and most likely has a composition which falls within the cluster defining B (Figure 5c). The streaking along the c* axis and parallel directions is indicative of stacking disorder.
The third sulphosalt has the largest unit cell (widest lattice fringes at ~43 Å) and can be indexed as neyite/cuproneyite on SAEDs down to [010] zone axis (Figure 8a,b). This is readily attributable to the cluster D in Figure 5c since it is present throughout foil 2 which was cut through lamellae of this composition. For the sake of simplicity, this sulphosalt is hereafter referred to as neyite, even though the crystal structure/chemistry has some notable differences relative to neyite sensu stricto as defined by Makovicky et al. (2001) [75]; see below. In foil 1, the 8L lillianite homologue and neyite occur as intergrowths with one another (Figure 8), where the slight misfit between the 33 and 37.5 Å repeats on the c and a axes in 8L and neyite, respectively, is adjusted by a stepwise defect (Figure 8c).
In the same sample, replacement relationships and inclusion nucleation at grain boundaries are also widespread (Figure 9). Aikinite appears to be a later phase, since this replaces both the 8L lillianite homologue and neyite. For example, neyite blocks of variable width, from single to several unit cells, are replaced along the c axis by aikinite (Figure 9a). The latter also fills the fracture between neyite and the 8L lillianite homologue with inclusions and defects along the embayment contact (Figure 9b,c). Coarser (tens of nm) grains of aikinite crosscut the lamellar aggregates of lillianite homologues (Figure 9d). Fine particles (tens of nm) of native gold and hessite are occasionally observed at the boundaries between the neyite and lillianite homologues (Figure 9e, f).
As noted above, at the contacts with aikinite, the Pb-Bi sulphosalt (phase B) occurs as sub-µm grains with different orientations at the contacts with neyite where inclusions are present (Figure 9e). Such fine-grained aggregates are not observed in neyite. Although no pores are observed, these aspects may be indicative of nanoscale dissolution and re-crystallisation of the lillianite homologues at the sites of inclusion nucleation.
The HR-TEM and electron diffraction data presented above draws attention to lattice-scale relationships between the main phases in the association, and the superimposed effects of replacement extending down to the nanoscale. Identification of a simple cell for the bismuthinite derivative species supports the formation of coarse aikinite that is hundreds of µm in size, tracing the Au front in Figure 5a as a process initiated at the nanoscale, from the grains that are tens to hundreds of nm in size nucleating along dissolution-reprecipitation boundaries (Figure 7a,b). Identification of the disordered, higher lillianite homologues (N = 8) in and around the aikinite, or as intergrowths with neyite (Figure 8c), is evidence for their formation via progressive replacement of primary heyrovskyite co-existing with galena, and ultimately leading to various symplectite associations (Figure 3a,b). Although TEM is best suited to discriminate order/disorder and crystal structural modularity in mineral series, and even if nuffieldite can be ruled out (much smaller unit cell; a = 14.49 Å; b = 21.41 Å; c = 4.04 Å; [93]), uncertainty still exists for defining neyite derivatives [75] relative to other large unit cell phases (such as some highly-substituted lillianite homologues such as ourayite). Moreover, the chemical variability reported so far for the neyite species [76], and the offset of the “D” compositional cluster from the ideal composition (Figure 5c) are issues that could be resolved using atomic probe resolution HAADF STEM imaging and EDS. Lastly, the various PbS-slabs building-up a large unit cell such as in neyite should be identifiable using high-resolution STEM imaging.

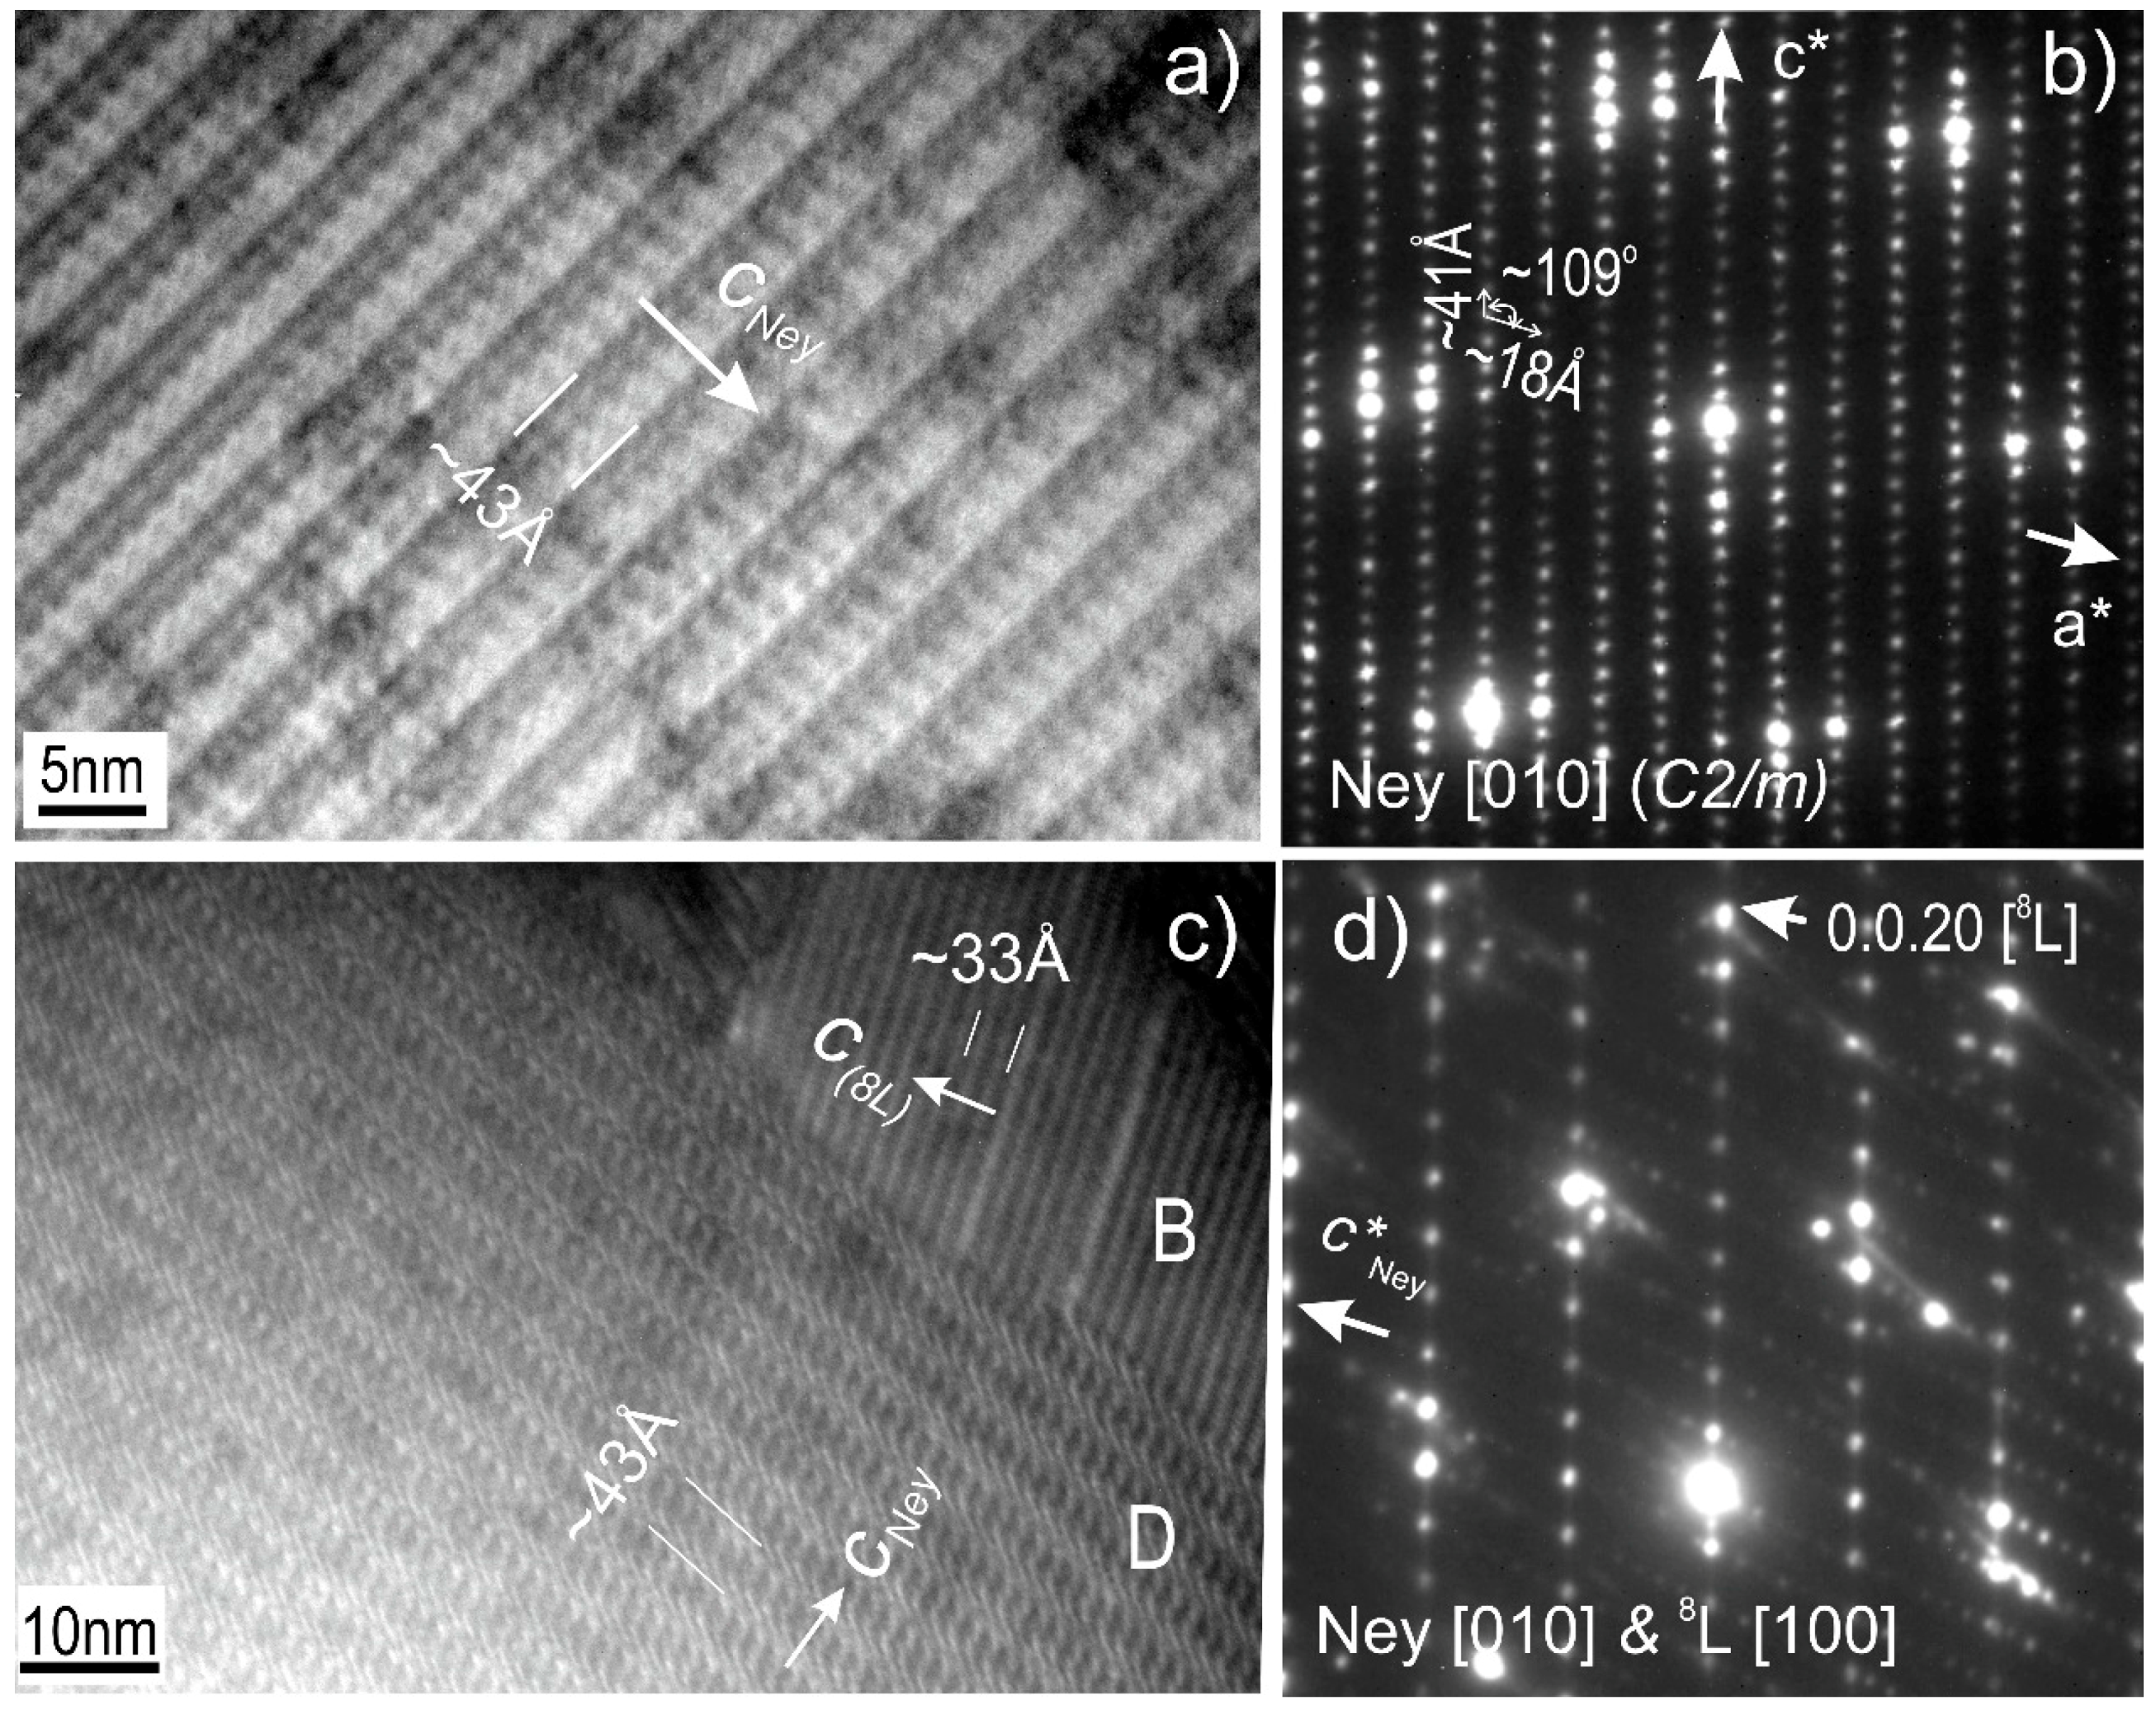
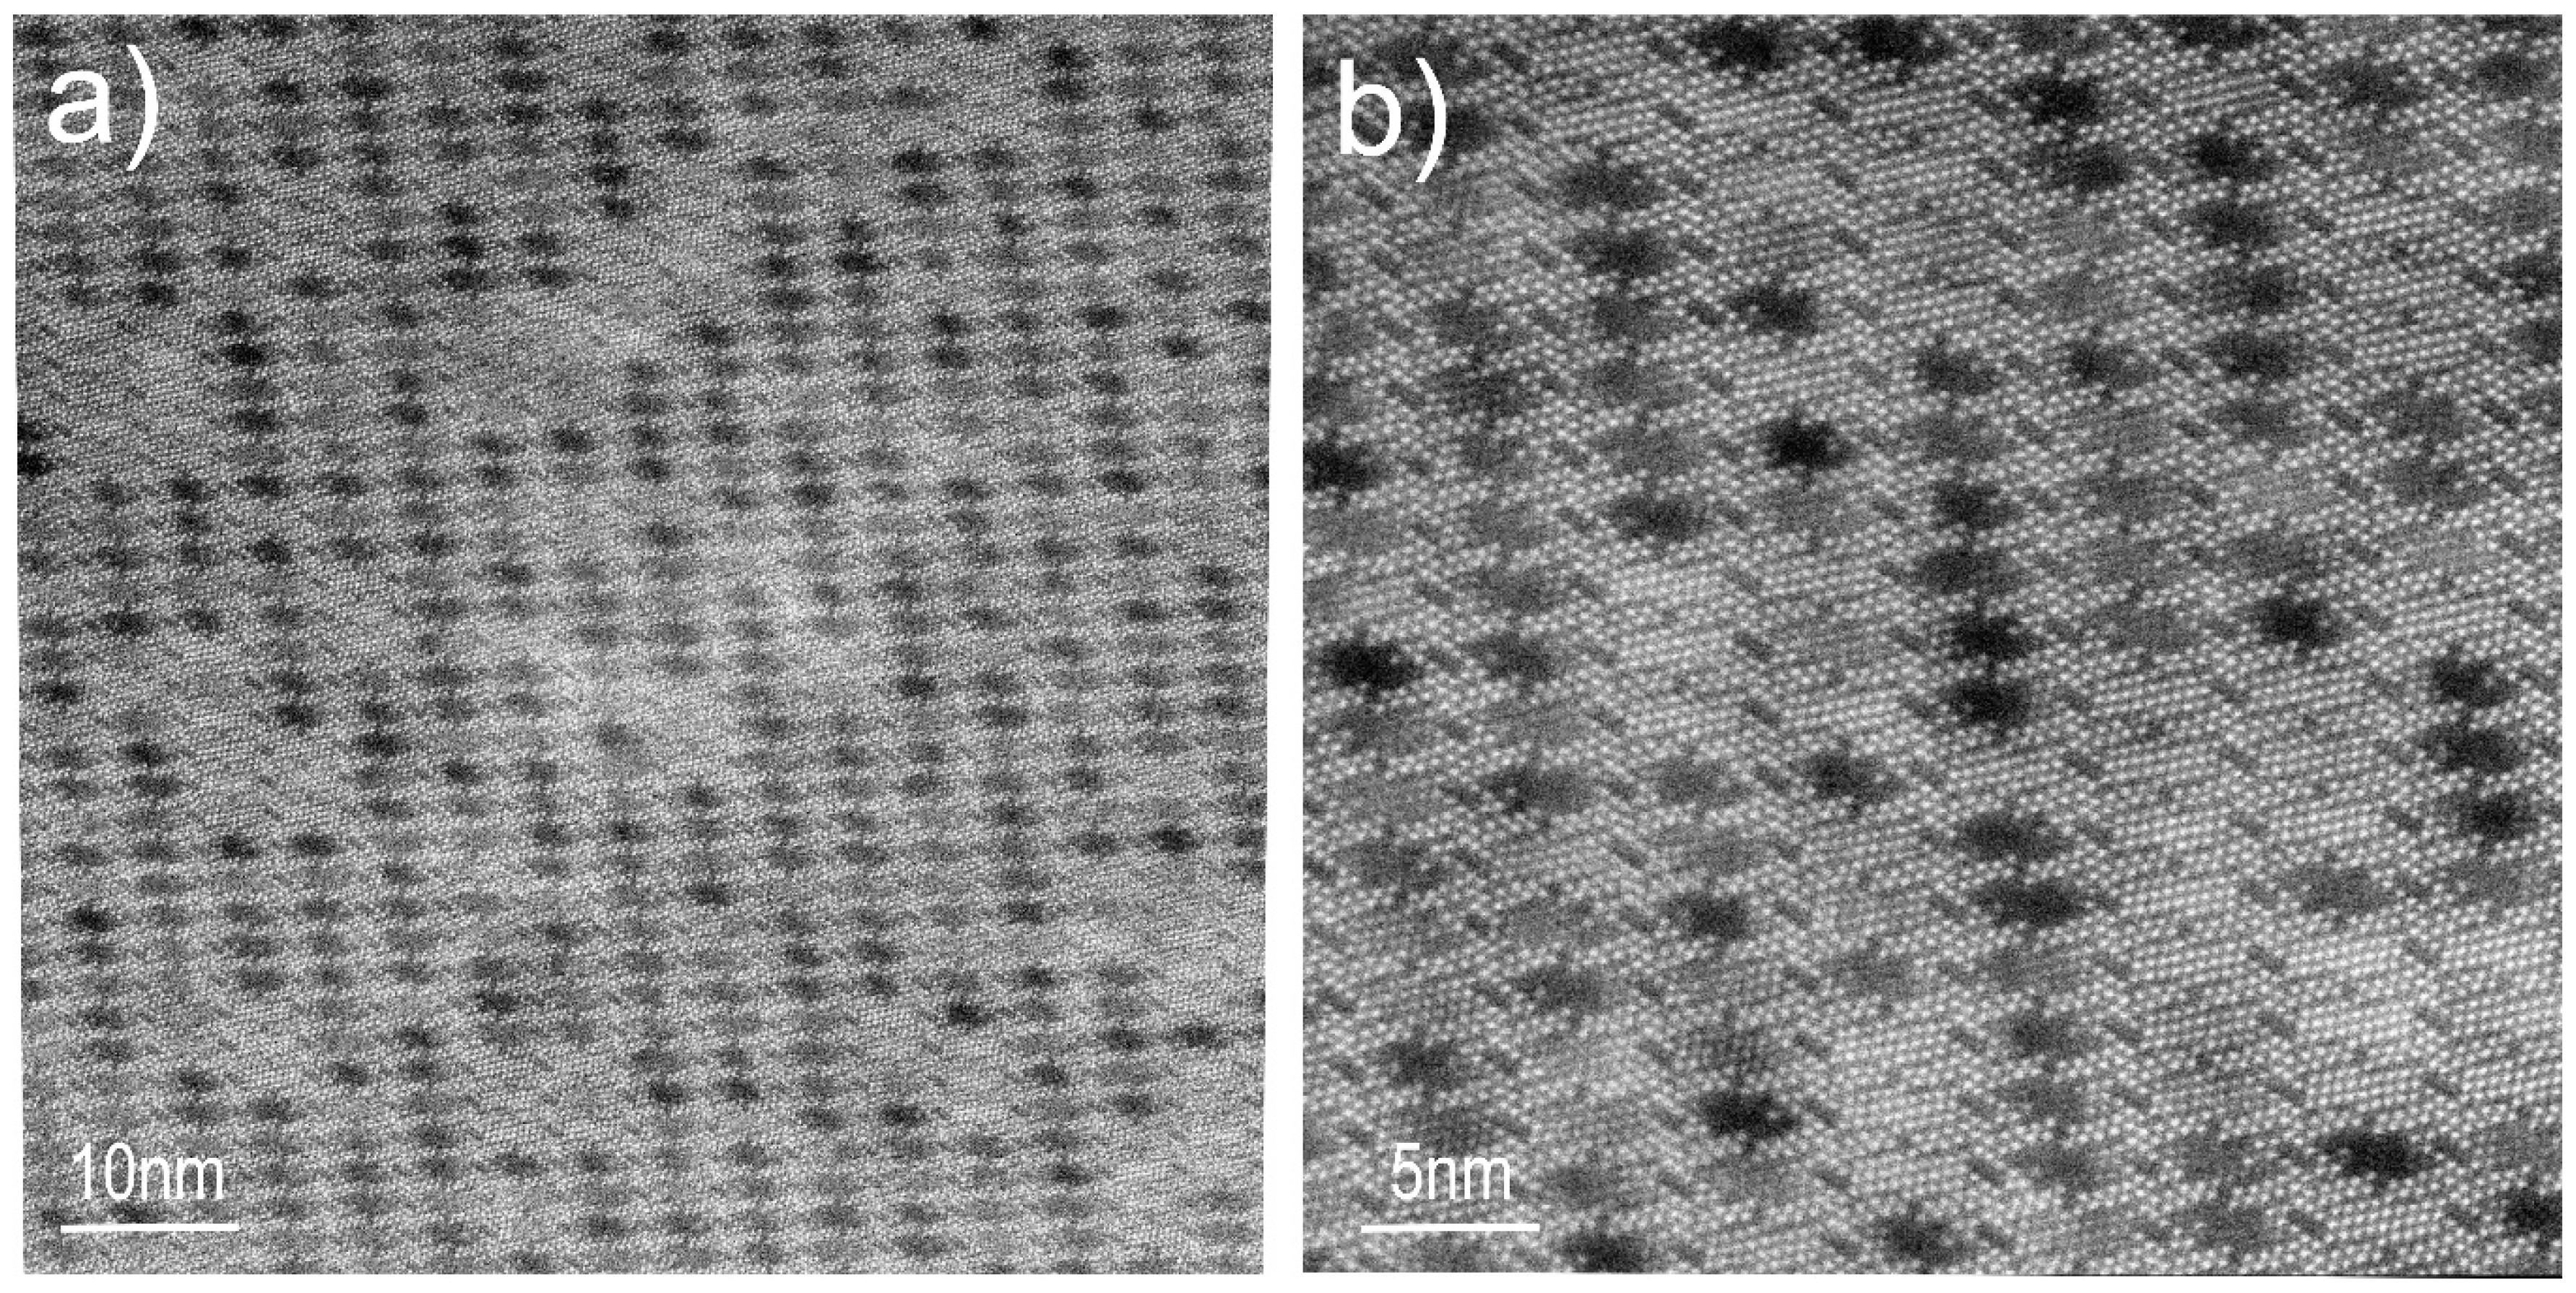
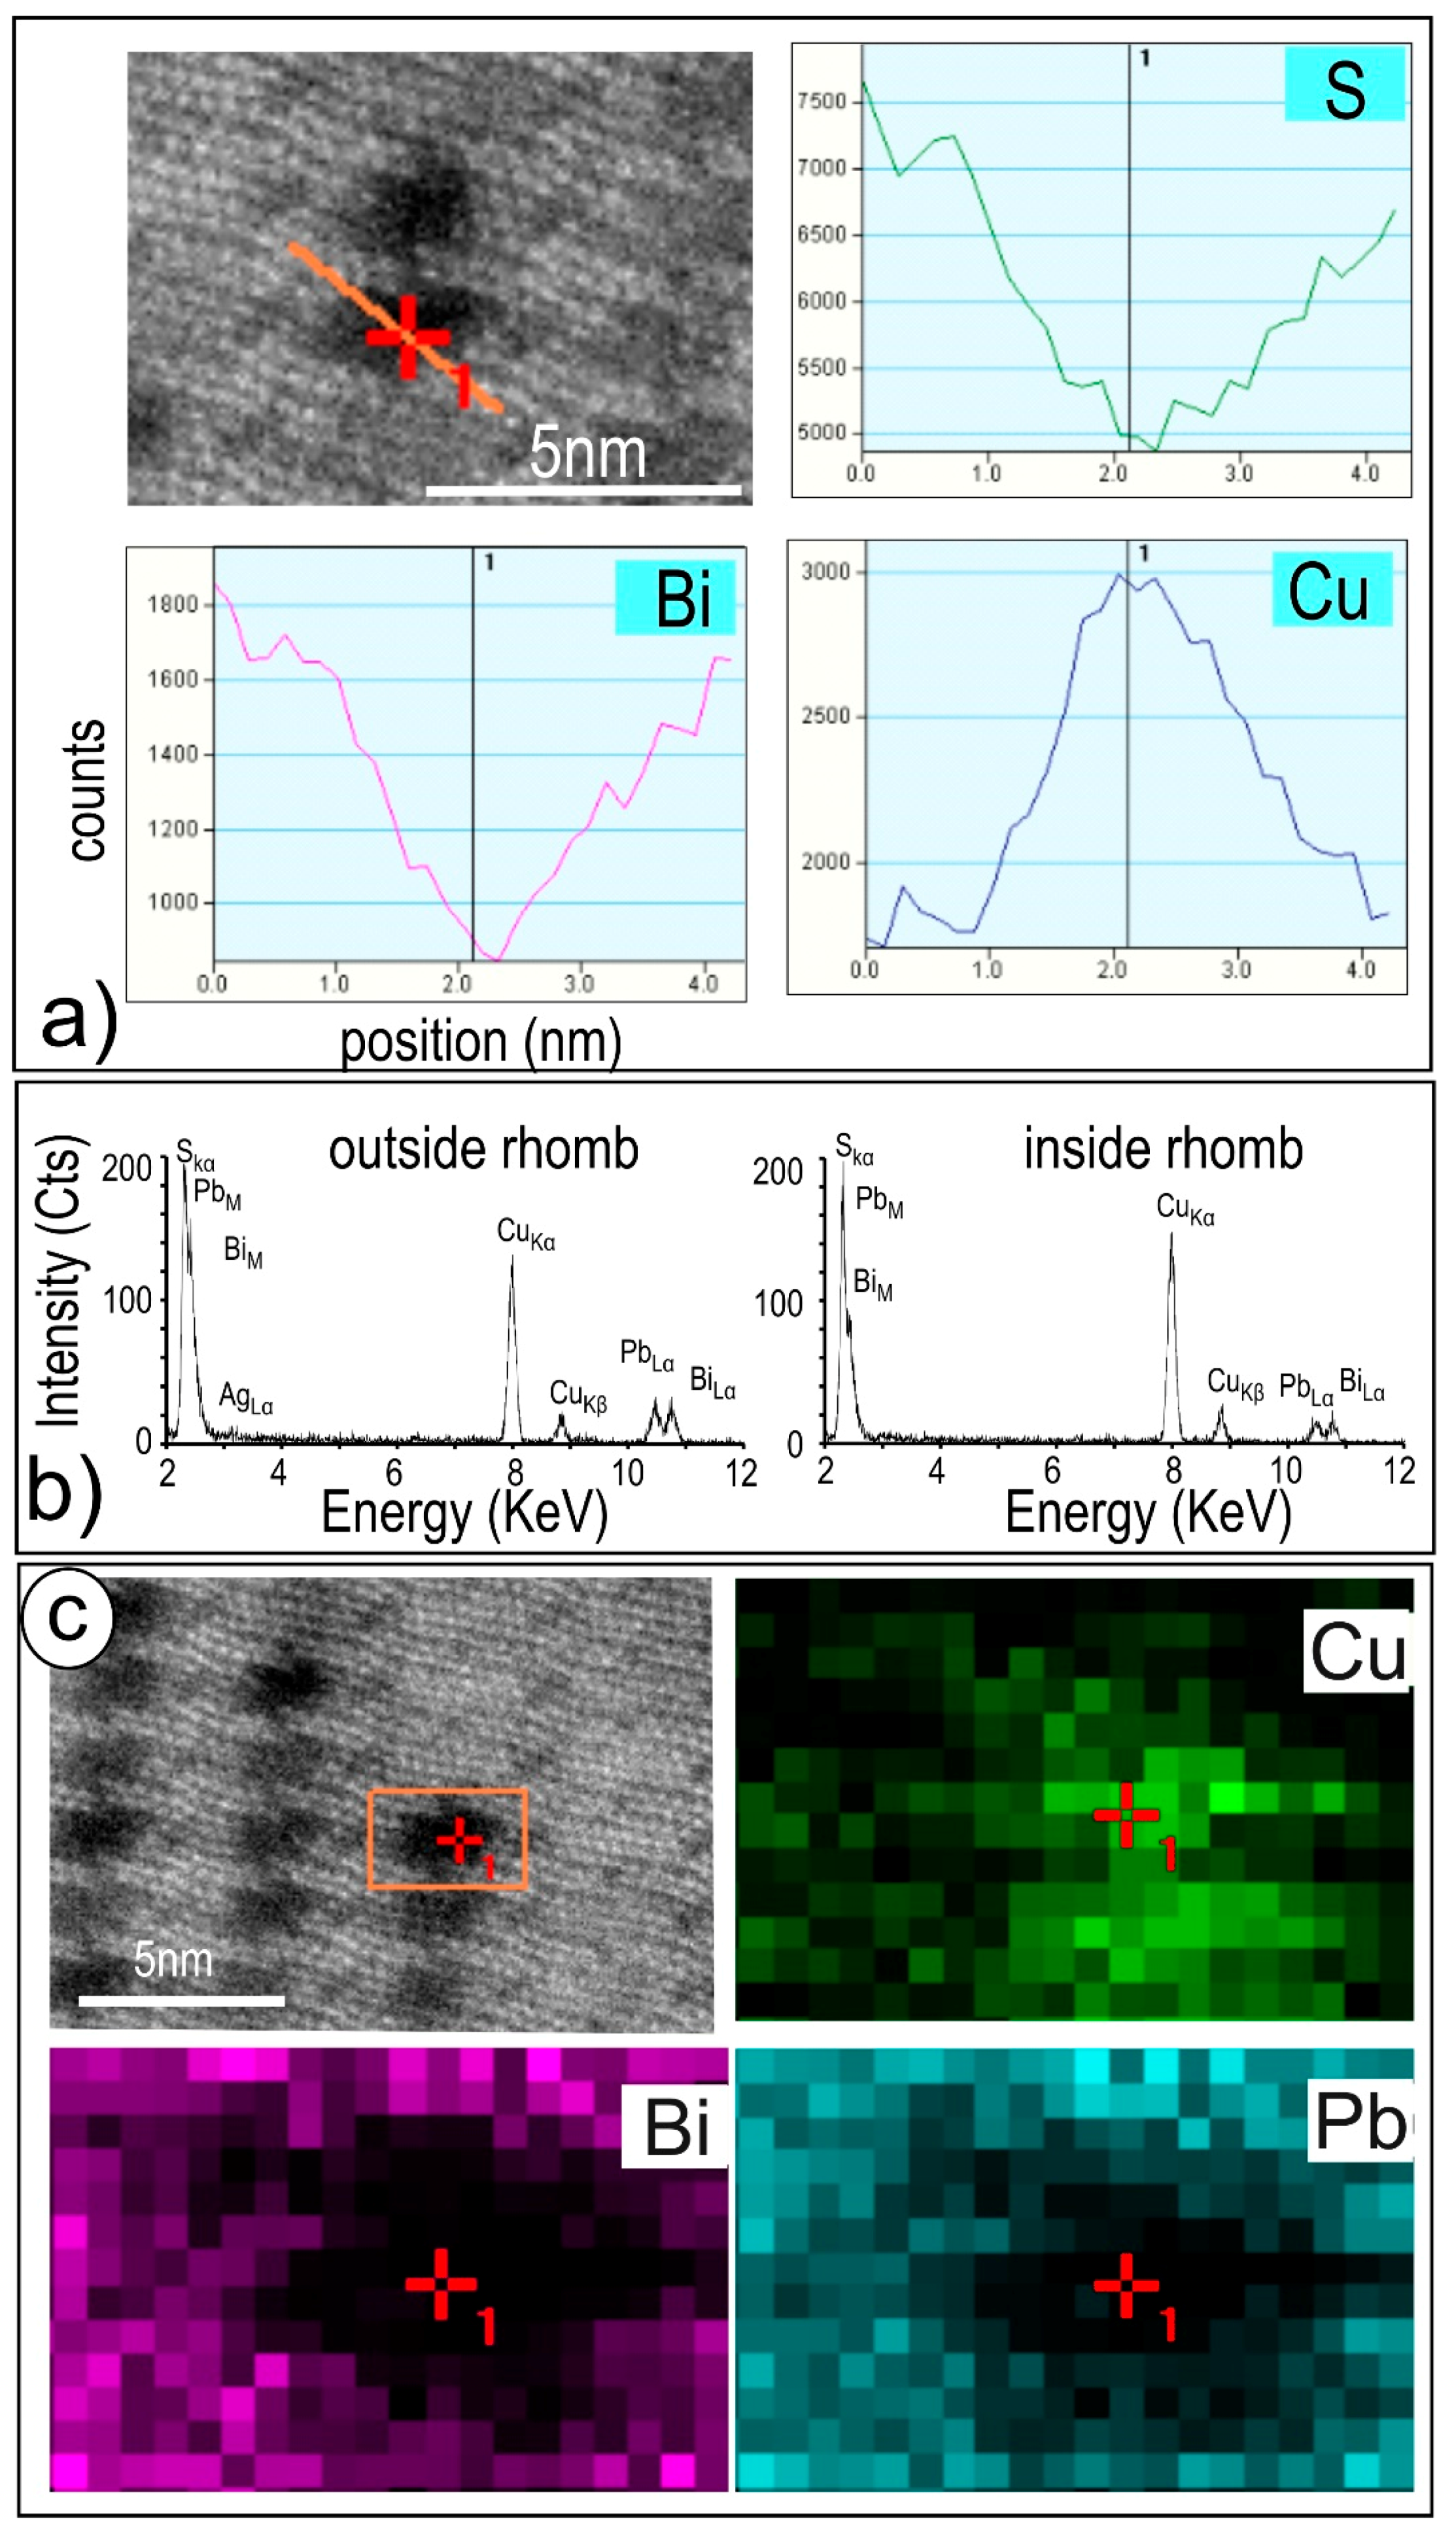
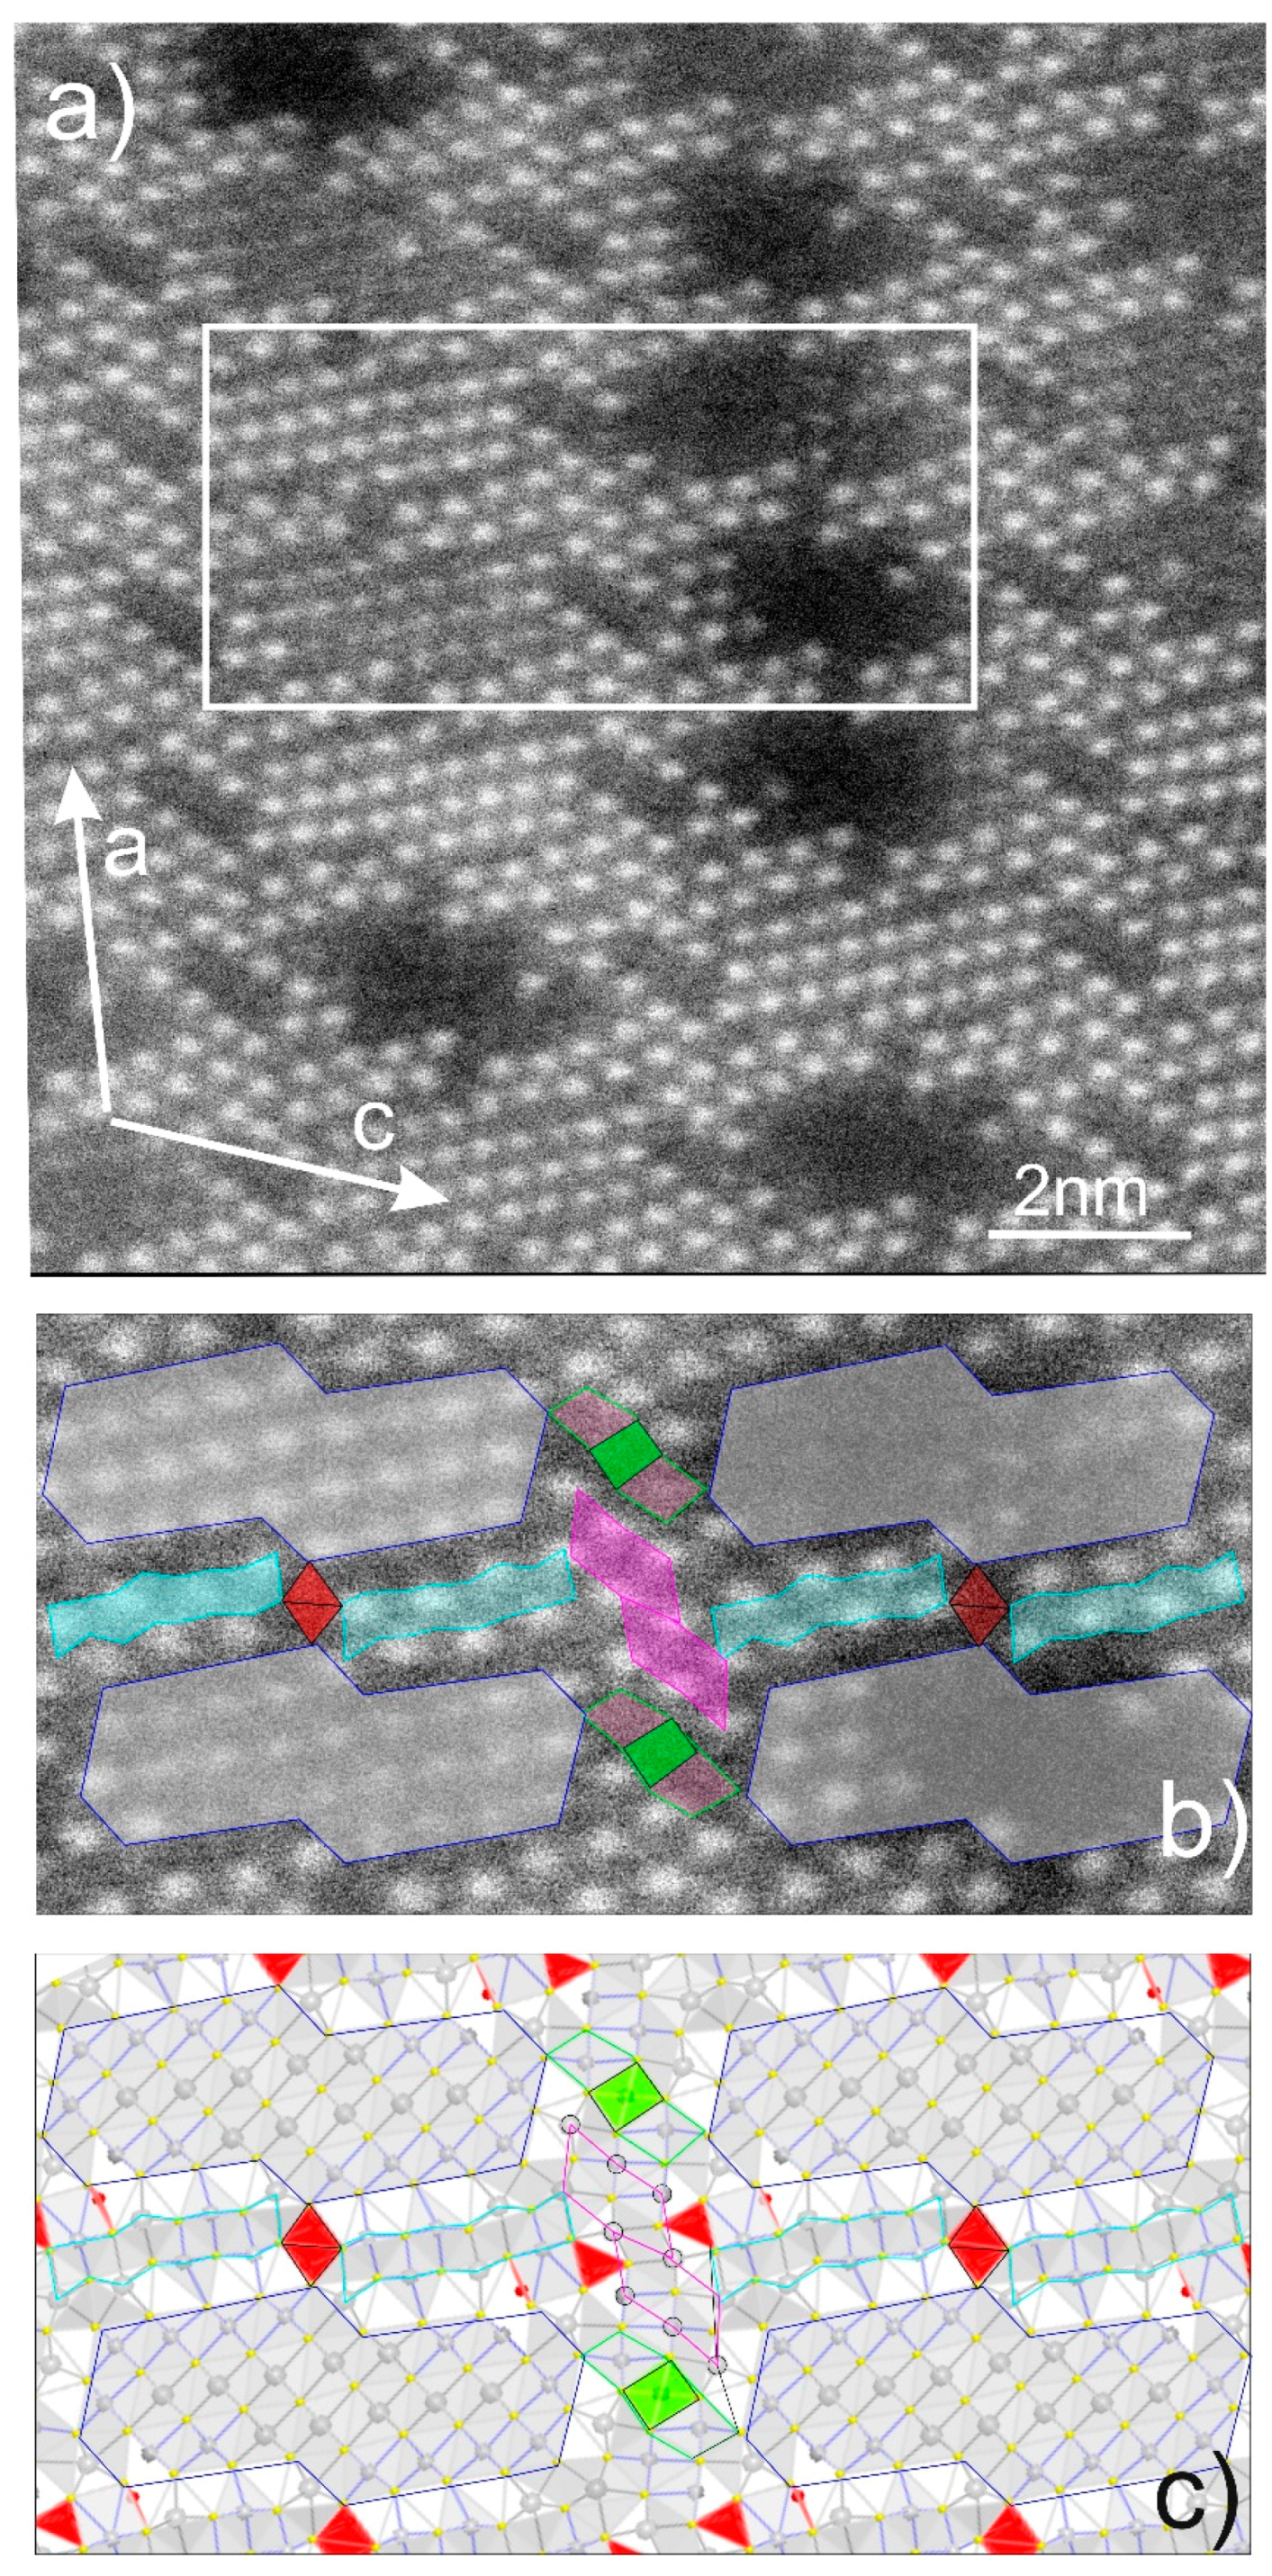
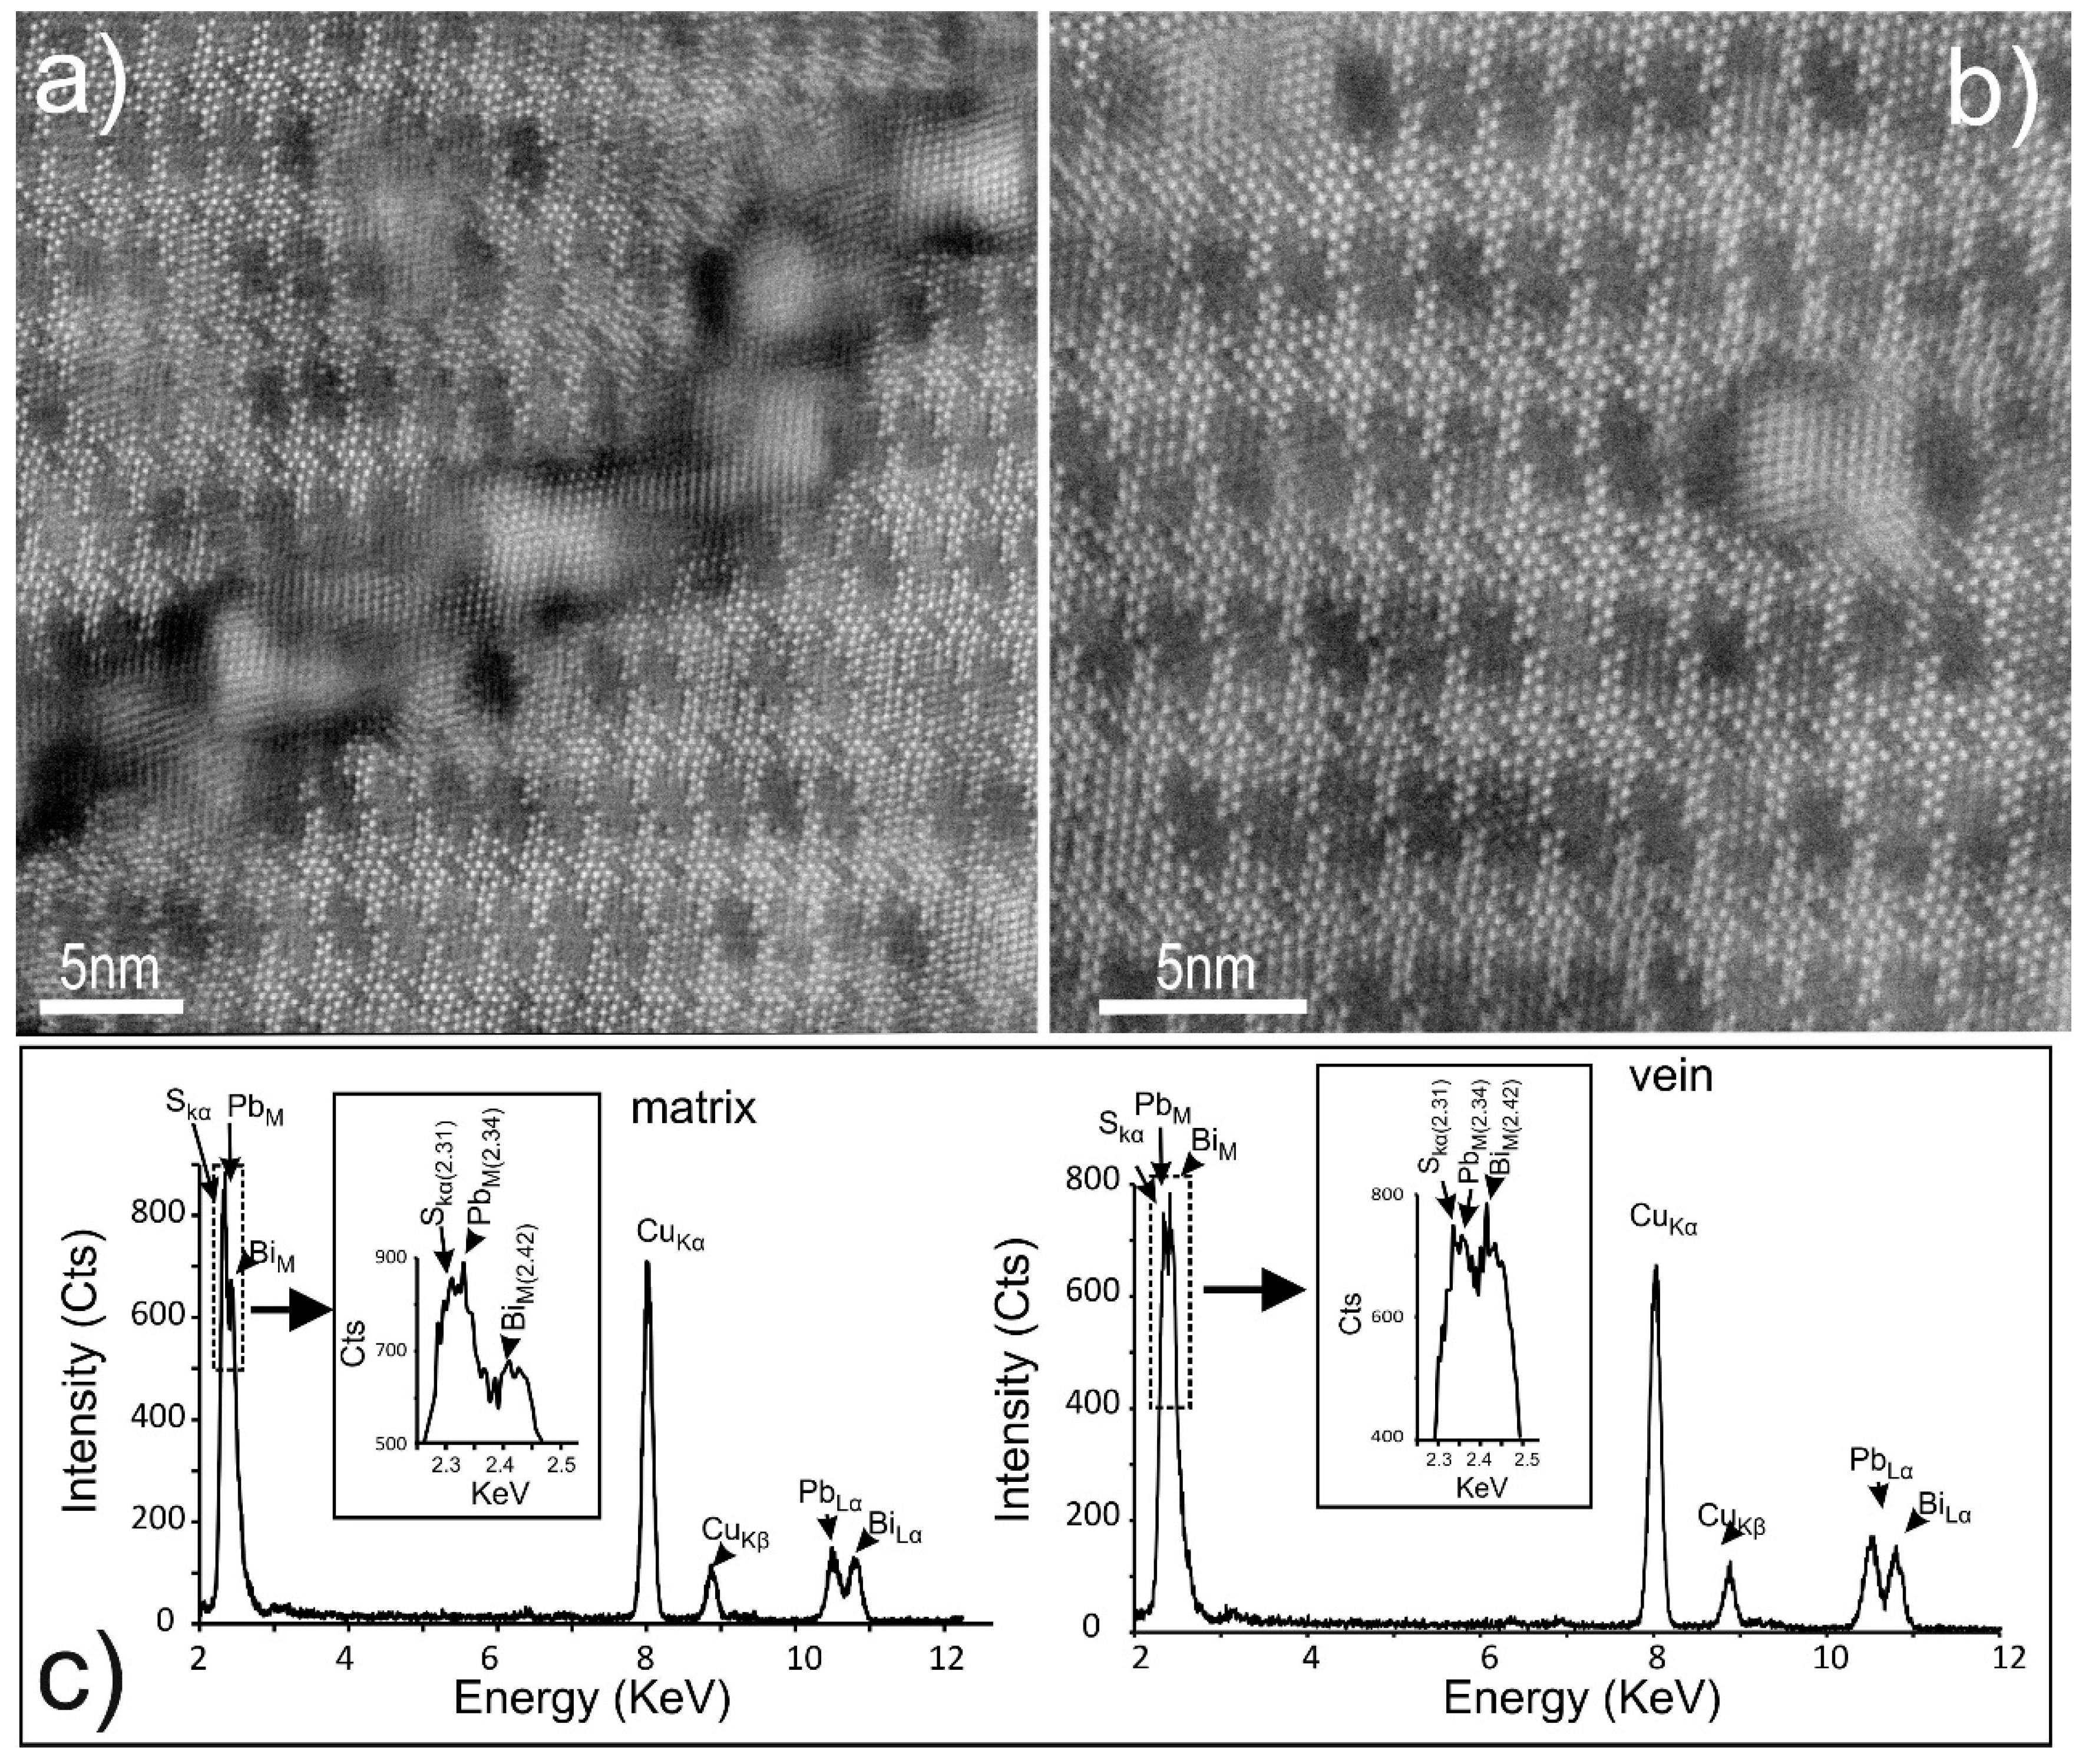
4.4. Bismuth Sulphosalts Down to the Atom-Scale—High-Resolution HAADF STEM Imaging and EDS

HAADF STEM imaging of neyite in foil 2 was done after tilting the specimen to the [010] zone axis. The recorded images show a phase with a complex boxwork pattern (Figure 10a) throughout the greater part of this foil (field (i) on Figure 6h). At a scale of tens of nm, this pattern shows (i) parallel, darker strips with a “rhomb-like” motif within a brighter matrix, and (ii) irregular interruption of the strips (Figure 10a). Further details revealed at higher magnification (Figure 10b) include the presence of other darker submotifs (<1 nm) bracketing the main ‘rhomb-like’ motif at regular intervals, i.e., ~2 nm along the strips, and ~4 nm on the sides. The only irregularity observed throughout the boxwork pattern was due to the ‘rhomb-like’ motifs displaying transitional contrast to the matrix in varying shades of grey to black.
The image in Figure 10b already shows similarities to the various PbS slabs within the neyite structure (Figure 1d), in which the rhomb-like motifs can be attributed to the (111)PbS, slabs, the widest in the crystal structure. If this assumption is valid, than the arrangement of heavy atoms (Pb, Bi as bright dots) also depict the (100)PbS slabs sandwiched between the (111)PbS and the adjacent (922)PbS slabs, forming thinner (~2 nm-wide), parallel strips with a kink-like, sheared arrangement relative to the (111)PbS strips. Amazingly, the pattern shows no other irregularity except the darkening of the (111)PbS, rhomb-like motifs; the heavy atoms (bright dots) are still observable within those with bright grey shades but no further detail is seen in the darkest motifs.
In order to understand the chemical variation relating to the contrast changes, an EDS profile was measured across one of the darkest rhomb-like motifs (Figure 11a). This showed depletion in heavy cation elements such as Bi (and Pb not shown on the figure), an increase in lighter cation elements such as Cu, and a decrease in the lightest elements such as S (anions in the structure). Despite this, the EDS spectra (Figure 11b) taken at points outside and inside the dark motif show that both locations are nonetheless Pb-Bi-S-bearing but with differences in the relative amounts of heavy versus light cations; Ag, although barely noticeable, is found only outside the dark motif. The same results are also shown by the EDS map over the ~4 nm-wide dark motif where there is an inverse correlation between Cu (high) and heavy atoms, Pb and Bi (low) (Figure 11c).
Ignoring the increase in Cu depicted in the rhomb-like motifs, the direct comparison between the atomic arrangement within the sulphosalt and the main slabs in the neyite structure indeed shows a striking match in terms of the width and geometry of the main building blocks, i.e., (111)PbS and (100)PbS slabs (Figure 12). The number of heavy atoms (Pb and Bi) in these slabs, i.e., 3- and 2-atoms wide, respectively, on the a axis, and their relative arrangements within the two modules is in perfect agreement with the modules derived from single crystal data for the neyite structure [75]. For example, both types of layers, i.e., pseudohexagonal-(111)PbS and tetragonal-(100)PbS, are described as sheared giving rise to tetrahedral Cu sites [75]. In the image in Figure 12b, the (100)PbS slabs are indeed kinked by a small, dark rhomb attributable to the two Cu atoms in the crystal structure (Cu1 in tetrahedral coordination [75]). We draw attention to the fact that this module is more similar in size/geometry to the neyite than the cuproneyite structure (see Figure 1d,e).
The part of the crystal structure considered as wavy, corrugated (922)PbS slabs (Figure 12c) is recognised in the 3-atom width (for heavy elements) forming two blocks with one atom offset between them and interleaved with a dark block (Figure 12a,b). The latter shows 3-atoms with weaker intensity relative to the other blocks and it is located at the same position considered occupied by Ag in the neyite structure. The two Bi-atoms neighbouring the Ag site are not immediately apparent on the HAADF STEM image where the darker contrast suggests the presence of lighter cations (Cu?). The second apparent discrepancy to the published model is the absence of obvious darkening on the Cu sites introduced by shearing of the (Pb, Bi)-blocks along the (922)PbS slabs. This difference between model and experiment could however be due to the specific environment, e.g., single Cu atoms, coordination, etc.
Our empirical comparative analysis undoubtedly shows that the large unit-cell sulphosalt under study is neyite since high-resolution HAADF STEM imaging allows for direct visualisation of the heavy atoms building the main blocks in the crystal structure. Differences in the distributions of the lighter cations relative to the sites (Ag and Cu) predicted by the model can be solved only by employing numerical simulations of the experimental images relative to the ideal crystal structure. Alternatively, using the ABF STEM imaging mode could help in tracking the lighter cations in the structure.
As in foil 1, the neyite in foil 2 also showed replacement (Figure 13; Supplementary Materials Figure S1) in the area marked by (ii) on Figure 6h, where a dense anastomosed vein network was observed (Supplementary Materials Figure S1a). At high magnification, HAADF STEM imaging showed that such veins have nm-scale dimension (up to 10–20 nm wide), and were completely filled with a mineral showing lattice fringes at ~4 Å with a ~103° angle between them when the specimen was tilted on the [010] neyite zone axis (Figure 13a). The vein displayed kink-geometry and protrusions within the matrix neyite. The mineral in the veins also showed bright dots (heavy atoms), but the margins of the vein locally appeared darker. No pores were detected.
In the same area as the veins, nanoparticles (NPs; particles with sizes of only a few nm) of the same mineral as in the veins are present (Figure 13b). The NPs were preferentially located along the (111)PbS slabs (Figure 13b, Supplementary Materials Figure S1b). Their geometry is relatively rounded and they tend to coalesce into one another (Figure 13b). Aggregation of such NPs could lead to formation of the veins themselves (Supplementary Materials Figure S1c). EDS spectra (a few nm spot size) showed that the mineral in the veins and NPs was also a sulphosalt, very similar in composition with the matrix neyite (Figure 13c). There is, however, a difference in the relative contents of Pb and Bi, where the height of the Mα peaks for both elements are akin to one another for the mineral in the vein relative to neyite. The mineral in the veins and NPs is attributable to a bismuthinite derivative such as aikinite (see below).
Attempts to use high resolution HAADF STEM imaging on foil 1 were unsuccessful due to the poor, uneven quality of the surface. We could, however, measure the composition of some of the small (tens of nm) grains of the bismuthinite derivatives and the surrounding, fine-grained lillianite homologue (Figure 14). The EDS spectra showed the presence of Ag peaks and a higher Bi Lα peak relative to the Pb Lα peak, indicating that this is an Ag-, Bi-substituted species and can be attributed to the B cluster on Figure 5c. Identification of a Cu-Pb-bearing member of the bismuthinite derivatives series relies on the relative comparison of EDS spectra with those of the lillianite homologue (Figure 14c,d), or neyite (Figure 11b and Figure 13c), and also indexing of the Fast Fourier Transform (FFT; inset Figure 14b) obtained from the image in Figure 14b on the [11-1] aikinite zone axis. The lattice fringes also allow for a direct comparison with the phase in the vein and NPs, shown above and in Supplementary Materials Figure S1d.
Besides providing the necessary details for the identification of neyite (Figure 12), the atomic-scale study provides a way to better understand models based on single crystal X-ray data, as discussed here for sites of Ag and Cu in the context of a modular sulphosalt structure. Most strikingly, the data show replacement between chemically- and structurally-related minerals of which the first step is the formation of NPs. The fact that this replacement takes place preferentially on modular blocks within a mineral with a larger crystal structure ((111)PbS in neyite) implies physical and chemical changes in the host mineral at the atomic scale. In this case, changes of the coordination polyhedra must be assumed to explain the transition from octahedral MeS6 in the (111)PbS layers of neyite to the square pyramidal coordination Me3+2 present in both the pyramidal and monocapped prismatic sites for Bi and Pb in the intermediate members of bismuthinite derivatives, leading to the creation of adjacent tetrahedral voids where a Cu atom is attached to each Pb replacing Bi (Figure 1b,d).
Based on the data above, we cannot, however, explain the modification of the same (111)PbS modules in neyite expressed as an irregular Cu-increase and leading to the patchiness seen at the lattice scale (Figure 10). Considering the preservation of geometry within this module, as opposed to the rounding associated with NP formation (Figure 13b), this could be considered an expression of lattice-scale intergrowths between discrete neyite species. This may include cuproneyite and “Cu-enriched” cuproneyite. Such a phenomenon can be readily associated with chemical gradients generated at reaction fronts in skarn-forming systems. Further work is required to validate this since the present crystal structural models are at odds with Cu incorporation in (111)PbS modules [75,76]. An alternative, potential explanation for the observations could lie in the FIB-milling procedures that would have remobilised atoms such as Cu. In such a case, however, it is rather difficult to explain the preservation of geometry not only in the larger modules but also in the smaller Cu-bearing motifs along the (100)PbS layers (Figure 10b and Figure 12a).
Lastly, an important result here is the discovery of nanometre-scale bismuthinite derivatives (aikinite) as inclusions (NPs and veins) within host neyite, which can account for the compositional shift from ideal neyite to aikinite and/or the related species in Figure 5c. It is very likely that the field of ‘Cu-enriched cuproneyite’ reported from the same deposit [76] could be similarly explained. Phase B consisted of nanoscale intergrowths between N = 8, Ag-, Bi-substituted lillianite homologue with aikinite. However, this phase could not be studied at the same level of detail as neyite. We note that Cd (several hundred ppm) differentiates between B (Cd-rich) and D (Cd-poor) phases (Figure 5a).

5. Discussion

The case study discussed here provides insights into ore-forming processes and particularly the interplay between lattice-scale mineral modifications that support geochemical changes and eventually leads to ore transformation. Secondly, the study draws attention to the relevance, and predictive capacity, of crystal structural modularity in mineral series, and the value this carries for recognition of primary crystallisation versus replacement processes.
The sections above report a progression from NP formation to veining in bismuth sulphosalts (Figure 13a,b), showing that the replacement process is substantial even at the sub-micron scale, and eventually leads to micron-scale mineral changes as observed along and across the reaction front. As the nm-size veins formed, minor/trace elements such as Ag (present in neyite but incompatible within the structures of bismuthinite derivatives) were released, and were either trapped as discrete Ag minerals (e.g., hessite), or transported elsewhere depending upon the availability of fluids and their interaction with existing minerals. The same scenario was also valid for other elements, such as Au. Gold was, however, present at concentrations of only tens to hundreds of ppm in the host bismuth sulphosalts [90], and thus orders of magnitude lower than Ag (e.g., 1–2 wt % in the neyite or lillianite homologues discussed here). Incorporation of Au in the lattice of bismuth sulphosalts is more effective in Ag-bearing species such as lillianite homologues and neyite (as in our case study), whereas it is difficult or impossible in bismuthinite derivatives unless distortion of Cu site is induced by uptake of Te to replace S [90]. This is concordant with the present observations, in which the coarsest aikinite acted as a ‘barrier’ promoting formation of Au–rich fronts (Figure 2 and Figure 5a).
The occurrence of discrete fine particles of native gold at the boundaries with sharp changes in mineralogy correlated with sub-µm-sized domain areas of dissolution and (re)precipitation reactions in the pre-existing minerals, and this progressively increased towards locations in the sample displaying nanoscale porosity. Such features indicated the percolation of fluids at disequilibrium with the parent minerals, and a coupling between the rates of dissolution with precipitation can be assumed based on the observation of pseudomorphic replacement [97], e.g., aikinite replaces pre-existing neyite + lillianite homologues along the same lamellae (Figure 2a). Whereas mineral replacement is widely documented, discussed, and experimentally tested for modelling petrological/ore forming processes [98], the present data showed for the first time, that these phenomena can be traced down to the atomic scale. The change, over several orders of magnitude, in the size of aikinite grains across distances of a few hundred µm ‘maps’ the physical state of Au enrichment in ore, from lattice-bound Au (ten to hundred ppm) in host Pb-Bi-sulphosalts, to abundant fine particles forming the Au-rich boundary at the contact to coarse aikinite (Figure 2, Figur 5a,b, and Figure 6d).
Baita Bihor is an unusually Bi-rich skarn deposit, and the type locality for several rare sulphosalts, including paderaite [99], cupromakovickyite [100], cuproneyite [76], and recently, also gratianite [14]. Skarn deposits worldwide show a close relationship between Bi-minerals and gold (e.g., [101]). The same is particularly true for skarn and other deposit types along the Late Cretaceous Banatitic Magmatic and Metallogenetic Belt in South Eastern Europe [102], in which the Baita Bihor deposit is hosted. Local gold enrichment in skarns of various types can be related to intrinsic stages of evolution, most likely during the switch from prograde to retrograde conditions, when waning metasomatic fluids are reversed back onto the prograde associations and replace them to various extents. Release of lattice-bound Au from any mineral recognised as a Au carrier is predictable, but those with complex modular structures, such as sulphosalts (bismuth sulphosalts in particular), also have the ability to ‘trap’ or ‘arrest’ such Au within the reaction area, as shown here. Such a mechanism of Au enrichment from hydrothermal fluids that would otherwise have concentrations of Au in the ppb range at most, to the formation of discrete Au-bearing minerals, is especially predictive in skarn environments but could also occur in other deposit types where similar conditions are met. Future studies will likely test the validity of the statements made here, leading us to predict a shift away from the current paradigm in which the ‘metal source’ is considered the most critical factor in deposit formation, to a focus on the intrinsic processes that can form and transform ore minerals.
Many ore assemblages comprise intergrowths between different minerals formed at the same time or during different stages in the deposit evolution. Provision of unequivocal evidence for the timing of their formation relative to one another is a key issue in ore petrology. Co-crystallization between different species within a series of minerals that share crystal-structural motifs can lead to coherent lattice-scale intergrowths between different members of the same or related series. Such features are paramount in explaining extended fields of compositional variation, common in natural bismuth sulphosalt assemblages [69,83,84,103,104,105].
Although more work is required to resolve the nature of the lattice-scale heterogeneity in neyite reported here, this is potentially an important contribution towards achieving an understanding of whether sulphosalts with boxwork architectures have subtle ways of reacting to chemical gradients, e.g., by slab zig-zag modulation rather than the lattice-scale intergrowths reported for sulphosalts with simpler structures. Such boxwork sulphosalts are also interesting because they have hierarchical levels of modularity, extending towards unusual compositions containing REE, or elements considered as critical metals such as In, and with anionic components including O and halogens ([58,106], and references therein).

6. Implications and Outlook

Despite the fact that the nanoscale characterization of ore minerals in a petrogenetic context is probably still in its infancy, numerous opportunities exist for innovative research. On the basis of preliminary data, we highlight several areas which we believe represent exciting avenues for future nanoscale mineralogical research. Furthermore, they all carry relevance for understanding how ore deposits form, how elements are distributed within them, and how the deposits can eventually be optimally exploited.
Observable across several orders of magnitude of scale and based on the correlation between chemistry and structural changes in host sulphosalts, we argue that structural-chemical modularity in minerals is a medium supporting the redistribution of minor and trace elements. This may offer predictive potential for finding specific metal concentrations within a given assemblage. As larger and larger volumes of accurate, site-specific trace element data for minerals has been generated, and these data find more and diverse applications in petrology and exploration, the number of questions regarding how, and indeed if, these elements are incorporated into the crystal lattice of the host mineral has also increased rapidly. This critical question goes right to the fundamental nature of solid solutions in minerals. Recent overviews of trace element studies in minerals [47] show the need and relevance of applying the kind of approach described here to a variety of other mineral systems. Examples include critical metals in sphalerite, heavy elements (U, Pb, W) in Fe-oxides, and REE, Y, or chalcophile elements (Mo, As) in skarn garnets, most of which cannot be readily predicted in ore deposits.
The Fe-oxides, magnetite and hematite, are excellent repositories for several dozen trace elements. The extensive compositional variation displayed by Fe-oxides opens opportunities for classifying and fingerprinting different types of ore deposits, tracing the provenance of detrital or alluvial oxide resources, as vectors for regional and mine-scale exploration, and in the deportment of potential by-products from Fe-oxide-bearing ores. Moreover, the ability of Fe-oxides to accommodate measureable concentrations of uranium and radiogenic lead opens up the possibility of U-Pb geochronology using minerals that are very common in hydrothermal ores [36,107]. However, the fundamental mechanisms by which many of these elements are incorporated within the oxides remain poorly constrained. Garnets are a further mineral group that displays extensive ranges of trace and minor element substitution, often complex substitution mechanisms, and they have a tendency, particularly in skarn systems, to host elements of petrogenetic and/or economic interest [108,109].
Quantifying the distributions of U, Th, and their daughter decay products in ores, concentrates, and tailings is of critical concern in some mining/processing operations. Unequivocal evidence for the key mineral hosts for these elements may, however, be difficult or impossible to obtain via traditional microanalytical techniques given their ultra-low concentrations and occurrence within particles which extend in size down to the nanoscale. Coupled with other methods such as α-particle tracking on the thin-section scale, in-situ sampling of small volumes of mineral material by FIB-SEM, subsequent HR-TEM, and HAADF STEM analysis provides an opportunity to bridge scales of observation from the micron- to nanometre scales, thus reducing the size of the “search area” by several orders of magnitude.
The latest generation of electron microscopes provides researchers in the geosciences and related fields an unparalleled opportunity to measure and characterize the structures and properties of minerals directly at the nanoscale. Moreover, interdisciplinary approaches involving instrumentation that can cover scales of observation from the macroscopic scale down to single atom resolution can deliver innovative solutions to problems of major economic significance. We can observe and interpret natural and man-made processes in minerals at the atomic scale, and in three dimensions—critical ingredients for the development of advanced technological solutions to problems previously considered insurmountable, including the generation of cleaner flotation concentrates, leading in turn to the improvement of production efficiency in the minerals sector.
There are certainly many other potential applications of nanoscale microscopy in ore petrology, and this will undoubtedly be a research field that is likely to expand in the near future as the instrumentation and the necessary research skills become more widely available. The present study shows ‘how to approach’ and ‘what are the opportunities’ brought in by advanced electron microscopy when performed on a site of petrogenetic interest.

Supplementary Materials

The following are available online at www.mdpi.com/2075-163X/6/4/112/s1.

Acknowledgments

We gratefully acknowledge valuable discussions with colleagues, co-authors, and Ph.D. students over the past decade on both the technical aspects of nanoscale characterisation, and on the problems themselves. Adelaide Microscopy and the Australian Microscopy and Microanalysis Research Facility are gratefully acknowledged for access to instrumentation and the time for Titan Themis sessions. Cristiana L. Ciobanu acknowledges support from the “FOX” project (Trace elements in iron oxides: deportment, distribution, and application in ore genesis, geochronology, exploration, and mineral processing), sponsored by BHP Billiton Olympic Dam and the S.A. Mining and Petroleum Services Centre of Excellence. We gratefully acknowledge insightful comments from the four journal reviewers.

Author Contributions

Cristiana L. Ciobanu conceived of this contribution, collected the data, and wrote the paper with valuable contributions from all co-authors (Nigel J. Cook, Christian Maunders, Benjamin P. Wade, and Kathy Ehrig). Christian Maunders operated the Titan Themis instrument, Benjamin P. Wade assisted with EPMA calibration and also provided feedback on the LA-ICP-MS mapping and processing.

Conflicts of Interest

The authors declare no conflict of interest.

References

  1. Heaney, P.J.; Vicenzi, E.P.; Giannuzzi, L.A.; Livi, K.J.T. Focused ion beam milling: A method of site-specific sample extraction for microanalysis of Earth and planetary materials. Am. Mineral. 2001, 86, 1094–1099. [Google Scholar] [CrossRef]
  2. Lee, M.R.; Bland, P.A.; Graham, G. Preparation of TEM samples by focused ion beam (FIB) techniques: Applications to the study of clays and phyllosilicates in meteorites. Mineral. Mag. 2003, 67, 581–592. [Google Scholar] [CrossRef]
  3. Wirth, R. Focused Ion Beam (FIB): A novel technology for advanced application of micro- and nanoanalysis in geosciences and applied mineralogy. Eur. J. Mineral. 2004, 16, 863–876. [Google Scholar] [CrossRef]
  4. Wirth, R. Focused Ion Beam (FIB) combined with SEM and TEM: Advanced analytical tools for studies of chemical composition, microstructure and crystal structure in geomaterials on a nanometre scale. Chem. Geol. 2009, 261, 217–229. [Google Scholar] [CrossRef]
  5. Graham, G.A.; Teslich, N.E.; Kearsley, A.T.; Stadermann, F.J.; Stroud, R.M.; Dai, Z.; Ishii, H.A.; Hutcheon, I.D.; Bajt, S.; Snead, C.J.; et al. Applied focused ion beam techniques for sample preparation of astromaterials for integrated nanoanalysis. Meteorit. Planet. Sci. 2008, 43, 561–569. [Google Scholar] [CrossRef]
  6. Lee, M.R. Transmission electron microscopy (TEM) of Earth and planetary materials: A review. Mineral. Mag. 2010, 74, 1–27. [Google Scholar] [CrossRef]
  7. Ciobanu, C.L.; Cook, N.J.; Utsunomiya, S.; Pring, A.; Green, L. Focussed ion beam-transmission electron microscopy applications in ore mineralogy: Bridging micron- and nanoscale observations. Ore Geol. Rev. 2011, 42, 6–31. [Google Scholar] [CrossRef]
  8. Cook, N.J.; Ciobanu, C.L.; Meria, D.; Silcock, D.; Wade, B. Arsenopyrite-pyrite association in an orogenic gold ore: Tracing mineralization history from textures and trace elements. Econ. Geol. 2013, 108, 1273–1283. [Google Scholar] [CrossRef]
  9. Ingham, E.S.; Cook, N.J.; Cliff, J.; Ciobanu, C.L.; Huddleston, A. A combined chemical, isotopic and microstructural study of pyrite from roll-front uranium deposits, Lake Eyre Basin, South Australia. Geochim. Cosmochim. Acta 2014, 125, 440–465. [Google Scholar] [CrossRef]
  10. Macmillan, E.; Ciobanu, C.L.; Ehrig, K.; Cook, N.J.; Pring, A. Chemical zoning and lattice distortion: Uraninite from Olympic Dam, South Australia. Am. Mineral. 2016, 101, 2351–2354. [Google Scholar] [CrossRef]
  11. Norberg, N.; Harlov, D.; Neusser, G.; Wirth, R.; Rhede, D.; Morales, L. Experimental development of patch perthite from synthetic cryptoperthite: Microstructural evolution and chemical re-equilibration. Am. Mineral. 2013, 98, 1429–1441. [Google Scholar] [CrossRef]
  12. Liu, Y.; King, H.E.; van Huis, M.A.; Drury, M.R.; Plūmper, O. Nano-tomography of porous geological materials using Focused Ion Beam-Scanning Electron Microscopy. Minerals 2016, 6, 104. [Google Scholar] [CrossRef]
  13. Yoshida, K.; Hirajina, T.; Miyake, A.; Tsuchiyama, A.; Ohi, S.; Nakano, T.; Uesugi, K. Combined FIB microsampling and X-ray microtomography: A powerful tool for the study of tiny fluid inclusions. Eur. J. Mineral. 2016, 28, 245–256. [Google Scholar] [CrossRef]
  14. Ciobanu, C.L.; Brugger, J.; Cook, N.J.; Mills, S.; Elliot, P.; Damian, G.; Damian, F. Graţianite, MnBi2S4, a new mineral from the Bǎiţa Bihor skarn, Romania. Am. Mineral. 2014, 99, 1163–1170. [Google Scholar] [CrossRef]
  15. Cook, N.J.; Ciobanu, C.L.; Brugger, J.; Etschmann, B.; Howard, D.J.; de Jonge, M.; Ryan, C.G.; Paterson, D. Determination of the oxidation state of Cu in substituted Cu-In-Fe-bearing sphalerite via μ-XANES spectroscopy. Am. Mineral. 2012, 97, 476–479. [Google Scholar] [CrossRef]
  16. Hoppe, P.; Cohen, S.; Meibom, A. NanoSIMS: Technical aspects and applications in cosmochemistry and biological geochemistry. Geostand. Geoanal. Res. 2013, 37, 111–154. [Google Scholar] [CrossRef]
  17. Obst, M.; Gasser, P.; Mavrocordatos, D.; Dittrich, M. TEM-specimen preparation of cell/mineral interfaces by Focused Ion Beam milling. Am. Mineral. 2005, 90, 1270–1277. [Google Scholar] [CrossRef]
  18. Schmid, G.; Zeitvogel, F.; Hao, L.; Ingino, P.; Floetenmeyer, M.; Stierhof, Y.-D.; Schroeppel, B.; Burkhardt, C.J.; Kappler, A.; Obst, M. 3-D analysis of bacterial cell-(iron)mineral aggregates formed during Fe(II) oxidation by the nitrate-reducing Acidovorax sp. strain BoFeN1 using complementary microscopy tomography approaches. Geobiology 2014, 12, 340–361. [Google Scholar] [CrossRef] [PubMed]
  19. Lee, M.R.; Brown, D.J.; Smith, C.L.; Hodson, M.E.; MacKenzie, M.; Hellmann, R. Characterization of mineral surfaces using FIB and TEM: A case study of naturally weathered alkali feldspars. Am. Mineral. 2007, 92, 1383–1394. [Google Scholar] [CrossRef]
  20. Kontonikas-Charos, A.; Ciobanu, C.L.; Cook, N.J. Albitization and redistribution of REE and Y in IOCG systems: Insights from Moonta-Wallaroo, Yorke Peninsula, South Australia. Lithos 2014, 208, 178–201. [Google Scholar] [CrossRef]
  21. Wo, P.C.; Munroe, P.R.; Vasiliev, M.; Xie, Z.H.; Alameh, K.; Kotov, V. A novel technique for microstructure characterization of garnet films. Opt. Mater. 2009, 32, 315–322. [Google Scholar] [CrossRef]
  22. Hartmann, K.; Wirth, R.; Heinrich, W. Synthetic near Σ5 (210)/[100] grain boundary in YAG fabricated by direct bonding: Structure and stability. Phys. Chem. Miner. 2010, 37, 291–300. [Google Scholar] [CrossRef]
  23. Palacios-Lidon, E.; Grauby, O.; Henry, C.; Astier, J.-P.; Barth, C.; Baronnet, A. TEM-assisted dynamic scanning force microscope imaging of (001) antigorite: Surfaces and steps on a modulated silicate. Am. Mineral. 2010, 95, 673–685. [Google Scholar] [CrossRef]
  24. Bourdelle, F.; Parra, T.; Beyssac, O.; Chopin, C.; Moreau, F. Ultrathin section preparation of phyllosilicates by Focused Ion Beam milling for quantitative analysis by TEM-EDX. Appl. Clay Sci. 2012, 59–60, 121–130. [Google Scholar] [CrossRef]
  25. Cosmidis, J.; Benzerara, K.; Menguy, N.; Arning, E. Microscopy evidence of bacterial microfossils in phosphorite crusts of the Peruvian shelf: Implications for phosphogenesis mechanisms. Chem. Geol. 2013, 359, 10–22. [Google Scholar] [CrossRef]
  26. Schindler, M.; Legrand, C.A.; Hochella, M.F. Alteration, adsorption and nucleation processes on clay-water interfaces: Mechanisms for the retention of uranium by altered clay surfaces on the nanometer scale. Geochim. Cosmochim. Acta 2015, 153, 15–36. [Google Scholar] [CrossRef]
  27. Klein-BenDavid, O.; Wirth, R.; Navon, O. Micrometer-scale cavities in fibrous and cloudy diamonds—A glance into diamond dissolution events. Earth Planet. Sci. Lett. 2007, 264, 89–103. [Google Scholar] [CrossRef]
  28. Miyahara, M.; Ohtani, E.; Kimura, M.; El Goresy, A.; Ozawa, S.; Nagase, T.; Nishijima, M.; Hiraga, K. Coherent and subsequent incoherent ringwoodite growth in olivine of shocked L6 chondrites. Earth Plan. Sci. Lett. 2010, 295, 321–327. [Google Scholar] [CrossRef]
  29. Ma, C.; Connolly, H.C., Jr.; Beckett, J.R.; Tschauner, O.; Rossman, G.R.; Kampf, A.R.; Zega, T.J.; Smith, S.A.S.; Schrader, D.L. Brearleyite, Ca12Al14O32Cl2, a new alteration mineral from the NWA 1934 meteorite. Am. Mineral. 2011, 96, 1199–1206. [Google Scholar] [CrossRef]
  30. Sautter, V.; Lorand, J.-P.; Cordier, P.; Rondeau, B.; Leroux, H.; Ferraris, C.; Pont, S. Petrogenesis of mineral micro-inclusions in an uncommon carbonado. Eur. J. Mineral. 2011, 23, 721–729. [Google Scholar] [CrossRef]
  31. Le Guillou, C.; Changela, H.G.; Brearley, A.J. Widespread oxidized and hydrated amorphous silicates in CR chondrites matrices: Implications for alteration conditions and H2 degassing of asteroids. Earth Plan. Sci. Lett. 2015, 420, 162–173. [Google Scholar] [CrossRef]
  32. Kaneko, S.; Miyahara, M.; Ohtani, E.; Arai, T.; Hirao, N.; Sato, K. Discovery of stishovite in Apollo 15299 sample. Am. Mineral. 2015, 100, 1308–1311. [Google Scholar] [CrossRef]
  33. Harlov, D.E.; Wirth, R.; Hetherington, C.J. The relative stability of monazite and huttonite at 300–900 °C and 200–1000 MPa: Metasomatism and the propagation of metastable mineral phases. Am. Mineral. 2007, 92, 1652–1664. [Google Scholar] [CrossRef]
  34. Seydoux-Guillaume, A.-M.; Wirth, R.; Ingrin, J. Contrasting response of ThSiO4 and monazite to natural irradiation. Eur. J. Mineral. 2007, 19, 7–14. [Google Scholar] [CrossRef]
  35. Hazen, R.M.; Ewing, R.C.; Sverjensky, D.A. Evolution of uranium and thorium minerals. Am. Mineral. 2009, 94, 1293–1311. [Google Scholar] [CrossRef]
  36. Ciobanu, C.L.; Wade, B.; Cook, N.J.; Schmidt Mumm, A.; Giles, D. Uranium-bearing hematite from the Olympic Dam Cu-U-Au deposit, South Australia: A geochemical tracer and reconnaissance Pb-Pb geochronometer. Precambr. Res. 2013, 238, 129–147. [Google Scholar] [CrossRef]
  37. Macmillan, E.; Cook, N.J.; Ehrig, K.; Ciobanu, C.L.; Pring, A. Uraninite from the Olympic Dam IOCG-U-Ag deposit: Linking textural and compositional variation to temporal evolution. Am. Mineral. 2016, 101, 1295–1320. [Google Scholar] [CrossRef]
  38. Ciobanu, C.L.; Cook, N.J.; Ehrig, K. Ore minerals down to the nanoscale: Cu-(Fe)-sulphides from the Iron Oxide Copper Gold deposit at Olympic Dam, South Australia. Ore Geol. Rev. 2016. [Google Scholar] [CrossRef]
  39. Cook, N.J.; Etschmann, B.; Ciobanu, C.L.; Howard, D.; Williams, T.; Rae, N.; Pring, A.; Geraki, K.; Chen, G.R.; Brugger, J. Synchrotron XANES study of a Ge-(Fe)-bearing sphalerite. Minerals 2015, 5, 117–132. [Google Scholar] [CrossRef]
  40. Ciobanu, C.L.; Cook, N.J.; Kelson, C.R.; Guerin, R.; Kalleske, N.; Danyushevsky, L. Trace element heterogeneity in molybdenite fingerprints stages of mineralization. Chem. Geol. 2013, 347, 175–189. [Google Scholar] [CrossRef]
  41. Wirth, R.; Reid, D.; Schreiber, A. Nanometer-sized platinum-group minerals (PGM) in base metal sulfides: New evidence for an orthomagmatic origin of the Merensky Reef PGE ore deposit, bushveld complex, South Africa. Can. Mineral. 2013, 51, 143–155. [Google Scholar] [CrossRef]
  42. Junge, M.; Wirth, R.; Oberthür, T.; Melcher, F. Mineralogical siting of platinum-group elements in pentlandite from the Bushveld Complex, South Africa. Mineral. Depos. 2015, 50, 41–54. [Google Scholar] [CrossRef]
  43. Harries, D.; Pollok, K.; Langenhorst, F. Translation interface modulation in NC-pyrrhotites: Direct imaging by TEM and a model toward understanding partially disordered structural states. Am. Mineral. 2011, 96, 716–731. [Google Scholar] [CrossRef]
  44. Harries, D.; Pollok, K.; Langenhorst, F. Oxidative dissolution of 4C- and NC-pyrrhotite: Intrinsic reactivity differences, pH dependence, and the effect of anisotropy. Geochim. Cosmochim. Acta 2013, 102, 23–44. [Google Scholar] [CrossRef]
  45. Tooth, B.; Ciobanu, C.L.; Green, L.; O’Neill, B.; Brugger, J. Bi-melt formation and gold scavenging from hydrothermal fluids: An experimental study. Geochim. Cosmochim. Acta 2011, 75, 5423–5443. [Google Scholar] [CrossRef]
  46. Ciobanu, C.L.; Cook, N.J.; Utsunomiya, S.; Kogagwa, M.; Green, L.; Gilbert, S.; Wade, B. Gold-telluride nanoparticles revealed in arsenic-free pyrite. Am. Mineral. 2012, 97, 1515–1518. [Google Scholar] [CrossRef]
  47. Cook, N.J.; Ciobanu, C.L.; George, L.; Zhu, Z.-Y.; Wade, B.P.; Ehrig, K. Trace element analysis of minerals in magmatic-hydrothermal ores by laser ablation inductively-coupled plasma mass spectrometry: approaches and opportunities. Minerals 2016, 6, 111. [Google Scholar]
  48. Van Tendeloo, G.; Bals, S.; van Aert, S.; Verbeek, J.; van Dyck, D. Advanced electron microscopy for advanced materials. Adv. Mater. 2012, 24, 5655–5675. [Google Scholar] [CrossRef] [PubMed]
  49. Crewe, A.V.; Wall, J.; Langmore, J. Visibility of single atoms. Science 1970, 168, 1338–1340. [Google Scholar] [CrossRef] [PubMed]
  50. Utsunomiya, S.; Ewing, R.C. Application of high-angle annular dark field scanning transmission electron microscopy, scanning transmission electron microscopy-energy dispersive X-ray spectrometry, and the energy-filtered transmission electron microscopy to the characterization of nanoparticles in the environment. Environ. Sci. Technol. 2003, 37, 786–791. [Google Scholar] [PubMed]
  51. Palenik, C.S.; Utsunomiya, S.; Reich, M.; Kesler, S.E.; Ewing, R.C. Invisible gold revealed: Direct imaging of gold nanoparticles in a Carlin-type deposit. Am. Mineral. 2004, 89, 1359–1366. [Google Scholar] [CrossRef]
  52. Reich, M.; Utsunomiya, S.; Kesler, S.E.; Wang, L.; Ewing, R.C.; Becker, U. Thermal behavior of metal nanoparticles in geologic materials. Geology 2006, 34, 1033–1036. [Google Scholar] [CrossRef]
  53. Deditius, A.P.; Utsunomiya, S.; Reich, M.; Kesler, S.E.; Ewing, R.C.; Hough, S.E.; Walshe, J. Trace metal nanoparticles in pyrite. Ore Geol. Rev. 2011, 42, 32–46. [Google Scholar] [CrossRef]
  54. Utsunomiya, S.; Kogawa, M.; Kamiishi, E.; Ewing, R.C. Scanning transmission electron microscopy and related techniques for research on actinide and radionuclide nanomaterials. In Actinide Nanoparticle Research; Springer: Berlin/Heidelberg, Germany, 2011; pp. 33–62. [Google Scholar]
  55. Utsunomiya, S.; Palenik, C.S.; Valley, J.W.; Cavosie, A.J.; Wilde, S.A.; Ewing, R.C. Nanoscale occurrence of Pb in an Archean zircon. Geochim. Cosmochim. Acta 2004, 68, 4679–4686. [Google Scholar] [CrossRef]
  56. Lazić, I.; Bosch, E.G.; Lazar, S. Phase contrast STEM for thin samples: Integrated differential phase contrast. Ultramicroscopy 2016, 160, 265–280. [Google Scholar] [CrossRef] [PubMed]
  57. Xu, H.; Shen, Z.; Konishi, H. Si-magnetite nano-precipitates in silician magnetite from banded iron formation: Z-contrast imaging and ab initio study. Am. Mineral. 2014, 99, 2196–2202. [Google Scholar] [CrossRef]
  58. Makovicky, E. Modular aspects of sulfides and sulfosalts. In EMU Notes in Mineralogy: Modular Aspects of Minerals; Merlino, S., Ed.; European Mineralogical Union: Jena, Germany, 1997; Volume 1, pp. 237–271. [Google Scholar]
  59. Guiner, A.; Bokij, G.B.; Boll-Dornberger, K.; Cowley, J.M.; Durovic, S.; Jagogzinski, H.; Krishna, P.; de Wolff, P.M.; Zvyagin, B.B.; Cox, D.E.; et al. Nomenclature of polytype structures. Acta Crystallogr. 1984, A40, 399–404. [Google Scholar]
  60. Veblen, D.R. Polysomatism and polysomatic series: A review and applications. Am. Mineral. 1991, 76, 801–826. [Google Scholar]
  61. De Lima Faria, J.; Hellner, E.; Makovicky, E.; Parthe, E. Nomenclature of inorganic structure types. Report of the International Union of crystallography commission on crystallographic nomenclature subcommittee on the nomenclature of inorganic structure types. Acta Crystallogr. 1990, A46, 1–11. [Google Scholar]
  62. Moëlo, Y.; Makovicky, E.; Mozgova, N.N.; Jambor, J.L.; Cook, N.; Pring, A.; Paar, W.; Nickel, E.H.; Graeser, S.; Karup-Møller, S.; et al. Sulfosalt systematics: A review. Report of the sulfosalt sub-committee of the IMA Commission on Ore Mineralogy. Eur. J. Mineral. 2008, 20, 7–62. [Google Scholar] [CrossRef]
  63. Cook, N.J.; Ciobanu, C.L.; Stanley, C.J.; Paar, W.; Sundblad, K. Compositional data for Bi-Pb tellurosulfides. Can. Mineral. 2007, 45, 417–435. [Google Scholar] [CrossRef]
  64. Cook, N.J.; Ciobanu, C.L.; Wagner, T.; Stanley, C.J. Minerals of the system Bi-Te-Se-S related to the tetradymite archetype: Review of classification and compositional variation. Can. Mineral. 2007, 45, 665–708. [Google Scholar] [CrossRef]
  65. Ciobanu, C.L.; Pring, A.; Cook, N.J.; Self, P.; Jefferson, D.; Dima, G.; Melnikov, V. Chemical-structural modularity in the tetradymite group: A HRTEM study. Am. Mineral. 2009, 94, 517–534. [Google Scholar] [CrossRef]
  66. Ohmasa, M.; Nowacki, W. A redetermination of the crystal structure of aikinite [BiS2|S|CuIVPbVII]. Z. Krist. 1970, 132, 71–86. [Google Scholar] [CrossRef]
  67. Kohatsu, I.; Wuensch, B.J. The crystal structure of gladite, PbCuBi5S9, a superstructure intermediate in the series Bi2S3-PbCuBiS3 (bismuthinite-aikinite). Acta Crystallogr. 1976, B32, 2401–2409. [Google Scholar] [CrossRef]
  68. Petricek, V.; Makovicky, E. Interpretation of selected structures of the bismuthinite-aikinite series as commensurately modulated structures. Can. Mineral. 2006, 44, 189–206. [Google Scholar] [CrossRef]
  69. Pring, A. Structural disorder in aikinite and krupkaite. Am. Mineral. 1989, 74, 25–255. [Google Scholar]
  70. Pring, A. Annealing of synthetic hammarite, Cu2Pb2Bi4S9, and the nature of cation-ordering processes in the bismuthinite–aikinite series. Am. Mineral. 1995, 80, 1166–1173. [Google Scholar] [CrossRef]
  71. Mozgova, N.N.; Nenasheva, S.N.; Chistyakova, N.I.; Mogilevkin, S.B.; Sivtsov, A.V. Compositional fields of minerals in the bismuthinite-aikinite series. Neues Jahrb. Mineral. Monatsh. 1990, 35–45. [Google Scholar]
  72. Ciobanu, C.L.; Cook, N.J. Intergrowths of bismuth sulphosalts from the Ocna de Fier Fe-skarn deposit, Banat, Southwest Romania. Eur. J. Mineral. 2000, 12, 899–917. [Google Scholar]
  73. Cook, N.J.; Ciobanu, C.L. Bismuth tellurides and sulphosalts from the Larga hydrothermal system, Metaliferi Mts., Romania: Paragenesis and genetic significance. Mineral. Mag. 2004, 68, 301–321. [Google Scholar] [CrossRef]
  74. Makovicky, E.; Mumme, W.G.; Hoskins, B.F. The crystal structure of Ag-Bi-bearing heyrovskýite. Can. Mineral. 1991, 29, 553–559. [Google Scholar]
  75. Makovicky, E.; Balić-Žunić, T.; Topa, D. The crystal structure of neyite, Ag2Cu6Pb25Bi26S68. Can. Mineral. 2001, 39, 1365–1376. [Google Scholar] [CrossRef]
  76. Ilinca, G.; Makovicky, E.; Topa, D.; Zagler, G. Cuproneyite, Cu7Pb27Bi25S68, a new mineral species from Baita Bihor, Romania. Can. Mineral. 2012, 50, 353–370. [Google Scholar] [CrossRef]
  77. Takeuchi, Y. Tropochemical twinning: A mechanism of building complex structures. Recent Prog. Nat. Sci. Jpn. 1978, 3, 153–181. [Google Scholar]
  78. Makovicky, E.; Karup-Møller, S. Chemistry and crystallography of the lillianite homologous series. I. General properties and definitions. Neues Jahrb. Mineral. Abh. 1977, 130, 264–287. [Google Scholar]
  79. Makovicky, E.; Karup-Møller, S. Chemistry and crystallography of the lillianite homologous series. II. Definition of new minerals: Eskimoite, vikingite, ourayite and treasurite. Redefinition of schirmerite and new data on the lillianite–gustavite solid-solution series. Neues Jahrb. Mineral. Abh. 1977, 131, 56–82. [Google Scholar]
  80. Makovicky, E. The building principles and classification of bismuth–lead sulphosalts and related compounds. Fortschr. Mineral. 1981, 59, 137–190. [Google Scholar]
  81. Topa, D.; Makovicky, E.; Schimper, H.J.; Dittrich, H. The crystal structure of a synthetic orthorhombic N = 8 member of the lillianite homologous series. Can. Mineral. 2010, 48, 1127–1135. [Google Scholar] [CrossRef]
  82. Pinto, D.; Balic-Zunic, T.; Garavelli, A.; Vurro, F. Structure refinement of Ag-free heyrovskyite from Vulcano (Aeolian Islands, Italy). Am. Mineral. 2011, 96, 1120–1128. [Google Scholar] [CrossRef]
  83. Colaitis, D.; van Dyck, D.; Amelincks, S. Electron microscope study of the system mPbS-nBi2S3. Phys. Status Solidi 1981, 68, 419–438. [Google Scholar] [CrossRef]
  84. Pring, A.; Jercher, M.; Makovicky, E. Disorder and compositional variation in the lillianite homologous series. Mineral. Mag. 1999, 63, 917–926. [Google Scholar] [CrossRef]
  85. Pring, A.; Ciobanu, C.L. Chemical modulations in Pb-Bi-sulphosalts: A glimpse at minerals in solid-state chemistry. In Turning Points in Solid State, Materials and Surface Chemistry; Harris, K., Edwards, P., Eds.; Royal Society of Chemistry: London, UK, 2008; pp. 239–249. [Google Scholar]
  86. Skowron, A.; Tilley, R.J.D. Chemically twinned phases in the Ag2S-PbS-Bi2S3 system. Part 1. Electron Microscope Study. J. Solid State Chem. 1990, 85, 235–250. [Google Scholar] [CrossRef]
  87. Drummond, A.D.; Trotter, J.; Thompson, R.M.; Cower, J.A. Neyite; a new sulphosalt from Alice Arm, British Columbia. Can. Mineral. 1969, 10, 90–96. [Google Scholar]
  88. Cioflica, G.; Vlad, S.; Volanschi, E.; Stoici, S. Magnesian skarns and associated mineralization at Baita Bihor. St. Cerc. Geol. Geofiz. Geogr. Ser. Geol. 1977, 22, 39–57. [Google Scholar]
  89. Cioflica, G.; Vlad, S.; Stoici, S. Repartition de la mineralisation dans les skarns de Baita Bihorului. Rev. Roum. Geol. Geophys. Geogr. Ser. Geol. 1971, 15, 43–58. (In French) [Google Scholar]
  90. Ciobanu, C.L.; Cook, N.J.; Pring, A.; Brugger, J.; Danushevsky, L.; Shimizu, M. ‘Invisible gold’ in bismuth chalcogenides. Geochim. Cosmochim Acta 2009, 73, 1970–1999. [Google Scholar] [CrossRef]
  91. Probe Software. Electron Microprobe Software Designed for Users by Users. Available online: http://www.probesoftware.com/ (accessed on 19 October 2016).
  92. George, L.; Cook, N.J.; Ciobanu, C.L. Trace and minor elements in galena: A reconnaissance LA-ICP-MS study. Am. Mineral. 2015, 100, 548–569. [Google Scholar] [CrossRef]
  93. American Mineralogist Crystal Structure Database. Available online: http://rruff.geo.arizona.edu/AMS/amcsd.php (accessed on 19 October 2016).
  94. FEI ChemiSTEM Technology: A Revolution in EDX Analytics. Available online: https://www.fei.com/WorkArea/DownloadAsset.aspx?id=21474838678 (accessed on 19 October 2016).
  95. Kohatsu, I.; Wuensch, B.J. The crystal structure of nuffieldite, Pb2Cu(Pb,Bi)Bi2S7. Z. Krist. 1973, 138, 343–365. [Google Scholar] [CrossRef]
  96. Moëlo, Y.; Meerschaut, A.; Makovicky, E. Refinement of the crystal structure of nuffieldite, Pb2Cu1.4(Pb0.4Bi0.4Sb0.2)Bi2S7: Structural relationships and genesis of complex lead sulfosalt structures. Can. Mineral. 1997, 35, 1497–1508. [Google Scholar]
  97. Putnis, A. Mineral replacement reactions: From macroscopic observations to microscopic mechanisms. Mineral. Mag. 2002, 66, 689–708. [Google Scholar] [CrossRef]
  98. Putnis, A. Mineral replacement reactions. Rev. Mineral. 2009, 70, 87–124. [Google Scholar] [CrossRef]
  99. Mumme, W.G. The crystal structure of paderaite, a mineral of the cuprobismutite series. Can. Mineral. 1986, 24, 513–521. [Google Scholar]
  100. Topa, D.; Makovicky, E.; Balic-Zunic, T. What is the reason for the doubled unit-cell volumes of copper-lead-rich pavonite homologues? The crystal structures of cupromakovickyite and makovickyite. Can. Mineral. 2008, 46, 515–523. [Google Scholar] [CrossRef]
  101. Meinert, L.D. Gold in skarns related to epizonal intrusions. Rev. Econ. Geol. 2000, 13, 347–375. [Google Scholar]
  102. Ciobanu, C.L.; Cook, N.J.; Stein, H. Regional setting and geochronology of the Late Cretaceous Banatitic Magmatic and metallogenetic belt. Mineral. Depos. 2002, 37, 541–567. [Google Scholar] [CrossRef]
  103. Pring, A.; Etschmann, B. HRTEM observations of structural and chemical modulations in cosalite and its relationship to the lillianite homologues. Mineral. Mag. 2002, 66, 451–458. [Google Scholar] [CrossRef]
  104. Cook, N.J.; Ciobanu, C.L. Lamellar minerals of the cuprobismutite series and related padĕraite: A new occurrence and implications. Can. Mineral. 2003, 41, 441–456. [Google Scholar] [CrossRef]
  105. Ciobanu, C.L.; Pring, A.; Cook, N.J. Micron- to nano-scale intergrowths among members of the cuprobismutite series and padĕraite: HRTEM and microanalytical evidence. Mineral. Mag. 2004, 68, 279–300. [Google Scholar] [CrossRef] [Green Version]
  106. Makovicky, E.; Topa, D. The crystal structure of sulfosalts with the boxwork architecture and their new representative, Pb15−2xSb14+2xS36Ox. Can. Mineral. 2009, 47, 3–24. [Google Scholar] [CrossRef]
  107. Courtney-Davies, L.; Zhu, Z.Y.; Ciobanu, C.L.; Wade, B.P.; Cook, N.J.; Ehrig, K.; Cabral, A.R.; Kennedy, A. Matrix-matched iron-oxide laser ablation ICP-MS U-Pb geochronology using mixed solution standards. Minerals 2016, 6, 85. [Google Scholar] [CrossRef]
  108. Ismail, R.; Ciobanu, C.L.; Cook, N.J.; Teale, G.; Giles, D.; Schmidt Mumm, A.; Wade, B. Rare earths and other trace elements in minerals from skarn assemblages, Hillside iron oxide-copper-gold deposit, Yorke Peninsula, South Australia. Lithos 2014, 184–187, 456–477. [Google Scholar] [CrossRef]
  109. Xu, J.; Ciobanu, C.L.; Cook, N.J.; Zheng, Y.; Sun, X.; Wade, B.P. Skarn formation and trace elements in garnet and associated minerals from Zhibula coper deposit, Gangdese Belt, southern Tibet. Lithos 2016, 262, 213–231. [Google Scholar] [CrossRef]
Figure 1. (a) Ternary (Cu, Ag)-Bi-Pb plot showing bismuth sulphosalts of interest in this study. Known species in the bismuthinite derivative series (left) and lillianite homologous series (right) are located on the plot; (be) Projection (as marked) of crystal structures for selected sulphosalts illustrating the main building blocks. Atoms are shown as balls: dark grey (smaller)—Bi; light grey (larger)—Pb; red—Cu; green—Ag; yellow—S. Coordination polyhedra are shown using the same colour code for each atom type; (b) Aikinite crystal structure [66] is built by Pb2S6 ribbons (dark grey) with 4 Cu atoms filling adjacent tetrahedral voids and BiS2+3 in monocapped prismatic polyhedra (light grey); (c) Ag-Bi-substituted heyrovskyite [74]. The bicapped trigonal prismatic PbS6+2 position is along the mirror planes (dark grey), the other cations (Ag, Pb, and Bi) are present in the octahedral MeS6 sites (light grey). The homologue number (N = 7 for heyrovskyite) represents the average of the BiS6 octahedra along (311)PbS directions counted on each side of the mirror planes (N = N1 + N2); (d) Neyite [75], showing the main building blocks as marked; (e) Cuproneyite [76], differing from neyite in that three types of Cu sites are present (linear, triangular, and asymmetrically tetrahedral), and the Ag position is occupied by Cu atoms.
Minerals 06 00112 g001
Figure 2. Back Scatter Electron (BSE) images showing aspects of the Au-rich boundary along the reaction front, in which there is a sharp change from aikinite to Cu-Ag-bearing Pb-Bi-sulphosalts. Galena (Gn) is present in the matrix. (a) Gold concentrations (yellow) along the front from laser ablation inductively coupled plasma mass spectrometry (LA-ICP-MS) data [90]; (b) Detail showing inclusions of native gold along the reaction front correlating with Cu-enrichment (darker shades) in the Pb-Bi-sulphosalts.
Minerals 06 00112 g002
Figure 3. BSE images (ac) showing typical symplectitic and lamellar intergrowths between Bi-ss and galena; (d) (Cu, Ag)-(Bi, Sb)-Pb ternary diagram, showing the composition of sulphosalts and sulphides throughout the entire sample (polished block). Star symbols represent ideal phases. Square: aikinite; circles: heyrovskyite; triangles: Pb-Bi-sulphosalts as marked. Abbreviations: Ai—aikinite; B—Pb-Bi sulphosalt (bright); D—Pb-Bi sulphosalt (dark); both B and D are Cu-Ag-bearing; E—eskimoite; Gn—galena; Hey—heyrovskyite; Nuf—nuffieldite; O—ourayite; V—vikingite; T—treasurite; (1)—Ag-Bi-substituted heyrovskyite [74]; (2)—Ag-Bi-substituted N = 8 synthetic lillianite homologues [81].
Minerals 06 00112 g003
Figure 4. Secondary Electron (SE) image showing the mapped areas (top left). Circle: area of FIB cuts (see Figure 5b) and LA-ICP-MS element maps for an area along the ‘reaction front’ marked on Figure 2a. See text for more explanations. Ai–aikinite; B–bright Pb-Bi-sulphosalt; D–dark Pb-Bi-sulphosalt; Cp–chalcopyrite; Gn–galena; Witt–wittichenite.
Minerals 06 00112 g004
Figure 5. (a) Reduced areas of LA-ICP-MS maps (from Figure 4) for elements of interest, showing the reaction zone used for the FIB-SEM study; (b) Secondary electron image showing the areas where FIB-cross sectioning and imaging were carried out, and from where the TEM samples were extracted. White lines show the locations of FIB-cuts and their number (foils 1–5); (c) Compositional plot showing sulphosalts from the area with the FIB-cuts in (b). Stars-ideal compositions; squares - aikinite; triangles–Pb-Bi-sulphosalts. Stars labelled (1) and (2) represent phases as given in Figure 1a and Figure 3d. Abbreviations: Ai—aikinite; Cp—chalcopyrite; CNe—cuproneyite; Cu-CNE—Cu-enriched cuproneyite; Cos—cosalite; Gb—galenobismuthite; Hey—heyrovskyite; Gus—gustavite; Kr—krupkaite; Lil—lillianite.
Minerals 06 00112 g005
Figure 6. Secondary Electron images showing details of the FIB-cuts lifted and placed on Cu grids (af); and TEM images of foils 1 and 2 (gh); Note the association between alabandite (Abn) and native gold (Au) along fractures (ab) and trails (c); Abundant, finest grains of native gold in aikinite (d); Note their distribution at the contact between aikinite and dark Bi-ss; (e,f) Details of fine particles of native gold at the contact between galena and alabandite. See the text for additional explanation. Letters A, B in (g) and (i), (ii) in (h) define areas of interest discussed in the text.
Minerals 06 00112 g006
Figure 7. Bright Field (BF) HR-TEM images and SAEDs (on zone axes as marked) showing associations between aikinite (Ai; ac) and the bright Pb-Bi-sulphosalt (phase B) identified as N = 8 lillianite homologue (8L; df). Note the fine-grained aggregate of B at the boundary to aikinite (a,b), and the high contrast between different slabs typical of twinning in lillianite homologues. Note the presence of streaks along c* and equivalent directions indicating disorder in 8L. See text for additional explanation.
Minerals 06 00112 g007
Figure 8. BF HR-TEM images and SAEDs (on zone axes as marked) showing details of Pb-Bi sulphosalt (D) (a,b) indexed as neyite (Ney); and relationships with Pb-Bi-sulphosalt (B) identified as 8L (c,d); Note the step-wise offsets at the contact between the two sulphosalts (c).
Minerals 06 00112 g008
Figure 9. BF HR-TEM images showing replacement relationships between aikinite (Ai) and the two Pb-Bi-sulphosalts (D and B) (a,b,d); defects along phase boundaries (c) and inclusions of native gold (e) and hessite Hs; (f) at grain boundaries. See the text for additional explanation.
Minerals 06 00112 g009
Figure 10. HAADF STEM images showing patterns realised by building blocks in the crystal structure of neyite down to the [010] zone axis (dark Pb-Bi-sulphosalt (phase D) in area (i) of foil 2; Figure 6h). Note the “zig-zag” pattern expressed as contrast variation in the ‘rhombic’ motifs forming parallel strips in (a); In (b) the structural motifs are shown by different orientations of the heavy atoms (bright dots; Bi, Pb), and dark contrast for units formed by lighter elements (Ag and Cu). Note the transitional, variable contrast for the rhombic motifs but the preservation of the geometrical outline. See the text for additional explanation.
Minerals 06 00112 g010
Figure 11. (a) EDS profile across one of the dark ‘rhombic’ motifs showing that it is richer in Cu; (b) EDS spectra for points along the profile in (a), showing the relative variation in concentrations of the main elements for spots outside and inside the motif. The high Cu peak is due to interference with the Cu grid. Note that the Ag peak is barely visible for neyite (concentration threshold for the detector?); (c) EDS elemental maps for one of rhombic motifs (rectangle on HAADF STEM image corner left), showing that it is Cu-rich, and Bi-Pb-poor relative to the enclosing matrix.
Minerals 06 00112 g011
Figure 12. Crystal structural slabs in the dark Pb-Bi-sulphosalt (D), identified from the HAADF STEM image in (a) and, in (b); an enlargement of the white rectangle area in (a); matching the neyite structure [75]; (c) down to the [010] zone axis. The slabs are outlined by: (111)PbS—dark blue and grey shading; (100)PbS—light blue and grey shading. Note the excellent correlation between the number of heavy atoms (Pb, Bi as white dots on the HAADF STEM images and small and larger grey balls on the sketch in (c)). The small rhombs in red correspond to Cu whereas the green rectangles show Ag positions. The purple shading in (b), and outlines in (c), show two small sheared blocks alternating with the Ag-bearing slabs (green outline on (c)). Note that these are dark on the HAADF STEM images (a,b), suggesting that they host atoms lighter than Bi and Pb considered in the structural model. See the text for additional explanation.
Minerals 06 00112 g012
Figure 13. HAADF STEM images (a,b) and EDS spectra (c) showing the replacement of neyite (Pb-Bi-sulphosalt B) by aikinite in area (ii) of foil 2 (Figure 6h). Neyite is tilted down to the [010] zone axis; aikinite shows lattice fringes down to [11-1] zone axis—see Figure 14b. (a) Nanometre-sized vein of aikinite with a kink-like trajectory. Note the darker margins, as well as the protrusions within neyite; (b) Nanoparticles of aikinite (NPs) with typical 1–3 nm size, centred on the (111)PbS slabs in the neyite structure. Note that they have round shapes; (c) EDS spectra representing the matrix neyite and vein aikinite, showing the relative differences for the peaks of the main elements (Bi and Pb). The high Cu peak is due to interference from the Cu grid. Note that the Ag peak is not visible for neyite (concentration threshold for the detector?).
Minerals 06 00112 g013
Figure 14. HAADF STEM images (a,b) and EDS spectra (c,d) of N = 8 lillianite homologue and aikinite in foil 1, area A (Figure 6). Fast Fourier Transform (FFT) in the inset of (b) indicates aikinite on the [11-1] zone axis. Lillianite shows dark contrast lamellae in (a). Note the presence of a distinct Ag peak for the lillianite homologue in (c) and the absence of such a peak in (d). The high Cu peak is due to interference from the Cu grid.
Minerals 06 00112 g014

