1. Introduction
The Caribou deposit is a Zn-Pb-Cu-Ag-type volcanogenic massive sulphide (VMS) deposit located in the northwestern part of the Bathurst Mining Camp (BMC), 50 km west of Bathurst, New Brunswick [
1]. The Caribou deposit is second only in size to the Brunswick No. 12 deposit [
1,
2,
3], totaling 70 Mt and grading 4.3% Zn, 1.6% Pb, 0.5% Cu, 51.3 g/t Ag and 1.7 g/t Au [
4]. Since its discovery in 1954, the deposit has been explored, developed and mined intermittently by several owners. Historically, complications with extraction associated with the fine-grained nature of the sulphide ore and low metal prices have caused several closures.
The mine was acquired by Trevali Mining Corporation in 2012 [
5], which resumed mining and processing in 2015. In 2013, a National Instrument 43-101 compliant technical report showed measured and indicated resource estimates of 7.23 million tonnes grading 6.99% Zn, 2.93% Pb, 0.43% Cu, 84.43 g/t Ag and 0.89 g/t Au [
5].
Although Zn, Pb and Cu are the primary resources, Au and Ag are important by-products that could help offset costs and decrease financial risk associated with periods of low base metal prices. Silver is primarily hosted in tetrahedrite and galena, with Ag concentrations generally significantly higher in tetrahedrite than galena [
6]. Silver grades and distribution are heterogeneous at the deposit scale. The highest Ag grades occur in the vent distal parts of the deposit, i.e., the East Sulphide Body (Lens 4) with an estimated 76% of the Ag in tetrahedrite and 21% in galena. In more vent-proximal parts of the deposit, i.e., the South Sulphide Body (Lens 3), an estimated 75% of the Ag occurs in galena with 19% in tetrahedrite [
6]. Notably, Ag concentrations are highest in sphalerite, galena and pyrite in the vent complex than in the bedded sulphides [
7].
Gold values were originally attributed to the presence of electrum [
6]; however, a more recent study has shown that Au in the BMC is hosted primarily in arsenian pyrite and to a lesser degree in arsenopyrite [
8]. For example, at the Brunswick No. 12 deposit, the distribution of Au is controlled by differences in transport and deposition between high-temperature (vent-proximal) versus low temperature (vent-distal) conditions [
3]. Despite numerous studies, Au and Ag distribution estimates are semi-quantitative and generally do not address Au and Ag values contained within and among specific sulphide phases.
This study used mineral liberation analysis (MLA) supported further by in situ laser ablation inductively coupled plasma-mass spectrometry (LA-ICP-MS) methods to document variations in Ag and Au intra- and inter-distributions of pyrite, sphalerite, galena, chalcopyrite, tetrahedrite-tennantite and arsenopyrite to evaluate their effect on Au and Ag recoveries during exploitation of the Caribou deposit.
2. Background
2.1. Regional Geology
The BMC is located in the Miramichi Highlands of northern New Brunswick and covers an area of about 3850 km
2 (
Figure 1). The BMC hosts 46 volcanogenic massive sulphide deposits with a combined pre-mining historical massive sulphide resource of approximately 500 Mt. Mining or advanced development has occurred at 10 deposits, namely: Brunswick No. 6 and No. 12, Caribou, Heath Steele, Half Mile Lake, Murray Brook, Restigouche, Stratmat, Key Anacon and Wedge [
2].
The deposits are hosted within a middle Ordovician bimodal volcanic and sedimentary succession referred to as the Bathurst Supergroup. The Bathurst Supergroup is emplaced in a back arc setting on the Gondwana margin and is divided into four groups. The first three are more or less coeval groups (California Lake, Sheephouse Brook and Tetagouche groups) and are dominated by felsic volcanic rocks at the base, which give way up section to mafic volcanic rocks [
7,
9]. The fourth group (Fournier Group) is slightly younger, dominated by mafic volcanic rocks and formed during the widening stage of the back arc basin [
1]. The bulk of the VMS tonnage in the BMC is associated with the earliest erupted felsic volcanic rocks in the California Lake, Sheephouse Brook and Tetagouche groups.
The California Lake Group hosts the Caribou deposit and is comprised of four formations (in ascending order): Spruce Lake, Mount Brittain, Canoe Landing Lake and Boucher Brook [
9]. The Spruce Lake Formation contains felsic volcanic rocks and shale [
10]. The Mount Brittain Formation contains felsic volcaniclastic rocks, minor basalt and lithic tuff interlayered with black shales and siltstones [
11]. The Caribou deposit is hosted in the Spruce Lake Formation and is associated with the felsic volcanic rocks [
7]. The Canoe Landing Lake Formation consists of mainly pillow basalts [
12]. The Boucher Brook Formation contains a basalt and interbedded shale sequence and a maroon, green shale and chert sequence [
9]. The felsic rocks of the Spruce Lake and Mount Brittain formations were formed early during rifting from high-temperature partial melts of a crustal block [
13,
14,
15]. Extension of the back-arc basin resulted in a progression from enriched, fractionated continental tholeiites to alkali basalts, to more primitive, mantle-derived mid-ocean ridge, tholeiitic pillow basalts that formed the volcanic rocks of the Canoe Landing Lake and Boucher Brook formations [
13].
Closure of the Tetagouche-Exploits basin by northwest-directed subduction from the Late Ordovician (Caradocian) to Late Silurian (Ludlovian) [
16,
17] was accompanied by poly-phase folding, thrusting and imbrication that imparted intense penetrative fabrics in host rocks and massive sulphides alike [
16,
17] associated with lower- to upper-greenschist and locally blueschist grade metamorphism [
18] and resulted in para-autochthonous and allochthonous sequences and stacked tectonic slices (nappes) [
9,
19].
2.2. General Characteristics of the Massive Sulphide Deposits in BMC
There are many similarities between the deposits in the BMC. Stringer or feeder zones underlie most deposits and have been described in detail for the Brunswick No. 12 [
20,
21,
22], Halfmile Lake [
23] and Caribou deposits [
7]. Stockwork mineralization is present in the footwall of these deposits along with large alteration-induced halos formed from the circulation of hydrothermal fluids [
21,
22,
24]. Massive sulphide bodies in the BMC are generally hosted above stockwork mineralization and vent zones and are composed of fine-grained pyrite, sphalerite, galena, chalcopyrite and pyrrhotite with minor arsenopyrite, marcasite and tetrahedrite [
8]. At the base of these lenses, also referred to as the basal sulphide facies, mineralization has generally been metasomatically altered by high temperature hydrothermal fluids resulting in an assemblage of pyrite, pyrrhotite and chalcopyrite [
8]. Above the basal sulphide facies are Pb- and Zn-rich lenses that exhibit sulphide layering [
25,
26]. Commonly in the BMC, the layering within bedded sulphides facies formed during syn-metamorphic deformation due to the composition and grain size variations in the sulphide minerals [
8], although at Caribou deposit, the layering has been interpreted to have formed by later tectonism, with ductile minerals (sphalerite and galena) taking up most of the strain [
7].
The BMC deposits were subjected to ductile deformation during closure of the Tetagouche-Exploits arc basin [
19]. The grade of metamorphism varies regionally from lower- to upper-greenschist from northeast to southwest [
27,
28,
29,
30]. Peak metamorphism conditions ranged from 325–425 °C and from 4–6 kbar [
31,
32,
33]. During these conditions, recrystallization increased the grain size of some sulphide grains, including porphyroblasts of pyrite, marcasite and arsenopyrite [
8]. However, the very fine-grained nature of most of the sulphides persisted through greenschist metamorphism [
8]. Deformation also induced linear (foliation) textures within sphalerite, galena and chalcopyrite and a durchbewegung texture in pyrrhotite-rich ores [
34,
35], which are locally present in ores of the BMC, but less so at the Caribou deposit.
2.3. Deposit Geology
The Caribou deposit is a proximal-autochthonous volcanic massive sulphide (VMS) deposit [
36]. The massive sulphides are hosted by the Spruce Lake Formation and are immediately underlain by a sequence of interbedded carbonaceous shale, pale gray phyllite, greywacke and thin intervals of chlorite-altered volcanic rocks [
7]. The deposit is overlain by felsic volcanic and related minor sedimentary rocks. Stringer sulphides cross cut hydrothermally altered sedimentary and felsic volcanic rocks in the footwall [
7]. The massive sulphides above the stringer zone consist of a vent complex and bedded sulphides [
7]. The massive sulphides and chloritic schists are present at the contact between massive sulphides and the overlying felsic volcanic rocks [
7]. Above the felsic volcanic rocks is a sequence of interbedded sedimentary and felsic volcanic rocks [
7].
Six en échelon lenses that from northwest to east are labelled Lenses 1–6, extend 1.5 km around the Caribou Synform that plunges 80°–85° of the north [
4,
37] (
Figure 2 and
Figure 3). Each lens is zoned with Cu-rich vent complexes near the bottom and western part of each lens (best developed in Lenses 1 and 2) and Pb-Zn-rich bedded sulphides that overlie the sulphide feeder zones (best developed in Lenses 4–6) and form a sharp contact with the hanging wall [
7]. Mineralization consists primarily of pyrite, sphalerite, galena and chalcopyrite with minor tetrahedrite, marcasite, arsenopyrite, electrum and bournonite [
38]. Photomicrographs of ore from Lens 4 are shown in
Figure 4,
Figure 5,
Figure 6,
Figure 7,
Figure 8 and
Figure 9. Quartz, siderite, magnetite, chlorite, muscovite and stilpnomelane are the most common non-sulphide accessory phases [
25,
26,
38].
The Caribou deposit has been intensely deformed with associated greenschist metamorphism during multiple collisional events related to the closure of the Tetagouche-Exploits back-arc basin and incorporation of the Bathurst Supergroup into an internally imbricated accretionary complex [
39]. Isoclinal folds and a strong penetrative axial planar schistosity were formed early during the first two deformation events (D1 and D2) [
39]. Kink folds postdate the schistosity and were formed before and during the formation of the Caribou Synform [
39]. A large dextral kink on the northwest limb of the Tetagouche Antiform produced the Caribou Synform (F4) [
6,
39].
2.4. Mineral Sources of Au and Ag
Sulphide minerals are important sources of Au and Ag. Gold and Ag values can be hosted in solid solution [
40,
41] or as submicroscopic inclusions within sulphide minerals [
42]. Trace and minor element concentrations are a function of the abundance of the elements in the system, the abundance of various host minerals and the fractionation (element distribution) patterns between them [
43]. Post-depositional processes, such as weathering [
44], high-temperature alteration and metamorphism, can redistribute Au and Ag concentrations within sulphides by remobilization [
8,
45].
2.4.1. Tetrahedrite-Tennantite-Freibergite
The distribution of tetrahedrite-group minerals at Caribou is highly variable among the six sulphide lenses with sparse occurrences near the footwall and hanging wall contacts of Lenses 1 and 2, extremely low occurrences in Lens 3 and widespread abundance in Lens 4 [
6]. Tetrahedrite-group minerals primarily occur as disseminated anhedral grains and rarely as veinlets that cross-cut sulphide layers [
6]. Tetrahedrite at the Caribou deposit is typically associated with galena, sphalerite and chalcopyrite; however, various tetrahedrite textures (disseminated and veinlet) and mineral associations do not correlate with specific tetrahedrite compositions [
6].
Tetrahedrite and tennantite compositions are highly variable, even in the same layer, with few analyses that correspond to the ideal end-member formulas of Cu
12Sb
4S
13 and Cu
12As
4S
13 [
6]. These minerals form a Sb-As solid-solution series with several elements that substitute for Cu [
6]. Natural tetrahedrite-tennantite typically conforms to the formula (Cu, Ag)
10(Fe, Zn, Hg, Cu*)
2(Sb, As)
4S
13 [
46], where Cu* is less than 0.2 atoms per unit formula [
47]. Tetrahedrite-tennantite contains monovalent (Cu
+) and divalent Cu (Cu
2+) [
48], with Cu
+ trihedrally and Cu
2+ tetrahedrally coordinated to sulphur [
49]. Silver preferentially substitutes for Cu
+ in freibergite rather than Cu
2+ atoms, which would require a coupled substitution to maintain charge balance [
50] and mercury substitutes for Cu
2+ tetrahedrally coordinated with sulphur [
51]. Additionally, Bi and Te can substitute for As and Sb, respectively [
49].
Silver-rich tetrahedrite is referred to as argentian tetrahedrite; when Ag concentrations exceed 20 wt %, the mineral undergoes a structural change and is called freibergite [
49]. The Ag-rich end-member has an ideal formula of Ag
12Sb
4S
13, with an estimated maximum Ag concentration of 51 wt % [
49]. Microprobe analyses indicate that tennantite and freibergite are rare relative to tetrahedrite [
6]. Silver concentrations are highest in Sb-rich tetrahedrite-group minerals; however, high Sb concentrations do not imply high Ag concentrations [
6]. Mercurian-tetrahedrite and freibergite occur mainly near the hanging wall side of the massive sulphide lenses, and tetrahedrite is estimated to account for 76% and 21% of the Ag in Lenses 4 and 3, respectively. Tetrahedrite-tennantite-freibergite is not known to host significant concentrations of Au.
2.4.2. Galena
Galena is one of the primary hosts of Ag at the Caribou deposit [
6]. With the exception of high-grade Pb-Zn zones along the hanging wall side of Lenses 1, 2 and 3, galena abundance is relatively low in these lenses, whereas it is widespread in Lens 4 [
38]. Galena grains are finer grained than pyrite and sphalerite and occur mainly as patchy replacements with sphalerite, and as patches, blebs and veinlets within pyrite [
38]. Galena also occurs as relict replacement textures in pyrite-forming complex fine-grained inclusions [
52].
Silver concentrations in galena typically correlate positively with Bi or Sb [
53] and are a result of Ag-Bi (+Pb) and Ag-Sb inclusions and solid solution [
54]. Ag-Sb and Ag-Bi (+Pb) inclusions in galena were inferred [
55] and were confirmed when submicroscopic inclusions of diaphorite (Pb
2Ag
3Sb
3S
8) were identified in galena using transmission electron microscopy (TEM) [
56].
Simple substitution of Ag
+ for Pb
2+ is not significant at temperatures lower than 450 °C [
53]. Higher Ag concentrations are achieved through coupled substitution of Ag
+ with Bi
3+ or Sb
3+ for 2Pb
2+ [
56,
57]. Solubility experiments have shown that AgSbS
2 forms a complete solid solution with galena at temperatures above 350 °C [
57] and that AgBiS
2 (matildite) forms a solid solution with galena at temperatures above 175 °C [
53,
58]. However, coupled substitution of Ag and Sb is less stable than coupled substitution of Ag and Bi [
57].
Microprobe results showed that Sb concentrations in galena from Lenses 3 and 4 are low (<0.11 wt % Sb) and erratic with respect to Ag [
6]. Bismuth concentrations are much higher (up to 1.58 wt %) and strongly correlated with Ag [
6]. These results suggest that Ag is hosted in solid solution via coupled substitution with Bi and minor Sb. Reported average galena Ag concentrations are highly variable: 1020 ppm Ag [
3] and 400 ppm Ag [
52]. Galena is not known to host significant concentrations of Au.
2.4.3. Chalcopyrite
Overall, chalcopyrite abundance at Caribou is low, with the highest abundance located in Lens 2 [
38]. Chalcopyrite mainly occurs as veins along pyrite grain boundaries with patches and minute blebs in pyrite and in interstices between grains [
38]. In chalcopyrite-rich zones, chalcopyrite has almost completely replaced pyrite with only small inclusions of pyrite that remain [
38]. Chalcopyrite rarely occurs as “chalcopyrite disease” [
38], which is the presence of minute and locally abundant inclusions of chalcopyrite distributed fairly evenly within sphalerite grains [
59,
60]. “Chalcopyrite disease” occurrence is higher in Lens 4 than Lens 3 [
38].
Chalcopyrite compositions were not reported in previous studies; however, chalcopyrite can contain significant concentrations of Ag. Experiments have shown that chalcopyrite can host significant concentrations of Ag (5–8 wt % Ag) in solid solution [
61]. Silver can also occur as a submicroscopic film on the surface of chalcopyrite [
62]. A more recent study reported that 6.3% of the total Ag budget at the Hacket River Main Zone occurs in solid solution with chalcopyrite, along with the minor submicroscopic inclusions of native Ag and Ag-bearing minerals [
54]. Chalcopyrite Ag contributions to the Ag budget of a deposit can be much higher; for example, chalcopyrite in the “A” stringer zone of the Kidd Creek Mine contains 60% of that zones Ag [
63]. Likewise, solid solution Ag in chalcopyrite accounted for 76% of the Ag budget for the Izok Lake deposit [
64]. Chalcopyrite is a poor host for Au [
40], but has been shown to host Au as submicroscopic inclusions at the Broken Spur vent field [
65].
2.4.4. Sphalerite
Sphalerite abundance varies by lens with low abundances in Lenses 1, 2 and 3, except in high-grade Pb-Zn zones near the hanging wall of these lenses. Sphalerite abundances are higher throughout Lens 4 [
38]. Sphalerite grains in high-grade Pb-Zn zones occur in laminar masses, whereas in low-grade Zn zones, it mainly occurs in pyrite interstices and less commonly along pyrite grain boundaries [
38]. Etched sphalerite grains showed that optically homogenous sphalerite consisted of anhedral grains that exhibit lamellar twinning and are slightly coarser than associated pyrite [
38].
Average sphalerite iron contents reported by two studies (<6.0 wt % and 4.9 wt %) agree fairly well [
38,
52]. Sphalerite at the Caribou deposit has a bimodal distribution for both Zn and Fe [
52]. Sphalerite can also contain minor concentrations of silver [
66,
67], which can occur within sphalerite as inclusions of galena, tetrahedrite-tennantite or other sulfosalts or in solid solution [
67]. Silver in solid solution may result from coupled substitution between Ag and Sn with 2Ag
+ and Sn
4+ substituting for 3Zn
2+, especially in Sn- and In-rich sphalerite [
67]. Sphalerite is not known to host significant concentrations of Au, but may contain inclusions of electrum introduced during syn-metamorphic remobilization [
68].
2.4.5. Arsenopyrite
Arsenopyrite is widespread at Caribou [
38]. Arsenopyrite occurs primarily as disseminated euhedral to subhedral grains, sometimes clustered and similar in size with associated pyrite. Less commonly, arsenopyrite occurs as tiny (0.5-µm diameter) anhedral grains and as pyrite overgrowths [
38]. Acid etching has shown that arsenopyrite commonly shows evidence of growth zoning [
38].
Arsenopyrite can host significant concentrations of Au in addition to other trace elements, such as Co, Cr, Cu, Ni, Mn, Pb, Sb and V [
69]. Arsenopyrite from the Caribou deposit contains variable concentrations of As, Sb and Co, with As concentrations ranging from 29.3–33.0 atomic % As, Sb concentrations ranging from 0.5–1.3 wt % and Co concentrations up to 3.2 wt % [
38]. Iron and sulphur contents in arsenopyrite were variable, but were not reported [
38]. High resolution TEM conducted on arsenopyrite grains from the Yangshan ore field containing up to 1 wt % Au did not contain inclusions or lattice dislocations on a scale of 5 nm, indicating that significant concentrations of Au can be hosted as a solid solution within arsenopyrite [
69]. Arsenopyrite grains from the Yangshan ore field were zoned with high concentrations of Au in As-rich core mantling intermediate zones and lower concentrations of Au in As-poor cores and rims [
69]. Au concentrations tend to decrease in arsenopyrite with increasing metamorphic recrystallization [
70] and to preferentially partition in arsenopyrite in comparison to coexisting pyrite or arsenian pyrite [
69].
2.4.6. Pyrite
Pyrite is the most abundant sulphide mineral in the BMC and is commonly arsenian [
71]. Pyrite grain sizes at Caribou do not vary significantly by lens and average 17 µm in diameter. Pyrite abundance generally increases from footwall to hanging wall [
38]. Pyrite is most commonly present as euhedral to anhedral grain and massive textures, but rarely occurs as framboidal and colloform textures [
38]. Framboidal and colloform textures have been interpreted to represent primary depositional textures [
72]; however, some of the framboidal textures may have formed during deformation and diagenesis [
73].
Arsenian pyrite is the primary host of Au in the BMC followed by arsenopyrite [
8]. Previous studies have shown that Au can reside in pyrite as a solid solution or as inclusions and that Au is associated with As [
40,
45,
69,
74,
75,
76,
77,
78]. The solubility of Au in arsenian pyrite, as determined from secondary ion mass spectrometry and electron microprobe analyses of Carlin-type and epithermal Au deposits, is a function of As and is roughly equivalent to an Au and As ratio of 1:200. Above this ratio, Au is usually present as native metal (Au
0) nanoparticles, whereas below this ratio, Au resides in solid solution [
45]. The dominant form of Au in arsenian pyrite is Au
1+, which likely formed from Au undersaturated hydrothermal fluids [
45]. The most commonly accepted mechanism of substitution is isovalent substitution of Au for Fe in distorted octahedral sites and isovalent substitution of As for S in structural tetrahedral sites [
78]. Gold and As substitution also may occur coupled with an As
2+ or As
3+ ion and a Au
+ ion for 2Fe
2+ ions, in high-sulfidation environments due to elevated ƒO
2 [
78]. Silver solubility in pyrite has not been addressed by many studies; however, one study suggests that Ag
+ and As
3+ could co-substitute for 2Fe
2+ [
79].
2.5. Gold in the Bathurst Mining Camp
Massive sulphide Au concentrations within the BMC vary by deposit and range from 0.002–6.86 g/t Au with an average of 0.85 g/t Au [
80]. Although Au is typically a by-product recovered during smelting, Au has been recovered directly from gossan-supergene zones at Caribou [
4], Heath Steele deposits [
81] and Murray Brook [
82]. Gossan deposits represent a small portion of the Au contained in the BMC, and the bulk of the remaining Au and Ag occurs in the massive sulphide bodies [
81]. Gold distributions vary systematically among the feeder zone, basal sulphide and Pb-Zn lenses of the massive sulphide deposits, based on distinct geochemical associations [
80]. Zones with an Au + Bi + Co ± Cu association display Au concentrations that increase with proximity towards the underlying feeder zones, whereas zones with an Au + Sb + As ± Ag association display Au concentrations that increase towards the hanging wall [
80]. The Au + Bi + Co ± Cu association is typically observed in the feeder and basal sulphide zones, but rarely in the Pb- and Zn-lenses, which usually has an Au + Sb + As ± Ag association [
8]. The highest Au concentrations are documented in the basal sulphide facies, but Pb and Zn lenses contain the largest reservoir of Au due to their much greater volume in the BMC [
80].
Pyrite and arsenopyrite contain most of the Au in the BMC within solid solution or as Au-rich inclusions, and that arsenopyrite contributes less to the overall Au distribution budget, due to low Au concentrations and its limited presence [
3]. In comparison, pyrite is pervasive and tends to have higher concentrations of Au than arsenopyrite, making it the primary host of Au in the BMC [
8]. Electrum and native Au have been noted, but do not contribute significantly to the Au distribution budget due to their rare occurrence [
83,
84]. Fine-grained electrum (0.1–1.5 µm in diameter) has been observed at the Caribou deposit [
38,
52]. Other sulphide minerals may host Au, including chalcopyrite, pyrrhotite, sphalerite and tetrahedrite-tennantite-freibergite; however, Au concentrations in these minerals are likely very low and will contribute little to the Au budget of the BMC [
8].
3. Experimental Design
3.1. Sample Selection
A total of 151 polished thin sections from the Caribou deposit were obtained from an earlier mineral testing program conducted at Lakefield Research. Historical Cu, Zn, Pb, Ag and Au drill core assays from those sampled intervals were provided by Trevali Mining Corporation and used to select samples from Lenses 3 and 4 (
Table 1 and
Table 2). All bulk rock (split core) assays are on 30 g pulps and analysed by atomic absorption spectrometry (AAS) and graphite furnace AAS.
Lens 3 Ag assay results (
n = 23) ranged from 62.0–202.0 g/t Ag. The critical Spearman’s rank value for 23 samples at 95% confidence is 0.42. Silver displays a positive Spearman’s rank correlation coefficient with Pb (
rs = 0.59) and Zn (
rs = 0.67) grades (
Figure 10). Silver displays a negative Spearman’s rank correlation coefficient with Cu (
rs = −0.42). Gold head assay results showed that these samples contained less than 1 g/t Au. Copper, Zn and Pb grades for these samples ranged from 0.22–0.82 wt %, 1.00–8.20 wt % and 2.94–21.61 wt %, respectively.
Lens 4 Ag assay results (n = 33) ranged from 41.9–188.5 g/t Ag. The critical Spearman’s rank value for 33 samples at 95% confidence is 0.35. Silver displays a moderate positive Spearman’s rank correlation coefficient with Pb grades (rs = 0.41). Gold grades were less than 1 g/t Au for all samples, except DDH055-76 m, DDH055-77.5 m and DDH055-80.0 m (1.37 g/t Au). Copper, Zn and Pb grades for the Lens 4 samples ranged from <0.01–0.47 wt %, 4.0–10.8 wt % and 1.8–8.7 wt %, respectively.
Comparing the drill core assays by lens shows that Lens 3 has higher average Ag, Cu and Pb contents, whereas Lens 4 has a higher average Zn content. Samples were selected for testing on the basis of Ag assay results, as most Au assay results were below the detection limits. Anderson–Darling, Ryan–Joiner and Kolmogorov–Smirnov normality tests conducted separately on the Lens 3 and Lens 4 Ag assays resulted in p-values of 0.264 and 0.585, >0.100 and >0.150, >0.150 and >0.150, respectively, indicating that the distributions are normal within 95% confidence. Ninety five percent confidence intervals for the Lens 3 and 4 Ag assays ranged from 106.4–136.1 g/t Ag and 108.4–124.0 g/t Ag, respectively. Six polished thin sections were selected from the drill core intervals: one sample below, one between and one above the confidence intervals for each lens. Polished thin sections selected from Lens 3 were 62-119-47.7, L2-16-67.4 and L2-16-70 with corresponding Ag drill core assays of 62.0, 111.0 and 164.0 g/t Ag, respectively. Polished thin sections selected from Lens 4 were L4-14-132, L4-14-134.5 and L4-15-100.1 with corresponding Ag assays of 99.2, 60.6 and 173.0 g/t Ag, respectively. It should be noted that all of the polished thin section selected for this study belong to the Pb-Zn lens of the deposit.
3.2. MLA Conditions
Mineral liberation analysis (MLA) was conducted on each polished thin section at Memorial University of Newfoundland’s Micro Analysis Facility (MAF-Inco Innovation Centre), to determine modal mineralogy and mineral grain size distributions. An FEI 650FEG MLA equipped with 2 Bruker XFLASH SDD X-ray detectors (Field and Electron and Ion Co., Brno, Czech Republic) was used to conduct the analyses using the following equipment parameters: high voltage of 25 kV, beam current of 10 nA and a horizontal frame width (HFW) of 1.5 mm. The MLA data were used to calculate modal mineralogy and to determine mineral grain size distributions, which were then used to select a wide variety of mineral grain sizes for LA-ICP-MS, to evaluate grain size sensitivity with respect to the Au and Ag concentrations.
3.3. LA-ICP-MS Conditions
In situ LA-ICP-MS was conducted on each polished thin section to determine the variation in Au and Ag concentrations within specific grains and among the various sulphide minerals. The LA-ICP-MS system (Coherent, Santa Clara, CA, USA) used a COMPexPro 102 F 193-nm Excimer laser connected to an Agilent 7700 quadrupole ICP-MS. The ICP-MS was operated at 1500 W and a torch depth that ranged from 5.0–5.5 mm. The system was tuned by rastering across NIST610 glass to achieve ThO+/Th+ < 0.2% (monitor of oxide production), 238U+/232Th+ ~ 1.0 (monitor of effective plasma temperature) and 22M+/44Ca++ < 0.35% (monitor of double-charged production).
Each polished thin section was loaded into a Laurin Technic sample cell that was evacuated and backfilled with He to remove traces of air from the cell. Sulphide samples were ablated in spot mode using 17-µm craters, a 3.5–4-Hz repetition rate and a laser energy (fluency) regulated at ~0.8 J/cm2. When the sulphide grains were large enough, laser spots were positioned as a line of points across each grain to evaluate elemental zoning. Each point was ablated for 30 s following 40 s (60 s for arsenopyrite) of gas background collection. Ablated material was transported out of the cell using 0.3 L/min He as a carrier gas. This was mixed downstream of the cells with 2.5 mL/min N2 (to enhance sensitivity) prior to reaching the ICP-MS torch.
The following isotopes were analyzed for all of the sulphide minerals except galena:
33S,
34S,
55Mn,
56Fe,
57Fe,
59Co,
63Cu,
66Zn,
69Ga,
72Ge,
75As,
107Ag,
111Cd,
115In,
121Sb,
197Au,
205Tl,
207Pb,
208Pb and
209Bi. Galena was analyzed for fewer isotopes (
32S,
33S,
34S,
56Fe,
75As,
121Sb,
197Au,
207Pb and
208Pb) to maximize count times for Au and Ag. Analyte dwell times were set individually, with the longest dwell times for Ag and Au. Total quadrupole sweep time was kept at <0.52 s. After ablation, the laser log file and ICP-MS intensity data file were synchronized using Iolite [
85] running as a plug-in for Wave metrics Igor Pro. Each dataset was processed using the Iolite internally standardized trace-element data reduction scheme, which filtered out concentrations greater than two standard deviations of the mean. Concentrations in unknowns were calibrated against sulphide reference material MASS-1 (purchased from USGS) and stoichiometric concentrations of a single element for each mineral: Zn for sphalerite (67.09%), Pb for galena (86.6%), Fe for chalcopyrite (30.43%), Sb for tetrahedrite-tennantite (27.33%), Fe for arsenopyrite (34.3%) and Fe for pyrite (46.54%). Since tetrahedrite-tennantite is a solid solution, it can show a significant range in composition and does not necessarily contain 27.33% Sb; trace element results are considered semi-quantitative. Each ablation time series was adjusted when necessary to avoid artifacts related to ablating through thin grains, large inclusions or on grain boundaries. Detection limits for Ag, Au, Fe, Cu and Pb varied. Limits of detection (LOD) were used in place of concentrations that were reported below LODs. Analyses with major element concentrations that deviated 10% from the stoichiometric concentration of that mineral were not used. Gold and Ag concentrations reported in the mass balance are a grain-based average, where the intra-grain average of each grain was averaged to determine the overall mineral average content for each polished thin section. Hereafter, we refer to this mean as the grain-based average. Average Au and Ag concentrations calculated for mass balance mineral averages that contained LOD are denoted by a less than sign (<) and, therefore, represent an overestimated concentration for that particular element. The Au distribution in the standard MASS-1 is somewhat inhomogeneous at the micron scale; therefore, Au concentrations reported in this work should be viewed with some caution.
4. Results
Overall MLA results (
Table 3) showed that modal mineralogy (converted to wt %) varied significantly among polished thin sections, although pyrite concentrations were highest (64.62–90.94 wt %), and tetrahedrite-tennantite concentrations were generally lowest (<0.01–0.07 wt %). Arsenopyrite concentrations were highest in the Lens 4 polished thin sections (0.92–5.28 wt %) and significantly lower in the Lens 3 polished thin sections (0.23–0.55 wt %). Chalcopyrite concentrations were highest in the Lens 3 polished thin sections (0.81–1.16 wt %) and lower in the Lens 4 polished thin sections (0.02–0.66 wt %). Galena concentration was highest for the L4-15-100.1 (Lens 4) polished thin section (17.79 wt %) and lowest for the 62-119-47.7 (Lens 3) polished thin section (0.66 wt %). Non-sulphide gangue (NSG) concentrations ranged from 1.80–9.20 wt % and consisted of mainly quartz and various carbonates.
LA-ICP-MS grain average results (
Table 4 and
Table 5) show that the primary host of Ag in the samples from Lenses 3 and 4 is galena (51.1%–88.0% of total Ag). Tetrahedrite-tennantite when present in higher concentrations (>0.04%) also contains high proportions of Ag (18.0%–38.1% of total Ag). The total Ag host order for the remaining minerals from most- to least-significant is pyrite, sphalerite, arsenopyrite and chalcopyrite. Pyrite from two of the polished thin sections (62-119-47.7 and L4-14-134.5) contains almost 25% of the total Ag, indicating that a significant portion of the Ag can be locked within pyrite.
Silver distribution results for the Lens 4 polished thin sections did not agree with the Ag distribution estimates (76% in tetrahedrite and 21% in galena) proposed by a previous study [
6]. In this study tetrahedrite was not the primary source of Ag in the polished thin sections examined. In fact, only one of the Lens 4 polished thin sections (L4-15-100.1) contained significant amounts of tetrahedrite, which only contained 38.1% of the total Ag. Differences in Ag distribution are most likely due to the erratic nature of tetrahedrite with respect to the abundance at the microscale and the limited number of polished thin sections analyzed. Silver distribution results for Lens 3 samples were in line with the Ag distribution estimates presented in a previous study [
6], i.e., 75% in galena and 19% in tetrahedrite.
Gold concentrations and distributions should be interpreted with caution as many of the grains analyzed were below the detection limits; consequently, Au concentrations and distributions are only semi-quantitative. The primary host of Au varied between arsenopyrite and pyrite in the polished thin sections (
Table 6 and
Table 7). The remaining minerals examined did not host a significant proportion of the total Au. Most of the grains analyzed in the L4-14-134.5 polished thin section were below the detection limits; consequently, the gold distribution was not calculated for this sample.
Average galena Ag concentrations were higher in the Lens 3 polished thin sections (2277.2 g/t Ag) than the Lens 4 polished thin sections (690.6 g/t Ag). In contrast, average Ag contents of tetrahedrite-tennantite were higher in the Lens 4 polished thin sections (138,550 g/t Ag) than in the Lens 3 polished thin sections (59,878.1 g/t Ag, respectively).
Inter-grain Au and Ag concentrations by mineral rarely showed significant differences. Those samples with significant differences between grains should be interpreted with caution due to the low sample size. Intra-grain Au and Ag concentrations varied randomly, but not systematically from the grain averages, which will likely affect metallurgical recoveries in a complex, but not in a significant manner.
5. Discussion
5.1. Distribution of Ag and Au
Gold concentrations are highest in the basal sulphide facies of the BMC with Au concentrations that increase towards the underlying feeder zones and are lowest in the bedded sulphides facies with Au concentrations that increase toward the hanging wall [
80]. At the Caribou deposit, Ag concentrations in galena, sphalerite and pyrite are highest in the basal sulphide facies and are lowest in the bedded sulphide facies [
7]. A previous study conducted on the Caribou deposit reported chalcopyrite Ag concentrations (
n = 18) up to 360 ppm with an average of 150 ppm Ag; however, the location of these grains with respect to facies was not reported [
7]. Comparatively, chalcopyrite grains analyzed in this study are from the bedded sulphides and had Ag concentrations that were much lower (<55.1 ppm Ag), possibly indicating that the samples analyzed in the previous study were located closer to or within the vent complex. If this is the case, chalcopyrite Ag concentrations will show a similar trend to pyrite, sphalerite and galena with higher Ag concentrations in the vent complex than the bedded sulphides. A similar trend with respect to chalcopyrite Ag concentrations is present at the Hackett River Main Zone deposit in Nunavut, Canada [
54]. Tetrahedrite-tennantite-freibergite Ag concentrations are lowest in the footwall and highest in the hanging wall [
6]. The distribution of Ag and Au is likely the result of “zone refining”, the dissolution and replacement of low-temperature assemblages with high-temperature assemblages by hot hydrothermal fluids in the vent complex [
86].
The distributions of Au and Ag are a function of metal complex stability, redox conditions, temperature and the abundance of co-substituting elements. Sulfur activity and redox state directly affect the carrying capacity of hydrothermal fluids [
87], suggesting that sulphur activity and redox state are the primary controls for mineral composition within VMS deposits [
54]. Fe-bearing oxide and sulphide mineral abundances and their ratios relative to each other can be used to partially constrain the redox conditions present during mineralization [
88,
89]. Pyrrhotite (Fe
1−xS) forms in environments with lower sulfur activities (
aS
2) and lower oxygen fugacities (
fO
2), whereas magnetite (Fe
3O
4) and pyrrhotite (Fe
1−xS) are stable at higher
fO
2 [
90]. Sphalerite iron concentrations can be compared locally to indicate differences in sulfur activity, with sphalerite iron concentrations decreasing with increasing sulfur activity [
90,
91].
Pyrite is the most abundant Fe-bearing mineral in the vent complex followed by chalcopyrite, magnetite, Fe-rich sphalerite and pyrrhotite [
7]. The lack of pyrrhotite and lower sphalerite iron concentrations in the bedded sulphide facies in comparison to the basal sulphide facies [
7] suggest higher
fO
2 conditions and higher
aS
2 in the bedded sulphide facies and lower
fO
2 conditions and lower
aS
2 in basal sulphide facies.
5.1.1. Galena and Tetrahedrite
Galena and tetrahedrite are the most important hosts of Ag at the Caribou deposit. The relative abundance of Ag in these minerals is largely controlled by redox conditions and the Bi to Sb ratio of the mineralizing fluid [
92]. Silver partitions into galena through coupled substitution of Sb under oxidized conditions or through coupled substitution of Bi under more reduced conditions [
54]. Limited data are available for galena located in the vent complex. Microprobe analyses conducted by a previous study on seven grains of galena from the vent complex showed an average Ag concentration of (1140 ppm Ag) [
7]. However, bismuth and antimony concentrations were below the detection limits. Considering the vent complex association of Au + Bi + Co ± Cu, the more reduced conditions in the basal sulphide facies and that Sb and Ag substitution is less effective with galena, the high abundance of Ag in galena within the vent complex is likely a result of coupled substitution between Bi and Ag. Galena in more reduced, high temperature vent-proximal environments contains more Bi and less Sb than galena in more oxidized and lower temperature vent-distal environments [
54]. This trend is also present at Caribou, as has been documented in a previous study, where galena in Lens 3, which is closer to the vent complex than Lens 4, contains more Bi and Ag and less Sb than galena in Lens 4 [
6]. A similar trend was observed from the in situ LA-ICP-MS analyses conducted on galena, where galena Ag concentrations were generally higher in the Lens 3 polished thin sections than the Lens 4 polished thin sections.
Under more oxidized conditions and when the mineralizing fluid contains a higher concentration of Sb, Ag strongly partitions into tetrahedrite-group minerals [
92]. This trend is also present at Caribou as Ag concentrations in tetrahedrite tend to increase from footwall to hanging wall and from proximal to distal lenses [
6]. This trend was also observed from the in situ LA-ICP-MS analyses conducted on tetrahedrite-tennantite, where tetrahedrite-tennantite Ag concentrations were generally higher in the Lens 4 polished thin sections than the Lens 3 polished thin sections. The Ag to Cu ratio in the mineralizing fluid controls the composition of the tetrahedrite-group minerals, with Ag-poor tetrahedrite-group minerals crystallizing from Cu-rich fluids and Ag-rich tetrahedrite-group minerals crystallizing from Cu-poor fluids [
93]. Silver-rich tetrahedrite-group minerals at the Caribou deposit contain low concentrations of Cu, while Ag-poor tetrahedrite-group minerals contain high concentrations of Cu [
6]. Furthermore, Ag-poor tetrahedrite at Caribou is commonly located toward the footwall of the deposit where the hydrothermal fluids are higher temperature and Cu-rich relative to the same fluid nearer the hanging wall. Tennantite, the As-rich end member, forms under more reduced conditions, whereas tetrahedrite, the Sb-rich end member, forms under more oxidized conditions [
93]. The affinity of Ag with Sb-rich tetrahedrite group minerals has been documented by numerous authors [
6,
94,
95,
96,
97]. Arsenic concentrations in Ag-poor tetrahedrite-group minerals at Caribou are highest near the footwall [
6], suggesting that Ag preferentially partitions into tetrahedrite-group minerals under less reducing conditions. Tetrahedrite and galena are not known to host significant concentrations of Au, and therefore, Au distributions within galena and tetrahedrite are considered insignificant and will not be discussed.
5.1.2. Chalcopyrite and Sphalerite
Chalcopyrite and sphalerite generally do not contain significant concentrations of Ag; however, Ag does partition into chalcopyrite from Bi-poor solutions under more reduced conditions [
92]. Hydrothermal fluids in the vent complex at Caribou were likely Bi-rich resulting in Ag-rich galena and Ag-poor chalcopyrite. Chalcopyrite Ag concentrations should decrease laterally and upwards towards the hanging wall, under more oxidizing conditions. Sphalerite tends to host Ag as inclusions rather than solid solution, except in In- and Sn-rich sphalerite [
67]. Sphalerite Ag concentrations are highest in the vent complex and lowest in the bedded sulphides [
7]. Time-resolved depth profiles from in situ LA-ICP-MS analysis of sphalerite grains show irregular Pb signals that may indicate the presence of galena inclusions. Sphalerite and chalcopyrite do not host significant concentrations of Au, hence their distribution with respect to sphalerite and chalcopyrite, and they will not be discussed further. The higher Au concentrations indicated in chalcopyrite samples from the Lens 4 polished thin sections relative to the Lens 3 polished thin sections are a result of the higher limits of detection in the Lens 3 analyses.
5.1.3. Pyrite and Arsenopyrite
Pyrite and arsenopyrite are the primary hosts of Au at the Caribou deposit. The distribution of Au is mainly due to the difference in Au transport and deposition between high-temperature (vent-proximal) versus low temperature (vent-distal) conditions [
80].
Although Au and Ag could directly precipitate and form discrete grains of electrum, native Ag or native Au, the majority of the Au and Ag at Caribou is contained within sulphide minerals as a solid-solution or as micro- to nano-inclusions, indicating that another mechanism is responsible for the Au and Ag distribution. It has been suggested that heavy metal complexes are attracted to charged sulphide mineral surfaces and then are chemisorbed [
98]. A similar mechanism is likely responsible for the incorporation of Au and Ag.
Gold partitions preferentially into arsenic-rich pyrite due to coupled substitution between Au and As [
78]. Arsenic concentrations in VMS deposits increase towards the hanging wall and reach their highest levels in the bedded sulphides [
7,
8]. Consequently, pyrite Au concentrations in the bedded sulphides should increase toward the hanging wall. Arsenopyrite contains higher concentrations of As than arsenian pyrite, suggesting that arsenopyrite should carry more Au. This assertion was corroborated by in situ LA-ICP-MS analysis during this study and suggests that the distribution of gold at Caribou appears to differ from other deposits in the BMC.
In situ LA-ICP-MS results show that Ag preferentially partitions into arsenopyrite relative to pyrite. Silver may partition into pyrite through coupled substitution with As, whereby Ag
+ and As
3+ substitute for 2 Fe
2+ [
79]. If this is the case, a similar mechanism may be responsible for Ag substitution in arsenopyrite. Consequently, in the bedded sulphides, the Ag content in both pyrite and arsenopyrite should increase towards the hanging wall.
In the basal sulphide facies arsenic concentrations are lower, but Au and Ag concentrations within pyrite are higher. In the vent complex, the hottest hydrothermal fluids should contain the most Au; therefore, Au contents in pyrite will increase towards the stringer zone. No data were available for the Au and Ag concentrations of arsenopyrite from the vent complex. The high temperature fluids in the vent complex were likely saturated with Au resulting in higher concentrations of Au and Ag complexed as chloro-complexes resulting in more effective coupled substitution of Au and arsenic into pyrite and the incorporation of Au inclusions.
5.2. Metallurgical Implications
Grades and distributions of Ag in products from Brunswick Mining and Smelting showed that Ag hosted in galena was generally recovered in the Pb concentrate (20.7%) with minor galena Ag recoveries obtained in the Zn (3.3%), Cu (0.5%), bulk (1.5%) and secondary Zn concentrates (0.5%) [
99]. The remaining Ag contained in galena (8.3%) reported to the tailings [
99,
100]. Silver was hosted in tetrahedrite-freibergite, chalcopyrite, pyrargyrite, stephanite and pyrite reported mainly to the Pb and Zn concentrates (17.7% and 16.3%, respectively) with lesser recoveries in the Zn concentrate (8.1%) and minor recoveries in the bulk and secondary Zn concentrate (1.9% and 1.0%, respectively) [
99]. The remaining Ag contained in these minerals (20.2%) reported to the tailings [
99,
100]. Although the mill design is different at the Caribou deposit, these results can be used to roughly interpret Ag recovery behavior at Caribou with respect to Lenses 3 and 4.
Lens 3 Ag values are primarily hosted in galena and will mostly report to the Pb concentrate, whereas Ag values associated with tetrahedrite-tennantite will mostly report to the Cu concentrate. Lens 4 Ag values are likely primarily associated with tetrahedrite-tennantite and will mostly report to the Cu concentrate, whereas Ag associated with galena will mostly report to the Pb concentrate. Galena and tetrahedrite-tennantite not recovered during flotation will result in lower Ag recoveries.
Silver recoveries will also fluctuate based on the ore’s location within a lens. Ore processed from near the footwall will likely result in lower Ag grades and recoveries in the Pb and Cu concentrates, since tetrahedrite-tennantite Ag concentrations tend to increase from toward the hanging wall. Base metal ores are typically composited to maintain a specific base metal ratio, so that mills can operate at near steady state conditions. Consequently, the Ag recovery behavior in composited ore is more complex and reflects the combined nature of the individual composites with respect to origin.
Currently, pyrite and arsenopyrite predominantly report to the tailings. Selective flotation could be used to create a separate pyrite and arsenopyrite concentrate [
101]. Gold and Ag grades in arsenopyrite may be high enough to consider separate processing of arsenopyrite for Au and Ag recovery and warrants further investigation. Intra-grain Au and Ag concentrations varied randomly, but not systematically from the grain averages, which will likely affect metallurgical recoveries in a complex, but not in a significant manner.
6. Conclusions
Understanding how exhalative volcanic massive sulphide deposits are formed, the environment in which they were formed and how the metals are saturated during genesis are critical to exploration and exploitation of these resources. Zinc, Pb and Cu are the primary resources that will be extracted from this deposit; however, Au and Ag are important by-products that help offset costs. An understanding of the variations in Ag and Au distribution is critical to the optimization of mineral processing design.
Silver is hosted primarily by galena and tetrahedrite, with the highest galena Ag concentrations in Lens 3 and the highest tetrahedrite Ag concentrations in Lens 4. Overall, Au is primarily hosted in pyrite, because of its abundance relative to arsenopyrite; however, on a grain by grain basis, Au content of arsenopyrite is generally higher than that of pyrite. The greatest influence expected on Au recovery at Caribou is the proportion of Au hosted in arsenopyrite and pyrite. Currently, arsenopyrite and pyrite report to the mine tailings. However, results from this study indicate arsenopyrite enriched with Au and Ag, warranting a follow-up study to evaluate the cost and benefits associated with generating an arsenopyrite concentrate to improve Au recovery.
Acknowledgments
The authors thank Trevali Mining Inc., the Natural Sciences and Engineering Research Council of Canada (NSERC) and New Brunswick Innovation Foundation (NBIF) for supporting and funding the project. The authors are grateful to David Grant and Dylan Goudie for conducting the MLA work at Memorial University, Newfoundland, and to Giovanni Di Prisco for his feedback and his willingness to discuss his experience with the Caribou project. The authors are also thankful to Jim Walker for reviewing and providing critical feedback on an earlier version of this paper. We also thank the journal editors and reviewers for providing critical feedback.
Author Contributions
Joshua Wright designed and performed the experiments and handled the paper. Dave R. Lentz advised, raised funds, conceived of the project, helped design the experiments and reviewed the paper. Phil Garland advised and reviewed the design of the experiment and reviewed the paper. Steven Rossiter assisted with the experiment.
Conflicts of Interest
The authors declare no conflict of interest.
References
- McClenaghan, S.H.; Walker, J.A.; Lentz, D.R. Trace-Element Contents of Base Metal Concentrates From the Caribou Mine, Bathurst Mining Camp, New Brunswick: Implications for the Recovery of Indium from Mill Products; Minerals, Policy and Planning Division, Mineral Resource Report 2009-2; New Brunswick Department of Natural Resources: Fredericton, NB, Canada, 2009; pp. 1–27.
- Goodfellow, W.D.; McCutcheon, S.R. Geologic and genetic attributes of volcanic sediment-hosted massive sulfide deposits of the Bathurst Mining Camp, northern New Brunswick-a synthesis. In Massive Sulphide Deposits of the Bathurst Mining Camp, New Brunswick, and Northern Maine; Goodfellow, W.D., McCutcheon, S.R., Peter, J.M., Eds.; Society of Economic Geologists: Littleton, CO, USA, 2003; pp. 245–301. [Google Scholar]
- McClenaghan, S.H.; Lentz, D.R.; Martin, J.; Diegor, W.G. Gold in the Brunswick no. 12 volcanogenic massive sulfide deposit, Bathurst Mining Camp, Canada: Evidence from bulk ore analysis and laser ablation ICP-MS data on sulfide phases. Miner. Depos. 2009, 44, 523–557. [Google Scholar] [CrossRef]
- Cavelero, R.A. The Caribou massive-sulphide deposit, Bathurst Camp, New Brunswick. In Guidebook to the Metallogeny of the Bathurst Camp; McCutcheon, S.R., Lentz, D.R., Eds.; Canadian Institute of Mining and Metallurgy: Westmount, QC, Canada, 1993; pp. 115–131. [Google Scholar]
- Arseneau, G. Independent Technical Report for the Caribou Massive Sulphide Project, Bathurst New Brunswick, Canada; Report 2CT21.000; Robertson, S., Ed.; Kirsten Consulting Inc.: Vancouver, BC, Canada, 2013; pp. 1–85. [Google Scholar]
- Jambor, J.L.; Laflamme, J.H.G. The Mineral Sources of Silver and Their Distribution in the Caribou Massive Sulphide Deposit, Bathurst Area, New Brunswick; Report 78-14; Canada Centre for Mineral and Energy Technology: Ottawa, ON, Canada, 1978; pp. 1–26.
- Goodfellow, W.D. Geology and genesis of the Caribou deposit, Bathurst Mining Camp, New Brunswick, Canada. In Massive Sulphide Deposits of the Bathurst Mining Camp, New Brunswick, and Northern Maine; Goodfellow, W.D., McCutcheon, S.R., Peter, J.M., Eds.; Society of Economic Geologists: Littleton, CO, USA, 2003; pp. 327–360. [Google Scholar]
- McClenaghan, S.H.; Lentz, D.R.; Cabri, L.J. Abundance and speciation of gold in massive sulfides of the Bathurst Mining Camp, New Brunswick, Canada. Can. Mineral. 2004, 42, 851–871. [Google Scholar] [CrossRef]
- Van Staal, C.R.; Wilson, R.A.; Rogers, N.; Langtop, J.P.; McCutcheon, S.R.; McNicoll, V.; Ravenhurst, C.E. Geology and tectonic history of the Bathurst Supergroup, Bathurst Mining Camp, and its relationships to coeval rocks in southwestern New Brunswick and adjacent maine—A synthesis. In Massive Sulphide Deposits of the Bathurst Mining Camp, New Brunswick, and Northern Maine; Goodfellow, W.D., McCutcheon, S.R., Peter, J.M., Eds.; Society of Economic Geologists: Littleton, CO, USA, 2003; pp. 37–60. [Google Scholar]
- Goodfellow, W.D.; Peter, J.M.; Winchester, J.A.; van Staal, C.R. Ambient marine environment and sediment provenance during formation of massive sulfide deposits in the Bathurst Mining Camp: Importance of reduced bottom waters to sulfide precipitation and sulfide preservation. In Massive Sulphide Deposits of the Bathurst Mining Camp, New Brunswick, and Northern Maine; Goodfellow, W.D., McCutcheon, S.R., Peter, J.M., Eds.; Society of Economic Geologists: Littleton, CO, USA, 2003; pp. 129–156. [Google Scholar]
- Gower, S.J. Preliminary Petrology and Lithogeochemistry of the Hartts Lake-Devils Elbow Brook Area, Northumberland County, New Brunswick; Minerals and Energy Division, Miscellaneous Report 18; New Brunswick Department of Natural Resources and Energy: Fredericton, NB, Canada, 1995; pp. 1–24.
- Rogers, N.; van Staal, C.R. Volcanology and tectonic setting of the northern Bathurst Mining Camp. Part 2. Mafic volcanic constraints on back-arc opening. In Massive Sulphide Deposits of the Bathurst Mining Camp, New Brunswick, and Northern Maine; Goodfellow, W.D., McCutcheon, S.R., Peter, J.M., Eds.; Society of Economic Geologists: Littleton, CO, USA, 2003; pp. 156–180. [Google Scholar]
- Van Staal, C.R.; Winchester, J.A.; Bédard, J.H. Geochemical variations in middle ordovician volcanic rocks of the northern Miramichi Highlands and their tectonic significance. Can. J. Earth Sci. 1991, 28, 1031–1049. [Google Scholar] [CrossRef]
- Lentz, D.R. Deformation-induced mass transfer in felsic volcanic rocks hosting the Brunswick No. 6 massive-sulfide deposit, New Brunswick; geochemical effects and petrogenetic implications. Can. Mineral. 1999, 37, 489–512. [Google Scholar]
- Rogers, N.; van Staal, C.R.; McNicoll, V.; Theriault, R. Volcanology and tectonic setting of the northern Bathurst Mining Camp: Part 1—Extension and rifting of the Popelogan arc. In Massive Sulphide Deposits of the Bathurst Mining Camp, New Brunswick, and Northern Main; Goodfellow, W.D., McCutcheon, S.R., Peter, J.M., Eds.; Society of Economic Geologists: Littleton, CO, USA, 2003; pp. 156–180. [Google Scholar]
- Van Staal, C.R. Brunswick subduction complex in the Canadian Appalachians: Record of the Late Ordovician to Late Silurian collision between Laurentia and the Gander margin of Avalon. Tectonics 1994, 13, 946–962. [Google Scholar] [CrossRef]
- Van Staal, C.R.; Dewey, J.F.; Niocaill, C.M.; McKerrow, W.S. The Cambrian-Silurian tectonic evolution of the northern Appalachians and British Caledonides: History of a complex, west and southwest Pacific-type segment of Iapetus. Geol. Soc. Lond. Spec. Publ. 1998, 143, 197–242. [Google Scholar] [CrossRef]
- Van Staal, C.R.; Williams, P.F. Structure, origin, and concentration of the Brunswick 12 and 6 orebodies. Econ. Geol. 1984, 79, 1669–1692. [Google Scholar] [CrossRef]
- Van Staal, C.R.; Fyffe, L.R. Dunnage and Gander Zones, New Brunswick: Canadian Appalachian Region; Geoscience Report 91-2; New Brunswick Department of Natural Resources and Energy, Minerals and Energy Division: Fredericton, NB, Canada, 1991; pp. 1–39.
- Luff, W.M.; Goodfellow, W.D.; Juras, S.J. Evidence for a feeder pipe and associated alteration at the Brunswick No. 12 massive-sulfide deposit. Explor. Min. Geol. 1992, 1, 167–185. [Google Scholar]
- Lentz, D.R.; Goodfellow, W.D. Geochemistry of the Stringer Sulphide Zone in the Discovery Hole at the Brunswick no. 12 Massive Sulphide Deposit, Bathurst, New Brunswick; Paper 93-1E; Geological Survey of Canada: Ottawa, ON, Canada, 1993; pp. 259–269.
- Lentz, D.R.; Goodfellow, W.D. Mineralogy and Petrology of the Stringer Sulphide Zone in the Discovery Hole at Brunswick no. 12 Massive Sulphide Deposit, Bathurst, New Brunswick; Paper 93-1E; Geological Survey of Canada: Ottawa, ON, Canada, 1993; pp. 248–258.
- Adair, R. Stratigraphy, structure, and geochemistry of the Halfmile Lake massive-sulphide deposit, New Brunswick. Explor. Min. Geol. 1992, 1, 151–166. [Google Scholar]
- Goodfellow, W.D. Major and minor element halos in volcanic rocks at Brunswick no. 12 sulphide deposit, New Brunswick, Canada. In Geochemical Exploration 1974; Elliot, I.L., Fletcher, W.K., Eds.; Elsevier: Amsterdam, The Netherlands, 1975; pp. 279–295. [Google Scholar]
- McAllister, A.L. Massive sulphide deposits in New Brunswick. Can. Inst. Min. Metall. Trans. 1960, 53, 88–98. [Google Scholar]
- Stanton, R.L. General features of the conformable “pyritic” orebodies. I. Field association. Can. Inst. Min. Metall. Trans. 1960, 63, 22–27. [Google Scholar]
- Helmstaedt, H. Structural geology of the Bathurst-Newcastle district. In Geology of New Brunswick Field Guide to Excursions; University of New Brunswick: Fredericton, NB, Canada, 1973; pp. 34–46. [Google Scholar]
- Van Staal, C.R. The Structure and Metamorphism of the Brunswick Mines Area, Bathurst, New Brunswick, Canada. Ph.D. Thesis, The University of New Brunswick, Fredericton, NB, Canada, 1985. [Google Scholar]
- Van Staal, C.R.; Fyffe, L.R.; Langton, J.P.; McCutcheon, S.R. The Ordovician Tetagouche Group, Bathurst Camp, northern New Brunswick, Canada: History, tectonic setting, and distribution of massive-sulfide deposits. Explor. Min. Geol. 1992, 1, 93–103. [Google Scholar]
- Lentz, D.R. Petrology, geochemistry, and oxygen isotope interpretation of felsic volcanic and related rocks hosting the Brunswick 6 and 12 massive sulfide deposits (Brunswick belt), Bathurst mining camp, New Brunswick, Canada. Econ. Geol. 1999, 94, 57–86. [Google Scholar] [CrossRef]
- Lentz, D.R.; Goodfellow, W.D. Petrology and mass-balance constraints on the origin of quartz-augen schist associated with the Brunswick massive sulfide deposits, Bathurst, New Brunswick. Can. Mineral. 1993, 31, 877–903. [Google Scholar]
- Lentz, D.R. Sphalerite and arsenopyrite at the Brunswick No. 12 massive-sulfide deposit, Bathurst camp, New Brunswick: Constraints on P–T evolution. Can. Mineral. 2002, 40, 19–31. [Google Scholar] [CrossRef]
- Currie, K.L.; van Staal, C.R.; Peter, J.M.; Rogers, N. Conditions of metamorphism of the main massive sulfide deposits and surrounding rocks in the Bathurst mining camp. In Massive Sulphide Deposits of the Bathurst Mining Camp, New Brunswick, and Northern Maine; Goodfellow, W.D., McCutcheon, S.R., Peter, J.M., Eds.; Society of Economic Geologists: Littleton, CO, USA, 2003; pp. 65–78. [Google Scholar]
- Craig, J.R. Metamorphic features in Appalachian massive sulphides. Mineral. Mag. 1983, 47, 515–525. [Google Scholar] [CrossRef]
- Marshall, B.; Gilligan, L.B. An introduction to remobilization: Information from ore-body geometry and experimental considerations. Ore Geol. Rev. 1987, 2, 87–131. [Google Scholar] [CrossRef]
- Jambor, J.L. Mineralogical evaluation of proximal-distal features in New Brunswick massive sulfide deposits. Can. Mineral. 1979, 17, 649–664. [Google Scholar]
- Roscoe, W.E. Geology of the Caribou deposit, Bathurst, New Brunswick. Can. J. Earth Sci. 1971, 8, 1125–1136. [Google Scholar] [CrossRef]
- Jambor, J.L. Mineralogy of the Caribou Massive Sulphide Deposit, Bathurst Area, New Brunswick; Report 81-8E; Canada Centre for Mineral and Energy Technology: Ottawa, ON, Canada, 1981; pp. 1–65.
- Van Staal, C.R.; Ravenhurst, C.E.; Winchester, J.A.; Roddick, J.C.; Langton, J.P. Post-taconic blueschist suture in the northern Appalachians of northern New Brunswick, Canada. Geology 1990, 18, 1073–1077. [Google Scholar] [CrossRef]
- Cook, N.J.; Chryssoulis, S.L. Concentrations of invisible gold in the common sulfides. Can. Mineral. 1990, 28, 1–16. [Google Scholar]
- Cabri, L.J.; Chryssoulis, S.L.; Villiers, J.P.R.D.; Laflamme, J.H.G.; Buseck, P.R. The nature of “invisible” gold in arsenopyrite. Can. Mineral. 1989, 27, 353–362. [Google Scholar]
- Chryssoulis, S.L.; Cabri, L.J.; Lennard, W. Calibration of the ion microprobe for quantitative trace precious metal analyses of ore minerals. Econ. Geol. 1989, 84, 1684–1689. [Google Scholar] [CrossRef]
- Cook, N.J.; Ciobanu, C.L.; Danyushevsky, L.V.; Gilbert, S. Minor and trace elements in Bornite and associated Cu–(Fe)-sulfides: A LA-ICP-MS study. Geochim. Cosmochim. Acta 2011, 75, 6473–6496. [Google Scholar] [CrossRef]
- Reich, M.; Chryssoulis, S.L.; Deditius, A.; Palacios, C.; Zúñiga, A.; Weldt, M.; Alvear, M. “Invisible” silver and gold in supergene digenite (Cu1.8S). Geochim. Cosmochim. Acta 2010, 74, 6157–6173. [Google Scholar] [CrossRef]
- Reich, M.; Kesler, S.E.; Utsunomiya, S.; Palenik, C.S.; Chryssoulis, S.L.; Ewing, R.C. Solubility of gold in arsenian pyrite. Geochim. Cosmochim. Acta 2005, 69, 2781–2796. [Google Scholar] [CrossRef]
- Tatsuka, K.; Morimoto, N. Tetrahedrite stability relations in the Cu-Fe-Sb-S system. Am. Mineral. 1977, 62, 1101–1109. [Google Scholar]
- Charlat, M.; Levy, C. Substitutions multiples dans la série tennantite-tétraédrite. Bulletin de la Société Francaise de Minéralogie et de Cristallographie 1974, 97, 241–250. (In French) [Google Scholar]
- Peterson, R.C.; Miller, I. Crystal structure and cation distribution in freibergite and tetrahedrite. Miner. Mag. 1986, 50, 717–721. [Google Scholar] [CrossRef]
- Riley, J.F. The tetrahedrite-freibergite series, with reference to the Mount Isa Pb-Zn-Ag orebody. Miner. Depos. 1974, 9, 117–124. [Google Scholar] [CrossRef]
- Kalbskopf, R. Strukturverfeinerung des freibergits. TMPM Tschermaks Petr. Mitt. 1972, 18, 147–155. (In German) [Google Scholar] [CrossRef]
- Kalbskopf, R. Die koordination des quecksilbers im schwazit. TMPM Tschermaks Petr. Mitt. 1971, 16, 173–175. (In German) [Google Scholar] [CrossRef]
- Giovanni Di, P. Mineralogical and Predictive Metallurgy Examination of Drill Core Samples from the Caribou and Restigouche Deposits, New Brunswick; LR: 8901-242—LIMS:JAN5009 and 50150.R00; Report 8901-242: 2000/07/04/; Lakefield Research Limited: Lakefield, ON, Canada, 2000; pp. 1–27. [Google Scholar]
- Van Hook, H.J. The ternary system Ag2S-Bi2S3-PbS. Econ. Geol. 1960, 55, 759–788. [Google Scholar] [CrossRef]
- Grant, H.L.J.; Layton-Matthews, D.; Peter, J.M. Distribution and controls on silver mineralization in the Hackett River Main Zone, Nunavut, Canada: An Ag- and Pb-enriched archean volcanogenic massive sulfide deposit. Econ. Geol. 2015, 110, 943–982. [Google Scholar] [CrossRef]
- Amcoff, Ö. Distribution of silver in massive sulfide ores. Miner. Depos. 1984, 19, 63–69. [Google Scholar] [CrossRef]
- Sharp, T.G.; Buseck, P.R. The distribution of Ag and Sb in galena; inclusions versus solid solution. Am. Mineral. 1993, 78, 85–95. [Google Scholar]
- Amcoff, Ö. The solubility of silver and antimony in galena. Neues Jahrb. Mineral. Monatshefte 1976, 6, 247–261. [Google Scholar]
- Voronin, M.V.; Osadchii, E.G. Thermodynamic properties of silver and bismuth sulfosalt minerals, pavonite (AgBi3S5) and matildite (AgBiS2) and implications for ore deposits. Econ. Geol. 2013, 108, 1203–1210. [Google Scholar] [CrossRef]
- Wiggins, L.B.; Craig, J.R. Reconnaissance of the Cu-Fe-Zn-S system; sphalerite phase relationships. Econ. Geol. 1980, 75, 742–751. [Google Scholar] [CrossRef]
- Barton, P.B., Jr.; Bethke, P.M. Chalcopyrite disease in sphalerite: Pathology and epidemiology. Am. Mineral. 1987, 72, 451–467. [Google Scholar]
- Prouvost, J. Various aspects of atomic displacements in metallic sulfides. In Third General Meeting; Special Paper 1; Mineralogical Society of America: Chantilly, VA, USA, 1966; pp. 144–148. [Google Scholar]
- Chen, T.T.; Dutrizac, J.E.; Owens, D.R.; Laflamme, J.H.G. Accelerated tarnishing of some chalcopyrite and tennantite specimens. Can. Mineral. 1980, 18, 173–180. [Google Scholar]
- Cabri, L.J. The distribution of trace precious metals in minerals and mineral products. Mineral. Mag. 1992, 56, 289–308. [Google Scholar] [CrossRef]
- Harris, D.C.; Cabri, L.J.; Nobiling, R. Silver-bearing chalcopyrite, a principal source of silver in the Izok Lake massive-sulfide deposit; confirmation by electron- and proton-microprobe analyses. Can. Mineral. 1984, 22, 493–498. [Google Scholar]
- Butler, I.B.; Nesbitt, R.W. Trace element distributions in the chalcopyrite wall of a black smoker chimney: Insights from laser ablation inductively coupled plasma mass spectrometry (LA–ICP–MS). Earth Planet. Sci. Lett. 1999, 167, 335–345. [Google Scholar] [CrossRef]
- Chryssoulis, S.L.; Surges, L.J.; Salter, R.S. Silver mineralogy at Brunswick mining and smelting and its implications for enhanced recovery. In Complex Sulfides, Processing of Ores, Concentrates and by-Products; American Institute of Mining, Metallurgical, and Petroleum Engineers-The Minerals, Metals and Materials Society: Warrendale, PA, USA, 1985; pp. 815–830. [Google Scholar]
- Cook, N.J.; Ciobanu, C.L.; Pring, A.; Skinner, W.; Shimizu, M.; Danyushevsky, L.; Saini-Eidukat, B.; Melcher, F. Trace and minor elements in sphalerite: A LA-ICPMS study. Geochim. Cosmochim. Acta 2009, 73, 4761–4791. [Google Scholar] [CrossRef]
- Hurley, T.D.; Crocket, J.H. A gold-sphalerite association in a volcanogenic base-metal-sulfide deposit near Tilt Cove, Newfoundland. Can. Mineral. 1985, 23, 423–430. [Google Scholar]
- Liang, J.; Sun, W.; Zhu, S.; Li, H.; Liu, Y.; Zhai, W. Mineralogical study of sediment-hosted gold deposits in the Yangshan Ore Field, Western Qinling Orogen, Central China. J. Asian Earth Sci. 2014, 85, 40–52. [Google Scholar] [CrossRef]
- Wagner, T.; Klemd, R.; Wenzel, T.; Mattsson, B. Gold upgrading in metamorphosed massive sulfide ore deposits: Direct evidence from laser–ablation–inductively coupled plasma-mass spectrometry analysis of invisible gold. Geology 2007, 35, 775–778. [Google Scholar] [CrossRef]
- Sutherland, J.K. The chemistry of some New Brunswick pyrites. Can. Mineral. 1967, 9, 71–84. [Google Scholar]
- Chen, T.T. Colloform and framboidal pyrite from the Caribou Deposits, New Brunswick. Can. Mineral. 1978, 16, 9–15. [Google Scholar]
- Scott, R.J.; Meffre, S.; Woodhead, J.; Gilbert, S.E.; Berry, R.F.; Emsbo, P. Development of framboidal pyrite during diagenesis, low-grade regional metamorphism, and hydrothermal alteration. Econ. Geol. 2009, 104, 1143–1168. [Google Scholar] [CrossRef]
- Fleet, M.E.; Chryssoulis, S.L.; MacLean, P.J.; Davidson, R.; Weisener, C.G. Arsenian pyrite from gold deposits; Au and As distribution investigated by SIMS and EMP, and color staining and surface oxidation by XPS and LIMS. Can. Mineral. 1993, 31, 1–17. [Google Scholar]
- Palenik, C.S.; Utsunomiya, S.; Reich, M.; Kesler, S.E.; Wang, L.; Ewing, R.C. “Invisible gold” revealed: Direct imaging of gold nanoparticles in a Carlin-type deposit. Am. Mineral. 2004, 89, 1359–1366. [Google Scholar] [CrossRef]
- Morishita, Y.; Shimada, N.; Shimada, K. Invisible gold and arsenic in pyrite from the high-grade Hishikari gold deposit, Japan. Appl. Surf. Sci. 2008, 255, 1451–1454. [Google Scholar] [CrossRef]
- Kovalev, K.R.; Kalinin, Y.A.; Naumov, E.A.; Pirajno, F.; Borisenko, A.S. A mineralogical study of the Suzdal sediment-hosted gold deposit, Eastern Kazakhstan: Implications for ore genesis. Ore Geol. Rev. 2009, 35, 186–205. [Google Scholar] [CrossRef]
- Deditius, A.P.; Reich, M.; Kesler, S.E.; Utsunomiya, S.; Chryssoulis, S.L.; Walshe, J.; Ewing, R.C. The coupled geochemistry of Au and As in pyrite from hydrothermal ore deposits. Geochim. Cosmochim. Acta 2014, 140, 644–670. [Google Scholar] [CrossRef]
- Chouinard, A.; Paquette, J.; Williams-Jones, A.E. Crystallographic controls on trace-element incorporation in auriferous pyrite from the Pascua epithermal high-sulfidation deposit, Chile-Argentina. Can. Mineral. 2005, 43, 951–963. [Google Scholar] [CrossRef]
- McClenaghan, S.H.; Goodfellow, W.D.; Lentz, D.R. Gold in massive sulfide deposits, Bathurst Mining Camp: Distribution and genesis. In Massive Sulphide Deposits of the Bathurst Mining Camp, New Brunswick, and Northern Maine; Goodfellow, W.D., McCutcheon, S.R., Peter, J.M., Eds.; Society of Economic Geologists: Littleton, CO, USA, 2003; pp. 303–326. [Google Scholar]
- Luff, W.M. A history of mining in the Bathurst area, northern New Brunswick, Canada. Can. Inst. Min. Metall. 1995, 88, 63–68. [Google Scholar]
- Boyle, D.R. Geochemistry and genesis of the Murray Brook precious metal gossan deposit, Bathurst Mining Camp, New Brunswick. Explor. Min. Geol. 1995, 4, 341–363. [Google Scholar]
- Leblanc, S. Massive Sulphide-Associated Gold: Brunswick No. 12 Mine, Bathurst, New Brunswick. Bachelor’s Thesis, University of New Brunswick, Fredericton, NB, Canada, 1989. [Google Scholar]
- Chryssoulis, S.L.; Agha, U. Gold Mineralogical Balance in Two Brunswick ore Samples; University of Western Ontario: London, ON, Canada, 1990. [Google Scholar]
- Paton, C.; Hellstrom, J.; Paul, B.; Woodhead, J.; Hergt, J. Iolite: Freeware for the visualisation and processing of mass spectrometric data. J. Anal. At. Spectrom. 2011, 26, 2508–2518. [Google Scholar] [CrossRef]
- Eldridge, C.S.; Barton, P.B., Jr.; Ohmoto, H. Mineral textures and their bearing on formation of the Kuroko orebodies. Econ. Geol. Monogr 1983, 5, 241–281. [Google Scholar]
- Einaudi, M.T.; Hedenquist, J.W.; Inan, E.E. Sulfidation state of fluids in active and extinct hydrothermal systems: Transitions from porphyry to epithermal environments. Soc. Econ. Geol. Spec. Publ. 2003, 10, 285–313. [Google Scholar]
- Scott, S.D. Experimental calibration of the sphalerite geobarometer. Econ. Geol. 1973, 68, 466–474. [Google Scholar] [CrossRef]
- Hannington, M.D.; Kjarsgaard, I.; Bleeker, W. Sulfide mineralogy, geochemistry and ore genesis of the Kidd Creek deposit. Part i. The North, Central, and South Orebodies. In Sulfide Mineralogy, Geochemistry and ore Genesis of the Kidd Creek Deposit; Economic Geology Pub. Co.: Littleton, CO, USA, 1999; pp. 163–224. [Google Scholar]
- Large, R.R. Chemical evolution and zonation of massive sulfide deposits in volcanic terrains. Econ. Geol. 1977, 72, 549–572. [Google Scholar] [CrossRef]
- Barton, P.B.; Toulmin, P. Phase relations involving sphalerite in the Fe-Zn-S system. Econ. Geol. 1966, 61, 815–849. [Google Scholar] [CrossRef]
- Huston, D.L.; Jablonski, W.; Sie, S.H. The distribution and mineral hosts of silver in eastern Australian volcanogenic massive sulfide deposits. Can. Mineral. 1996, 34, 529–546. [Google Scholar]
- Hackbarth, C.J.; Petersen, U. A fractional crystallization model for the deposition of argentian tetrahedrite. Econ. Geol. 1984, 79, 448–460. [Google Scholar] [CrossRef]
- Sandecki, J.; Amcoff, O. On the occurrence of silver-rich tetrahedrite at Garpenberg Norra, central Sweden. Neues Jahrb. Mineral. 1981, 141, 324–340. [Google Scholar]
- Miller, J.W.; Craig, J.R. Tetrahedrite-tennantite series compositional variations in the Cofer deposit, mineral district, Virginia. Am. Mineral. 1983, 68, 227–234. [Google Scholar]
- Johnson, N.E.; Craig, J.R.; Rimstidt, J.D. Compositional trends in tetrahedrite. Can. Mineral. 1986, 24, 385–397. [Google Scholar]
- Sack, R.O.; Lynch, J.V.G.; Foit, F. Fahlore as a petrogenetic indicator: Keno Hill Ag-Pb-Zn district, Yukon, Canada. Mineral. Mag. 2003, 67, 1023–1038. [Google Scholar] [CrossRef]
- Jean, G.E.; Bancroft, G.M. Heavy metal adsorption by sulphide mineral surfaces. Geochim. Cosmochim. Acta 1986, 50, 1455–1463. [Google Scholar] [CrossRef]
- Petruk, W. Applied Mineralogy in the Mining Industry; Elsevier: Ottawa, ON, Canada, 2000. [Google Scholar]
- Petruk, W.; Schnarr, J. An evaluation of the recovery of free and unliberated mineral grains, metals and trace elements in the concentrator of brunswick mining and smelting Corp. Ltd. Can. Mineral. 1981, 74, 132–159. [Google Scholar]
- Tapley, B.; Yan, D. The selective flotation of arsenopyrite from pyrite. Miner. Eng. 2003, 16, 1217–1220. [Google Scholar] [CrossRef]
Figure 1.
Simplified geology map of the Bathurst Mining Camp showing the location of the Caribou deposit and the five major rocks (modified from [
1]). BMC, Bathurst Mining Camp.
Figure 1.
Simplified geology map of the Bathurst Mining Camp showing the location of the Caribou deposit and the five major rocks (modified from [
1]). BMC, Bathurst Mining Camp.
Figure 2.
Geology at 150 m below the surface, showing the relative locations of the six lenses and their relationship to the stratigraphic units of the Spruce Lake Formation and Boucher Brook Formation (modified from [
7]).
Figure 2.
Geology at 150 m below the surface, showing the relative locations of the six lenses and their relationship to the stratigraphic units of the Spruce Lake Formation and Boucher Brook Formation (modified from [
7]).
Figure 3.
Cross-section of the west limb of the Caribou deposit, looking 7° west of north, which shows the massive sulphide lenses relative to the stratigraphic units of the Spruce Lake Formation and Boucher Brook Formation (modified from [
4]).
Figure 3.
Cross-section of the west limb of the Caribou deposit, looking 7° west of north, which shows the massive sulphide lenses relative to the stratigraphic units of the Spruce Lake Formation and Boucher Brook Formation (modified from [
4]).
Figure 4.
Reflected light photomicrograph showing the sulphide phases present in the L4-7-105.7 polished thin section. Ductile sulphides (Gn, Cp, Sp, Td-Tn) are concentrated in the interstices of coarser grained pyrite, whereas arsenopyrite is finely intergrown with the m.g. to c.g. porphyroblastic pyrite.
Figure 5.
Reflected light photomicrograph from the L4-7-105.7 polished thin section. Pyrite textures transition with fine aggregate textures (with interstitial Sp) on the left and coarser aggregate textures progressing to the right in this image. Some Py, Cp, and Sp grains, as seen at the top centre, are isolated in the non-sulphide gangue minerals and are subhedral.
Figure 6.
Reflected light photomicrograph from the L4-7-105.7 polished thin section. Tetrahedrite grains are commonly in contact with Cp, Sp, and Gn at grain boundaries, and occur frequently as veinlets or along grain boundaries within pyrite. Chalcopyrite has the same grain size distribution in gangue-rich areas as Py-rich areas, whereas this is not the same for Sp and Gn.
Figure 7.
Reflected light photomicrograph from the L4-14-132.0 polished thin section. Chalcopyrite grains occur as disseminated grains within Py, Asp, and gangue, but are mostly concentrated in gangue-rich areas. Coarse-grained, inclusion free (relatively) Sp occurs mainly along pyrite-gangue zones.
Figure 8.
Reflected light photomicrograph from L4-14-132.0 polished thin section. Subhedral Asp grains are isolated within Py aggregates, while coarse Asp euhedra are present at the grain boundaries of pyrite-Sp aggregates. Sphalerite is interstitial phase to Py-Asp assemblage.
Figure 8.
Reflected light photomicrograph from L4-14-132.0 polished thin section. Subhedral Asp grains are isolated within Py aggregates, while coarse Asp euhedra are present at the grain boundaries of pyrite-Sp aggregates. Sphalerite is interstitial phase to Py-Asp assemblage.
Figure 9.
Reflected light photomicrograph from the L4-14-132.0 polished thin section. Relatively large subhedral to euhedral Asp grains and finer subhedral Py grains are commonly in contact at grain boundaries with interstitial Sp. Sphalerite, Cp, and Gn occur primarily as interstitial phases between the grains of Asp and Py.
Figure 10.
Silver versus Pb drill core interval assays for Lenses 3 (n = 33) and 4 (n = 23).
Figure 10.
Silver versus Pb drill core interval assays for Lenses 3 (n = 33) and 4 (n = 23).
Table 1.
Lens 3 drill core interval assay results.
Table 1.
Lens 3 drill core interval assay results.
| Drill Hole ID | Interval Depth, m | g/t | wt % |
|---|
| Ag | Au | Cu | Zn | Pb | Total Cu, Zn, Pb |
|---|
| DDH62-119 | 47.7 | 62.0 | <1 | 0.82 | 1.00 | 2.94 | 4.76 |
| DDH62-119 | 44.4 | 68.5 | <1 | 0.37 | 1.70 | 6.82 | 8.89 |
| DDH62-119 | 41.4 | 78.8 | <1 | 0.35 | 2.60 | 7.86 | 10.81 |
| DDH62-101 | 43.6 | 89.1 | <1 | 0.41 | 2.10 | 6.40 | 8.91 |
| L2-16 | 72.5 | 92.0 | <1 | 0.38 | 2.56 | 6.98 | 9.92 |
| L2-05 | 66.7 | 103.0 | <1 | 0.29 | 3.64 | 8.45 | 12.38 |
| L2-17 | 117.0 | 105.0 | <1 | 0.80 | 3.39 | 7.92 | 12.11 |
| DDH62-119 | 49.0 | 105.6 | <1 | 0.66 | 2.22 | 8.88 | 11.76 |
| L2-16 | 74.6 | 107.0 | <1 | 0.44 | 3.64 | 11.01 | 15.09 |
| L2-17 | 121.0 | 108.0 | <1 | 0.31 | 3.69 | 9.05 | 13.05 |
| L2-16 | 70.0 | 111.0 | <1 | 0.36 | 2.78 | 6.67 | 9.81 |
| DDH62-101 | 46.2 | 113.8 | <1 | 0.31 | 4.44 | 10.40 | 15.15 |
| L2-05 | 61.7 | 128.0 | <1 | 0.33 | 4.51 | 19.81 | 24.65 |
| L2-17 | 111.0 | 128.0 | <1 | 0.28 | 7.42 | 14.18 | 21.88 |
| DDH62-101 | 48.5 | 133.7 | <1 | 0.58 | 2.82 | 7.88 | 11.28 |
| L2-17 | 114.2 | 134.0 | <1 | 0.29 | 6.73 | 13.38 | 20.40 |
| L2-06 | 103.7 | 134.0 | <1 | 0.29 | 3.97 | 9.71 | 13.97 |
| L2-05 | 64.4 | 135.0 | <1 | 0.22 | 5.85 | 10.18 | 16.25 |
| L2-17 | 108.0 | 146.0 | <1 | 0.42 | 5.50 | 10.77 | 16.69 |
| L2-16 | 67.4 | 164.0 | <1 | 0.32 | 4.86 | 13.45 | 18.63 |
| L2-06 | 100.8 | 169.0 | <1 | 0.34 | 5.60 | 16.27 | 22.21 |
| L2-17 | 105.0 | 172.0 | <1 | 0.28 | 8.20 | 21.61 | 30.09 |
| L2-06 | 97.8 | 202.0 | <1 | 0.39 | 1.86 | 3.22 | 5.47 |
| Average | - | 121.3 | <1 | 0.40 | 3.96 | 10.17 | 14.53 |
Table 2.
Lens 4 drill core interval assay results.
Table 2.
Lens 4 drill core interval assay results.
| Drill Hole ID | Interval Depth, m | g/t | wt % |
|---|
| Ag | Au | Cu | Zn | Pb | Total Cu, Zn, Pb |
|---|
| TH320-02 | 7.3 | 41.9 | - | 0.22 | 6.34 | 2.81 | 9.37 |
| DDH103 | 358 | 43.5 | - | 0.22 | 9.51 | 5.85 | 15.58 |
| TH320-01 | 6.7 | 45.2 | <1 | 0.18 | 7.02 | 4.15 | 11.35 |
| TH320-01 | 1.3 | 51.8 | <1 | 0.15 | 7.63 | 2.96 | 10.74 |
| L4-14 | 137.5 | 57.3 | <1 | 0.47 | 10.21 | 1.79 | 12.47 |
| L4-14 | 134.5 | 60.6 | <1 | 0.19 | 6.57 | 2.91 | 9.67 |
| L4-02 | 21.0 | 68.9 | <1 | 0.31 | 5.53 | 3.51 | 9.35 |
| L4-07 | 108.7 | 69.9 | <1 | 0.20 | 4.93 | 3.43 | 8.56 |
| TH320-01 | 4 | 74.9 | <1 | 0.15 | 6.44 | 4.14 | 10.73 |
| L4-16 | 126.3 | 78.2 | <1 | 0.27 | 10.75 | 3.57 | 14.59 |
| L4-07 | 107.2 | 80.9 | <1 | 0.36 | 10.11 | 4.10 | 14.57 |
| L4-05 | 82.0 | 83.0 | <1 | 0.35 | 9.95 | 5.05 | 15.35 |
| DDH103 | 353 | 90.5 | <1 | 0.19 | 7.66 | 5.30 | 13.15 |
| L4-02 | 19.0 | 90.9 | <1 | 0.34 | 9.63 | 3.41 | 13.38 |
| L4-15 | 103.2 | 93.7 | <1 | 0.35 | 8.55 | 2.53 | 11.43 |
| L4-14 | 132.0 | 99.2 | <1 | 0.40 | 10.22 | 3.79 | 14.41 |
| DDH055 | 76 | 101.5 | 1.37 | 0.40 | 5.00 | 2.90 | 8.30 |
| TH320-02 | 5.1 | 104.7 | <1 | 0.17 | 6.48 | 4.81 | 11.46 |
| L4-14 | 128.9 | 111.3 | <1 | 0.24 | 6.32 | 5.30 | 11.86 |
| DDH055 | 77.5 | 115.2 | 1.37 | 0.25 | 6.10 | 3.70 | 10.05 |
| DDH62-045 | 33.5 | 122.4 | <1 | 0.00 | 6.24 | 3.00 | 9.24 |
| DDH62-045 | 38.0 | 124.4 | <1 | 0.00 | 9.32 | 6.00 | 15.32 |
| L4-15 | 101.6 | 126.7 | <1 | 0.26 | 10.15 | 5.23 | 15.64 |
| L4-02 | 17.3 | 140.9 | <1 | 0.22 | 5.63 | 4.35 | 10.20 |
| DDH103 | 350 | 141.5 | <1 | 0.23 | 6.10 | 4.50 | 10.83 |
| L4-05 | 79.5 | 148.5 | <1 | 0.42 | 9.05 | 4.62 | 14.09 |
| DDH055 | 80.0 | 149.4 | 1.37 | 0.35 | 8.20 | 5.30 | 13.85 |
| L4-05 | 76.5 | 167.0 | <1 | 0.28 | 10.35 | 8.73 | 19.36 |
| L4-15 | 100.1 | 173.0 | <1 | 0.12 | 8.64 | 6.60 | 15.36 |
| L4-16 | 124.5 | 175.2 | <1 | 0.21 | 6.80 | 3.20 | 10.21 |
| L4-07 | 105.7 | 176.9 | <1 | 0.28 | 4.04 | 3.66 | 7.98 |
| TH320-02 | 2.4 | 178.5 | <1 | 0.19 | 9.87 | 5.59 | 15.65 |
| DDH62-045 | 35.5 | 188.5 | <1 | <0.00 | 7.08 | 3.90 | 10.98 |
| Average | - | 108.4 | <1.03 | 0.24 | 7.77 | 4.26 | 12.28 |
Table 3.
Mineral liberation analysis modal mineralogy results.
Table 3.
Mineral liberation analysis modal mineralogy results.
| Lens | PTS 1 | wt % |
|---|
| Sp | Gn | Cp | Td-Tn | Asp | Py | NSG 2 |
|---|
| 3 | 62-119-47.7 | 4.57 | 0.66 | 1.16 | <0.01 | 0.55 | 85.48 | 7.58 |
| 3 | L2-16-67.4 | 0.07 | 6.07 | 0.82 | 0.07 | 0.23 | 90.94 | 1.80 |
| 3 | L2-16-70 | 13.70 | 5.90 | 0.81 | 0.01 | 0.37 | 70.01 | 9.20 |
| 4 | L4-14-132 | 16.80 | 1.87 | 0.66 | <0.01 | 5.28 | 69.27 | 6.12 |
| 4 | L4-14-134.5 | 13.93 | 4.71 | 0.20 | <0.01 | 4.82 | 70.07 | 6.27 |
| 4 | L4-15-100.1 | 9.60 | 17.79 | 0.02 | 0.05 | 0.92 | 64.62 | 7.00 |
Table 4.
LA-ICP-MS Ag average grain concentrations.
Table 4.
LA-ICP-MS Ag average grain concentrations.
| Lens | PTS 1 | ppm Ag 2 |
|---|
| Sp | Gn | Cp | Td-Tn 3 | Asp | Py |
|---|
| 3 | 62-119-47.7 | 32.6 | 2854.4 | 5.6 | N/A | 95.0 | 8.3 |
| 3 | L2-16-67.4 | 255.5 | 3067.8 | <12.9 | 59,878.1 | <40.6 | 8.0 |
| 3 | L2-16-70 | 43.8 | 909.4 | 51.0 | N/A | <89.5 | 0.8 |
| 4 | L4-14-132 | 26.9 | 1172.1 | 55.1 | N/A | <44.9 | 6.5 |
| 4 | L4-14-134.5 | 25.1 | 416.5 | 40.7 | N/A | <15.8 | 12.4 |
| 4 | L4-15-100.1 | 57.6 | 483.3 | N/A | 138,550.0 | 117.7 | 18.0 |
Table 5.
Silver distributions by grain average.
Table 5.
Silver distributions by grain average.
| Lens | PTS 1 | Ag, % of Total |
|---|
| Sp | Gn | Cp | Td-Tn | Asp | Py |
|---|
| 3 | 62-119-47.7 | 5.3 | 67.3 | 0.2 | N/A | 1.9 | 25.3 |
| 3 | L2-16-67.4 | 0.1 | 78.8 | 0.0 | 18.0 | 0.0 | 3.1 |
| 3 | L2-16-70 | 9.9 | 88.0 | 0.7 | N/A | 0.5 | 0.9 |
| 4 | L4-14-132 | >13.4 | >65.1 | >1.1 | N/A | <7.0 | >13.4 |
| 4 | L4-14-134.5 | >10.7 | >60.1 | >0.3 | N/A | <2.3 | >26.6 |
| 4 | L4-15-100.1 | 3.3 | 51.1 | N/A | 38.1 | 0.6 | 6.9 |
Table 6.
LA-ICP-MS Au average grain concentrations.
Table 6.
LA-ICP-MS Au average grain concentrations.
| Lens | PTS 1 | ppm Au 3 |
|---|
| Sp | Gn | Cp | Td-Tn 2 | Asp | Py |
|---|
| 3 | 62-119-47.7 | <0.04 | <0.18 | <0.15 | N/A | 21.29 | <0.60 |
| 3 | L2-16-67.4 | <0.15 | <0.14 | <0.21 | <0.17 | <1.22 | <0.60 |
| 3 | L2-16-70 | <0.07 | <0.08 | <0.18 | N/A | <7.93 | 0.48 |
| 4 | L4-14-132 | <0.10 | <0.16 | <0.99 | N/A | 15.18 | <0.11 |
| 4 | L4-14-134.5 | <0.11 | <0.07 | <1.11 | N/A | <5.02 | <0.11 |
| 4 | L4-15-100.1 | <0.09 | <0.07 | N/A | <0.50 | <13.37 | <0.48 |
Table 7.
Gold distributions by grain average.
Table 7.
Gold distributions by grain average.
| Lens | PTS 1 | Au, % of Total |
|---|
| Sp | Gn | Cp | Td-Tn | Asp | Py |
|---|
| 3 | 62-119-47.7 | <0.3 | <0.2 | <0.3 | N/A | >18.5 | <80.7 |
| 3 | L2-16-67.4 | 0.0 | <1.5 | <0.3 | <0.1 | <0.5 | <97.6 |
| 3 | L2-16-70 | <2.5 | <1.3 | <0.4 | N/A | <7.7 | <88.1 |
| 4 | L4-14-132 | <1.9 | <0.3 | <0.7 | N/A | >88.7 | <8.4 |
| 4 | L4-14-134.5 | N/A | N/A | N/A | N/A | N/A | N/A |
| 4 | L4-15-100.1 | <1.9 | <2.7 | N/A | 0.0 | <27.2 | <68.2 |
© 2016 by the authors; licensee MDPI, Basel, Switzerland. This article is an open access article distributed under the terms and conditions of the Creative Commons Attribution (CC-BY) license (http://creativecommons.org/licenses/by/4.0/).


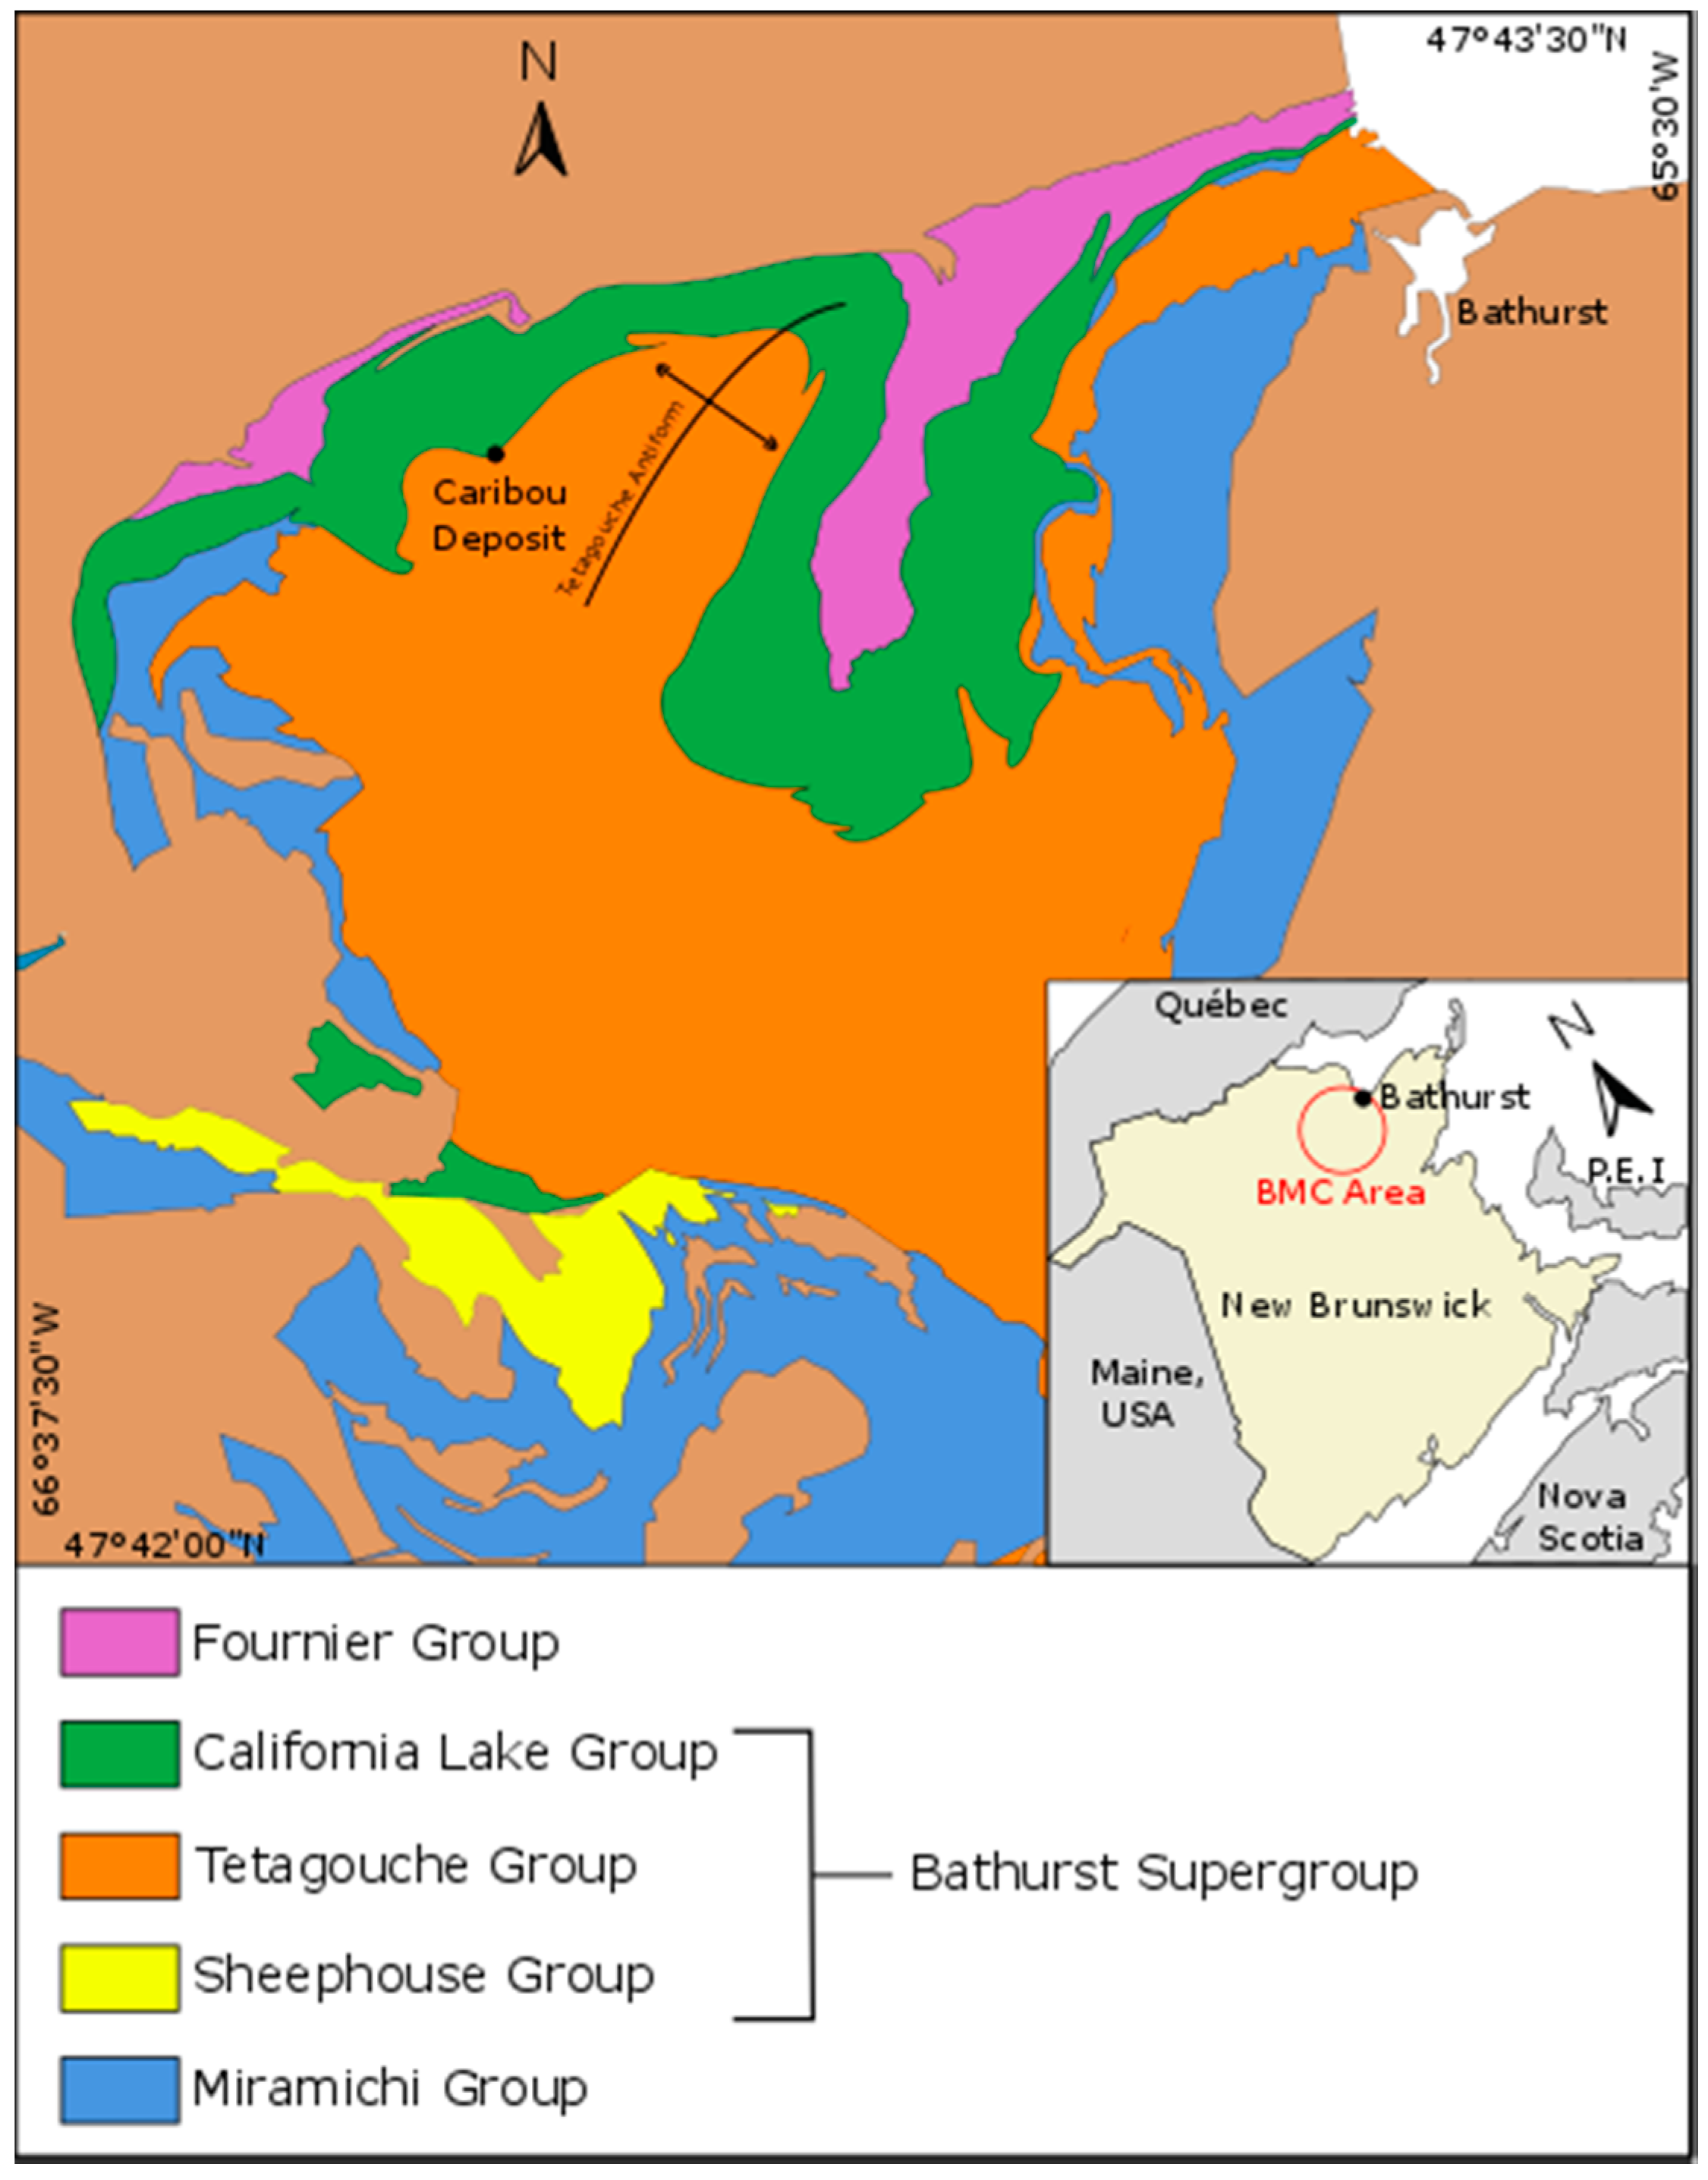
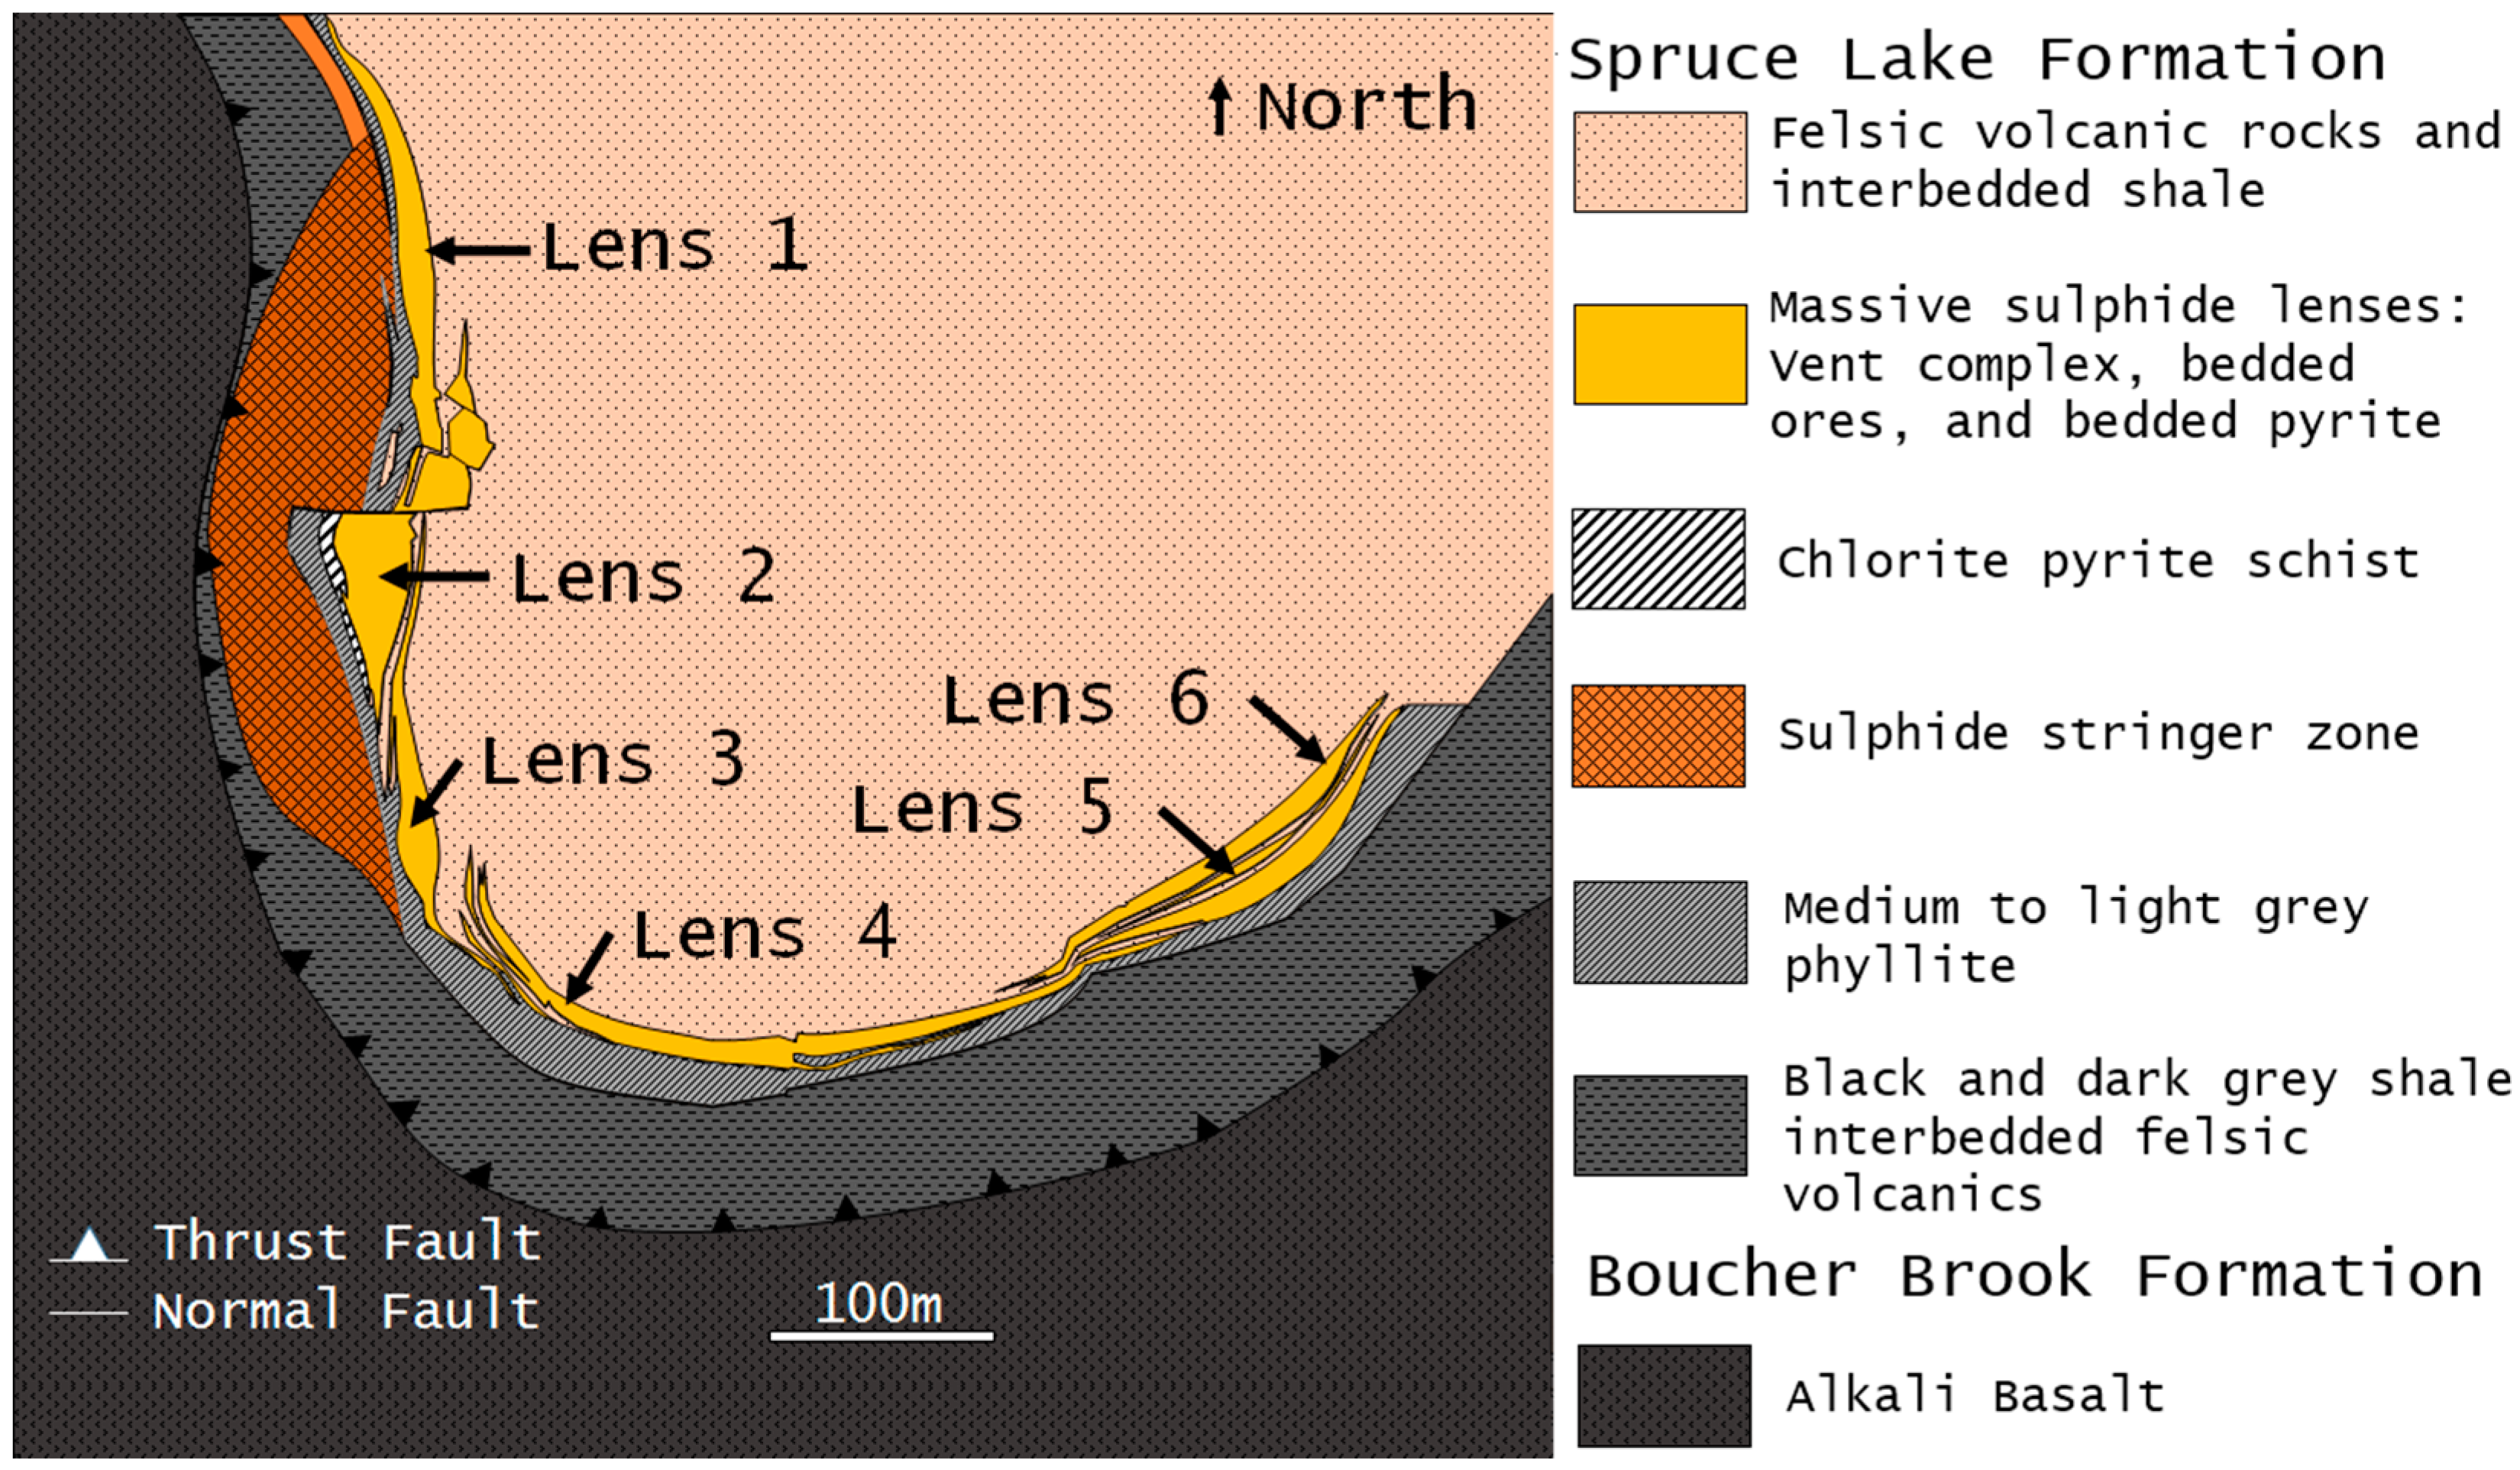
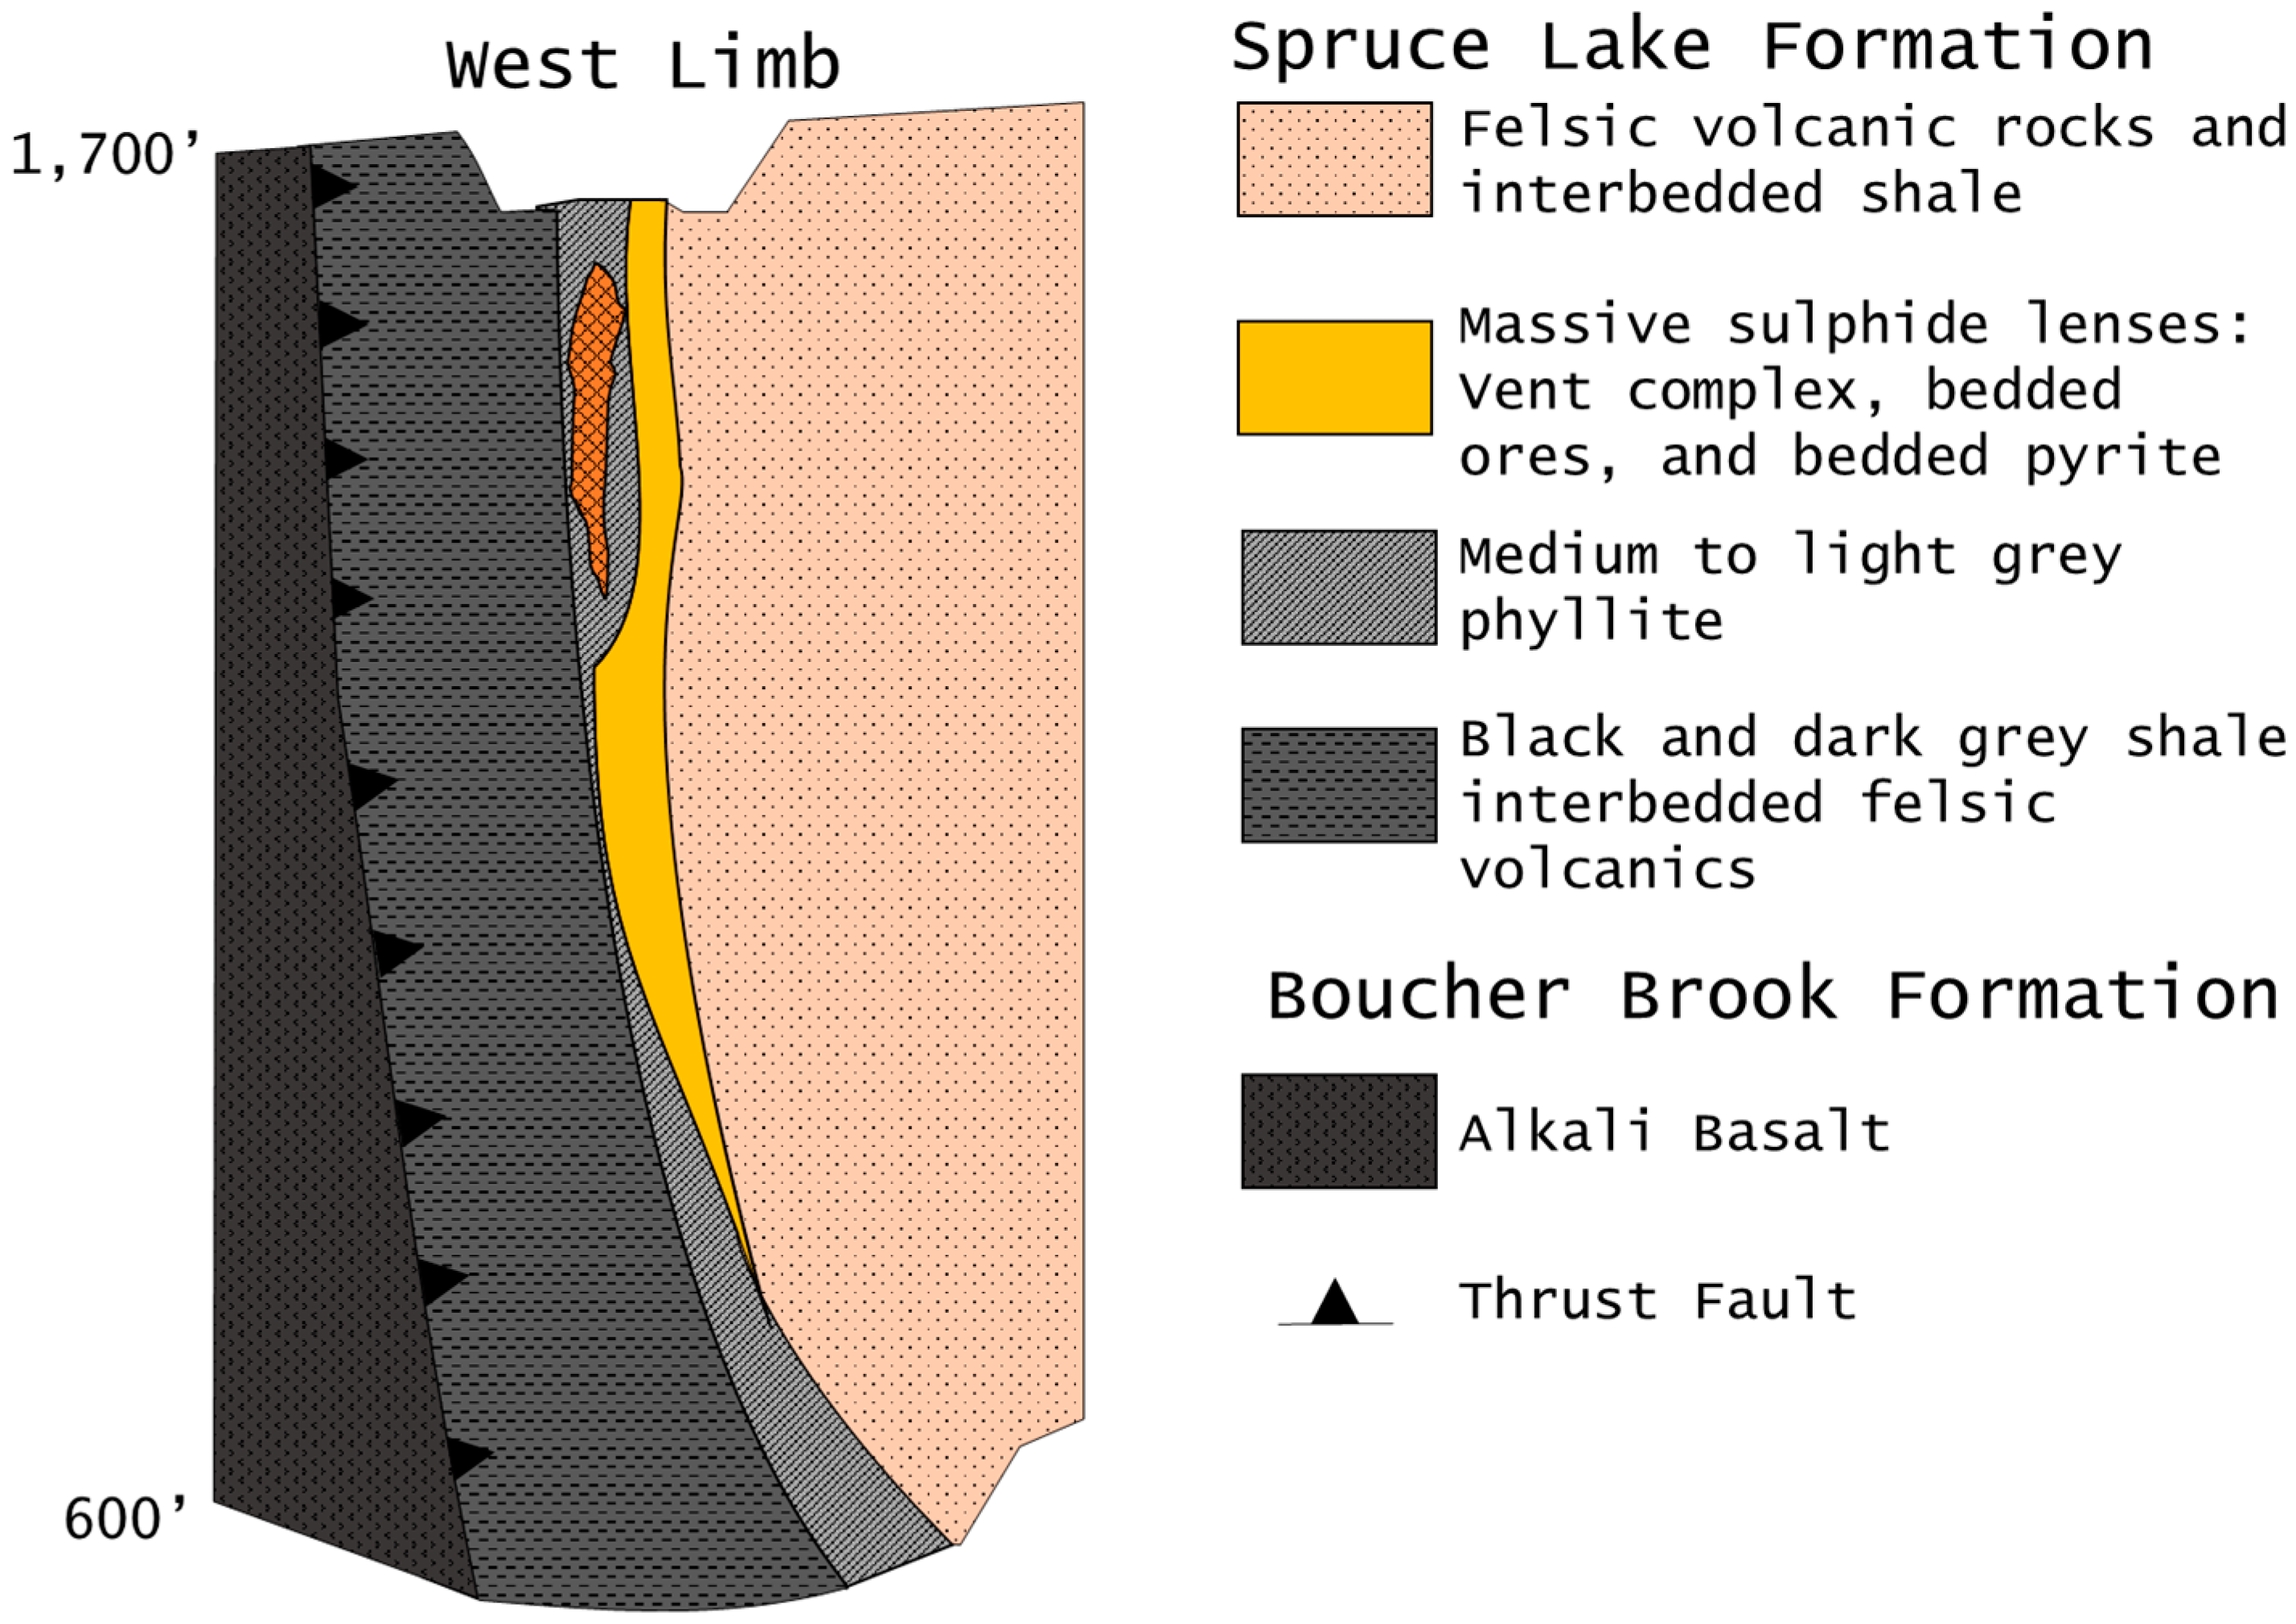


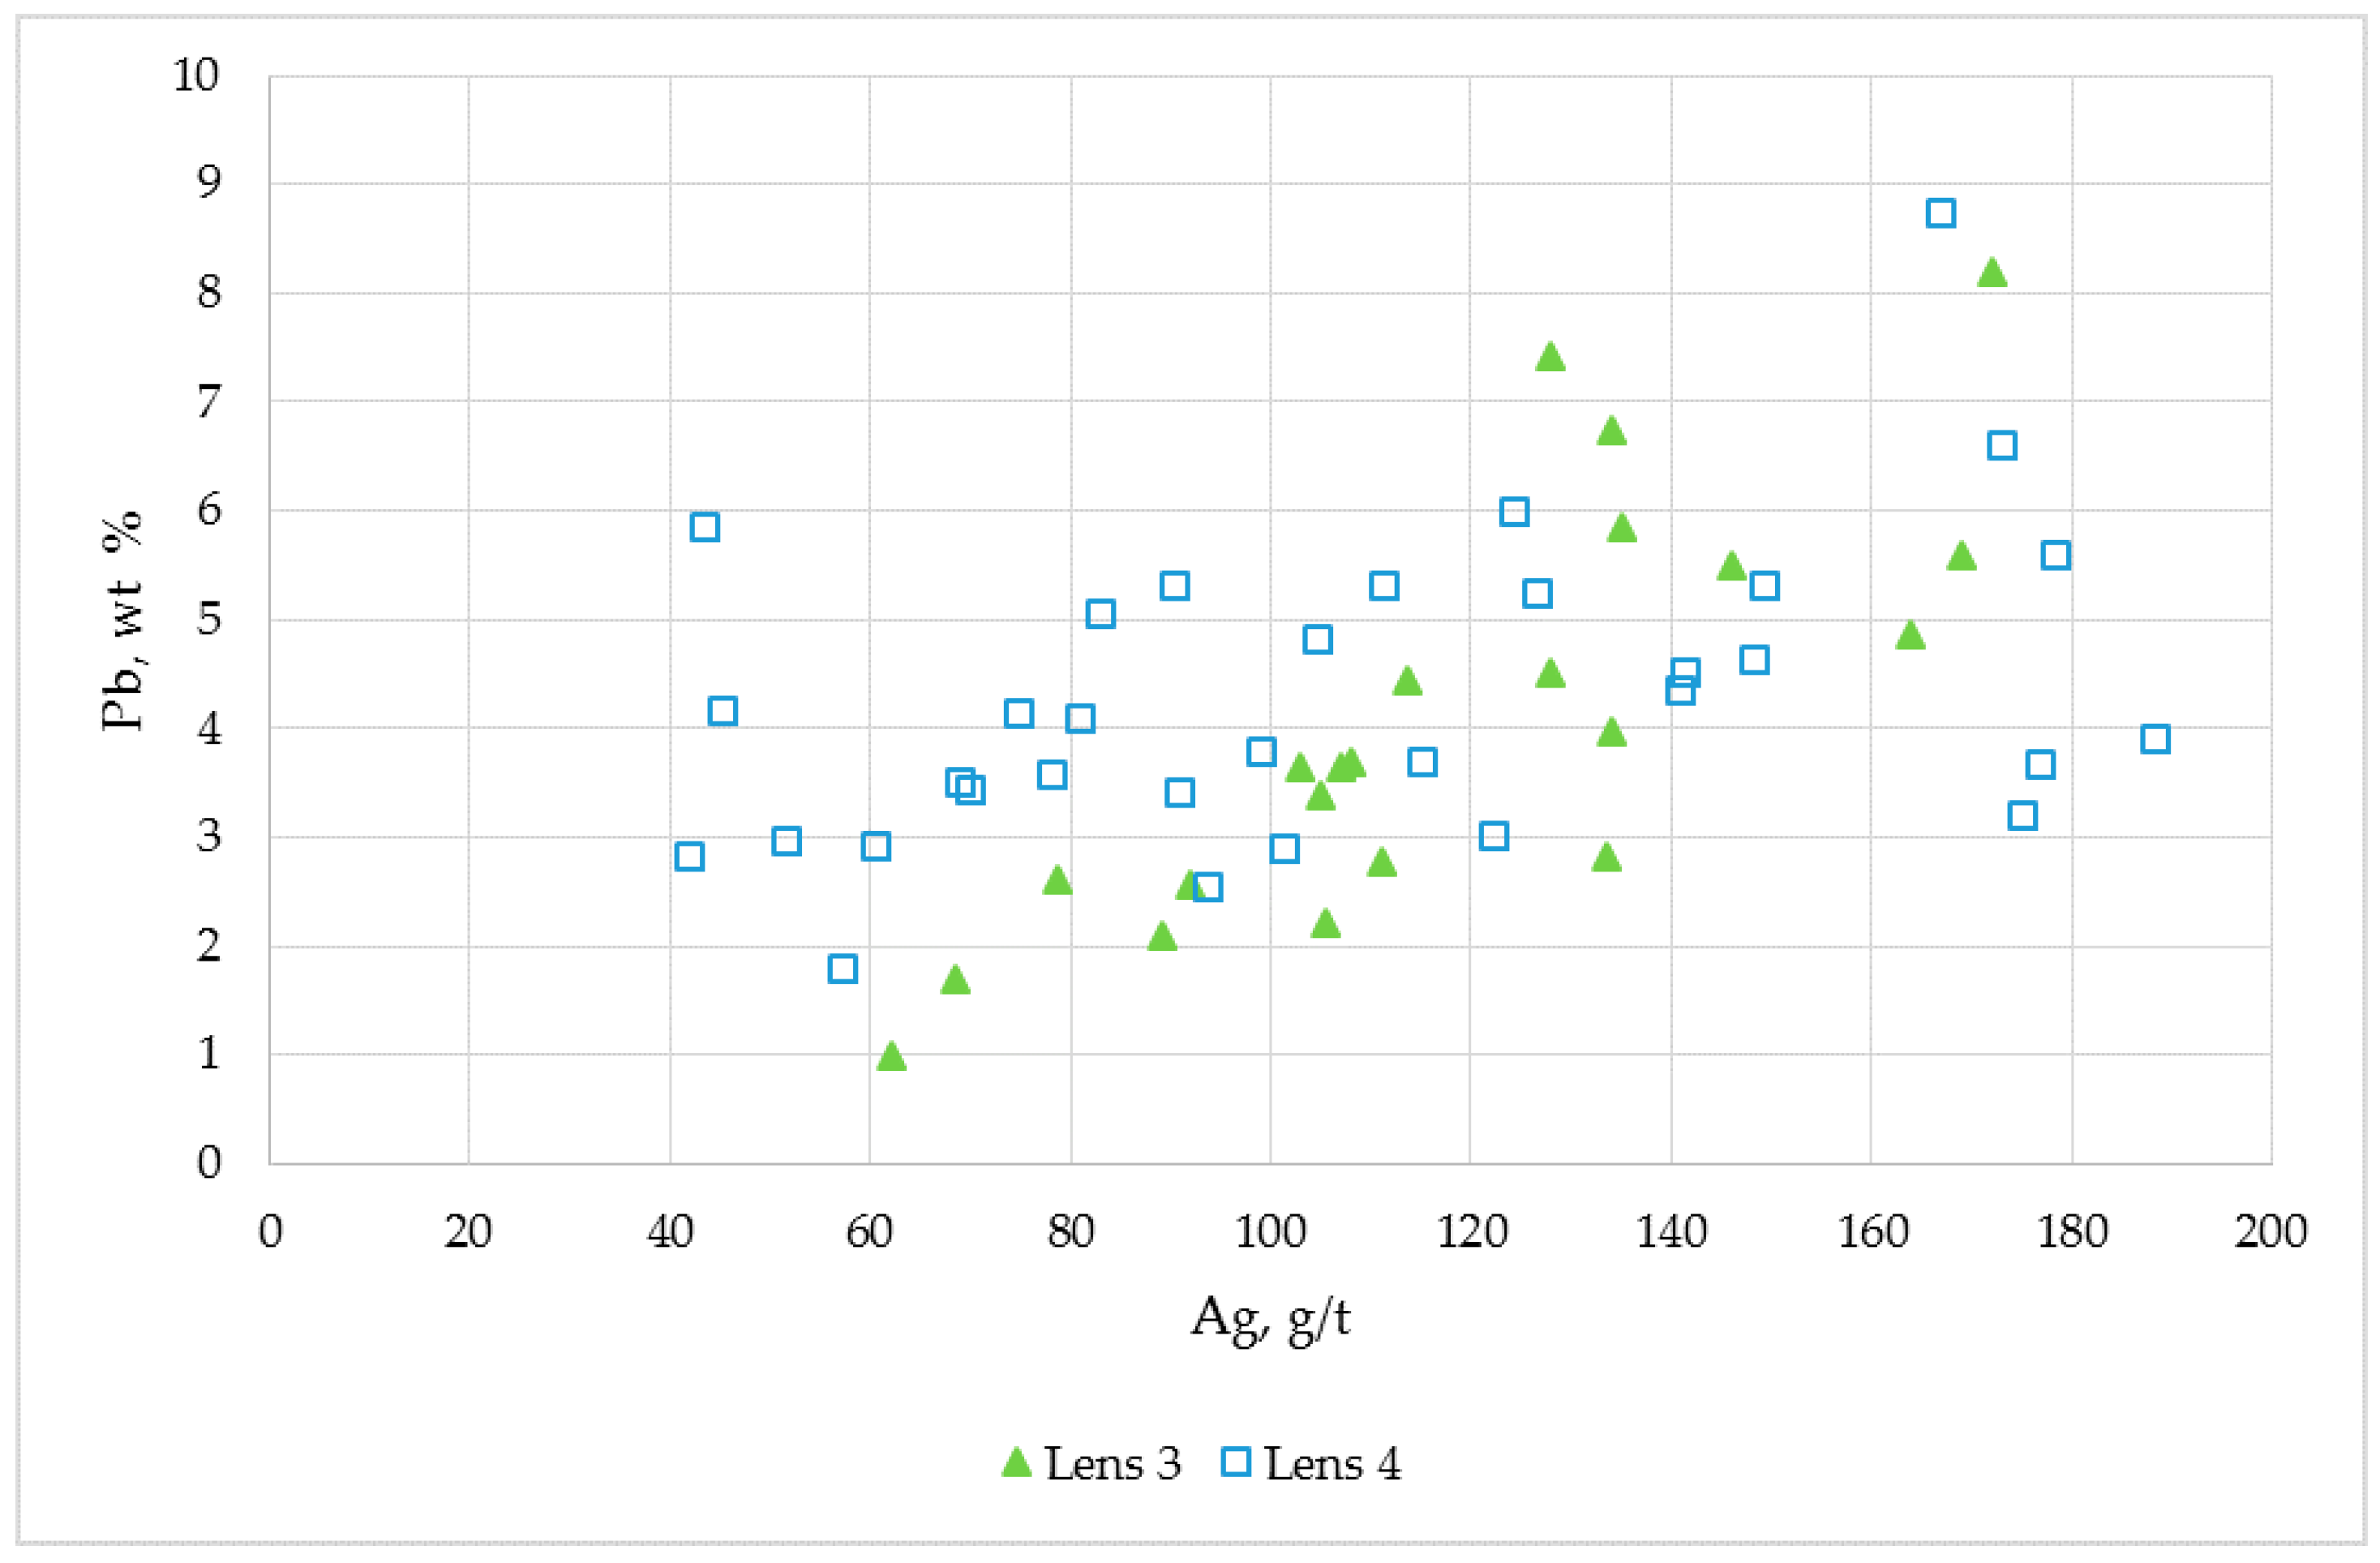

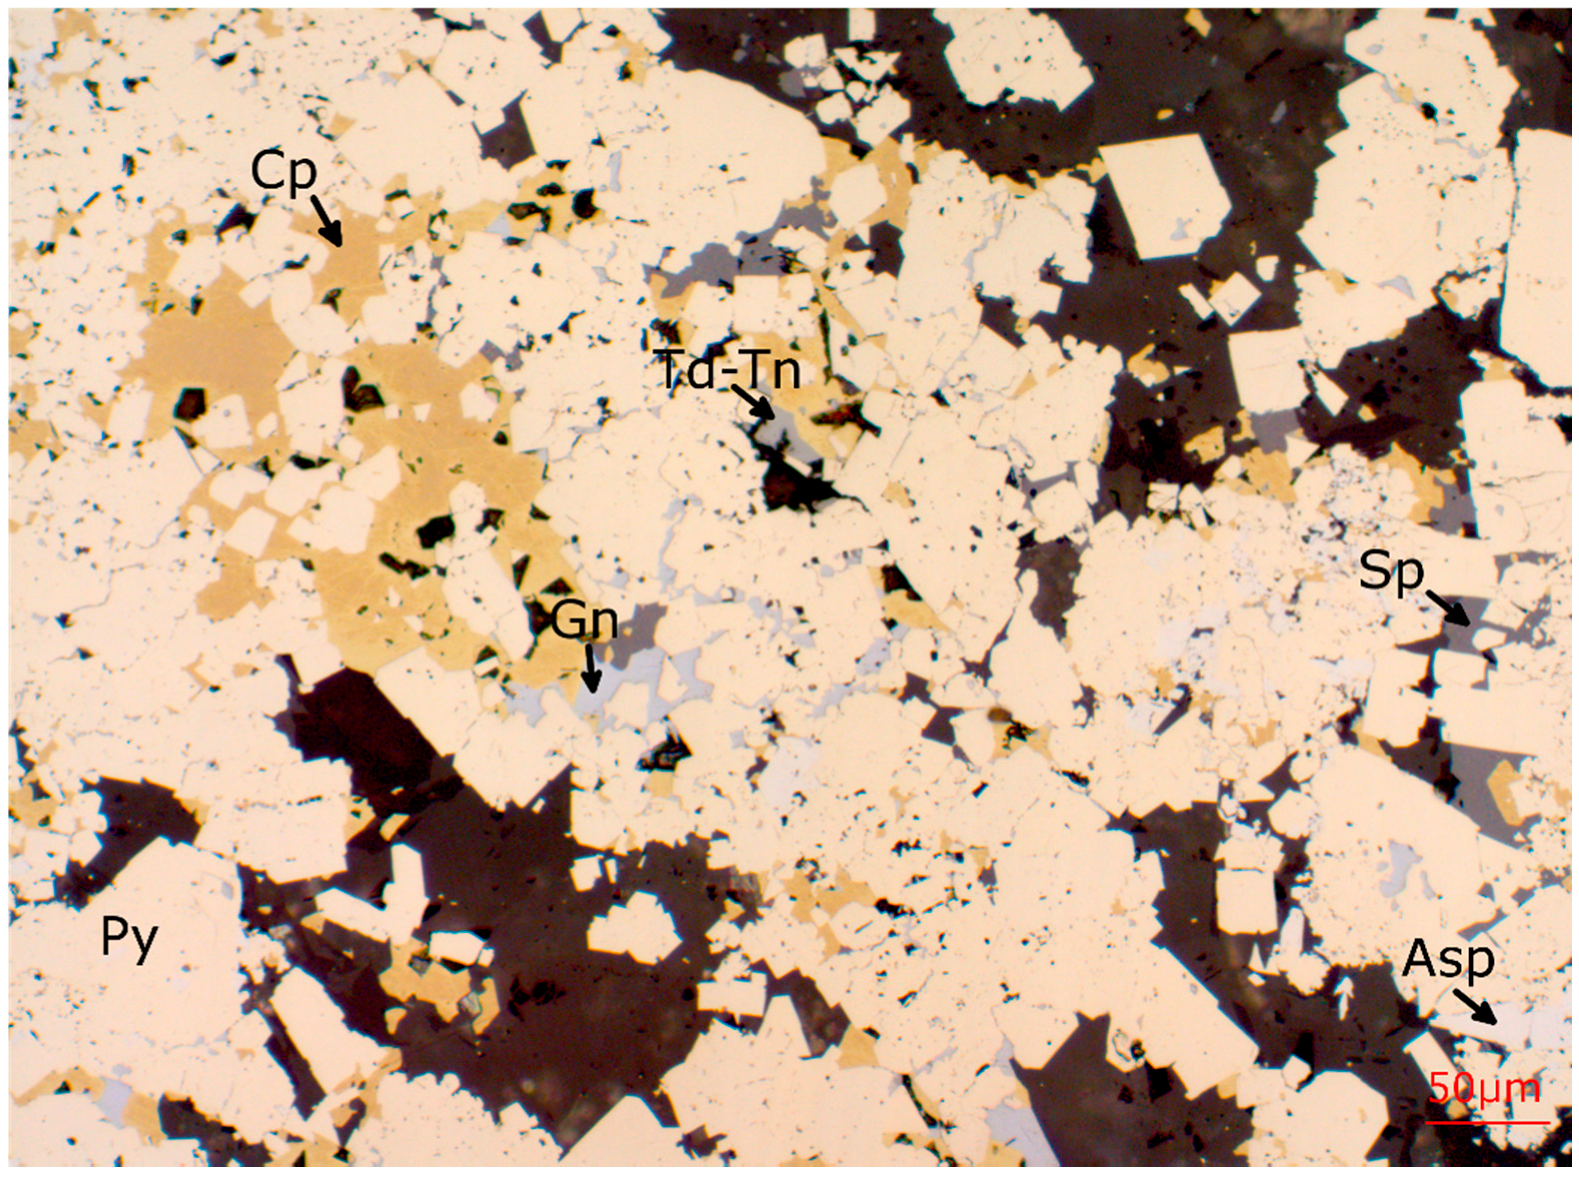
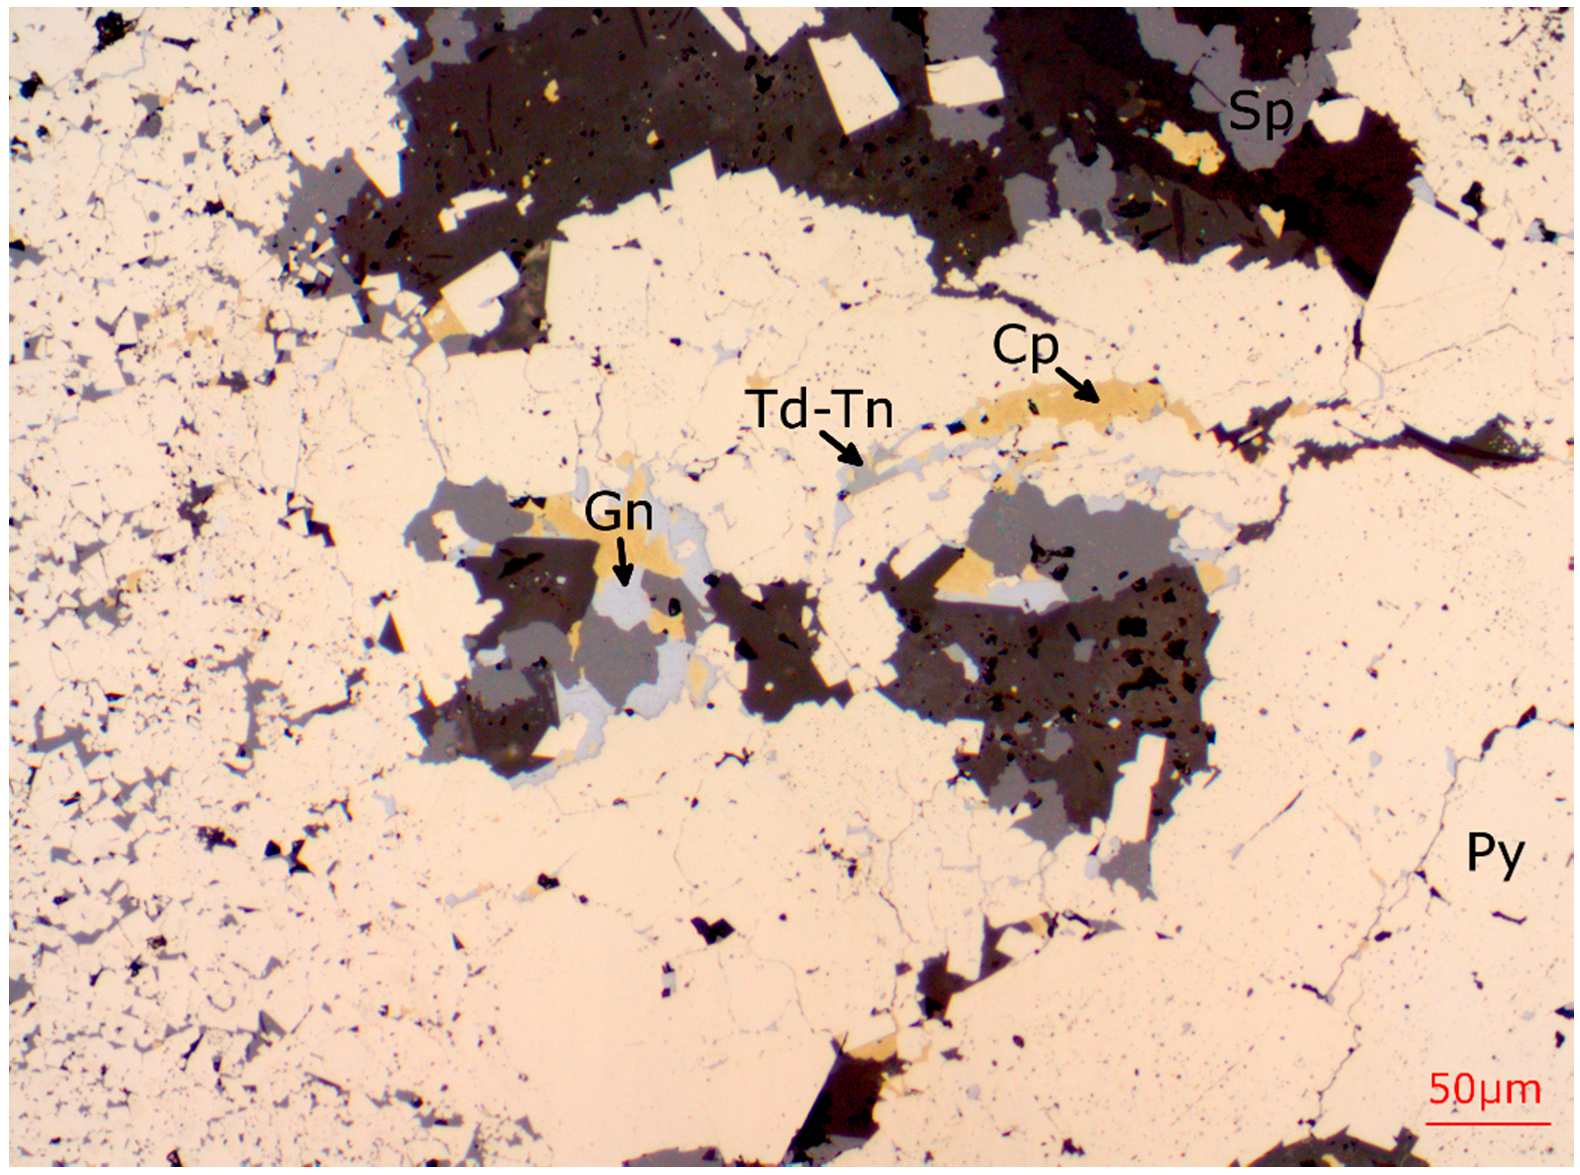
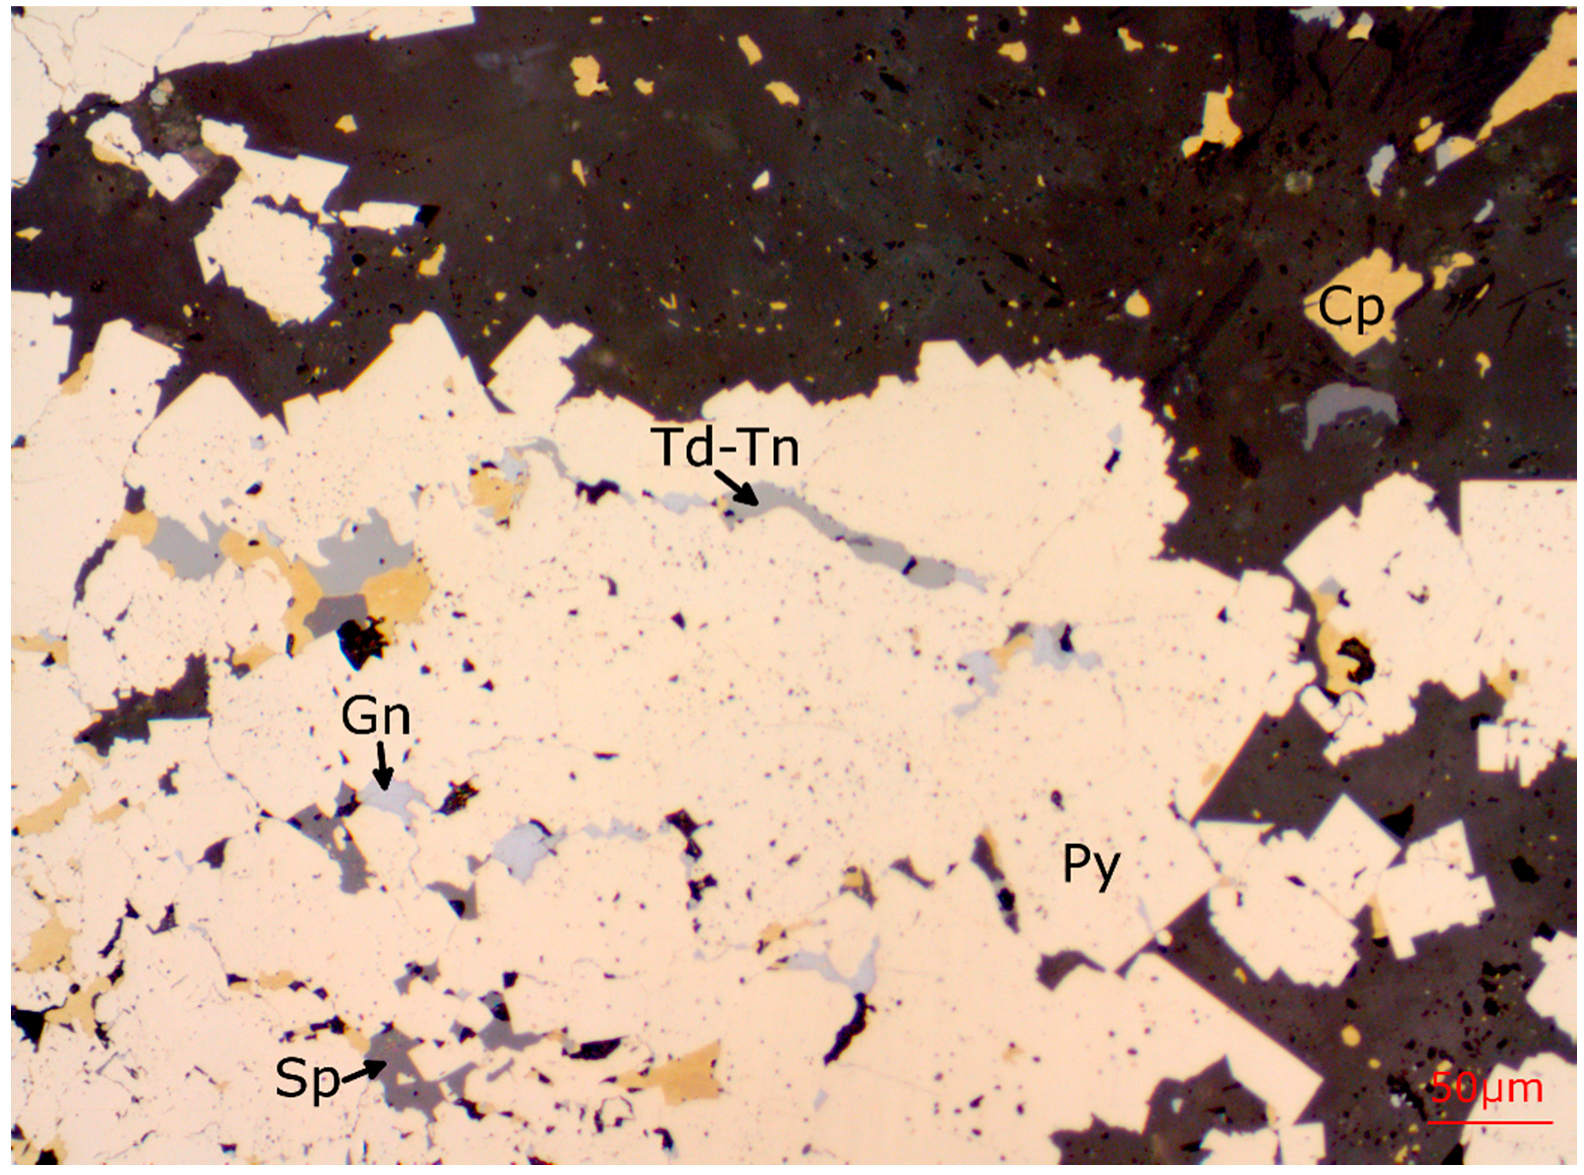
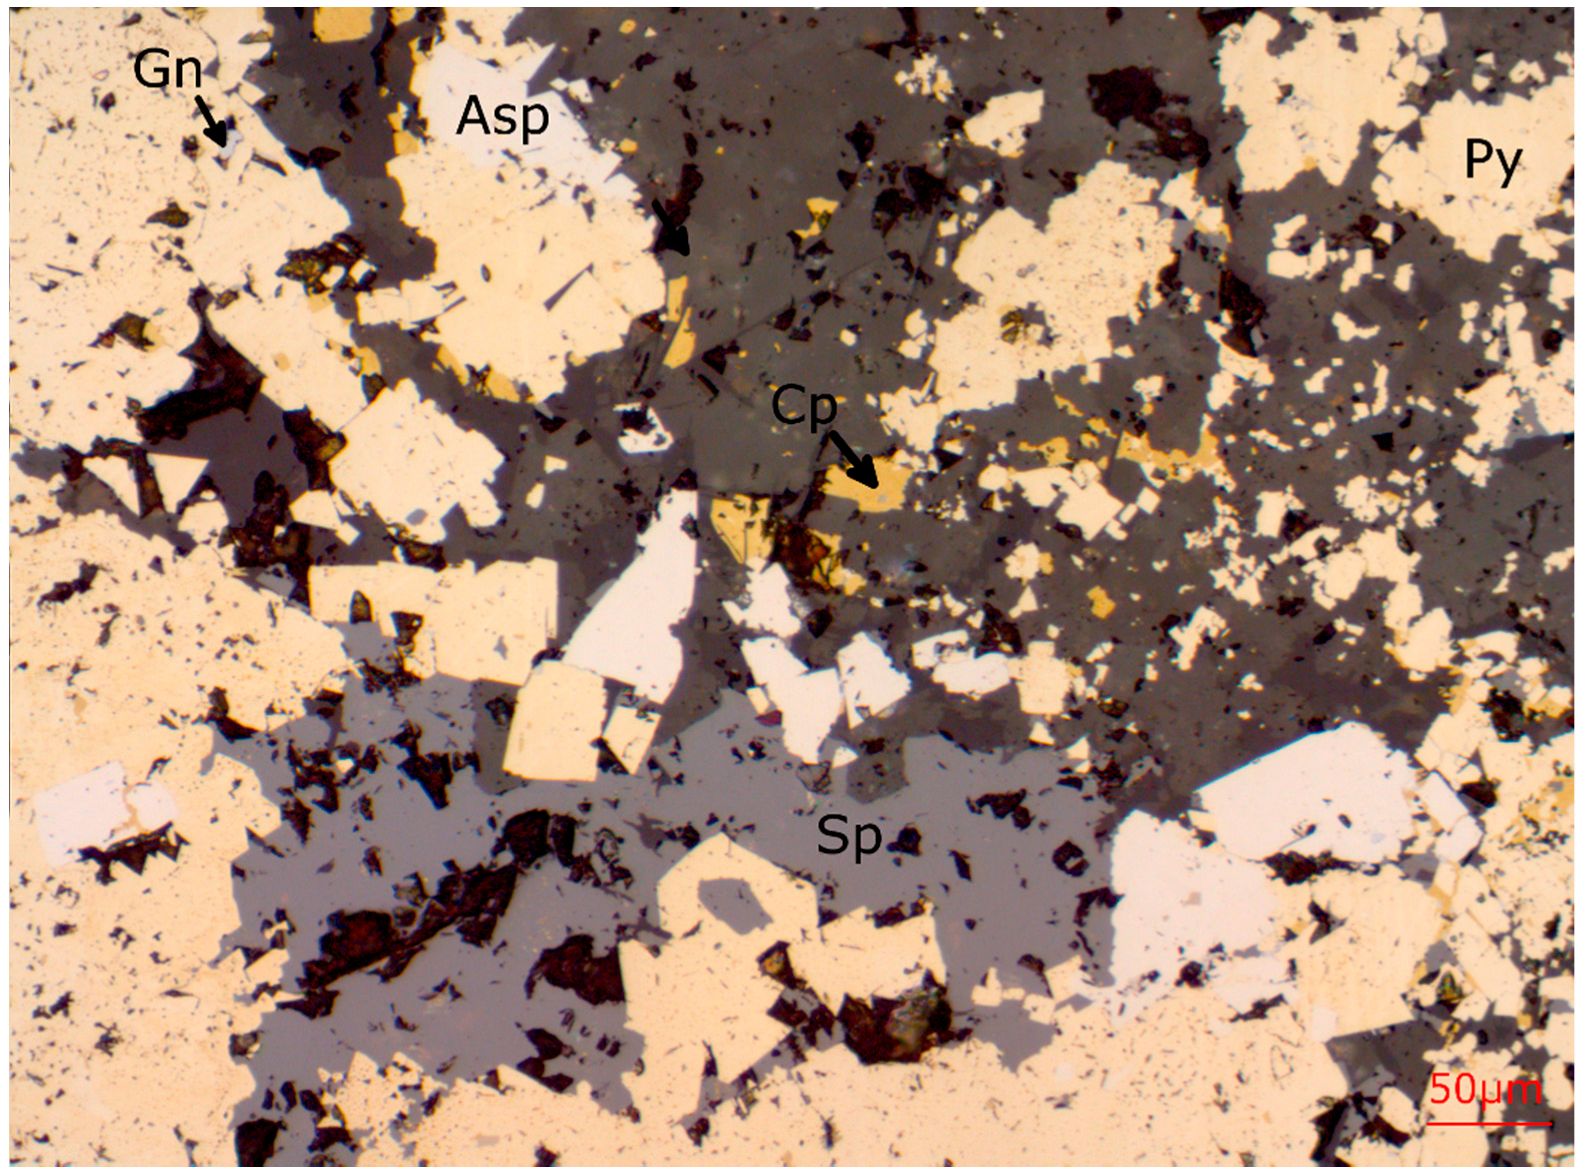
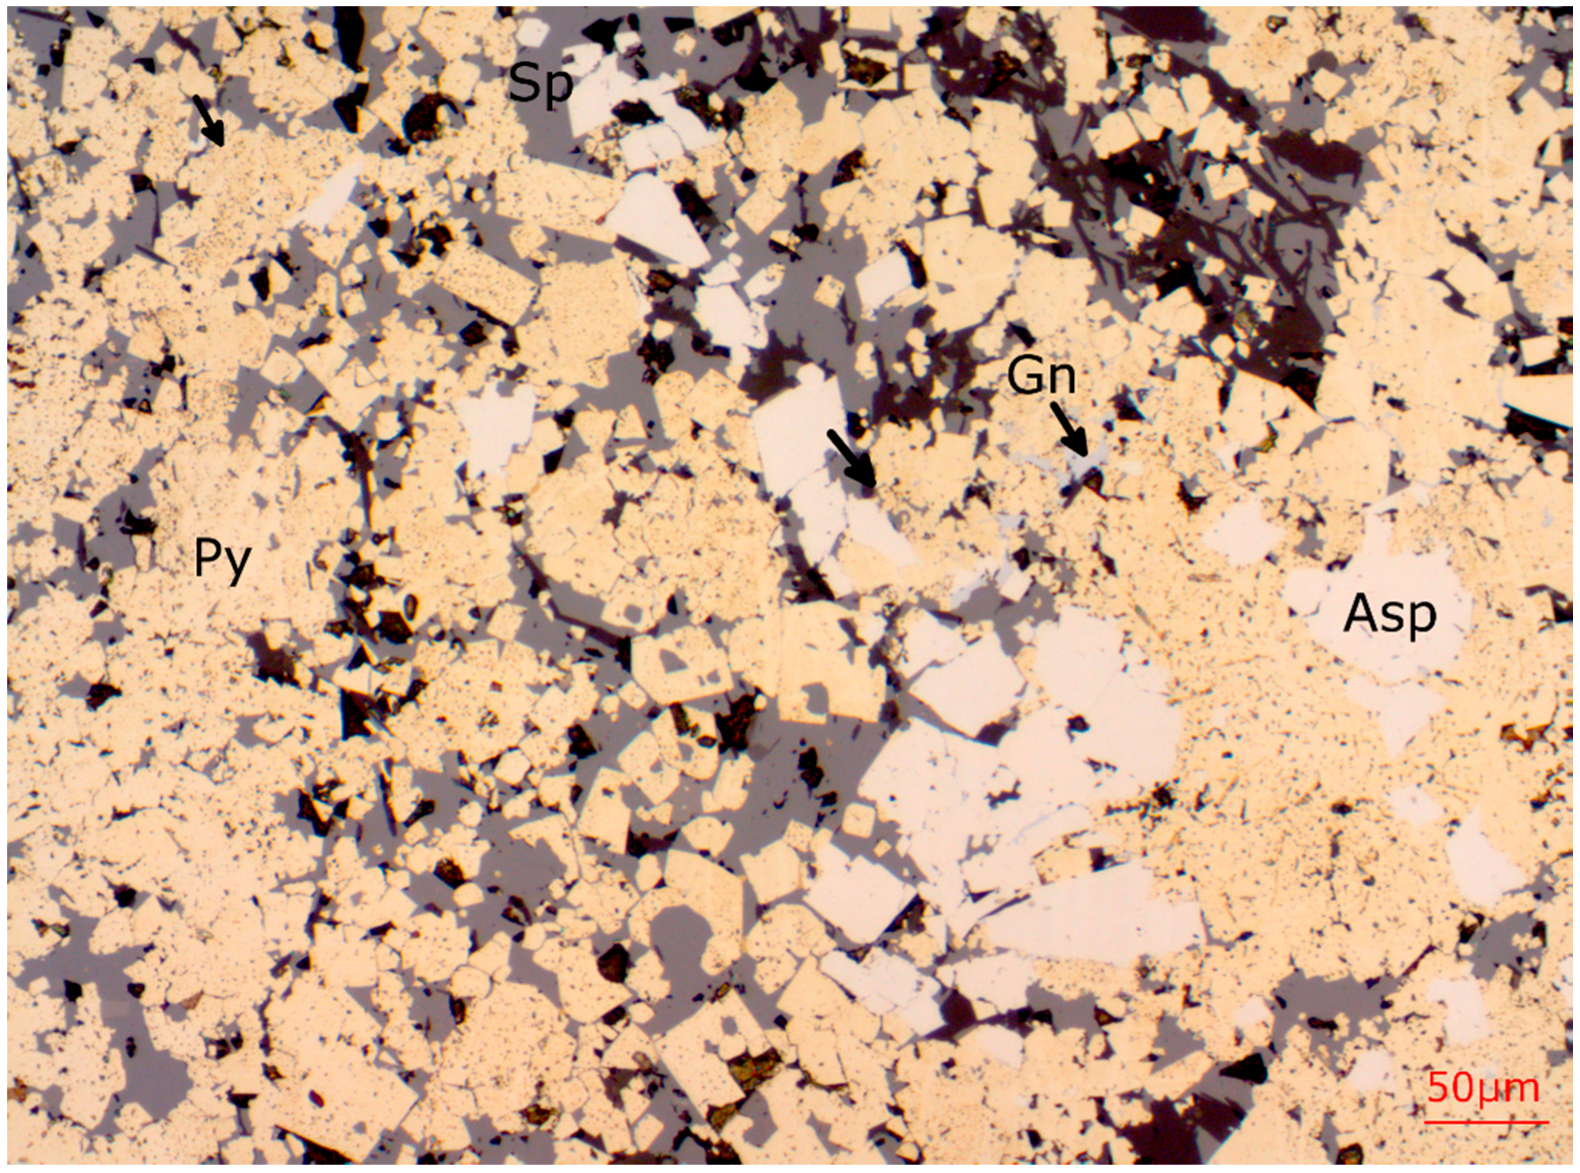
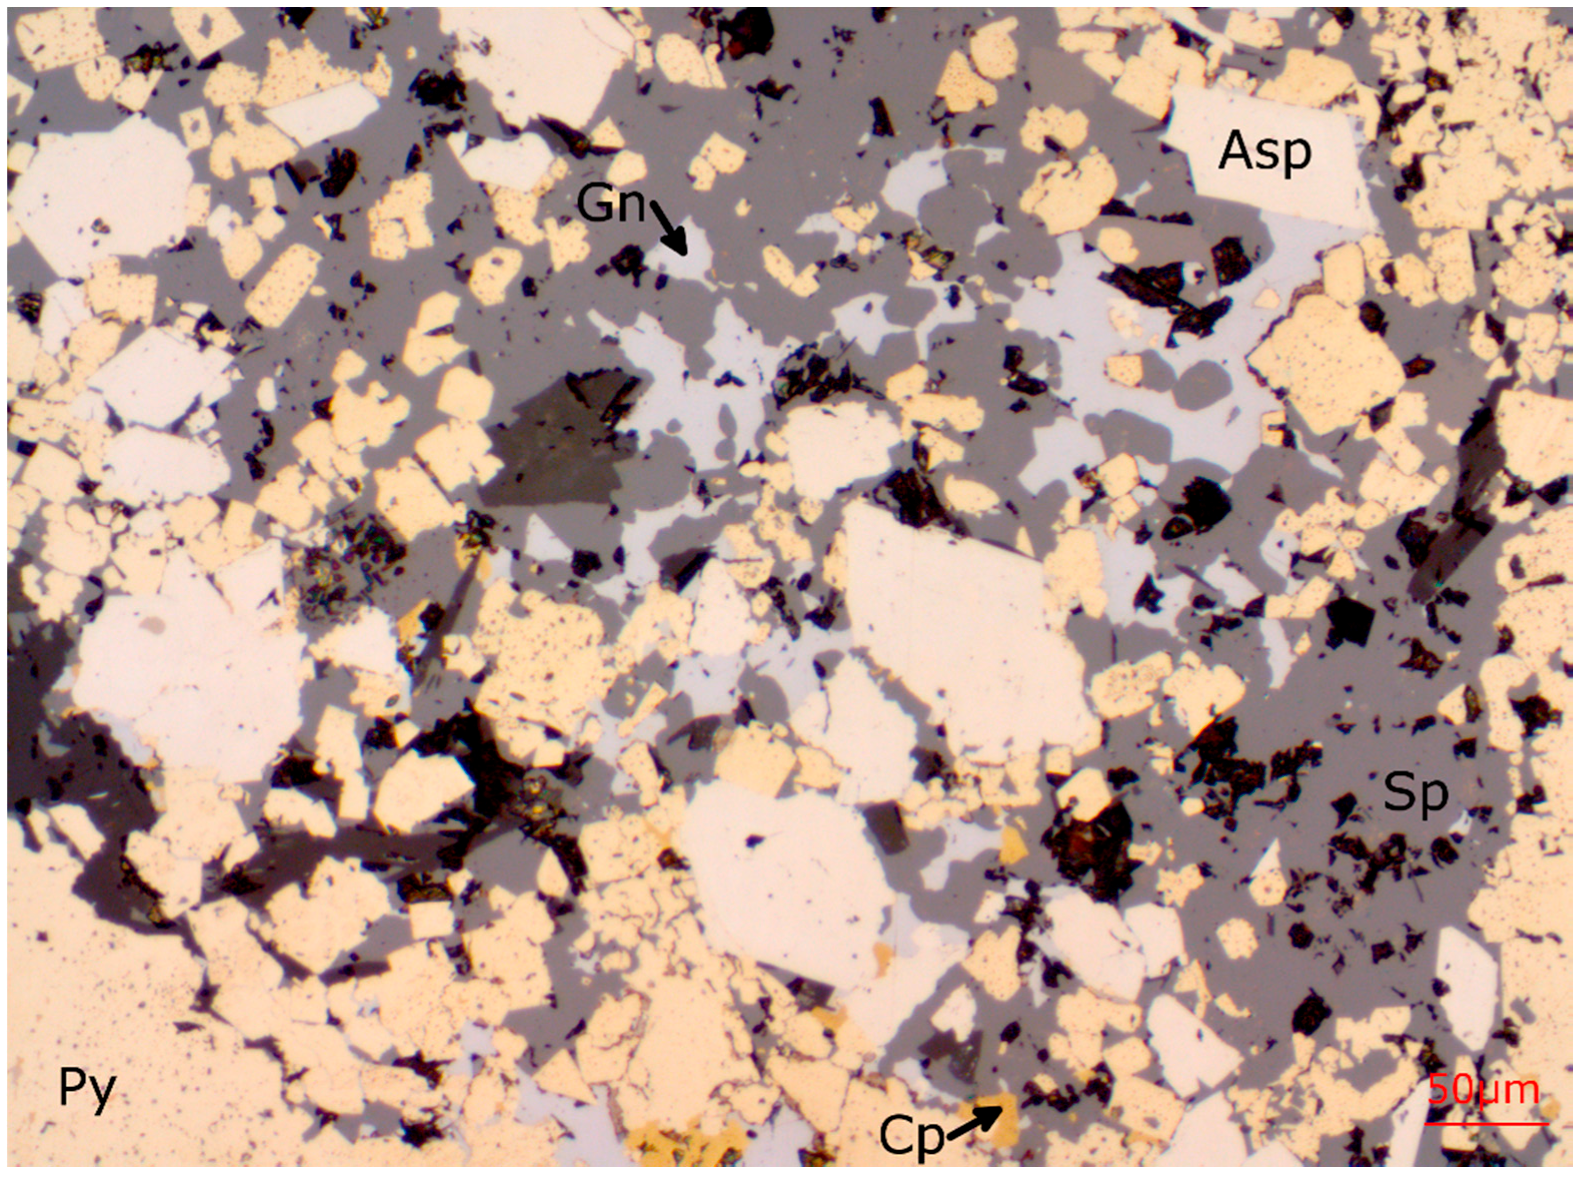