1. Introduction
The lighting industry has undergone great improvements with the advent of the rare earth phosphors. At the end of the life of fluorescent tubes, these phosphors have usually been discarded as waste products after mercury removal [
1]. As waste phosphors have shown an increased environmental burden and pose a significant risk to human health due to the existence of heavy metals, such as mercury and manganese, they have received wide attraction as urban mining resources for extracting rare earth elements (RE), such as yttrium (Y), europium (Eu), cerium (Ce), and terbium (Tb). In 2011, about 4800 million fluorescent lamps were disposed [
2], and the value of rare earths contained in the waste phosphors was more than 1600 million dollars. If these rare earth elements can be recycled and reused efficiently, it will reduce the exploitation of primary rare earth minerals and build the circular-utilization industrial chain of abandoned rare earths, which will greatly help improve the efficient utilization of rare earth resources.
Phosphors are a mixture of red phosphors, blue phosphors, and green phosphors, in which red phosphors are rare earth oxides, which can be decomposed by hydrometallurgical processes, and Y and Eu elements presented in red phosphors can be recovered relatively easily. However, the chemical structures of blue and green powders are in spinel structures [
3,
4], these chemical structures are so stable that they are difficult to destroy with inorganic acids [
5].
Various pyrometallurgical and hydrometallurgical approaches for recovery of Y and Eu from waste phosphors have been reported by many researchers [
6]. Using two steps of liquid–liquid extraction, waste phosphors can be separated into red, green, and blue phosphors [
7]. De Michelis compared different acid leaching systems to study yttrium extraction from waste fluorescent powders, and proved that red phosphors could be dissolved in inorganic acid solution [
8], and using a hydrochloric acid with hydrogen peroxide system, red phosphors could be effectively dissolved by leaching [
9].
It is well known that too many acids and high amounts of energy are consumed in the above process, and highly corrosion-resistant equipment is required. The drawbacks of such a process limit further applications. Chloride metallurgy is emerging as an alternative process, which has been proven to be more efficient and cheaper for the extraction and used to refine precious, base, and refractory metals [
10,
11]. Up to now, few studies have been conducted to recover rare earth elements from waste phosphors by chlorination roasting, however, this method is particularly well-suited for the recovery of valuable metals in mineral processing. Rare earth elements can be recovered by using ammonium chloride roasting with a fluorine deactivation process [
12]. By selective chlorination roasting, the valuable metals can be recovered from a spent nickel-metal hydride battery [
13]. Yan et al. extracted lithium from lepidolite using chlorination roasting and water leaching processes [
14]. In these processes, NH
4Cl decomposes into gaseous HCl under heating, and the produced gaseous HCl reacts with the rare earth oxide to form a rare earth chloride (RECl
3), which can be easily leached out of the minerals using water [
15]. In this study, the ammonium chloride roasting technique, followed by a water leaching process was applied to the recovery of Y and Eu elements from waste phosphors.
2. Materials and Methods
2.1. Materials
The waste phosphors used were mercury-free waste phosphors supplied by a Peiyuan Lighting Materials Co., Ltd. (Jiangzhou, China). The composition of the samples was analyzed by X-ray fluorescence (XRF) and the results are shown in
Table 1, indicating that the total content of rare earth elements is 22.93%—including Y, Eu, Ce, and Tb. Content of Si is 24.97% which is much higher than expected for the phosphors, which is probably due to a certain amount of Si from the fluorescent tubes.
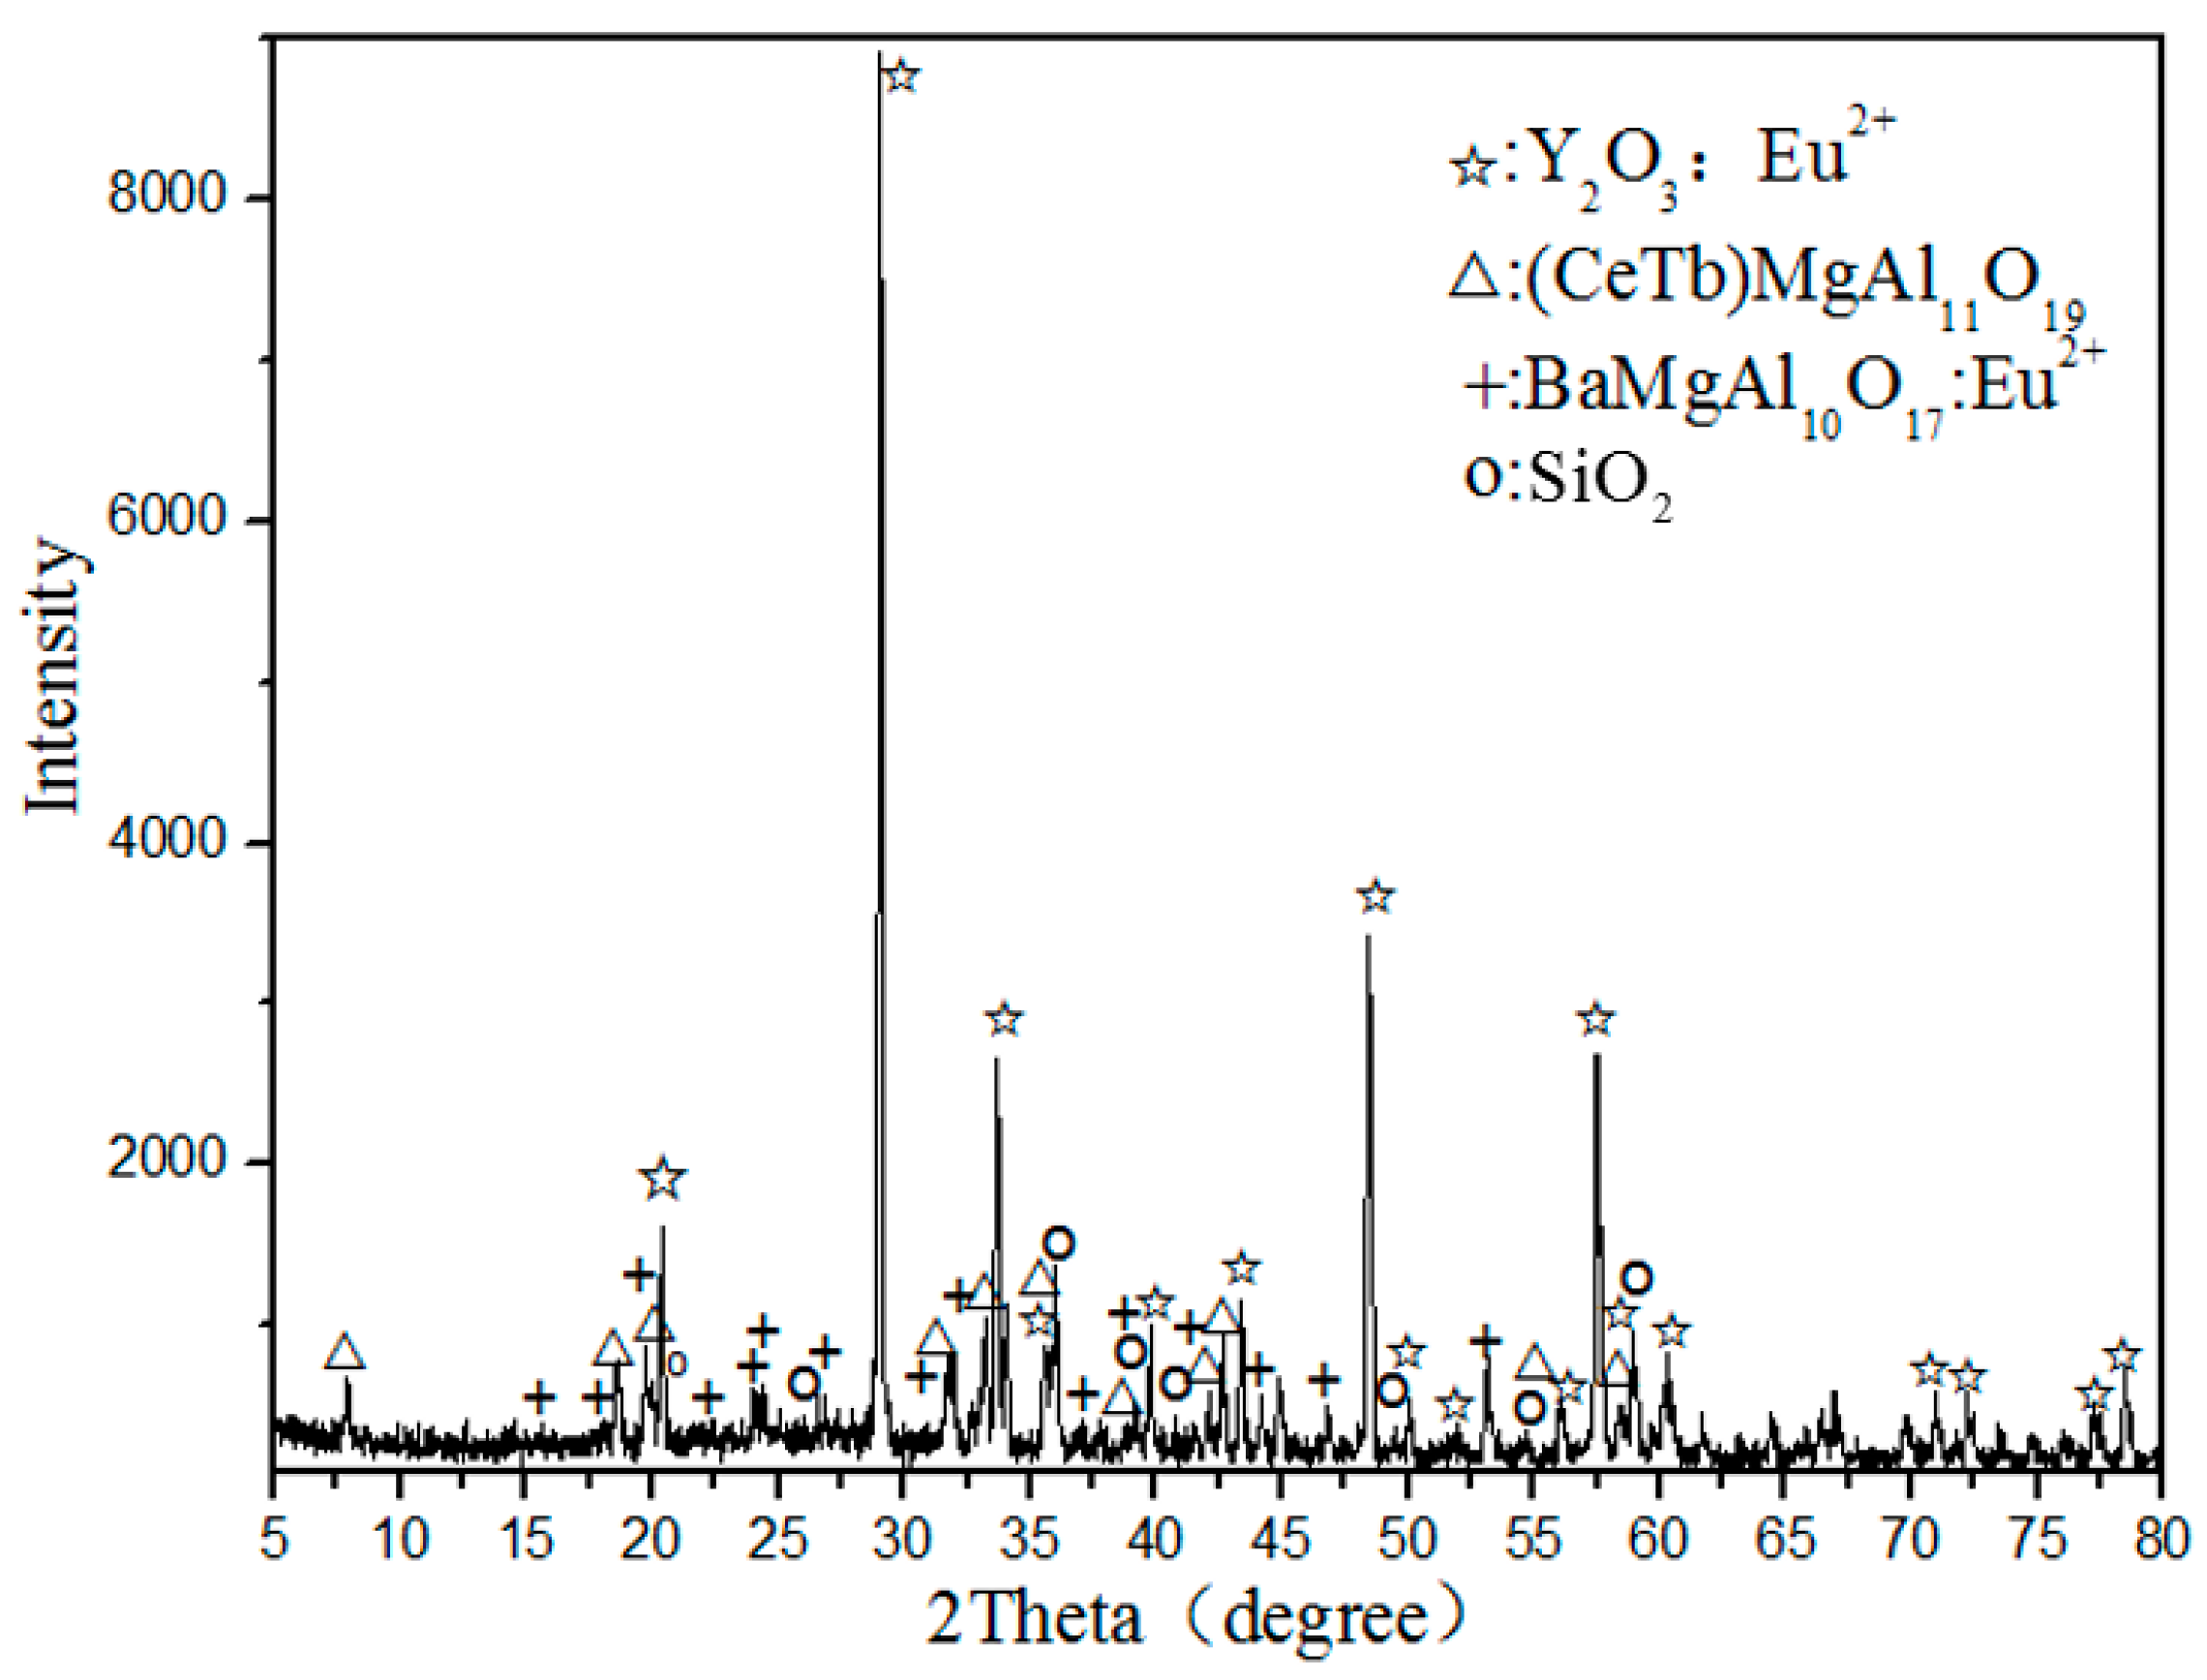
Figure 1 shows the X-ray diffraction (XRD) analysis of waste phosphors, indicating that the main crystalline phases of samples are Y
2O
3: Eu
3+ (red phosphor), (CeTb)MgAl
11O
19 (green phosphor), BaMgAl
10O
17:Eu
2+ (blue phosphor), and SiO
2 (quartz).
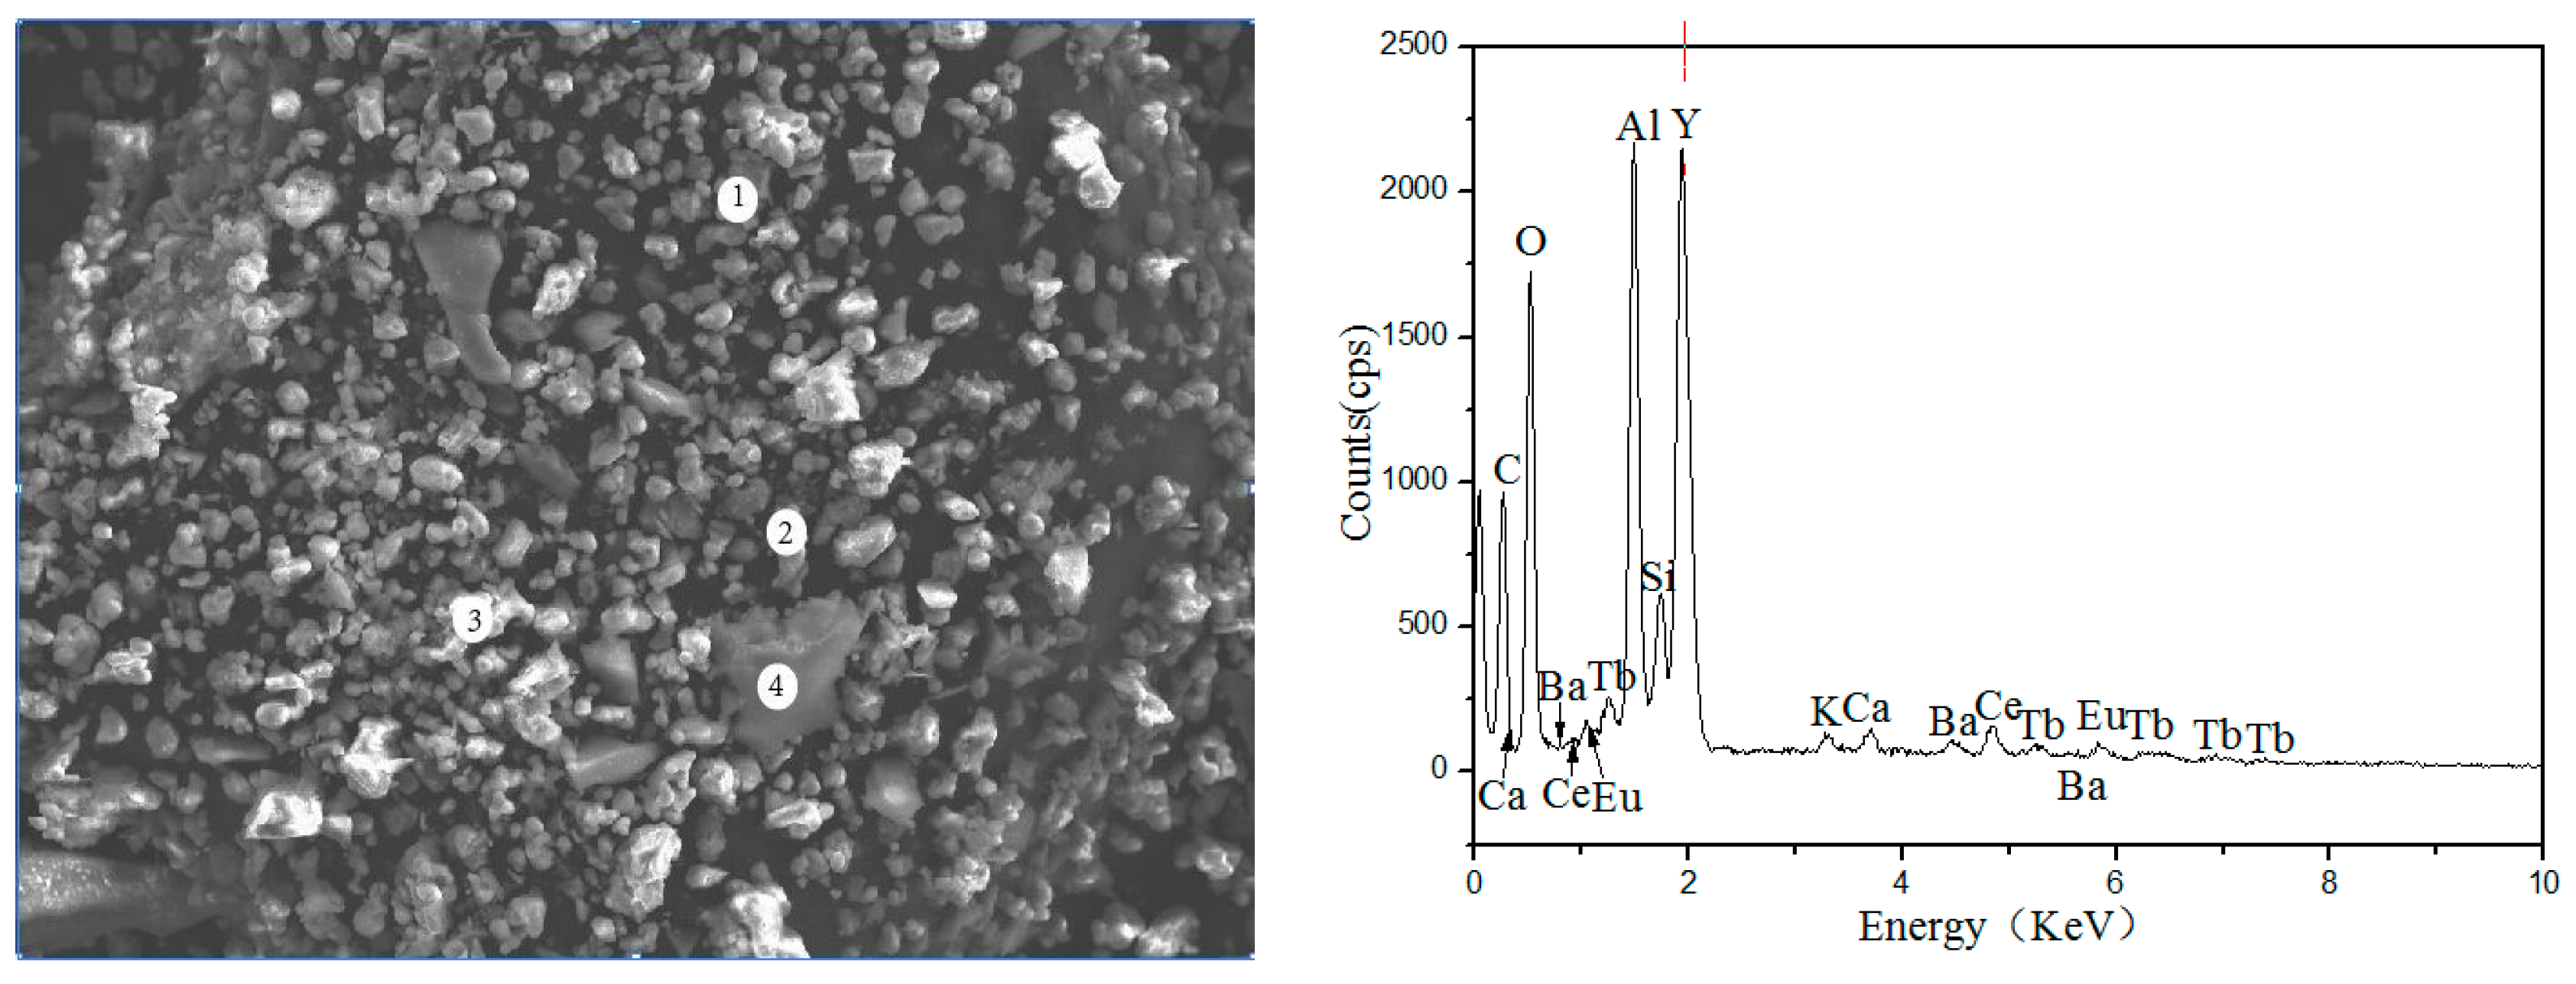
Figure 2 and
Table 2 show the Scanning Electron Microscope-Energy Dispersive Spectrometer (SEM-EDS) image of waste phosphors, in which the large granular particles are fragments of fluorescent tubes (Point-4), the elements presented in these particles were mainly Si and O, the bright particles were red phosphors (Point-3), the main elements were Y and O, Point-1 and Point-2 were blue and green phosphors; the main elements were O, Al, etc.
2.2. Methods
2.2.1. Roasting and Leaching of Waste Phosphors
For each test, 20 g of waste phosphors were well mixed with ammonium chloride, placed into a crucible, placed over a muffle burner, and heated at 250–500 °C for 30–120 min. Next, deionized water was carefully added to the crucible with a solid-to-liquid ratio of 1:10. Then, the materials in the crucible were magnetically stirred for 10 min at 25 °C, and the leach solution was then separated from the residue by filtration using a vacuum pump and a filter. The residue was washed a few times with deionized water and dried in a drying oven, and characterized by XRD and SEM-EDS. The leach solution was analyzed by Inductively Coupled Plasma Optical Emission Spectrometer (ICP-OES) to calculate the leaching rate of Y and Eu. There is a vent hole in the top of the muffle burner, and the ammonia gas generated in this process escapes via the vent hole, and then is introduced into a container with a diluted hydrochloric acid solution, and converted into an ammonium chloride solution. Such treatment minimizes possible environmental issues and has the potential for possible reuse of the ammonium chloride solution in the process.
2.2.2. Extraction of Rare Earth Elements
The pH of the leach solution was adjusted by continuously adding a Na2S and NH3·H2O solution. With the increasing pH, the impurities can be precipitated gradually. The precipitated product was separated by filtration. The leach solution was added to the oxalate solution to precipitate Y and Eu ions, and the pH values were adjusted by adding HCl or NH3·H2O solution. The precipitation process lasted for 4 h at 80 °C, and then the precipitated product was filtered, dried, and roasted at 800 °C for 2 h, with the final mixed rare earth oxides (REOs) obtained.
2.3. Reagents and Equipment
X-ray fluorescence analysis (XRF) was conducted using an AXIOS system (PANalytical. B.V, Co., Ltd., Ea Almelo, The Netherlands), and X-ray diffraction (XRD) analysis was measured with an RU-200B (Rigaku Co., Ltd., Tokyo, Japan). The pH meter used was an HM-40V (TOA Denpa Togyo, Co., Ltd., Tokyo, Japan). Prodigy 7 (Leeman Labs Inc., Hudson, NH, USA) was used to conduct the Inductively Coupled Plasma Optical Emission Spectrometer (ICP-OES) analysis. Scanning Electron Microscope/Energy Dispersive Spectroscopy (SEM-EDS) analysis was carried out on a Zeiss Ultra Plus (Carl Zeiss AG, Oberkochen, Germany). The muffle burner with vent hole was supplied by Guoju Industry, Co., Ltd., Luoyang, China (GWL-1600LB).
As for chlorination roasting–water leaching process, ammonium chloride (NH4Cl) was used as the chlorinating agent, HCl and NH3·H2O as pH regulators. All chemicals were first grade reagents and distilled water was used for all solutions.
3. Results and Discussion
3.1. Effect of Roasting Temperatures and Time on the Leaching Rate of Y and Eu
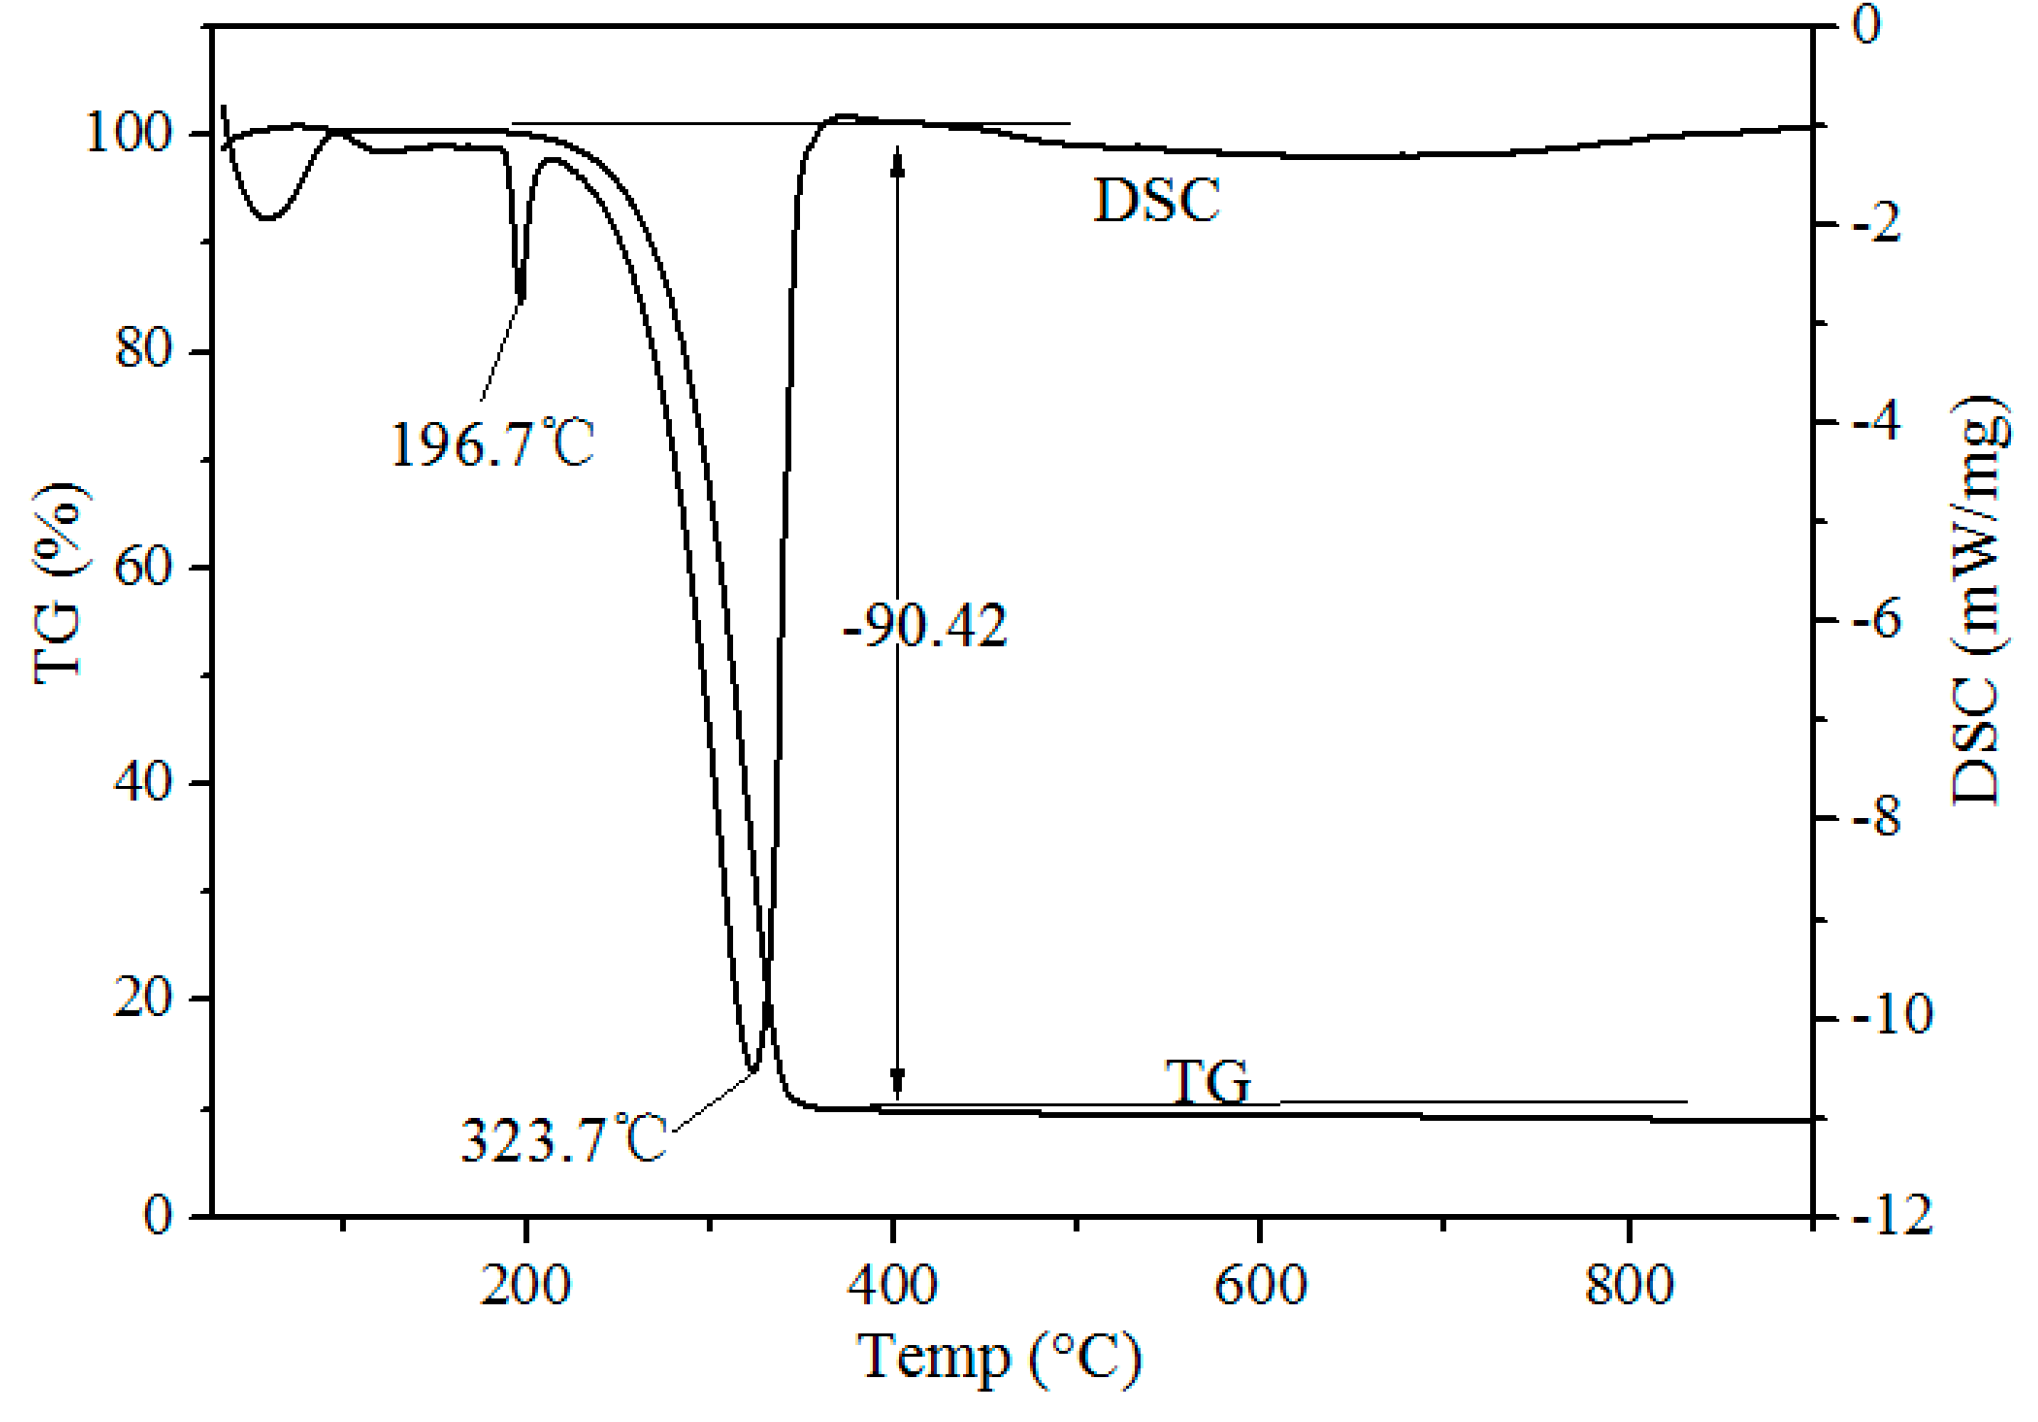
Thermogravimetric-Differential Scanning calorimeter (TG-DSC) curves of waste phosphors mixed with NH
4Cl on a mass ratio of 1:4 after chlorination roasting at atmospheric pressure are shown in
Figure 3. Two endothermic peaks at 196.7 and 323.7 °C were observed in the DSC curve. The endothermic peak at 193.1 °C was due to the release of adsorbed water of NH
4Cl. The endothermic peak at 323.7 °C was due to the decomposition of the NH
4Cl shown in Formula (1). During the roasting process, HCl is in the form of gas, generated from the decomposition of ammonium chloride, and waste phosphors react with HCl to form rare earth chlorides (Formula (2)). TG and DSC curves indicate that chlorination roasting temperature is an important factor in determining the metal leaching efficiency.
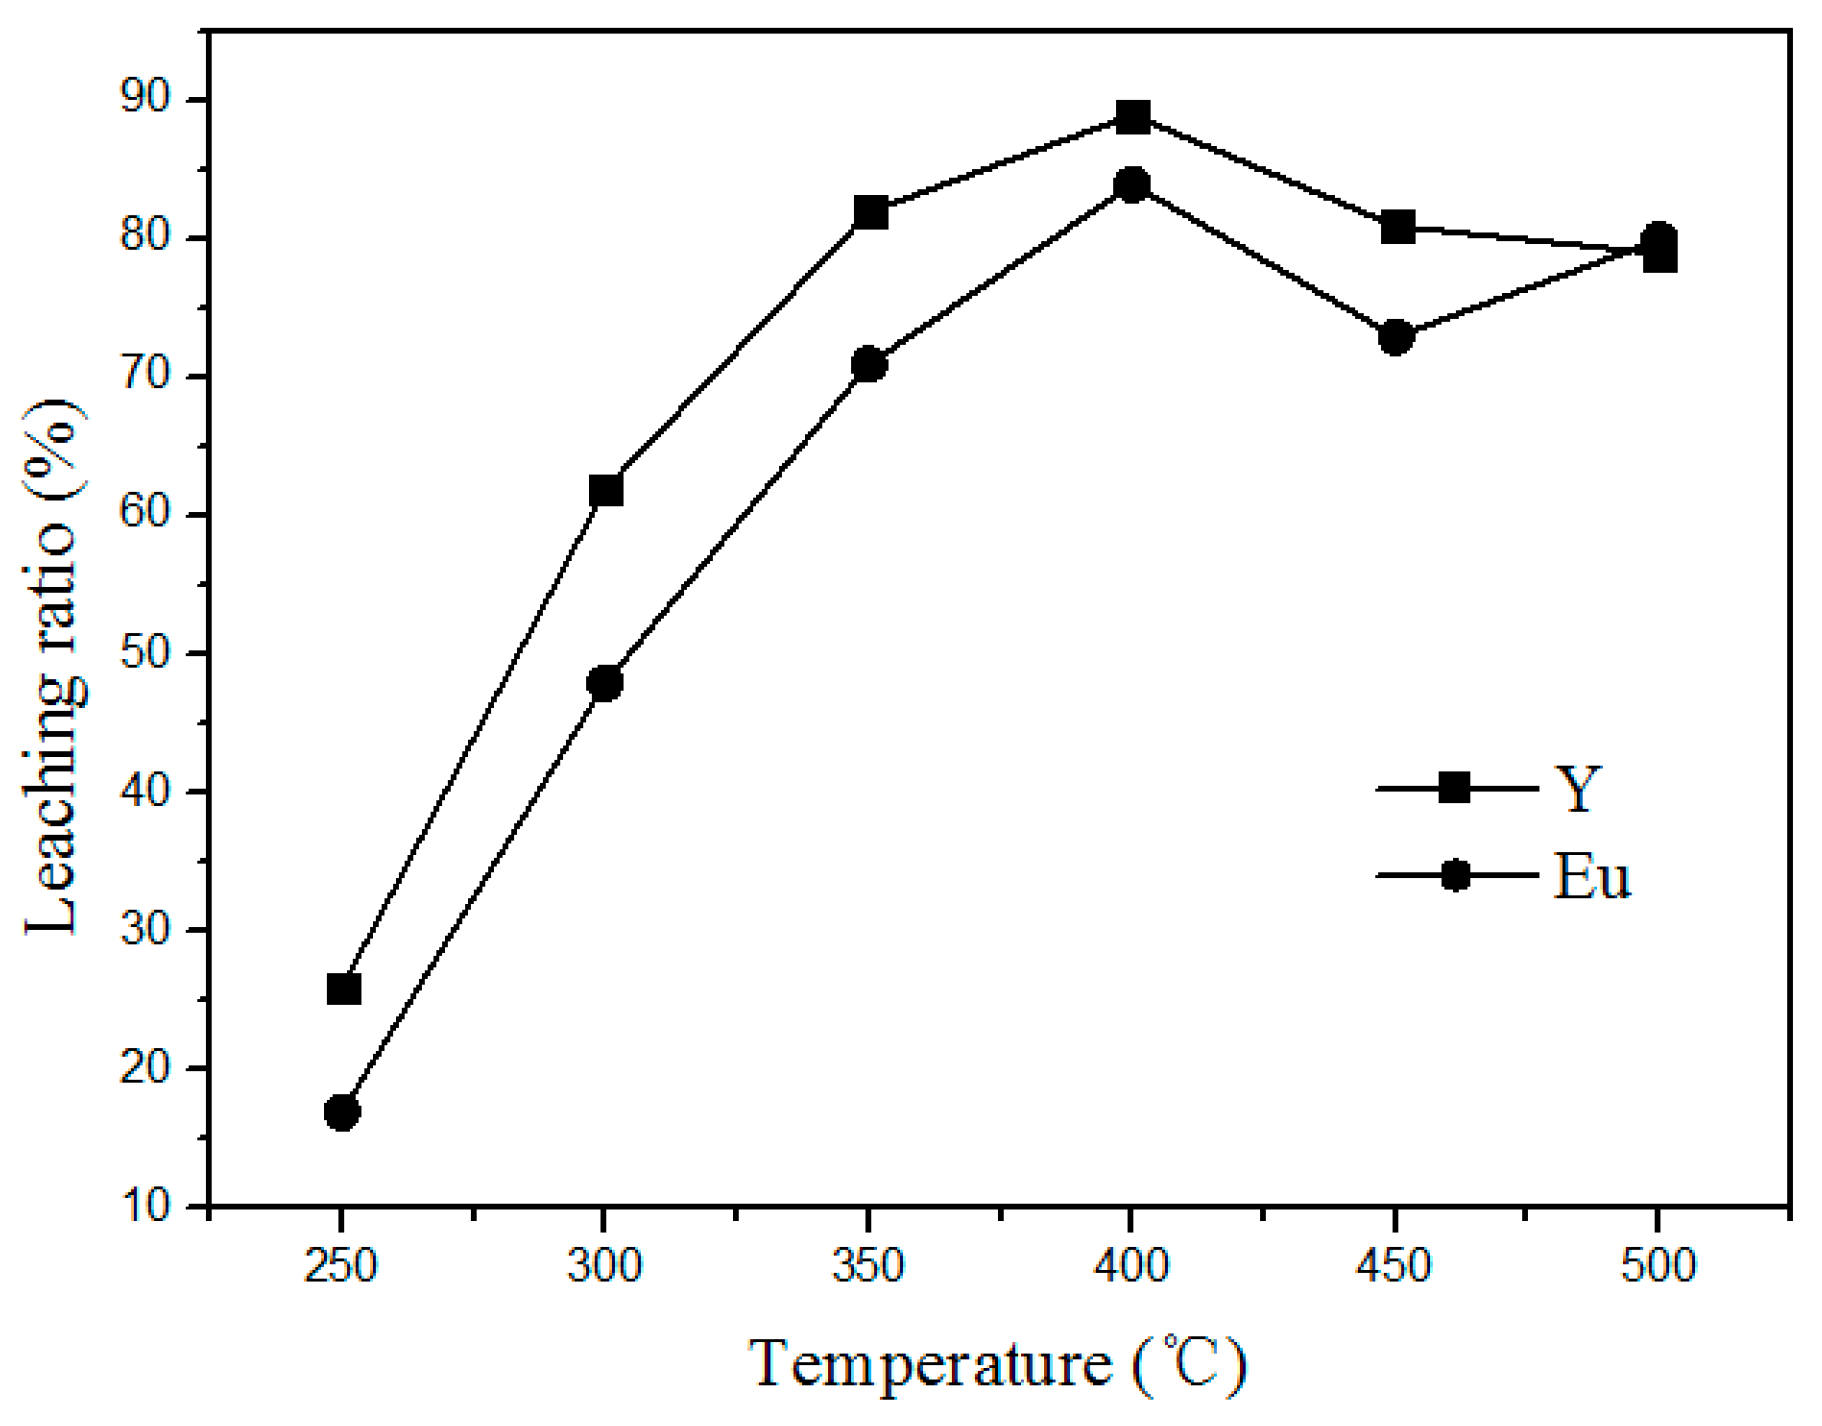
The effect of chlorination roasting temperature on the leaching rate of Y and Eu from waste phosphors was carried out at a mass ratio of 1:4 (waste phosphors to NH
4Cl) for 90 min. Related results are shown in
Figure 4. It shows that the Y and Eu leaching efficiency increases rapidly from a low value at 250 °C to the maximum at 400 °C. As expected, high temperature promotes the decomposition of waste phosphors. However, above 400 °C, leaching ratios clearly decrease because the reaction shown in Formula (1) becomes vigorous, leading to the significant generation of HCl into the air, decreasing the amount of HCl for phosphor decomposition. Moreover, the higher quantity of HCl generated also causes severe environmental pollution. To decrease energy consumption and avoid air pollution, roasting temperature should be controlled within 400 °C.
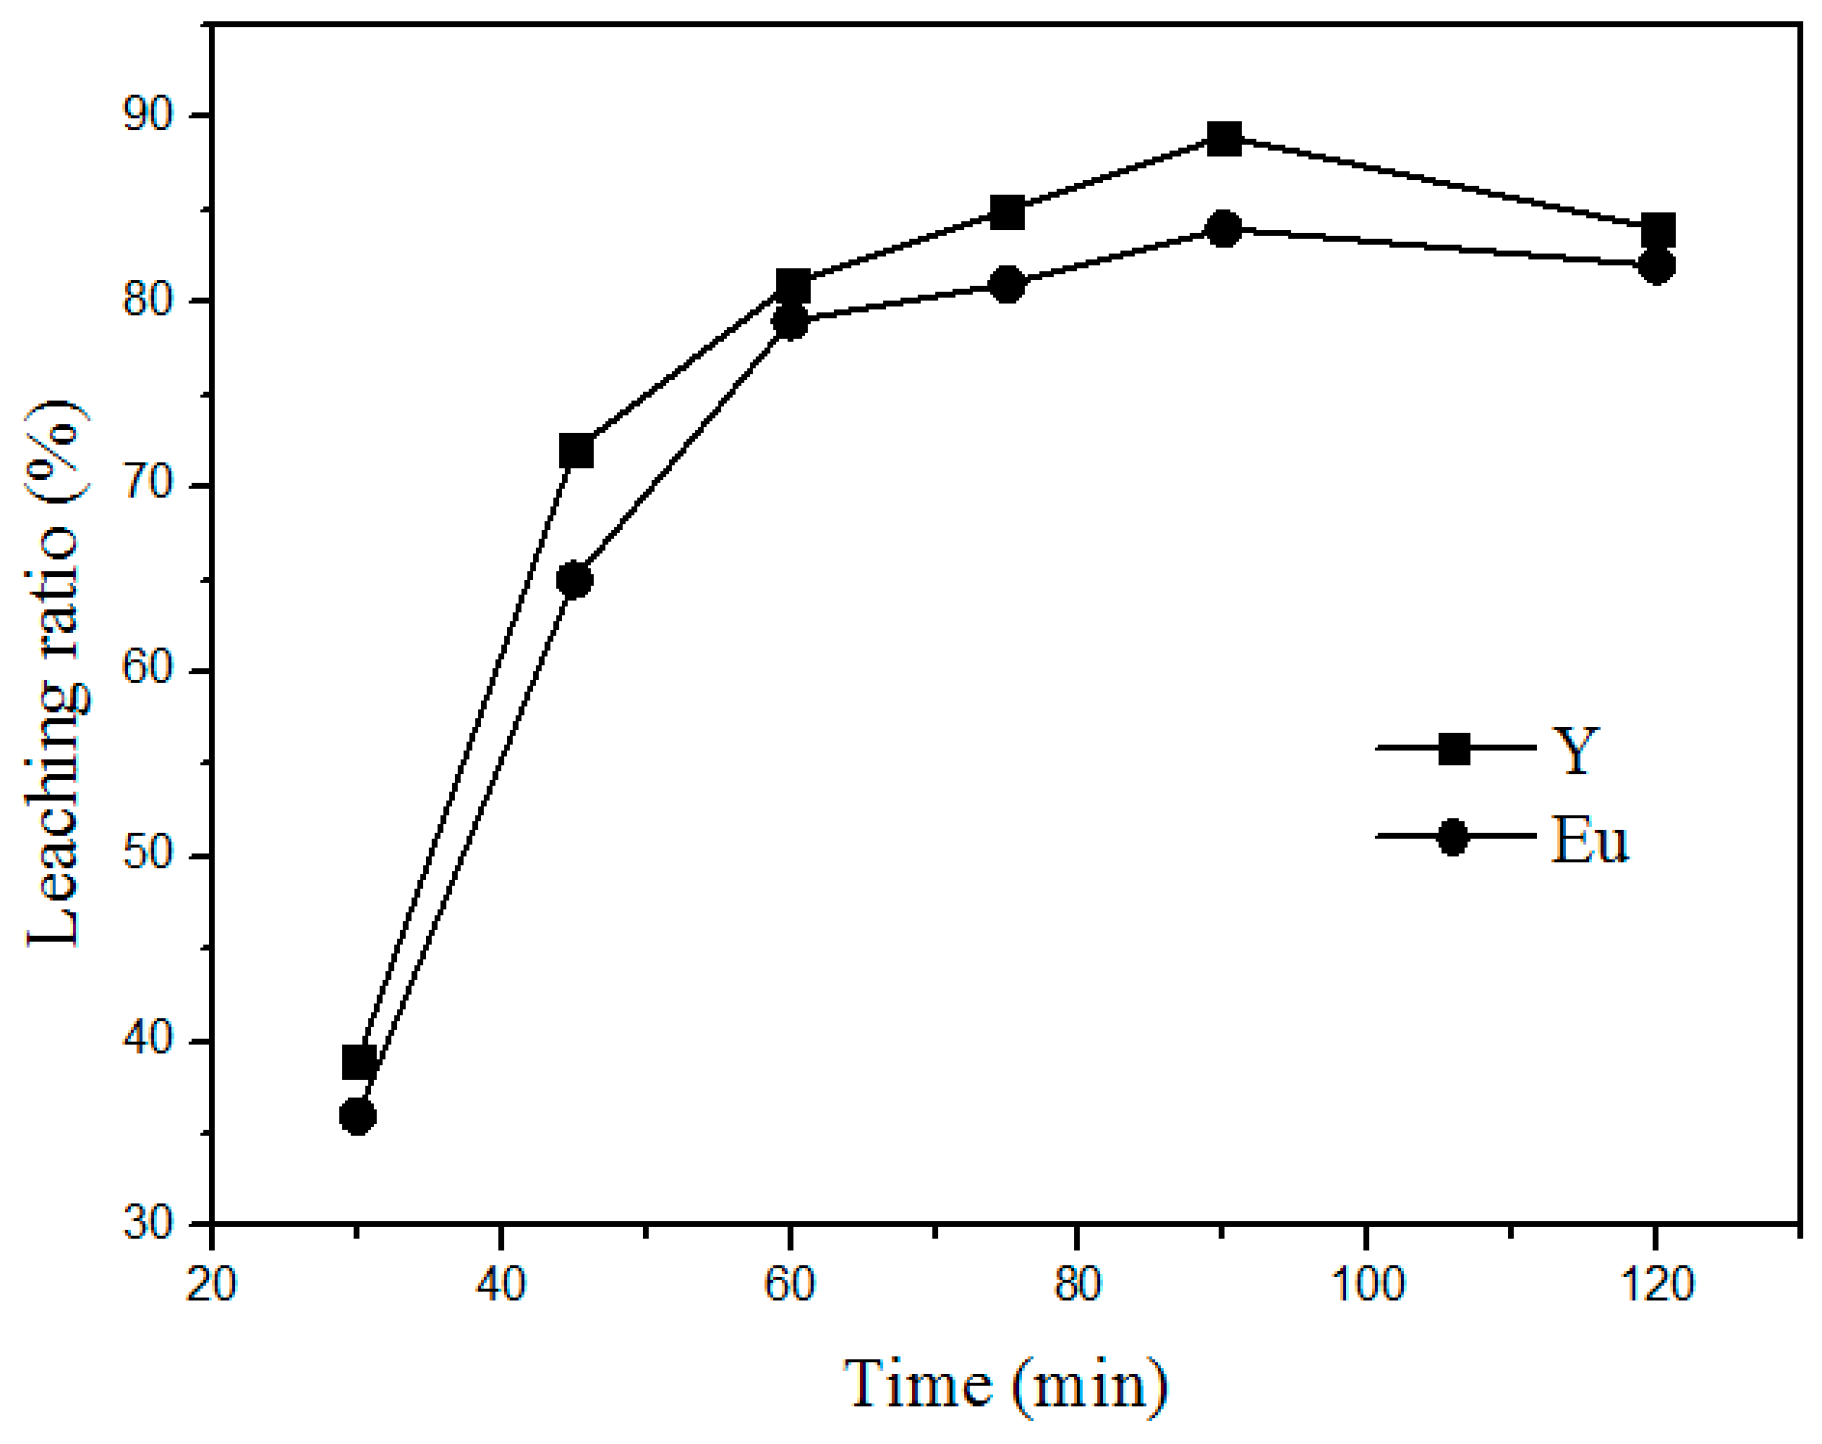
Additionally, the time of roasting is another important factor that influences the leaching process.
Figure 5 shows the variation in the leaching rate of Y and Eu at different roasting times at 400 °C and a mass ratio of 1:4 (waste phosphors to NH
4Cl). The leaching rate increased with increasing leaching time by 30–90 min. Above 90 min, the variation in the leaching rate is insignificant. Therefore, the optimum time for the leaching process is 90 min.
3.2. Effect of Ammonium Chloride Addition
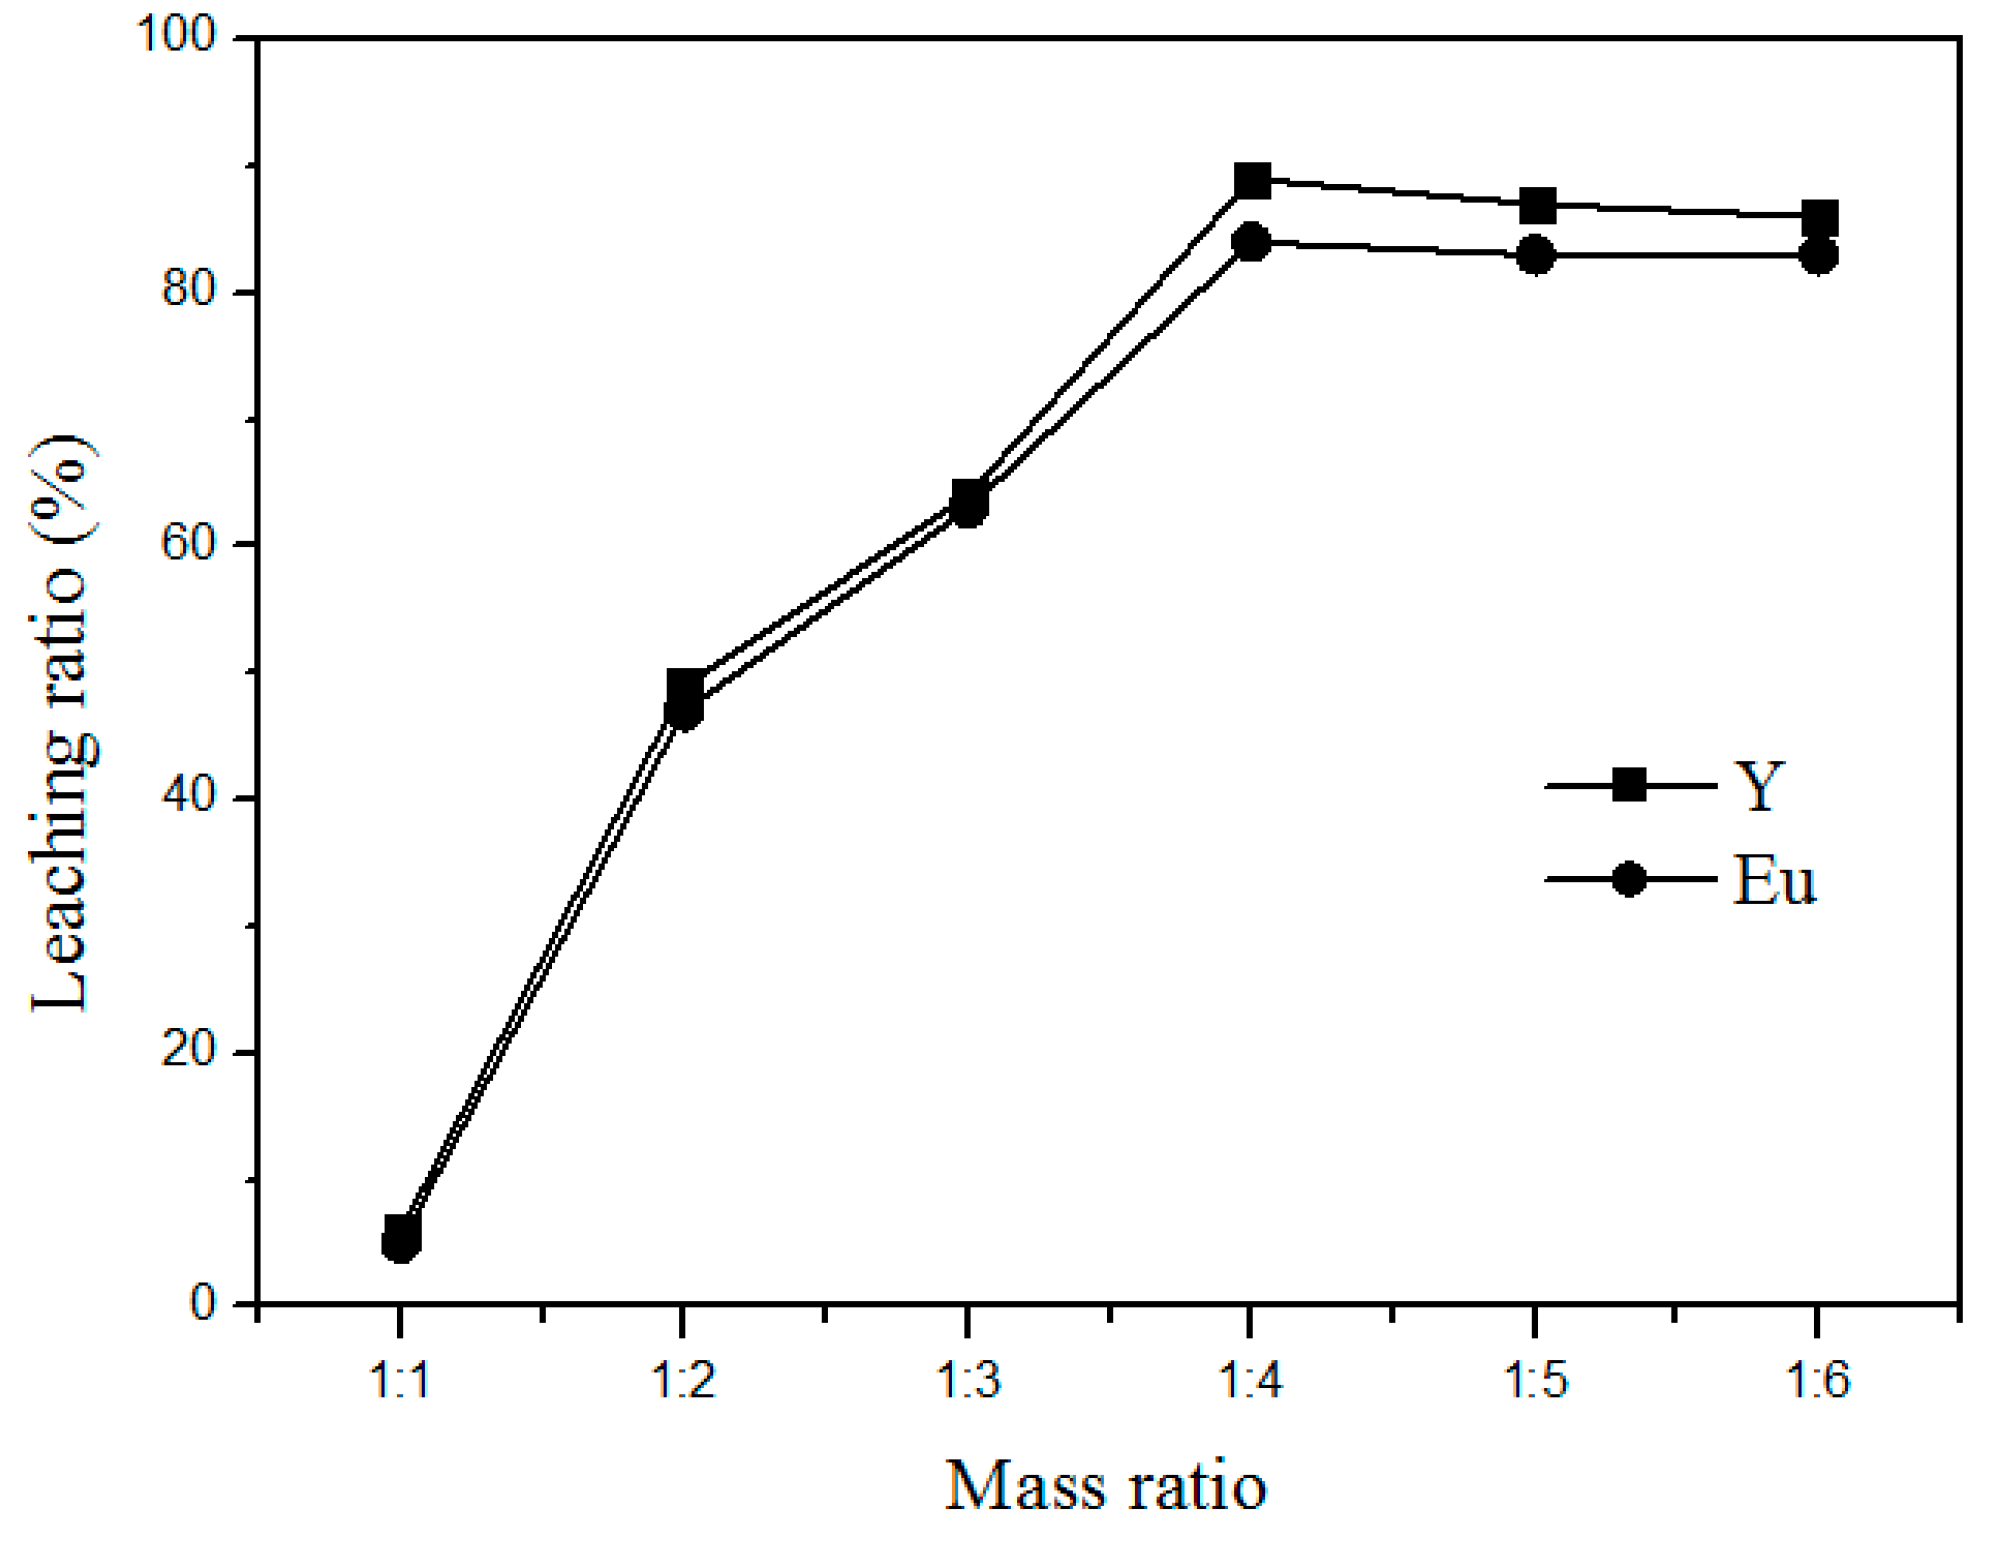
To achieve complete chloride reactions, the waste phosphors and ammonium chloride have to be well mixed. In addition, to save operating costs and enhance the leaching rate, a suitable amount of ammonium chloride should be added for maximizing the reaction efficiency.
Figure 6 shows the relationship between the leaching rate and the amount of ammonium chloride added at 400 °C for 90 min. The leaching rate increased with the increased addition of ammonium chloride. This is consistent with the roasting reactions as shown in Formulas (1) and (2). However, the leaching rate increased only marginally after the weight ratio of waste phosphors to ammonium chloride reached 1:4. Hence, 1:4 was taken as the optimum mass ratio of waste phosphors to NH
4Cl for the rest of the study.
3.3. Variation of Phase in the Roasting and Leaching Process
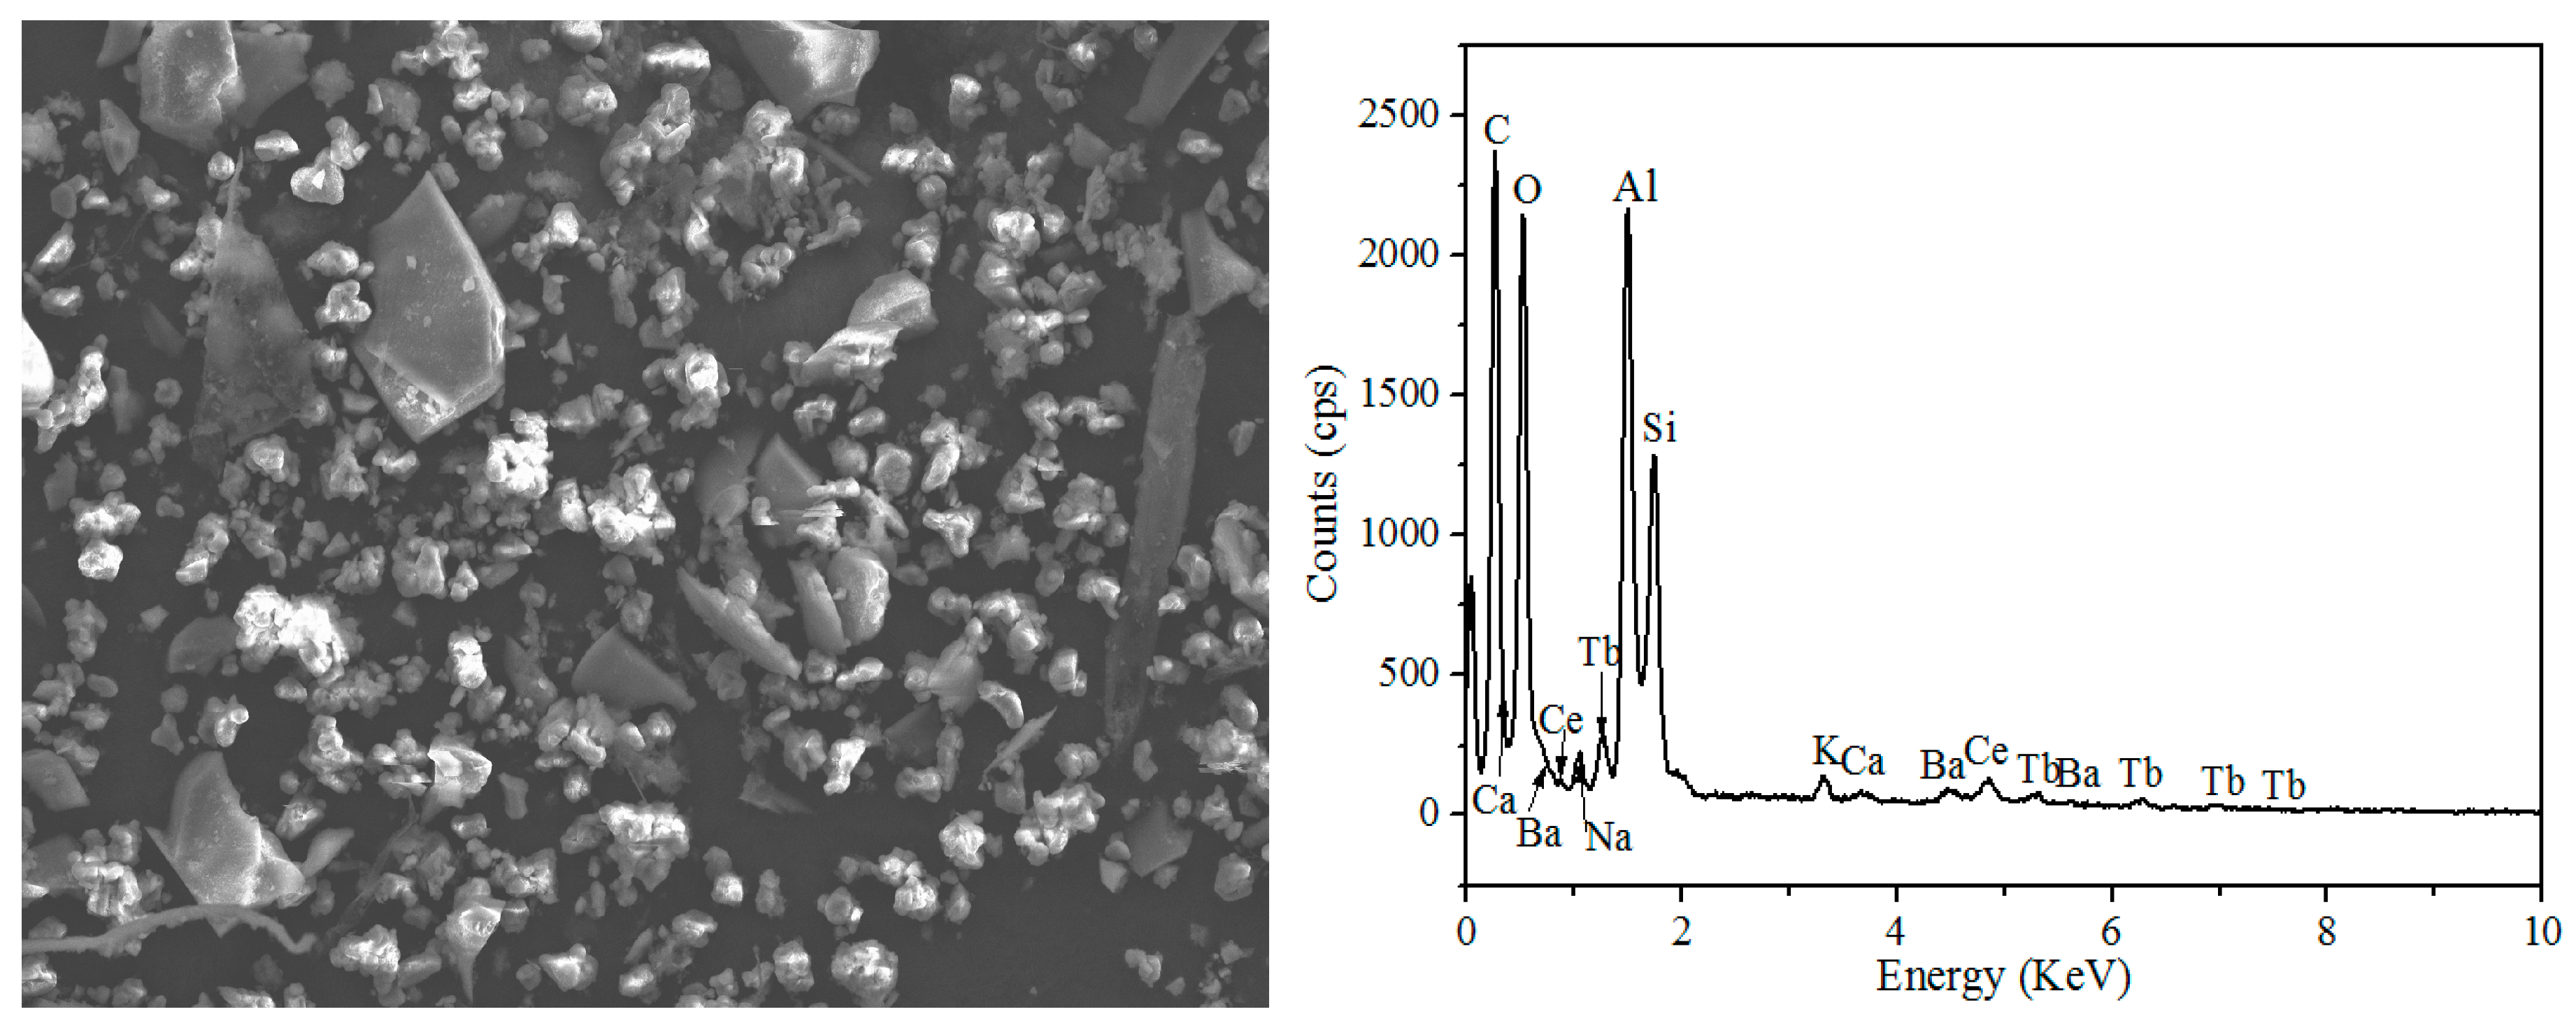
The SEM-EDS analysis of the leaching residue (
Figure 7) shows that the main elements present in the residue are O, Si, and Al, and the peak of Y and Eu disappeared after the water leaching process, indicating that Y and Eu elements present in the phosphors can be efficiently extracted into the leach solution.
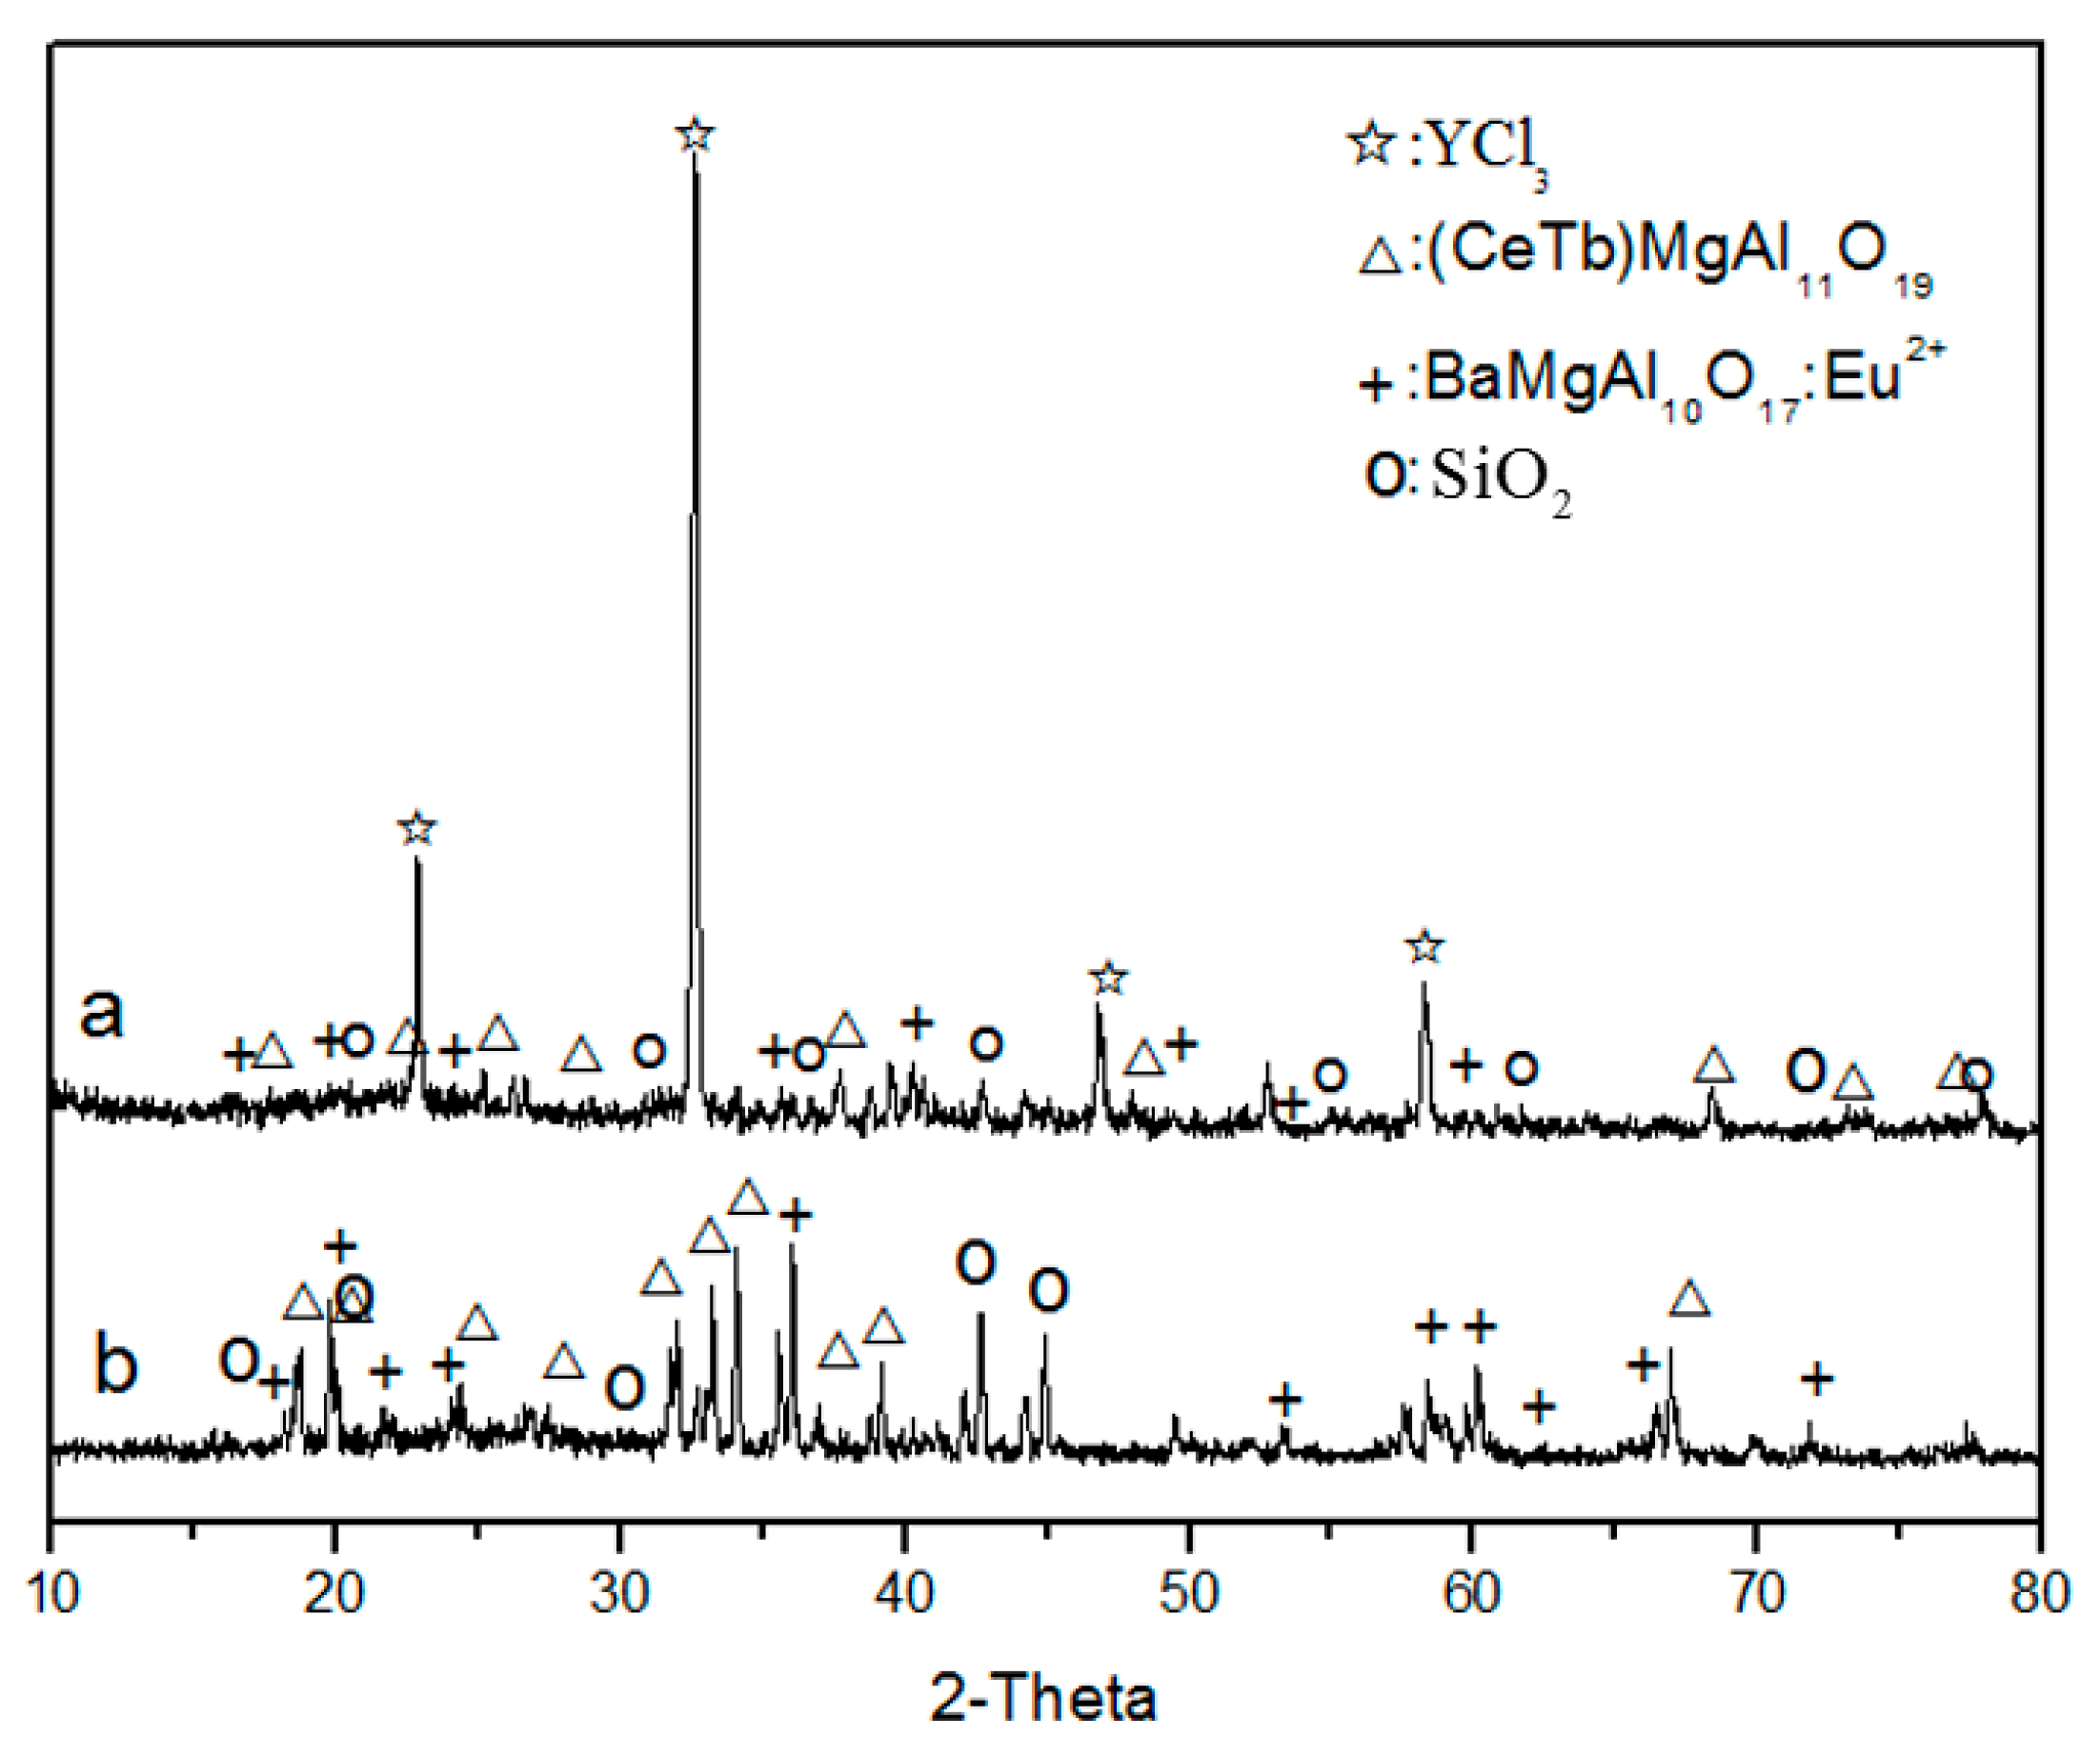
Figure 8a shows the XRD pattern of waste phosphors after roasting at 400 °C. The pattern shows that the main phases transformed to YCl
3, (CeTb)MgAl
11O
19, BaMgAl
10O
17:Eu
2+, and SiO
2, indicating that the red phosphors (Y
2O
3: Eu
3+) react with NH
4Cl and form RECl
3 after roasting. The XRD pattern of the leaching residue (
Figure 8b) shows that the main phases were SiO
2, (CeTb)MgAl
11O
19, and BaMgAl
10O
17:Eu
2+, indicating that RECl
3 was leached to the solution. This indicated that red phosphors can be effectively destroyed by chlorination roasting and rare earth elements can become soluble, which can then be easily separated from the insoluble materials, such as SiO
2 and blue and green phosphors, by leaching.
3.4. Separation of Impurities from the Leach Solution
After leaching, a small amount of impurities are dissolved in the leach solution. Those ions could precipitate after adding oxalates with rare earths and decrease the purity of rare earth products. In order to remove the impurities effectively without precipitating the rare earths, a variety of agents have been tested. The results show that NH3·H2O, NH4HCO3, and Na2S can remove the impurities effectively. Wherein the effect of NH4HCO3 was the most effective, but the loss ratio of rare earth was the highest (40.3%), and using a Na2S solution the loss ratio of rare earth was the lowest, but it cannot remove the impurities effectively (7.2%). In the quest for more precipitation of impurities and lower loss ratio of rare earth, this study uses a NH3·H2O and Na2S solution to precipitate the impurities.
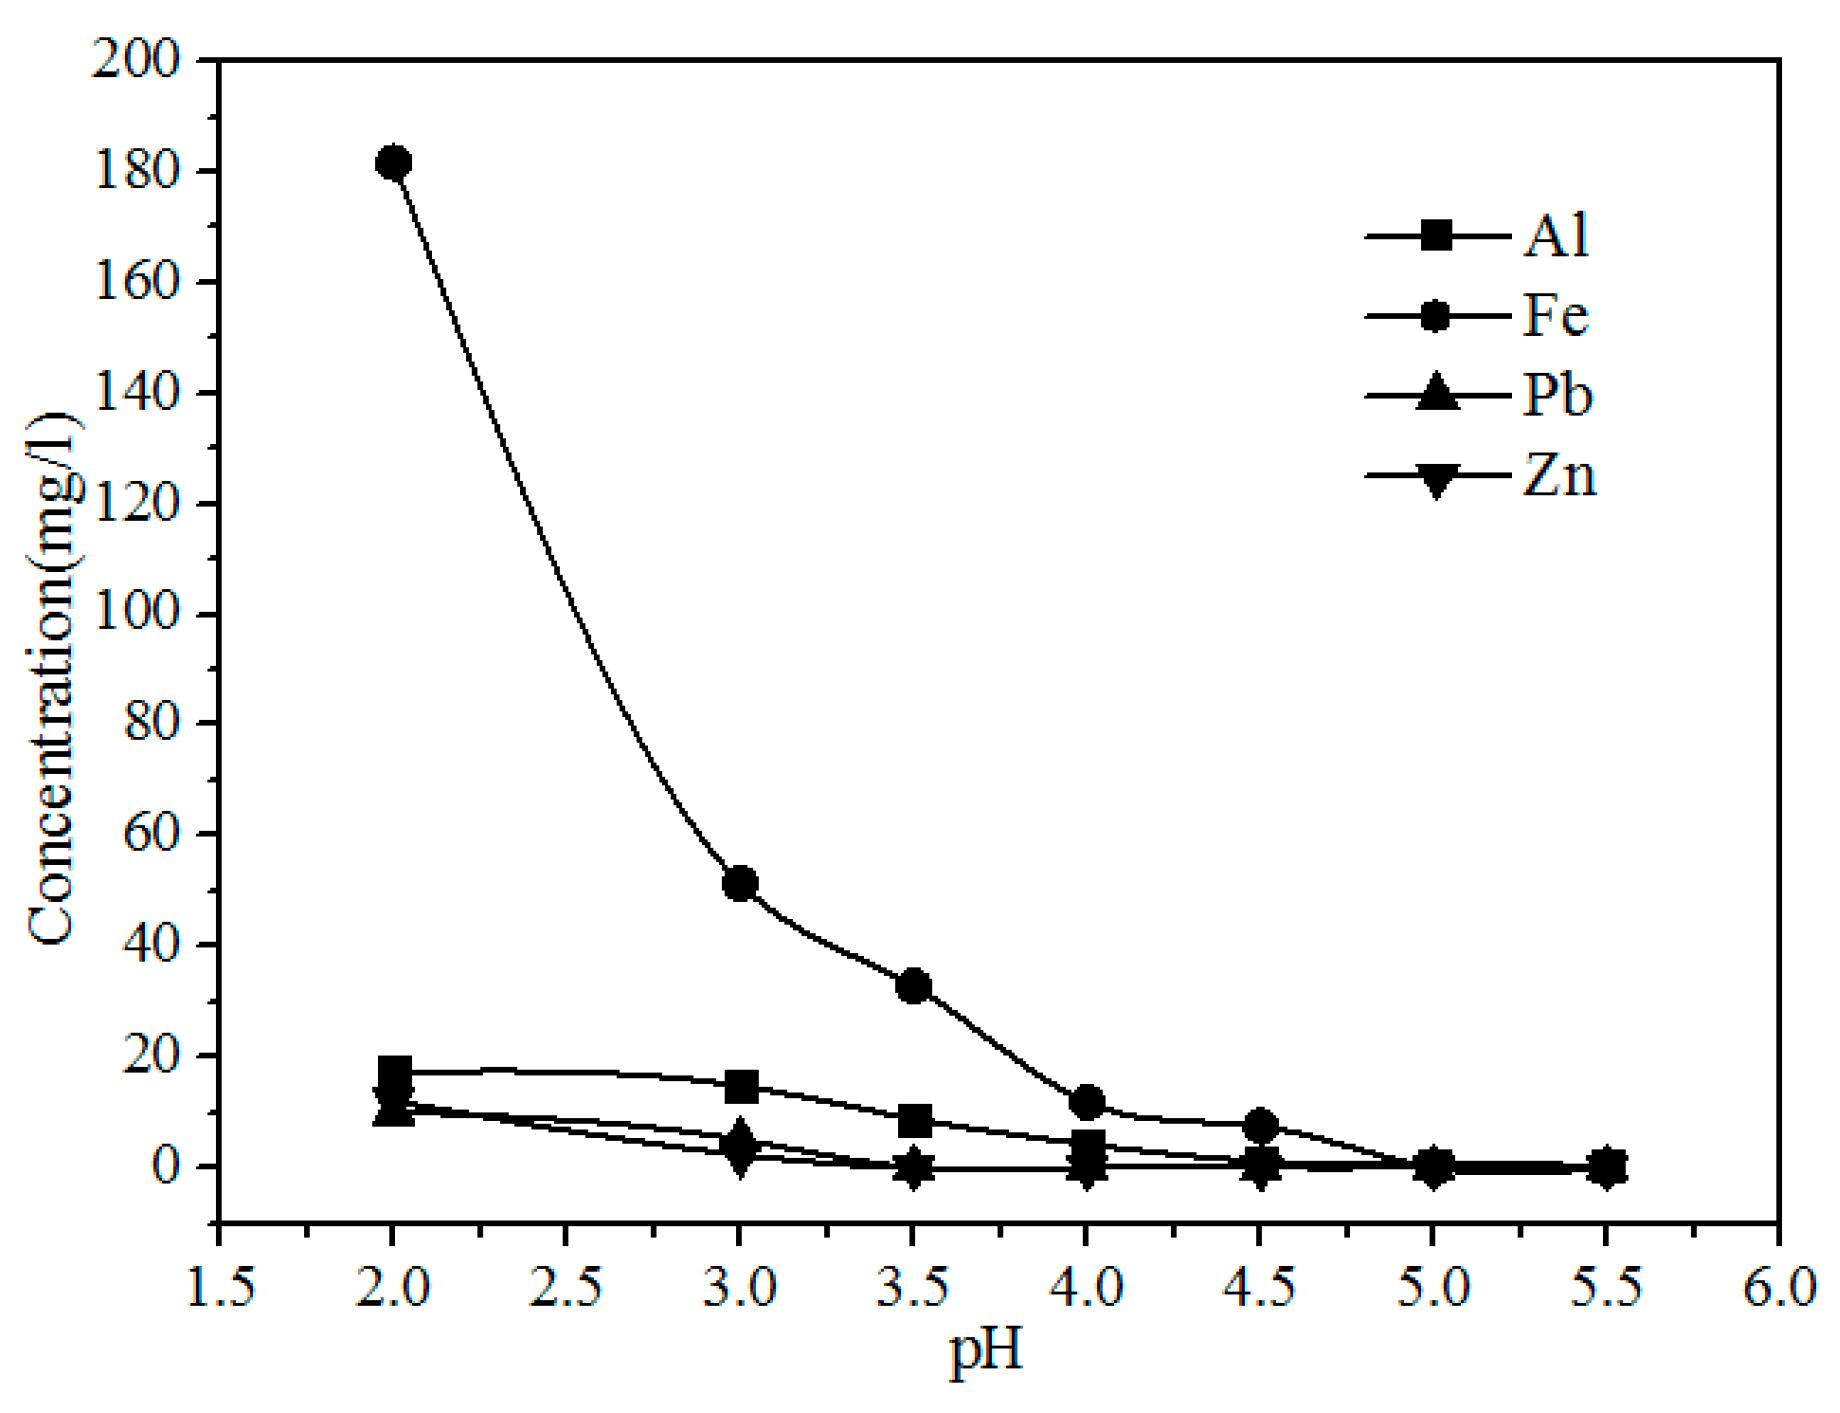
As shown in
Figure 9, the concentration of Fe, Al, Pb, and Zn clearly decreases with increasing pH because the Pb
2+ and Zn
2+ were precipitated with S
2−, and Al
3+ and Fe
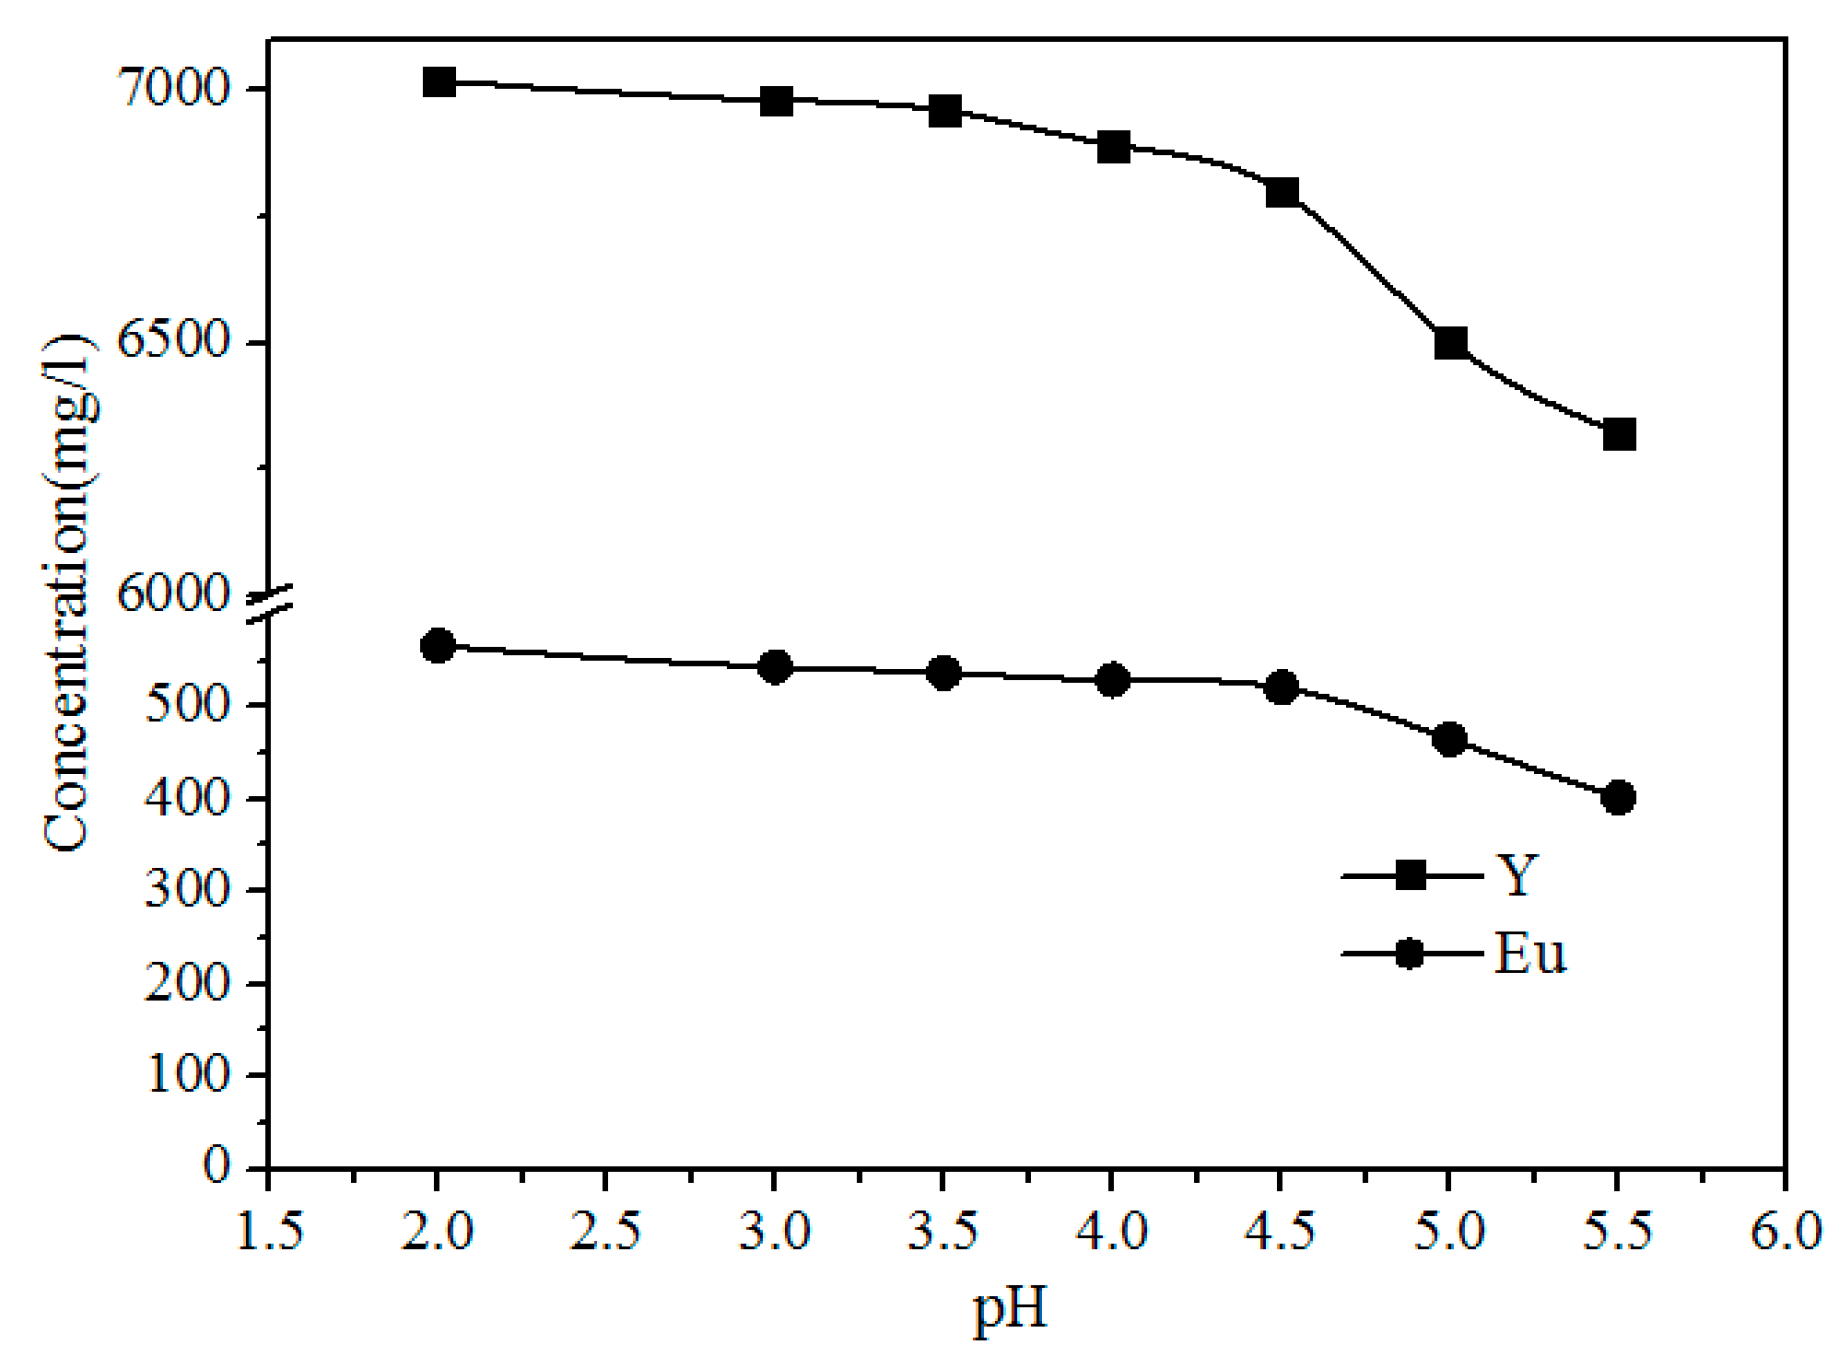
3+ were hydrolyzed with increasing pH via the reactions shown in Formulas (3)–(6). The concentrations of Y and Eu do not decrease until the pH exceeds 4.50 (
Figure 10). The pH required for the hydrolysis of Y and Eu is higher than those of Al and Fe, thus the impurities can be separated by adding a Na
2S and NH
3·H
2O solution to adjust the pH value to 4.5.
3.5. Extraction of Rare Earth Elements from the Leach Solution
The leach solution under the optimum conditions was taken for the recovery of rare earth elements by precipitation using an oxalate solution (Formula (7)):
It should be noted that, based on the precipitation reaction, 6 mols of H+ could be generated with the generation of 1 mol of precipitate, the pH values of the solution could decrease, and a high concentration of H+ can increase the solubility of rare earth precipitation, it is not conducive to the precipitation of rare earths. Therefore, in the process of the precipitation reaction, the amount of oxalates and the pH values are significant for the precipitation of rare earths.
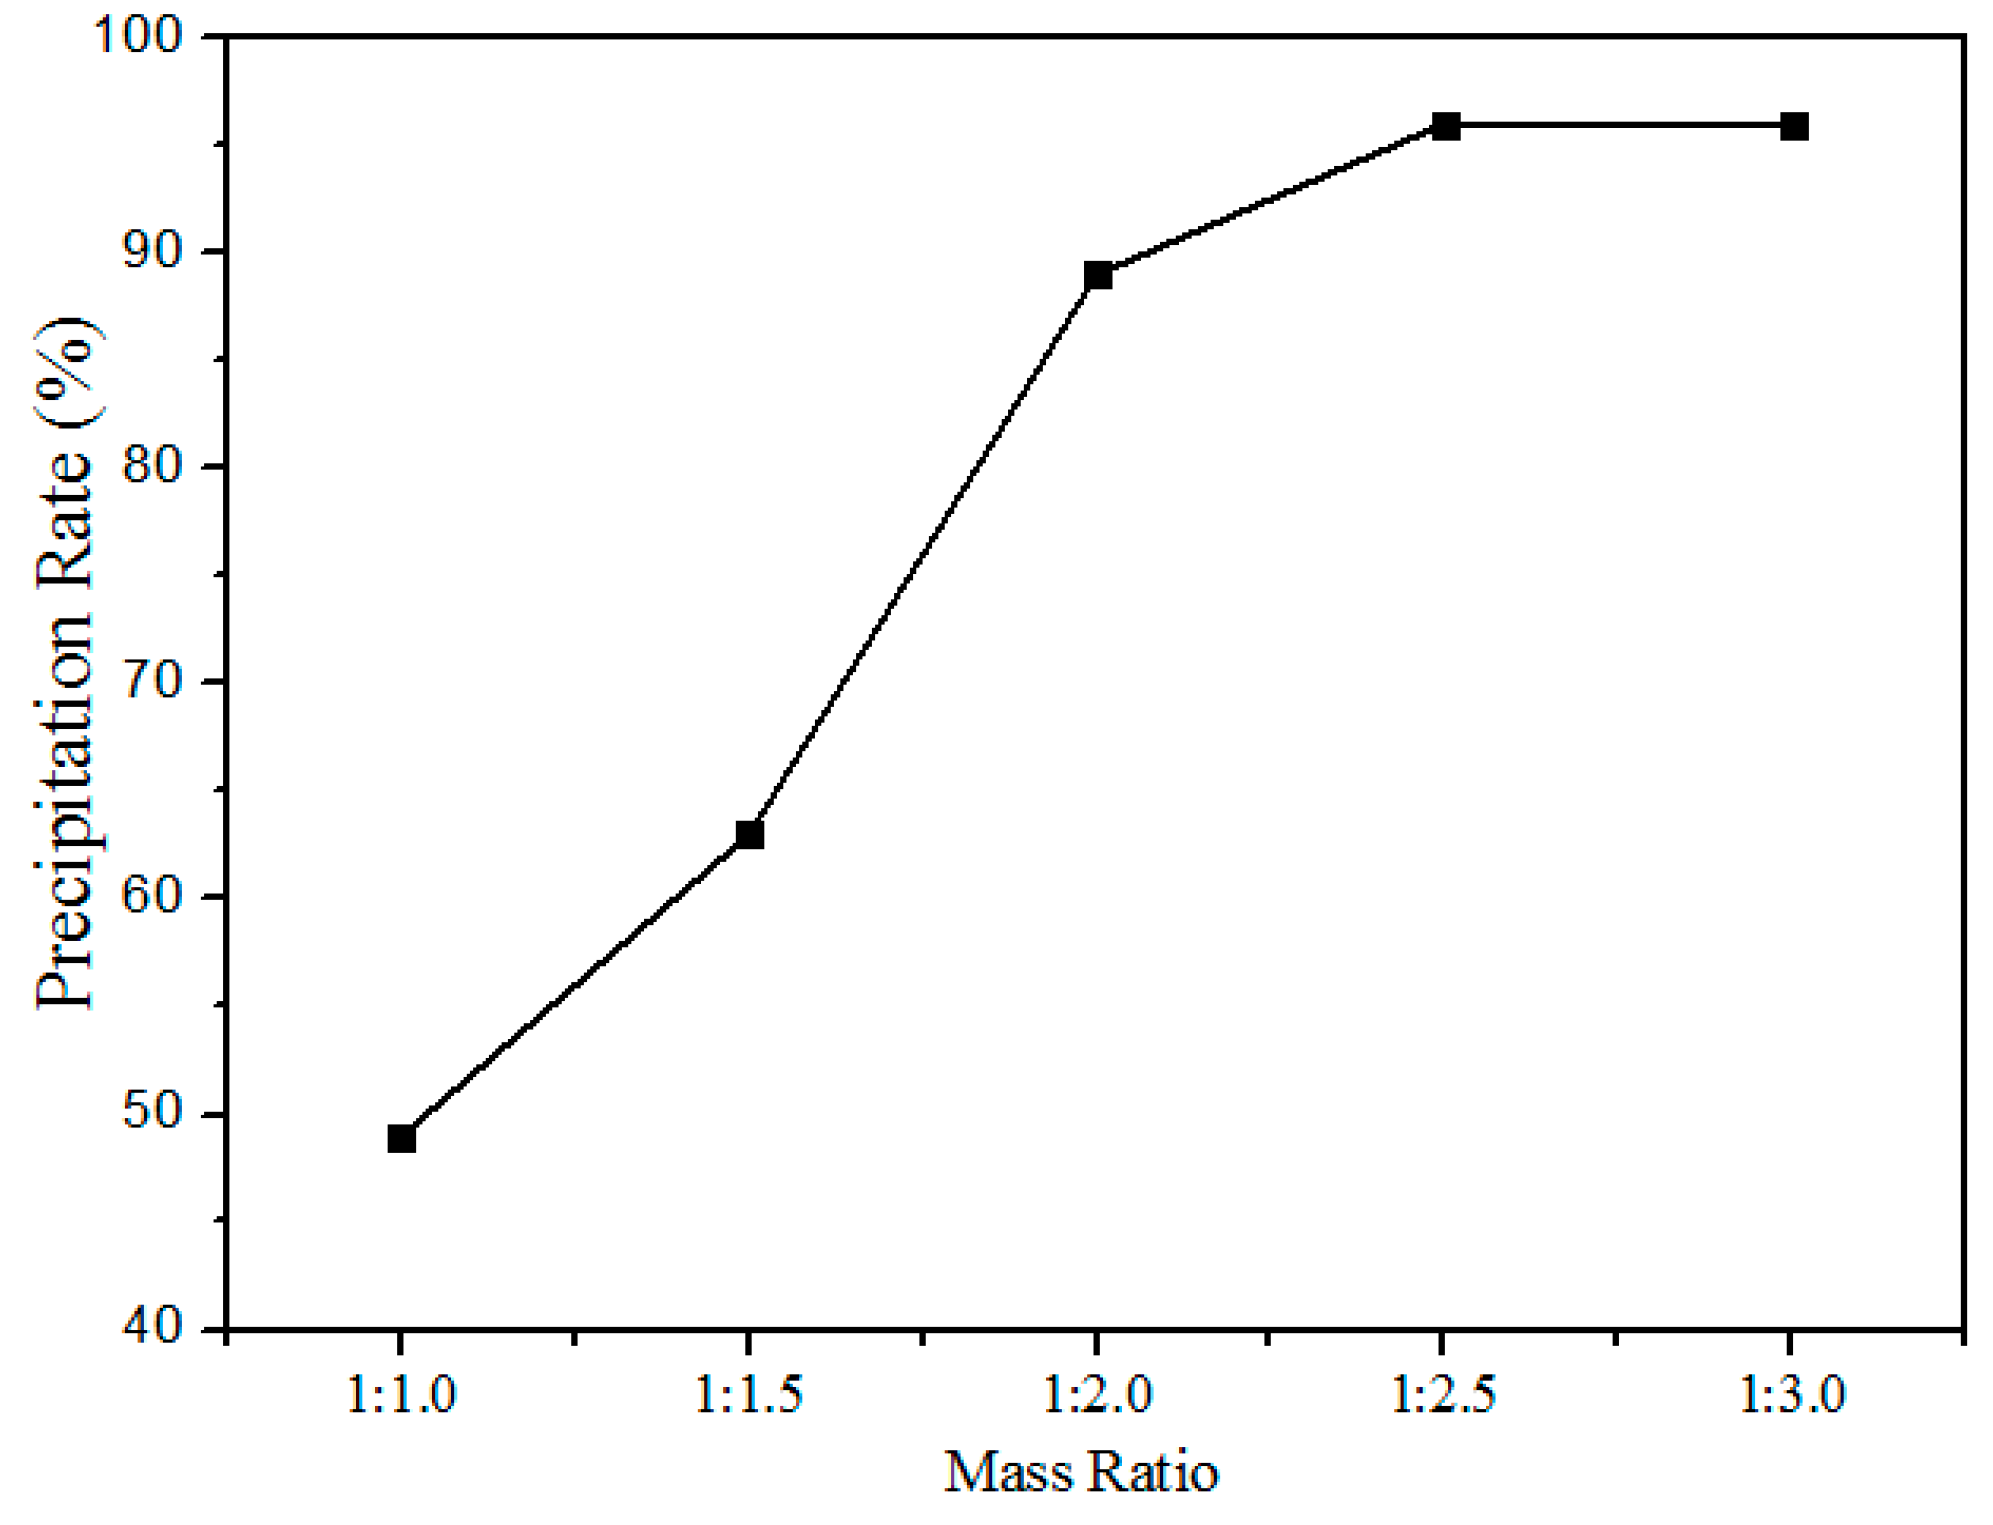
Figure 11 shows the relationship between the precipitation rate and oxalate addition (the mass ratio of rare earth elements to the oxalate addition) at pH values of 1.5. The precipitation rate increased with the increased addition of oxalates, after the mass ratio reaches 1:2.5 the variation in the precipitation rate is insignificant. Hence, the optimum mass ratio chosen was 1:2.5.
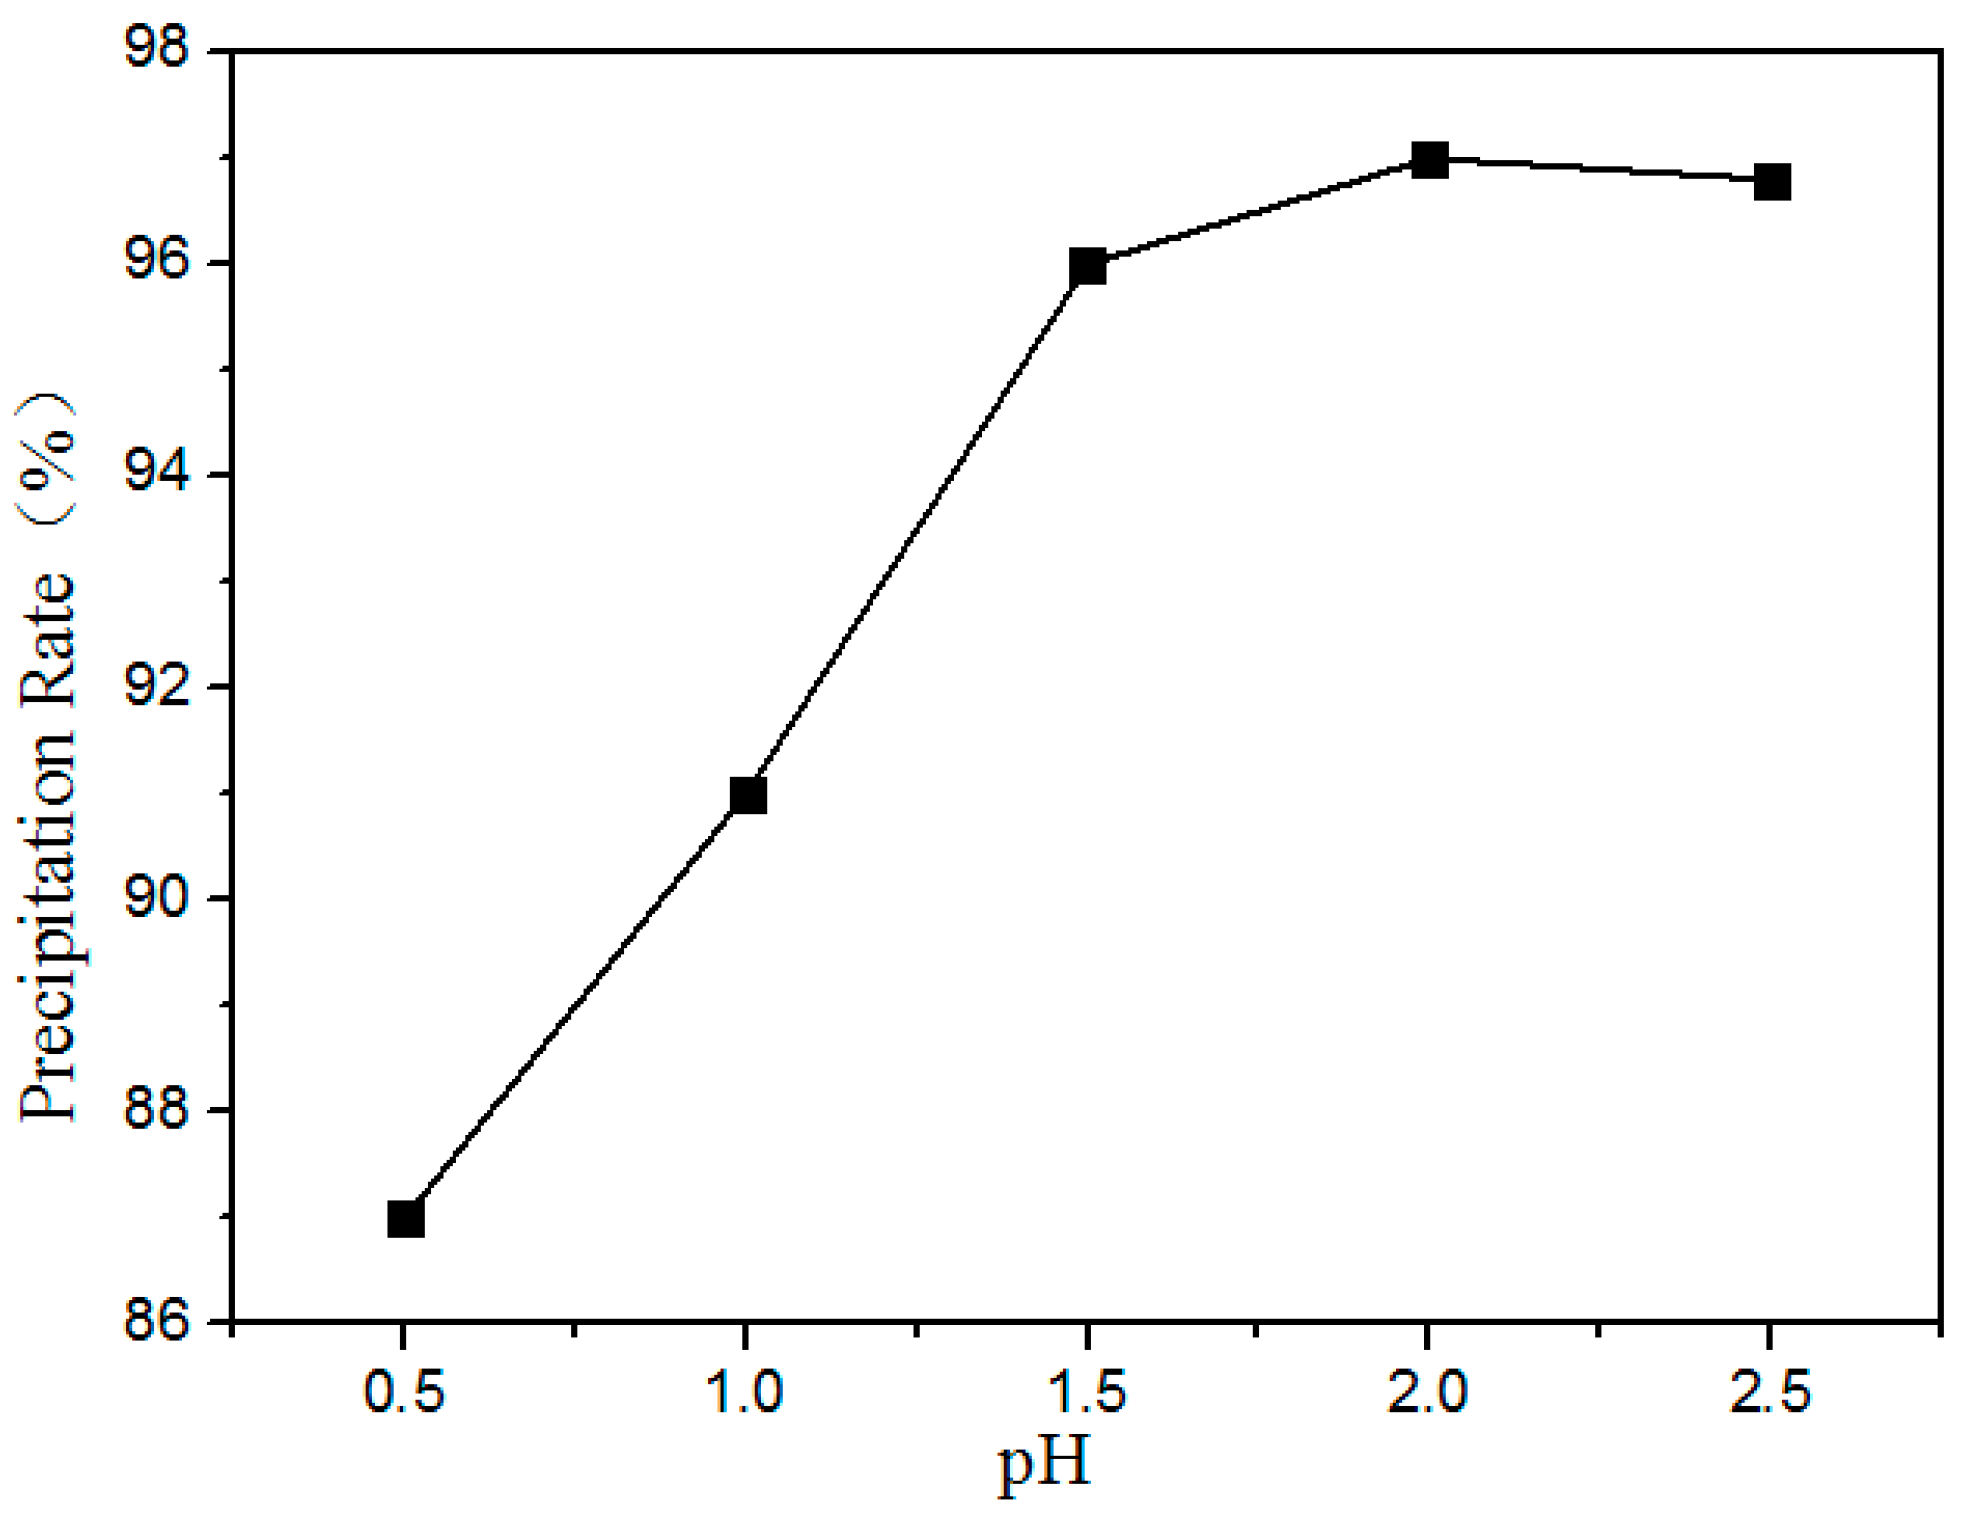
Figure 12 shows the precipitation ratio of rare earths at different pH values. It is shown that the precipitation rate of the rare earths increased with increasing pH. Above pH 2.0, the RE was almost completely precipitated. Therefore, the optimum pH value is 2.0.
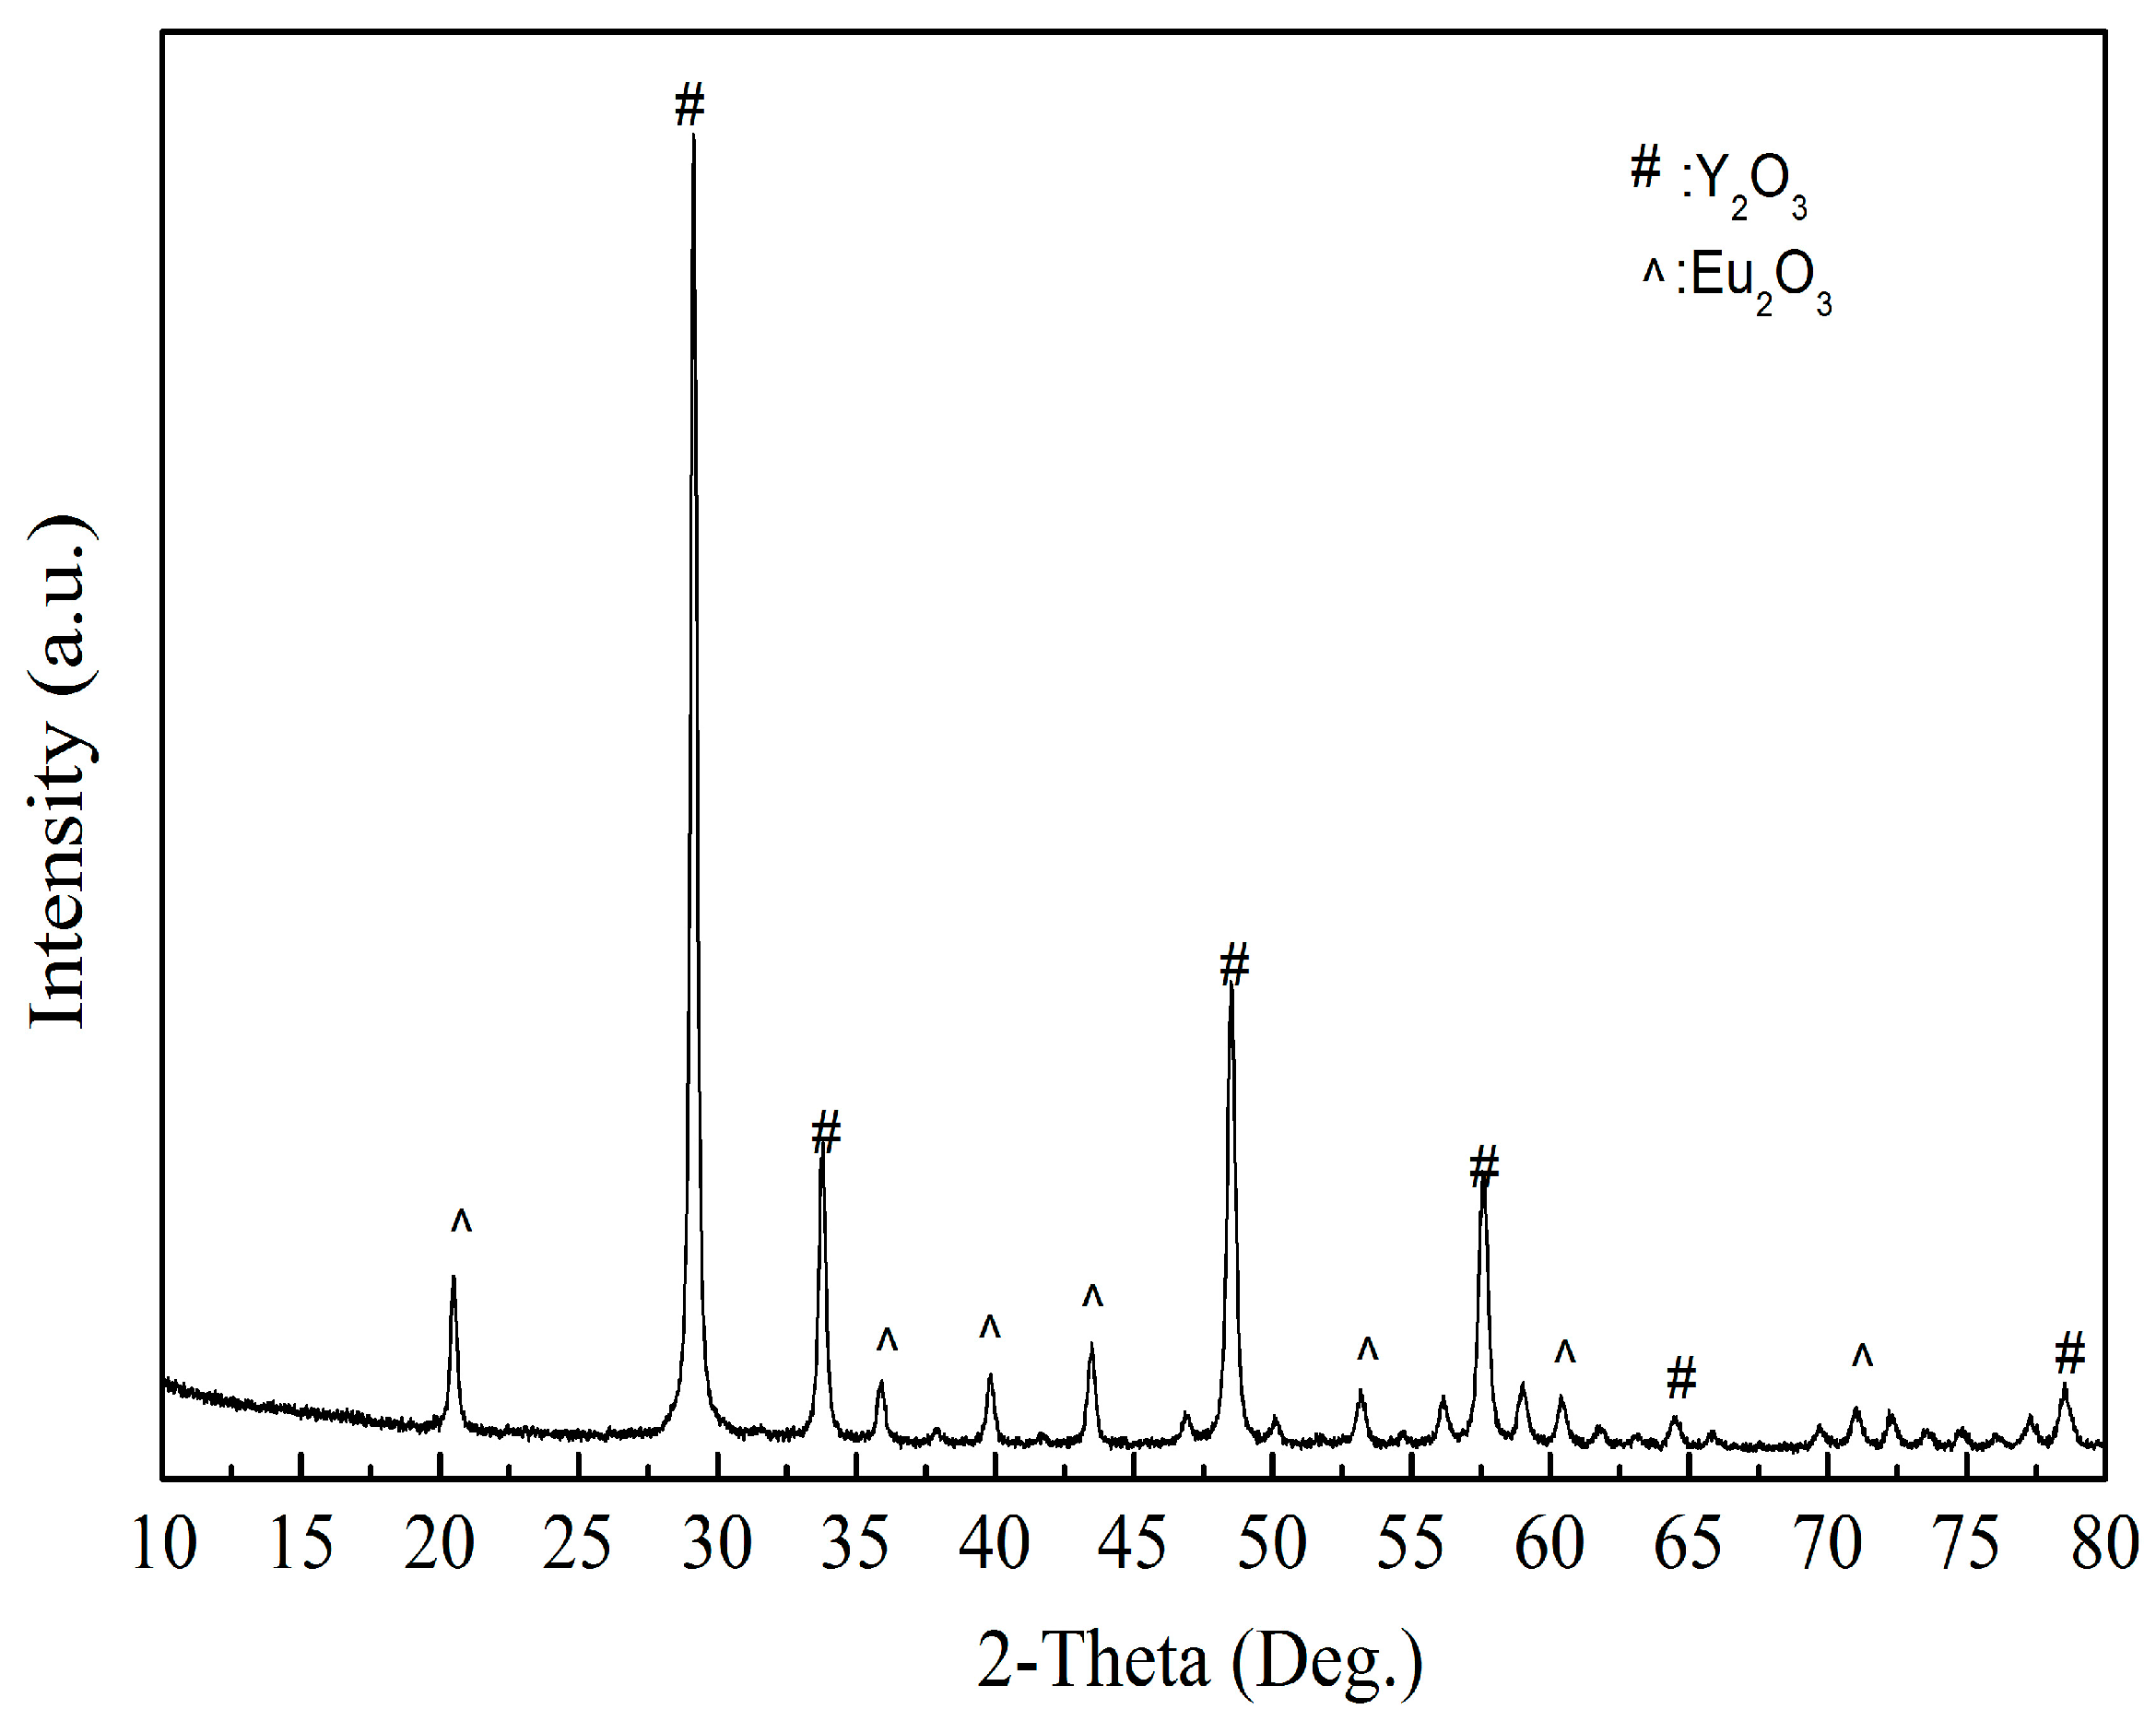
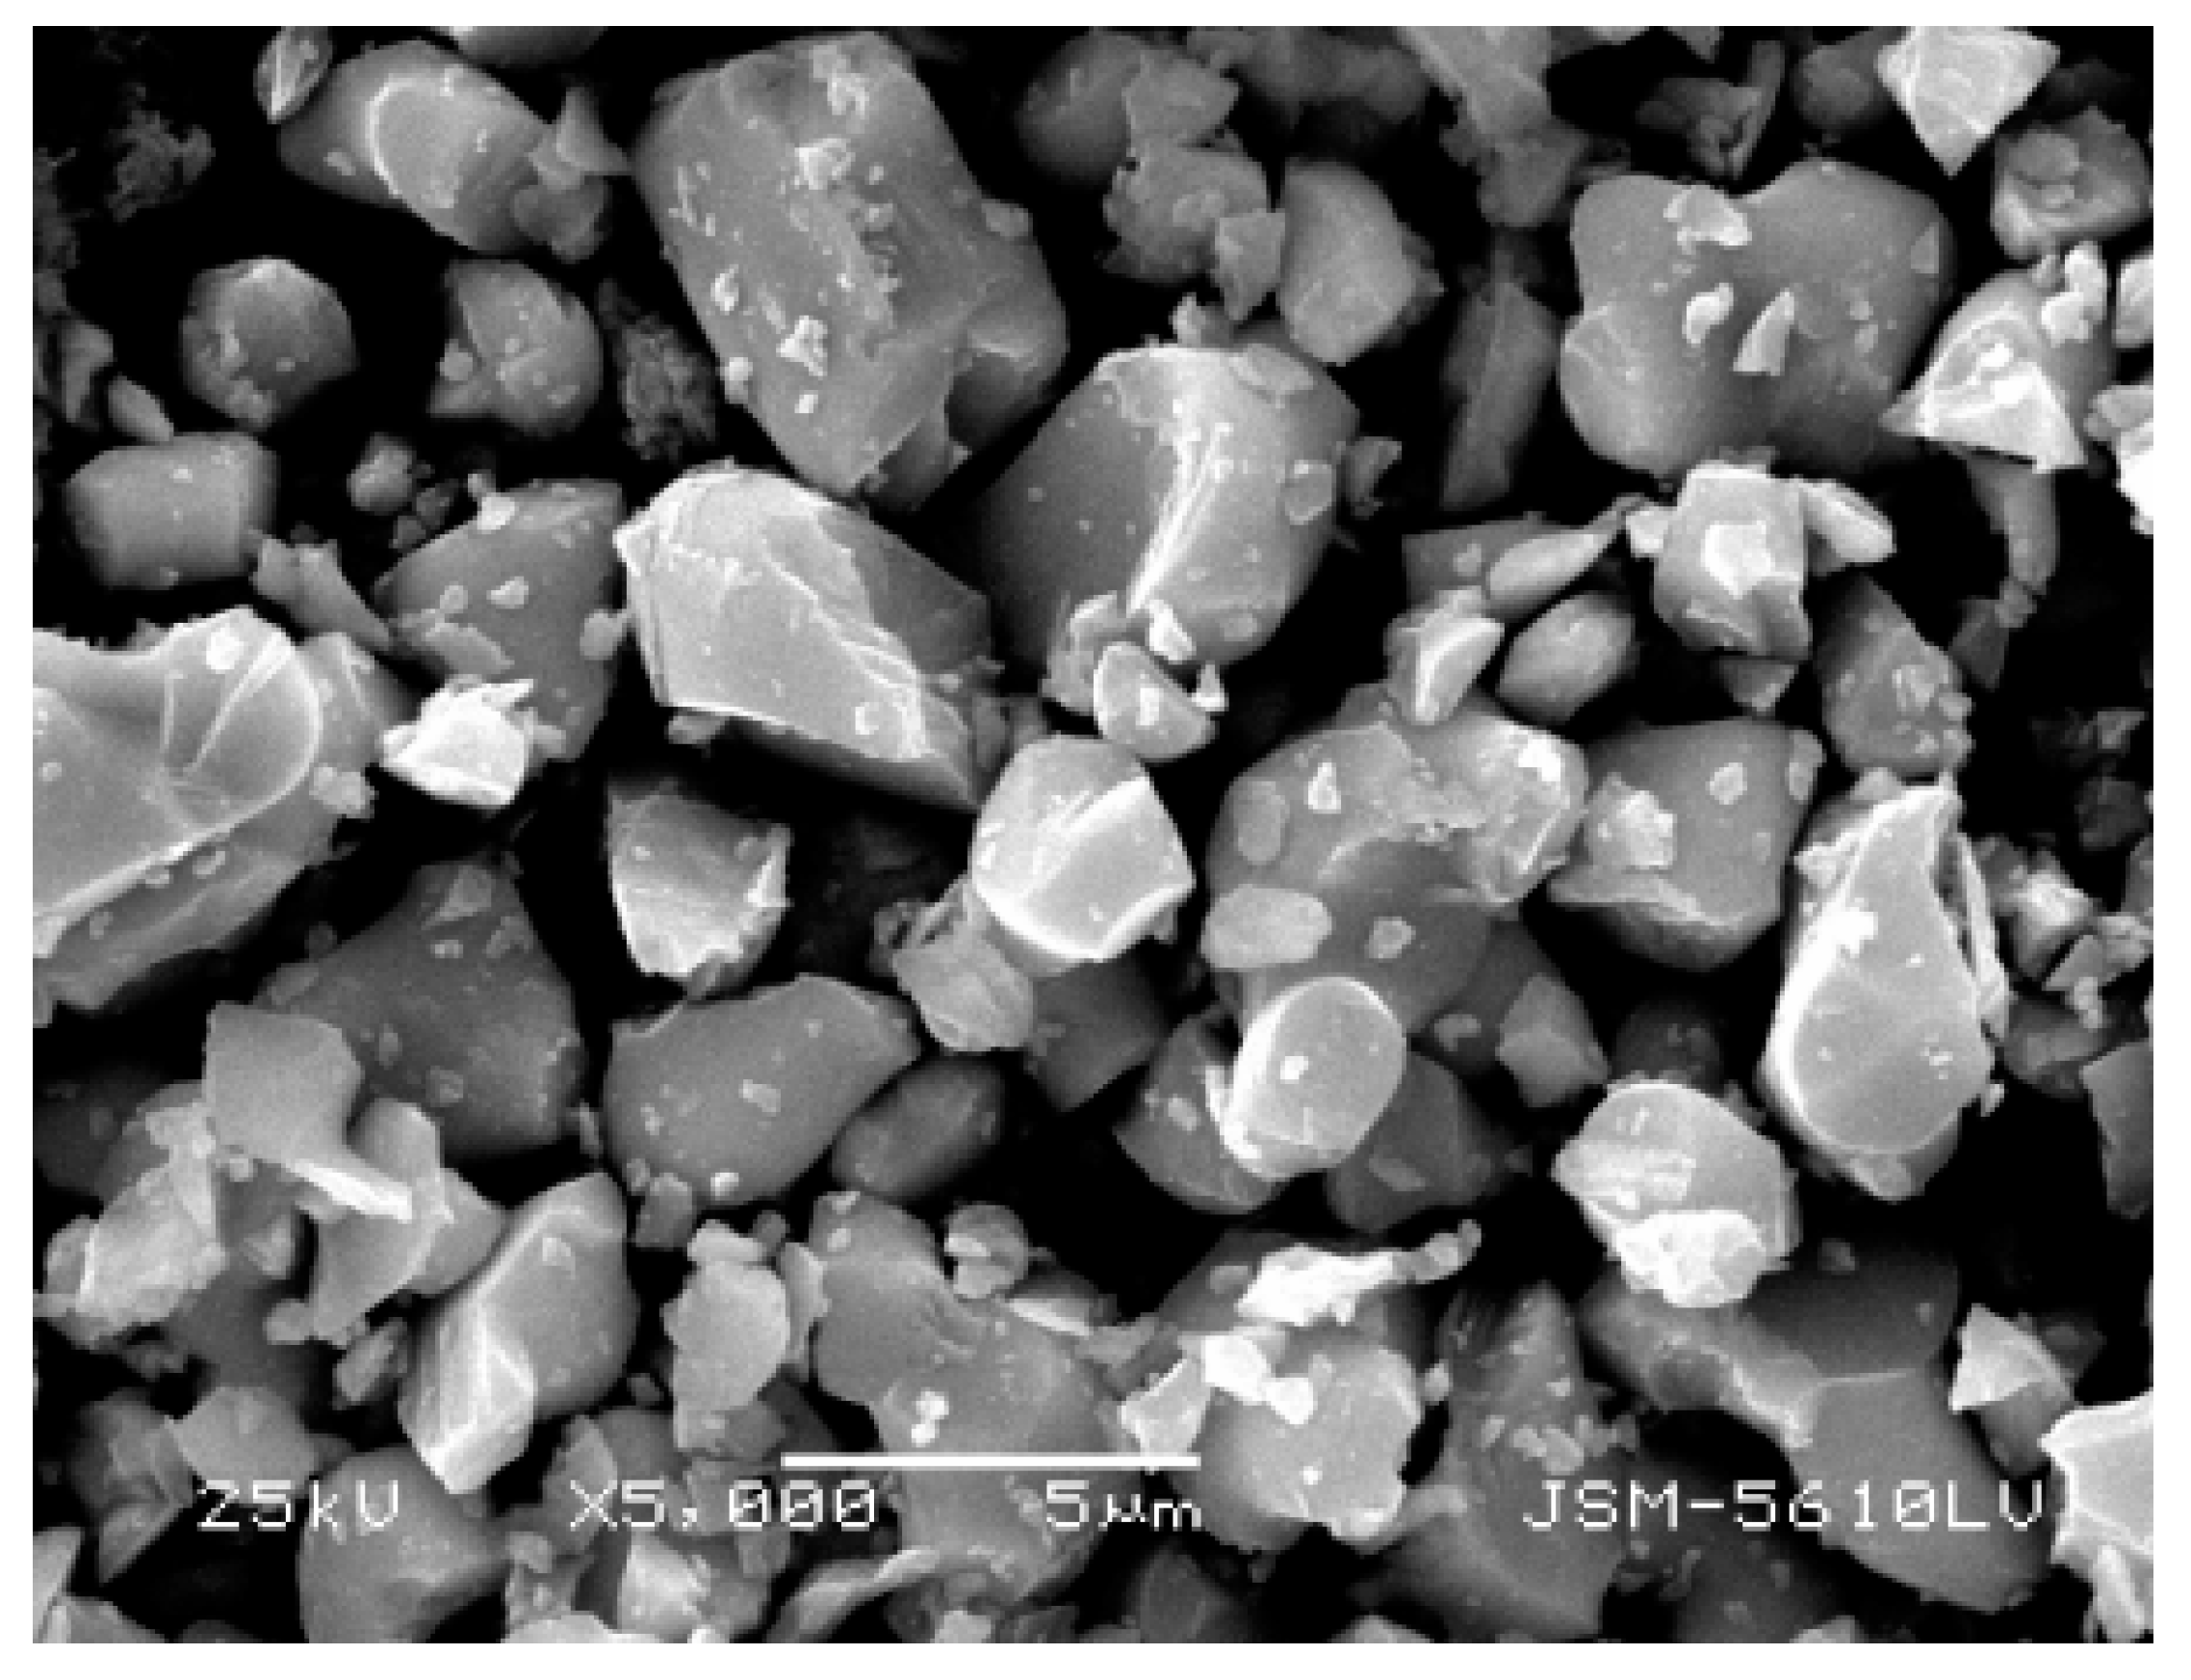
As shown in
Figure 13, the product obtained by calcining the oxalate’s precipitation of RE has an irregular crystal shape with an average length of 5 μm. The result of XRD analysis (
Figure 14) shows that the main crystalline phase of the REOs is Y
2O
3 and Eu
2O
3. The diffraction peaks of the REOs are sharp without any impurity peaks, indicating that the product was a high purity material of Y and Eu. The composition of the product is listed in
Table 3, indicating the total content of Y
2O
3 and Eu
2O
3 is 99.84%, and the products can be reused to synthesize red phosphors directly without separating Y
2O
3 and Eu
2O
3.
4. Conclusions
Ammonium chloride roasting, followed by a water leaching process, was proposed and tested to recover Y and Eu from waste phosphor in this study. By chlorination roasting at 400 °C for 2 h and water leaching, Y and Eu elements can be efficiently decomposed and extracted into the leach solution. Then, the impurities present in the solution could be removed by adding NH3·H2O and Na2S solution to adjust the pH to 4.50. The rare earth elements can be efficiently precipitated after adding the H2C2O4 solution at pH 2. After calcining at 800 °C for 1 h, the high purity rare earth oxides of Y and Eu can be obtained.
Compared with the conventional processes, the method used in this study has the advantages of simple operations, low roasting temperatures and low operating costs, and a high recovery of rare earth (87.35%) with a high purity of product (99.84% REOs) can be obtained. The developed process can be potentially implemented in commercial operations, and the obtained rare earth oxides can be reused to synthesize red phosphors directly without separating Y2O3 and Eu2O3.


