Article

The Development of Fine Microgram Powder Electrode System and Its Application in the Analysis of Chalcopyrite Leaching Behavior

Department of Earth Resources Engineering, Kyushu University, Fukuoka 819-0395, Japan
*
Author to whom correspondence should be addressed.
Minerals 2016, 6(4), 103; https://doi.org/10.3390/min6040103
Submission received: 2 August 2016 / Revised: 22 September 2016 / Accepted: 27 September 2016 / Published: 9 October 2016

Abstract

:
An electrode system to study the mechanism of fine microgram powder sulfide mineral dissolution was developed by using a relatively simple method that enables the attachment of micrograms of fine powder to a platinum plate surface. This system yields highly reproducible results and is sensitive compared with conventional electrode systems for various sulfide minerals such as pyrite, chalcopyrite, chalcocite, enargite, and tennantite. The leaching behavior of chalcopyrite was re-examined in a test of the application of this electrode system. Chalcopyrite dissolution is enhanced in specific potential regions because it is believed to be reduced to leachable chalcocite, but this result is inconclusive because it is difficult to detect the intermediate chalcocite. Powder chalcopyrite in the new powder electrode system was held at 0.45 V in the presence of copper ion and sulfuric acid media followed by an application of potential in the anodic direction. Besides the chalcopyrite oxidation peak, a small peak resulted at ∼0.55 V; this peak corresponds to reduced chalcocite, because it occurs at the same potential as the chalcocite oxidation peak.

1. Introduction

In the mining industry, the electrochemical behavior of sulfide minerals has been studied to elucidate their surface chemistry for hydrometallurgical, mineral processing, and environmental purposes. In general, the electrochemistry of sulfide minerals has been studied using massive mineral electrodes. However, in many cases in industry, it would be better to use a powder electrode, because the sulfide mineral often exists in powder form, and it is impossible sometimes to obtain a massive sample.
Massive sulfide electrodes are used widely for electrochemistry, and normally these are fabricated from a flat sulfide mineral sample with one side that is connected to copper wire and cemented with epoxy resin. The other side of this sulfide mineral sample is used as a sulfide electrode surface. This type of electrode is widely accepted, but its sensitivity is poor because of the large amount of samples used compared with powder electrodes [1]. The carbon paste electrode is used most frequently as a powder electrode, and is fabricated as follows [2,3]: Conductive carbon powder and a small amount of sulfide powder mineral is mixed to form a paste with paraffin oil as an inactive binder to form a homogeneous paste. This paste is inserted into a cylindrical tube; one side is used as the electrode and the other is used as an electrode connector with a connection to a copper wire. This method is simple, and after measurement, the surface can be easily replaced by cutting the tube. However, it is not possible to adjust the amount of reacting sulfide mineral or estimate the amount of sulfide mineral on the electrode surface by using this method, because the sulfide powder exists uniformly inside the carbon paste. In an alternative method, a carbon rod is used as an electrode; the sulfide powder sample is attached directly to the carbon rod surface and is used as the powder electrode [1]. In this method, the amount of sulfide mineral attached to the electrode surface can be adjusted. However, it is difficult to add micrograms of a sample to such an electrode because it is difficult to weigh out such sample masses by using an electronic balance. Furthermore, powder may be lost during the measurement. The authors developed a new attachment method in which a sulfide powder suspension is attached to the surface of carbon paste with alcohol and the material is allowed to dry [4]. This method can be used to attach a small amount of powder to the surface, but its reproducibility is low.
In this study, an improvement in, and the development of, a new fine microgram powder electrode system was achieved. Various estimates, such as the reproducibility and sensitivity were achieved with this method, and a quantitative analysis was attempted. An estimation of chalcopyrite dissolution, for which the dissolution mechanism has been controversial, was also carried out using this new method.

2. Experimental Material and Methods

2.1. Materials

High-purity mineral samples of chalcopyrite (Miyatamata Mine, Japan), pyrite (Hirase Mine, Japan), chalcocite (Hilfe Gottes, Germany), enargite (Superior, WI, USA), and tennantite (Penamellera, Spain) were used as experimental samples. The massive samples were wet ground using #800 emery paper and pure water to yield a fine powder sample, and the wet ground samples were collected by filtration using a 0.2-µm pore size filter, followed by vacuum freeze drying. Scanning electron microscopy observations confirmed that most of the samples were in the 10-µm size range. Chemical composition of each samples are shown in Table 1. From X-ray diffractometry, it was indicated that the pyrite sample consisted of almost pure pyrite, the chalcopyrite sample consisted of mostly chalcopyrite and a small amount of quartz. The chalcocite sample consisted of almost pure chalcocite. The enargite sample consisted of mostly enargite and a small amount of pyrite. The tennantite sample consisted of mostly tennantite and a small amount of pyrite and quartz.

2.2. Electrochemical Measurement

A conventional three-electrode electrolytic cell (a working electrode, a platinum counter electrode, and a Ag/AgCl reference electrode) was used in the electrochemical analysis with potentiostat (1205B, ALS Co., Ltd., Tokyo, Japan). All electrode potentials are reported with respect to the standard hydrogen electrode. Potentiodynamic polarization experiments were conducted as electrochemical measurements at a potential sweep rate of 1 mV·s−1, and the potential swept from an open circuit potential to 1.4 V. All electrochemical measurements were carried out in 0.1-M sulfuric acid at room temperature under ambient conditions without stirring the electrolyte. To detect the reduced product, one electrochemical measurement was carried out with a holding potential at 0.45 V for 300 s followed by potential polarization in the anodic direction at 1 mV·s−1 to 1.4 V. This method is a type of cathodic stripping voltammetric method.
A 1-cm × 1-cm platinum sheet to which a small amount of fine powder sample was attached was used as the working electrode. The powder sample was attached using the following procedure: 0.01 g of powder sample was suspended in 10 mL of pure water inside a small glass cell, and a uniform suspension was produced by ultrasonic treatment for 1 min. A known amount of this uniform suspension was withdrawn by using a micropipette, placed onto a platinum sheet, and the suspension was dried by mildly warming the electrode with a 40 °C hot plate. The electrode was held up over the hot plate above 1 cm. Suspension was usually dried less than 15 min. By adjusting the amount of suspension in the micropipette, this procedure can be used to place the microgram powder sample onto the platinum sheet. The sample was attached to only one side of platinum electrode.

3. Results and Discussion

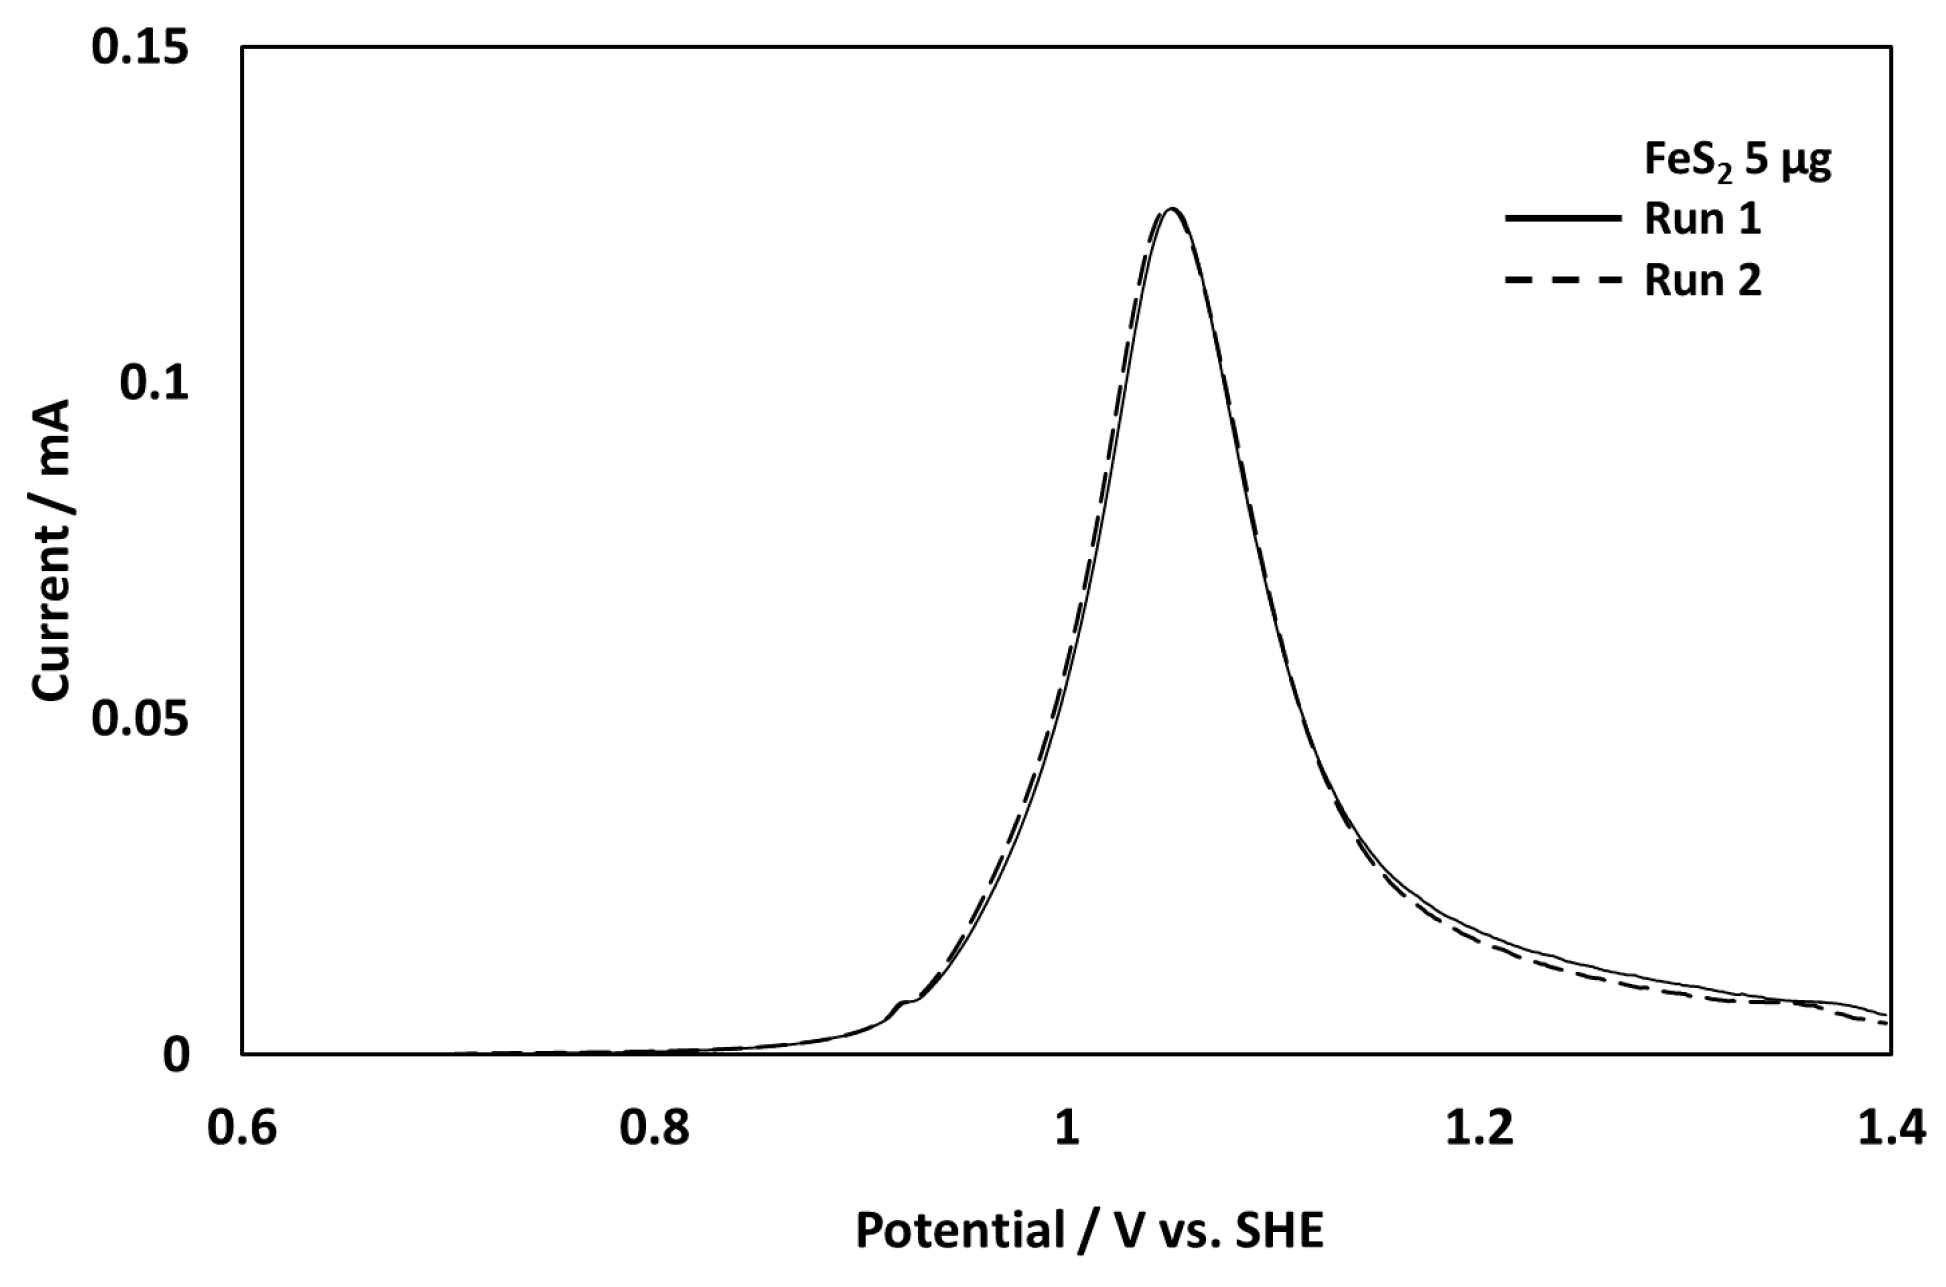
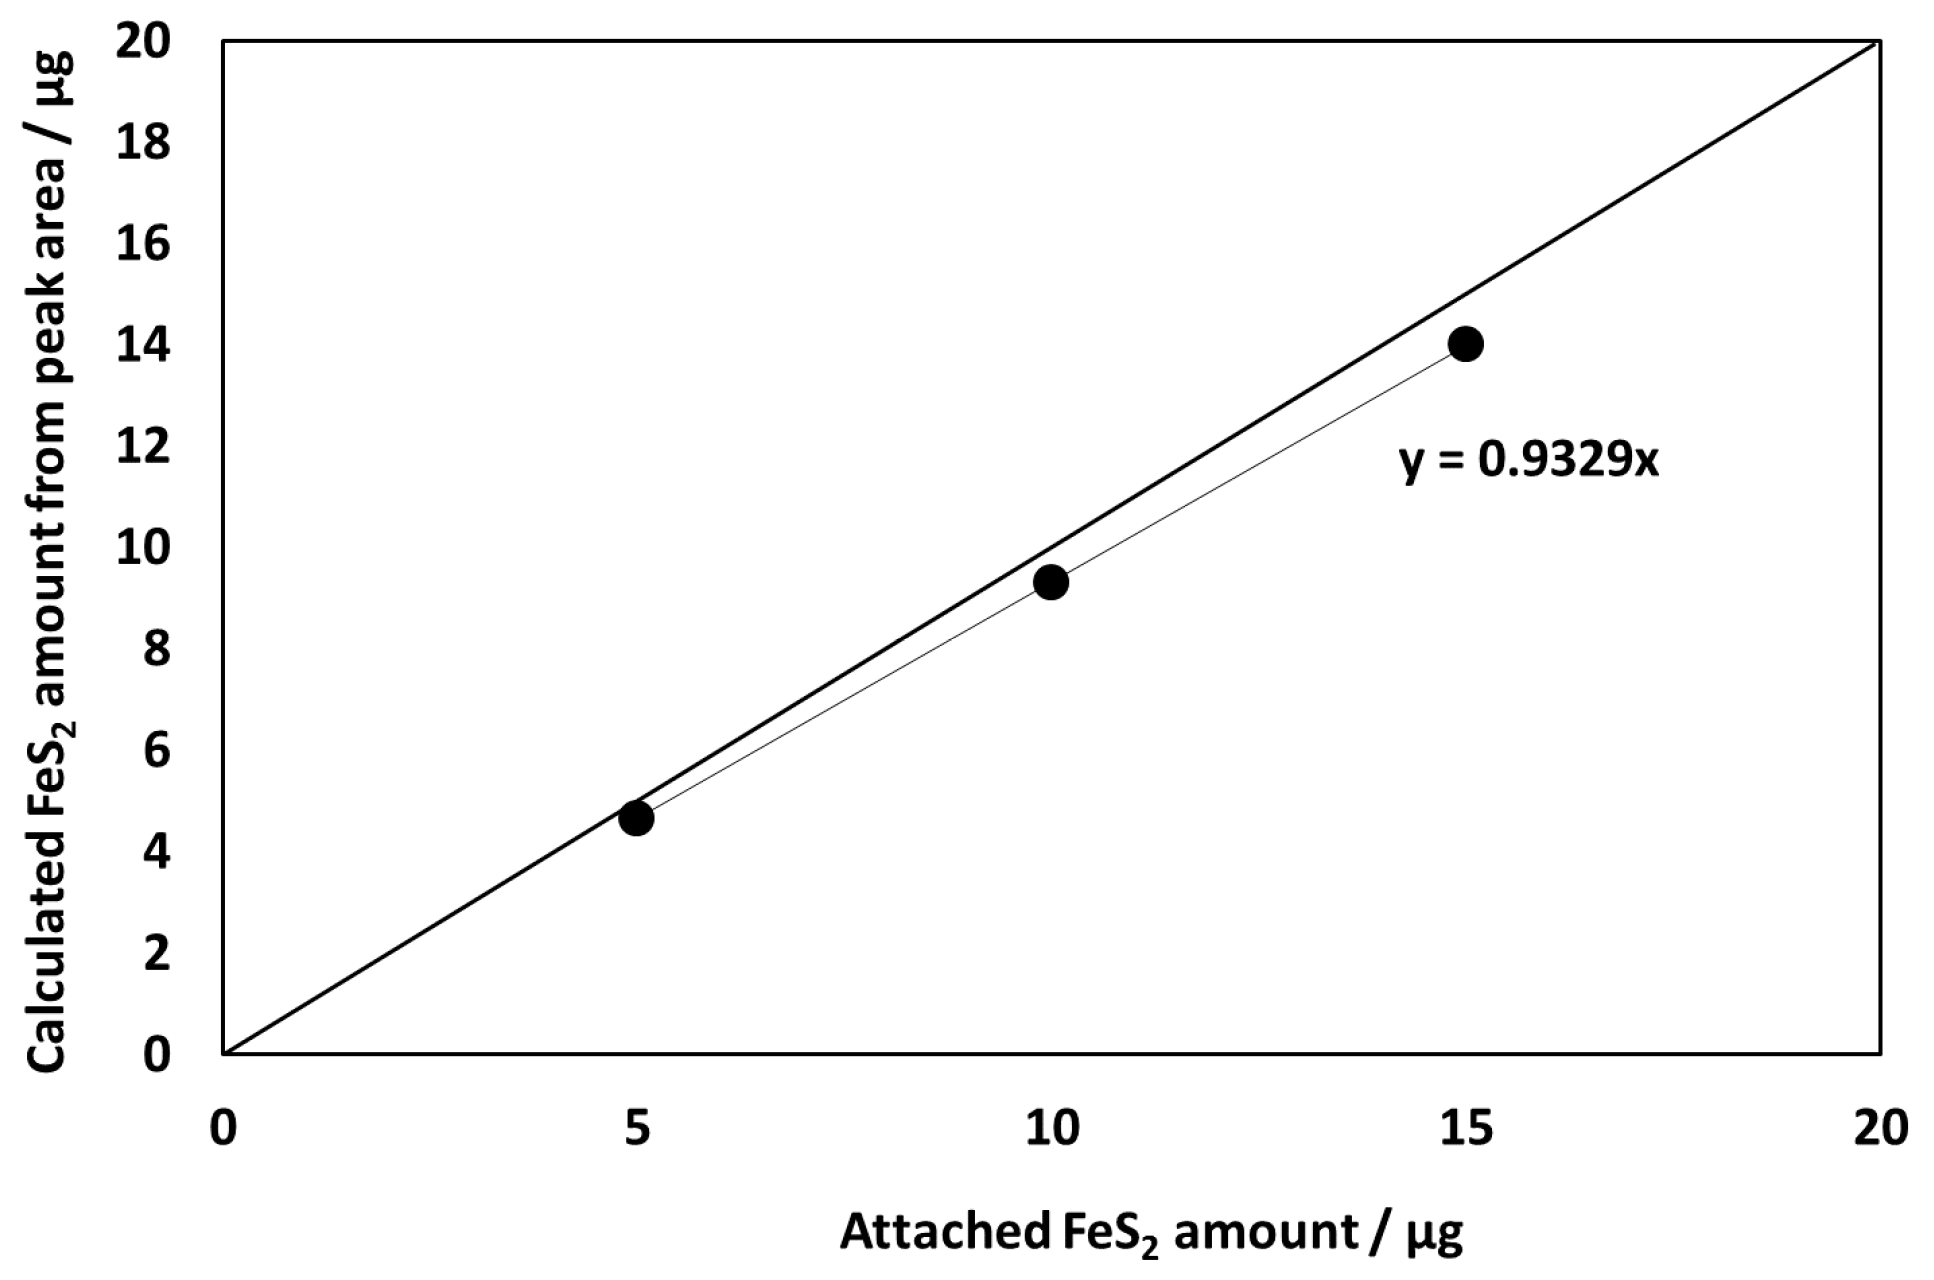
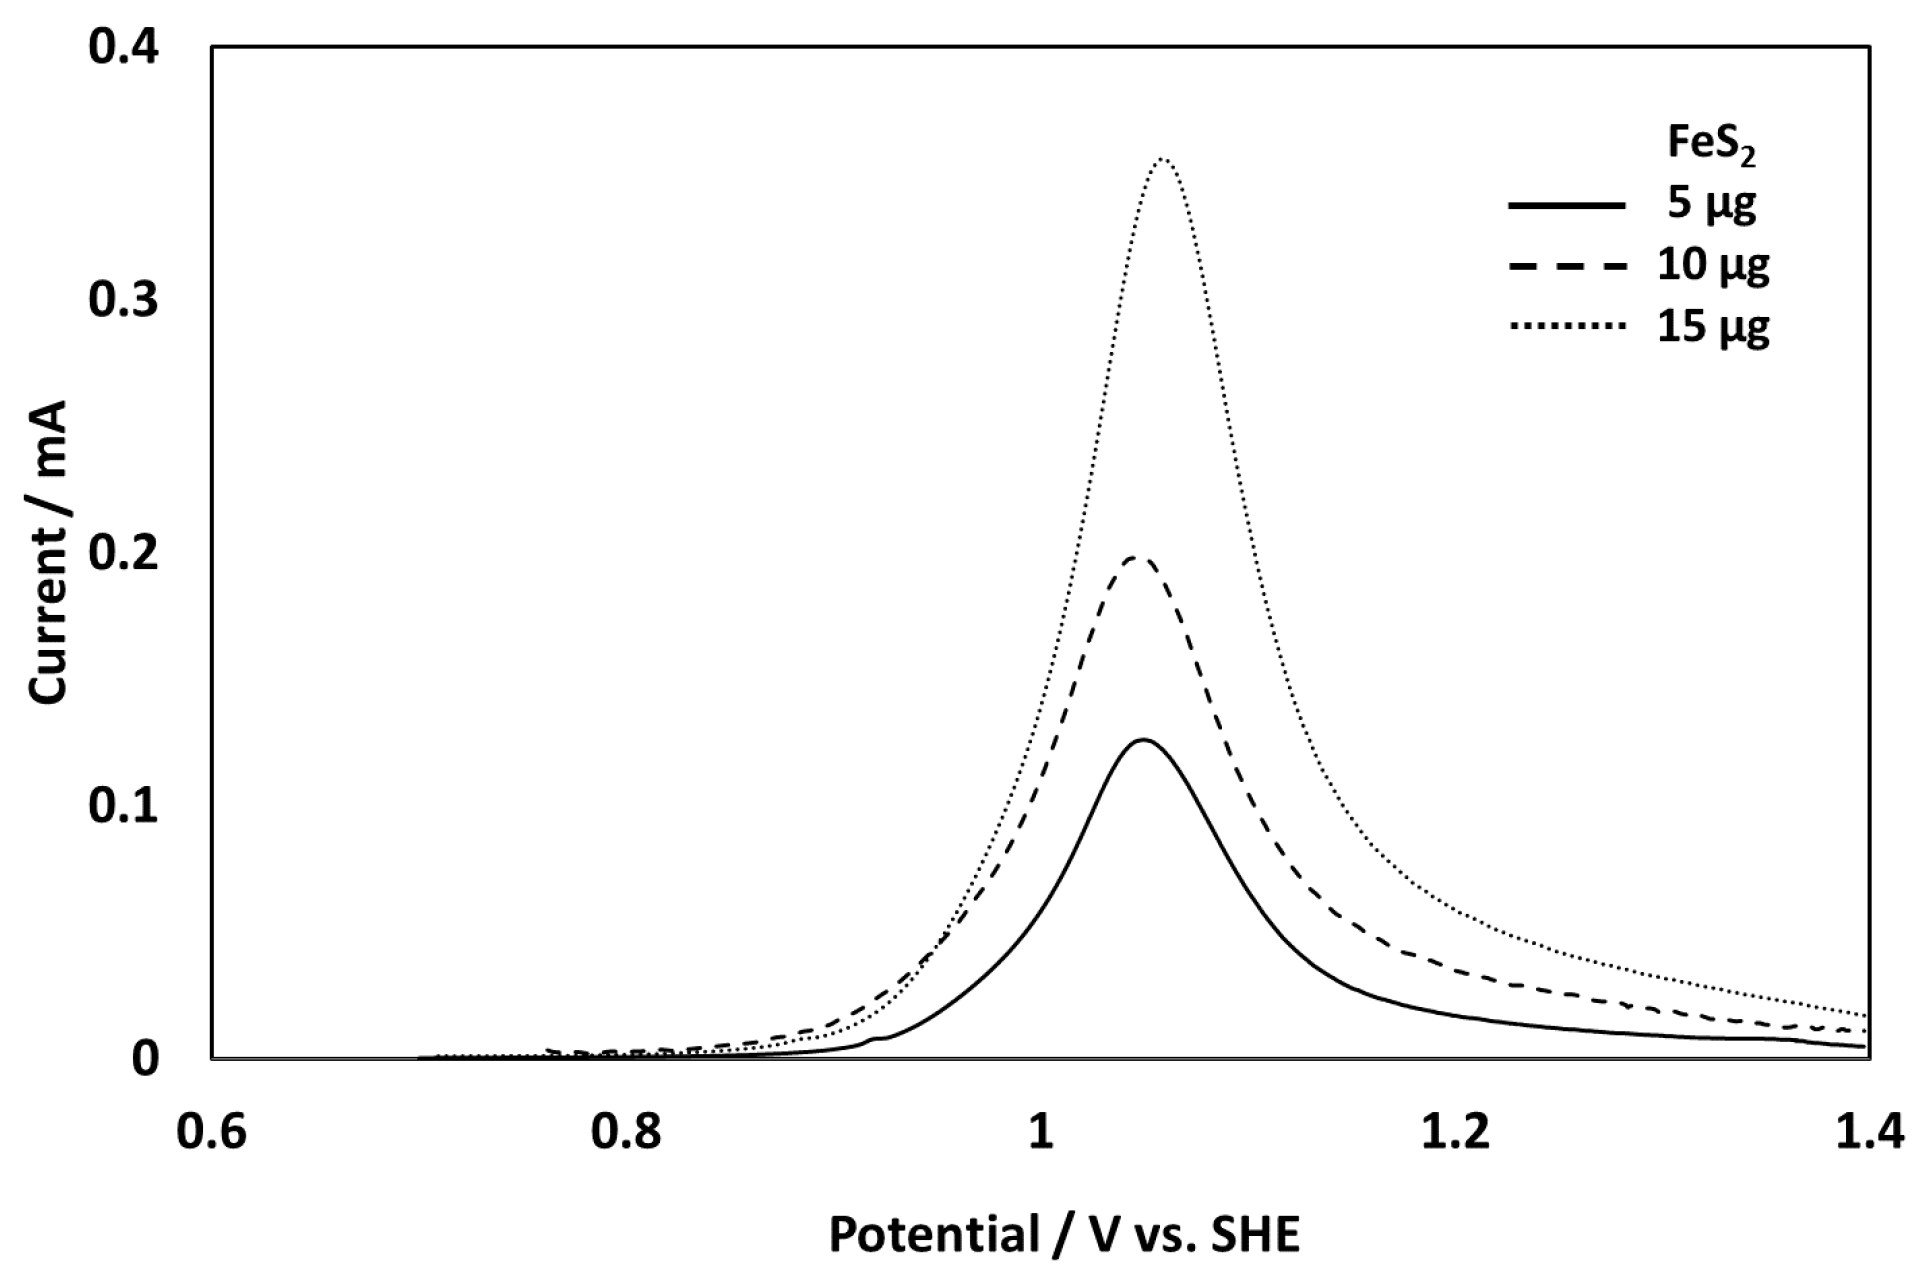
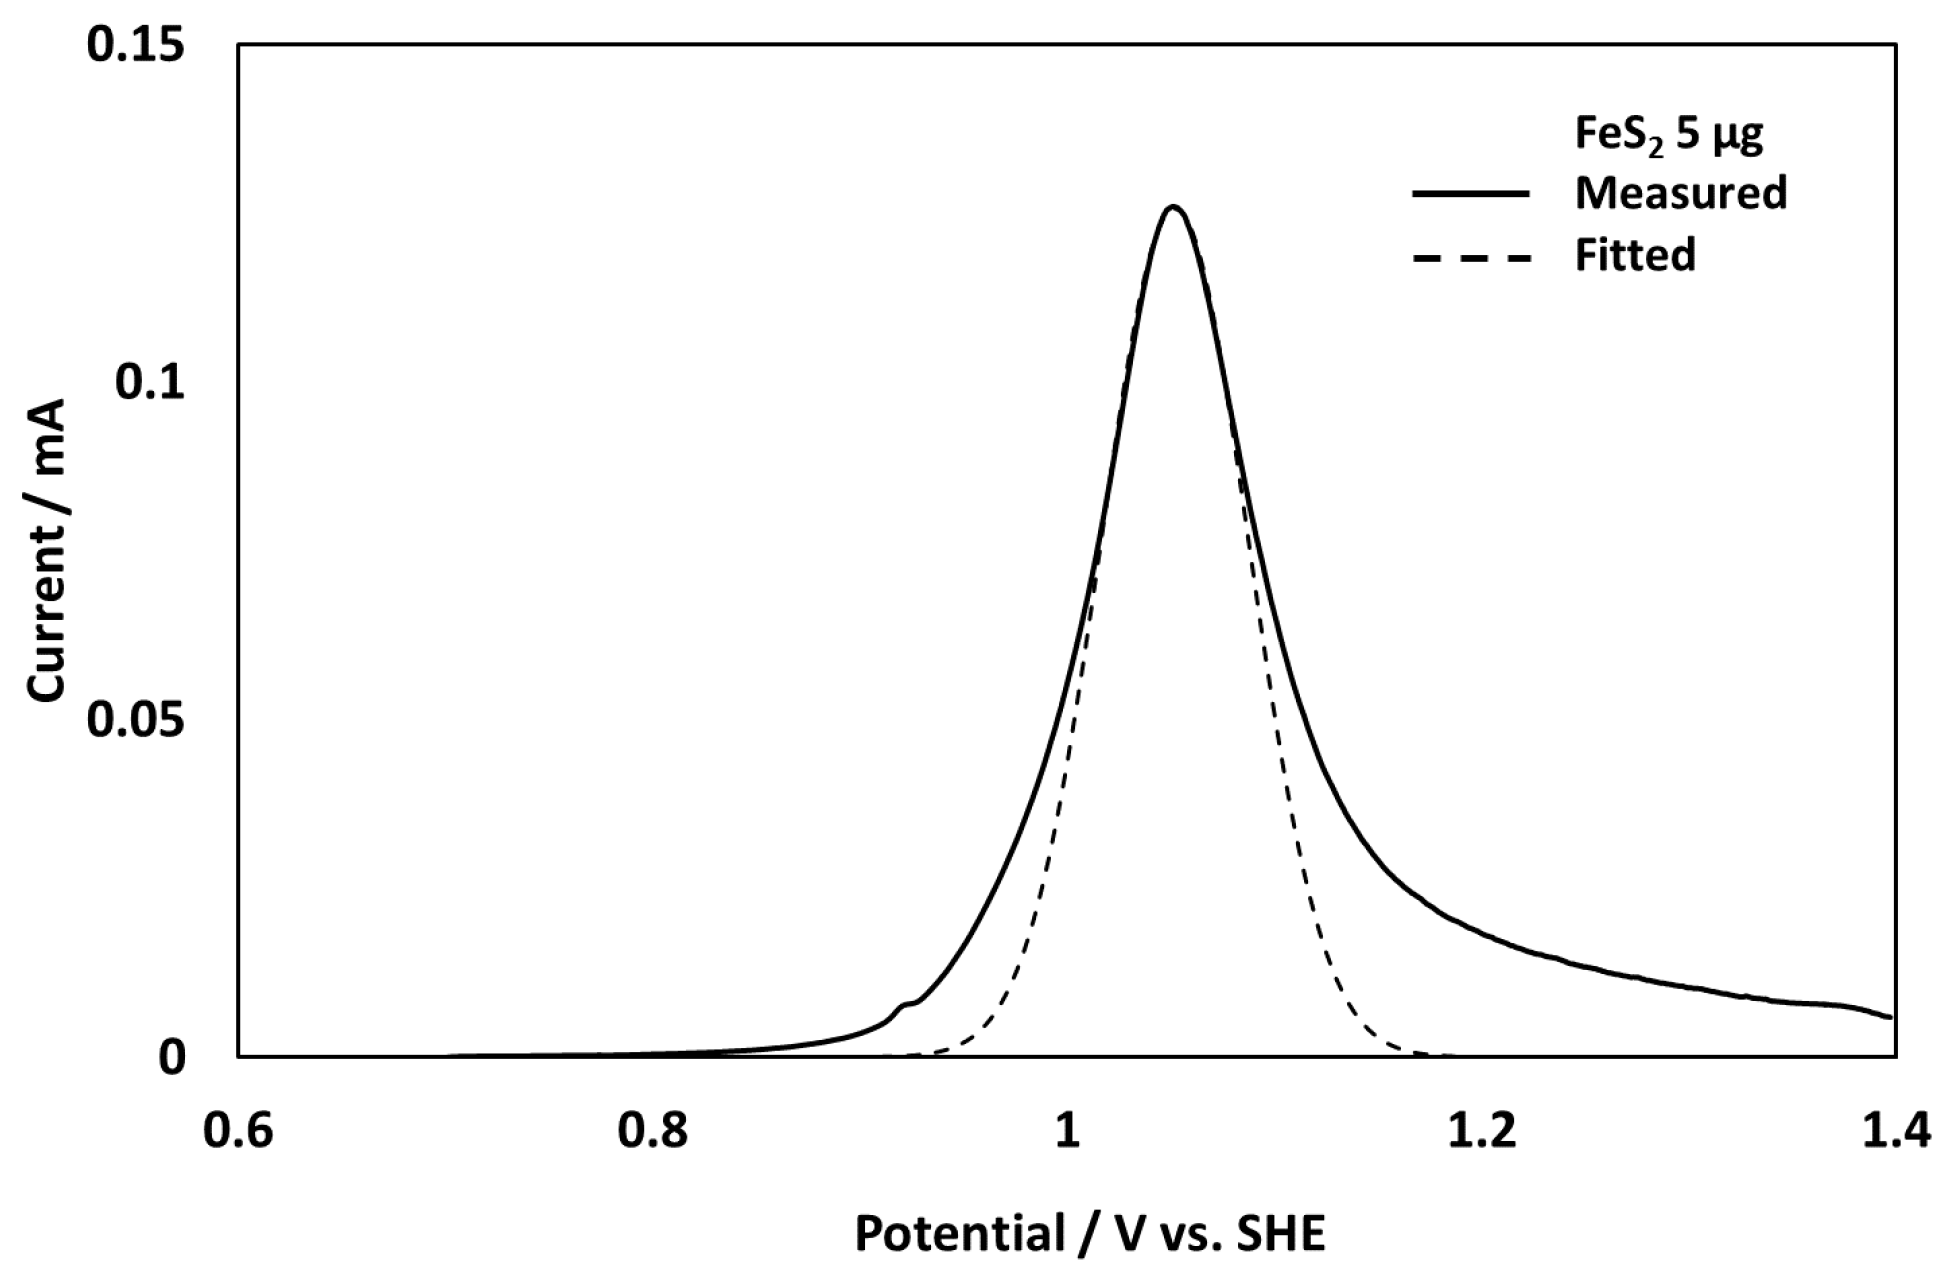
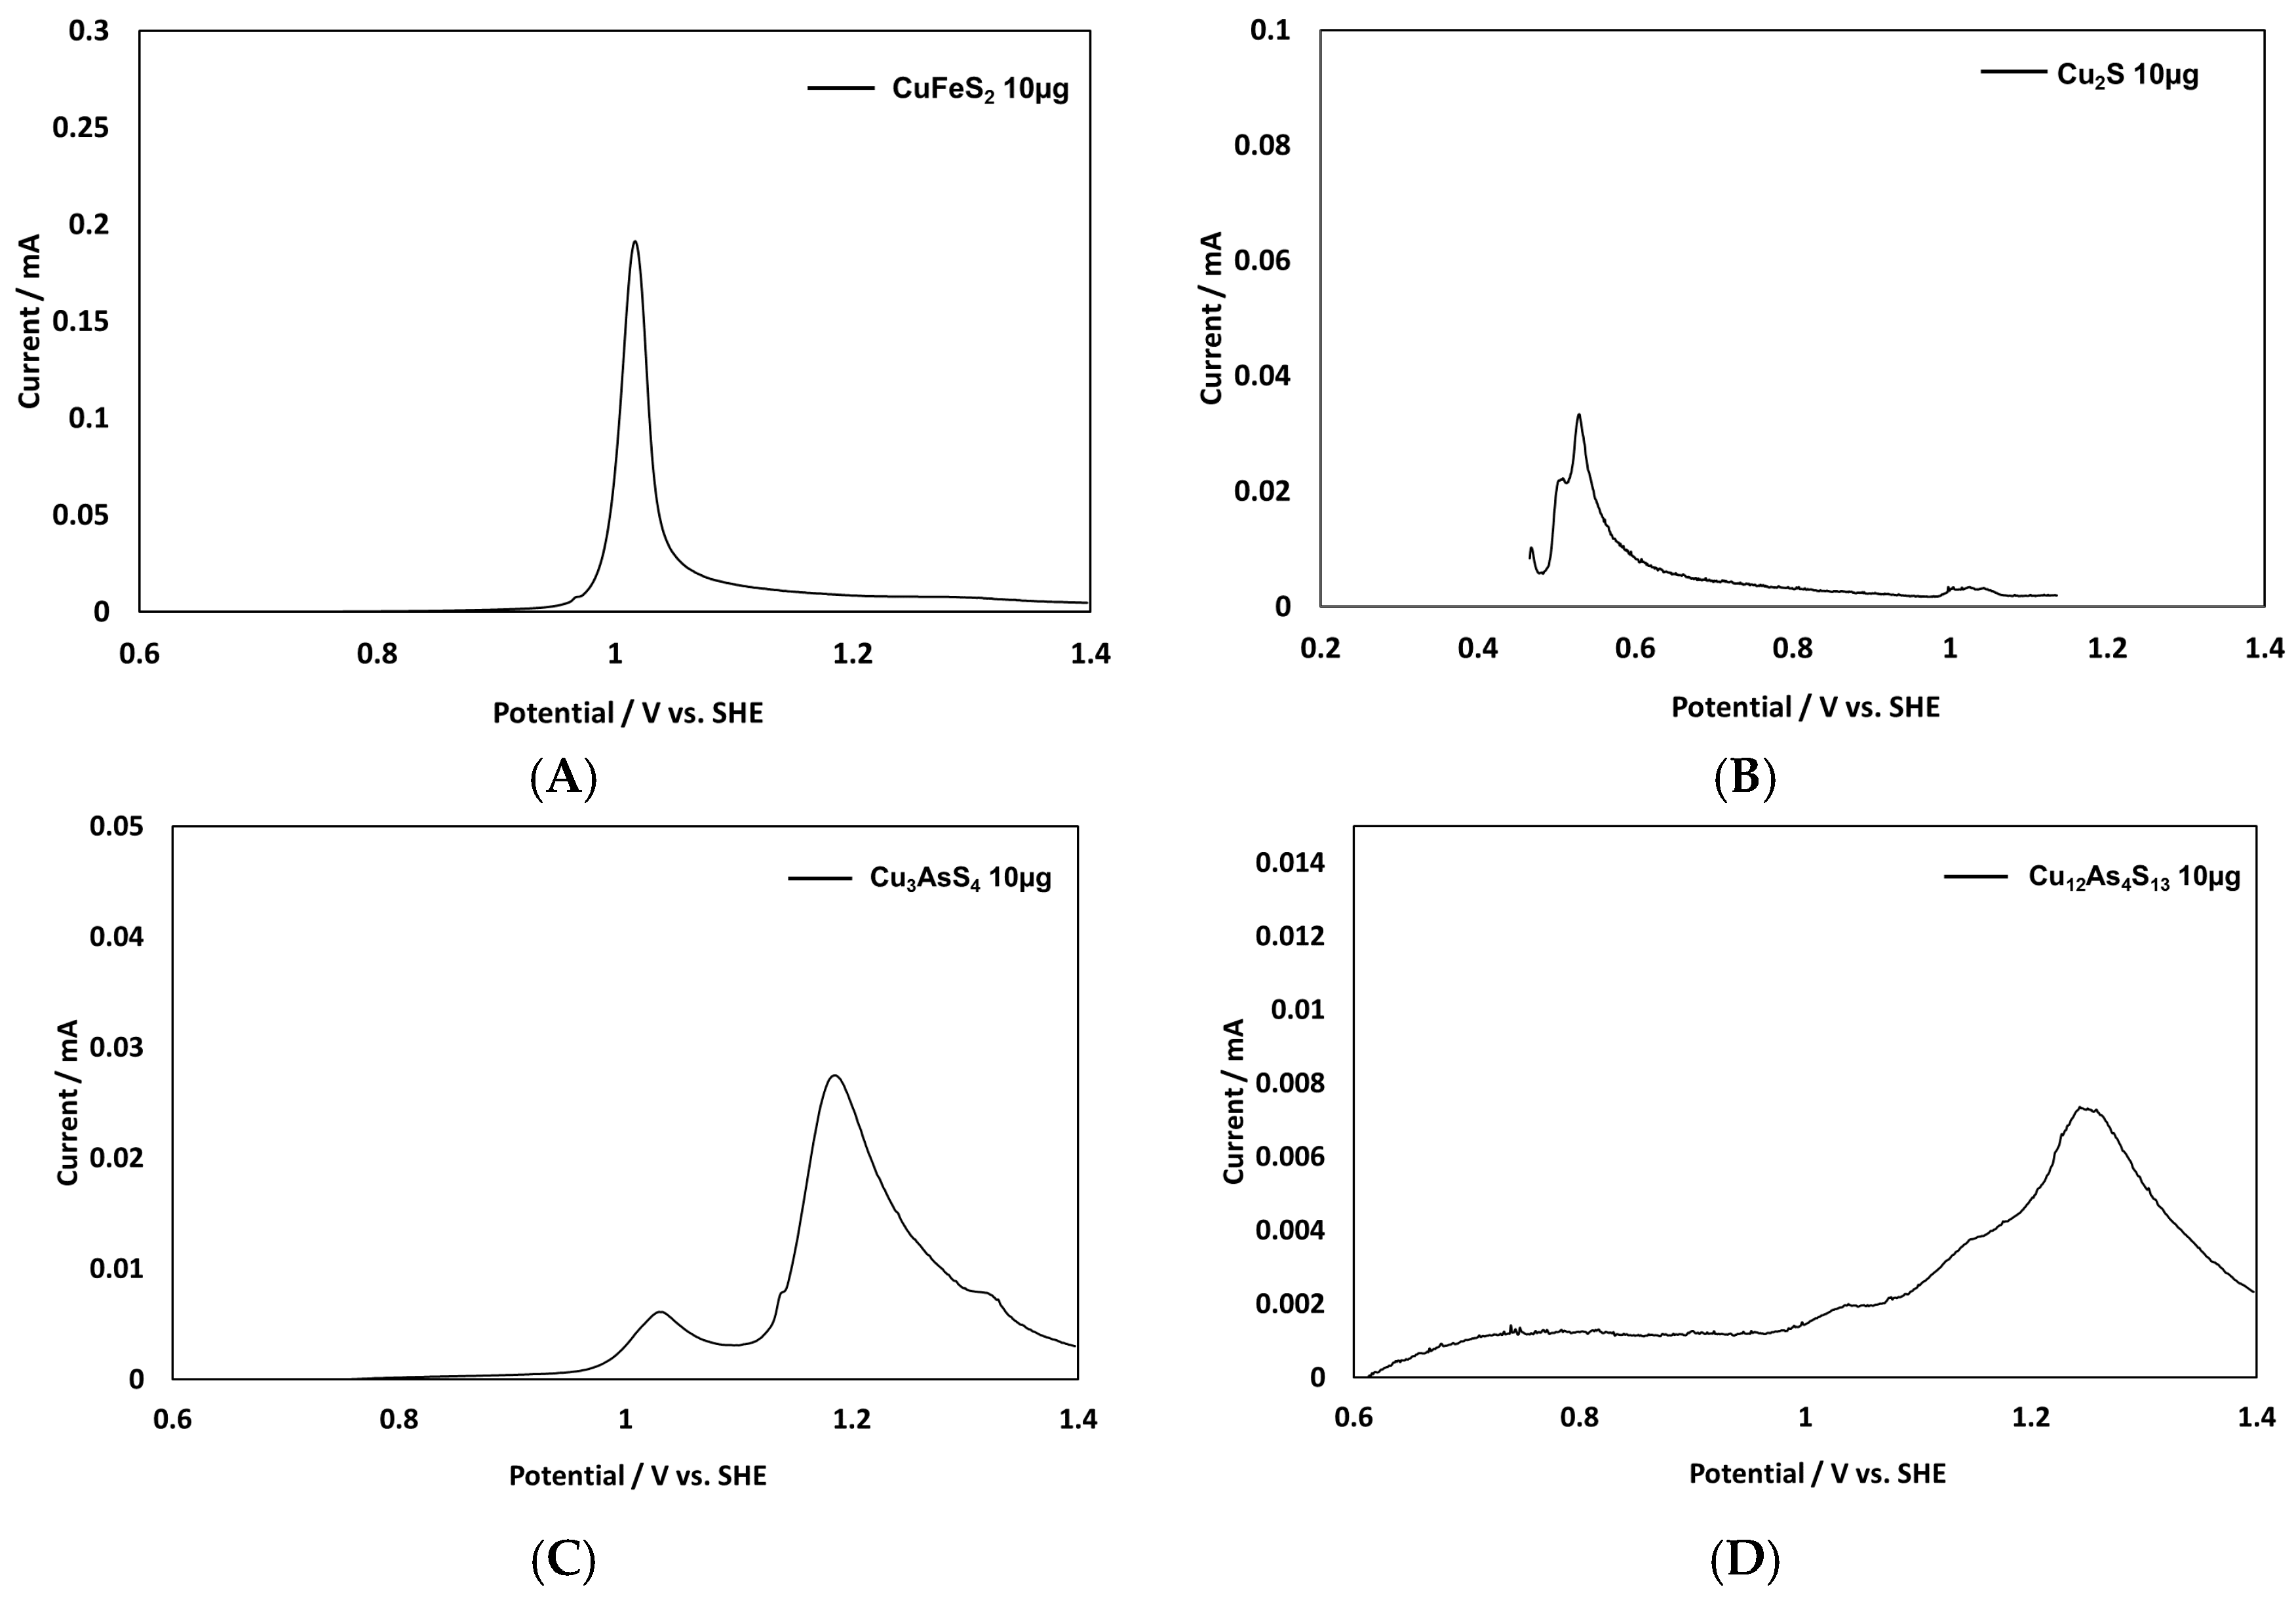
3.1. Evaluation of the New Electrode System

To evaluate the new electrode system, 5 µg of a fine pyrite powder sample was attached to the surface of the platinum sheet using the method provided in the experimental procedure, and the potential polarization was determined. Figure 1 shows the voltammogram obtained under these conditions and includes replicate experimental results. A sharp peak was obtained at 1.05 V with high reproducibility. If sensitivity of this result was compared with the result obtained by a solid electrode [5] or a sample mixed in a carbon paste electrode [6], the new electrode system seems superior.
The effect of the amount of attached sample was investigated by adjusting the micrograms of attached suspension amount as described in the experimental procedure. Figure 2 shows that the voltammogram peak increased with the increase in sample mass from 5 to 15 µg. It is because more attached sample means increasing the oxidized sample mass, i.e., peak height and peak area in the anode region also increased since the anodic current indicates the oxidation rate on the electrode surface.
Peak fitting was carried out by using a pyrite peak and by the Gaussian function to estimate the oxidized sample. Figure 3 shows the pyrite oxidation peak and the peak fitted with the Gaussian function.
It is assumed that pyrite is oxidized with the following equation [7]:
FeS2 = Fe3+ + 2S0 + 3e.
From this fitted peak area, the oxidized pyrite amount was calculated from
W = C × M F × n ,
where W is the mass of oxidized pyrite (g); C is the total charge of peak area (C), which is calculated from the current on each potential and scan rate; F is the Faraday constant (96,485 C); and n is the number of electrons required to oxidize one molecule of pyrite (in this case, n is equal to 3). The peak was fitted at the top and was assumed to be symmetrical. The asymmetry in the lower and higher potential regions can be explained by oxidized sulfur oxidation or some other by-reaction. The oxidized pyrite mass was calculated to be 4.66 µg, which is similar to the attached pyrite sample mass of 5 µg. This estimate was determined for the voltammogram of pyrite with 5–15 µg of the attached sample. Figure 4 shows a straight-line relationship (with 93% correlation) between the attached and calculated mass of pyrite from the Gaussian fitted peak area. This result indicates that this new electrode system could be used for quantitative analysis.
This electrode system has also been used with other sulfide minerals. Figure 5 shows the voltammogram of a 10-µg chalcopyrite (CuFeS2, Figure 5A), chalcocite (Cu2S, Figure 5B), enargite (Cu3AsS4, Figure 5B) and tennantite (Cu12As4S13, Figure 5C) samples.
As shown in Figure 5A, the chalcopyrite oxidation peak exists at 1.02 V and the peak potential is similar to that of pyrite. In this case, the chalcopyrite oxidation reaction is given as follows [8]:
CuFeS2 = Cu2+ + Fe3+ + 2S0 + 5e.
From the thermodynamic calculation software [9], the pyrite oxidation (Equation (1)) and chalcopyrite oxidation (Equation (2)) standard potential can be obtained as 0.494 V. This potential is low compared with that obtained from the peak potential of chalcopyrite (1.02 V) and pyrite (1.05 V), and it confirms that chalcopyrite and pyrite are refractory because these minerals show a passivation effect and their oxidation potential is high. The peak shape is sharp compared with pyrite, and the oxidation current at the foot of the pyrite peak is ∼0.9 V higher than that of chalcopyrite, which suggests that pyrite oxidation occurs at a lower potential than that of chalcopyrite, although the oxidation peak of pyrite is similar to that of chalcopyrite.
Figure 5B shows two chalcocite oxidation peaks at ∼0.503 and 0.529 V. These peaks are low compared with pyrite and chalcopyrite. Although the standard potential of chalcocite in Equation (4) [10] (0.561 V) [9] is higher than that of chalcopyrite (0.494 V) and pyrite (0.494 V), chalcocite oxidation dissolution is easier than that of chalcopyrite and pyrite because of the passivation effect on chalcopyrite and pyrite.
Cu2S = 2Cu2+ + S.
Chalcocite oxidation can occur in the following steps [10]:
Cu2S = CuS + Cu2+ + 2e;
CuS = Cu2+ + S + 2e.
A comparison of the standard and peak potentials shows that the first peak (0.503 V) is similar to that of the chalcocite oxidation potential to covellite (0.491 V) [9], and this first peak may be chalcocite oxidation to covellite. However, the second peak at 0.529 V is lower than that of the covellite or chalcocite oxidation peaks. Miki et al. [10] indicated that covellite, which is produced from chalcocite oxidation, is more easily oxidized than crystalline covellite. The second peak may be a covellite oxidation peak that is produced from chalcocite oxidation. Two peaks on the chalcocite oxidation peak can be explained by chalcocite oxidation to covellite and covellite oxidation.
As shown in Figure 5C, enargite produces two peaks; one is a small peak at 1.032 V and the other is a large peak at 1.189 V. The enargite oxidation current continued at a higher large peak potential, which shows that the oxidation reaction continues. Controversial reports exist on enargite oxidation, but the total oxidation reaction can be expressed as follows [11]:
Cu3AsS4 + 4H2O = 3Cu2+ + H2AsO4 + 4S + 6H+ + 11e.
Enargite dissolution has been reported to show a passivation effect [11] similar to pyrite and chalcopyrite, with a peak visible only in a higher potential region. Córdova et al. [12] indicated that enargite dissolution can occur with the preferential dissolution of copper ions.
Cu3AsS4 = Cu(3−x)AsS4 + xCu2+ + 2xe.
This reaction helps explain the two enargite dissolution peaks; the first peak results from copper dissolution, and the other peak is from intermediate product oxidation. This can apply to the selective copper dissolution of enargite.
Figure 5D shows that tennantite exhibits a broad peak, but has a roughly similar trend in the enargite dissolution peak, with a small peak in a lower potential region and a main peak at a higher potential region. Overall tennantite oxidation occurs as follows [13]:
Cu12As4S13 + 16H2O = 12Cu2+ + 4H2AsO4 + 13S + 24H+ + 44e.
However, tennantite has many complex forms and sometimes it is not uniform. This may result in an unclear peak compared with the enargite peak. A similar trend for the tennantite occurs, as well as for enargite, because of the preferential oxidation of copper. This can also apply to the selective dissolution of copper from copper-containing arsenic sulfide minerals. This optimum condition should be confirmed with further study.

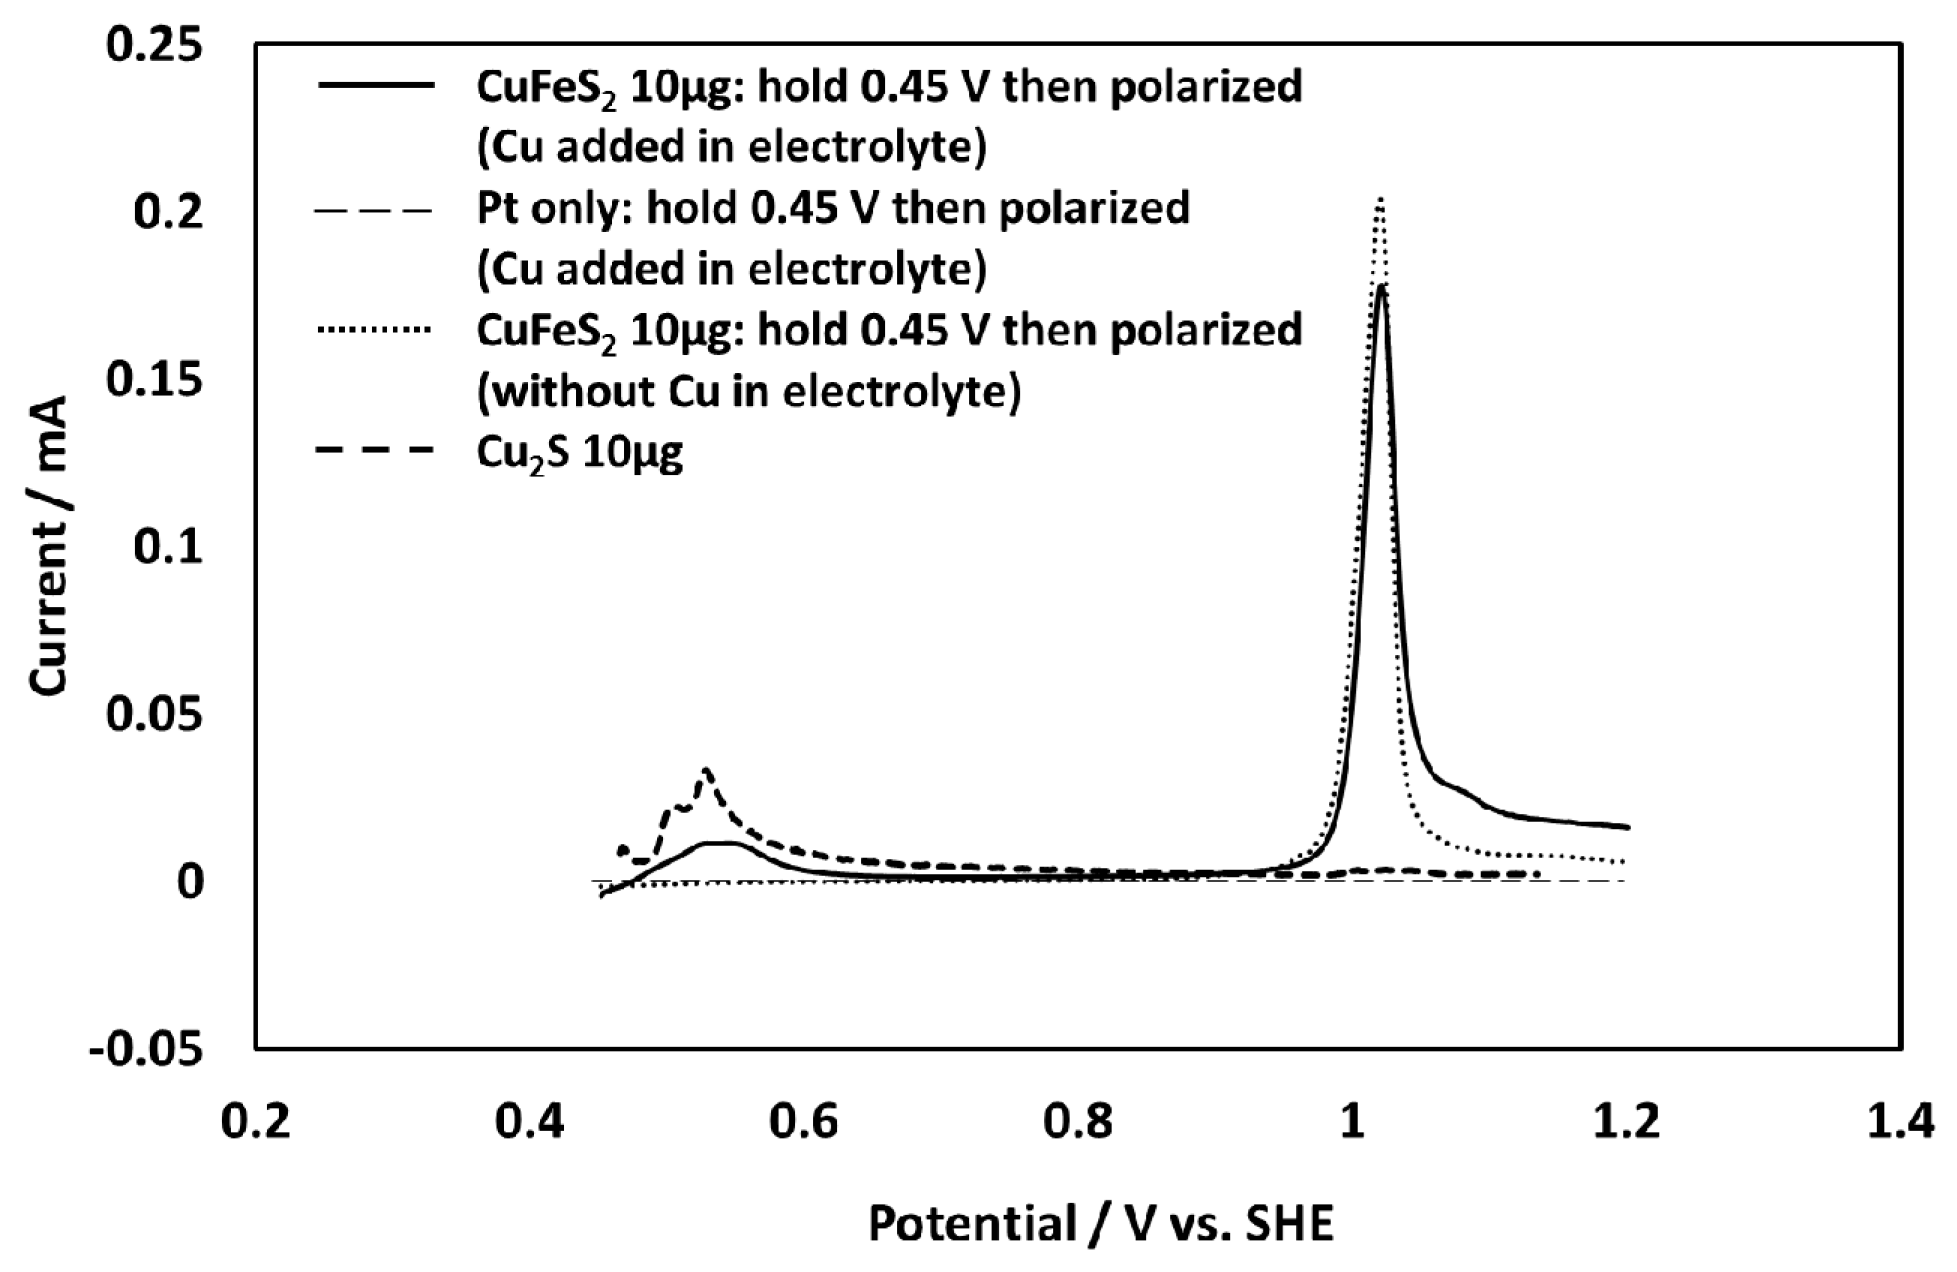
3.2. Analysis of Chalcopyrite Dissolution Mechanics

The new powder electrode system has a high reproducibility and sensitivity. To test its applicability, an analysis of the chalcopyrite dissolution mechanics, for which the dissolution behaviour is controversial, was carried out. Chalcopyrite is the most abundant copper resource, but hydrometallurgical copper recovery from chalcopyrite is problematic because the chalcopyrite dissolution is low. It has been suggested that chalcopyrite forms a passivation layer during dissolution due to produced elemental sulphur [14], recently thought to be produced copper polysulfide [15]. It has also been reported that chalcopyrite dissolution is enhanced significantly within a certain potential window (0.55–0.62 V vs. standard hydrogen electrode) because chalcopyrite is reduced to chalcocite in the presence of copper ions (Equation (10)), and this reduced chalcocite oxidation (Equation (4)) is easier than that of chalcopyrite dissolution [16,17,18].
CuFeS2 + 3Cu2+ + 4e = 2Cu2S + Fe2+.
However, this mechanism is controversial and is not widely accepted because chalcopyrite reduction and intermediate chalcocite oxidation occur simultaneously in the same system, and intermediate chalcocite is not detected with any analysis. One of the reasons for the undetected chalcocite is that the intermediate chalcocite is unstable and is difficult to detect. The detection of intermediate chalcocite by this new electrode system was carried out to confirm this mechanism.
To confirm chalcopyrite reduction to chalcocite in the presence of copper ions, chalcopyrite fine powder electrode was held at 0.45 V for 300 s in the presence of 0.01-M copper ion with 0.1-M sulfuric acid electrolysis, and the potential was swept in the anodic direction at 10 mV·s−1. Figure 6 shows the voltammogram for the chalcopyrite electrode that was held at 0.45 V for 300 s, after which the potential was polarized in the anodic direction. The chalcocite potential polarization results are also shown in Figure 6. The reduced chalcopyrite has a broad peak around 0.5 V and then a sharp large peak at 1.0 V. The sharp peak is consistent with the chalcopyrite oxidation peak as shown in Figure 5A. The other broad peak at 0.5 V is consistent with the chalcocite oxidation peak. As confirmation, the same experiment was carried out for chalcopyrite electrode without copper ions, but no peak resulted. This means that chalcopyrite reduction does not occur at 0.45 V without copper ions. The same experiments were carried out using a platinum electrode with copper ions, and no peak was obtained. This result indicates that copper ions cannot be reduced to metallic copper under this condition. These results indicate that chalcopyrite can be reduced to chalcocite in the presence of copper ions, and this result also confirms the controversial chalcopyrite leaching mechanism, where chalcopyrite dissolution is enhanced within a certain potential window because chalcopyrite is reduced to amenable chalcocite in the presence of copper ions.

4. Conclusions

A relatively easy method was developed for the preparation of a fine microgram powder sulfide mineral electrode system. This electrode has a high reproducibility and provided relatively sensitive symmetrical peaks for various sulfide minerals such as pyrite, chalcopyrite, chalcocite, enargite, and tennantite. Gaussian fitting of this result indicates the possibility of quantitative analysis using this electrode. This electrode system method can work as a standard for fine powder sulfide.
We estimated the controversial chalcopyrite leaching mechanism with this electrode system. Chalcopyrite dissolution is enhanced because chalcopyrite is reduced to chalcocite, and intermediate chalcocite is key to supporting this model. In the new electrode system, powder chalcopyrite was attached and held at 0.45 V in the presence of copper ions in acidic media, followed by the potential being polarized in the anodic direction. A small peak was obtained at ∼0.5 V, and this small peak was consistent with that of chalcocite. The results support a reaction model in which chalcopyrite is reduced to amenable chalcocite.

Acknowledgments

We appreciate the support of this research by Sumitomo Metal Mining, Co., Ltd. (Tokyo, Japan) and by a Grant-in-Aid for Science Research (grant numbers 15H02333 and 16K06929) from the Japan Society for the Promotion of Science (JSPS).

Author Contributions

Hajime Miki and Kazunori Oka carried out experiments. Hajime Miki designed research plan and wrote paper, Tsuyoshi Hirajima and Keiko Sasaki contributes discussion of research results and data analysis.

Conflicts of Interest

The authors declare no conflict of interest.

References

  1. Grygar, T.; Marken, F.; Schröder, U.; Scholz, F. Electrochemical analysis of solids. A review. Collect. Czech. Chem. Commun. 2002, 67, 163–208. [Google Scholar] [CrossRef]
  2. Almeida, C.M.V.B.; Giannetti, B.F. A new and practical carbon paste electrode for insoluble and ground samples. Electrochem. Commun. 2002, 4, 985–988. [Google Scholar] [CrossRef]
  3. Eghbalnia, M.; Dixon, D.G. Electrochemical study of leached chalcopyrite using solid paraffin-based carbon paste electrodes. Hydrometallurgy 2011, 110, 1–12. [Google Scholar]
  4. Nicol, M.J.; Miki, H. Applications of the Electrochemistry of Fine Mineral Sulfides. In Proceedings of the Jan D. Miller Symposium—Innovations in Natural Resource Processing, Salt Lake City, UT, USA, 28 February–2 March 2005; pp. 179–192.
  5. Nicol, M.J.; Miki, H.; Basson, P. The effects of sulphate ions and temperature on the leaching of pyrite. 2. Dissolution rates. Hydrometallurgy 2013, 133, 182–187. [Google Scholar] [CrossRef]
  6. Liu, Y.; Dang, Z.; Wu, P.X.; Lu, J.; Shu, X.; Zheng, L. Influence of ferric iron on the electrochemical behavior of pyrite. Ionics 2011, 17, 169–176. [Google Scholar] [CrossRef]
  7. Kelsall, G.H.; Yin, Q.; Vaughan, D.J.; England, K.E.R.; Brandon, N.P. Electrochemical oxidation of pyrite (FeS2) in aqueous electrolytes. J. Electroanal. Chem. 1999, 471, 116–125. [Google Scholar] [CrossRef]
  8. Biegler, T.; Horne, M.D. The Electrochemistry of Surface Oxidation of Chalcopyrite. J. Electrochem. Soc. 1985, 132, 1363–1369. [Google Scholar] [CrossRef]
  9. HSC Chemistry, Version 6.0; Chemical Reaction and Equilibrium Software; Outotec Co., Ltd.: Espoo, Finland, 2006.
  10. Miki, H.; Nicol, M.J.; Velásquez-Yévenes, L. The kinetics of dissolution of synthetic covellite, chalcocite and digenite in dilute chloride solutions at ambient temperatures. Hydrometallurgy 2011, 105, 321–327. [Google Scholar] [CrossRef]
  11. Lattanzi, P.; Pelo, S.D.; Musu, E.; Atzei, D.; Elsener, B.; Fantauzzi, M.; Rossi, A. Enargite oxidation: A review. Earth Sci. Rev. 2008, 86, 62–88. [Google Scholar] [CrossRef]
  12. Córdova, R.; Gómez, H.; Real, S.G.; Schrebler, R.; Vilche, J.R. Characterization of natural enargite/aqueous solution systems by electrochemical techniques. J. Electrochem. Soc. 1997, 144, 2628–2636. [Google Scholar] [CrossRef]
  13. Sasaki, K.; Takatsugi, K.; Ishikura, K.; Hirajima, T. Spectroscopic study on oxidative dissolution of chalcopyrite, enargite and tennantite at different pH values. Hydrometallurgy 2010, 100, 144–151. [Google Scholar] [CrossRef]
  14. Dutrizac, J.E.; MacDonald, R.J.C.; Ingraham, T.R. The kinetics of dissolution of Synthetic Chalcopyrite in aqueous acidic ferric sulfate solutions. Trans. Met. Soc. AIME 1969, 245, 955–959. [Google Scholar]
  15. Hackel, R.P.; Dreisinger, D.B.; Peters, E.; King, J.A. Passivation of chalcopyrite during the oxidative leaching in sulfate media. Hydrometallurgy 1995, 39, 25–48. [Google Scholar] [CrossRef]
  16. Hiroyoshi, N.; Miki, H.; Hirajima, T.; Tsunekawa, M. A model for ferrous-promoted chalcopyrite leaching. Hydrometallurgy 2000, 57, 31–38. [Google Scholar] [CrossRef]
  17. Hiroyoshi, N.; Miki, H.; Hirajima, T.; Tsunekawa, M. Enhancement of chalcopyrite leaching by ferrous ions in acidic ferric sulfate solutions. Hydrometallurgy 2001, 60, 185–197. [Google Scholar] [CrossRef]
  18. Hiroyoshi, N.; Kuroiwa, S.; Miki, H.; Tsunekawa, M.; Hirajima, T. Synergistic effect of cupric and ferrous ions on active-passive behavior in anodic dissolution of chalcopyrite in sulfuric acid solutions. Hydrometallurgy 2004, 74, 103–116. [Google Scholar] [CrossRef]
Figure 1. Potential polarization with 5 µg of pyrite that is attached to the platinum plate surface. Experiments were repeated (runs 1 and 2) to determine the reproducibility.
Minerals 06 00103 g001
Figure 2. Effect of the attached amount of pyrite on the voltammogram. Potential polarization with 5–15 µg of pyrite that is attached to the platinum plate surface.
Minerals 06 00103 g002
Figure 3. Pyrite voltammogram and the result of peak fitting with a Gaussian function. The pyrite voltammogram is the result of potential polarization with 5 µg of pyrite that is attached to the platinum plate surface.
Minerals 06 00103 g003
Figure 4. Relationships between the attached amount of pyrite on the platinum plate surface and the calculated amount of pyrite from the peak area of Gaussian fitted peak with the voltammogram.
Minerals 06 00103 g004
Figure 5. Comparison between voltammograms on various sulfide mineral: result of potential polarization with 10 µg of chalcopyrite (A) and chalcocite (B); result of potential polarization with 10 µg of enargite (C) and tennantite (D).
Minerals 06 00103 g005
Figure 6. Voltammogram with or without 10 µg of chalcopyrite that is attached to the platinum plate surface and was held at 0.45 V for 300 s before the potential was polarized in the anodic direction at a 1 mV·s−1 scan rate under ambient conditions. The electrolyte is 0.1-M H2SO4 with or without 0.01-M Cu2+. The chalcocite potential polarization results that are shown in Figure 5B are added to this graph for comparison.
Minerals 06 00103 g006
Table 1. Chemical composition of each sample (%).
SampleCuFeAsSSi
Pyrite0.00744.7053.80.2
Chalcopyrite34.629.0033.77.9
Chalcocite84.80.7022.60.2
Enargite40.76.914.128.60
Tennantite47.53.218.629.43.8

