Article

Preventive Replacement Decisions for Dragline Components Using Reliability Analysis

Department of Mining Engineering, Middle East Technical University, 06800 Çankaya Ankara, Turkey
*
Author to whom correspondence should be addressed.
Minerals 2016, 6(2), 51; https://doi.org/10.3390/min6020051
Submission received: 30 January 2016 / Revised: 18 May 2016 / Accepted: 20 May 2016 / Published: 30 May 2016
(This article belongs to the Special Issue Frontiers of Surface Mining Research)

Abstract

:
Reliability-based maintenance policies allow qualitative and quantitative evaluation of system downtimes via revealing main causes of breakdowns and discussing required preventive activities against failures. Application of preventive maintenance is especially important for mining machineries since production is highly affected from machinery breakdowns. Overburden stripping operations are one of the integral parts in surface coal mine productions. Draglines are extensively utilized in overburden stripping operations and they achieve earthmoving activities with bucket capacities up to 168 m3. The massive structure and operational severity of these machines increase the importance of performance awareness for individual working components. Research on draglines is rarely observed in the literature and maintenance studies for these earthmovers have been generally ignored. On this basis, this paper offered a comprehensive reliability assessment for two draglines currently operating in the Tunçbilek coal mine and discussed preventive replacement for wear-out components of the draglines considering cost factors.

Graphical Abstract

1. Introduction

Mining is a machine-intensive sector where different systems with different operational tasks are employed at production areas. Concordantly, various mining machineries are purchased annually to be utilized in underground and surface mines and many of them are exposed to more than expected failures during operations due to inadequate maintenance policies. Some of them are retired earlier than their expected lifetimes since they can no longer be utilized economically. This condition necessitates careful consideration of reliability measures for machinery components and enhancement of preventive activities in maintenance policies. In this basis, stochastic reliability models can be utilized to characterize system components and to decide those components that can be replaced preventively for effective maintenance. In this way, downtime losses due to maintenance and the resultant interruptions in mine production can be reduced, as well as sustaining the functional health of machineries.
Overburden stripping is an integral part of surface coal mining operations. Efficiency in these operations has a great impact on the overall operating cost and mine productivity. Draglines are frequently-used earthmovers in stripping operations, together with shovel-truck dispatching systems. In the United States alone, almost half of the stripping operations are achieved using draglines with a bucket capacity of more than 40 yd3 (30 m3) [1]. These earthmovers hold massive structural bodies over 4000 tonnes and capital investment up to $100 million [2]. They achieve overburden stripping via dragging of their buckets suspended from a boom with a varying length between 37 and 128 m [3]. Draglines manufactured in recent decades generally hold a bucket volume up to 125 m3 and they may remove 30–35 million m3 of overburden annually [4]. Various components with high functional dependency league together to ensure the actions of a dragline, such as, hoisting, dragging, swing, and walking. Any production delay due to a system breakdown induced by these components may cause an economical loss up to $1 million per day [2]. Therefore, investigation of component performance is critically important to evaluate dragline reliabilities and to reveal underlying reasons for downtimes. On this basis, the reliability concept offers a probabilistic tool to characterize systems elements together with their failure modes and to improve maintenance strategies via effectively embedding questions of whom, how, when, and how long into maintenance policies. Reliability also helps the development of various proactive activities, such as preventive component replacement, capital equipment replacement, and optimization of maintenance issues such as inspection interval, crew capacity, and spare part policy. In this sense, this study carried out a comprehensive reliability assessment on individual components of draglines and discussed preventive component replacements in a financial manner.
In the literature, much research has been carried out on the reliability and maintenance of mining machineries, such as load-haul-dump [5,6,7,8,9,10,11,12,13,14], shovel [15,16,17,18,19], longwall shearer [20,21,22,23], drilling equipment [24,25,26,27,28], and draglines [29,30,31]. There are limited amounts of research for dragline reliability and maintenance. Previous studies only offered a rough assessment of dragline reliability without component or subsystem decomposition. In addition, component failure modes appearing in dragline operations and how/when to apply preventive maintenance for these components have been ignored in the literature. On this basis, this paper presents an in-depth reliability analysis and preventive replacement analysis for individual components of dragline. The methodology of the study (Figure 1) was applied for two draglines currently operating in the Tunçbilek coal mine, Turkey, and a 13-year maintenance record for the draglines was utilized in the analyses.
The methodology briefly covers (i) data acquisition and data decomposition, (ii) pre-processing of datasets to check data independency and trend, (iii) evaluation of component reliabilities, (iv) discussing wear-out levels of components, (iv) performing an age-replacement policy for applicable components, and (v) decision-making for optimal replacement intervals.
The paper was structured considering Figure 1 as follows: Section 2 include definitions on datasets and failure modes, data decomposition, and data trend and correlation tests. Section 3 examines component reliability estimations and component characterization. Detection of component wear-out levels, assumptions on preventive replacement policy, and optimal replacement decisions are discussed in Section 4. The main conclusions driven from the study are stated in Section 5.

2. Pre-Processing of Lifetime Datasets

Reliability basically inquires about system performances via responding to how/when/how frequent questions in the case of system failures. Accuracy of a reliability model depends on a complete definition of both failure modes arising in components and structural and functional dependencies between failures. In the definition of failure modes, this research study utilized machinery catalogues, personal interviews with maintenance experts, and maintenance records of two draglines currently operating in the Tunçbilek Coal Mine, Turkey. The records included the chronological failure occurrence and recovery times in a period between 1998 and 2011 and their brief explanations.
During an operation, a dragline throws its bucket away from the main frame, regarding the operational radius of its boom. Subsequently, ground material is stripped via dragging the bucket toward the main frame. Filled material is dumped into the spoil area following a swing action. The dragline proceeds this cycle successively. After completion of stripping in the area, the dragline renews its position using the walking mechanism. Regarding these operational abilities and failure records, the system was decomposed into seven main subsystems as hoisting, rigging, bucket, dragging, movement, machinery house, and boom. Major components inducing breakdowns were gathered under the relevant subsystems considering their functional similarities. In the paper, the draglines with buckets of 20 yd3 (15.3 m3) and 40 yd3 (30.6 m3) were labeled as Dragline-1 and Dragline-2, respectively. It was detected from failure statistics that operations of Dragline-1 and Dragline-2 were halted for 938 and 903 times due to failures, yielding total breakdown duration of 13,954 and 16,471 h, respectively. Quantitative contribution of each subsystem to maintenance numbers and maintenance breakdowns can be viewed in Figure 2. Pie charts in Figure 2 reveal that 56 and 47 per cent of the breakdowns are due to failures in the machinery house components alone for Dragline-1 and Dragline-2, respectively. The charts also show that although subsystems, such as the rigging and bucket, cause frequent downtimes, they are observed to be repaired in shorter periods compared to the other subsystems.
Major failure-inducing components in the individual subsystems and their common failure modes and repair types were revealed as given in Table 1. For sensitivity of the reliability model, different failure modes in identical components were stated separately. In these components, Mode01 refers direct replacement of components in case of failures where Mode02 indicates dislocation of components from their mechanisms that can also be recovered without replacement. Therefore, Mode01 and Mode02 define non-repairable and repairable condition of components. This situation generally appears in rope components of rigging, dragging, and hoisting subsystems and pulley components in the rigging subsystem. In addition, groups of non-repairable identical components were identified as repairable components since these groups cannot be replaced completely after failures. Chain, ringbolts, sockets, digging teeth, and pins are the members of these groups. Additionally, some components in Table 1 were indicated with a failure mode of general malfunction due to insufficient explanation in the maintenance record sheets.
Following system decomposition and data assignment, lifetime (time-between-failures) datasets of the components were tested for both independence between failure occurrences and deterioration/growth trends of component lifetimes. In this sense, scatterplots of ith versus (i − 1)th time-between-failures, TBF, values were utilized to control data independency. In these plots, data accumulation with a specific pattern is good evidence of data correlation, which fails data independency. Data independency was also validated using Lag-1 (ith versus (i − 1)th TBF) and Lag-2 (ith versus (i − 2)th TBF) Pearson correlation tests [32]. A sample illustration of the tests for the Dragline-1 bucket pin is given in Figure 3. It shows that the data is distributed independently since paired data is scattered randomly and correlated insignificantly considering p-values of Pearson tests. Other components also exhibit similar data behavior with statistically insignificant data correlation.
Lifetime trend behavior was checked using a hypothesis-testing method called as Crow/AMSAA. The test validates whether a time series follow any general ascending/descending behavior in a specified time interval or not. Rejection of null hypothesis in the method defenses that lifetime dataset is nonstationary with a deterioration or growth rate. In cases where the data trend is not confirmed, lifetime behavior is assumed to be stationary. The Crow-AMSAA test accepts the trend behavior of the dataset if 2 N / β ^ < χ 2 N , 1 α / 2 2 or 2 N / β ^ > χ 2 N , α / 2 2 where N is the total number of failures, β ^ is the expected shape parameter, χ a , b 2 is the score of chi-square distribution, and 1 α is confidence interval. β ^ can be estimated using Equation (1) where T i is cumulative time-between-failures till ith failure [33]:
β ^ = N i = 1 N 1 ln ( T N T i )
Sample application results for Crow-AMSAA test are shown in Table 2. The test failed to reject the trend behavior for the Dragline-1 motor component, where other components were verified to hold stationary lifetimes.
The tests also showed that following components with identity code (Table 1) have a lifetime trend: DR1, HO1, RI1, and MO1 for Dragline-1, and HO2, HO4, BU2, BU4, BU5, RI6, MH1, MH3, MO1, and MO3 for Dragline-2. Effects of both data independency and data trend on reliability parameter estimation will be discussed in Section 3.

3. Reliability Analysis of Dragline Components

Reliability analysis allows qualitative and quantitative evaluation of system operability and underlying reasons for system breakdowns due to failures. In this sense, the reliability function, also called the survival function, is utilized to find the probability of a system or component to be operational in between prescribed time intervals. It is derived using a cumulative failure function, F ( t ) , which is the integral of failure density function f ( t ) over a time interval (Equation (2)):
R ( t ) = 1 F ( t ) = 1 0 t f ( t ) d t
Failure density functions characterize component lifetimes and serve to find out failure probabilities, mean lifetimes, and failure rates of components in a time slot. The estimation of function parameters is affected from data independency and the trend of time-between-failure (TBF) data. In case of an absence of data independency, a branching Poisson process can be utilized [34]. If data independency is not a problem, as in this study, then data trends should be considered in parameter estimation. If successive TBF data does not hold any increasing or decreasing trend, the failure density function parameters can be estimated via a best-fit distribution of TBF values [34]. These components with stationary datasets are assumed to be maintained to as good as new condition. On the other hand, lifetime characterization of other components can be carried out using stochastic models with the ability of measuring data nonstationary. In this sense, the general renewal process (GRP) offers a flexible modelling for nonstationary datasets since the process allows estimation of renewal rates between as good as new and as bad as old via assigning a restoration factor (RF) between 1 and 0, respectively [35]. GRP can be modelled regarding one of the two separate assumptions on restoration factors: (i) maintenance can recover defects only between two successive failure points. This is called the Kijima-I model; or (ii) maintenance can recover accumulated defects from the beginning of the lifetime. This is called the Kijima-II model [35]. This study considers the Kijima-II model in estimation of GRP parameters since maintenance provides a general recovery on dragline components, more or less. Virtual age assumption for the Kijima-II model and related probability density function with power law process ( λ β t β 1 ) can be viewed in Equations (3) and (4), respectively. Here, q is the degree of repair, where RF = 1 q , υ i is the virtual age of the component, x i is the time-between-failures, λ is the failure rate, and β is the shape parameter. Likelihood estimations of the model parameters can be examined in [35]:
υ i = q ( υ i 1 + x i )
f ( t i | t i 1 , t i , , t 1 ) = f ( t i | t i 1 ) = λ β ( x i + υ i 1 ) β 1 e λ [ ( x i + υ i 1 ) β υ i 1 β
Lifetime parameters of dragline components were estimated using Weibull++7 (Reliasoft, Tucson, AZ, USA). The parametric values can be examined in Table 3 and Table 4 for Dragline-1 and Dragline-2, respectively. In Table 3 and Table 4, p-values of the Anderson-Darling test are also illustrated to show goodness of fit for best-fit distributions. The null hypothesis in the test defends that data follows a specified distribution. Large p-values (>0.05) accept the null hypothesis in a 95% confidence interval. This condition is satisfied for all best-fit distributions of the dragline components with identically and independently distributed (iid) datasets.
Table 3 and Table 4 indicated that the Weibull distribution and GRP were utilized to define the majority of the component lifetimes. GRP and Weibull distribution hold common descriptive parameters [34]. The shape parameter, β, in the expressions identifies the slope of the lifetime curve and shapes the curve between quasi-exponential and bell-shaped behavior. Lifetime curves with shape parameters of 1 and 3.5 exhibit exact behavior of exponential and normal distributions, respectively. Parameter η is the scale parameter, indicating the exact time point where failure probability of the relevant component is fairly equal to 63.2%. The last parameter, γ , identifies the start point of the plot and moves the curve away from the origin. Positive γ is also referred as failure-free time where the probability of component failure is zero. Exponential, normal, lognormal, and log-logistic distributions are the other distributions fitted to the lifetime datasets. In the exponential distribution, failure rate ( λ ) is the only descriptive parameter and remains constant in time. A second parameter, γ , can be also used in the exponential distribution to state a failure-free time. Additionally, normal distribution is a symmetrical bell-shape distribution explained using mean ( μ ) and standard deviation ( σ ). In addition, logarithmic and log-logistic distributions use the logarithmic state of mean and standard deviation in expressions via substituting TBF values with ln (TBF).
Using parametric values in Table 3 and Table 4, surviving/failing probabilities of the components can be calculated for different time points. These lifetime parameters also give opportunity to understand whether the components are in a wear-out period or not. The components with increasing failure rates due to deterioration in wear-out periods may need to be replaced preventatively, since corrective replacement after failure can cause higher economic consequences. On this basis, Section 4 will discuss the decision criterions for preventive replacement of the dragline components and evaluate optimal replacement intervals considering cost factors.

4. Preventive Replacement Decisions for the Dragline Components

A preventive replacement policy provides longevity and sustainability of system operations via maintaining active system components preventively prior to failures. However, policy application should be validated economically since redundant and inconvenient replacements may cause higher production losses. Therefore, the following conditions should be regarded in the decision process:
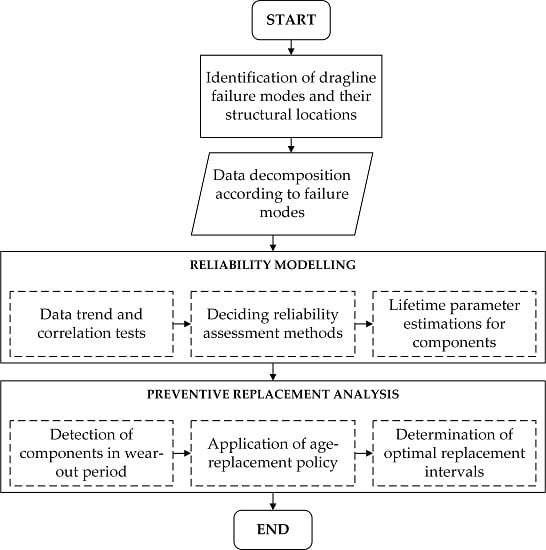
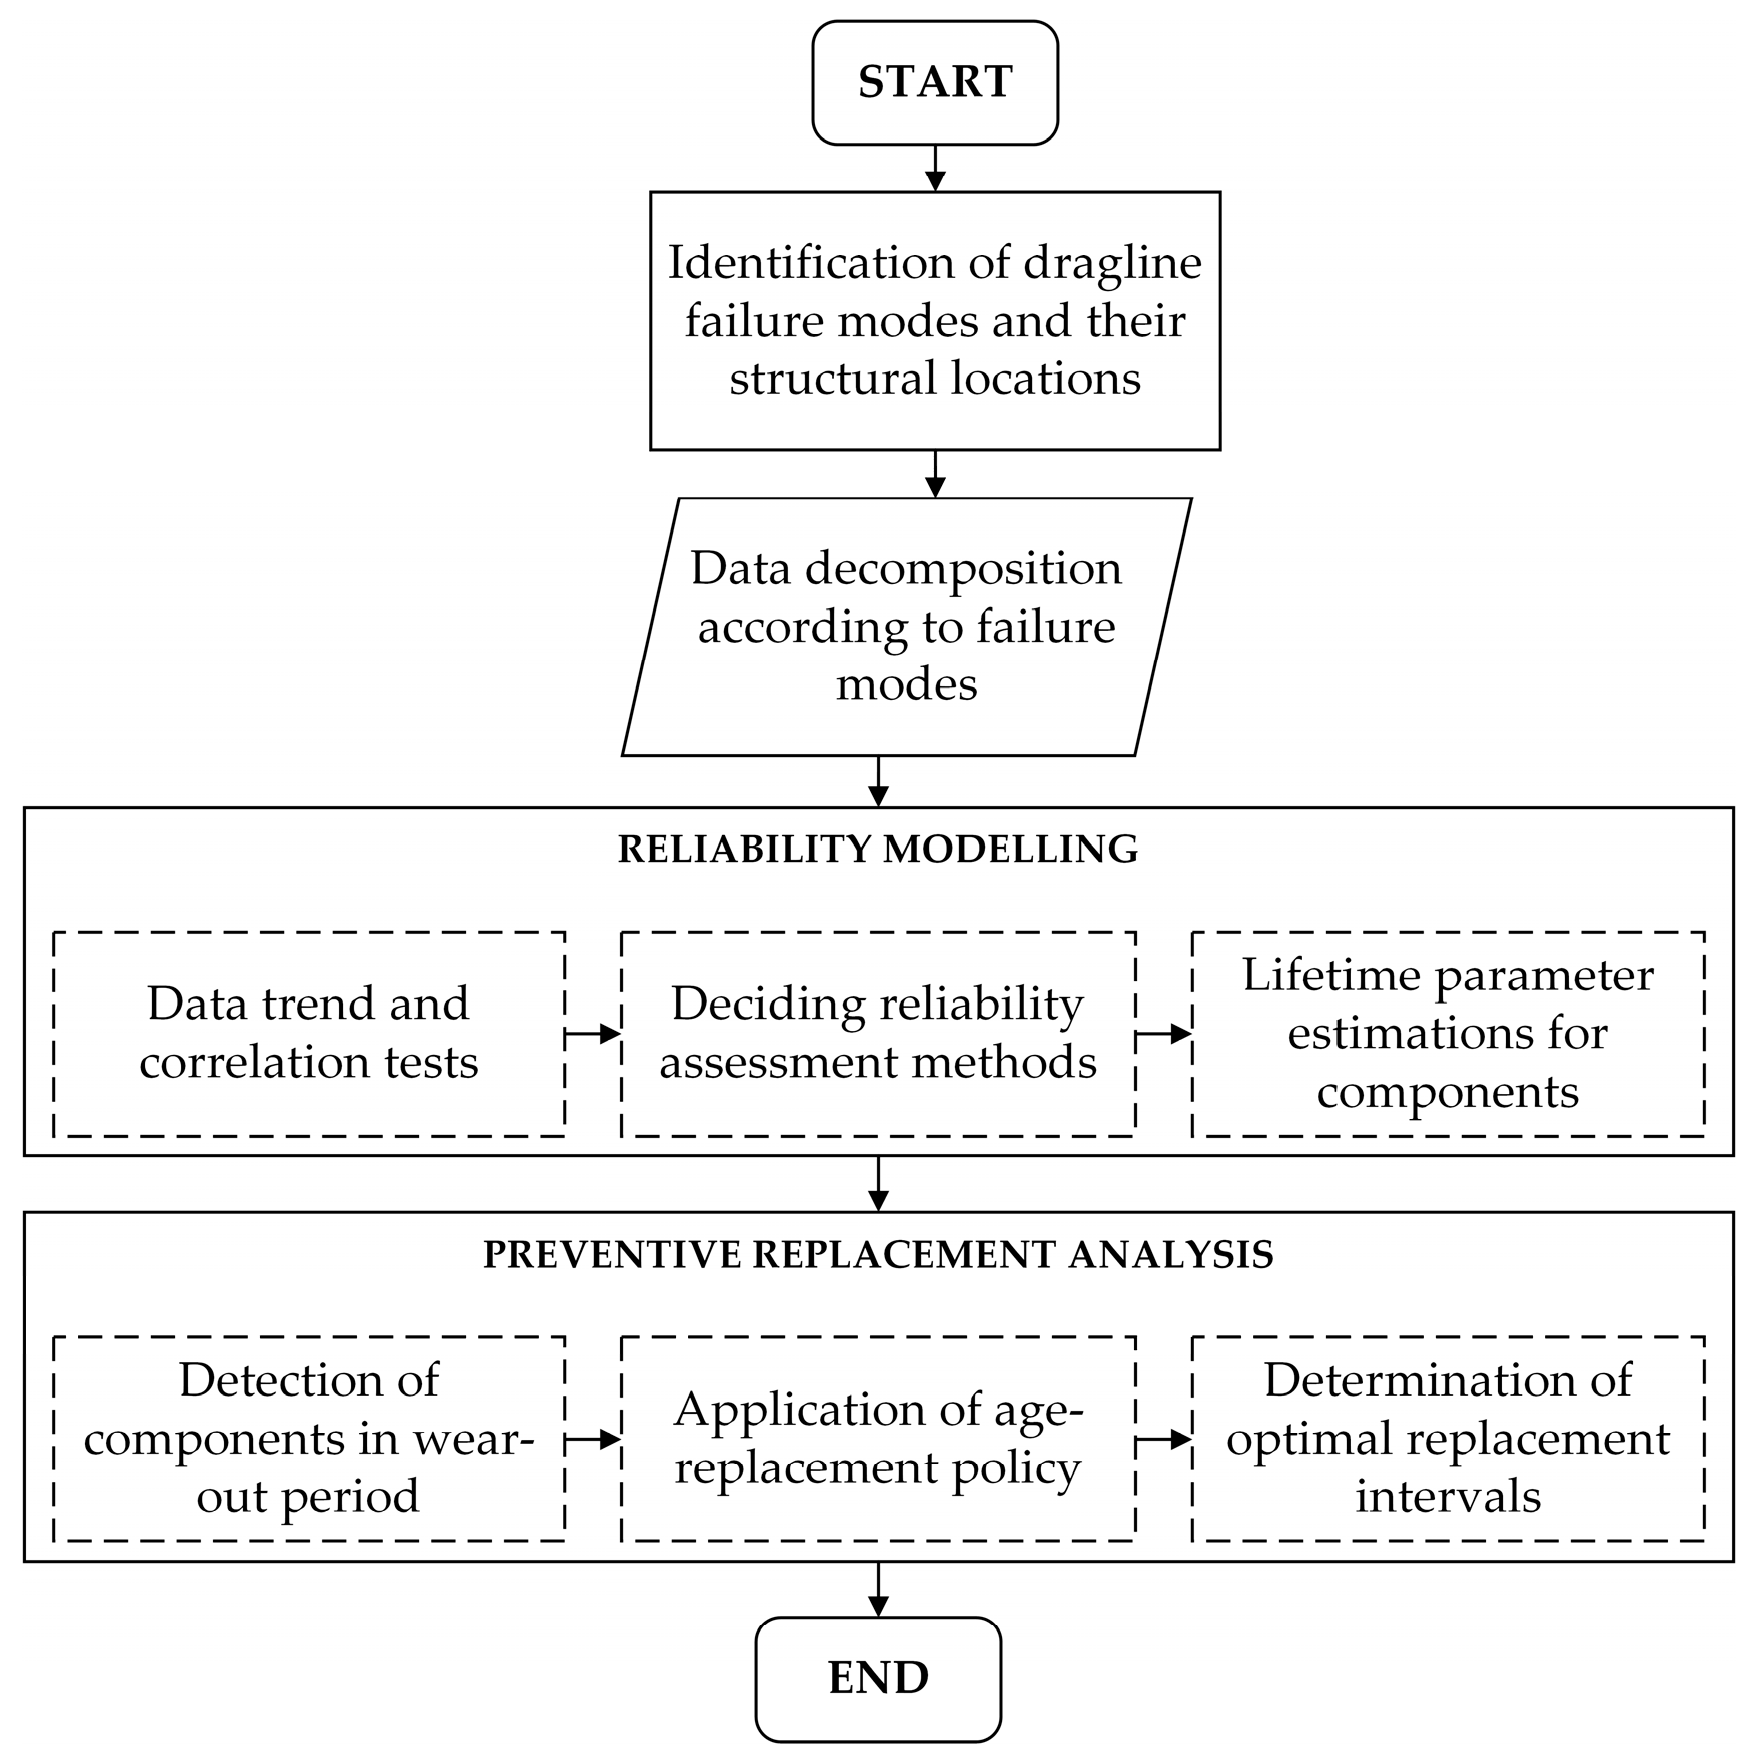
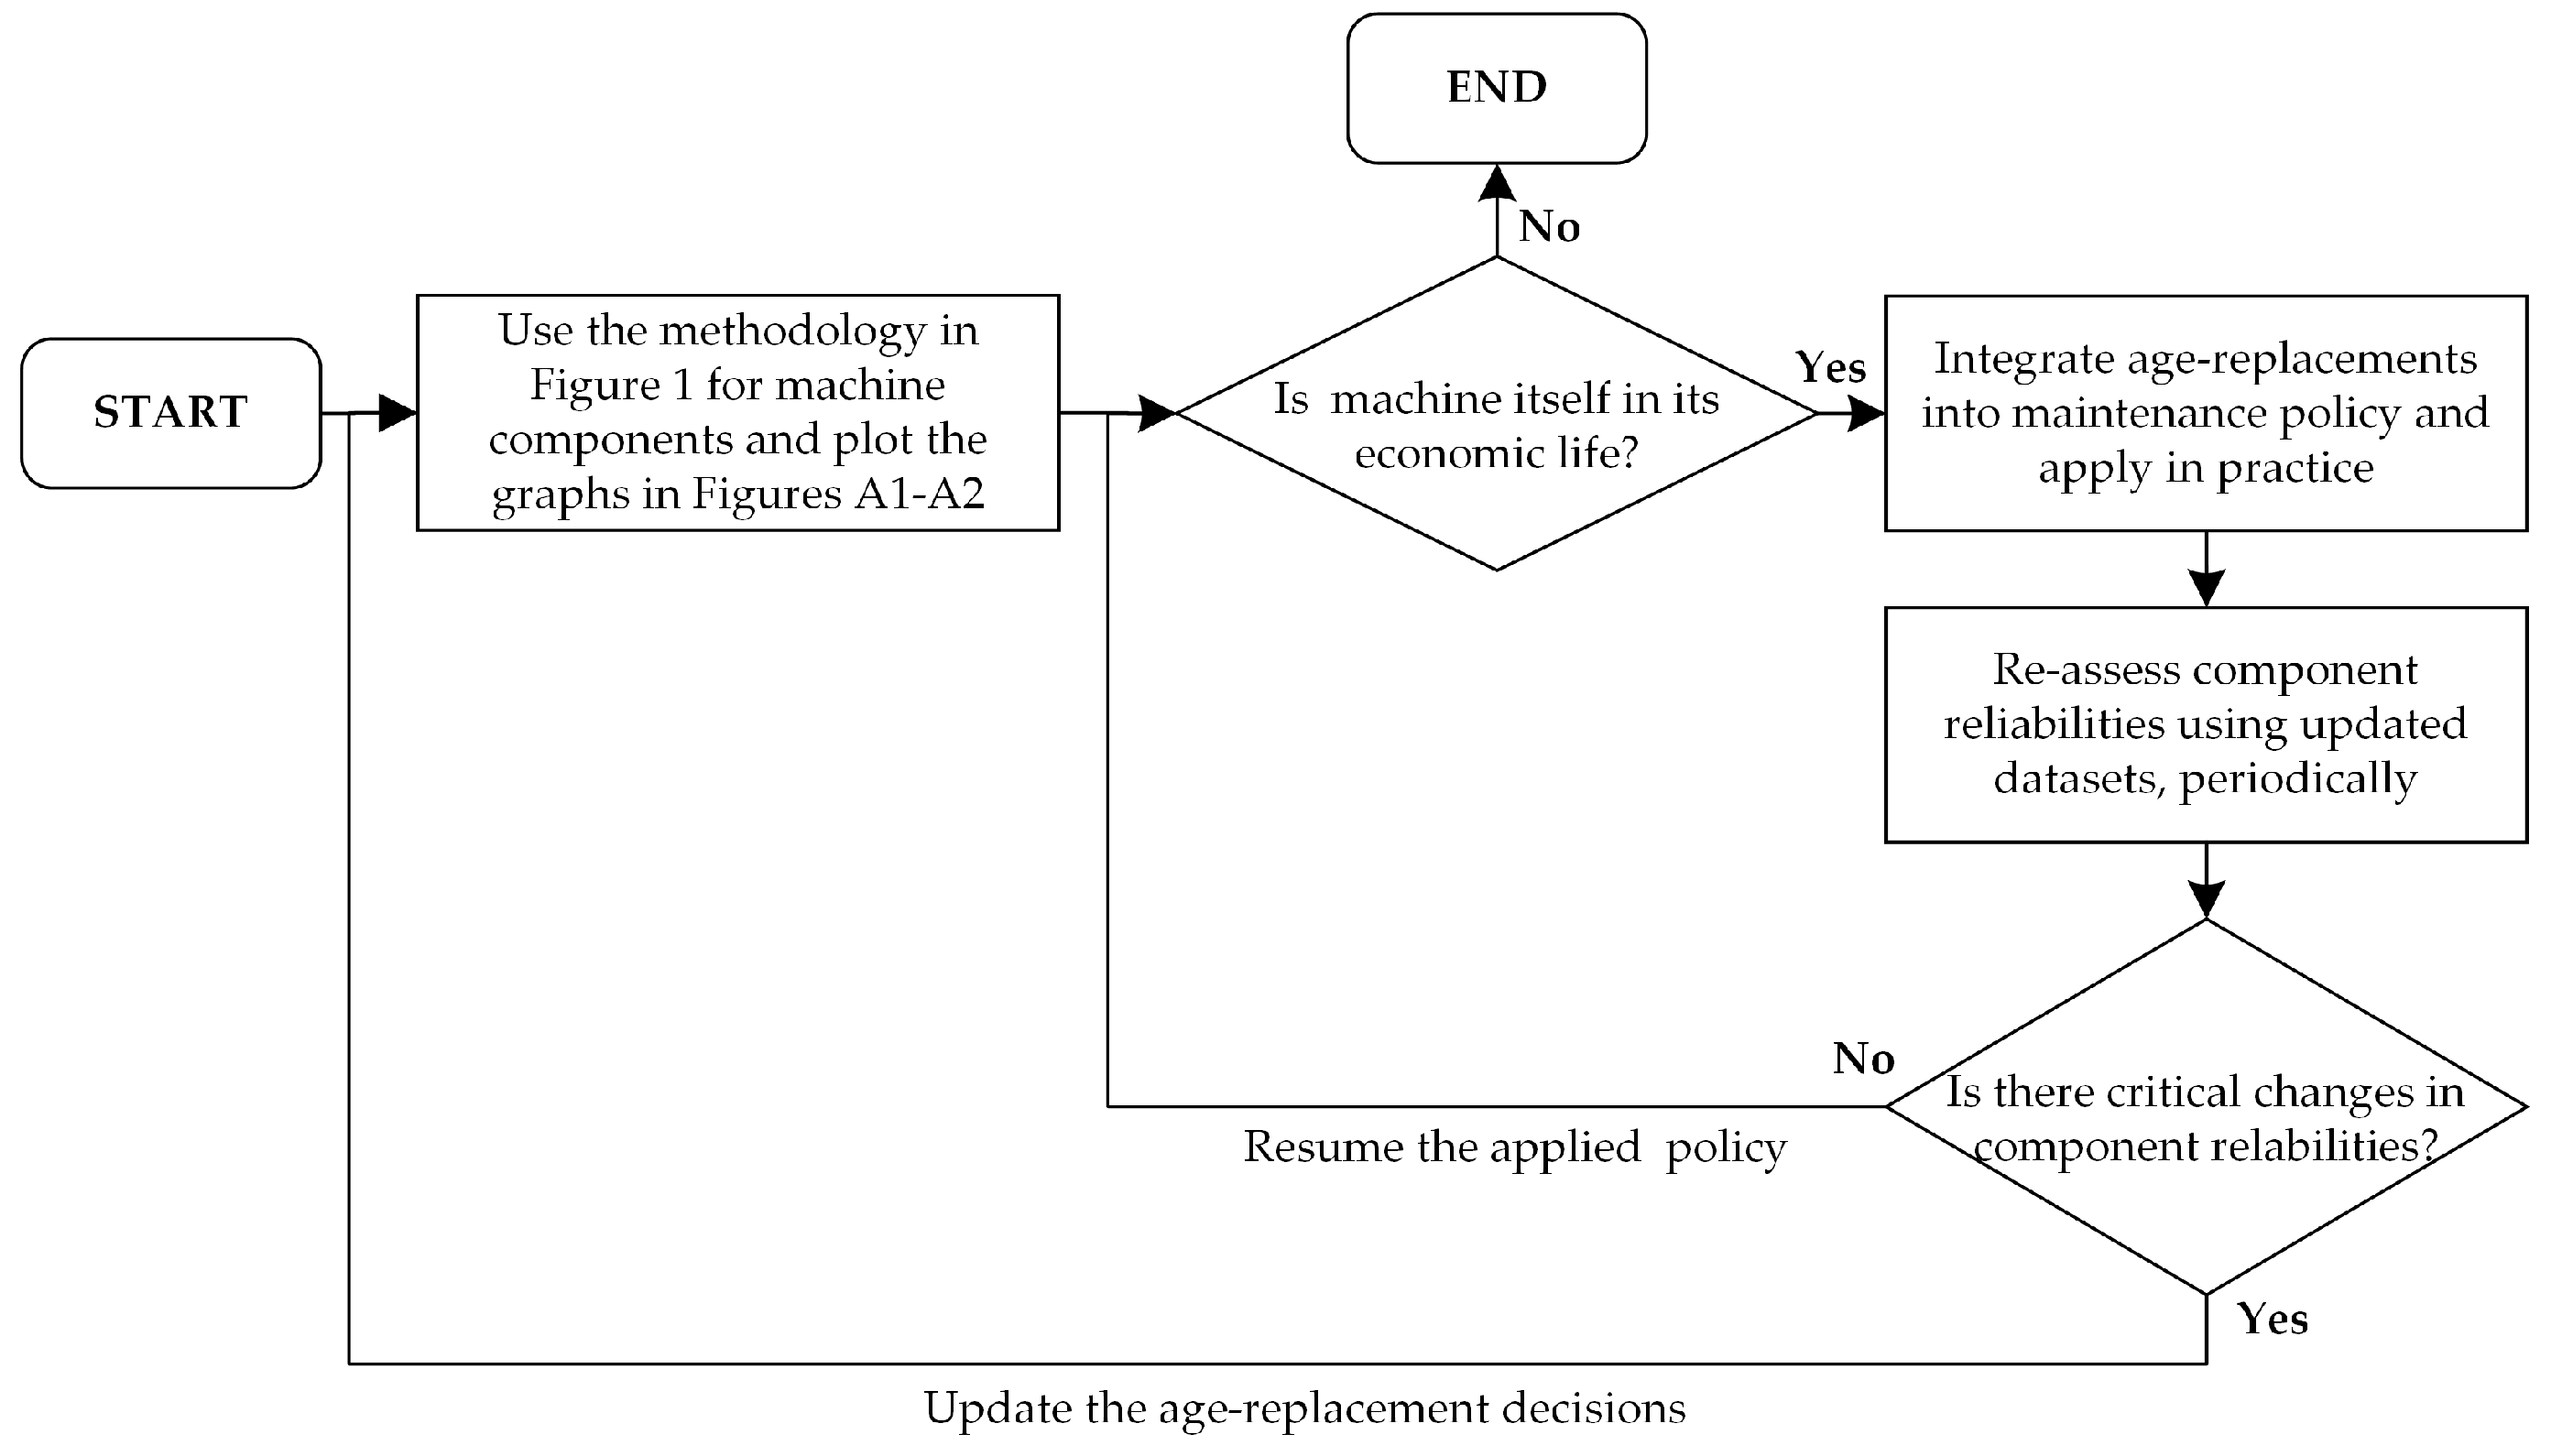
  • Preventive age-replacement decisions can be applicable for the components in a wear-out period. Generally, a component exhibits three types of failure rate characteristics during its lifetime as infant mortality, useful life, and wear-out [36]. During these periods, the component holds decreasing, nearly-constant, and increasing failure rates, respectively. In the study, lifetime parameters in Table 3 and Table 4 were utilized to detect dragline components in the wear-out period. For the components fitted in the Weibull distribution, shape parameter (β) is a good indicator of determining whether the component is in the early stages of its lifetime, in its useful lifetime with random failure patterns, or in the deterioration period with wear-out problems. For the lifetime with β > 1, the components are in their wear-out periods since they have increasing failure rates. For other distributions, component failure rates should be analyzed to check whether they follow an increasing failure rate or not. It should be noticed that Weibull distribution with a shape parameter of 3.5 exhibits exact normal distribution. Therefore, components holding normally-distributed lifetime parameters are candidate components in the wear-out period, inherently. This condition is also valid for other quasi-normal distributions, such as, lognormal, logistic, and log-logistic.
  • Total financial consequence of preventive replacement for a component should be less than the one with corrective replacement. Although replacements turn components into as good as new condition and increase system durability, financial benefits of preventive activities should be validated, comparing with corrective activities. It is substantial that all direct and indirect costs of preventive and corrective replacements should be included in the cost estimations.
In addition to these decision assumptions, the structural and functional convenience of preventive maintenance should also be considered. Due to a lack of sufficient explanations in maintenance record sheets, components of the machinery house and movement units, such as motors, generators, walking, rotation, and warning could not be decomposed into bottom elements. Complete replacements of these components are practically impossible. Therefore, DR2, DR3, HO1, HO2, RI1, RI3, and RI5 for Dragline-1, and DR2, DR3, DR6, HO2, RI3, and RI5 for Dragline-2, were only selected as candidate components for preventive replacement. They are in the wear-out period and also structurally convenient for such a maintenance activity. An age-replacement model was utilized to find the optimal preventive replacement interval via minimizing expected unit cost which covers both corrective and preventive replacement costs probabilistically. A unit cost function of the model can be examined in Equation (5) [37]. In the equation, c c is the total cost of unit corrective replacement, c p is the total cost of unit preventive replacement, F ( t 0 ) is the failure probability of component at time t 0 , and R ( t 0 ) is the surviving probability, i.e., reliability, of the component at time t 0 . Therefore, Equation (5) estimates unit replacement cost at any time t 0 :
A c ( t 0 ) = c c F ( t 0 ) + c p R ( t 0 ) 0 t 0 R ( t )
The optimal interval for preventive replacement can be calculated via equalizing the numerator of the derivative of Equation (5) to zero as shown in Equations (6) and (7) [37]. In the equations, r ( t ) is the failure rate and t 0 * is the optimal age-replacement interval:
h c ( t 0 ) = r ( t 0 ) 0 t 0 R ( t ) d t R ( t 0 ) c p c c c p
h c ( t 0 * ) = 0
As shown in the model, the optimal replacement interval is excessively affected from the failure rate and ratio between corrective and preventive replacement costs. The failure rate of wear-out components for any time t 0 can be estimated using parameters in Table 3 and Table 4 with a ratio of f ( t ) / R ( t ) . On the other hand, financial worth of a replacement activity can change depending on both the supply cost of a component and production loss due to system downtime during maintenance. In mining operations, indirect costs due to production loss generally overtake direct costs of components since the time value of mining production is comparatively higher. This condition becomes crucial, especially for draglines, since mine production is directly affected by dragline breakdowns. Preventive replacement activities are expected to be completed in shorter time periods compared to corrective ones since preventive maintenance are more organized and pre-planned activities. On the other hand, corrective replacements are performed after failures and time losses can increase due to extended preparation periods for maintenance. Therefore, production loss in preventive replacement is expected to be lower than corrective replacement. In this sense, if unit time value of production loss increases, the ratio between corrective and preventive replacement costs also increases. This condition enables the application of preventive replacements in shorter intervals. On the other hand, if the ratio is relatively small, replacement intervals extend and overtake mean lifetimes of components. In these cases, application of preventive replacement fails since it becomes meaningless to perform the replacements with an interval higher than the expected component lifetime. Therefore, it is obvious that the minimum cost ratio for applicability of replacement should satisfy the condition t 0 * = m e a n   l i f e t i m e for the components.
A numerical example was carried out for the DR2 component of Dragline-1 to find out the minimum required ( c c / c p ) for the application of preventive replacement. The lifetime of this component is fitted in a two-parameter Weibull distribution with parameters of β = 1.3 ; η = 1085.0 (Table 3). The probability density function, f ( t ) , of a two-parameter Weibull distribution can be examined in Equation (8) [38]:
f ( t ) = β η ( t η ) β 1 e ( t η ) β
The mean lifetime (mean time-between-failures, MTBF) of this component can be found using Equation (9) [38]. It gives the expected operating time of the component without failure:
MTBF= 0 t f( t )dt= 0 t  1.3 1085 ( t 1085 ) 0.3 e ( t 1085 ) 1.3 dt=1011 h
The minimum cost ratio for this component can be estimated via substituting the optimal replacement interval, t 0 * , with MTBF in Equation (6) as follows:
r ( 1011   ) 0 1011   R ( t ) d t R ( 1011   ) c p c c c p = 0           ( c c / c p ) = 6.3  
These calculations were also performed for the other wear-out components via changing relevant probability density functions and lifetime parameters. Since replacement events for the target components in the study are independent to each other the analysis considers that replacements take place individually without affecting other replacement decisions. The results can be investigated in Table 5. Since there is not any specific minimization point for the cost functions of DR3, HO1, and HO2 in Dragline-1, and DR6 and RI3 in Dragline-2, applicable cost ratios for these components could not be calculated.
As stated, a rise of cost ratios reduces replacement intervals and enables the application of preventive replacements with increasing frequency. Therefore, required cost ratios for changing preventive replacement intervals were also plotted in Figure A1 and Figure A2 in Appendix A. These plots lie between minimum points calculated in Table 5 and a cost ratio of 40. Decision-makers in maintenance policies can utilize these kinds of graphs in changing financial conditions. For instance, if the ratio between economic consequences of corrective and preventive replacement rises from 1.9 (Table 5) to 4.0, then the replacement interval drops from 14,902 operating hours (Table 5) to 7835 h for the Dragline-1 RI5 component as given in Figure A1. For sustainable utilization of these decision graphs, the methodology in Figure 4 can be utilized.
In the progress of time, machinery components can exhibit variations in their lifetime characteristics and this situation can invalidate previous decisions for preventive replacements. Therefore, the replacement policy discussed in this study should be re-evaluated periodically using up-to-date reliability analysis as illustrated in Figure 4.

5. Conclusions

This study extensively used reliability assessment and age-replacement methods to investigate the optimality of preventive component replacements for two draglines currently operating in the Tunçbilek coal mine. In this sense, individual failure modes in the dragline mechanism were detected and characterized using reliability evaluation methods. Resultant lifetime parameters were utilized to identify wear-out components in the dragline. Applicability of preventive replacements for these components were examined using an age-replacement model. The analysis results reveal that preventive replacement can be optimal only if the cost ratio between preventive and corrective replacement comes to a threshold level. It was also observed that an increase in both wear-out level and cost ratio decrease preventive replacement intervals and necessitates application of replacements with high frequency. In the study, an age-replacement policy was detected to be applicable only for some components of dragging, hoisting, and rigging subsystems. More detailed maintenance records can help to thoroughly decompose other critical components, such as motors, generators, rotation, and walking. However, due to lack of clear maintenance data on these components, they were included in the analysis holistically and this condition prevented application of an age-replacement policy for these components in a practical manner.

Acknowledgments

This research study was partially supported by The Scientific and Technological Research Council of Turkey (TUBITAK) with project number 111M320. The authors would like to thank Metin Özdoğan and Enver Şekerci for their support to this research study in acquiring data and sharing their expertise on dragline maintenance. The authors are also grateful to three anonymous reviewers for their useful comments and suggestions.

Author Contributions

Nuray Demirel and Onur Golbasi provided a joint contribution in building of the study methodology, the data analysis, interpretation of the analysis results, and writing of the paper.

Conflicts of Interest

The authors declare no conflict of interest.

Appendix A

Figure A1. Optimal replacement intervals of Dragline-1 wear-out components for changing cost ratios.
Minerals 06 00051 g005
Figure A2. Optimal replacement intervals of Dragline-2 wear-out components for changing cost ratios.
Minerals 06 00051 g006

References

  1. Gilewicz, P. International Dragline Population Matures. Coal Age 2000, 105, 30–32. [Google Scholar]
  2. Townson, P.G.; Murthy, D.N.; Gurgenci, H. Optimization of Dragline Load. In Case Studies in Reliability and Maintenance; Blischke, E.W., Murthy, D.N., Eds.; John Wiley and Sons Inc.: Hoboken, NJ, USA, 2003; pp. 517–544. [Google Scholar]
  3. Humphrey, J.D. The Fundamentals of the Dragline; Marion Power Shovel Division Dresser Industries: Marion, OH, USA, 1990. [Google Scholar]
  4. Darling, P. SME Mining Enginering Handbook, 3rd ed.; Society for Mining, Metallurgy, and Exploration: Englewood, CO, USA, 2011. [Google Scholar]
  5. Samanta, B.; Sarkar, B.; Mukherjee, S.K. Reliability Modelling and Performance Analyses of an LHD System in Mining. J. S. Afr. Inst. of Min. Metall. 2004, 4, 1–8. [Google Scholar]
  6. Vayenas, N.; Wu, X. Maintenance and Reliability Analysis of a Fleet of Load-Haul-Dump Vehicles in an Underground Hard Rock Mine. Int. J. Min. Reclam. Environ. 2009, 23, 227–238. [Google Scholar] [CrossRef]
  7. Vagenas, N.; Runciman, N.; Clement, S.R. A Methodology for Maintenance Analysis of Mining Equipment. Int. J. Surf. Min. Reclam. Environ. 1997, 11, 33–40. [Google Scholar] [CrossRef]
  8. Chatterjee, S.; Bandopadhyay, S. Reliability Estimation using a Genetic Algorithm-Based Artificial Neural Network: An Application to a Load-Haul-Dump Machine. Expert Syst. Appl. 2012, 39, 10943–10951. [Google Scholar] [CrossRef]
  9. Chatterjee, S.; Dash, A.; Sukumar, B. Ensemble Support Vector Machine Algorithm for Reliability Estimation of a Mining Machine. Qual. Reliab. Eng. Int. 2014, 31, 1503–1516. [Google Scholar] [CrossRef]
  10. Gustafson, A.; Schunnesson, H.; Kumar, U. Reliability Analysis and Comparison between Automatic and Manual Load Haul Dump Machines. Qual. Reliab. Eng. Int. 2013, 31, 523–531. [Google Scholar] [CrossRef]
  11. Gustafson, A.; Schunnesson, H.; Galar, D.; Kumar, U. Production and Maintenance Performance Analysis: Manual versus Semi-Automatic LHDs. J. Qual. Maint. Eng. 2013, 19, 74–88. [Google Scholar]
  12. Gustafson, A.; Schunnesson, H.; Galar, D.; Kumar, U. The influence of the Operating Environment on Manual and Automated Load-Haul-Dump Machines: A Fault Tree Analysis. Int. J. Min. Reclam. Environ. 2013, 27, 75–87. [Google Scholar] [CrossRef]
  13. Kumar, U. Availability Studies of Load-Haul-Dump Machines. In Proceedings of the APCOM Symposium, Littleton, CO, USA, 27 February–2 March 1989.
  14. Kumar, U.; Klefsjö, B. Reliability Analysis of Hydraulic Systems of LHD Machines Using the Power Law Process Model. Reliab. Eng. Syst. Saf. 1992, 35, 217–224. [Google Scholar] [CrossRef]
  15. Hall, R.A.; Daneshmend, L.K. Reliability Modelling of Surface Mining Equipment: Data Gathering. Int. J. Surf. Min. Reclam. Environ. 2003, 17, 139–155. [Google Scholar] [CrossRef]
  16. Roy, S.; Bhattacharyya, M.; Naikan, V.N. Maintainability and Reliability Analysis of Fleet Shovels. Min. Technol. 2001, 110, 163–171. [Google Scholar] [CrossRef]
  17. Samanta, B. Reliability Analysis of Shovel Machines Used in an Open Cast Coal Mine. Miner. Resour. Eng. 2001, 10, 219–231. [Google Scholar] [CrossRef]
  18. Samanta, B.; Sarkar, B.; Mukherjee, S.K. Maintenance Planning of a Mining Equipment Based on Evaluation of Machine Health for the New Millennium. J. Mines Met. Fuels 2001, 49, 26–31. [Google Scholar]
  19. Samanta, B.; Sarkar, B.; Mukherjee, S.K. Reliability Assessment of Hydraulic Shovel System using Fault Trees. Trans. Inst. Min. Metall. Sect. A Min. Technol. 2002, 111, 129–135. [Google Scholar] [CrossRef]
  20. Hoseinie, S.H.; Ataei, M.; Khalokakaie, R.; Kumar, U. Reliability Modeling of Water System of Longwall Shearer Machine. Arch. Min. Sci. 2011, 56, 291–302. [Google Scholar]
  21. Hoseinie, S.H.; Ataei, M.; Khalokakaie, R.; Ghodrati, B.; Kumar, U. Reliability Analysis of Drum Shearer Machine at Mechanized Longwall Mines. J. Qual. Maint. Eng. 2012, 18, 98–119. [Google Scholar] [CrossRef]
  22. Hoseinie, S.H.; Khalokakaie, R.; Ataei, M.; Kumar, U. Reliability-Based Maintenance Scheduling of Haulage System of Drum Shearer. Int. J. Min. Miner. Eng. 2011, 3, 26–37. [Google Scholar] [CrossRef]
  23. Wang, W.H.; Zhang, D.K.; Cheng, G.; Shen, L.H. The Dynamic Fault Tree Analysis of Not-Cutting Failure for MG550/1220 Electrical Haulage Shearer. Appl. Mech. Mater. 2012, 130–134, 646–649. [Google Scholar] [CrossRef]
  24. Al-Chalabi, H.S.; Lundberg, J.; Wijaya, A.; Ghodrati, B. Downtime Analysis of Drilling Machines and Suggestions for Improvement. J. Qual. Maint. Eng. 2014, 20, 306–332. [Google Scholar] [CrossRef]
  25. Morandi, A. Application of Reliability-Based Techniques to Mobile Drilling Units. In Proceedings of the International Conference on Offshore Mechanics and Arctic Engineering, Rio de Janeiro, Brazil, 3–8 June 2001.
  26. Rahimdel, M.J.; Ataei, M.; Kakaei, R.; Hoseinie, S.H. Reliability Analysis of Drilling Operation in Open Pit Mines. Arch. Min. Sci. 2013, 58, 569–578. [Google Scholar]
  27. Rahimdel, M.J.; Ataei, M.; Khalokakaei, R.; Hoseinie, S.H. Reliability-Based Maintenance Scheduling of Hydraulic System of Rotary Drilling Machines. Int. J. Min. Sci. Technol. 2013, 23, 771–775. [Google Scholar] [CrossRef]
  28. Rahimdel, M.J.; Ataei, M.; Khalokakaei, R.; Hoseinie, S.H. Maintenance Plan for Fleet of Rotary Drill Rigs. Arch. Min. Sci. 2014, 59, 441–453. [Google Scholar]
  29. Samanta, B.; Sarkar, B. Availability Modelling of a Dragline System—A Case Study. J. Inst. Eng. India Part PR Prod. Eng. Div. 2002, 83, 20–26. [Google Scholar]
  30. Uzgören, N.; Elevli, S. Non-Homogeneous Poisson Process: Reliability Analysis of a Mining Equipment. J. Fac. Eng. Archit. Gazi Univ. 2010, 25, 827–837. [Google Scholar]
  31. Uzgören, N.; Elevli, S.; Elevli, B.; Uysal, Ö. Reliability Analysis of Draglines’ Mechanical Failures. Eksploatacja i Niezawodnosc 2010, 48, 23–28. [Google Scholar]
  32. Enders, C.K. Applied Missing Data Analysis, 1st ed.; Guilford Press: New York, NY, USA, 2010. [Google Scholar]
  33. Wang, P.; Coit, D.W. Repairable Systems Reliability Trend Tests and Evaluation. In Proceedings of the Reliability and Maintainability Symposium, Alexandria, VA, USA, 24–27 January 2005.
  34. Barabady, J.; Kumar, U. Reliability Analysis of Mining Equipment: A Case Study of a Crushing Plant at Jajarm Bauxite Mine in Iran. Reliab. Eng. Syst. Saf. 2008, 93, 647–653. [Google Scholar] [CrossRef]
  35. Mettas, A.; Zhao, W. Modeling and Analysis of Repairable Systems with General Repair. In Proceedings of the IEEE Reliability and Maintainability Symposium, Alexandria, VA, USA, 24–27 January 2005.
  36. Gölbaşı, O.; Demirel, N. Review of Trend Tests for Detection of Wear-Out Period for Mining Machineries. In Proceedings of the International Mining Congress and Exhibition of Turkey, Antalya, Turkey, 14–17 April 2015.
  37. Barlow, R.E.; Proschan, F. Mathematical Theory of Reliability; John Wiley and Sons Ltd: New York, NY, USA, 1965. [Google Scholar]
  38. Kumar, U.D.; Crocker, J.; Chitra, T.; Saranga, H. Reliability and Six Sigma; Springer Science + Business Media Inc.: New York, NY, USA, 2006. [Google Scholar]
Figure 1. Research methodology of the study.
Minerals 06 00051 g001
Figure 2. Decomposition of dragline (a) and distribution of maintenance statistics (b).
Minerals 06 00051 g002
Figure 3. Data independency tests for lifetime dataset of Dragline-1 bucket pin.
Minerals 06 00051 g003
Figure 4. Methodology for sustainability of the preventive replacement decisions.
Minerals 06 00051 g004
Table 1. Failure modes and maintenance types of dragline components.
UnitCodeComponentFailure ModeRepair Type
DraggingDR1Chain assemblyBreakageReplacing and welding of individual chain
DR2RingboltBreakageWelding
DR3Rope-Mode01RuptureReplacement
DR4Rope-Mode02Dislocation from pulleyRecovering the mechanism
DR5ControlGeneral malfunctionGeneral repair
DR6SocketBreakageWelding
HoistingHO1BrakeFail to brakeMechanical repair
HO2Rope-Mode01RuptureReplacement
HO3Rope-Mode02Dislocation from pulleyRecovering the mechanism
HO4SocketsBreakageWelding
HO5ControlGeneral malfunctionGeneral repair
BucketBU1Bucket bodyWear and tearWelding
BU2Chain assemblyBreakageReplacing and welding of individual chain
BU3Digging teethDropping, breakageReplacing and welding of individual tooth
BU4PinsBreakageReplacement of individual pins
BU5RingboltBreakageWelding
RiggingRI1SocketBreakageWelding
RI2RingboltBreakageWelding
RI3Rope-Mode01RuptureReplacement
RI4Rope-Mode02Dislocation from pulleyRecovering the mechanism
RI5Pulley-Mode01Irrecoverable malfunctionReplacement
RI6Pulley-Mode02Mechanical disintegrationRecovering the mechanism
Machinery HouseMH1GeneratorsGeneral malfunctionRemoval of brush dust, fixing armatures, bearings or couplings
MH2MotorsGeneral malfunctionRemoval of brush dust, fixing armatures, bearings or couplings
MH3LubricationGeneral malfunctionFixing injectors, valves, pumps, air compressors or timing mechanism
MH4Air conditioningGeneral malfunctionGeneral repair
MovementMO1RotationGeneral malfunctionFixing transmission box, bearings, felts, pinion gears, turret traversing mechanism, rails or flanges
MO2WalkingGeneral malfunctionFixing transmission box, bearings, felts, walking axle, journal bearing, pins or steel construction of walking feet
MO3WarningGeneral malfunctionFixing connection couplings or warning brushes
BoomBO1Boom chordsFracturePreventive welding
Table 2. Crow-AMSAA test results for motor and lubrication components of the draglines.
Test StatisticsDragline-1Dragline-2
Motors (MH2)Lubrication (MH3)Motors (MH2)Lubrication (MH3)
2 N / β ^ 153.0679.1276.38199.68
χ 2 N , 1 α / 2 2 86.7976.1655.19162.78
χ 2 N , α / 2 2 135.48122.1195.08227.50
DecisionReject H 0 Accept H 0 Accept H 0 Accept H 0
Table 3. Lifetime parameters of Dragline-1 components.
CodeModelParameterp-valueCodeModelParameterp-value
Dragging UnitHoisting Unit
DR1Weibull-3P β = 0.9 ; η = 812.3 ; γ = 15.8 0.258HO1Lognormal-2P μ = 6.8 ;   σ = 2.0 0.284
DR2Weibull-2P β = 1.3 ; η = 1085.0 >0.250HO2Log-logistic-2P μ = 7.4 ;   σ = 0.2 0.205
DR3Log-logistic-2P μ = 6.7 ; σ = 0.5 0.168HO3GRP β = 1.5 ; η = 7361.1 ; RF = 0 % Not idd
DR4Weibull-3P β = 0.8 ; η = 732.2 ; γ = 9.8 0.233HO4Weibull-2P β = 0.9 ; η = 10 , 402.7 >0.250
DR5Weibull-2P β = 0.9 ; η = 1820.2 >0.250HO5GRP β = 1.7 ; η = 10 , 566.2 ; RF = 80 % Not idd
DR6Weibull-2P β = 1.0 ; η = 5509.9 >0.250
Bucket UnitRigging Unit
BU1GRP β = 0.7 ; η = 788.9 ; RF = 0 % Not iddRI1Weibull-2P β = 1.1 ; η = 2420.1 >0.250
BU2Weibull-2P β = 0.6 ; η = 11 , 528.2 >0.250RI2Weibull-2P β = 0.8 ; η = 3438.4 0.224
BU3GRP β = 0.8 ; η = 942.8 ; RF = 92 % Not iddRI3Weibull-3P β = 1.5 ; η = 595.2 ; γ = 51.9 >0.500
BU4Weibull-3P β = 0.9 ; η = 873.4 ; γ = 31.3 >0.500RI4No Failure Data--
BU5GRP β = 0.9 ; η = 988.8 ; RF = 85 % Not iddRI5Lognormal-2P μ = 9.5 ;   σ = 0.4 0.836
RI6GRP β = 0.7 ; η = 1176.4 ; RF = 0.72 Not idd
Machinery House UnitMovement Unit
MH1GRP β = 0.8 ; η = 1472.2 ; RF = 0 % Not iddMO1GRP β = 0.5 ; η = 490.7 ; RF = 78 % Not idd
MH2GRP β = 0.7 ; η = 758.4 ; RF = 90 % Not iddMO2Weibull-2P β = 1.1 ; η = 1635.7 0.156
MH3Exponential-2P λ = 0.1 × 10 2 ; γ = 13.0 >0.250MO3GRP β = 1.4 ; η = 3322.3 ; RF = 0 % Not idd
MH4No Failure Data--
Boom Unit
BO1Weibull-3P β = 0.4 ;   η = 2675.6 ;   γ = 16.2 >0.250
Table 4. Lifetime parameters of Dragline-2 components.
CodeModelParameterp-valueCodeModelParameterp-value
Dragging UnitHoisting Unit
DR1GRP β = 0.9 ; η = 626.7 ; RF = 0 % Not iddHO1GRP β = 0.7 ; η = 1443.7 ; RF = 90 % Not idd
DR2Weibull-3P β = 1.0 ; η = 820.8 ; γ = 52.0 0.354HO2Normal-2P μ = 2 , 851.6 ;   σ = 1640.6 0.93
DR3Weibull-3P β = 2.2 ; η = 1848.3 ; γ = 389.0 >0.500HO3Lognormal-2P μ = 8.2 ;   σ = 1.3 0.519
DR4Weibull-3P β = 1.0 ; η = 2451.8 ; γ = 14.0 >0.500HO4No Failure Data--
DR5Weibull-3P β = 0.9 ; η = 485.7 ; γ = 11.5 >0.500HO5Weibull-2P β = 0.7 ; η = 1042.1 0.16
DR6Lognormal-2P μ = 8.4 ;   σ = 1.5 0.364
Bucket UnitRigging Unit
BU1Weibull-3P β = 0.9 ; η = 959.1 ; γ = 20.8 0.492RI1GRP β = 0.8 ; η = 6790.1 ; RF = 0 % Not idd
BU2Exponential-2P λ = 0.2 × 10 3 ; γ = 4528.1 >0.250RI2Weibull-2P β = 0.9 ; η = 3608.0 >0.250
BU3Weibull-2P β = 0.9 ; η = 740.8 0.191RI3Log-logistic-2P μ = 5.8 ;   σ = 0.5 0.178
BU4Weibull-3P β = 0.9 ; η = 640.4 ; γ = 12.7 >0.500RI4Weibull-2P β = 0.8 ; η = 2494.6 >0.250
BU5Weibull-3P β = 1.0 ; η = 1114.9 ; γ = 28.5 >0.500RI5Normal-2P μ = 3765.2 ;   σ = 2954.0 0.882
RI6Weibull-3P β = 1.3 ; η = 1935.4 ; γ = 28.8 >0.500
Machinery House UnitMovement Unit
MH1Weibull-3P β = 0.8 ; η = 829.2 ; γ = 12.3 0.475MO1GRP β = 0.8 ; η = 782.4 ; RF = 0 % Not idd
MH2Exponential-2P λ = 0.8 × 10 3 ; γ = 20.4 >0.250MO2Weibull-3P β = 0.7 ; η = 647.5 ; γ = 14.4 >0.500
MH3Lognormal-2P μ = 5.8 ;   σ = 1.3 0.339MO3Exponential-2P λ = 0.3 × 10 3 ; γ = 332.5 >0.250
MH4Lognormal-2P μ = 7.9 ;   σ = 1.0 0.212
Boom Unit
BO1Exponential-1P λ = 1.09 × 10 4 0.348
Table 5. Minimum required cost ratios for preventive replacement intervals.
Dragline-1Dragline-2
ComponentInterval (h) Min   ( c c / c p ) ComponentInterval (h) Min   ( c c / c p )
DR210116.3DR285910.9
DR32521No applicable ratioDR312483.4
HO16642No applicable ratioDR612,686No applicable ratio
HO21848No applicable ratioHO228522.7
RI1236321.6RI3489No applicable ratio
RI35883.0RI537655.2
RI514,9021.9

