Article

Molecularly-Limited Fractal Surface Area of Mineral Powders

1
IT4Innovations Centre and Nanotechnology Centre, VSB—Technical University of Ostrava, 17. listopadu 15/2172, 70833 Ostrava, Czech Republic
2
Institute of Physics, Faculty of Mining and Geology, VSB—Technical University of Ostrava, 17. listopadu 15/2172, 70833 Ostrava, Czech Republic
3
Department 606, VSB—Technical University of Ostrava, 17. listopadu 15/2172, 70833 Ostrava, Czech Republic
4
Institute of Clean Technologies, VSB—Technical University of Ostrava, 17. listopadu 15/2172, 70833 Ostrava, Czech Republic
5
Department of Natural Sciences and Humanities, College of Logistics, Palackeho 1381/25, 75002 Prerov, Czech Republic
*
Author to whom correspondence should be addressed.
Minerals 2016, 6(2), 44; https://doi.org/10.3390/min6020044
Submission received: 24 February 2016 / Revised: 27 April 2016 / Accepted: 9 May 2016 / Published: 13 May 2016
(This article belongs to the Special Issue Mineral Surface Science and Nanogeoscience)

Abstract

:
The topic of the specific surface area (SSA) of powders is not sufficiently described in the literature in spite of its nontrivial contribution to adsorption and dissolution processes. Fractal geometry provides a way to determine this parameter via relation SSA ~ x(D − 3)s(2 − D), where x (m) is the particle size and s (m) is a scale. Such a relation respects nano-, micro-, or macro-topography on the surface. Within this theory, the fractal dimension 2 ≤ D < 3 and scale parameter s plays a significant role. The parameter D may be determined from BET or dissolution measurements on several samples, changing the powder particle sizes or sizes of adsorbate molecules. If the fractality of the surface is high, the SSA does not depend on the particle size distribution and vice versa. In this paper, the SSA parameter is analyzed from the point of view of adsorption and dissolution processes. In the case of adsorption, a new equation for the SSA, depending on the term (2 − D)∙(s2sBET)/sBET, is derived, where sBET and s2 are effective cross-sectional diameters for BET and new adsorbates. Determination of the SSA for the dissolution process appears to be very complicated, since the fractality of the surface may change in the process. Nevertheless, the presented equations have good application potential.

1. Introduction

Specific surface area (SSA) is an important parameter influencing many physical and chemical processes, but there is no useful general equation for this quantity available in literature. This paper focuses on the surfaces of natural mineral powders (particular or granular materials, porous media), but the presented theory could be applied to all types and forms of materials. Surface energy, mechanical fragmentation processes, dissolution processes, chemical reactivity among liquid and solid powder particles, and adsorption are all strongly determined by the surface area of interacting powders [1,2,3,4].
The well-known measurement method for direct determination of the SSA is the BET (Brunauer, Emmett, Teller) method [5], which is based on gas adsorption. Alternatively, a dissolution process allows the SSA determination [6,7]. The “geometric” SSA can be derived from sieve or laser measurements of particle size distribution [8,9] or from capillary elevation of liquid through powder [10,11]. A correct equation for the determination of SSA must take into account the size distribution of particles and surface topography. Theoretical relations for computation of the specific surface area of powder materials are presented in [9] for smooth particles or in reviews for fractal (rough-surface, irregular-surface) particles in [12,13,14], which also dealing with principal problems of the surface topography.
The goal of this paper is to offer relationships for practical evaluation of the real surface area of powders. Such an approach offers the possibility of evaluation of large sample sets if the fractal dimension D of a surface is well known, for example from several BET measurements. The end of the paper mentions errors committed by other authors expressing SSA through fractal geometry.

1.1. Powders

In general, the powders may be prepared via two processes: (i) by a mechanical fragmentation of large pieces of material through sequential fragmentation to powder form and (ii) by a crystallization pathway, where crystals are created within a solution. In case of mechanically fragmented materials, particle shapes are relatively independent of crystallographic parameters [15]. In cases of crystals that grew within the solution, their shapes are determined by the types of crystal lattices. Their SSA depends on particle size (grain or crystal sizes), particle shapes, and level of surface topography. The differences between surface topography may be very significant, as presented for several materials in Figure 1 and Figure 2.

1.2. Particle Size Distribution

Particle sizes in poly-disperse samples typically follow two-parametric distribution, most often log-normal (or Gaussian normal), power function GGS (Gates, Gaudin, Schuhmann), or exponential function RRSB (Rosin, Rammler, Sperling, Bennet) [16]. Evaluation of their surface area is not simple, in contrast to samples with very narrow size ranges, often considered and denoted as monodisperse. The most frequent type of distribution is log-normal, which was observed in both mechanically fragmented and crystallized powders [16,17]. The SSA of monodispersional, smooth, spheric particles is equal to SSA = 6/(ρ·x), where ρ is particle density (true density) and x (m) the particle size (effective diameter). The SSA of the smooth-spheric particles following the log-normal size distribution is SSA = 6ρ−1·exp[−(μ + 2.5w2)], where μ and w are the arithmetic mean and standard deviation of ln(xi) values, respectively, and xi is the diameter of an individual particle [8,9].

1.3. Surface Fractal Topography

A very useful mathematical tool for describing surface topography seems to be Mandelbrot´s fractal geometry [18]. This theory was successfully used for description of the topography of mineral powder surfaces [19,20,21]. The conclusions of such an analysis are:
(I) surface topography may have a fractal character, as found for more than 75% of materials [19]; (II) the surface fractal dimension D typically ranges between 2 and 3 and D = 2 denotes a smooth surface; (III) the surface topography is self-similar; (IV) the fractal dimension D can be determined from the linear dependence of log(SSA) on log(x), the slope is equal to (D – 3), or can alternatively be calculated from the dependence of log(SSA) on log(s), where the slope is equal to (2 − D), where x is the powder particle parameter (radius or diameter) and s (m) is the measurement scale (most often the size of adsorbate’s molecule); (V) the SSA of particular materials can be expressed as C·s2 − D·xD − 3, where C (m3/kg) is a constant related to the shape and density of the particles, s (m) is the size of adsorption molecule, x (m) is the size of the particles, and D is the surface fractal dimension [21].
The s parameter may even reach a lattice dimension of crystals, i.e., 10−10 m. Because of an experimentally found paradox that D variables depend on the type of adsorbate (size of s), the researchers [7] introduced a new parameter, the “reaction fractal dimension” DR (see Table 1). It means that the same powder may have different fractal dimensions according to the type of adsorbate molecules interacting with the powder surface. In several works dealing with the fractal dimension of surfaces, the scale parameter was omitted in spite of the fact that it is not possible to perform fractal analysis without it (see Discussion).

2. Methods

This paper presents a theoretical framework to describe the SSA. Focusing on provision of applicable relations for the SSA of powder mineral materials, which are greatly spread in chemical processes, and currently play a significant role in nanotechnology, we used the basic findings of the Mandelbrot fractal theory [14]. This theory was completed using parameters related to the size distribution of powder particles. To support the theory, data from previous measurements are presented in Table 1 and Table 2. Theoretical simulations were performed using Matlab 7.0 and Microsoft Excel codes.
The photos of the mineral particles were obtained from SEM Philips 515 (Philips, Amsterdam, The Netherlands). The presented SSA values (for Figure 1 and Figure 2) were acquired from BET measurements on a Sorptomatic 1990 device (Thermo Fisher Scientific, Waltham, MA, USA).
Terminology: There is a problem in deciding whether specific surface area (SSA) is an appropriate name for the quantity that is the subject of the article. We could rename it chemical specific surface area, reaction specific surface area, or reactive specific surface area. Whatever the most appropriate name may be, what is known for certain is that real SSA does not exist since it depends on the s scale parameter, i.e., on the size of adsorbate (dissolvent). In our opinion, it is better to keep the traditional name SSA, which is used in the main experimental technique (BET), to have the possibility of comparison, and simultaneously add the term reactive specific surface area (RSSA) as a more appropriate value for real surface processes. In the RSSA, which is defined in the discussion section, diffusion time of adsorbate (dissolvent) to fractal-porous media plays an important role.

3. Results and Discussion

In this section, the SSA is derived for pure powder materials using fractal theory. This approach provides a possibility for a recomputation of the SSA results from BET measurements to the SSA for a new adsorbate. The SSA value is then transformed to the RSSA in the discussion section below. Simple models for time-development of reaction fractal dimension DR during surface interaction processes are simulated.

3.1. Shape Factor and Particle Shape Approximation

In this paper, the simplest spheric approximation of particle shapes, a sphere with diameter x, is used. Then, the surface area of the smooth spheric particles is A = πx2 and its volume is V = πx3/6, in which π and π/6 are shape factors. Real particles and crystals have various shapes and their shape factors cannot easily be derived.

3.2. Size Distribution of the Powder Particles

In laboratory work, it is experimentally very difficult to prepare a powder monodispersion, the particle size distribution of which can be described by a Dirac delta function. The powders are actually prepared as pseudo-monodispersions (narrow polydispersions) with xmin and xmax parameters. If the xmaxxmin size interval is narrow, the particle size distribution can simply be considered as uniform, but the size uniformity as well as the uniformity of other quantities (surface area or volume of particles) is not guaranteed. The parameters of this type of distribution are presented in Appendix A, including xA and xV, the particle sizes with average surface area and volume, respectively, which are needed for the determination of the SSA. If the powders follow a linear distribution (see Figure 3), the related parameters, presented in Appendix B, can be used. It seems to be most practical to use the parameters for experimental distribution (see Appendix C). If, as is often observed, powder particles follow log-normal distribution, the mentioned parameters are presented in Appendix D. The particle size distribution of a powder can be determined most precisely by laser analyzers.

3.3. Determination of the Specific Surface Area (SSA)

Considering the main results of fractal theory [18], a practical equation can be derived for computation of the SSA of powders with fractal (non-smooth) surfaces.
The maximal amount of molecules covering the spheric particle in a single layer is
N = ( π x A 2 s 2 ) D A = π D A ( x A s ) 2 D A = π D / 2 ( x A s ) D ,
where xA (m) is the particle size with average surface area, s (m) is the effective cross sectional diameter of a liquid molecule, D (-) is the true fractal dimension of the surface, and DA = D/2 fractal dimension of the surface related to the area scale. For similar considerations see [22,23]. Approximation of the adsorbate molecular cross-sectional area by square seems to be theoretically more valid than approximation by circle. Equation (1) corresponds with Mandelbrot´s fractal geometry, where the fractal dimension for unit area (length) is expressed by the well-known equation D = log(N)/log(1/ε), where ε ≤ 1 is a dimensionless equivalent to the scale parameter s. A total area of the single particle (granule, grain, crystal) is
A = N s 2 = π D / 2 x A D s ( 2 D ) ( m 2 ) .
The SSA is generally defined as SSA = A/(ρV) = nAave/(ρnVave), where A and V are the surface area and volume of all powder particles with density ρ, Aave and Vave are average values for a set of particles, and n is their count. Respecting the fractal character of a surface, the SSA is
SSA = 6 π ( D / 2 1 ) x A D s ( 2 D ) ρ x V 3 ( m 2 / k g )
In case of true mono-dispersion,
SSA = 6 π ( D / 2 1 ) x ( D 3 ) s ( 2 D ) ρ ( m 2 / k g ) ,
where x is the particle size (effective diameter).
The limits of Equation (3b) are SSA = 6/(ρ·x) for D = 2 and SSA = 6π0.5/(ρ·s) for lim D 3 SSA . An equation similar to Equation (3b) is presented in [21] and in a simpler form also in the book by Adamson [12], page 564. The importance of the xA and xV parameters significantly decreases if the value of D approaches 3.
The form of Equation (3b) confirms the validity of the mutual experimentally observed linear relation between log(SSA) and log(x) or the linear relation between log(SSA) and log(s), with slopes equal to (D − 3) and (2 − D) respectively [7,19], as mentioned in the introduction. It seems that such experimentally determined dependences with a significant linear theoretical fit imply a fractal (or self-similar) character of measured surfaces. Also, several authors note the multifractality of the surface [24,25]. It is contentious whether the dependences presented in [24] express “multifractality” or non-fractality of surface. Multifractality of surface seems to be hard to explain since the basis of the fractal theory is a dimensional replication of the same surface motive.
Considering alternative evaluation of the external surface area by SSAext = λ6/(ρ·x) relation in [26], where λ is the surface roughness, the slope of linear relation between log(SSA) and log(x) is equal to −1. Such an equation is not applicable to fractal surfaces and may be fully recovered by Equation (3a) or (3b).

3.4. Useful Equations

Logarithmic transformation of Equation (3a,b) gives
log(SSA) = b + m1log(xA) − 3log(xV)
log(SSA) = b + m2log(x),
where b = log[6π(D/2 − 1)ρ−1s(2 − D)] and m1 = D and m2 = (D − 3). Equation (4b) corresponds with the relation generally used for evaluation of SSA of mineral powders [26]. The slope in the log(SSA) vs. log(x) dependence is presented for several minerals in Table 2 (original slopes recomputed for fractal dimensions). In several cases, the fractal dimension D does not fall into the interval 2 ≤ D < 3, similarly as in the case of Table 1. Such results were not explained in the original paper [7], but theoretically, using Equation (4a), the paradox can be explained.
Brantley and Mellott [26] used the mentioned dependence (Equation (4b)); however, they worked with narrow polydispersions. As a particle size parameter, they introduced the “mean particle diameter” d = 10n = (xmaxxmin)0.5, where n = (logxmax + logxmin)/2, considering the particle size distribution as log-normal. For example, for Amelia albite, the presented size limits amount to xmax = 840 μm and xmin = 500 μm and the mean particle diameter amounts to d = 648 μm. Their approach is not correct, because considering the particle size distribution as log-normal in all powder size intervals is not correct (the log-normal distribution cannot be expected within the individual size intervals, see Figure 3). As a result, the expressions for d do not represent the effective particle dimension.

3.5. Determination of the Surface Fractal Dimension D

Equation (4a,b) offer the possibility of regression determination of the true surface fractal dimension D or reaction fractal dimension DR. In the case of real powders having dispersion of particle sizes, valid relations are
log(SSA∙xV3) ~ D∙log(xA)
log(SSA) ~ (2 − D)log(s).
Fractal dimension of mono-dispersion can be determined using the relation
log(SSA) ~ (D − 3)log(x)
or through the relation presented in Equation (5b). In this sense, the values and uncertainties of the D and DR fractal dimensions, presented in Table 1 and Table 2, should be revised according to Equation (5a). The parameters xA and xV can be most simply computed from experimental distribution (see Appendix C), which is determined based on the particle size measurement using a laser analyzer. Vandamme et al. deal with the theoretical limits of such an approach by simulating single-layer molecular coverage of the hypothetical nano-, micro- and millimetric irregularities on the material surface [23].

3.6. Uncertainty Computation

We usually need to express the results in the form of (SSA ± uSSA) m2/kg. The practicality of the main presented results (Equation (3a,b)) is significantly dependent on the uSSA = [Σ(uqi∙∂SSA/∂qi)2]0.5 uncertainty, where qi is the q-th quantity. The most significant contribution to uSSA, which is the total uncertainty, probably really induces uncertainty of the uD surface fractal dimension. The uD should be determined as exactly as possible.

3.7. Incorrect Use of Fractal Theory for the SSA Evaluation

In several papers, the fractal theory is incorrectly used for the SSA evaluation. Authors usually ignore the significance of the s scale parameter, which is one of the most important parameters within the fractal theory. For example, in [26] an equation is presented for geometric SSA in the form of aρ−1x(D − 3), where a is the shape coefficient. The s parameter is missing and if D is not equal to 2, SSA does not have the m2∙kg−1 unit. Similar incorrect equations were previously presented, for which see [27]. Working with fractal theory, the authors again ignored the s scale parameter, and presented an incorrect equation SSA = kdave(D − 3) for spheric monodispersion, where a is the shape coefficient and dave is the average size of particles.

3.8. Transformation of the SSA Value after the BET Measurement for a New Adsorbate

The SSABET acquired through BET measurement can be determined using several types of adsorbate molecules (N2, Kr, or Ar and others). If use of powder for interaction with another adsorbate (for example water) is desirable after the BET measurement, the new SSA2 can be estimated by the general equation SSA2 = SSABET + ∆SSA = SSABET + ∆s∙dSSABET/dsBET and ∆s = (s2sBET), where s2 is the size of the molecule of the new adsorbate and sBET the size of the molecule used in the BET measurement. Now, the SSABET is considered as an experimental value, but derivation is applied to Equation (3a), SSABET = 6π(D/2 − 1)ρ−1xADxV3sBET(2 − D). The derived surface area related to the new adsorbate is:
SSA2 = SSABET∙[1 + (2 − D)∙(s2sBET)/sBET] (m2/kg).
The s values are constants and represent the cross-sectional diameters of adsorbate molecules and are not dependent on the type of adsorbent. The tabulated values of a b constant (m3·mol−1) from the van der Waals equation should be used for their estimations (see Table 3). The s effective diameter equals (b/NA)1/3, where NA is Avogadro´s number. The standard uncertainty of such a transformation should be estimated from uBET and uncertainties of D, sBET and s2. The validity of Equation 6 should be tested in BET measurements, but is probably restricted by variation of fractal dimension, as subsequently presented.

3.9. Discussion on Variability of Fractal Dimension

The existence of different fractal dimension D for various adsorbates (or dissolvents, on the same mineral powder) is an empirical finding and does not seem to have any theoretical substantiation. The fractal dimension is likely to be an invariant surface constant (according to fractal theory), independent on the size of the adsorbate molecule. On the other hand, the existence of the abovementioned phenomenon is strongly supported by experiments (see Table 1). Taking into account the two different surface processes, adsorption and dissolution, the explanation could be based on a consideration of the time-dependent creation of the molecular layer on the powder surface connected with the different intensity of molecular diffusion into the pores as well as on the change of surface topography during the dissolution [29,30,31]. Other surface interaction processes like precipitation, crystal growth, and corrosion can be analyzed, while their description is probably very similar [30,32].
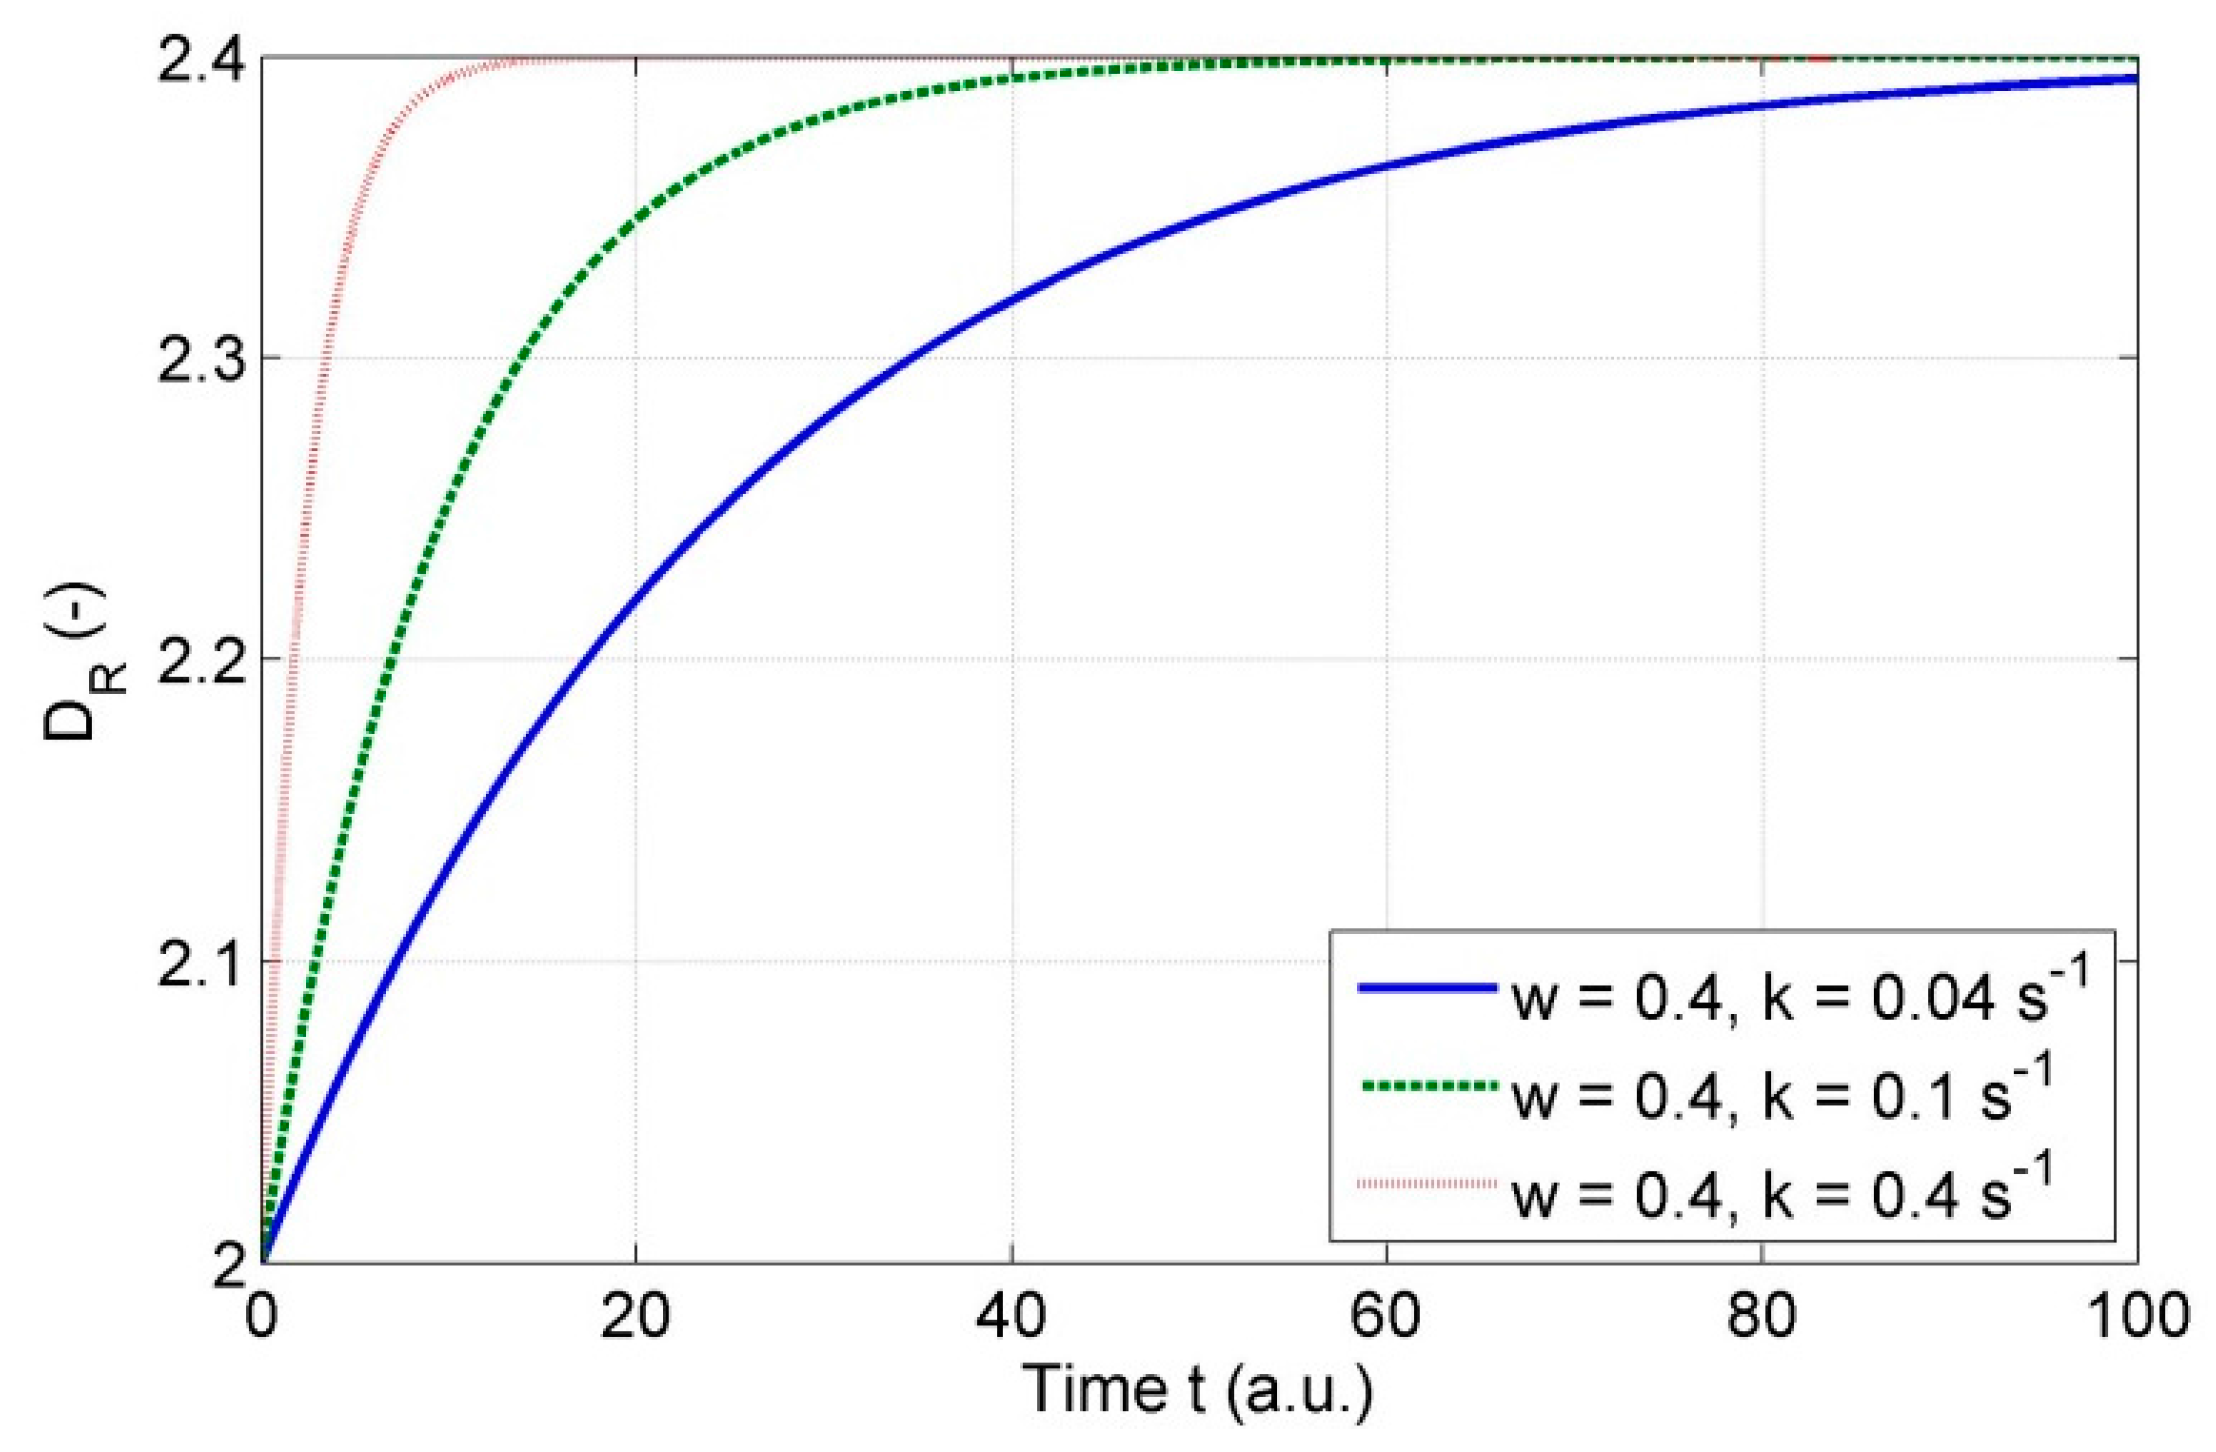
In the case of adsorption/sorption processes that are based on van der Waals forces on the interface, the connection between true fractal dimension D and the reaction fractal dimension DR could be most simply estimated via an asymptotic function:
DR = 2 + w(1 − ekt),
where D = 2 + w, w = 0 , 1 ) and k > 0 s−1 are constants and t (s) is the time (for simulations see Figure 4). The k constant represents the intensity of adsorbate diffusion to pores. The boundary conditions of the presented equation are DR = 2 at the time t = 0 s and the opposite condition is lim t D R = D . More complicated derivations for this process could be made from advanced models of penetration of liquid to fractal porous media [31].
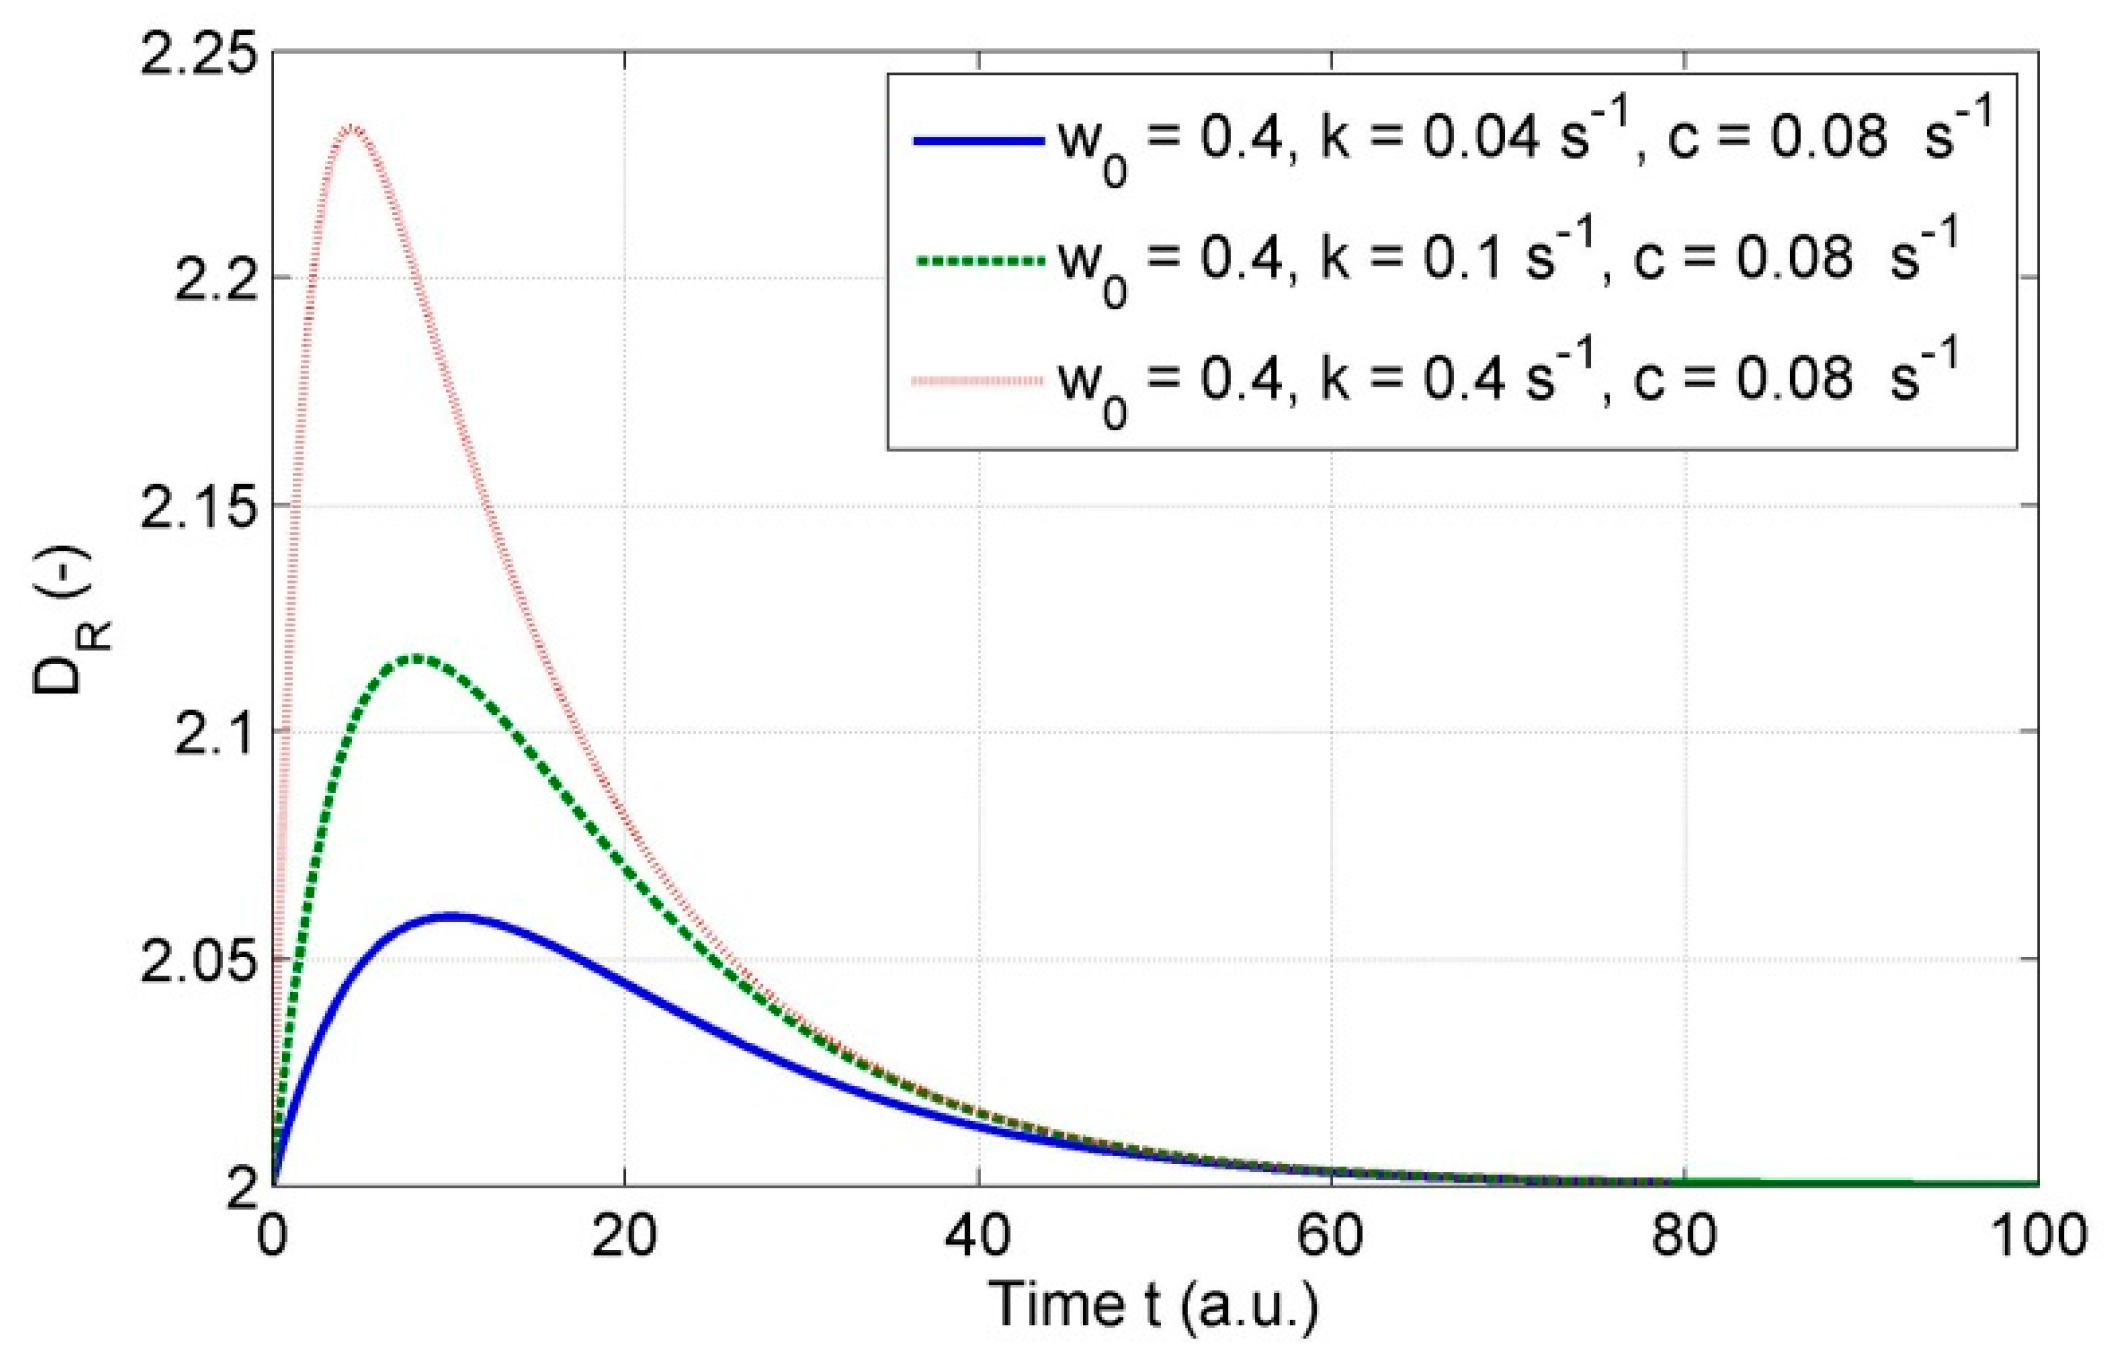
In the case of dissolution processes that are based on surface chemical interactions reducing the amount of solid material, the variability of fractal dimension probably depends on time, too. This seems to be a more complicated issue than adsorption, which poses many specific problems [33]. The reaction surface area A is one of the parameters in dissolution rate r, which is presented in the form of r = kAλ·exp[−E/(RT)] in unit mol/(m2·s), where k and λ are constants, E is the specific activation energy, and RT is specific heat [30]. It is apparent that the SSA has to change during the dissolution and the dissolution rate changes during the process according to the change of fractal dimension. For the development of reaction fractal dimension, a simple function that could be valid for an ideal dissolution process can be estimated as follows:
DR = 2 + w(1 − ekt), w = w0·ect,
where k > 0 s−1 is a constant and 2 + w0·ect = D is the true surface fractal dimension, c > 0 s−1 represents the intensity at which smoothness is achieved, w 0 = 0 , 1 ) is a constant related to initial fractal dimension. This relation is deduced from the condition that at the beginning of interaction, the process is similar to adsorption and fractal dimension DR = 2, because the adsorbate molecules start to diffuse to pores and inner irregularities at that moment. Simultaneously, the dissolution is active on the external cover of particles and the fractality (or roughness) is reduced. Adding these two processes results in time-dependence, as presented in Figure 5. In reality, however, the fractality (roughness) can increase with time in some dissolution processes, making this idealized model invalid provided that any inhomogeneities and non-reactive surface points appear on the surface [30,33,34].
The reaction fractal dimension DR appears to be a time-dependent quantity during adsorption or dissolution. From this point of view, it is more practical to write the reaction fractal dimension in the form of DR,t, where t (s) is the measurement time. For example, DR,6h denotes the value of the reaction fractal dimension after six hours of adsorption/dissolution. A more precise designation would be DR,He,6h with the specification of a He-like adsorbate/dissolvent. A single value of SSA for a specific powder does not exist, and surface area quantity must be related to the adsorbate size and time. This approach could explain the paradox of a different cross-sectional area of the same gas on a different material, as presented in many papers e.g., [35], and perhaps also the paradox D < 2 in Table 1 and Table 2.
Thus, we have two basic equations. The first one is the equation for the SSA, the idealized Equation (3a), which is valid only for long reaction times and is appropriate for adsorption or sorption. The equation can be rewritten to find a more practical relation for general time-dependent surface interaction processes. Consequently, reactive specific surface area can be expressed as follows:
RSSA X ,   t = 6 π ( 0.5 D R , t     1 ) x A D s ( 2     D R ,   t ) ρ x V 3 ( m 2 / k g )
where X is the designation of a liquid or gas substance (H2O, N2, He, i.e., adsorbate, dissolvent), t (s) is the reaction time and s (m) is the size of adsorbate or dissolvent. Therefore, whereas the SSA does not depend on time, the RSSA does. The Equation (9) is appropriate for a description of dissolution processes. The SSA seems to be a constant quantity for long-standing adsorption processes, but not for dissolution processes, because there the true fractal surface dimension D changes with time. The dissolution rate expressed as mass/time is proportional to the RSSAX,t by the relation
d m d t RSSA X , t
but the total amount ∆m (kg) of solute is
m RSSA X ,   t ¯ = 1 Δ t t 1 t 2 RSSA X ,   t d t
and depends on the mean of RSSAX,t, where ∆t = t2t1 is the dissolution time interval.

4. Conclusions

It is possible to determine the SSA of the powder particles using fractal theory by means of Equation (3a), or in the case of time-dependent surface processes by Equation (9) via the RSSA. For the exact evaluation of the SSA or RSSA for a set of the same type of samples, first the reaction fractal dimension of surface DR should be determined using dependence log(RSSAX,t∙xV3) ~ DR,t∙log(xA) or log(RSSAX,t) ~ (2 − DR,t)∙log(s), by several BET or dissolution measurements. The value of the SSA depends on the size of the interacting molecule. The size of this molecule is equal to s scale, a significant parameter within fractal geometry. The value of the reaction fractal dimension DR seems to be a function of the time and the true fractal dimension D.
A new equation SSAX = SSABET∙[1 + (2 − D)∙(sXsBET)/sBET], where sBET and sX are effective cross-sectional diameters for the BET and for new adsorbate molecules, was derived. After the BET measurement, this equation can be used for estimation of the SSA of the same powder potentially interacting with a new adsorbate.

Acknowledgments

This paper was created within the project “IT4Innovations Centre of Excellence,” Registration No. CZ.1.05/1.1.00/02.0070 (European Union and Czech State Budget support). The article was elaborated partly in the framework of the following projects: “Institute of Clean Technologies for Mining and Utilization of Raw Materials for Energy Use”, Reg. No. LO1406; RMTVC (Regional Materials Science and Technology Centre) No. LO1203 and SGS (Students Grant Competition) No. SP2016/94.

Author Contributions

Petr Jandacka designed and performed the measurements; Petr Jandacka and Jan Valicek analyzed the data; Jaromir Pistora and Vilem Madr provided materials and measurement devices—they controlled of activities; Petr Jandacka formulated the theory, derived the equations and wrote the paper.

Conflicts of Interest

The authors declare no conflict of interest.

Appendix A. Estimation of the xA and xV Effective Particle Dimensions for the Uniform Particle Size Distribution

If spheric particle size x (diameter) has a uniform distribution fx(x) = 1/(xmaxxmin), then the surface area A = h(x) = πx2 has a distribution
f A ( A ) = f x [ h 1 ( A ) ] d x d A ,
where h−1(A) = x = (A/π)0.5. Consequently, probability densities for surface area, depending on A and x, are
f A ( A ) = 1 2 π ( x max x min ) ( π A ) 0.5 ,
and
f A ( x ) = 1 2 π x ( x max x min ) .
Average surface area can be computed according to the following equation:
A ave ( A ) = A min A max A f A ( A ) d A ,
and because dA = 2πxdx, dependence on x equals
A ave ( x ) = x min x max π x 2 ( x max x min ) d x = π ( x max 3 x min 3 ) 3 ( x max x min ) .
Analogically, using the same algorithm, the average volume is
V ave ( x ) = π ( x max 4 x min 4 ) 24 ( x max x min ) .
The size of a particle with average surface area has a diameter of
xA = (Aave/π)0.5,
and the size of a particle with average volume has a diameter of
xV = (6Vave/π)1/3.

Appendix B. Estimation of the Effective Particle Dimensions xA and xV for the Linear particle Size Distribution

Considering the linear particle size distribution fx(x) = kx + q, the following condition can be stated:
1 = x min x max ( k x + q ) d x = k 2 ( x max 2 x min 2 ) + q ( x max x min ) ,
where the intercept q equals
q = 2 k ( x max 2 x min 2 ) 2 ( x max x min ) .
Using the same algorithm as in Appendix A, the average surface area is
A ave ( x ) = π k 4 ( x max 4 x min 4 ) + π q 3 ( x max 3 x min 3 ) ,
and the average volume is
V ave ( x ) = π k 30 ( x max 5 x min 5 ) + π q 24 ( x max 4 x min 4 ) .
The k and q parameters should be determined based on a linear fit of the experimental distribution in a selected size interval (see Figure 3). The spheric particle with average surface area has a diameter of
xA = (Aave/π)0.5,
and the diameter of spheric particle having average volume is
xV = (6Vave/π)1/3.

Appendix C. Estimation of the xA and xV Effective Particle Dimensions for the Experimental Particle Size Distribution

The probability density of experimental distribution is
f = ni/[n(xbxa)],
where (xbxa) is the particle size interval of a bin.
The spheric particle sizes with average surface area and average volume are
x A = ( 1 n i = 1 n n i x i 2 ) 0.5 ,
x V = ( 1 n i = 1 n n i x i 3 ) 1 / 3 ,
where n is the total number of particles and ni are the frequencies of particle sizes xi.

Appendix D. Estimation of the xA and xV Effective Particle Dimensions for the Log-Normal Particle Size Distribution

The probability density of the log-normal distribution is
f ( x ) = 1 ω x 2 π exp ( ln x μ 2 ω 2 ) .
The average surface area and the average volume are
Aave = π·exp(2μ + 2ω2),
Vave = π·exp(3μ + 4.5ω2)/6,
where μ is the arithmetic mean and w standard deviation of the ln(xi) values [8,9]. In the particle size distribution, the diameter of a spheric particle with average surface area is
xA = (Aave/π)0.5
and the diameter of a spheric particle with average volume is
xV = (6Vave/π)1/3.

References

  1. Greathouse, J.; Johnson, K.; Greenwell, H. Interaction of natural organic matter with layered minerals: Recent developments in computational methods at the nanoscale. Minerals 2014, 4, 519–540. [Google Scholar] [CrossRef] [Green Version]
  2. Li, J.; Hitch, M. Carbon dioxide sorption isotherm study on pristine and acid-treated olivine and its application in the vacuum swing adsorption process. Minerals 2015, 5, 259–275. [Google Scholar] [CrossRef]
  3. Ozkanlar, A.; Kelley, M.; Clark, A. Water organization and dynamics on mineral surfaces interrogated by graph theoretical analyses of intermolecular chemical networks. Minerals 2014, 4, 118–129. [Google Scholar] [CrossRef]
  4. Ghanbarian-Alavijeh, B.; Millán, H. The relationship between surface fractal dimension and soil water content at permanent wilting point. Geoderma 2009, 151, 224–232. [Google Scholar] [CrossRef]
  5. Brunauer, S.; Emmett, P.H.; Teller, E. Adsorption of gases in multimolecular layers. J. Am. Chem. Soc. 1938, 60, 309–319. [Google Scholar] [CrossRef]
  6. Dokoumetzidis, A.; Macheras, P. A century of dissolution research: From Noyes and Whitney to the biopharmaceutics classification system. Int. J. Pharm. 2006, 321, 1–11. [Google Scholar] [CrossRef] [PubMed]
  7. Farin, D.; Avnir, D. Reactive fractal surfaces. J. Phys. Chem. 1987, 91, 5517–5521. [Google Scholar] [CrossRef]
  8. Jandacka, P.; Hlavac, L.M.; Madr, V.; Sancer, J.; Stanek, F. Measurement of specific fracture energy and surface tension of brittle materials in powder form. Int. J. Fract. 2009, 159, 103–110. [Google Scholar] [CrossRef] [Green Version]
  9. Jandacka, P.; Sancer, J.; Vojtkova, H.; Besta, P.; Brazda, R.; Kolicova, P.; Simkova, L. Fracture energy of selected brittle silicates. Ceram. Silik. 2011, 55, 355–361. [Google Scholar]
  10. Carman, P.C. Capillary rise and capillary movement of moisture in fine sands. Soil Sci. 1941, 52, 1–14. [Google Scholar] [CrossRef]
  11. Jandacka, P.; Dvorsky, R.; Lunacek, J. Measurement of powder surface area using capillary elevation method. Inzynieria Miner. 2015, 16, 171–179. [Google Scholar]
  12. Adamson, W.A. Physical Chemistry of Surfaces; John Wiley & Sons, Inc.: New York, NY, USA, 1990. [Google Scholar]
  13. Lüttge, A.; Arvidson, S.R. The mineral-water interface. In Kinetics of Water-Rock Interaction; Brantley, L.S., Kubicki, D.J., White, F.A., Eds.; Springer: New York, NY, USA, 2008; pp. 73–107. [Google Scholar]
  14. Lüttge, A.; Arvidson, R.S.; Fischer, C. Fundamental controls of dissolution rate spectra: Comparisons of model and experimental results. Procedia Earth Planet. Sci. 2013, 7, 537–540. [Google Scholar] [CrossRef]
  15. Jandacka, P.; Uhlar, R.; Kolenova, I.; Duskova, V.; Mahdalova, V.; Filipkova, K.; Zeman, D. Charakteristika Tvarů Částic Minerálních Partikulárních Látek; Recyklace odpadů XIII, Ostrava, Czech Republic; VSB-TU Ostrava: Ostrava, Czech Republic, 2009. (In Czech) [Google Scholar]
  16. Zisselmar, R.; Kellerwessel, H. Approximate mathematical description of particle-size distributions—Possibilities and limitations as to the assessment of comminution and classification processes. Part. Part. Syst. Character. 1985, 2, 49–55. [Google Scholar] [CrossRef]
  17. Eberl, D.D.; Drits, V.A.; Srodon, J. Deducing growth mechanisms for minerals from the shapes of crystal size distributions. Am. J. Sci. 1998, 298, 499–533. [Google Scholar] [CrossRef]
  18. Mandelbrot, B. The Fractal Geometry of Nature; W. H. Freeman and Company: San Francisco, CA, USA, 1982. [Google Scholar]
  19. Avnir, D.; Farin, D.; Pfeifer, P. Molecular fractal surfaces. Nature 1984, 308, 261–263. [Google Scholar] [CrossRef]
  20. Avnir, D.; Farin, D.; Pfeifer, P. Surface geometric irregularity of particulate materials—The fractal approach. J. Colloid Interface Sci. 1985, 103, 112–123. [Google Scholar] [CrossRef]
  21. Borkovec, M.; Wu, Q.; Degovics, G.; Laggner, P.; Sticher, H. Surface area and size distributions of soil particles. Colloids Surfaces A Physicochem. Eng. Asp. 1993, 73, 65–76. [Google Scholar] [CrossRef]
  22. Ficker, T. Fractal strength of cement gels and universal dimension of fracture surfaces. Theor. Appl. Fract. Mech. 2008, 50, 167–171. [Google Scholar] [CrossRef]
  23. Vandamme, H.; Levitz, P.; Bergaya, F.; Alcover, J.F.; Gatineau, L.; Fripiat, J.J. Monolayer adsorption on fractal surfaces—A simple two-dimensional simulation. J. Chem. Phys. 1986, 85, 616–625. [Google Scholar] [CrossRef]
  24. Stach, S.; Cybo, J.; Chmiela, J. Fracture surface—Fractal or multifractal? Mater. Character. 2001, 46, 163–167. [Google Scholar] [CrossRef]
  25. Stach, S.; Roskosz, S.; Cybo, J.; Cwajna, J. Multifractal description of fracture morphology: Investigation of the fractures of sintered carbides. Mater. Character. 2003, 51, 87–93. [Google Scholar] [CrossRef]
  26. Brantley, S.L.; Mellott, N.P. Surface area and porosity of primary silicate minerals. Am. Miner. 2000, 85, 1767–1783. [Google Scholar] [CrossRef]
  27. Piscitelle, L.; Segars, R. Effect of the particle size distribution in determining a powder´s fractal dimension by single gas BET: A mathematical model. J. Colloid Interface Sci. 1992, 149, 226–232. [Google Scholar] [CrossRef]
  28. Brož, J.; Roskovec, V.; Valouch, M. Fyzikální a Matematické Tabulky; SNTL: Prague, Czech Republic, 1980. (In Czech) [Google Scholar]
  29. El-Safty, S.A. Sorption and diffusion of phenols onto well-defined ordered nanoporous monolithic silicas. J. Colloid Interface Sci. 2003, 260, 184–194. [Google Scholar] [CrossRef]
  30. Fischer, C.; Kurganskaya, I.; Schäfer, T.; Lüttge, A. Variability of crystal surface reactivity: What do we know? Appl. Geochem. 2014, 43, 132–157. [Google Scholar] [CrossRef]
  31. Ghanbarian, B.; Hunt, A.G. Universal scaling of gas diffusion in porous media. Water Resour. Res. 2014, 50, 2242–2256. [Google Scholar] [CrossRef]
  32. Fischer, C.; Karius, V.; Weidler, P.G.; Lüttge, A. Relationship between micrometer to submicrometer surface roughness and topography variations of natural iron oxides and trace element concentrations. Langmuir 2008, 24, 3250–3266. [Google Scholar] [CrossRef] [PubMed]
  33. Arvidson, R.S.; Ertan, I.E.; Amonette, J.E.; Luttge, A. Variation in calcite dissolution rates: A fundamental problem? Geochim. Cosmochim. Acta 2003, 67, 1623–1634. [Google Scholar] [CrossRef]
  34. Fischer, C.; Arvidson, R.S.; Lüttge, A. How predictable are dissolution rates of crystalline material? Geochim. Cosmochim. Acta 2012, 98, 177–185. [Google Scholar] [CrossRef]
  35. Tkáčová, K. Mechanical Activation of Minerals; Elsevier: Amsterdam, The Netherlands, 1989. [Google Scholar]
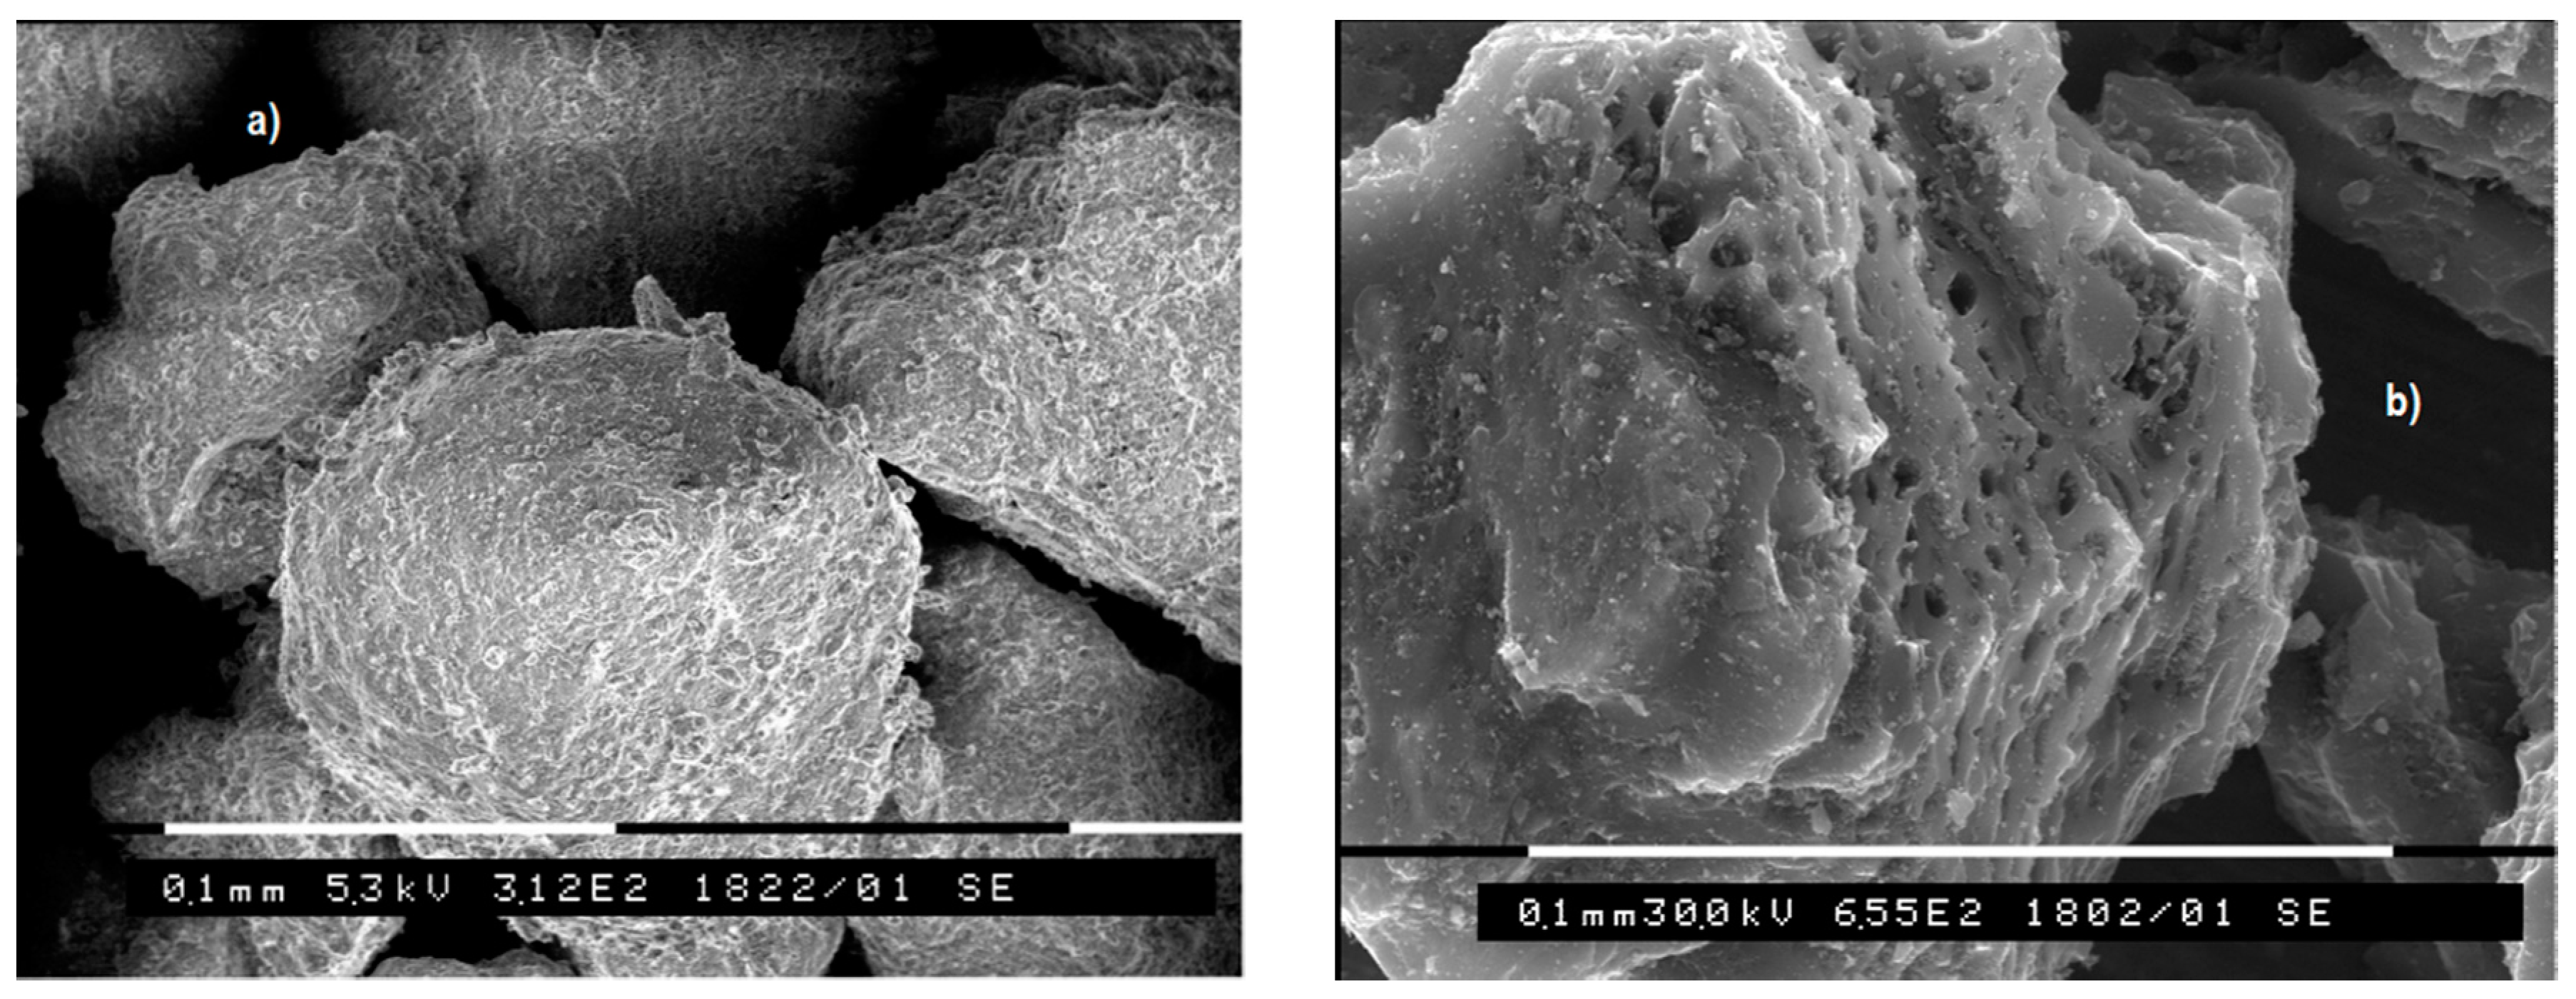
Figure 1. Examples of powder particles with high SSA: fractal-like topography of montmorillonite (a) with SSA ≈ 1000 m2·g−1 (nanometric pores) and activate black coal (b) with surface area around 1100 m2·g−1 and pore size of approximately 5 μm (maximum)—its surface seems to be non-homogenous, i.e., non-fractal. Scale bars 0.1 mm.
Minerals 06 00044 g001
Figure 2. Relatively smooth surface topography of olivine, SSA ≈ 1 m2·g−1 (a) and bio-sample of rapeseed oil having bio-topography (b)—where the surface area was not measured. Scale bars: (a) 0.1 mm, (b) 1 mm.
Minerals 06 00044 g002
Figure 3. Linear approximation of particle size distribution within a narrow interval of log-normal particle size distribution.
Minerals 06 00044 g003
Figure 4. Simulation of hypothetic time-dependence of DR on the time in the case of adsorption processes—influence of diffusion of adsorbate on fractal surface topography.
Minerals 06 00044 g004
Figure 5. Simulation of hypothetic time-dependence of DR on the time in the case of specific dissolution process—influence of diffusion and “dissolution of fractality.”
Minerals 06 00044 g005
Table 1. Surface fractal dimensions and their standard deviations of natural powders in a shortened table taken from [7]. The DR is the reaction fractal dimension and D is the true fractal dimension.
Powder MaterialProcess for DR DeterminationParticle Size Range (μm)DRD a
Upper Columbus dolomite (CaCO3-MgCO3)Acidic dissolution in NH4Cl163–26052.15 ± 0.102.91 ± 0.02
Upper Columbus dolomite (CaCO3-MgCO3)Acidic dissolution in oxalate buffer163–26052.34 ± 0.042.91 ± 0.02
Niagara dolomite (CaCO3-MgCO3)Acidic dissolution in NH4Cl163–26052.07 ± 0.062.58 ± 0.01
Niagara dolomite (CaCO3-MgCO3)Acidic dissolution in oxalate buffer163–26052.19 ± 0.052.58 ± 0.01
Halimeda skeletal carbonate (green algae)Acidic dissolution in seawater81–5132.05 ± 0.083.02 ± 0.07
Hybla alkali feldspar (potassium aluminosilicate)Dissolution in HCl (pH 5)56–4002.95 ± 0.162.36 ± 0.02
Hybla alkali feldspar (potassium aluminosilicate)Dissolution in boric acid buffer (pH 9)56–4003.06 ± 0.062.36 ± 0.02
QuartzDissolution in HF (3.66 M)45–10002.14 ± 0.062.08 ± 0.08
Ottawa sand (quartz)Dissolution in HF (3.66 M)89–7112.15 ± 0.062.08 ± 0.08
Madagascar quartzDissolution in HF (0.1 M)0.4–61.59 ± 0.051.99 ± 0.06
Madagascar quartzDissolution in dilute NaOH0.4–61.78 ± 0.071.99 ± 0.06
Vitreous silicaDissolution in HF (0.1 M)0.4–12.61.95 ± 0.042.03 ± 0.04
Iceland spar calcite (CaCO3)Reaction with Fe(ClO4)3 in presence of 2% CO2100–6312.11 ± 0.032.16 ± 0.04
Iceland spar calcite (CaCO3)Reaction with Fe(ClO4)3 in presence of 20% CO264–6312.45 ± 0.042.16 ± 0.04
Iceland spar calcite (CaCO3)Dissolution in HCl (pH 3)137–6311.80 ± 0.062.16 ± 0.04
a determined from BET or dissolution methods using small adsorbate molecules.
Table 2. Evaluation of fractal dimensions of natural mineral powders—table transferred from [26]. The values of the fractal dimension D were computed on the basis of the above derived relation D = m + 3, see Equation (5c).
Powder MaterialmD
Quartz−1.02.0
Microcline (Keystone)−0.8 ± 0.22.2 ± 0.2
Microcline (Keystone)−0.8 ± 0.12.2 ± 0.1
Albite glass−1.4 ± 0.11.6 ± 0.1
Albite (Amelia)−1.0 ± 0.12.0 ± 0.1
Albite (Evje)−0.7 ± 0.12.3 ± 0.1
Oligoclase (Madawaska)−0.6 ± 0.22.4 ± 0.2
Labradorite (Labrador)−0.5 ± 0.12.5 ± 0.1
Bytownite (Duluth)−0.5 ± 0.12.5 ± 0.1
Bytownite (Crystal Bay)−0.6 ± 0.22.4 ± 0.2
Anorthite (Miyake Jima)−1.2 ± 0.21.8 ± 0.2
Anorthite (Grass Valley)−0.20 ± 0.052.80 ± 0.05
Olivine (San Carlos)−1.1 ± 0.21.9 ± 0.2
Olivine (Twin Sisters)−0.3 ± 0.22.7 ± 0.2
Diopside (Herschel)−0.6 ± 0.22.4 ± 0.2
Hornblende (Gore Mtn.)−0.6 ± 0.12.4 ± 0.1
Table 3. Estimations of the effective cross-sectional diameters s = (b/NA)1/3 of selected adsorbate molecules according to the tabulated b values [28] contained in van der Waals’s equation. The standard uncertainty of s is estimated from ub = 10−8 m3∙mol−1 value.
Adsorbateb∙106 (m3∙mol−1)s∙1010 (m)Adsorbateb∙106 (m3∙mol−1)s∙1010 (m)Adsorbateb∙106 (m3∙mol−1)s∙1010 (m)
N238.704.09 ± 0.03HCl40.604.16 ± 0.03C3H890.305.43 ± 0.02
Ar32.003.84 ± 0.04C2H4O2107.005.74 ± 0.02C3H8O98.305.58 ± 0.02
Kr39.604.12 ± 0.03SO256.704.65 ± 0.03Rn62.004.79 ± 0.02
H226.623.61 ± 0.04CO39.544.12 ± 0.03Hg16.963.11 ± 0.06
He23.503.47 ± 0.05CO242.814.23 ± 0.03CS272.505.04 ± 0.02
H2O30.403.78 ± 0.04O231.703.83 ± 0.04H2S43.004.24 ± 0.03
C2H6O83.955.30 ± 0.02CH442.754.23 ± 0.03 C7H8146.006.37 ± 0.01
C6H6119.05.95 ± 0.02CH4O67.004.91 ± 0.02C8H10176.006.78 ± 0.01
HF73.855.08 ± 0.02O349.104.43 ± 0.03Br44.404.28 ± 0.03