Article

Quantitative XRD Analysis of the Structural Changes of Ba-Exchanged Montmorillonite: Effect of an in Situ Hydrous Perturbation

1
Departement de Physique, Faculté des Sciences de Bizerte, Université de Carthage, Zarzouna 7021, Tunisia
2
General Studies Department, College of Electronics & Communications, Technical and Vocational Training Corporation, TV Street, P.O. Box 2816, Jeddah 21461, Saudi Arabia
3
Department of Mathematics, College of Science, King Saud University, P.O. Box 2455, Riyadh 11451, Saudi Arabia
*
Author to whom correspondence should be addressed.
These authors contributed equally to this work.
Minerals 2015, 5(3), 507-526; https://doi.org/10.3390/min5030507
Submission received: 21 April 2015 / Revised: 4 August 2015 / Accepted: 4 August 2015 / Published: 14 August 2015

Abstract

:
The structural changes along the c axis, of the Ba-exchanged montmorillonite (Swy-2-Ba), under variable relative humidity (% RH), is investigated. In this regard, the arrangement, amount and position of both exchangeable cation and the water molecules in the interlamellar space (IS), are evaluated. This aim is achieved using the X-ray diffraction (XRD) profile modeling approach that consists of comparing experimental and theoretical patterns calculated from structural models. The contributions of the hydration states and the interlayer water amounts, as a function of the % RH, are registered by quantitative XRD investigation. The validated structural models are heterogeneous, suggesting various proportions of layer types at different RH ranges, which means the coexistence of different mixed layer structure MLS packages, exhibiting different proportions of layers with contrasting hydration states. This result is attributed to the orientation of the applied hydration sequence. Indeed, the interlayer water molecule amounts, which led to the appearance of a logic hydration hysteresis, are strongly affected by hydrous perturbation.

Graphical Abstract

1. Introduction

The mineral montmorillonite belongs to the smectite mineral group, in which all members have an articulated layer structure and swelling properties. The main structure is composed of two tetrahedral sheets, sandwiching an octahedral one, often occupied by a trivalent cation. Common for the smectite group is that the thickness of an individual mineral layer is around 10 Å and kept uniform in lateral extent of the other two directions (up to several hundred nanometers). Each layer is composed of a central sheet of octahedrally coordinated cations, linked on both sides through shared oxygens to sheets of tetrahedrally coordinated cations. This type of mineral is often referred to as 2:1 layer structure [1,2,3,4]. The cationic substitutions in either the tetrahedral and/or octahedral sheet induce a charge deficit, which is compensated by the presence of cations in the interlayer spaces. Polar solvents, especially water, interact strongly with the charged layer surfaces and penetrate the interlamellar spaces (IS) to surround the compensator cations, which incite the swelling of the smectite structure. In relation with their high cation exchange capacity (CEC) and specific surface areas (SS), montmorillonite is considered a promising buffer material used as a geological barrier for industrial wastewater treatment. Several studies [5,6,7] are devoted to the use of natural clays as adsorbents for toxic elements, including organic substances, heavy metals and radioactive elements that may pollute soils, surface waters and cause serious environmental and health concerns.
The adsorption and/or ion exchange of heavy metals M2+ on clay minerals has been described by empirical and mechanistic models.
Some studies are undertaken on removal of heavy toxic metals from wastewaters [8,9,10,11] and restriction of their accumulation in the biosphere [12,13,14]. Barium is among the heavy metals widely present in many industrial effluents, and also has many radioactive isotopes, 133Ba being the most important one [15]. A number of authors [16,17,18] studied the adsorption and immobilization of Ba2+ cations by smectites (mainly by montmorillonite).
The pioneering studies [19,20,21,22,23,24,25] of the smectite hydration properties as a function of the relative humidity, based on X-ray diffraction (XRD) patterns, focused essentially on the fluctuations of a 00l basal reflections position. Several layer hydration types, related to relative humidity, are defined. The dehydrated state (0W) is characterized by d001 between 9.7–10.2 Å, monohydrated state (1W) with d001 varying from 11.6 to 12.9 Å, the bi-hydrated layer type (2W) with d001 between 14.9–15.7 Å, and the tri-hydrated ones (3W) with a d001 extending between 18–19 Å [26,27].
The coexistence of different layer types over an extended relative humidity (RH) range has not allowed the experimental identification of the interlayer structure. The structure of the IS can be reproduced theoretically using a combination of four H2O plans. Furthermore, in most studies of the smectite hydration heterogeneity, the structure of the interlayer H2O has not been refined because the XRD profile fitting was usually performed over a limited angular range.
This work is focused on the effect of continuous variation of relative humidity, along a hydration−dehydration cycle, of Ba-exchanged montmorillonite. This aim is achieved using the XRD profiles modeling approach.

2. Experimental Section

2.1. Sample

The dioctahedral smectite used in this work is a reference montmorillonite sample (Swy-2) from the Source Clay Repository of The Clay Minerals Society [27]. The host material originates from Wyoming mineral deposit (USA) characterized by a half-cell structural formula as follows [28]:
( S i 3 , 923 A l 0 , 077 ) ( A l 1 , 459 T i 0 , 018 4 + F e 0 , 039 3 + F e 0 , 045 2 + M g 0 , 382 2 + ) O 10 ( O H ) 2 ( C a 0 , 177 2 + N a 0 , 027 + )
This clay mineral represents a major octahedral charge and exhibits an extremely limited substitution in the tetrahedral sheets, where the cation exchange capacity (CEC) is 101 meq/100 g [29].

2.2. Sample Preparation

The Na-rich montmorillonite suspension is prepared according to a classical protocol [30]. This preliminary treatment is performed in order to guarantee, respectively, a maximum dispersion and a saturation of exchangeable sites with homo-ionic cations. The obtained sample is referred to as Swy-2-Na. Following the same ionic exchange process, the obtained Swy-Na fraction is dispersed in 100 mL of 1M barium chloride (BaCl2) solution, in order to saturate all exchangeable sites with the bivalent cations Ba2+. Therefore, the obtained sample is referred as Swy-2-Ba. Two oriented slides were prepared for the Swy-2-Ba complex, by depositing sample suspension on a glass slide and then drying it at room temperature for few hours, in order to obtain an air-dried preparation [30].

2.3. X-ray Diffraction (XRD) Investigation

2.3.1. XRD Measurements

All experimental XRD patterns were recorded from the oriented preparations of the air-dried homo-ionic sample (Swy-2-Ba), using a Brucker D8 Advance X-ray diffractometer (Bruker AXS GmbH, Karlsruhe, Germany) at 40 kV and 20 mA (CuKα monochromatic radiation, λCuKα = 1.5406 Å), step size of 0.04° 2θ and counting time of 6 s per step, over the angular range 2–40° 2θ.

2.3.2. Relative Humidity Sequences

The experimental XRD patterns were registered at fixed RH values, over a 10% RH scale. The diffractometer installation was equipped with an Ansyco rh-plus 2250 humidity control device coupled to an Anton Paar TTK450 chamber (Anton Paar GmbH, Graz, Austria). Before the study under controlled atmosphere took place, all samples were initially recorded under room (air dry) conditions. Samples were kept at 23 °C in the CHC+ chamber (Anton Paar GmbH) during the whole data collection. Samples were kept also under a constant flow of mixed dry/saturated air to maintain the desired relative humidity (RH) after an initial equilibration. To carry out the first (hydration) cycle, the RH value was increased from room conditions (297 K and ~40% RH), to almost saturated condition (80% RH). In the second (dehydration) cycle, the procedure was realized by decreasing RH to an extremely dry state (10% RH), and finally a second return to room conditions (40% RH) was allowed. These cycles will be referred to as, respectively, hydration/dehydration and dehydration/hydration.

2.3.3. Semi-Quantitative XRD Investigation

The diffractometer installation was monitored by the EVA DIFFRAC Plus software (Bruker AXS GmbH, Karlsruhe, Germany) which allowed the calculation of qualitative parameters, such as the basal spacing d001 from the first-order (00l) Bragg reflections, its FWHM ( Full Width at Half Maximum) and the rationality (ξ) of the 00l reflection position [31]. The semi-quantitative parameter indications, combined with the description of profile geometry (i.e., symmetric or asymmetric X-ray peaks) provided preliminary information about the hydration evolution of the studied complex (Swy-Ba) all over the explored RH range. In fact, the qualitative aspect of this analytical method could not provide alone the required structural information, such as position and arrangement of Ba2+ cations with H2O molecules in the interlamellar space along the c axis. In addition, the greatest handicap is the missing information on the quantification of different hydration states, coexisting in the same sample structure. For these reasons, a quantitative analysis of XRD was performed.

2.3.4. Quantitative XRD Investigation

The XRD modeling method is widely used to quantify hydration properties of smectite as a function of relative humidity [32,33,34]. This indirect method consists of an adjustment of the experimental patterns by fitting the positions and profile shapes of 00l reflections over the explored angular range. Theoretical XRD patterns are calculated using the algorithms and the Z atomic coordinates of the interlayer space developed by Drits and Tchoubar [35]. The proposed theoretical intensities were calculated according to the matrix formalism detailed by Drits and Tchoubar [35]. The diffracted intensity along the 00l rod of the reciprocal space is given by:
I 00 l ( 2 θ ) = L p S p u r ( R e [ Ф ] [ W ] { [ I ] + 2 n M 1 [ ( M n ) n ] [ Q ] n } )
where Re correspond to the real part of the final matrix; Spur, the sum of the diagonal terms of the real matrix; Lp, the Lorentz-polarization factor; M, the number of layers per stack; n = 1.1 − M − 1; [Ф], the structure factor matrix; [I], the unit matrix; [W], the diagonal matrix of the proportions of the different kinds of layers and; [Q], the matrix representing the interference phenomena between adjacent layers. Abundances of the diverse types of layers (Wi), the mode of stacking of the different kinds of layers and the mean number of layers per Coherent Scattering Domain (CSD) are determined through XRD profile modeling approach. Within a CSD, the stacking of layers is described by a set of junction probabilities (Pij). The relationships between these probabilities and the abundances Wi of the different types of layers are given by Oueslati [36,37]. All XRD profiles are simulated following the fitting strategy detailed by Oueslati [38,39,40].

3. Results and Discussion

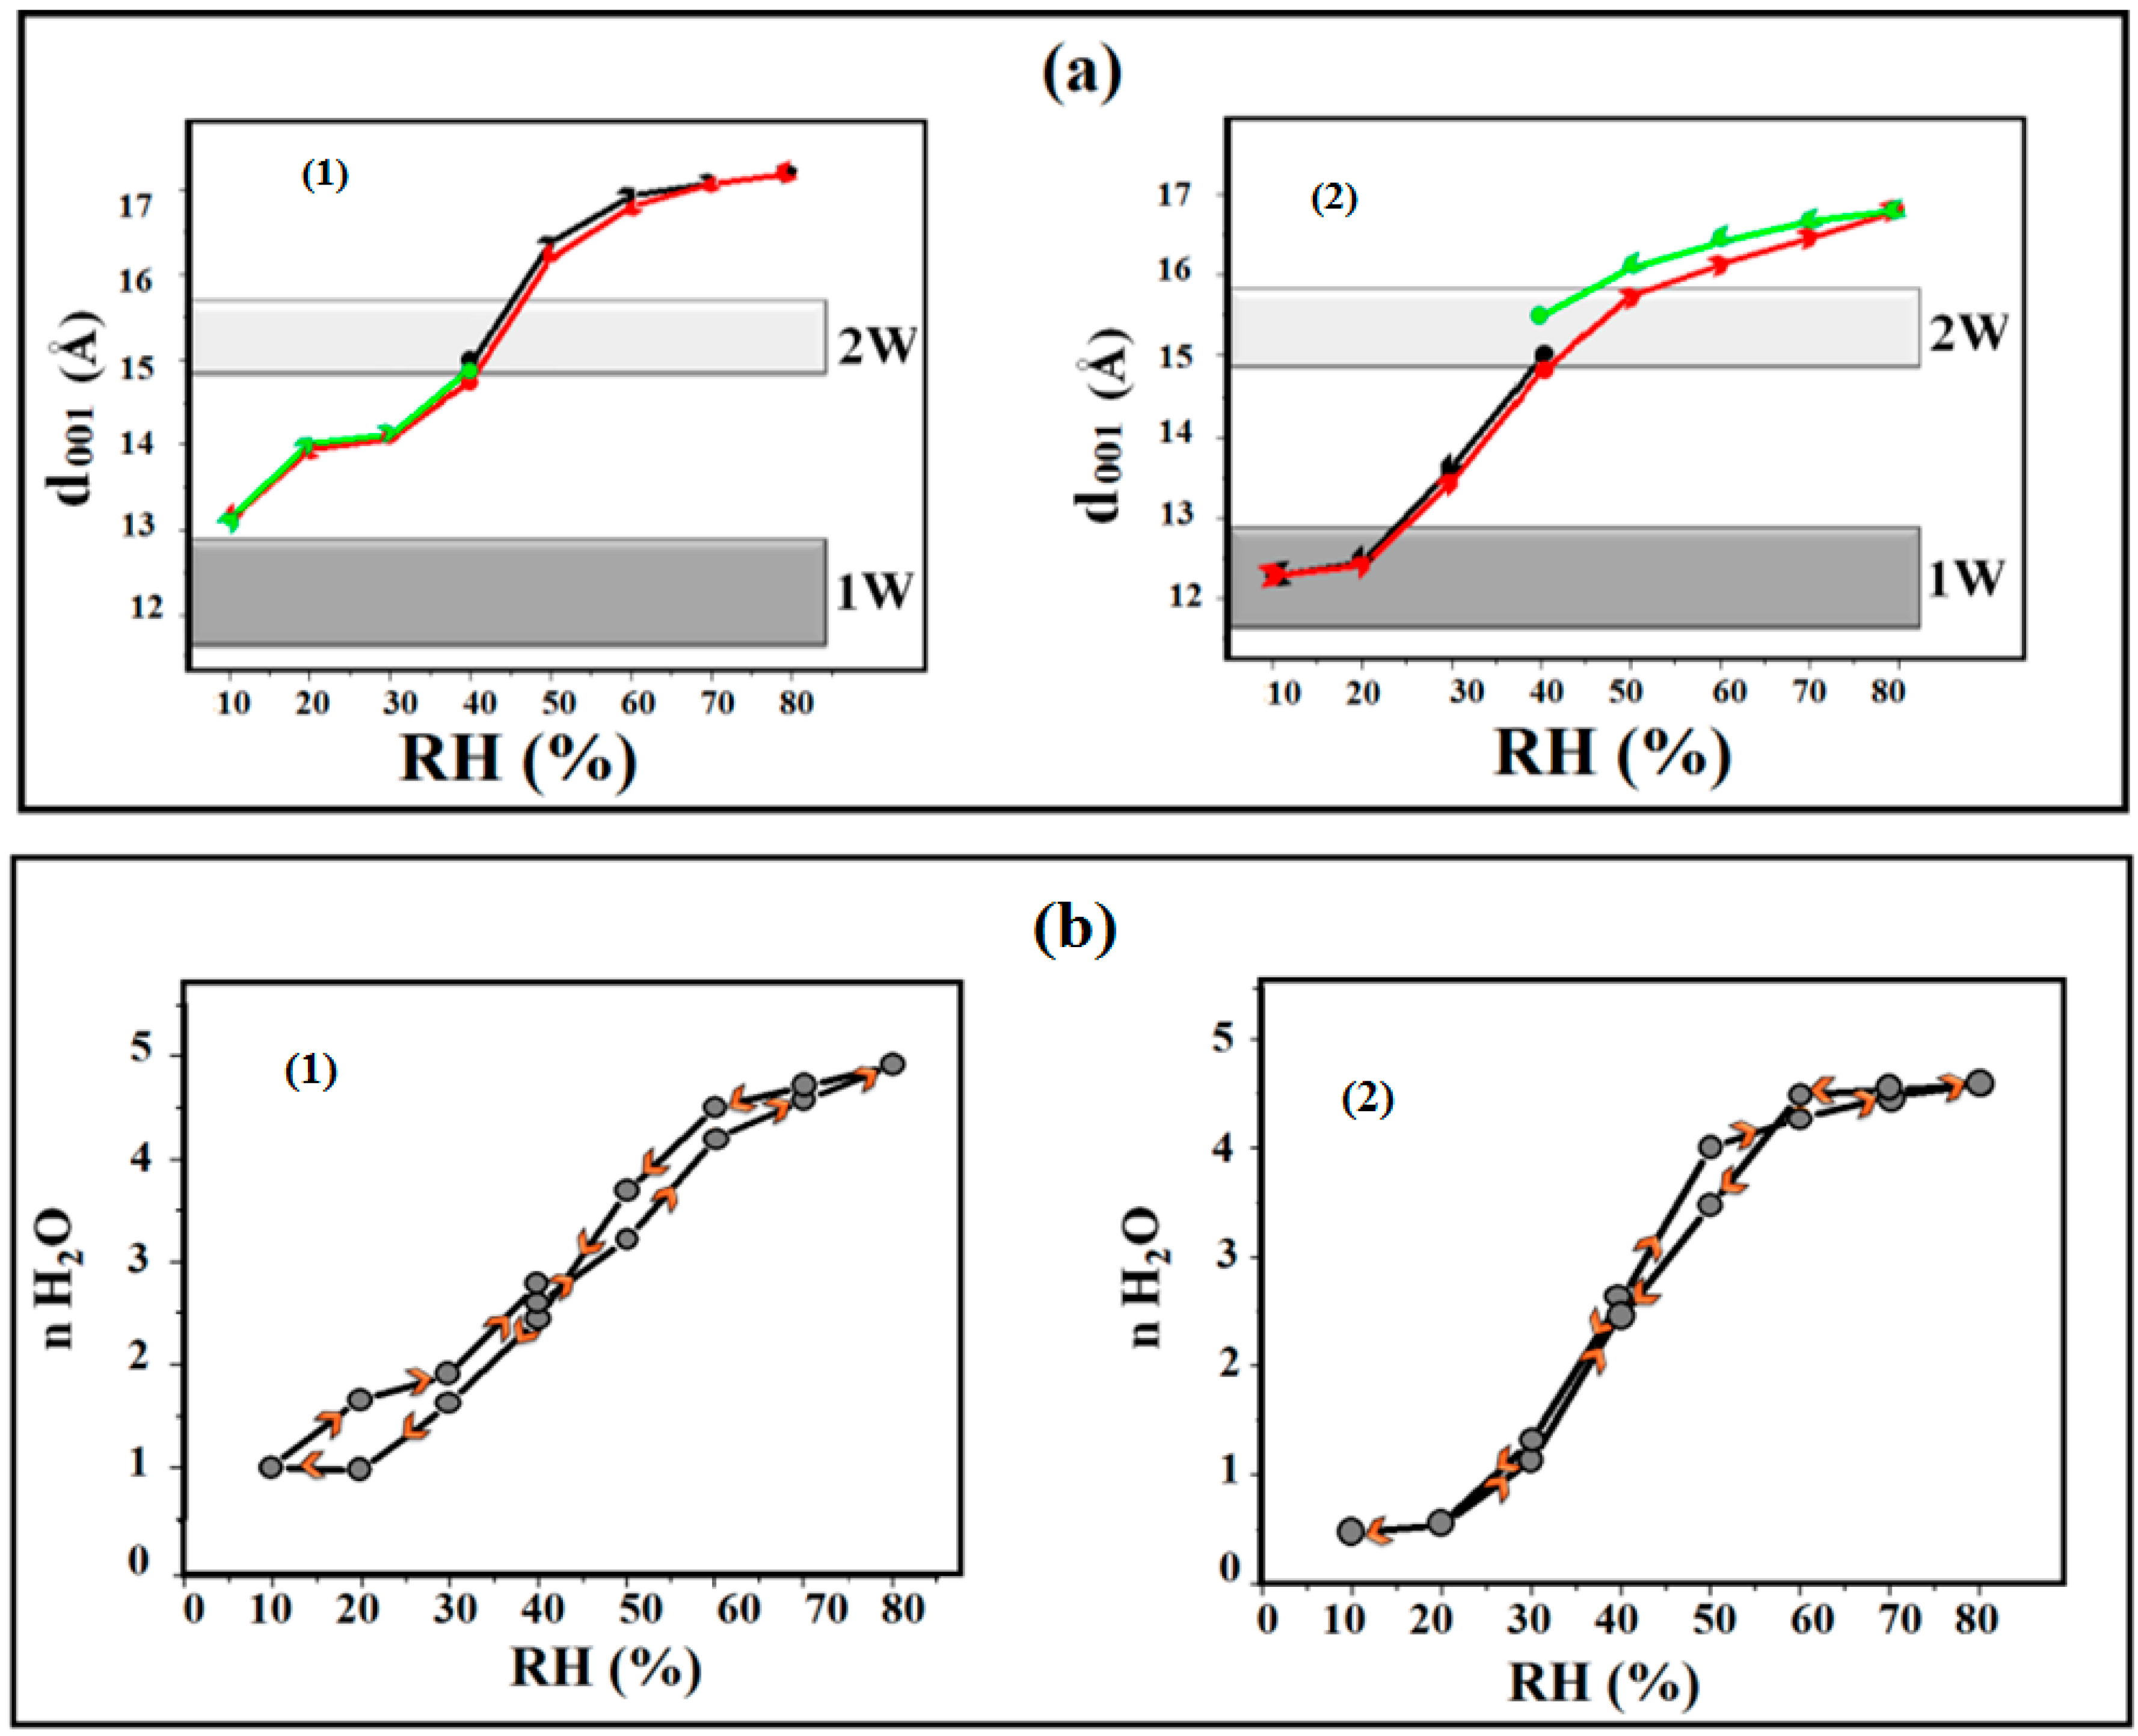
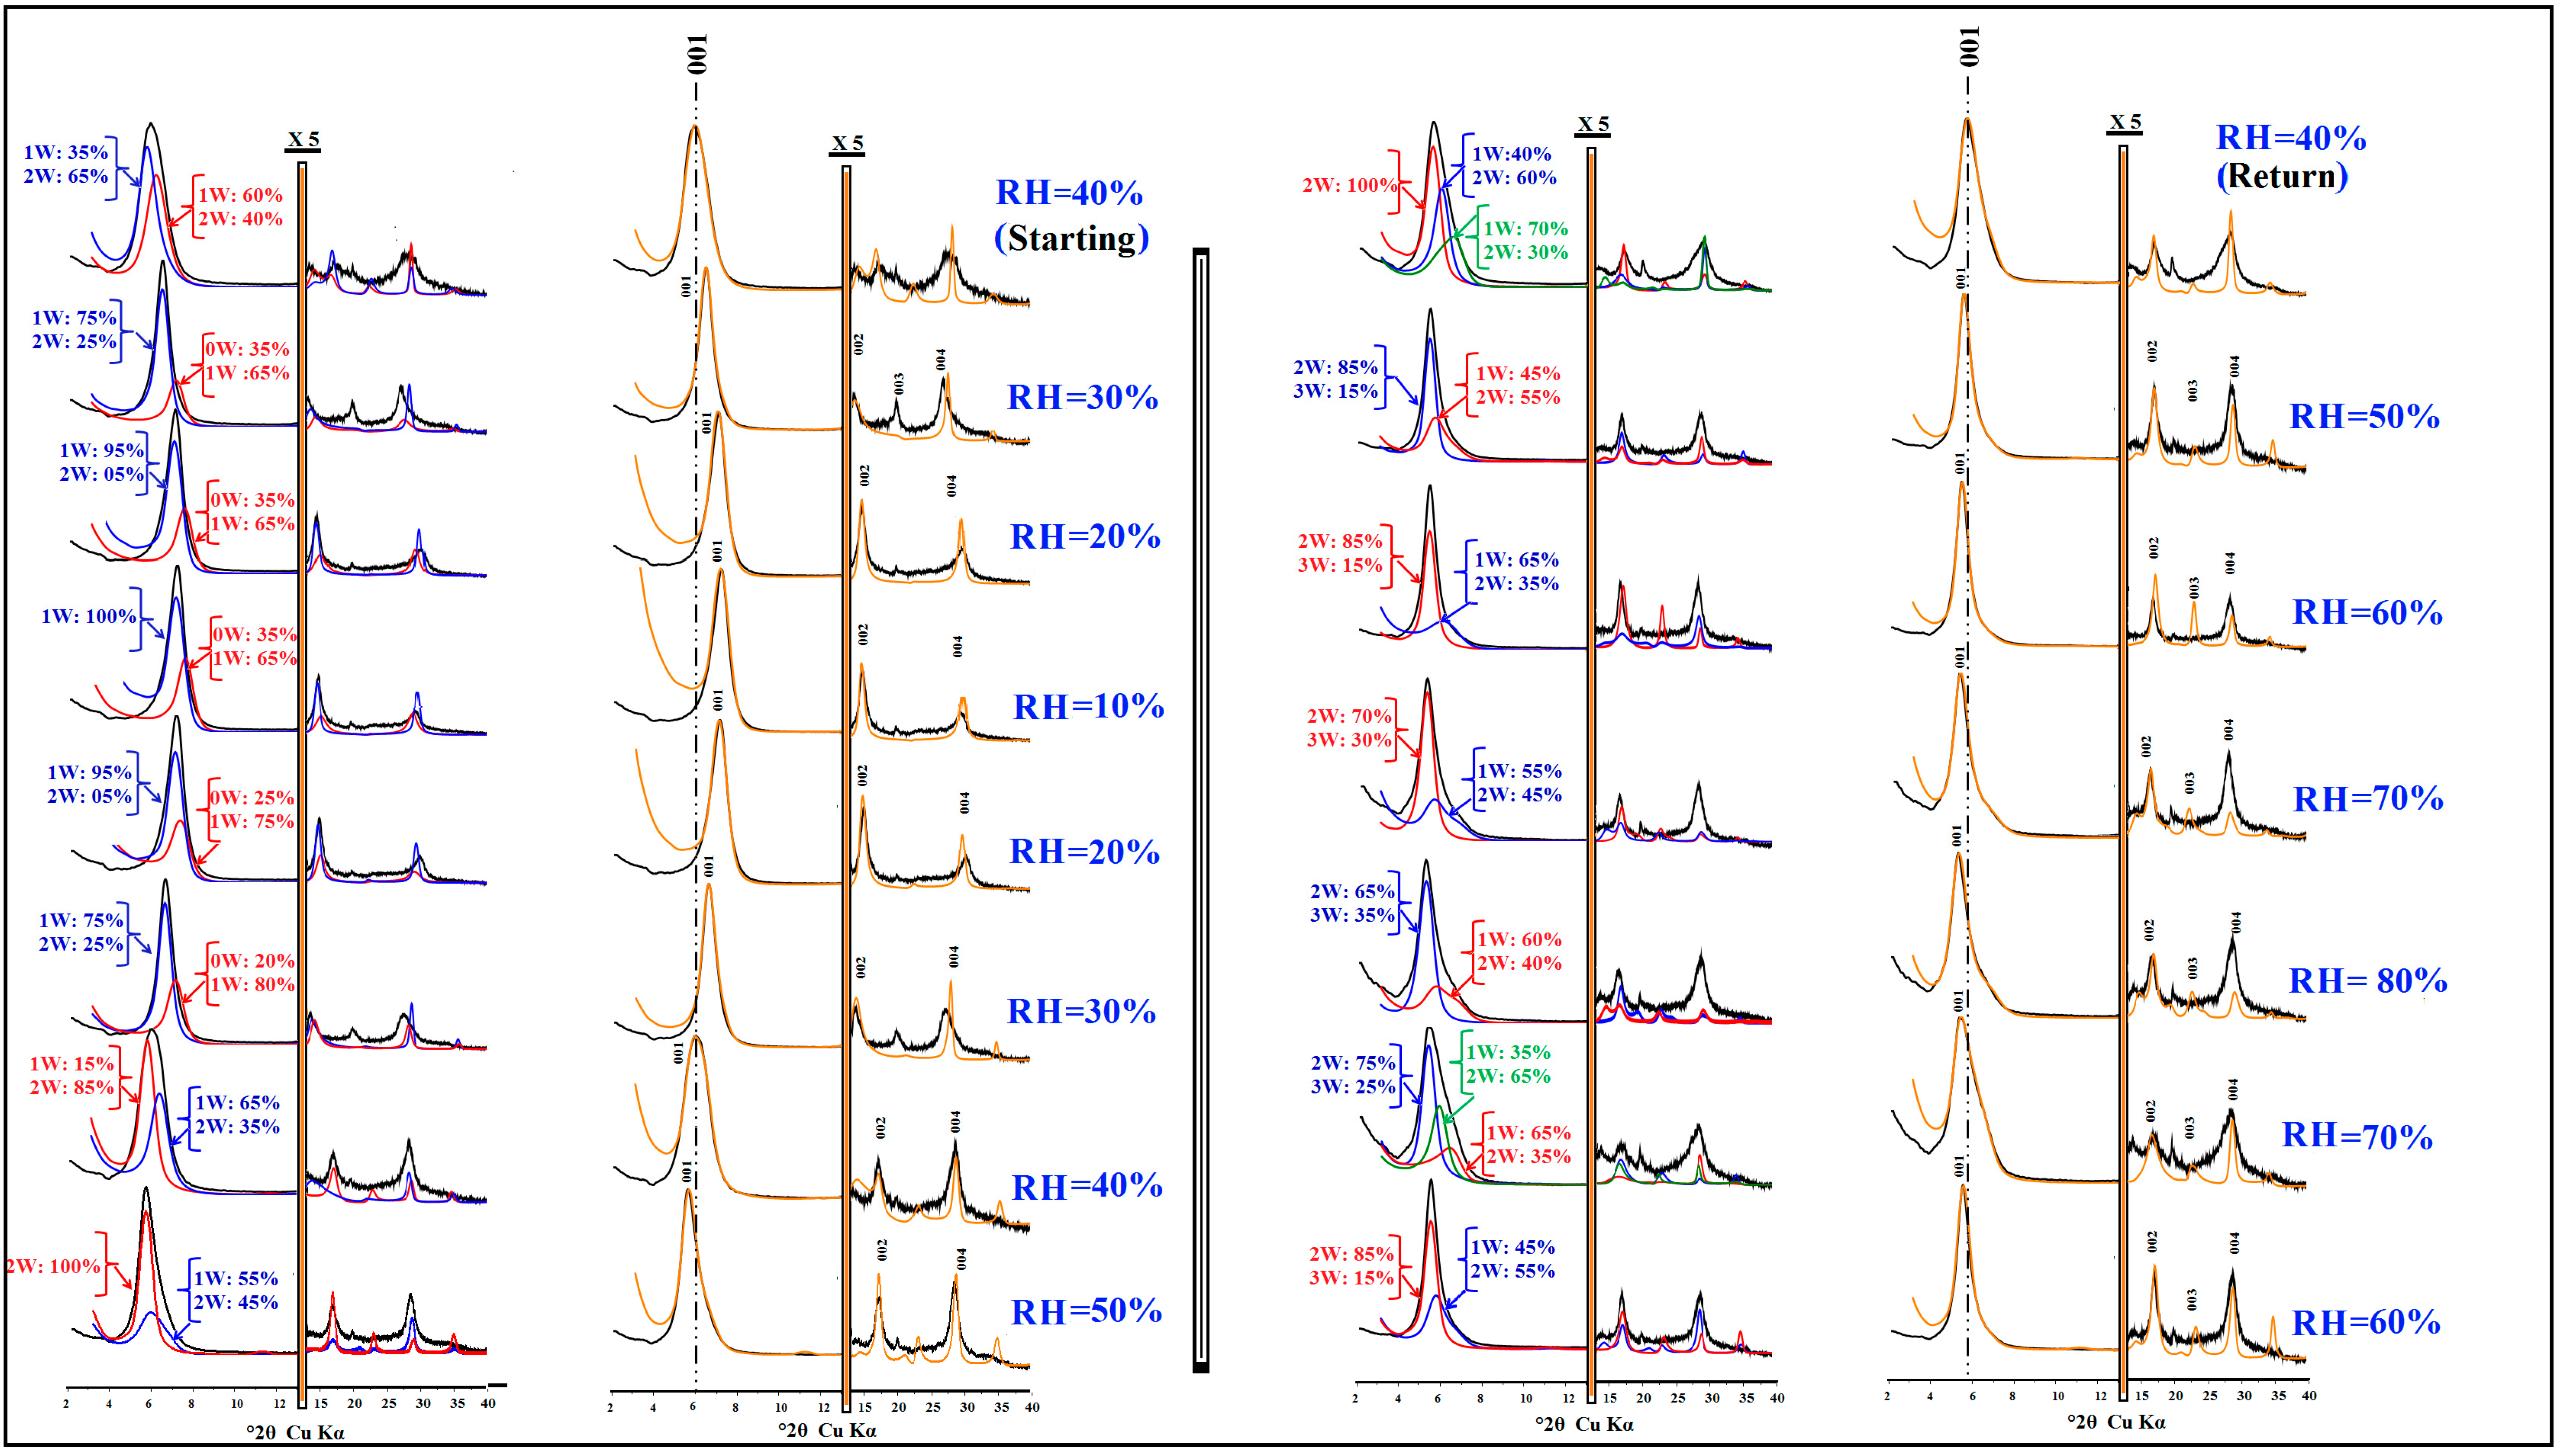
3.1. First Hydration/Dehydration Cycle

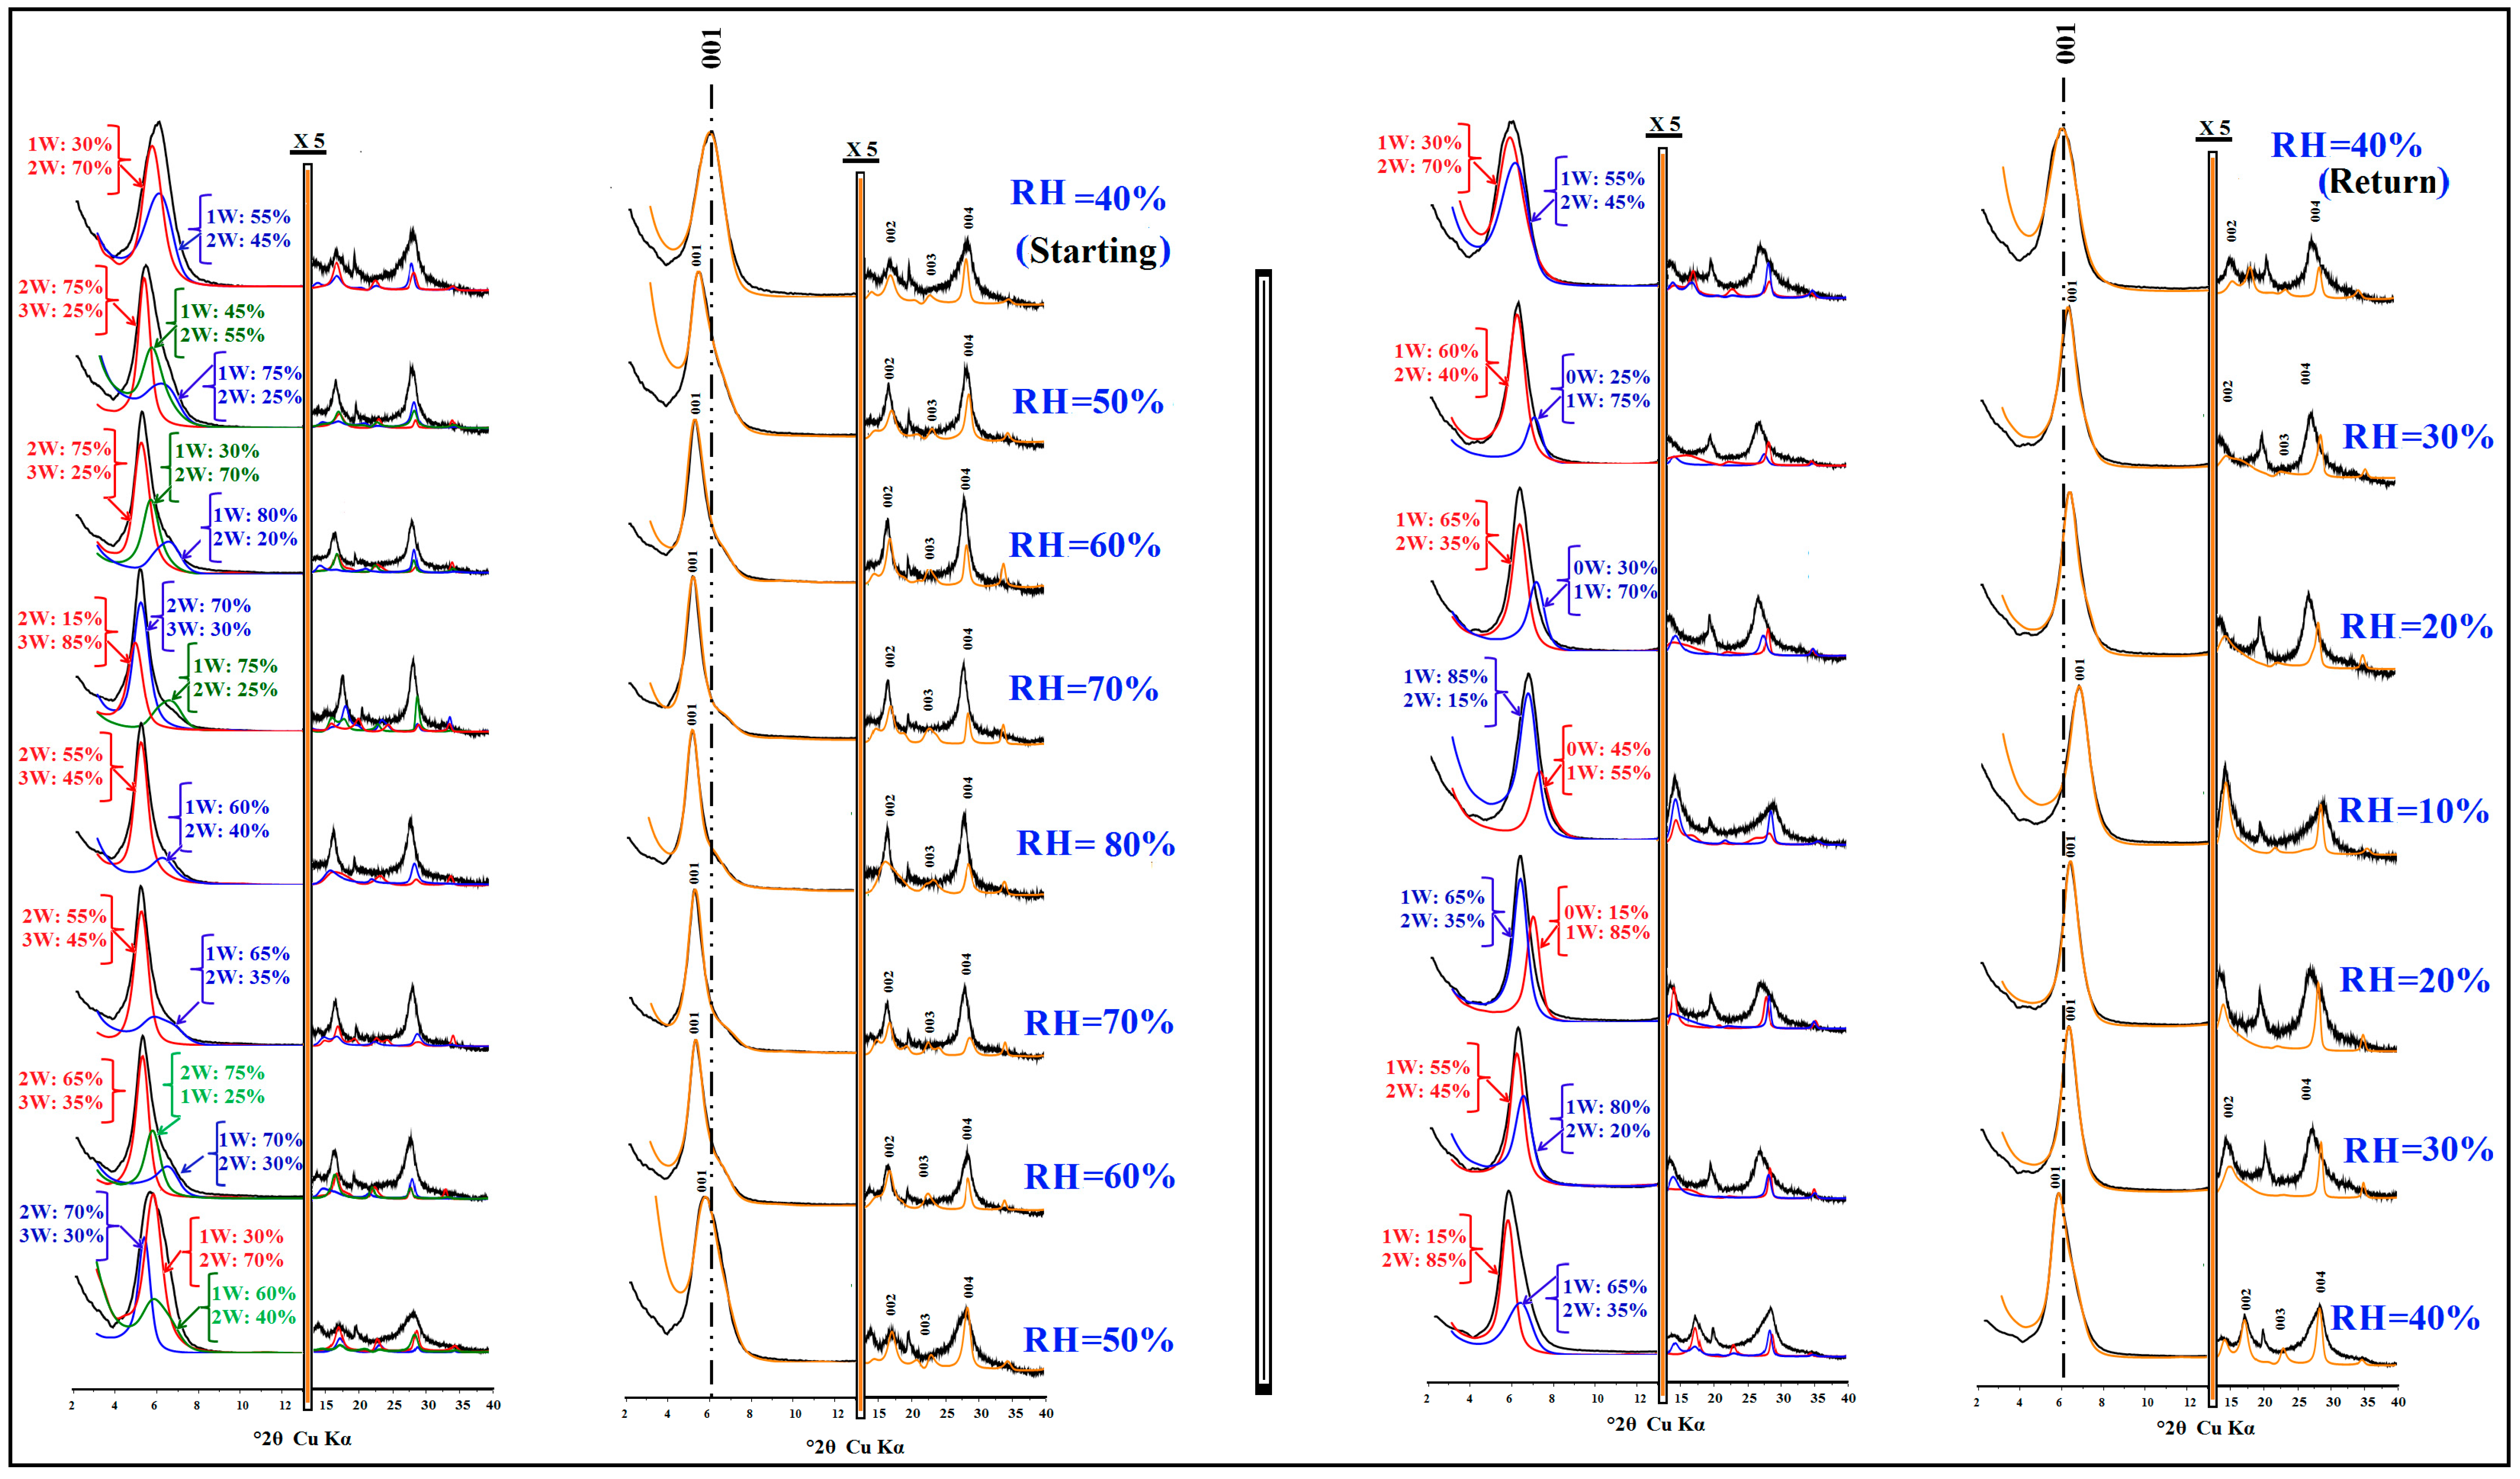
3.1.1. Qualitative XRD Analysis

Experimental XRD patterns obtained under controlled atmosphere during the first cycle are presented in Figure 1 with the theoretical profiles calculated, using the corresponding contributions of the various mixed-layer structures.
For the RH range extending between 50% (hydration process) ≤ RH ≤ 40% (dehydration process) all recorded profiles are characterized by an asymmetric 001 reflection, revealing the appearance and/or disappearance of a new hydration phase during the hydration transition. This observation is interpreted as a heterogeneous hydration, confirmed by the calculated FWHM and the ξ parameter values, showing irrational 00l reflection position (Table 1). For the rest of the studied cycle, the majority of 001 reflections are more symmetric, which is in conflict with the calculated high FWHM and ξ values, probably indicating the presence of hydration heterogeneities (Table 1). The evolution of d001 basal spacing values as a function of the relative humidity (Figure 2) shows a fast progress versus RH values during the hydration process. The d001 ranges from 14.94 Å at the beginning of the cycle (40%, corresponding to a homogeneous 2W state), to 17.19 Å at the highest RH condition (80%). This statement is gathered by a fast intercalation of water molecules in the IS, which accelerate the 2W → 3W transition. Along the dehydration process, the variation of the d001 spacing from 80% to 40% RH tails the same route shown during the hydration procedure. Approaching the lowest RH field, a slow decrease of d001 spacing, reaching d001 = 13.11 Å at 10% RH, is noted.
This phase, probably attributed to an interstratified 2W/1W hydration state, mainly dominated by the monohydrate layer types (1W), extends over the lower RH range.
The hydration process, respecting the same dehydration path reached at 40% RH, is characterized by a slow 1W → 2W transition compared to the first cycle.

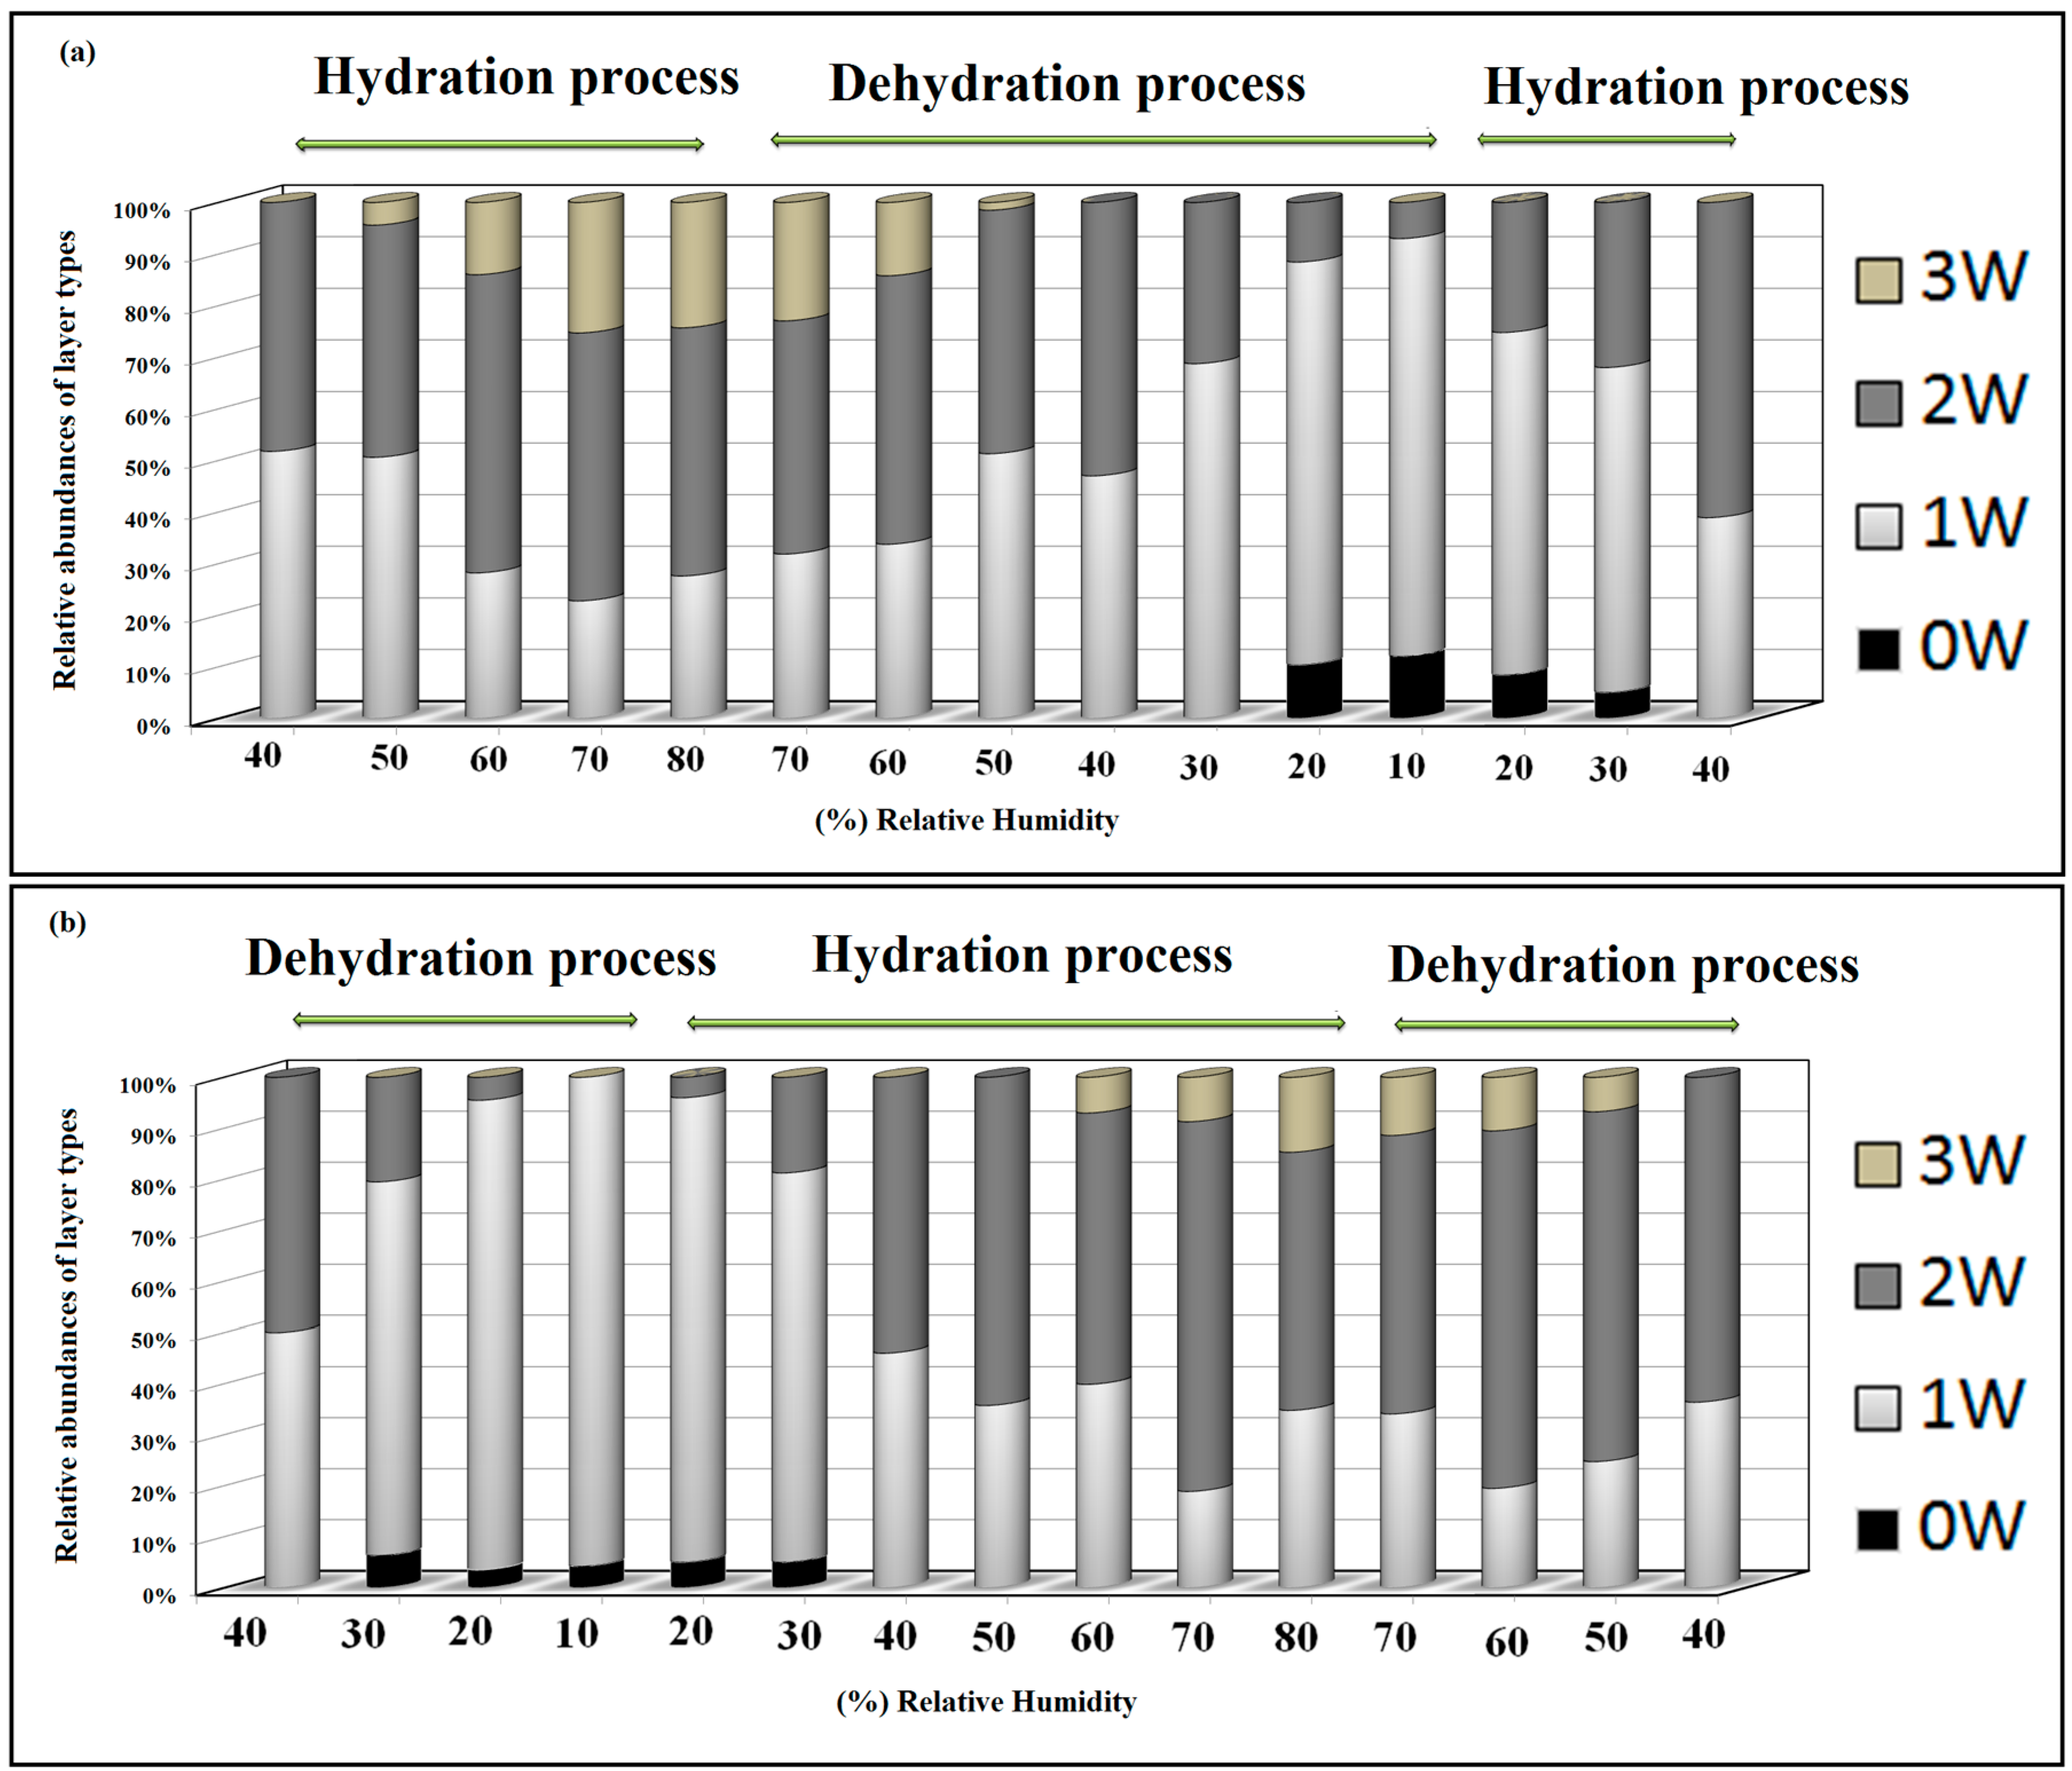
3.1.2. Quantitative XRD Investigation

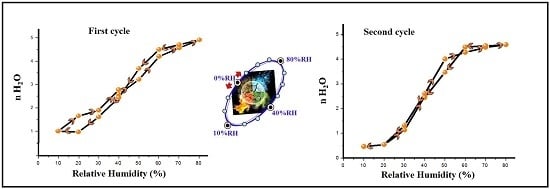
Evolution of the Hydration Performance

Results derived from the quantitative XRD analysis are explained by sequential transitions between hydration states along continuous RH range. An important heterogeneous hydration state is detected from 50% to 70% RH.
During the dehydration process 60% RH → 50% RH, the contribution of three different MLSes is imposed in order to achieve the best fit. For the rest of the RH states, just two MLS types allow reproducing the experimental XRD profiles. The relative proportions of the MLSes and their detailed compositions used to adjust theoretical and experimental patterns are reported in Table 2.
Figure 1. Best agreement obtained between experimental (black) and theoretical (yellow) XRD patterns, calculated using the respective contributions (red, green, blue) of the various mixed-layer structures in the case of the first cycle.
Minerals 05 00507 g001
Table 1. Qualitative XRD analysis versus relative humidity (RH) conditions.
Process% RHd001 (Å)FWHM (° 2θ)ξ, XiCharacter
Case of the First Cycle
Hydration40 (Starting)14.941.550.97, 3I
5016.381.210.55, 3I
6016.920.880.52, 3I
7017.070.800.69, 3I
8017.190.780.67, 3I
Dehydration7017.060.800.55, 3I
6016.80.900.50, 3I
5016.161.550.32, 3I
4014.741.460.68, 3I
3014.060.890.37, 3H
2013.940.900.39, 3H
1013.111.120.52, 3I
Hydration2014.010.960.51, 3I
3014.110.990.52, 3I
40 (Return)14.890.630.37, 3H
Case of the Second Cycle
Dehydration40 (Starting)14.961.320.52, 3I
3013.610.770.25, 3H
2012.450.870.23, 3H
1012.270.890.20, 3H
Hydration2012.400.900.20, 3H
3013.430.780.24, 3H
4014.791.340.66, 3I
5015.740.940.35, 3H
6016.130.710.22, 3H
7016.451.300.70, 3I
Dehydration8016.800.900.55, 3I
7016.660.820.70, 3I
6016.400.680.20, 3H
5016.090.730.19, 3H
40 (Return)15.501.550.59, 3I
Note: FWHM (° 2θ) calculated for (001) reflection, ξ (Å): calculated as the standard deviation of the ℓ*d (00l) values for Xi measurable reflections over the angular range, Character: H (homogeneous), I (interstratified).

Evolution of the Layers Types in Structure

The relative proportions of various layer types (summing up all MLSes) as a function of RH are represented in Figure 4. At the beginning of the cycle (40% RH starting), the Swy-2-Ba structure is reproduced by a segregated 1W/2W hydration model. By increasing RH values, a fast transition from 1W to 2W hydration state, accompanied by a modest appearance of the tri-hydrated layer type (3W) is noted at 50% RH for the first time. The amount of 3W hydration state rises to reach a high contribution (24.30%) at the almost saturated state, where bi-hydrated layer type dominates the structure. On the other hand, along the dehydration process, where % RH extends between 80% RH and 50% RH, the structure is characterized by an interstratified phase, including the three-layer type (1W, 2Wand 3W) with a dominance of a bi-hydrated one. When RH extends from 40% to 30%, a disappearance of the 3W hydration state is renowned and theoretical models include heterogeneous structures, containing variable proportions of 2W and 1W layer types (Table 2). By approaching the lower RH range, a notable acceleration of the 2W → 1W transition is observed. At 20% RH (dehydration process) and during the first appearance of dehydrated layer type (0W), the structure is dominated by monohydrated layers (78.10%). All over the RH range, spreading between 20% (dehydration process) ≤ RH ≤ 30% (rehydration process), the structure is characterized by the coexistence of three hydration states with different contributions involving 0W, 1W and 2W (Table 2). At the end of the cycle (40% RH), a process of complete vanishing of dehydrated layers (0W) and fast 1W → 2W transition, leaves a structure, dominated by the bi-hydrated phase.
Figure 2. (a) Evolution of the given d001 spacing values according to % RH along the first cycle, based on the following: hydration (black color); dehydration (red line); hydration (green line) sequence (1) and the second ones, based on the following: dehydration (black color); hydration (red line); dehydration (green line) sequence (2) cycle. (b) Comparison of the interlayer water contents as a function of the relative humidity rates (RH %) between the first (1) and the second cycle (2).
Minerals 05 00507 g002
Table 2. Optimum structural parameters used to reproduce experimental patterns of Swy-Ba as a function of RH along the first cycle.
Process% RH% of MLS0W/1W/2W/3W-R0//R1N H2OZ H2On BaZ BaM
0W0W0W0W
1W1W1W1W
2W2W2W2W
3W3W3W3W
Hydration40640/15/85/0–R0----8
Start360/65/35/0–R1110.300.1510.30
411.40/14.600.1512.20
----
50 ----
450/75/25/0–R12.510.000.1510.00
37.400/45/55/0–R0411.20/14.700.1512.008
17.600/0/75/25–R03.611.50/14.30/16.200.1514.30
60 ----
560/0/75/25–R12.510.200.1510.20
300/80/20/0–R1511.00/14.400.1512.009
140/30/70/0–R15.411.50/14.70/16.200.1514.70
70 ----
61.640/0/70/30–R1210.200.1510.20
30.360/75/25/0–R1511.20/14.600.1512.008
80/0/15/85–R1611.50/14.90/16.700.1514.90
80540/0/55/45–R0----
460/60/40/0–R02.510.000.1510.007
5.211.30/14.700.1512.20
7.511.30/14.80/16.600.1514.80
Dehydration70510/0/55/45–R1----
490/65/35/0–R1210.200.1510.208
5.211.30/14.700.1512.20
7.511.30/14.80/16.600.1514.80
60420/70/30/0–R1----
40.600/0/65/35–R11.510.500.1510.508
17.400/25/75/0–R0510.80/14.800.1512.10
5.411.50/14.60/16.400.1514.60
50760/60/40/0–R1----
190/30/70/0–R12.509.800.1509.807
50/0/70/30–R1510.80/14.800.1512.20
3.610.20/14.50/16.400.1514.50
40870/55/45/0–R1----
130/30/70/0–R1110.000.1510.008
411.20/14.700.1512.20
----
30550/80/20/0–R0----
450/55/45/0–R0110.700.1510.7010
311.00/13.800.1512.00
----
20770/85/15/0–R0--0.158.90
2345/55/0/0–R1110.700.1510.70
211.50/14.200.1512.0011
----
108015/85/0/0–R1--0.159.00
200/65/35/0–R0110.700.1510.7011
2.411.00/14.500.1512.00
----
Hydration20720/65/35/0–R0--0.158.90
2830/70/0/0–R0110.700.1510.7010
411.20/14.800.1512.00
----
30800/60/40/0–R0--0.159.00
2025/75/0/0–R0110.300.1510.3010
411.20/14.800.1512.00
----
40580/30/70/0–R1----7
420/55/45/0–R1110.500.1510.50
411.00–14.600.1512.20
- --

3.2. The Second Hydration/Dehydration Cycle

3.2.1. Qualitative XRD Investigation

The best agreement between the experimental XRD patterns, recorded in situ along the reverse cycle, and the calculated theoretical profiles, is presented in Figure 3, together with the composition and proportions of MLSes used for modeling. The global observation of the experimental XRD patterns show that 00l reflections are characterized by symmetric profiles, except for the RH range extending between 70% and 60% RH. Throughout this humidity range, the appearance of peak-shoulders indicates a coexistence of various crystallite hydration phases. An examination of the FWHM and the irrationality parameter values (Table 1), suggesting an interstratified hydration character all over the investigated %RH range, confirms this hypothesis.
The d001 evolution versus % RH (Figure 3) allows an estimation of the hydration progress law along the second cycle. At 40% RH, the d001 value (14.96 Å) is attributed to a homogeneous 2W hydration state. By progressively decreasing % RH towards extremely dry conditions (10% RH), a fast lessening of spacing values down to 12.27 Å credited to a homogeneous 1W hydrated state, is observed. Along the hydration process, the d001 upsurge follows virtually the same rule, detected along the dehydration procedure (between 20% ≤ RH ≤ 40%).
Figure 3. Best agreement obtained between experimental (black) and theoretical (yellow) XRD patterns calculated using various mixed-layer structures’ contribution (red, green, blue) in the case of the second cycle.
Minerals 05 00507 g003
From 50% RH to 80% RH, a slow growth of the basal spacing values reflects the hard 2W → 3W transition. During the dehydration procedure, which starts from the almost saturated conditions to 40% RH (the end of the cycle), d001 slowly decreases from 16.80 to 15.50 Å, where the studied sample is characterized by an interstratified structure, ascribed probably to an intermediate 2W and 3W hydrated state. Moreover, at higher RH values, an appearance of a loop, enlightened by important structural fluctuations, created by distinct hydration transitions in the interlamellar space (IS), is noted (Figure 3).

3.2.2. Quantitative XRD Analysis

Progress of the Heterogeneous Hydration in the Structure

The quantitative investigation shows that all proposed models are characterized by the coexistence of various MLSes with different relative contributions of layer types (Figure 3) which proves the heterogeneous hydration character over the RH range. The structure heterogeneity degree is determined respectively at 70% RH (hydration procedure) and at the end of the cycle (40% RH). In fact, the obtained results prove that the best agreement between calculated and experimental patterns are achieved assuming three different particle populations (Figure 3). Structural parameters and compositions of the MLSes, used to achieve the fitting throughout the second cycle are summarized in Table 3.
Table 3. The optimum structural parameters used to reproduce experimental patterns of Swy-Ba as a function of RH, along the second cycle.
Procedure% RH% of MLS0W/1W/2W/3W-R0//R1n H2OZ H2On BaZ BaM
0W0W0W0W
1W1W1W1W
2W2W2W2W
3W3W3W3W
Dehydration40600/60/40/0–R1----
Start400/35/65/0–R1110.700.1510.709
411.20/14.700.1512.20
----
30820/75/25/0–R0--0.159.00
1235/65/0/0–R0110.300.1510.3011
211.20/14.000.1512.20
----
20900/95/05/0–R0--0.159.00
1035/65/0/0–R00.509.800.159.8011
211.20/14.800.1512.20
----
10880/100/0/0--0.158.90
1235/65/0/0–R00.59.500.159.508
----
----
Hydration20800/95/05/0–R0--0.158.90
2025/75/0/0–R00.510.200.1510.208
210.80/14.000.1512.20
----
30750/75/25/0–R0--0.159.00
2520/80/0/0–R0110.700.1510.709
311.00/13.800.1512.20
----
40620/65/35/0–R0----
380/15/85/0–R0110.700.1510.708
411.00/13.800.1512.20
----
50650/55/45/0–R1----
350/0/100/02.509.800.159.808
511.30/14.000.1512.20
----
60 ----8
490/65/35/0–R12.509.800.159.80
28.050/0/75/25–R05.211.30/14.700.1512.20
22.950/35/65/0–R07.510.30/14.80/16.600.1514.80
70 ----8
580/0/85/15–R02.510.200.1510.20
420/45/55/0–R1511.00/13.800.1512.20
4.510.90/14.50/16.700.1514.50
80580/60/40/0–R1----8
420/0/65/35–R12.510.500.1510.50
5.211.00/14.900.1512.20
7.510.90/14.90/16.200.1514.90
Dehydration70620/55/45/0–R1----
380/0/70/30–R12.510.500.1510.50
5.211.00/14.900.1512.208
7.510.30/14.90/16.400.1514.90
60700/0/85/15–R0----
300/65/35/0–R12.29.800.159.80
511.20/14.800.1512.108
5.411.00/14.70/16.400.1514.70
50550/0/85/15–R0----
450/45/55/0–R11.59.900.159.90
411.20/14.000.1512.108
5.411.00/14.70/16.400.1514.70
40400/70/30/0–R1----9
390/0/100/01.510.000.1510.00
210/40/60/0–R0311.00–13.800.1512.00
----

Evolution of Hydration State’s Contributions

At the beginning of the cycle, the structural model of the studied sample is obtained by mixing 50% of 1W hydration state and 50% of the bi-hydrated ones (2W). With decreasing RH values along the dehydration process, a fast 2W–1W transitions is observed (Figure 2), accompanied by the appearance of dehydrated layers at 30% RH, which persist in the structure both along the dehydration and hydration process (Figure 4). Over this range, the structure is dominated by mono-hydrated layers, which preserve the highest proportions, compared to 0W and 2W. A transformation is observed at 40% RH, along the hydration procedure, where a fast increase of 2W at the expense of 1W hydration state is noted. In fact, the studied complex structure is described using 46% and 54% of 1W and 2W layer types, respectively. Reaching 60% RH, the intercalation of water planes in interlayer spaces becomes easier, which is confirmed by the appearance of 3W layers over an RH spreading between 60% (during the hydration process) ≤ RH ≤ 50% RH (during the dehydration process). At this stage, the structure keeps a major contribution of 2W phases with minor contributions of 1W and 3W layers types. Arriving at the end of the cycle, the structure model is characterized by 36.40% and 63.60% for 1W and 2W hydration states respectively.
Figure 4. Evolution of the relative contribution of different layer types (summing up all mixed-layer structures) as a function of the relative humidity (%RH) in the first (a) and second (b) cycles, respectively.
Minerals 05 00507 g004

4. Discussion

Treated wastewaters contain elevated concentrations of suspended and dissolved organic and inorganic matter, insufficiently removed from the effluent. Adsorption on solid substrates, such as clay or activated carbon, is one of the methods used for wastewater treatment.
Montmorillonite clay, available in large quantities, can be used as an adsorbent for the removal of many pollutants present in soil solutions. The evaluation of potential sorbent materials requires an understanding of all physical and chemical phenomena that control the clay/solution interface. This study tries to answer the fundamental question about the effect of atmospheric conditions (specifically relative humidity in this case) on the metal/montmorillonite exchange process, using XRD modeling approach. Removal of barium from aqueous solutions represents one of the topics that many studies are focused on, using different methods [41]. One of those [42] studied the sorption of Ba2+ on montmorillonite, at ionic strengths ranging from 1 × 10⁻³ to 1 × 10⁻¹ M. His L-shape exchange isotherms for Ba2+−Na+ systems are defined by a Langmuir-type equation. The main reported results show that the exchange capacity of Ba2+ ions increase with a decrease of ionic strength. Several former works [18,43] also report similar studies based on XRD investigations. Others [44,45] applied the XRD profile modeling approach in combination with adsorption−desorption isotherm experiments to assess the proportion of different layer types (with 0.3 planes of interlayer H2O molecules), coexisting along the isotherms. However, their calculations were limited to reproduce the position of the 001 reflection, whereas positions and shapes of higher-order 00l reflections were not considered. These limitations did not allow a complete description of the real structure of their samples.
Ferrage et al. [46] demonstrate in the case of high-charge montmorillonite (SAz-1) and low-/high-charge beidellites (SbId-1 and Sb-Ca), studied under controlled atmosphere and saturated by Sr and Ca cations, that structure models are more heterogeneous for beidellite than for montmorillonite. They also show that the increase of the hydration heterogeneity in beidellite originates from the presence of 0W (nonexpendable) and of 1W layers under high RH conditions.
In this study, the proposed theoretical models used to fit a Ba-exchanged montmorillonite specimen, presented a more complex structure of “crystallite”, characterized by numerous contributions of MLSes than those used in earlier studies. The quantitative XRD investigation explored a wide range of 00l reflection (up to 004). The best agreement between experimental and theoretical patterns was achieved, using the proposal of coexistence of different MLS types, exhibiting different proportions of layers with contrasting hydration states.
This result is in accordance with the literature [34,35,36,46,47], especially in terms of structural heterogeneities. Indeed, for the Swy-2-Ba sample, and along the dehydration process, the structure is characterized by multiple MLS contributions, including different relative proportions of layer types (0W, 1W, 2W and 3W). The maximum structural heterogeneity is observed by extending RH to extreme atmospheric conditions 80% RH, where structure presents a random distribution of layer type with appearance of the 3W hydration state. The lowest heterogeneity is observed, near to room conditions, at 50% RH.
Hence, the hydration heterogeneity is the main deduced behavior for all studied specimens. The theoretical structural models, related respectively to the high relative humidity value and after the dehydration sequence, show more complex structure than for the initial structure.
This result is in agreement with the study of Ferrage et al. [32] where authors showed an increase of the hydration heterogeneity degree, characterized by the presence of more than one hydration state into the structures of two mineral specimens (beidellite) with variable charge location.
On the other hand, this work complies with [47,48] where the author modelled the XRD spectra, fitting both positions and profiles of the 00l reflections over a large angular range and showed that randomly interstratified structures, each containing different layer types, coexisted in their montmorillonite samples.

5. Conclusions

The structure response of Ba-exchanged montmorillonite (sample Swy-2-Ba) over both the dehydration and hydration RH paths was studied, using qualitative and quantitative XRD analysis.
The quantitative XRD investigation shows that all proposed models are characterized by the coexistence of various MLSes with different relative contributions of layer types, which demonstrates the heterogeneous hydration character. This result is interpreted as a variation in interlamellar space (IS) configurations, indicating unstable material behavior, inappropriate for further long storage application. All structural fluctuations and hydrous perturbations strongly affect the amount of interlayer water molecules, leading to the appearance of a logical hydration hysteresis. The highest degree of structure heterogeneity was determined at 70% RH (hydration procedure) and at the end of the cycle (40% RH), which means that after any change in atmospheric humidity trend, the homogeneity of the clay/soil solution system is disturbed and the exchange performance of the geological barrier can be affected.

Acknowledgments

The authors would like to extend their sincere appreciation to the Deanship of Scientific Research at King Saud University for funding this Research group No. RG-1435-026.
The content and style of the paper greatly benefited from the comments of two anonymous reviewers. The editorial assistance of Thomas N. Kerestedjian is acknowledged.

Author Contributions

Walid Oueslati had the original idea for the study and, with all co-authors carried out the design. Marwa Ammar and Nejmeddine Chorfi performed the experiments and analyzed the data together with Walid Oueslati.
Walid Oueslati carried out the analyses and drafted the manuscript, which was revised by all authors. All authors read and approved the final manuscript.

Conflicts of Interest

The authors declare no conflict of interest.

References

  1. Volzone, C.; Rinaldi, J.O.; Ortiga, J. Retention of gases by hexadecyltrimethylammonium-montmorillonite clays. J. Environ. Manag. 2006, 79, 247–252. [Google Scholar] [CrossRef] [PubMed]
  2. Oueslati, W.; Meftah, M.; Rhaiem, H.B.; Amara, A.B.H. Cation Exchange Selectivity versus concentration of competing heavy metal cations (Pb2+, Zn2+): Case of Na-montmorillonite. Phys. Procedia 2009, 2, 1059–1063. [Google Scholar] [CrossRef]
  3. Monash, P.; Pugazhenthi, G. Development of Ceramic Supports Derived from Low-Cost Raw Materials for Membrane Applications and its Optimization Based on Sintering Temperature. Int. J. Appl. Ceram. Technol. 2011, 8, 227–238. [Google Scholar] [CrossRef]
  4. Kumar, A.S.K.; Ramachandran, R.; Kalidhasan, S.; Rajesh, V.; Rajesh, N. Potential application of dodecylamine modified sodium montmorillonite as an effective adsorbent for hexavalent chromium. Chem. Eng. J. 2012, 211–212, 396–405. [Google Scholar] [CrossRef]
  5. Wu, P.; Dai, Y.; Long, H.; Zhu, N.; Li, P.; Wu, J.; Dang, Z. Characterization of organo-montmorillonites and comparison for Sr(II) removal: Equilibrium and kinetic studies. Chem. Eng. J. 2012, 191, 288–296. [Google Scholar] [CrossRef]
  6. Graciela, P.Z.; Rikke, G.O.; Hansen, H.C.B.; Bjarne, W.S. Adsorption of the disinfectant benzalkonium chloride on montmorillonite. Synergistic effect in mixture of molecules with different chain lengths. J. Environ. Manag. 2013, 128, 100–105. [Google Scholar]
  7. Košak, A.; Lobnik, A.; Bauman, M. Adsorption of Mercury(II); Lead(II), Cadmium(II) and Zinc(II) from Aqueous Solutions using Mercapto-Modified Silica Particles. Int. J. Appl. Ceram. Technol. 2013, 12, 461–472. [Google Scholar] [CrossRef]
  8. Ijagbeni, C.O.; Baek, M.-H.; Kim, D.-S. Montmorillonite surface properties and sorption characteristics for heavy metal removal from aqueous solutions. J. Hazard. Mater. 2009, 166, 538–546. [Google Scholar] [CrossRef] [PubMed]
  9. Kailas, L.W.; Pradeep, K.; Shri, C.; Bina, N.P.; Tjoon, T.T. Adsorption of Cadmium Ions from Aqueous Solution Using Granular Activated Carbon and Activated Clay. Clean Soil Air Water 2010, 38, 649–656. [Google Scholar]
  10. Özkahraman, B.; Acar, I.; Emik, S. Removal of Cu2+ and Pb2+ Ions Using CMC Based Thermoresponsive Nanocomposite Hydrogel. Clean Soil Air Water 2011, 39, 658–664. [Google Scholar] [CrossRef]
  11. Mary, A.; Bradley, L.; Ray, M.; Eugene, Z.; Aleksey, V. Adsorption of heavy metal ions on mesoporous silica-modified montmorillonite containing a grafted chelate ligand. Appl. Clay Sci. 2012, 59–60, 115–120. [Google Scholar]
  12. Silva, M.M.F.; Oliveira, M.M.; Avelino, M.C.; Fonseca, M.G.; Almeida, R.K.S.; Silva Filho, E.C. Adsorption of an industrial anionic dye by modified-KSF-montmorillonite: Evaluation of the kinetic, thermodynamic and equilibrium data. Chem. Eng. J. 2012, 203, 259–268. [Google Scholar] [CrossRef]
  13. Bhattacharyya, R.; Ray, S. K. Removal of congo red and methyl violet from water using nano clay filled composite hydrogels of poly acrylic acid and polyethylene glycol. Chem. Eng. J. 2015, 260, 269–283. [Google Scholar] [CrossRef]
  14. Salem, S.; Salem, A.; Babaei, A.A. Preparation and characterization of nano porous bentonite for regeneration of semi-treated waste engine oil: Applied aspects for enhanced recovery. Chem. Eng. J. 2015, 260, 368–376. [Google Scholar] [CrossRef]
  15. Iucolano, F.; Caputo, D.; Colella, C. Permanent and safe storage of Ba2+ in hardened phillipsite-rich tuff/cement pastes. Appl. Clay Sci. 2005, 28, 167–173. [Google Scholar] [CrossRef]
  16. Zhang, P.C.; Brady, P.V.; Arthur, S.E.; Zhou, W.Q.; Sawyer, D.; Hesterberg, D.A. Adsorption of barium(II) on montmorillonite: An EXAFS study. Colloids Surf. A Physicochem. Eng. Asp. 2001, 190, 239–249. [Google Scholar] [CrossRef]
  17. Ammar, M.; Oueslati, W.; Rhaiem, H.B.; Amara, A.B.H. Effect of the hydration sequence orientation on the structural properties of Hg exchanged montmorillonite: Quantitative XRD analysis. J. Environ. Chem. Eng. 2014, 2, 1604–1611. [Google Scholar] [CrossRef]
  18. Chávez, M.L.; Pablo, L.; García, T.A. Adsorption of Ba2+ by Ca-exchange clinoptilolite tuff and montmorillonite clay. J. Hazard. Mater. 2010, 175, 216–223. [Google Scholar] [CrossRef] [PubMed]
  19. Glaeser, R.; Méring, J. Isothermes d’hydratation des montmorillonites biioniques (Ca, Na). Clay Mineral. Bull. 1954, 2, 188–193. (In French) [Google Scholar] [CrossRef]
  20. Harward, M.E.; Brindley, G.W. Swelling properties of synthetic smectites in relation to lattice substitutions. Clays Clay Miner. 1965, 13, 209–222. [Google Scholar] [CrossRef]
  21. Harward, M.E.; Carstea, D.D.; Sayegh, A.H. Properties of vermiculites and smectites: Expansion and collapse. Clays Clay Miner. 1969, 16, 437–447. [Google Scholar] [CrossRef]
  22. Watanabe, T.; Sato, T. Expansion characteristics of montmorillonite and saponite under various relative humidity conditions. Clay Sci. 1988, 7, 129–138. [Google Scholar]
  23. Sato, T.; Watanabe, T.; Otsuka, R. Effects of layer charge, charge location, and energy change on expansion properties of dioctahedral smectites. Clays Clay Miner. 1992, 40, 103–113. [Google Scholar] [CrossRef]
  24. Yamada, H.; Nakazawa, H.; Hashizume, H.; Shimomura, S.; Watanabe, T. Hydration behavior of Na-smectite crystals synthetised at high pressure and high temperature. Clays Clay Miner. 1994, 42, 77–80. [Google Scholar] [CrossRef]
  25. Laird, D.A. Influence of layer charge on swelling of smectites. Appl. Clay Sci. 2006, 34, 74–87. [Google Scholar] [CrossRef]
  26. Sato, T.; Murakami, T.; Watanabe, T. Change in layer charge of smectites and smectite layers in illite/smectite during diagenetic alteration. Clays Clay Miner. 1996, 44, 460–469. [Google Scholar] [CrossRef]
  27. Oueslati, W.; Rhaiem, H.B.; Amara, A.B.H. Effect of relative humidity constraint on the metal exchanged montmorillonite performance: An XRD profile modeling approach. Appl. Surf. Sci. 2012, 261, 396–404. [Google Scholar] [CrossRef]
  28. Moll, W.F. Baseline studies of the clay minerals society source clays: Geological Origin. Clays Clay Miner. 2001, 49, 374–380. [Google Scholar] [CrossRef]
  29. Mermut, A.R.; Cano, A.F. Baseline studies of the clay minerals society source clays: Chemical analyses of major elements. Clay Clay Miner. 2001, 49, 381–386. [Google Scholar] [CrossRef]
  30. Borden, D.; Giese, R.F. Baseline studies of the clay minerals society source clays: Cation exchange capacity measurements by the ammonia-electrode method. Clay Clay Miner. 2001, 49, 444–445. [Google Scholar] [CrossRef]
  31. Srodon, J.; Morgan, D.J.; Eslinger, E.V.; Eberl, D.D.; Karlinger, M.R. Chemistry of illite/smectite and end-member illite. Clays Clay Miner. 1986, 34, 368–378. [Google Scholar] [CrossRef]
  32. Bailey, S.W. Nomenclature for regular interstratifications. Am. Mineral. 1982, 67, 394–398. [Google Scholar] [CrossRef]
  33. Ferrage, E.; Lanson, B.; Sakharov, B.A.; Geoffroy, N.; Jacquot, E.; Drits, V.A. Investigation of smectite hydration properties by modeling of X-ray diffraction profiles. Part 2. Influence of layer charge and charge location. Am. Mineral. 2007, 92, 1731–1743. [Google Scholar] [CrossRef] [Green Version]
  34. Ferrage, E.; Lanson, B.; Michot, L.; Robert, J.L. Hydration properties and interlayer organization of water and ions in synthetic Na-smectite with tetrahedral layer charge. Part 1. Results from X-ray diffraction profile modeling. J. Phys. Chem. C 2010, 114, 4515–4526. [Google Scholar] [CrossRef] [Green Version]
  35. Oueslati, W.; Rhaiem, H.B.; Amara, A.B.H. XRD investigations of hydrated homoionic montmorillonite saturated by several heavy metal cations. Desalination 2011, 271, 139–149. [Google Scholar] [CrossRef]
  36. Drits, V.A.; Tchoubar, C. X-ray Diffraction by Disordered Lamellar Structures: Theory and Applications to Microdivided Silicates and Carbons; Springer: Berlin, Germany, 1990; p. 371. [Google Scholar]
  37. Oueslati, W.; Meftah, M.; Chalghaf, R.; Rhaiem, H.B.; Amara, A.B.H. XRD investigation of selective exchange process for di-octahedral smectite: Case of solution saturated by Cu2+ and Co2+ cation. Z. Kristallogr. Proc. 2011, 1, 389–395. [Google Scholar]
  38. Oueslati, W.; Rhaiem, H.B.; Lanson, B.; Amara, A.B.H. Selectivity of Na–montmorillonite in relation with the concentration of bivalent cation (Cu2+, Ca2+, Ni2+) by quantitative analysis of XRD patterns. Appl. Clay Sci. 2009, 43, 224–227. [Google Scholar] [CrossRef]
  39. Ammar, M.; Oueslati, W.; Rhaiem, H.B.; Amara, A.B.H. XRD profile modeling approach tools to investigate the effect of charge location on hydration behavior in the case of metal exchanged smectite. Powder Diffr. 2013, 28, 284–300. [Google Scholar] [CrossRef]
  40. Ammarm, M.; Oueslatim, W.; Rhaiemm, H.B.; Amara, A.B.H. Quantitative XRD analysis of the dehydration–hydration performance of (Na+, Cs+) exchanged smectite. Desalination Water Treat. 2014, 52, 4314–4333. [Google Scholar] [CrossRef]
  41. Atun, J.G.; Bascetin, E. Adsorption of barium on kaolinite, illite and montmorillonite at various ionic strengths. Radiochim. Acta 2004, 91, 223–228. [Google Scholar] [CrossRef]
  42. Bérend, I.; Cases, J.M.; François, M.; Uriot, J.P.; Michot, L.J.; Masion, A.; Thomas, F. Mechanism of adsorption and desorption of water vapour by homoionic montmorillonites: The Li+, Na+, K+, Rb+ and Cs+ exchanged forms. Clays Clay Miner. 1995, 43, 324–336. [Google Scholar] [CrossRef]
  43. Greathouse, J.; Johnson, K.; Greenwell, H. Interaction of Natural Organic Matter with Layered Minerals: Recent Developments in Computational Methods at the Nanoscale. Minerals 2014, 4, 519–540. [Google Scholar] [CrossRef] [Green Version]
  44. Cases, J.M.; Bérend, I.; François, M.; Uriot, J.P.; Michot, L.J.; Thomas, F. Mechanism of adsorption and desorption of water vapour by homoionic montmorillonite: The Mg2+, Ca2+, Sr2+ and Ba2+ exchanged forms. Clays Clay Miner. 1997, 45, 8–22. [Google Scholar] [CrossRef]
  45. Ferrage, E.; Lanson, B.; Sakharov, B.A.; Drits, V.A. Investigation of smectite hydration properties by modeling of X-ray diffraction profiles. Part 1. Montmorillonite hydration properties. Am. Miner. 2005, 90, 1358–1374. [Google Scholar] [CrossRef]
  46. Calarge, L.; Lanson, B.; Meunier, A.; Formoso, M.L. The smectiticminerals in a bentonite deposit from Melo (Uruguay). Clay Miner. 2003, 38, 25–34. [Google Scholar] [CrossRef] [Green Version]
  47. Meunier, A.; Lanson, B.; Velde, B. Composition variation of illitevermiculite-smectite mixed-layer minerals in a bentonite bed from charente. Clay Miner. 2004, 39, 187–196. [Google Scholar] [CrossRef] [Green Version]
  48. Oueslati, W.; Karmous, M.S.; Rhaiem, H.B.; Lanson, B.; Amara, A.B.H. Effect of interlayer cation and relative humidity on the hydration properties of a dioctahedral smectite. Z. Kristallogr. Suppl. 2007, 26, 417–422. [Google Scholar] [CrossRef]

