Article

Water- and Boron-Rich Melt Inclusions in Quartz from the Malkhan Pegmatite, Transbaikalia, Russia

1
Helmholtz Centre Potsdam, German Research Centre for Geoscience GFZ, Telegrafenberg, D-14473 Potsdam, Germany
2
Centre of Excellence in Ore Deposits, University of Tasmania, Hobart 7001, Australia
3
Geological Department, Saint Petersburg State University, St. Petersburg, 199034, Russia
*
Author to whom correspondence should be addressed.
Minerals 2012, 2(4), 435-458; https://doi.org/10.3390/min2040435
Submission received: 16 August 2012 / Revised: 24 October 2012 / Accepted: 25 October 2012 / Published: 15 November 2012
(This article belongs to the Special Issue Advances in Economic Minerals)

Abstract

:
In this paper we show that the pegmatite-forming processes responsible for the formation of the Malkhan pegmatites started at magmatic temperatures around 720 °C. The primary melts or supercritical fluids were very water- and boron-rich (maximum values of about 10% (g/g) B2O3) and over the temperature interval from 720 to 600 °C formed a pseudobinary solvus, indicated by the coexistence of two types of primary melt inclusions (type-A and type-B) representing a pair of conjugate melts. Due to the high water and boron concentration the pegmatite-forming melts are metastable and can be characterized either as genuine melts or silicate-rich fluids. This statement is underscored by Raman spectroscopic studies. This study suggested that the gel state proposed by some authors cannot represent the main stage of the pegmatite-forming processes in the Malkhan pegmatites, and probably in all others. However there are points in the evolution of the pegmatites where the gel- or gel-like state has left traces in form of real gel inclusions in some mineral in the Malkhan pegmatite, however only in a late, fluid dominated stage.

1. Introduction

In recent years a number of contradictory suggestions as to the genesis of gem-bearing pegmatites from the famous Malkhan deposit are found in the pegmatite literature [1,2,3,4]. Actual analytical data are only presented in some conference papers, for example [5,6,7]. This paper gives a more detailed discussion of our results which were collected over a period of more than 10 years, since these results provide strong support for the melt-melt-fluid immiscibility concept (see to this [8]), which remains disputed by some others working on these pegmatites.
A detailed description of the Malkhan deposit, their history, geology and mineralogy is given in [4]. However information on the genesis is confined to a generalized discussion of fluid versus colloidal (gel) state in independent natural autoclaves. Limited information on rare minerals and the high boric acid [H3BO3] (3 to 27% (g/g)) in fluid inclusions (FI) are given, data about melt inclusions (MI) are very sparse and liquid-liquid immiscibility processes were not considered.
In the present paper we will show using electron microprobe analyses and Raman spectrometric studies of the water and boron contents on homogenized melt inclusions, that immiscibility processes are very important for the evolution and diversity of the pegmatite-forming melts in the Malkhan system. At some points in the evolution a temporary colloidal stage may have been present, but not as a principle process. New studies (this and [9]) of high-temperature gel inclusions in pegmatite-forming minerals (quartz, albite) have shown characteristic differences in composition of water-rich silicate melt inclusions and gel inclusions [9]. As a rule the SiO2 content is too high and the glass-forming components are too low in gel inclusions to form a glass at realistic temperatures.
In the present work the nomenclature used for the different inclusion types is given in [8]—see Figure 4 therein. However given the high primary boron concentration the general system behavior is better described by a pseudo-ternary melt system containing three partly immiscible melts: silicate-rich melt, extremely water-rich silicate melt, and a water- and boron-rich melt, poor in silicates. The topology of the system is not precisely known. In the simplest case there is a system with one miscibility gap in the liquid state. However a system with three separate miscibility gaps is also conceivable.
Further complications result from the formation of vapor-rich phases. As a general rule the MI can be classified according to the water- and in part boron concentrations as follows:
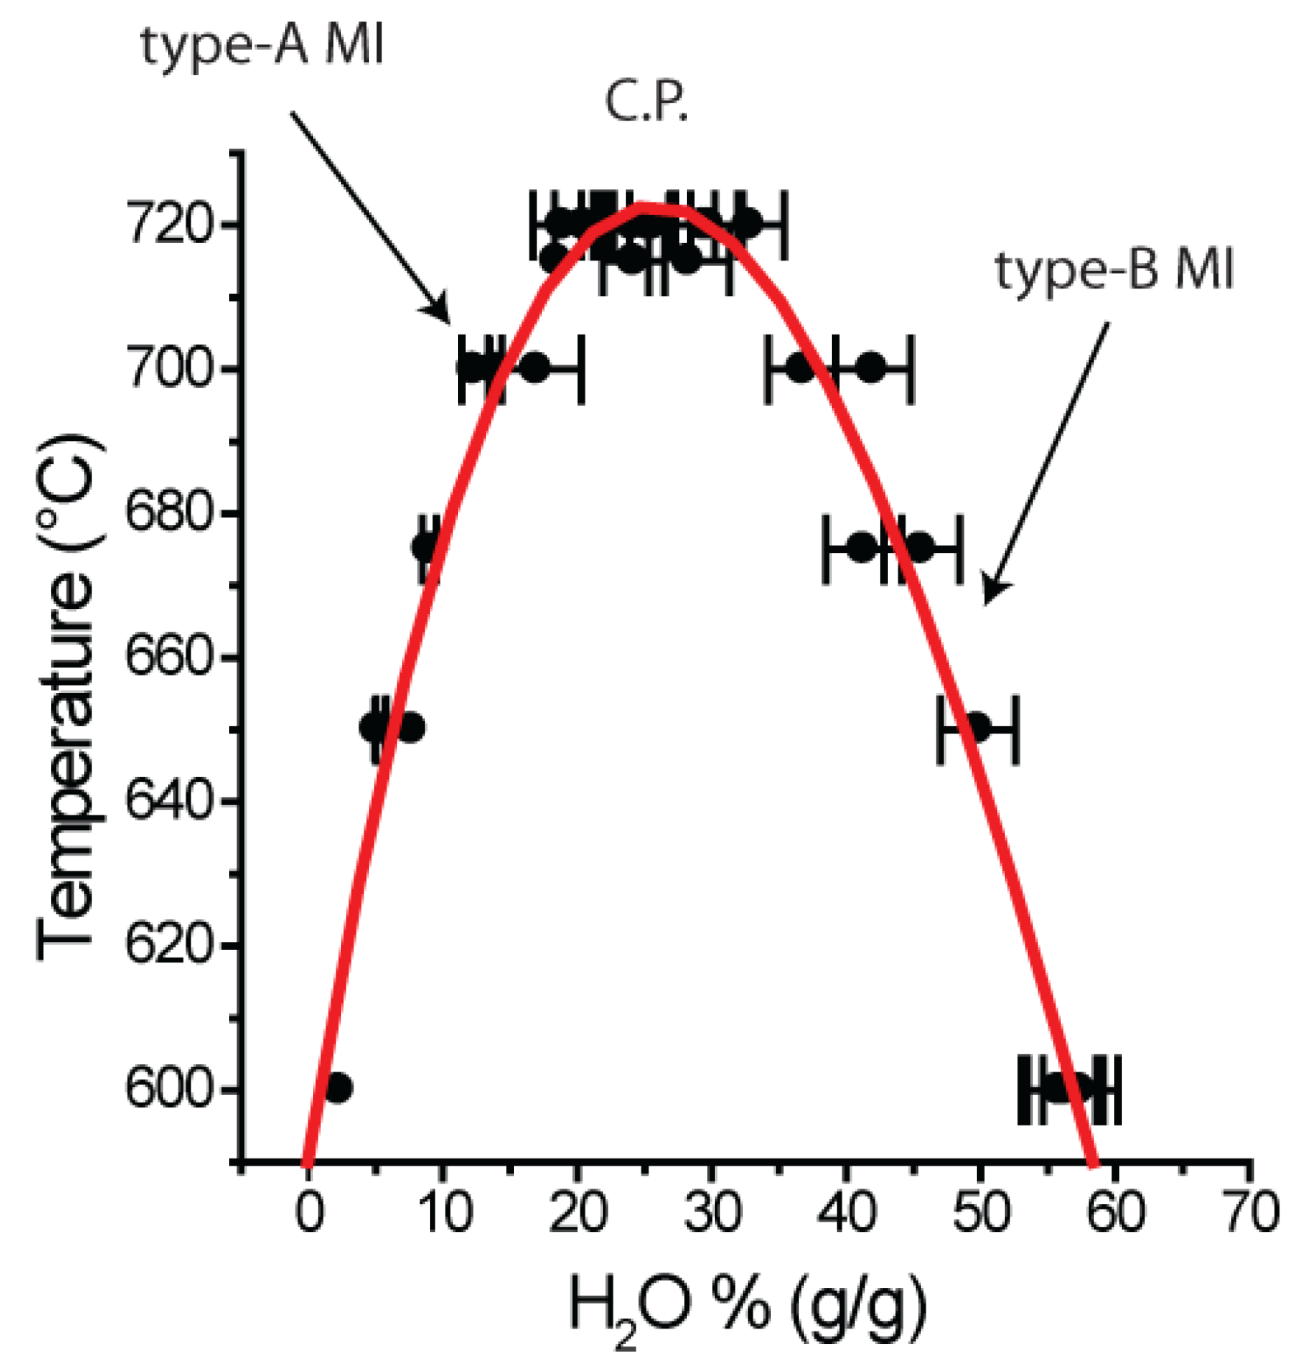
  • Type-A MI: <20% (g/g) H2O
  • Near-critical MI: ~26% (g/g) H2O
  • Type-B MI: >30 and <60% (g/g) H2O
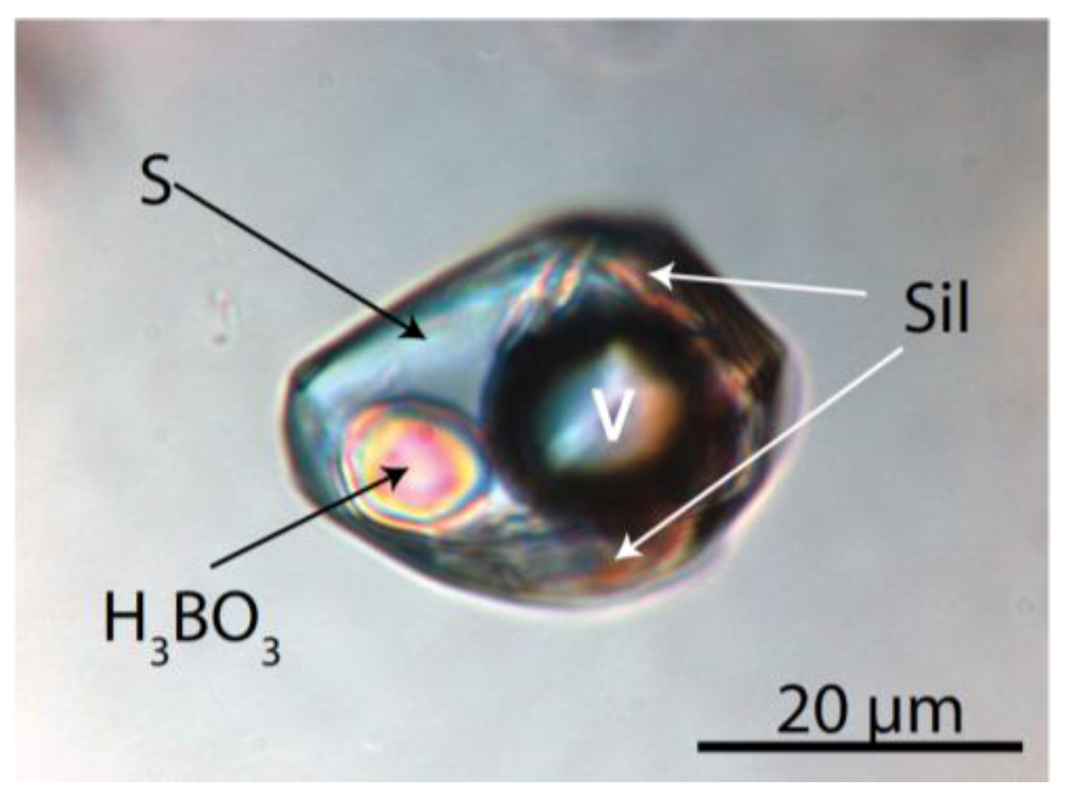
  • Type-C MI: high B and H2O concentrations (~50% H3BO3) as well as small amounts of silicates.
A secondary criterion for these inclusions is the formation of a visible silicate glass phase during the re-homogenization process. Boron-rich fluid inclusions which are directly connected to the liquid immiscibility process (three-phase equilibrium between two melts and vapor or a supercritical fluid or three melts) are referred to as type-C fluid or melt inclusions (fluid inclusions in the pseudo-binary and melt inclusions in the pseudo-ternary systems). Inclusions which trapped a fluid phase unrelated to liquid immiscibility processes are referred to as fluid inclusions (FI)—see Roedder [10]. However note that we use fluid inclusions only for some comparisons to the early melt-dominated stage with the melt-melt immiscibility which is the central point of our paper.
We define gel inclusions as inclusions which trapped an original silica gel or a sol. By normal alteration process the primary gel or sol phases are transformed into a fluid inclusion with large amounts of solids—mostly quartz and cristobalite, which cannot be homogenized at the trapping conditions (Thomas and Davidson [9]).

2. Geological Setting

The Malkhan ridge is located in the central Transbaikal region/Russia about 200 km SE from Ulan-Ude, the capital of the Buryat Republic, and is bounded by the Khilok River in the north and the Chikoi River in the south. The Malkhan field of complex granitic, miarole-rich pegmatites occupies an area of about 60 km2. The pegmatites are related to Mesozoic granites of the larger Bolsherechensky massif and the smaller Oreshnyi massif composed of subalkaline, porphyritic biotite granites sometimes passing into calc-alkaline granites. The granites are of Cretaceous age, according to Zagorsky and Peretyazhko [11] the 40Ar/39Ar age of the granite-pegmatite system is 127.6–123.8 Ma. These results are consistent with a Rb-Sr isotope age of 126.4 ± 0.7 Ma, 87Sr/86Sr = 0.7187 ± 70, MSWD = 0.49 obtained for the Oreshnyi granite by one of the authors (E.B.).
Although gemstones from this region of Siberia have been known since 1723, the Malkhan gem pegmatites were discovered during the 1970’s by Russian geologists exploring the region for rare earth metals.
Pegmatites are relatively abundant in the Malkhan region, especially between both granite massifs. The pegmatites form platy veins up to 350 m long and up to 7–10 m thick. Pegmatites are mainly quartz and feldspar, in some pegmatites oligoclase is the dominant feldspar, in others potassium feldspar. The average chemical and mineralogical bulk composition of the granites and pegmatites are given by Zagorsky and Peretyazhko [12] and Zagorsky et al. [3].
The pegmatites are dominated by graphic, vague graphic and fine-pegmatitoid structure. The central inner zone is rich in miarolitic cavities of up to few cubic meters. The gem pockets range from 0.5 to 2 m in diameter and are lined with fine pink to red tourmaline crystals. Most pockets contain large gemmy tourmaline crystals attached to their walls or found loose in the decomposed feldspar and mica debris and mud. The crystals and crystal fragments can be cut into exquisite gemstones.
The miaroles contain colorless and smoky quartz, feldspar, lepidolite, variously colored tourmaline, topaz, morganite, danburite, hambergite and a number of other rare minerals including borocookeite and nanpingite. A detailed description of the minerals is given by Zagorsky and Peretyazhko [4]. The pegmatites are the main source of gem-quality tourmaline in Russia, and are famous for other gemstones including beryl (vorobyevite, morganite), topaz, danburite, pollucite, spessartine, and hambergite.
Previous studies of quartz- and tourmaline-hosted fluid inclusions in Malkhan pegmatites [1,2,12] showed very high concentrations of boric acid in the pegmatite aqueous fluid (up to 27% (g/g) H3BO3)—an important hint that the pegmatite-forming melt should also contain high concentration of boron. In this study we provide new constraints on composition and evolution of pegmatite-forming melts and fluids, and show that in some late stages there are transitions from true fluid to fluids with sol/gel characteristics.

3. Samples and Experimental and Analytical Methods

3.1. Samples

This study is focused mainly to the early melt inclusions in quartz of graphic granite from the Sosedka (MX-467), Oreschnaya (MX-73-74) and Zapadnaya (MX-27) pegmatites, some from quartz-oligoclase zones with only a vague graphic structure from Mokhovaya (MX-483), Oktyabrskaya (MX-707) and a few quartz samples are from miarolitic cavities in the Mokhovaya (MX-1, MX-2, MX-4) and the Zapadnaya pegmatite (MX-27). A summary of the samples used are given in Table 1 together with their positions within the pegmatites.
Table 1. Origin of the pegmatite quartz samples from the Malkhan pegmatite field in Transbaikalia, Russia.
Pegmatite veinSamplePosition in the pegmatites
MokhovayaMX-483Quartz-oligoclase zone (with only vague graphic structure)
MokhovayaMX-1, MX-2, MX-4Miarolitic cavities*
OreshnayaMX-73-74Graphic granite
Oktyabr’skayaMX-707Quartz-oligoclase zone (with only vague graphic structure)
SosedkaMX-467Graphic granite
ZapadnayaMX-27Graphic granite
Granite
Oreshnyi MassifMX-49Biotite-muscovite granite
* The samples are generally from the root of the quartz crystals.
One sample from the biotite-muscovite granite from the Oreshnyi Massif was studied to demonstrate that the pegmatite hosting granites was also already enriched in boron and was also influenced by the same supercritical fluids which are responsible for the pegmatite-formation.

3.2. Cold-Seal Pressure Vessel Homogenization Experiments

Because the melt inclusions in pegmatite generally were completely crystallized it was necessary to re-homogenize the melt inclusions to a homogeneous, daughter crystal-free glass for electron microprobe and Raman spectroscopic studies. Quartz grains containing melt inclusions from the graphic granite were homogenized using conventional horizontal cold-seal pressure vessel technique at the GeoForschungsZentrum (GFZ) Potsdam (the procedure is described by Thomas et al. [13]. We used this technique to prevent significant water loss by leakage or diffusion. According to our previously published work in this field (see Thomas [14]) the use of microscope heating stages at ambient pressure for the homogenization of melt inclusions in quartz at temperatures greater than 650 °C risks a noticeable water loss, which increase with increasing temperature (see also Massare et al. [15], Portnyagin et al. [16], and Severs et al. [17]). This loss can be reduced by using cold-seal pressure vessel technique. This shifts the threshold temperature for the start of diffusion loss of water to temperatures around 720–750 °C [14].
Homogenization was carried out at 1 kbar or higher since this dramatically decreases diffusive loss of H2 or H2O compared to conventional atmospheric pressure techniques. If any diffusive re-equilibration had occurred it would decrease the apparent H2O concentrations, so quoted figures should be considered as conservative. The temperature steps used were chosen from preliminary studies [5,6,7,13] which showed that the primary melt inclusions were trapped in a relative wide temperature range along a pseudobinary solvus. Generally, for all temperature steps and homogenization measurements we used new samples.
Immediately after homogenization the fluid phase of the type-B melt inclusions was a single-phase fluid, but over a random period from minutes up to 10 years in some cases, large sassolite daughter crystals appeared in the fluid phases, demonstrating the metastable behavior of the whole inclusion system.
The homogenizations temperatures of some fluid inclusions and the melting temperatures of some salt phases (mostly sassolite) were performed with a calibrated LINKAM THMS 600 heating and freezing stage, together with a TMS92 temperature programmer and a LNP2 cooling system mounted on an Olympus microscope. The stage was calibrated with synthetic fluid inclusions (SYNFLINC) and melting points of different standards. All measurements were performed under argon. The standard deviation depends on absolute temperature and is always less than ±2.5 °C for temperatures greater 100 °C, and is ≤0.2 °C for cryometric measurements lower than 20 °C.

3.3. Microprobe Analysis of the Melt Inclusion Glass

Melt inclusion glasses were analyzed with a Cameca SX50 and a SX100 electron microprobe at GFZ, Potsdam using following analytical conditions: accelerating voltage of 15 kV, beam current of 10 nA, beam size of 2–40 µm, counting time 20 s on peak for Si, Al, Na, K, Ca, Fe, Mg, Mn, and Ti, 40 s for F, P, Cl, Rb, and Cs, and 120 s for Sn. Synthetic oxides and minerals were used as standards. To minimize the effect of incorporation of excess SiO2 from the inclusion wall into the glass we have generally used melt inclusions with a diameter greater than 20 µm, and if possible greater 50 µm. To prevent sodium loss Na was measured at first with the largest beam size determined by the inclusion diameter.
Boron was analyzed with the Cameca SX50 microprobe at 10 kV and 40 nA, using a PC2 pseudo-crystal in the trace-element mode [18] and the anti-contamination setup with liquid nitrogen. LaB 6 was taken as internal and synthetic glasses containing up to 20% (g/g) B2O3 as external standards. A counting time of 300 s at the peak, a shift of +500, and backgrounds between −5200 and +8000 were chosen. Analyses were also performed in the peak-area mode (60 s, 10,000 steps, five scans). Both methods yielded identical results. The detection limit for boron was at 0.06% (g/g) and the relative error is 10.4%. Data for elements other than boron are given to provide information, and to generate ideas regarding the effects of the main compounds other than boron and water on the composition of the pegmatite-forming melts.
At higher temperature (>700 °C) there may be a re-equilibrium problem between melt inclusion and host quartz. To minimize this problem we have generally used the largest inclusions from the run. The error produced by this effect is an overestimation of SiO2 and an underestimation of water and boron of the melt inclusions. The absolute value of this error is unknown, but on the basis of previous experiments an estimate of a maximum of 5% can be assumed. That means at a B2O3 concentration of 8.6 an increase of SiO2 by 5% (g/g) would decrease the value for B2O3 to 8.1% (g/g) as a worst case. As a rule this value is equal to the standard deviation of 1σ.

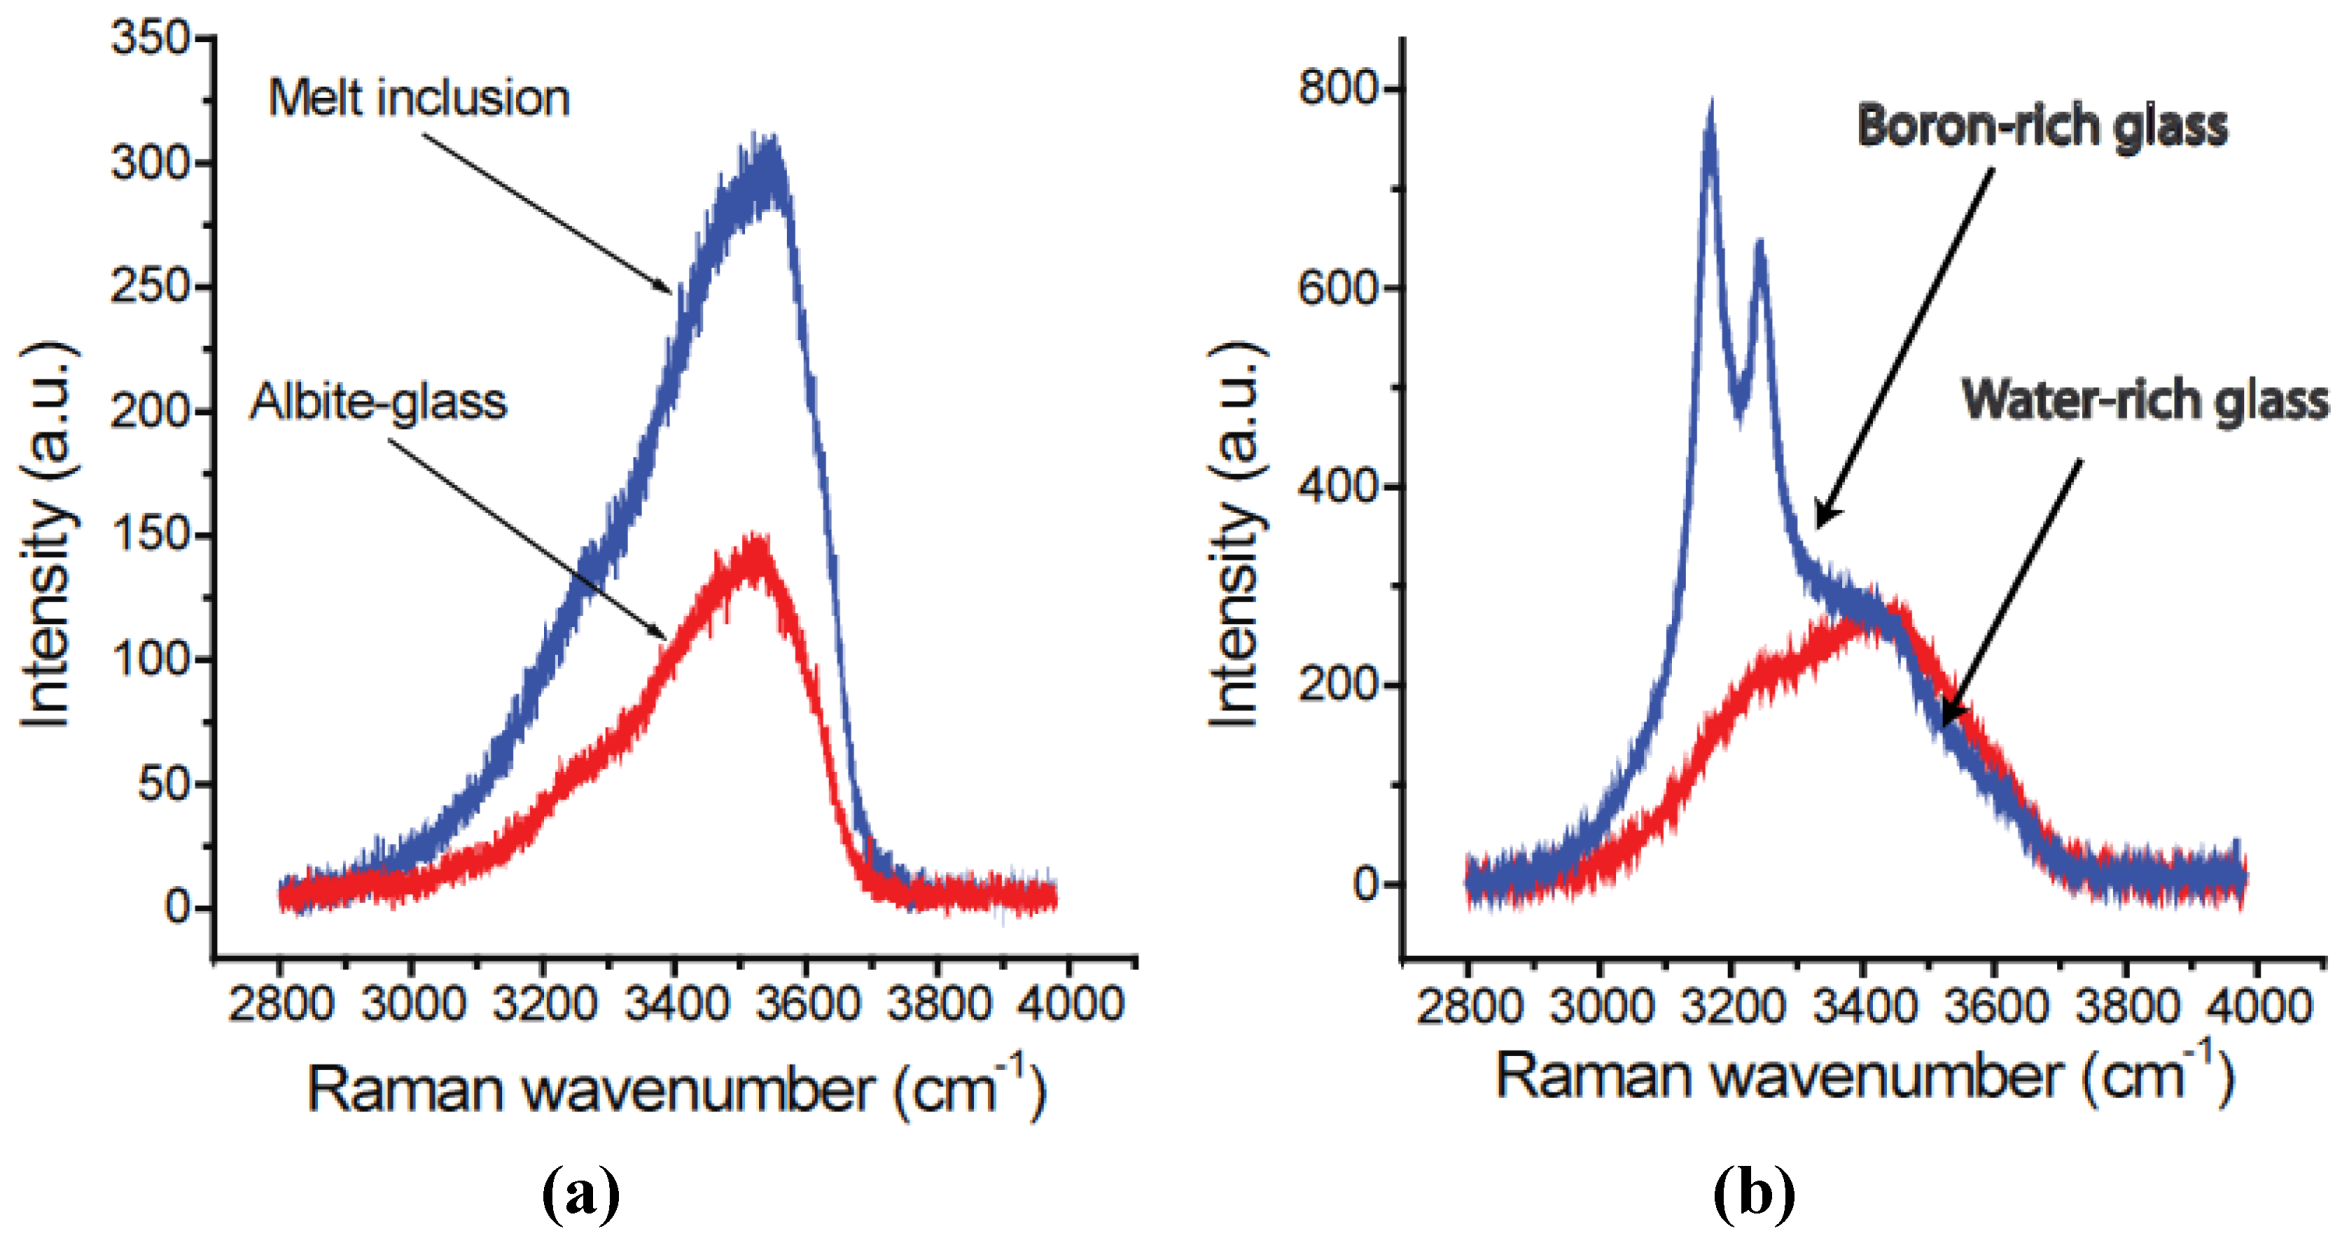
3.4. Micro-Raman Spectroscopy and Water Determination in Melt Inclusion Glass

Raman spectra were recorded with a Jobin-Yvon LabRam HR800 spectrometer (grating: 1800 gr/mm), equipped with an Olympus optical microscope and a long-working-distance LMPlanFI 100x/0.80 objective. We used a 514 and 488 nm excitation of a Coherent Ar+ laser Model Innova 70C, a power of 300 mW (about 45 mW on sample), at a resolution ≤0.6 cm−1. The spectra were collected at a constant laboratory temperature (20 °C) with a Peltier-cooled CCD detector and the positions of the Raman bands were controlled and eventually corrected using the principal plasma lines in the Argon laser. The difference between the recommended and measured positions of the plasma lines in the fingerprint spectral region is not larger than 0.6 cm−1.
Water concentrations of some of the volatile-rich melt inclusions from the graphic granite and smoky quartz from the miarolitic cavities were determined by confocal Raman spectroscopy following the method by Thomas [19] and Thomas et al. [20,21]. Synthetic glasses with a total of 6.53% (g/g) and 11.71% (g/g) H2OT, determined by Karl Fischer titration, were used as reference standards. Typical Raman spectra are shown in Figure 1.
Figure 1. (a) Typical Raman spectra in the high frequency range of a melt inclusion glass (sample MX-4), homogenized at 700 °C and 1 kbar in comparison to a synthetic albite glass (Ab-83) with 11.71% (g/g) water, determined with the Karl-Fisher method (see [19]). From 7 different inclusions we obtained a water concentration of 25.3 ± 3.1% (g/g); (b) Raman spectra from very H3BO3-rich melt inclusion glasses and a water-rich glass (~28% (g/g)) in quartz of the same sample. The sharp doublet at 3165 and 3247 cm−1 corresponds to molecular H3BO3 dissolved in high amounts in the silicate glass.
Minerals 02 00435 g001
For the determination of boric acid, carbonate, bicarbonate and sulfate in fluid and melt inclusions we used a modified method according to Sun and Qin [22], characterized by measurement of the relative intensity ratio between two Raman sub-bands in the OH stretching region between 2800 and 3800 cm−1and the corresponding Raman bands of the species H3BO3, CO32−, HCO3 and SO4−2 at about 875, 1380, 1017 and 983 cm−1, respectively. For calibration we used standardized aqueous solutions of these compounds (aqueous solutions of H3BO3, Na, K, Rb, Cs carbonates, NaHCO3, and H2SO4).
In contrast to Sun and Qin [22] for the determination of carbonates in the fluid phases (fluid and melt inclusions) in quartz we used the Raman band at about 1380 cm−1, according to Oliver and Davis [23], because the strongest Raman band at 1066 cm−1 is influenced by two quartz bands (1066 and 1080 cm−1) in this region. Note that the carbonate frequencies are virtually independent of alkali metal cations (Li, Na, K, Rb, Cs). Therefore we obtain only the CO32− concentration with this method, the same is true for sulfate (see [24]).

3.5. Interpreting Melt Inclusion Analyses

In deriving solvus data from the high temperature and high pressure experiments our philosophy was that normally the quartz samples contain a large spectrum of melt inclusions trapped at different temperatures, representing part of or all of the solvus of the pseudobinary curve. To obtain the necessary information the experiments are performed at different run temperatures within the expected solvus boundaries (see [13,21,25]). To prevent decrepitation the experiments must be performed at higher pressures. For most experiments a CO2 gas pressure of 1, 2 or 3 kbar is enough. In the present study run temperatures at 600, 650, 675, 700, 715 and 720 °C at a constant holding time of 20 h were chosen, on the basis of previous experiments. At any given run temperature those inclusions trapped at or below that temperature will homogenize, any un-homogenized or partly homogenized inclusions are assumed to have been trapped at higher temperatures.
As a rule the samples contain two different melt inclusion types, one more peraluminous and less water-rich melt (type-A) and the second more peralkaline and very water-rich melt (type-B) using the nomenclature of Thomas et al. [25] and Thomas and Davidson [8]. In melting experiment at the lowest temperature homogenized inclusions of both these types represent the extremes with respect to total water concentration, and Raman spectroscopy is used to quantify that amount. Type-A melt inclusions homogenize completely to glass, occasionally with only a small shrinkage bubble, and Raman spectroscopy is straight forward. Due to their high volatile content, after quenching water-rich type-B melt inclusions normally dissociate into a glass and an aqueous fluid bubble containing a vapor bubble. In this case the task is to find the inclusion with the lowest homogeneous glass/bubble ratio for a given temperature, the bulk water concentration is then the weighed sum of the water content of the glass, determined with the Raman spectroscopy and the volume of the molecular water of the fluid phase. Less commonly some type-B inclusions quench to a metastable homogeneous glass using the rapid quench technique. In this case the total water content can be determined directly.
At the highest run temperature all inclusions are homogenized to type-A and type-B melt inclusions and some intermediate compositions representing the solvus crest, but with a range of water concentrations spanning the whole solvus range. Therefore lower run temperatures are necessary to decrease this “band spread”, and separate out type-A and type-B melt inclusions at the extremes of the pseudo-solvus. Additionally, since low-temperature inclusions are often missing in the early high temperature crystallization products (graphic granites), samples from miarolitic cavities are used to find the data representing lower temperatures.
As a clarification, although we use the term type-B melt inclusions, at high water concentration homogenization of the suspended melt droplets occurs into the water-rich fluid phase. Given this behavior the inclusions are, from a strictly objective view point, silicate-rich fluids. However, since Raman spectroscopy shows the fluid suspended droplets are molten silicates, we use the original nomenclature to highlight differences from salt-rich fluid inclusions. In addition, with increasing silicate component as the critical point of the pseudobinary system is approached, the behavior will be more and more melt-like.

4. Results

4.1. Inclusions in Quartz from the Oreshnyi Massif Biotite-muscovite Granite

The Malkhan complex was intruded by Mesozoic granites of the larger Bolsherechensky massif and the smaller (7 km × 5 km) Oreshnyi massif. Most of the Malkhan pegmatites are located between both massifs [4]. To see if we can find early indications of pegmatite-forming processes we have studied one granite sample from the Oreshnyi massif.
Quartz from the Oreshnyi Massif granite contain very rare primary silicate melt inclusions but abundant small, H3BO3-rich fluid inclusions and rare H3BO3-rich type-B melt inclusions. These inclusions are arranged in sub-parallel planes crossing the grain boundaries. Therefore both inclusion types are of secondary origin relative to the granite—see Figure 2. For the origin of these secondary inclusions there are two principal possibilities: (i) generation of the secondary trails by the interaction of the pegmatites with the granite and (ii) the trails represent fluid channels, which brought parts the pegmatite-forming fluids from deeper regions of the granite. From observations on different granites in the Erzgebirge region, Germany we prefer the second possibility.
These inclusions are not arranged in growth zones, they form oriented planes which cross-cut quartz grain boundaries. These inclusions are remnants of a pervasive supercritical fluid passing through the completely crystallized granite after main crystallization, similar to the boric acid-rich pervasive solutions connected to the Variscan ore-forming granites in the Erzgebirge region/Germany (Thomas et al. [13]).
However increased boron concentrations were also found during reconnaissance microprobe studies on feldspars of this granite. For an albite crystal we determined 1.6% (g/g) and for an orthoclase 1.0% (g/g) B2O3, respectively. From this result it may be concluded that at a high boron activity the formation of the reedmergnerite molecule [NaBSi3O8] in the feldspars is possible, in albite to the extent of 0.11% (mol/mol) and in orthoclase 0.07% (mol/mol).
Figure 2. Microphotographs of fluid and melt inclusions in quartz of the granite from the Oreshnyi Massif. (a) shows a quartz grain with secondary inclusions in sub-parallel planes. Single inclusions in these planes after the homogenization run at 720°C and 2 kbar are shown in (b) and (c). (b) is a melt inclusion also containing a sassolite daughter crystal; (c) is a fluid inclusion also containing a sassolite daughter crystal. S—water-rich solution, V—vapor, G—glass.
Minerals 02 00435 g002

4.2. Inclusion in Pegmatite Quartz

The early quartz (i.e., in graphic granite) and also the root zones of clear and smoky quartz crystals contain two types of re-crystallized melt inclusions, type-A and water-rich type-B, by the criteria of Thomas et al. [13]. These inclusions are interpreted to represent syngenetic melt pairs formed by melt-melt immiscibility process during the crystallization over a relatively large temperature range of 600 and 720 °C. Figure 3 shows typical near-critical unheated melt inclusions with boric acid daughter crystals in quartz of the graphic granite from the Oreschnaya pegmatite. Because the melting temperature of the boric acid daughter crystals of these inclusions (average of 20 inclusions from the same growth zone) is 50.3 ± 3.8 °C, corresponding to 10.5 ± 0.9% (g/g) H3BO3, a considerable amount of molecular water must be present in the inclusion. Furthermore a large part of boron is linked to other borates and silicates.
As well as both melt inclusion types there are syngenetic fluid inclusions, which visually are often the dominant type. In quartz from the miarolitic cavities the quantity of fluid inclusions conspicuously increases from the root zone into the main body of the crystals. Most of these fluid inclusions contain sassolite daughter crystals. A concise discussion of the formation and relationship of the different inclusion types in the type-A-B-C classification are given in Thomas and Davidson [8].
Figure 3. (a) Typical unheated near-critical melt inclusions with boric acid daughter [H3BO3] crystals in quartz of the graphic granite from the Oreschnaya pegmatite; (b) Enlargement of the first melt inclusion in (a) showing the border (indicated by white arrows) of the former fluid subphase (fluid + bubble) formed immediately after trapping and cooling. This originally sharp phase boundary is deformed by the crystallization of the glass phase. G—recrystallized glass, V—vapor.
Minerals 02 00435 g003

4.2.1. Melt Inclusion Data

The Raman data obtained for water and the microprobe results of boron determinations are given in Table 2. In the case of type-B melt inclusions the water and boron bulk concentration was calculated from the volume proportions of glass and fluid (liquid and vapor phase) and the corresponding density of these phases (see [26] and [8,24]).
The water data, plotted on a temperature-H2O-concentration diagram, form a pseudo-binary solvus with a solvus crest near 720 °C (Figure 4).
The behavior of boron is a little different to water – the boron concentration increases with the water content according to a second order polynomial (Figure 5).
Table 2. Water and boron concentration in melt inclusions in quartz of the Malkhan pegmatite. Boron was determined using the microprobe technique and water by Raman spectroscopy and volumetric measurements (see [8]) in the case of type-B melt inclusions.
PegmatiteT (°C)MI-typeGlass% (vol/vol)SDH2O% (g/g)SDnB2O3% (g/g)SDn
Mokhovaya650A5.10.438
600B18.655.82.888.20.13
700A17.03.310
700B35.836.82.62
720B62.9220.52.211
720critical10025.33.17
720B45.229.82.5116.90.153
Oreschnaya650A5.40.431.63
650B233.649.82.88
675A9.20.552.40.914
675B30.64.241.32.878.41
700A12.30.974.40.67
700B29.942.02.8108.72
720A22.11.8396.80.69
720B45.70.1329.42.5277.11
Oktyabr'skaya600B17.657.42.818.11
675B26.5145.62.818.41
715A18.516.71
715B47.61.728.33.0227.80.62
720A25.616.01
Sosedka600A2.310.80.35
715B5524.22.317.21
720A24.12.5156.90.715
720B67.1818.92.217.11
Zapadnaya600B18.30.556.32.838.31
650A7.722.72
675A9.00.592.51.15
700A13.90.5344.60.35
720A21.60.495.80.57
720B40.8 32.82.626.5 5
Sum of n296146
SD—standard deviation (1σ); n—studied melt inclusions; A—type-A MI; B—type-B MI;
Critical—water-rich, totally homogenized glass;
Water in type-B glass: (9.1 ± 2.3) % (g/g) (n = 217 determinations)
Density of the fluid phase: 0.55 ± 0.07 g/cm3(n = 55 determinations)
Figure 4. Pseudobinary water versus temperature plot of rehomogenized type-A and type-B melt inclusions in quartz from the Malkhan pegmatites. Points on the opposite side of the both solvus branches represent conjugate melt pairs. C.P—Critical Point of the system.
Minerals 02 00435 g004
Figure 5. Correlation between water and B2O3 concentration in melt inclusions in quartz from the Malkhan pegmatites.
Minerals 02 00435 g005
A maximum of 10.2 ± 2.1% (g/g) B2O3 was determined for five homogeneous melt inclusions in the graphic granite samples MX-73-74 and MX-467 in the 700 °C runs. Figure 6 show typical re-homogenized near-critical melt inclusions in quartz of graphic granite.
According to Raman spectra of the melt inclusion glasses boron forms the planar orthoborate three-coordinated boron νs (B(3)-O) modes (see [26]). Given this coordination the metastable behavior of the inclusion system is understandable – over time some boron may move from the metastable glass phase into the water-rich phase and there forms daughter crystals of sassolite as shown in Figure 6. From measurements of the melting temperature of sassolite in the water-rich subphase of such near-critical type-B melt inclusions in quartz of graphic granite of sample MX-27, which is 109.8 ± 4.6 °C (n = 24), a concentration of 32.7 ± 2.6% (g/g) H3BO3 was determined. As a rough estimate this concentration gives a bulk concentration for the whole inclusion of 10.7% (g/g) B2O3. This is a little bit more than we have determined with microprobe, possibly due to loss of boron during preparation in the order of about 1% (g/g) B2O3.
Figure 6. Figure (a) a typical, near-critical type-B melt inclusion in quartz of the Oktyabrskaya pegmatite, rehomogenized at 715 °C and 2 kbar; (b) a near-critical boric acid-rich type-B melt inclusion in quartz of the graphic granite of the Zapadnaya pegmatite; and (c) is a type-C fluid inclusion in the same sample, rehomogenized at 700 °C and 2 kbar. H3BO3—boric acid, G—boron-rich glass, S—boric acid-rich aqueous solution, V—vapor.
Minerals 02 00435 g006
Melt-melt-fluid immiscibility and the previously mentioned mechanism should probably be responsible for a large fractionation of boron isotopes during pegmatite-forming processes. The lighter 10B isotope should be enriched in the melt-fluid inclusion series: type-A→type-B→type-C moving to the right by diffusion and/or ideal distillation. A melt inclusion system shown in Figure 6 should be an ideal target for B isotope distribution studies.
To obtain information about the composition of the pegmatite-forming melts some microprobe results are given in Table 3, mostly from type-A melt inclusions.
Table 3. Selected microprobe results on melt inclusions in quartz of graphic granite from the Malkhan pegmatites [data in % (g/g)], water-free.
Type-A MI ZapadnayaType-B MI Zapadnaya(2)Type-A MI SosedkaType-A MI SosedkaType-B MI Sosedka(2)(3)Type-A MI OreschnayaType-A MI Oreschnaya
SiO272.567.873.776.7 ± 2.967.268.7 ± 1.567.2
TiO20.030.030.010.03d.l.0.030.01
Al2O312.710.011.912.4 ± 1.310.811.2 ± 0.710.6
B2O33.8 ± 0.5(1)8.03.02.8 ± 1.08.66.3 ± 0.37.1 ± 0.8(1)
MgOd.l.0.010.030.020.030.01d.l.
CaO0.110.440.10.9 ± 0.30.090.080.05
MnOd.l.0.010.020.10.020.020.02
FeO0.02d.l.0.040.040.04d.l.0.02
Na2O3.05.52.02.8 ± 0.43.64.1 ± 0.24.4
K2O3.13.53.02.6 ± 0.43.93.4 ± 0.54.1
Rb2O0.220.120.820.2 ± 0.10.750.2 ± 0.030.1
Cs2O3.03.24.00.75 ± 0.23.63.5 ± 0.23.6
F1.61.51.30.55 ± 0.21.22.3 ± 0.72.9
Cld.l.d.l.0.020.020.02d.l.0.01
P2O50.04d.l.0.040.020.040.020.02
Sum100.12100.1199.9899.9399.8999.88100.13
ASI1.310.671.381.31 ± 0.190.900.94 ± 0.080.81
n11118251
(1) 10 determinations;
(2) the fluid phase contain mainly alkali borates beside small amounts of alkali sulfates;
(3) the values for Na and K are to low estimated; Li was not determined.
The position of the melt inclusions in the pseudobinary solvus (Figure 4) can be deduced from the boron concentration. For the technical reasons mentioned results for the type-B melt inclusions are difficult to determine, and are given mainly for comparison. Note that the determination of sodium in the water- and boron-rich glasses is a complex task. Further information regarding the composition of melt inclusions are given in Peretyazhko et al. [27] and Thomas et al. [7]. Table 3 in Peretyazhko et al. [27] gives SIMS-data for BeO, Li2O, Ta2O5, Nb2O5 corresponding to 0.12, 0.54, 0.57, and 0.10% (g/g) respectively.

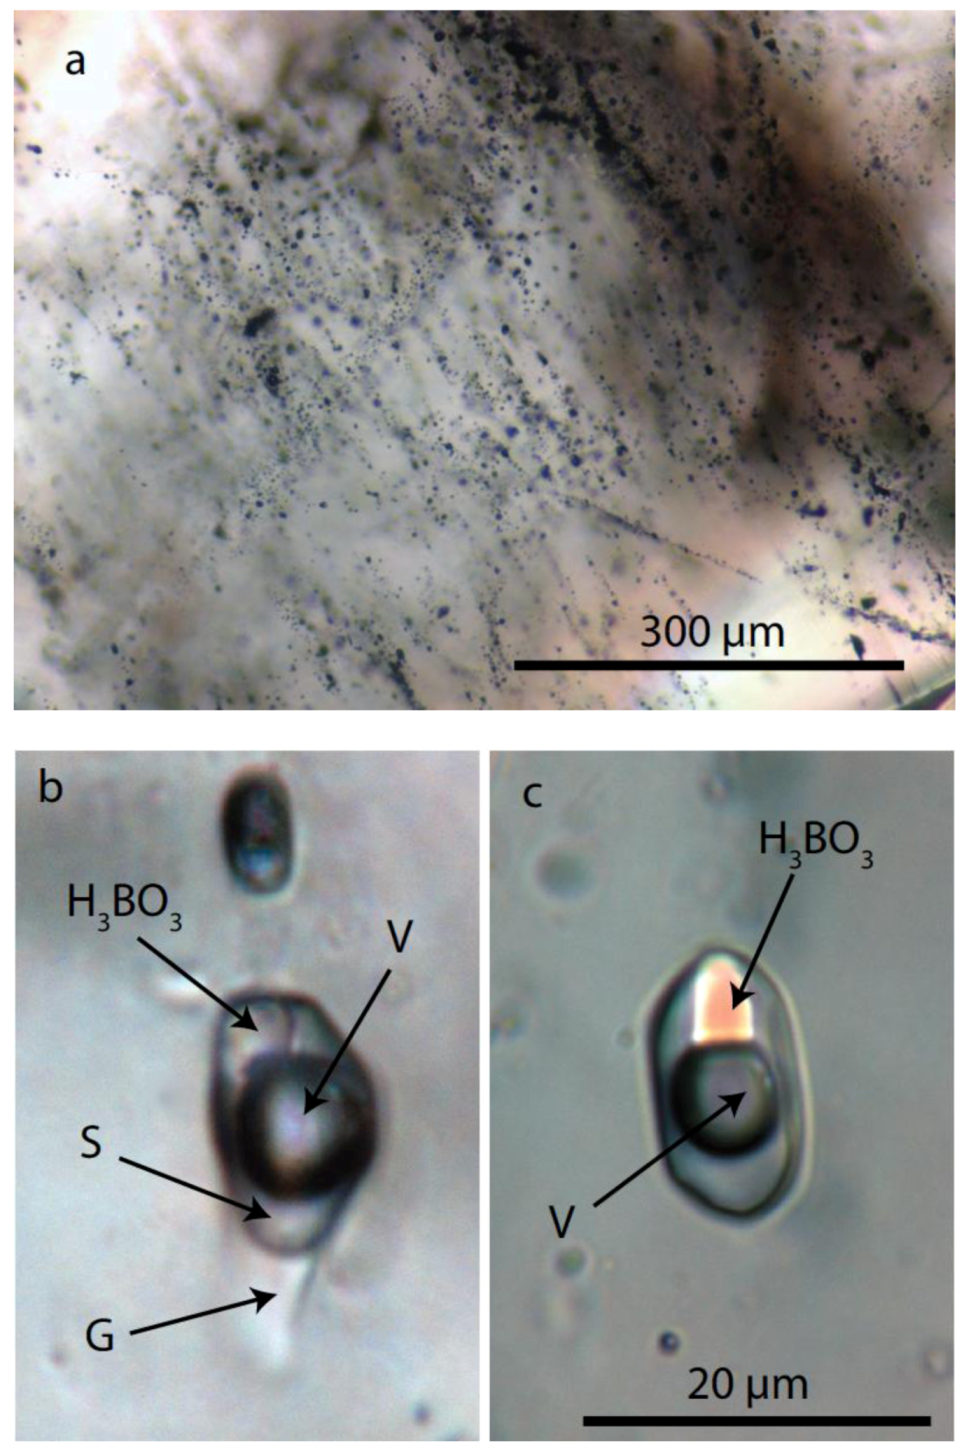
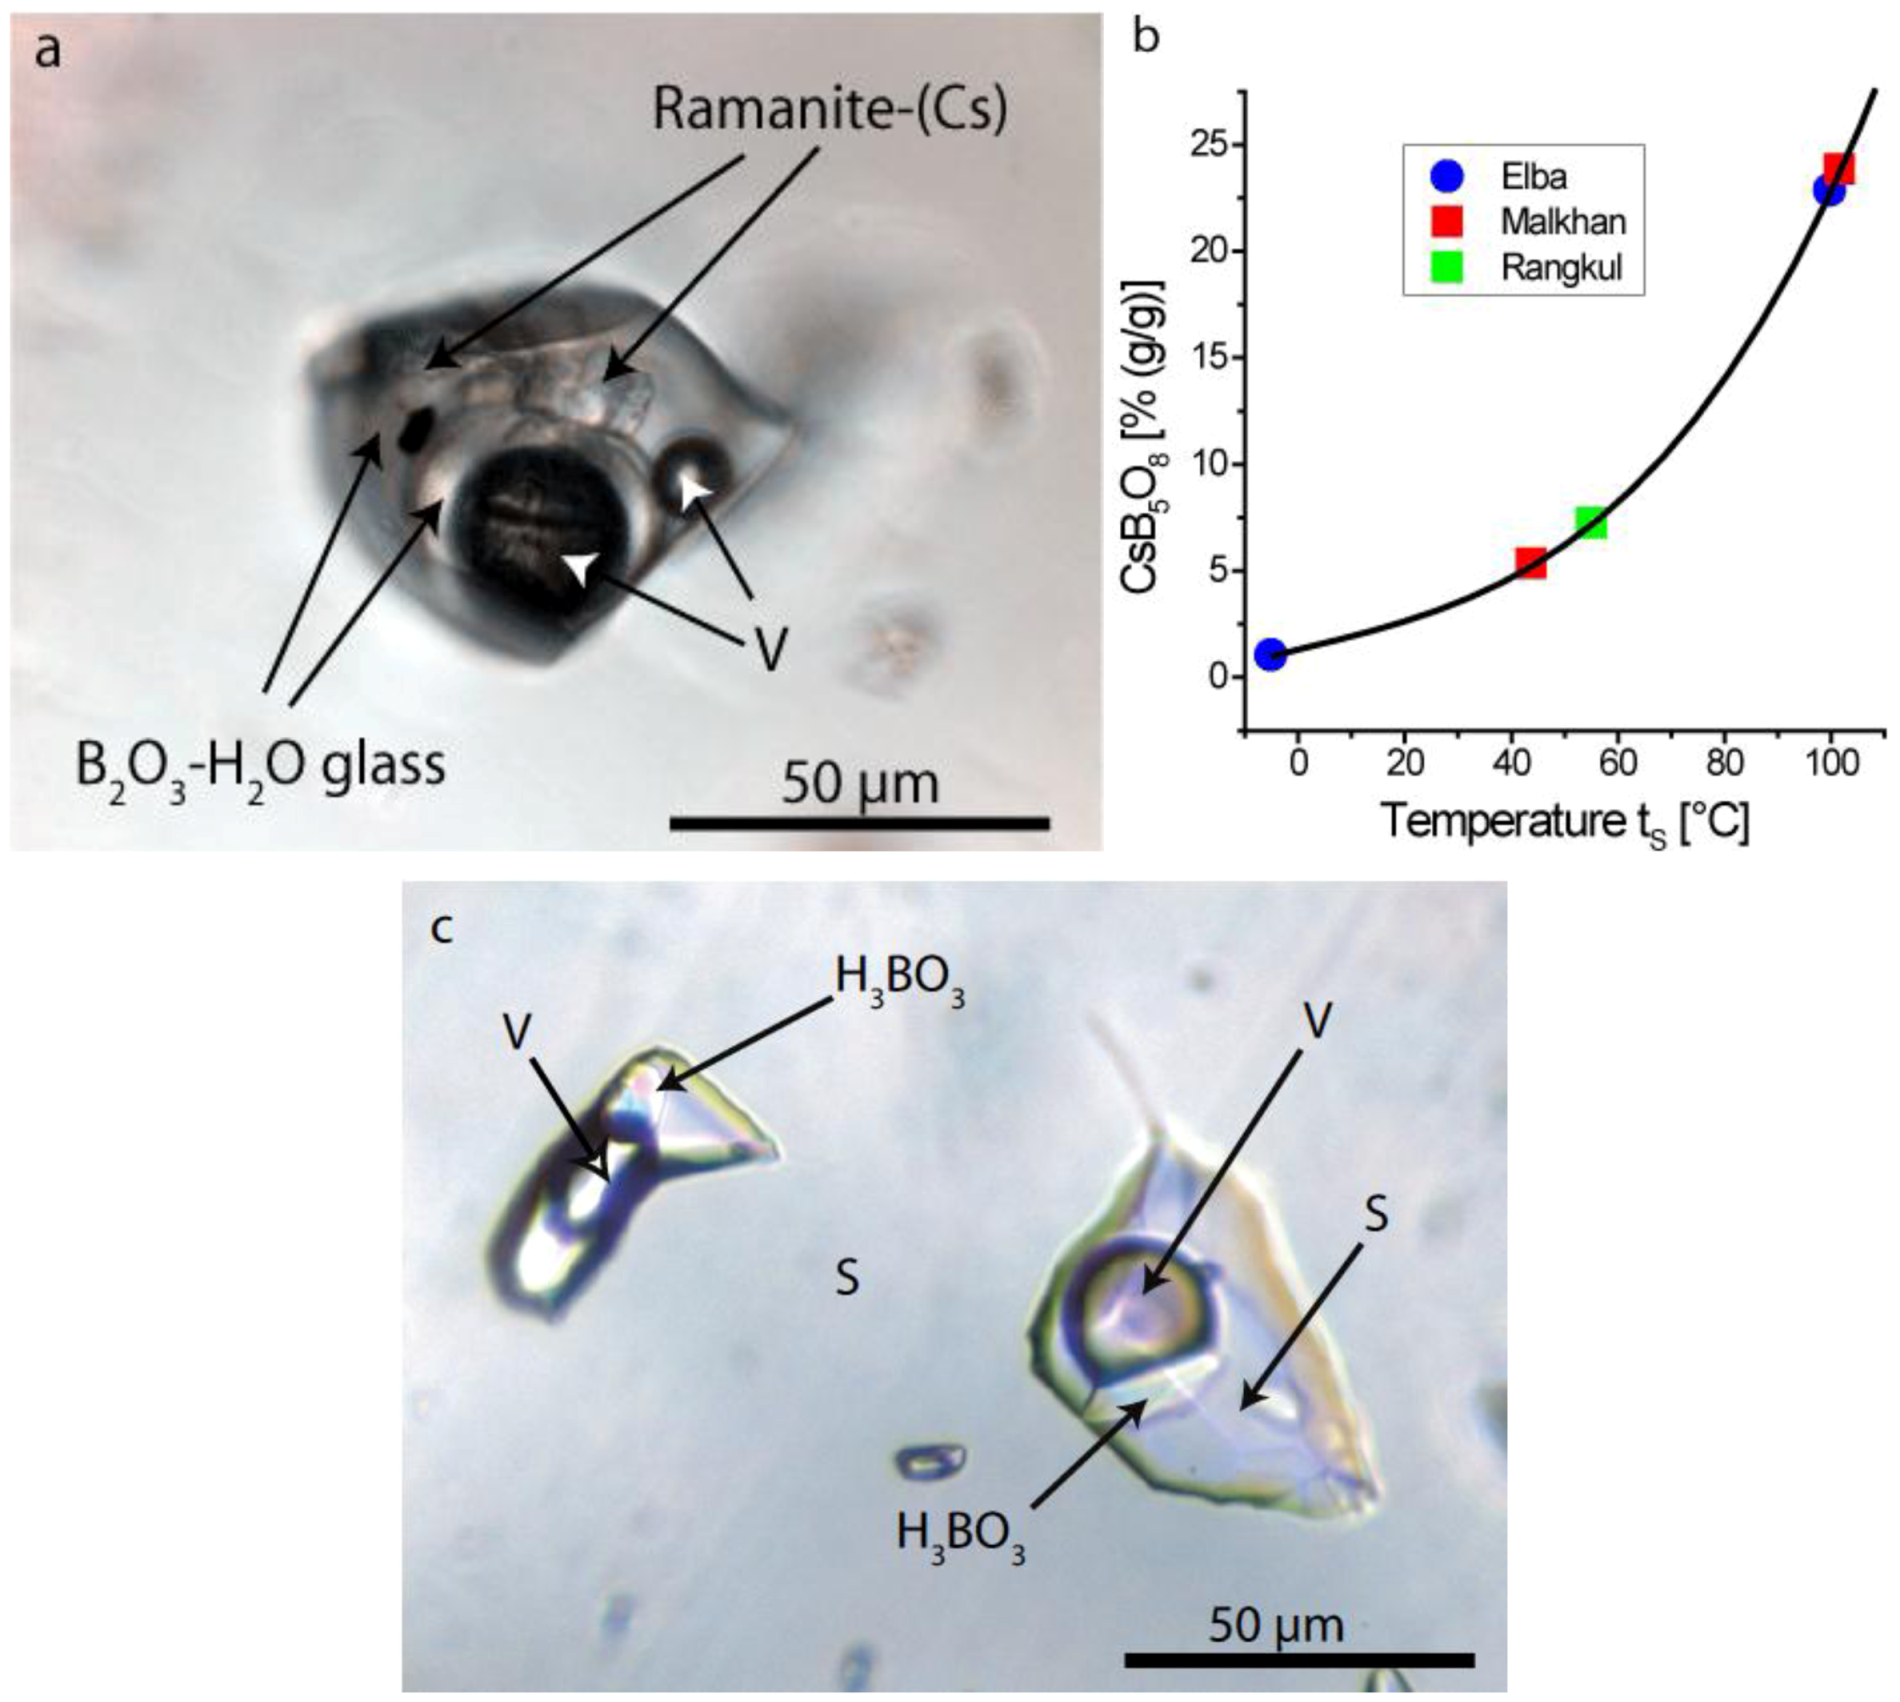
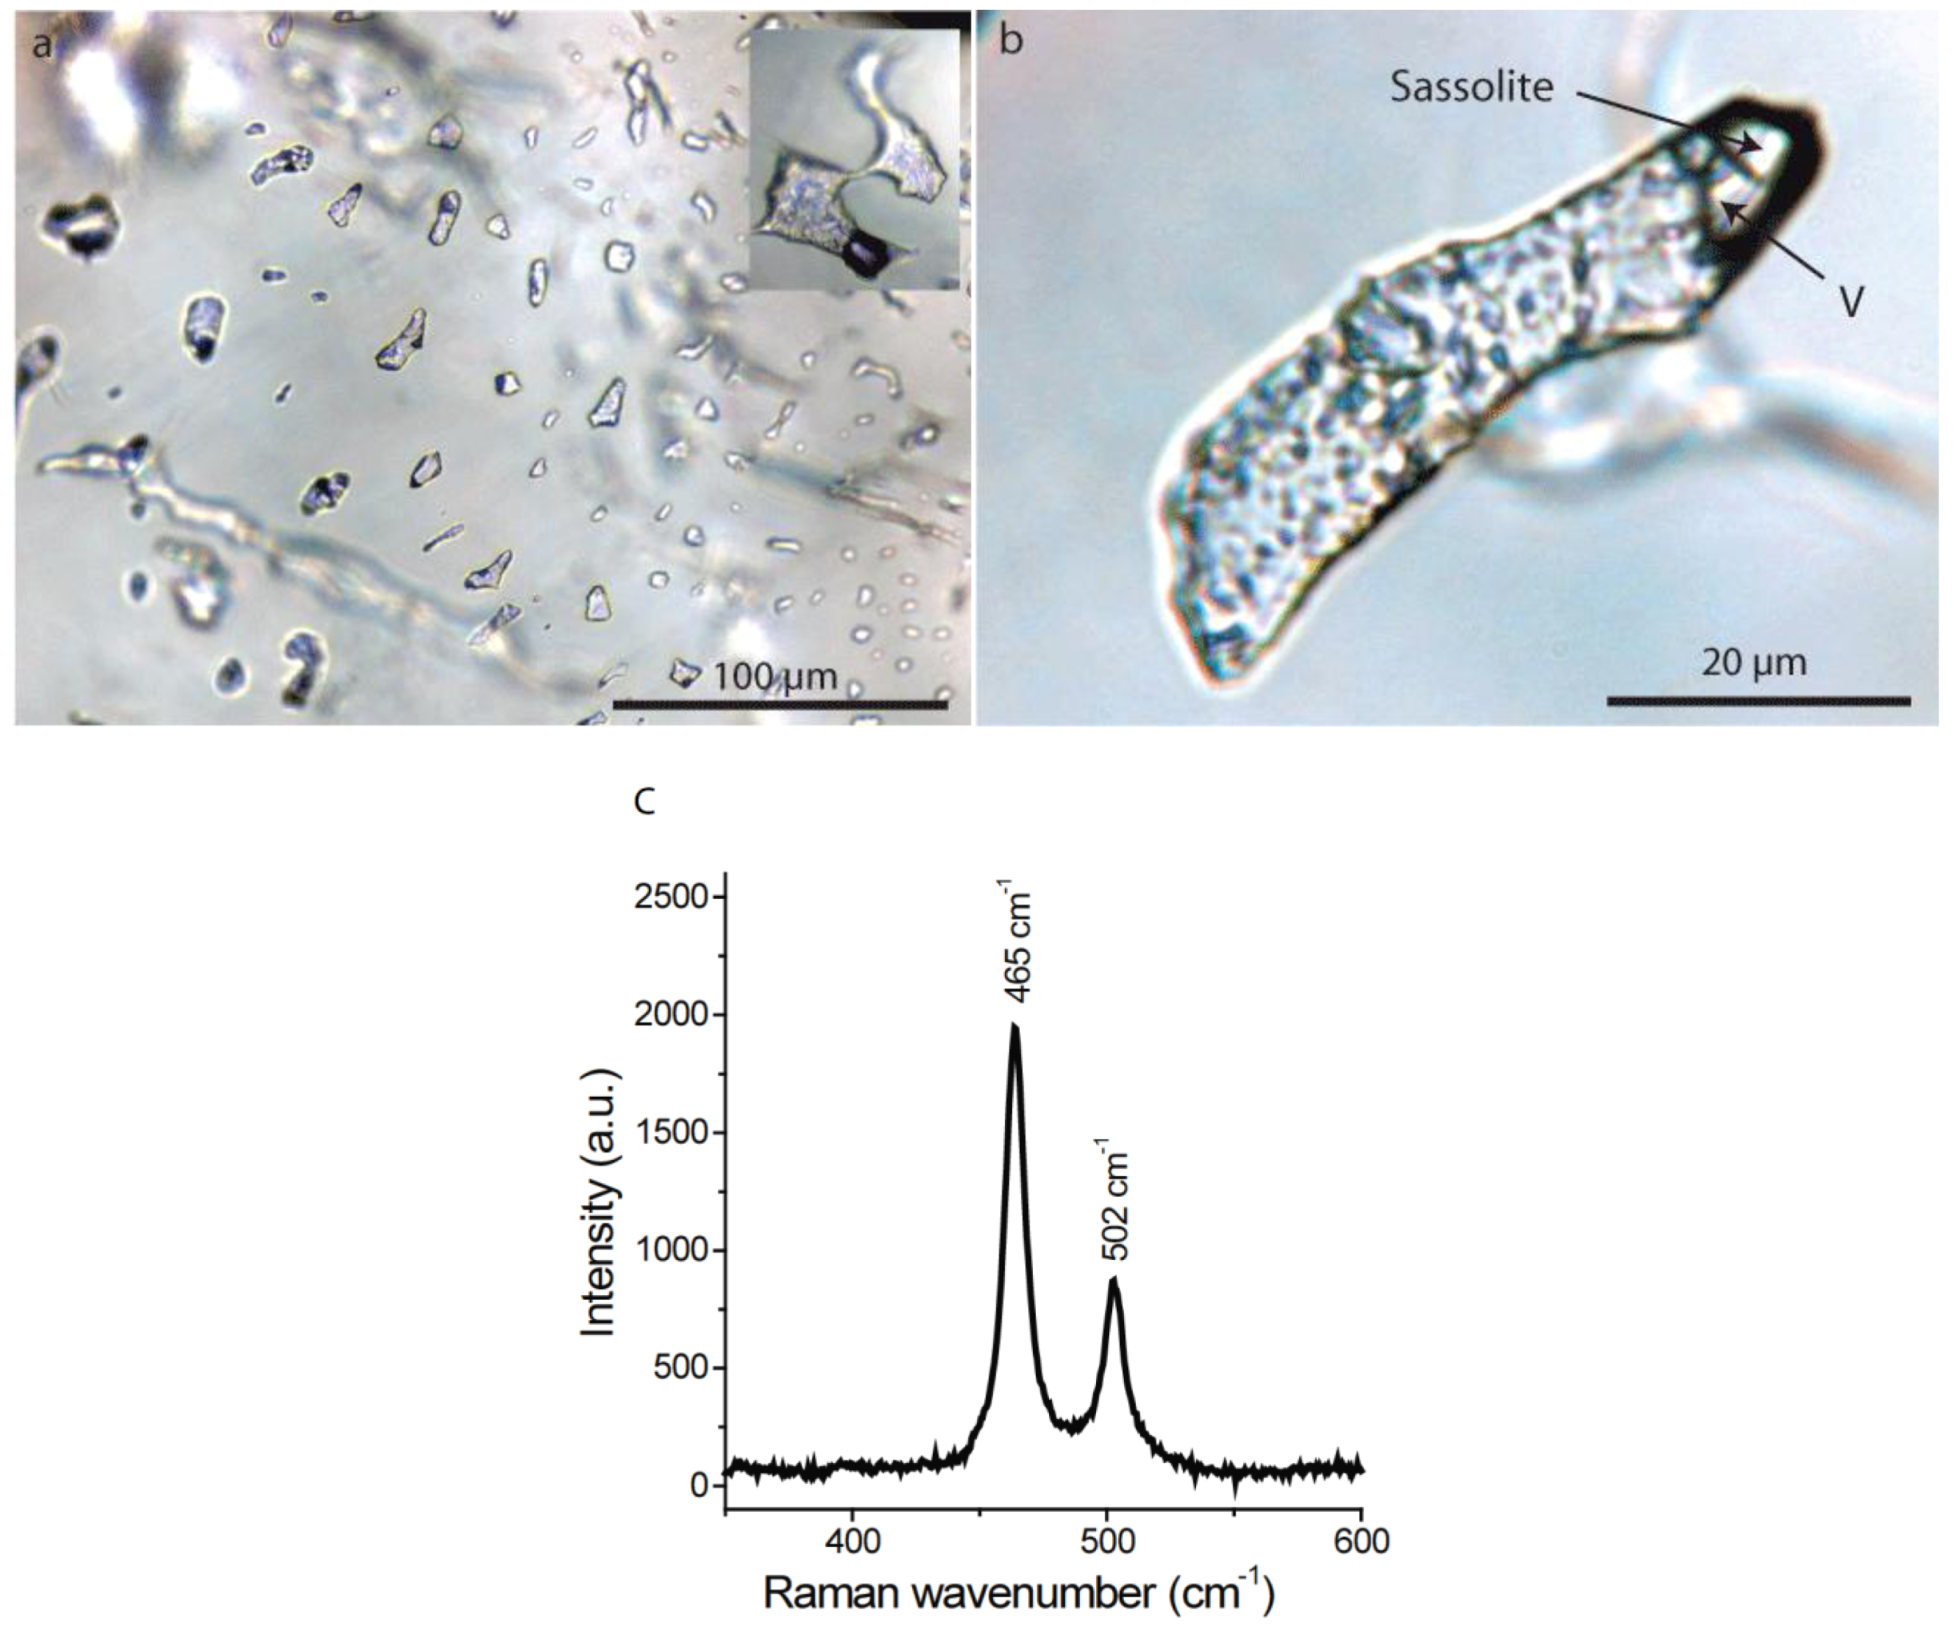
4.2.2. Fluid Inclusions

This fluid inclusion study is restricted to the early state of the pegmatite formation, as we use results obtained from fluid inclusions only to get a general idea of the evolution from the melt- to the fluid-dominated stages, studying the present daughter crystal phases or the composition of the fluid phase with Raman to obtain evidence of the character of the hydrothermal solutions which follows the melt-dominated stages. More detail will be given in another contribution.
Many minerals (quartz, tourmaline, beryl, topaz, danburite, feldspar, hambergite) of the Malkhan pegmatites contain fluid inclusions with high concentrations of boric acid (sassolite), as shown by the strong interference colors of daughter mineral phases. Concentrations increase to very high values, up to 32% (g/g) H3BO3 from vaguely graphic quartz from the Mokhovaya pegmatite. In clearly secondary fluid inclusions the boric acid concentration is relatively low – the melting temperature tS (H3BO3) = 47.4 ± 6.5 °C of typical fluid inclusions gives a boric acid concentration of 9.9 ± 1.5% (g/g).
However, in primary fluid inclusions in a growth zone in a water-clear quartz crystal (sample MX-2) we found the highest boric acid concentration for the Malkhan pegmatites: tS (H3BO3) = 142.5 ± 4.2 °C (n = 18), corresponding to 53.0 ± 3.6% (g/g) H3BO3. These inclusions homogenize at 282.5 ± 13 °C into the liquid phase, which at this temperature has a water-like viscosity, indicated by the rapidly moving particles in these fluid inclusions. Upon cooling, a clear water-bearing low density B2O3 glass forms around the bubble, which contains a mixture of water and metaboric acid HBO2. According to the definition given at the beginning these types of inclusion are type-C melt/fluid inclusions, since in addition to high boron concentrations they contain small amounts of silicate component. After a random amount of time, at most a few of weeks or months, the starting situation (boric acid + solution + vapor) is restored spontaneously, mostly due to silica crystallizing on the inclusion walls.
As well as the generally high boric acid concentration there are often very Cs-rich inclusions, with Cs in the form of the Cs pentaborate mineral, ramanite-(Cs)—see Thomas et al. [28]. By calculations according to Gmelin [29] the melting temperature, tS = 101.8 ± 5.3 °C of 12 inclusions gives a Cs pentaborate concentration of 23.8% (g/g) (see Figure 7) or a Cs concentration of 10.04% (g/g), a 20,000 fold enrichment against the mean content of granitic rocks. Data in the Figure 7b for the Elba pegmatite [28] and Rangkul pegmatite [30] are given for comparison. The second point for the Malkhan pegmatite represents late-stage fluid inclusions for comparision.
The melting temperature of boric acid in the ramanite-(Cs)-rich inclusions is 110.8 ± 4.2 °C, which yield a boric acid concentration of 31.5% (g/g), this value corresponds to an enrichment factor of 21,000 also against the average concentration in the granitic rocks. Here we see clearly that the large enrichment of Cs is coupled directly to that of boron.
In large fluid inclusions in topaz from the same pegmatite which homogenize at about 400 °C we have found beryllonite [NaBePO4] daughter crystals, corresponding to about 10,000 ppm BeO, and also small zabuyelite [Li2CO3] daughter crystals.
Other components, previously not taken into account are alkali carbonate, bicarbonate and sulfate, mostly in late stage solutions, however present already in small amounts in the fluid phase of the type-B melt inclusions. During a reconnaissance screening with Raman spectroscopy (see Thomas and Davidson [24]) we determined carbonate and bicarbonate concentrations in fluid inclusions in some quartz crystals with homogenization temperatures around 350 °C, which correspond to an equivalent concentration of 7.8% (g/g) Na2CO3 and also 3.5% (g/g) SO42−, equivalent to 7.8% (g/g) Na2SO4, in addition to the omnipresent boric acid (~6% (g/g). Typical fluid inclusions in quartz are shown in Figure 7c.

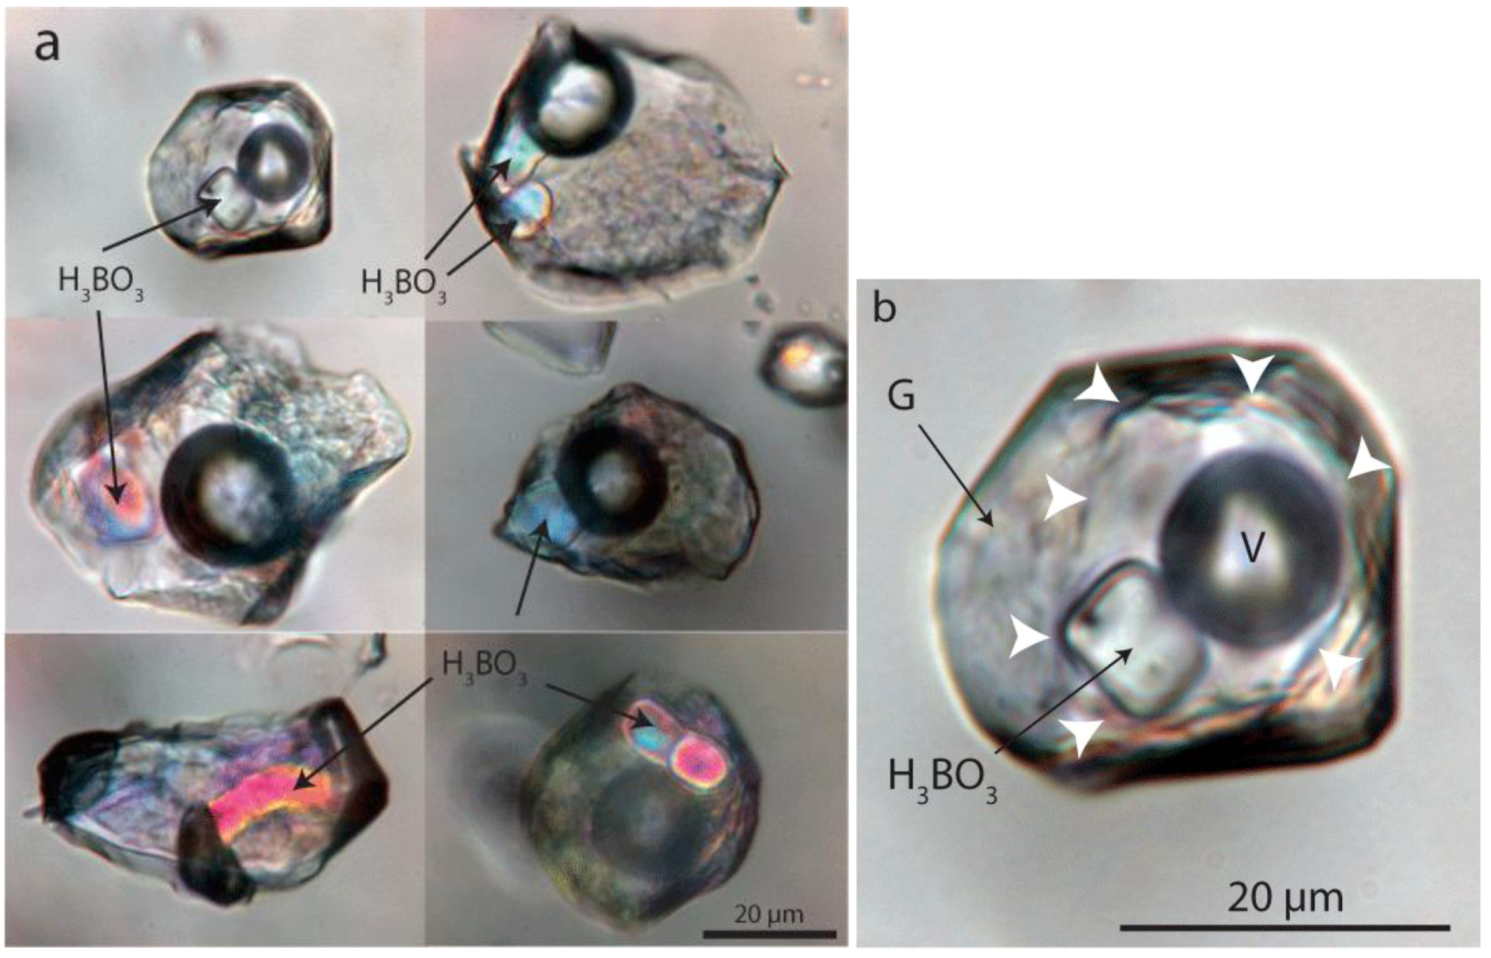
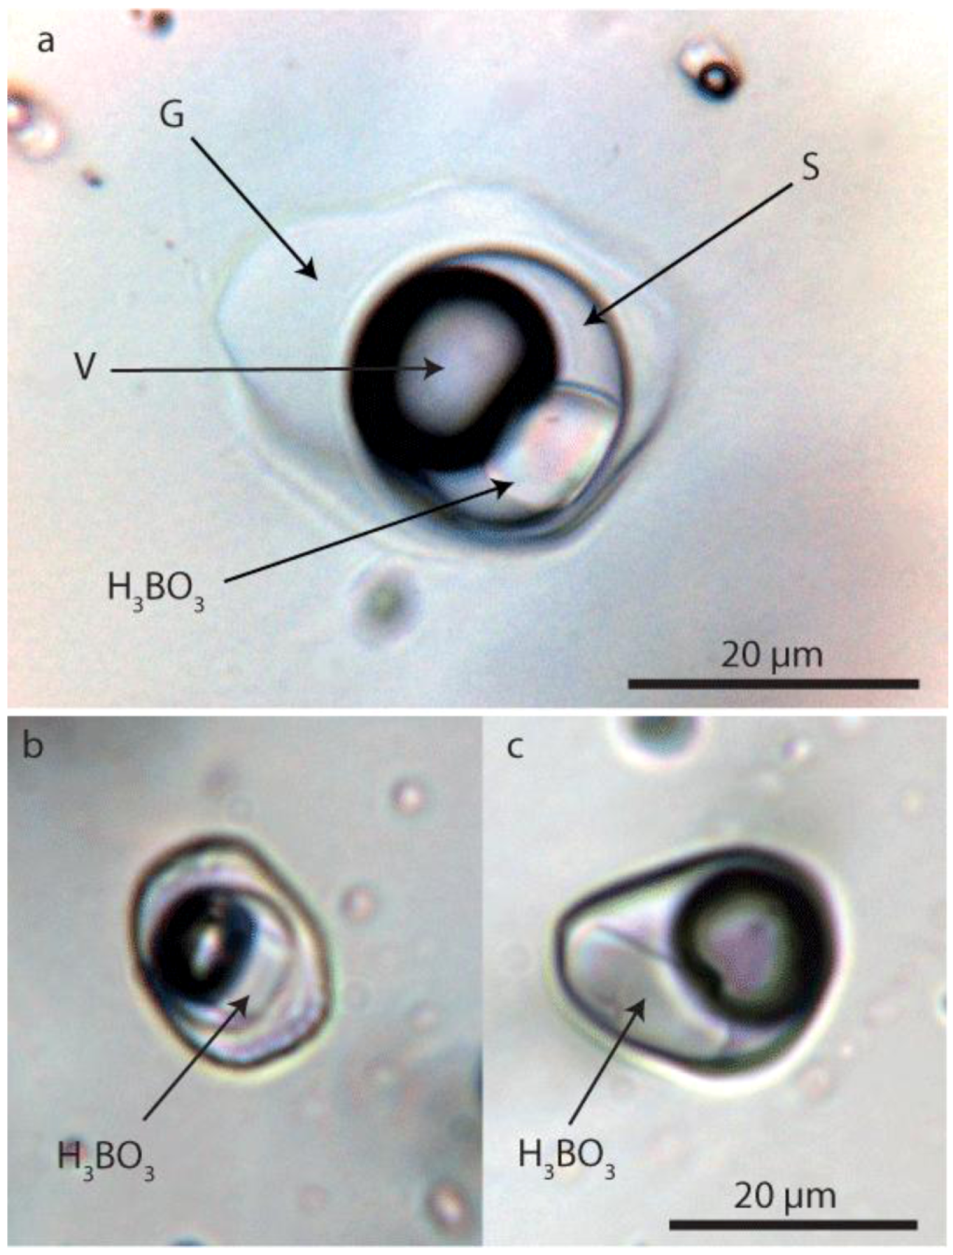
4.2.3. Gel Inclusions

During the course of our studies of inclusions from the Malkhan pegmatite a number of inclusions were found which we interpret as be inclusions which originally trapped a gel or gel-like phase. As an example achroite crystals in miarolitic cavities from the Mokhovaya pegmatite (MX-2) crystallized at a late stage, and contain fluid inclusions as well as numerous inclusions containing a fluid and a large amount of grains of quartz and subordinated cristobalite (Figure 8).
According to Thomas and Davidson [9,31] this inclusion type is interpreted as former gel inclusions, and are quite visibly different from the type-A and -B melt and primary fluid inclusions (see Figure 3, Figure 6, and Figure 7) found in the higher temperature pegmatite minerals. Note, however, after the alteration process the gel inclusions described contain mostly quartz, cristobalite, and molecular water. The Raman spectra (Figure 8c) of some quartz grains in such gel inclusions are characterized by a strong band at 502 cm−1, which is typical for high content of moganite (here ~40%) beside the strong band at 465 cm−1, typical for α-quartz. Moganite has a monoclinic symmetry and is a typical component of chalcedony and agate (see [32]).
Figure 7. Photomicrograph (a) shows a very boric acid and ramanite-(Cs)-rich fluid inclusion in quartz (MX-2). After homogenization the boric acid forms a B2O3-H2O glass as well as metaboric acid and crystals of Cs pentaborate; Graph (b) shows the solubility of ramanite-(Cs) as water-free CsB5O8 with the melting temperature tS (polynomial line 3th order) according to [29]), determined using a calibrated LINKAM THMS 600 heating and freezing stage.The points for Elba, Malkhan and Rangkul represent fluid inclusion with ramanite-(Cs) daughter crystals and their corresponding melting temperature tS. Note the low values for Elba and Malkhan corresponds to late stage fluid inclusions. Photomicrograph; (c) shows typical boric acid-rich fluid inclusion in pegmatite quartz MX-2. S-boric acid-rich solution, V–vapor, H3BO3 boric acid daughter crystals.
Minerals 02 00435 g007
Figure 8. Photomicrographs of gel-like inclusions from the Malkhan pegmatites, (a) gel-like inclusions in low temperature achroite, a colorless variety of tourmaline. The insert is a larger inclusion in the same growth zone, but out of the focal plane; (b) is a single typical gel-like inclusion, primarily containing quartz grains, small amounts of cristobalite and a carbonate- and H3BO3-bearing solution; see also Thomas and Davidson [31, Figure 6]. A Raman spectra in the range 350–600 cm−1 from grains in the inclusion is shown in (c). The labeled bands at 465 cm−1 and 502 cm−1 are the main symmetric stretching-bending modes of α-quartz and moganite respectively.
Minerals 02 00435 g008

5. Discussion

5.1. The Significance of the Gel State in Pegmatite Evolution

Since several papers regarding the Malkhan pegmatite [4,33,34] state that the water-rich melt inclusions are gel or gel-like inclusions, and the gel state represents the determining step for the pegmatite formation, some clarifying comments are necessary. Coexisting type-A and type-B melt inclusions represent conjugate pairs, and are formed during a melt-melt immiscibility process (e.g., Thomas and Davidson [21,24]) and are therefore a clear evidence of magmatic processes, and that silicate melts as molecular liquids represent an important stage. Furthermore, due to the unusually high boron and alkali content the formation of glass from a melt during cooling is favored—B2O3 is a very good glass former. Following rapid quenching the initially optically clear homogeneous water-rich supercooled liquid disassociates into a denser stable or metastable glass and a fluid phase. Raman spectrometric investigations at room temperature demonstrate that glass is a real glass and not a gel. As an example of this the Raman spectra of the melt inclusion glass in the low frequency region from 75 to 1400 cm−1 are typical for aluminosilicate glasses (see McMillan and Wolf [35]). Immediately after quenching from the homogeneous melt stage the metastable water-rich glass is characterized by a very high concentration of the hydroxyl group SiO-H and molecular water indicated by the near symmetric and extreme high Raman band ν1 centered at 3450 cm−1 (see Figure 1 and Figure 3g in Thomas and Davidson [8]). The typical molecular water bands ν3 and 2ν1 are also suppressed (see Ihinger et al. [36]). This metastable glass transforms into a stable glass by escape of molecular water forming the fluid subphase in the melt inclusion system. At trapping temperatures the very water-rich melt system behaves as a near supercritical or supercritical fluid (see Thomas and Davidson [8] Figure 3 therein). Such behavior is untypical for a silica-gel, although the physicochemical behavior of the gel state at high temperature and pressure is poorly constrained—to this see the discussion and references in Xue and Kanzaki [37] and Mattsson et al. [38].
An important demonstration of the melt nature of the contents of the inclusions comes from homogenization and Hydrothermal Diamond Anvil Cell (HDAC) experiments [39]. In these, small melt droplets coalescence into larger homogeneous patches, forming the density-arranged meniscus-like structure of the type-B melt inclusions. Due to the high water and boron content of such melts the glass transition temperature is very low and the material react in a rubber-like fashion and have the tendency to crystallize at low temperatures. Water-rich silicate melt inclusions form a stable glass at quenching, and gel inclusions cannot form any glass at normal trapping conditions—the SiO2 content is too high and the glass-forming components are too low. In the gel state there is also a strong separation of the alkalis from SiO2, forming near-pure SiO2 gels.
However this does not mean that the gel state is completely absent during the whole process, we have observed in our HDAC experiments (Thomas et al. [39]) that a gel state can exist during cooling but only briefly over quite small temperature intervals, and certainly not for the whole process of heating and cooling.
Given the extremely high volume of SiO2 in the gel inclusions relative to the very low concentration of alkalies as carbonates or borates, melting under realistic temperature and pressure conditions is not possible, even if one assumes that the alkalies were consumed by the host (see discussion in Thomas et al. [8]). In the immediate vicinity of these gel-like inclusions there are also fluid inclusions of the same shape with homogenization temperatures around 150 °C. This implies that gel formation is a state restricted both by temperature and in the evolutionary sequence of a given pegmatite and is not the determining step during the pegmatite formation.
The term “gel state” is used by the cited authors and especially by Smirnov et al. [40] sensu lato for hydrosilicate liquids derived experimentally from the simple system Na2O-SiO2-H2O. In this system with more than 15% (g/g) Na2O the formation of gels is plausible, because other glass formers (B2O3, Al2O3) are missing. However simple extrapolation to complex natural systems is unsafe and more spectroscopic and experimental studies are necessary. Note, in all homogenization experiments performed within this study we observed the formation of stable or metastable glasses in the temperature interval between 600 and 750 °C. From our experiments we would not rule out the transitory convergence between the gel and melt states, because we observed in some HDAC experiments which failed due to unexpected pressure escape the transitory formation of a gel-like suspension of melt droplets in the hydrothermal solution during those sudden pressure decreases. Such a mechanism is possible in nature by the sudden change of equilibrium conditions to open system behavior. However, we cannot accept the existence of the gel state as a major or determining stage in pegmatite formation. To this point see Thomas and Davidson [9] and Thomas et al. [39]

5.2. Evolution of the Malkhan Pegmatite

In the paper “The Pegmatite Puzzle” London and Morgan [41] strongly supports the model proposed and developed by the first named author [42]. However London noted that several important pieces of this puzzle are still missing including “when and how pegmatites are derived from their source granites”. The origin of this dilemma results from the assumption that at the beginnings pegmatite-forming melts have the same water content as the granites. According to [41,42] that means a maximum of about 7% (g/g) water in the melt. In two review papers we have shown [8,43] that the water concentration in granite melt is generally <10% (g/g) and for pegmatite-forming melts we have a larger range from 2 to more than 50% (g/g). Furthermore we have demonstrated, using the threshold viscosity of 100 Pa·s for the separation of a pegmatite-forming melt from the granite matrix according to McKenzie [44] that higher water concentrations are necessary. At 800 °C a minimum water concentration of 11.4, at 700 °C ≥ 13.7, and at 550 °C 18.5% (g/g) are necessary. Of course other viscosity reducing species such as boron and fluorine will reduce the amount of water needed.
The goal of the present study is to demonstrate the actual water concentration present at the beginning of pegmatite formation, and for this we used samples mainly from the graphic granite zone of the pegmatites, because these are at the beginning of the pegmatite evolution. By this selection we have also minimized the risk of introducing water (water gain) to the melt inclusion by contact with the late fluid dominated pegmatite stage (see Portnyagin et al. [16]).
Due to the primary high volatile content of the pegmatite-forming melts the coupled processes of crystallization are highly dynamic, which at first glance suggest multi-stage influxes of melts of very different compositions (Zagorsky and Peretyazhko [4], Zagorskii [34]). In the case of the distribution of beryllium in melt inclusions of the Ehrenfriedersdorf pegmatites in the Erzgebirge region, Germany we have demonstrated (Thomas et al. [30]) that such view can easily be misleading. This impression is furthered by hydrothermal re-crystallization processes which are highly effective down to quite low temperatures, especially if the fluids involved are rich in boric acid or alkali carbonate and bicarbonate. From the unheated samples it is very difficult to see a clear relationship between them since they are filled with a confusing mass of solid crystalline material, among them also large amounts of alkali borate hydrates and water-rich fluid and vapor, and because the form and dimension of the inclusions is highly variable (see Figure 9, Figure 10).
Moreover, there are also primary type-C fluid or melt inclusions randomly distributed among the melt inclusions (see Figure 6c). In this case we can assume that SiO2 of the system was deposited on the inclusion wall, producing an apparent fluid inclusion. Sometimes these type-C fluid inclusions are the dominant type. To add to the difficulty there are also inclusions representing the top of the solvus curve, thus being intermediate between type-A and type-B MI. A clear discrimination is only possible after heating under pressure, atmospheric pressure heating stage experiments are unsuitable because the most inclusions decrepitate. Once this is done it is possible to deal with the apparent confusion is to classify the homogenized inclusions by different degrees of filling (i.e., glass/liquid ratios). This allows separation of type-A and type-B inclusions, which reduces the degrees of freedom for such complicated systems, and thus interpretation of the melt inclusion data in the light of melt-melt-fluid immiscibility. In rare cases there are also type-C melt inclusions, very high in boron, forming a B2O3-rich melt at heating to moderate temperatures (Figure 11).
Figure 9. Unheated melt inclusions in quartz of graphic granite from the Oreschnaya pegmatite. Small and relatively flat inclusions (b) to (e) can easily be recognized as such. However, if the inclusion diameter increases to more than 50 µm (or inclusions oriented perpendicular to the viewing plane, as in (a) and (f)) the identification quickly becomes more difficult. The amount of water cannot be estimated from the unheated melt inclusions, because the molecular water distributed between the crystals and the volume of water-bearing minerals is unknown.
Minerals 02 00435 g009
Figure 10. A very water-rich type-B melt inclusion in pegmatite quartz (MX-73-74) containing a sassolite daughter crystal, boric-acid rich solution—S, a vapor phase—V and small amounts of silicate crystals—Sil.
Minerals 02 00435 g010
Figure 11. Two boron-rich fluid or melt inclusions of type-C in quartz from the Mokhovaya pegmatite (a) before heating and (b) after heating to 310°C using a microscope heating stage. during heating to the homogenization temperature (tH = 282.5 ± 13°C) the boric acid melted incongruently at about 169°C into metaboric acid HBO2 and a H2O-rich B2O3 melt, which attached to the vapor bubble on cooling. Note, at the homogenization temperature, small suspended particles in the homogeneous fluid show a rapid movement inside of the inclusion, demonstrating the water-like extremely low viscosity. M—H2O-bearing B2O3 melt; S—boric acid-rich solution, V—vapor.
Minerals 02 00435 g011
From the microprobe results it follows that some elements, especially Cs and B, show broadly the multi-stage enrichment of these elements from the granite, via the melt-dominated pegmatite stage, to the extreme enrichment in the co-genetic type-C fluid inclusions by at least an overall factor of 20,000.
The general picture of the type-A-B-C inclusions in quartz of the early graphic granite of the Malkhan pegmatites together with the inclusions of secondary origin in the granites suggest that the primary pegmatite-forming media was an extremely water- and boron-rich melt or perhaps more correctly a supercritical fluid with a very low viscosity, a large transport capacity for alumosilicates, and a very high infiltration capability. Furthermore, our study of the melt inclusions demonstrates clearly that the main processes during the magmatic dominated stages are connected with melts and extremely water-rich melts or silicate-rich fluids (Audétat and Keppler [45]) and not by gels or gel-like material in the classic sense.
However, given the increase of boric acid and some anions (CO32−, HCO3, SO42−) in the developing fluids there is an increased tendency for the gel state to form, although only at later stages of pegmatite evolution, and low temperature conditions. Given the solubility of silica in such gels they may provide a mechanism by which enormous mass of silica can be transported and deposited in the quartz core of the pegmatite.

Acknowledgements

We would like to thank Dieter Rhede and Oona Appelt from the GFZ Potsdam for the help with microprobe boron analyses and to Victor Zagorsky and Sergey Smirnov for difficult to obtain literature regarding Russian granite pegmatites, and also for valuable discussion of several aspects of the pegmatite genesis. We are grateful to two anonymous reviewers for their useful and constructive comments.

References

  1. Peretyazhko, I.S.; Prokof’ev, V.Y.; Zagorskii, V.E.; Smirnov, S.Z. Role of boric acids in the formation of pegmatite and hydrothermal minerals: Petrologic consequences of sassolite (H3BO3) discovery in fluid inclusions. Petrology 2000, 8, 214–237. [Google Scholar]
  2. Smirnov, S.Z.; Peretyazhko, I.S.; Prokof’ev, V.Y.; Zagorskii, V.E.; Shebanin, A.P. The first finding of sassolite (H3BO3) in fluid inclusions in minerals. Russ. Geol. Geophys. 2000, 41, 193–205. [Google Scholar]
  3. Zagorsky, V.E.; Peretyazhko, I.S.; Shmakin, B.M. Miarolitic Pegmatites. In Granitic Pegmatites; Shmakin, B.M., Makagon, V.N., Eds.; Nauka: Novosibirsk, Russia, 1999; Volume 3, p. 488. [Google Scholar]
  4. Zagorsky, V.Y.; Peretyazhko, I.S. The Malkhan gem tourmaline deposit in Transbaikalia, Russia. Miner. Obs. 2008, 13, 4–39. [Google Scholar]
  5. Badanina, E.V.; Thomas, R.; Syritso, L.F.; Veksler, I.V.; Trumbull, R.B. High boron concentration in a Li-F granitic melt. Dokl. Earth Sci. 2003, 390, 529–532. [Google Scholar]
  6. Badanina, E.V.; Thomas, R.; Syritso, L.F. Evolution of silicate melts during formation of the granite-pegmatite system of the Malkhany pegmatite field, Russia. Geochim. Cosmochim. Acta Suppl. 2005, 69, 240. [Google Scholar]
  7. Thomas, R.; Badanina, E.; Veksler, I. Extreme boron enrichment in granitic melt revealed by melt inclusions from Malkhan pegmatite, Russia. In Proceedings of the 8th Pan-American Current Research on Fluid Inclusions Meeting (PACROFI VIII), Halifax, Nova Scotia, Canada, 21-26 July 2002.
  8. Thomas, R.; Davidson, P. Water in granite and pegmatite-forming melts. Ore Geol. Rev. 2012, 46, 32–46. [Google Scholar] [CrossRef]
  9. Thomas, R.; Davidson, P. Evidence of a water-rich silica gel state during the formation of a simple pegmatite. Mineral. Mag. 2012, 76. in press. [Google Scholar]
  10. Roedder, E. Fluid Inclusions. In Reviews in Mineralogy; Ribbe, P.H., Ed.; Mineralogical Society of America: Washington, DC, USA, 1984; Volume 12, p. 644. [Google Scholar]
  11. Zagorsky, V.E.; Peretyazhko, I.S. First 40Ar/39Ar age determination on the Malkhan granite-pegmatite system: Geodynamic implications. Dokl. Earth Sci. 2010, 430, 172–175. [Google Scholar] [CrossRef]
  12. Zagorsky, V.Y.; Peretyazhko, I.S. The Malkhan granite-pegmatite system. Dokl. Earth Sci. 2006, 406, 132–135. [Google Scholar] [CrossRef]
  13. Thomas, R.; Förster, H.-J.; Heinrich, W. The behaviour of boron in a peraluminous granite-pegmatite system and associated hydrothermal solutions: A melt and fluid inclusion study. Contrib. Mineral. Petrol. 2003, 144, 457–472. [Google Scholar] [CrossRef]
  14. Thomas, R. Estimation of the viscosity and the water content of silicate melts from meltinclusion data. Eur. J. Mineral. 1994, 6, 511–535. [Google Scholar]
  15. Massare, D.; Métrich, N.; Clocchiatti, R. High-temperature experiments on silicate melt inclusions in olivine at 1 atm: Inference on temperature of homogenization and H2O concentration. Chem. Geol. 2002, 183, 87–98. [Google Scholar] [CrossRef]
  16. Portnyagin, M.; Almeev, R.; Matveev, S.; Holtz, F. Experimental evidence for rapid water exchange between melt inclusions in olivine and host magma. Earth Planet. Sci. Lett. 2008, 272, 541–552. [Google Scholar] [CrossRef]
  17. Severs, M.J.; Azbej, T.; Thomas, J.B.; Mandeville, C.W.; Bodnar, R.J. Experimental determination of H2O loss from melt inclusions during laboratory heating: Evidence from Raman spectroscopy. Chem. Geol. 2007, 237, 358–371. [Google Scholar] [CrossRef]
  18. McGee, J.J.; Slack, J.F.; Herrington, J.R. Boron analysis by electron microprobe using MoB4C layered synthetic crystals. Am. Mineral. 1991, 76, 681–684. [Google Scholar]
  19. Thomas, R. Determination of water contents of granite melt inclusions by confocal laser Raman microprobe spectroscopy. Am. Mineral. 2000, 85, 868–872. [Google Scholar]
  20. Thomas, R.; Kamenetsky, V.S.; Davidson, P. Laser Raman spectroscopic measurements of water in unexposed glass inclusions. Am. Mineral. 2006, 91, 467–470. [Google Scholar] [CrossRef]
  21. Thomas, R.; Webster, J.D.; Heinrich, W. Melt inclusions in pegmatite quartz: Complete miscibility between silicate melts and hydrous fluids at low pressure. Contrib. Mineral. Petrol. 2000, 139, 394–401. [Google Scholar] [CrossRef]
  22. Sun, Q.; Qin, C. Raman OH stretching band of water as an internal standard to determine carbonate concentrations. Chem. Geol. 2011, 283, 274–278. [Google Scholar] [CrossRef]
  23. Oliver, B.G.; Davis, A.R. Vibrational spectroscopic studies of aqueous alkali metal bicarbonate and carbonate solutions. Can. J. Chem. 1973, 51, 698–702. [Google Scholar] [CrossRef]
  24. Thomas, R.; Davidson, P. The application of Raman spectroscopy in the study of fluid and melt inclusions. Z. Dt. Ges. Geowiss. 2012, 163, 113–126. [Google Scholar]
  25. Thomas, R.; Webster, J.D.; Rhede, D.; Seifert, W.; Rickers, K.; Förster, H.-J.; Heinrich, W.; Davidson, P. The transition from peraluminous to peralkaline granitic melts: Evidence from melt inclusions and accessory minerals. Lithos 2006, 91, 137–149. [Google Scholar] [CrossRef]
  26. Thomas, R. Determination of the H3BO3 concentration in fluid and melt inclusions in granite pegmatites by laser Raman microprobe spectroscopy. Am. Mineral. 2002, 87, 56–68. [Google Scholar]
  27. Peretyazhko, I.S.; Smirnov, S.Z.; Thomas, V.G.; Zagorsky, V.Y. Gels and melt-like gels in high-temperature endogeneous mineral formation. In Metallogeny of the Pacific Northwest: Tectonics, Magmatism and Metallogeny of Active Continental Margin; Khanchuk, A.I., Ed.; Dalnauka: Vladivostok, Russia, 2004; pp. 306–309. [Google Scholar]
  28. Thomas, R.; Davidson, P.; Hahn, A. Ramanite-(Cs) and ramanite-(Rb): New cesium and rubidium pentaborate tetrahydrate minerals identified with Raman spectroscopy. Am. Mineral. 2008, 93, 1034–1042. [Google Scholar] [CrossRef]
  29. Gmelin, L. Gmelins Handbuch der Anorganischen Chemie System-No.25 Caesium; Springer: Berlin, Germany, 1938; p. 268. [Google Scholar]
  30. Thomas, R.; Webster, J.D.; Davidson, P. Be-daughter minerals in fluid and melt inclusions: Implications for the enrichment of Be in granite-pegmatite systems. Contrib. Mineral. Petrol. 2011, 161, 483–495. [Google Scholar] [CrossRef]
  31. Thomas, R.; Davidson, P. Water and melt/melt immiscibility, the essential components in the formation of pegmatites; evidence from melt inclusions. Z. geol. Wiss. Berl. 2008, 36, 347–364. [Google Scholar]
  32. Götze, J.; Nasdala, L.; Kleeberg, R.; Wenzel, M. Occurence and distribution of “moganite” in agate/chalcedony: A combined micro-Raman, Rietveld, and cathodoluminescence study. Contrib. Mineral. Petrol. 1998, 133, 96–105. [Google Scholar] [CrossRef]
  33. Peretyazhko, I.S.; Zagorskii, V.E.; Smirnov, S.Z.; Mikhailov, M.Y. Conditions of pocket formation in the Oktyabrskaya tourmaline-rich gem pegmatite (the Malkhan field, Central Transbaikalia, Russia). Chem. Geol. 2004, 210, 91–111. [Google Scholar] [CrossRef]
  34. Zagorskii, V.Y. Malkhan gem tourmaline deposit: Types and nature of miaroles. Dokl. Earth Sci. 2010, 431, 314–317. [Google Scholar] [CrossRef]
  35. McMillan, P.F.; Wolf, G.H. Vibrational spectroscopy of silicate liquids. Rev. Mineral. 1995, 32, 247–315. [Google Scholar]
  36. Ihinger, P.D.; Hervig, R.L.; McMillan, P.F. Analytical methods for volatiles in glasses. Rev. Mineral. 1994, 30, 67–121. [Google Scholar]
  37. Xue, X.; Kanzaki, M. Dissolution mechanisms of water in depolymerized silicate melts: Constraints from 1H and 29Si NMR spectroscopy and ab initio calculations. Geochim. Cosmochim. Acta 2004, 68, 5027–5057. [Google Scholar] [CrossRef]
  38. Mattson, J.; Wyss, H.M.; Fernandez-Nieves, A.; Miyazaki, K.; Hu, Z.; Reichmann, D.R.; Weitz, D.A. Soft colloids make strong glasses. Nature 2009, 462, 83–86. [Google Scholar]
  39. Thomas, R.; Davidson, P.; Schmidt, C. Extreme alkali bicarbonate- and carbonate-rich fluid inclusions in granite pegmatite from the Precambrian Rønne granite, Bornholm Island, Denmark. Contrib. Mineral. Petrol. 2011, 161, 315–329. [Google Scholar] [CrossRef]
  40. Smirnov, S.Z.; Thomas, V.G.; Kamenetsky, V.S.; Kozmenko, O.A.; Large, R.R. Hydrosilicate liquids in the system Na2O-SiO2-H2O with NaF, NaCl and Ta: Evaluation of their role in ore and mineral formation at high T and P. Petrologiya 2012, 20, 300–314. [Google Scholar]
  41. London, D.; Morgan, G.B., VI. The pegmatite puzzle. Elements 2012, 8, 263–268. [Google Scholar] [CrossRef]
  42. London, D. Pegmatites; Mineralogical Association of Canada: Ottawa, Canada, 2008. [Google Scholar]
  43. Thomas, R.; Davidson, P.; Beurlen, H. The competing models for the origin and internal evolution of granitic pegmatites in the light of melt and fluid inclusion research. Mineral. Petrol. 2012, 106, 55–73. [Google Scholar]
  44. McKenzie, D. The extraction of magma from the crust and mantle. Earth Planet. Sic. Lett. 1985, 74, 81–91. [Google Scholar] [CrossRef]
  45. Audétat, A.; Keppler, H. Viscosity of fluids in subduction zones. Science 2004, 303, 513–516. [Google Scholar]

