1. Introduction
The “paragenetic sequence” diagram has been the hallmark of ore-textural investigations for more than a century, and it has proven useful to illustrate time relationships in ore-forming events. Such evidence as replacement textures, cross-cutting relationships, exsolution features, and crustification sequences have been used to deduce chronology during ore formation. Some of these evidences perhaps are more ambiguous than others. However, it is a central tenet of geology that the deposition of subsequent layers of geologic materials is the ultimate tool in deciphering the chronology of events. In ores, nowhere is this principle illustrated better than in banded bonanza epithermal ores, where successive layers of ore and gangue minerals coat fracture (vein) walls. Investigations of some of these Tertiary banded bonanza ores in western USA (
Figure 1) reveal some universal features in these ores besides their rich endowments of precious metals at the hand-sample scale: (1) fine-grained quartz (and locally opal) textures implying former presence of amorphous silica precursors or chalcedony in addition to direct quartz precipitation; (2) they are commonly Se-rich and locally contain ubiquitous Ag-Se(±S) phases; (3) sulfide and sulfosalts in intimate association with precious- metal minerals at the hand-sample scale are typically much less abundant than electrum+naumannite; and (4) they all have some textural evidence of silica and Au-Ag phases being transported and deposited in the bonanza ore setting as small particles [
1,
2,
3,
4]. A similar interpretation perhaps can be made from Hishikari, Kushikino, and Koryu epithermal deposits in Japan [
5,
6,
7,
8,
9,
10].
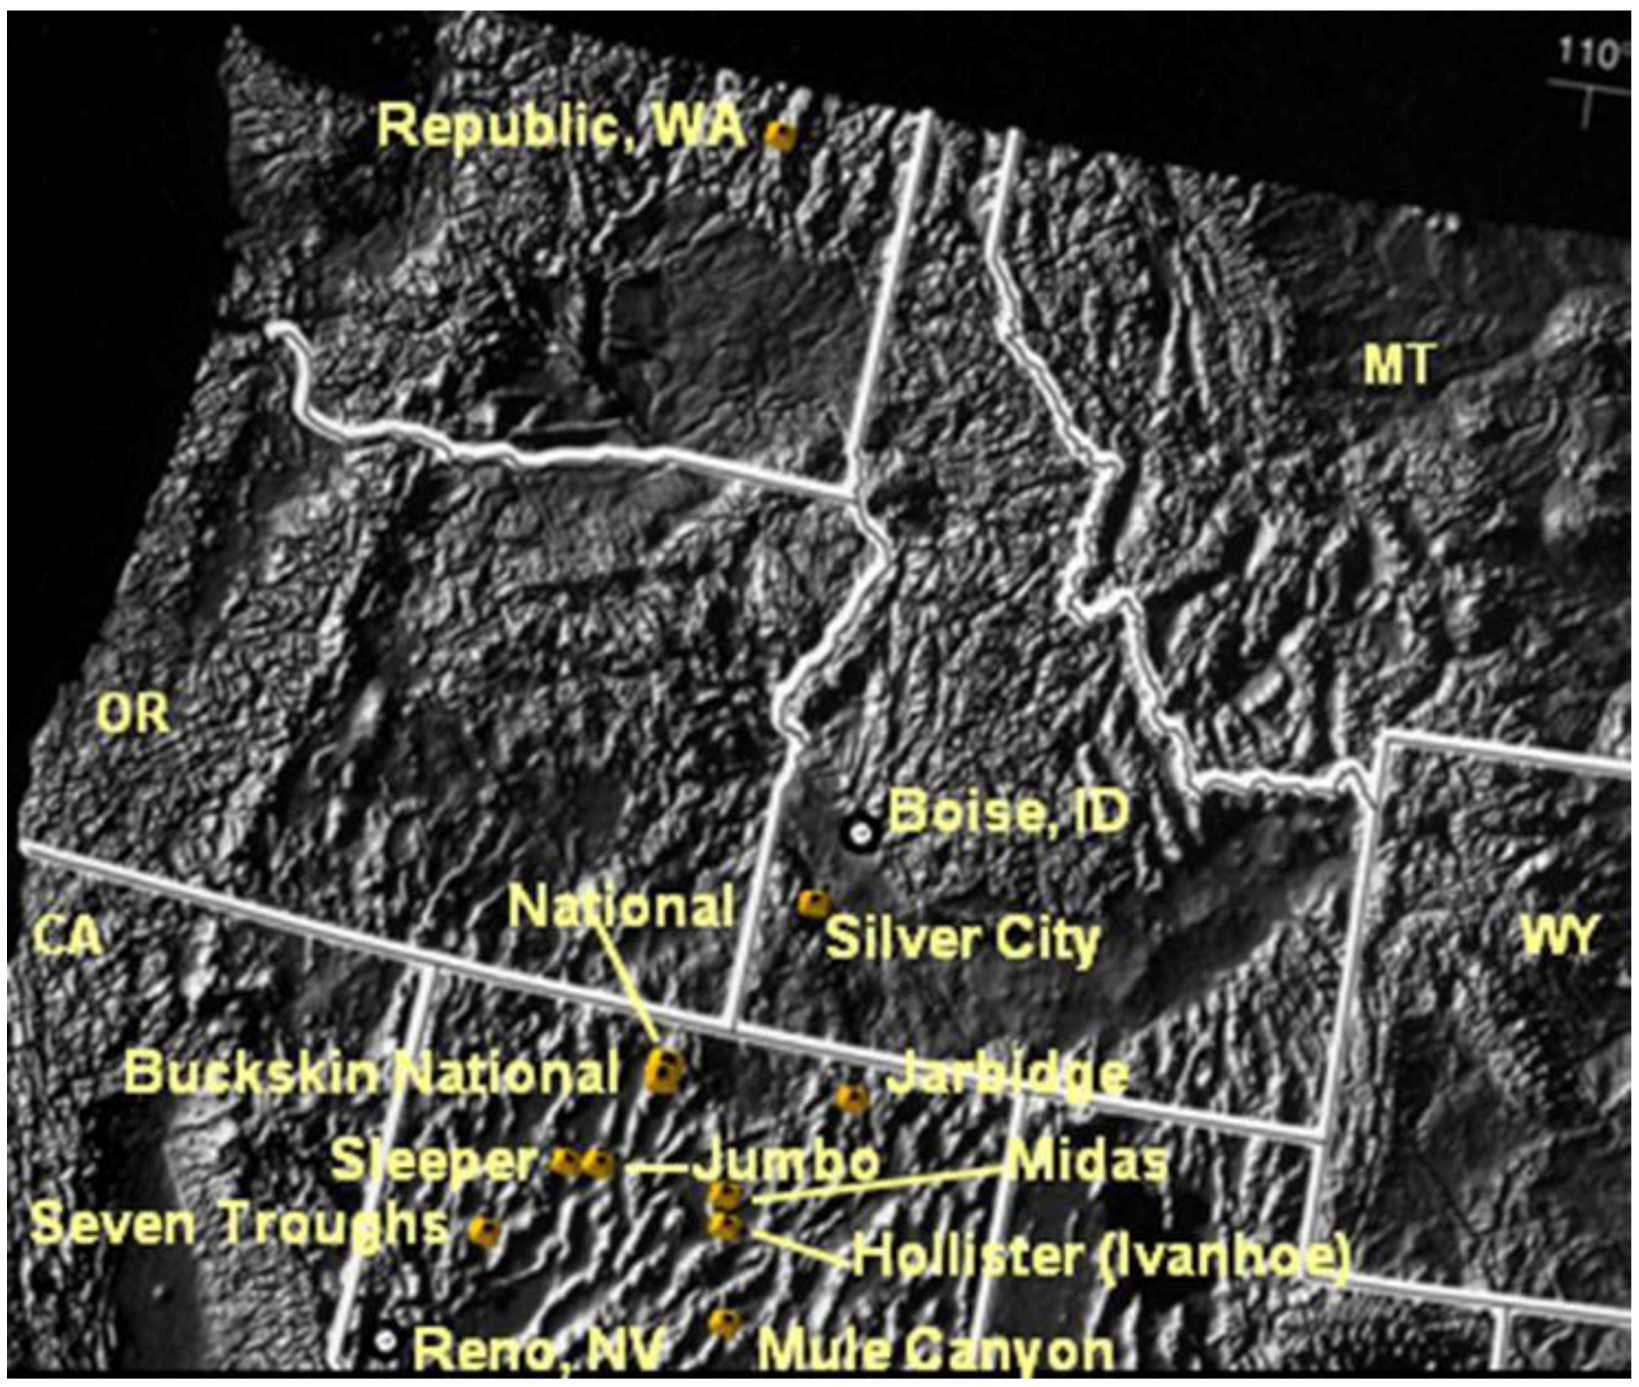
Figure 1.
Location map of Tertiary low sulfidation (LS) epithermal deposits (and/or districts) exhibiting evidence of nanoparticles in bonanza ores.
Figure 1.
Location map of Tertiary low sulfidation (LS) epithermal deposits (and/or districts) exhibiting evidence of nanoparticles in bonanza ores.
Textural evidence [
1,
2] from the bonanza low-sulfidation Sleeper deposit in Nevada supported the concept that gold (and silica) colloids played an important role in forming extraordinary high-grade Au-Ag ores there. Earlier, Lindgren [
11] had made a similar proposal for extremely high-grade ores from the National Deposit, National District, Nevada which he had studied previously [
12]. Saunders [
2] also showed that naumannite formed dendritic growths associated with colloidal silica at the Sleeper deposit, and later Saunders
et al. [
3] proposed that naumannite (Ag
2Se) also formed colloids in bonanza Se-rich epithermal deposits of western USA. This conclusion is supported by naumannite textures elsewhere in Nevada, such as at Midas [
13], Buckskin National [
3,
4,
14], Seven Troughs [
14], and Republic (Washington) [
4], and perhaps the above-mentioned Japanese deposits.
Textures often are notoriously difficult to interpret in the absence of controlled experiments e.g., [
15], but the primary textural evidence described below for episodic introduction of metals into bonanza ores is generally unambiguous given the banded crustification textures of the ores described. However, in terms of colloid formation, there is some ambiguity given the propensity of colloids to (re)crystallize over time, as has been well documented for silica in the inversion of opal to chalcedony and quartz [
16,
17]. Saunders
et al. [
4] proposed two different textures that support nanoparticle formation in epithermal ores: (1) evidence of physical transport of nanoparticles by ore-forming fluids, which Saunders
et al. [
4] “sluice box” textures; and (2) a specific colloid aggregation texture which we call “fractal dendrites”. The term dendrite has different connotations to different users. Saunders
et al. [
3] differentiated between “dendritic” gold crystals that have a “feathery” appearance yet where dendrite branching was controlled by internal crystal structure,
versus a 3-dimensional chaotic growth pattern which they interpreted to form by colloid aggregation. The latter follow a fractal growth pattern caused by efficient sticking of the metal colloids [
18,
19] and has the general appearance of a conifer tree or perhaps even sage brush [
20] and have been called “fractal dendrites” to distinguish these features from more crystalline dendrites. Irrespective of their appearance, they formed as positive “topographic” features on the vein walls and point toward the center of the vein (“younging” direction [
2,
3,
17]).
Saunders [
1,
2] proposed that electrum and silica colloids at the Sleeper deposit nucleated as a consequence of H
2S loss in the boiling zone in the shallow epithermal system. The more recent recognition that naumannite also forms ubiquitous colloids in the bonanza epithermal ores of western USA perhaps argues against a simple boiling model: If the loss of H
2S leads to electrum particle nucleation during boiling, it would seem that a similar loss in H
2Se would mitigate against naumannite colloid formation in the same zone. Further, recent reconnaissance Pb-isotopic investigations by Kamenov
et al. [
21] suggest that electrum and naumannite have “locked in” a deep, primitive, mafic-magma Pb-isotope signature. Further, more recent hypotheses regarding “vapor-phase” transport of metal(loid)s up from the magmatic environment to the epithermal setting [
22,
23,
24] beg the question that perhaps some precious-metal mass transport to the epithermal setting might be accomplished by nano-particles. Thus, the purpose of this note is to document some ore textures in a few admittedly non-typical, very high-grade epithermal deposits to pose the possibility that these textures might be the result of deep ore-forming processes, and that evidence of those processes might be preserved in the shallow bonanza ores.
A colloid is small particle (crystalline, organic, or amorphous) generally thought of as an entity that is larger than ~10−9 m and a nanoparticle is typically considered to have a size less than 10−7 m. Because atoms are at the scale of ~10−10 m, the “nano” realm only comprises about 3 orders of magnitude in size. Although colloids have size implications and their diameters can overlap with nanoparticles, colloids have the added constraint that they must be dispersed in a liquid. In hydrothermal settings, it is proposed here that the term nanoparticle should be used instead of “colloid” as there is no evidence that the particles are either dispersed in or transported by a true liquid (more likely, a super-critical fluid). However, from a materials engineering standpoint, the 10−7 m threshold is the approximate size below which nanoparticles may have different physical and chemical “surface” properties than the bulk solids, and thus might have some interesting industrial applications.
From a geologic standpoint, what might be their significance? The average pore diameter in shale or the width of a microfracture in crystalline rock is on the order of 10
−6 m e.g., [
25] and thus a nanoparticle is smaller than that by ~1–3 orders of magnitude and thus can be transported through these solids. Although we typically think of shale as an “aquitard” in hydrogeology, fluids can flow through essentially any kind porous media. Fluid flow is a function of not only a function of the intrinsic permeability of the geologic material, but also of viscosity and density of the fluid itself [
25].
SEM images of electrum surfaces from fractal dendrites from the Sleeper deposit, Nevada [
2] indicate that if they formed by aggregation of small particles, then the particles were ~10
−7 to 10
−8 m in size. Thus in the newer terminology those “fractal” dendrites were made from electrum nanoparticles as opposed to colloids. Others have interpreted the origin of “fractal” dendrites in bonanza epithermal gold ore to be the result of diffusion of gold in silica gels [
26]. Do gold (or naumannite) nanoparticles have different physical properties than gold colloids, and do nanoparticles of gold as they are transported up? Clearly some experimental investigations might shed some light on these questions. In gold sols (a stable aqueous suspension of colloid/nanoparticles) gold nanoparticles repel each other upon mutual approach at room temperature (preventing “sticking”), which is the expected behavior of gold colloids with negatively-charged surfaces [
1]. Irrespective of whether gold (electrum) nanoparticles have different physical properties than macro-scale gold particles or crystals, the working hypothesis now is that nanoparticles in these bonanza epithermal systems form deeper than the epithermal setting as their Pb-isotopic composition is very primitive and magma-like [
21]. This suggests that the nanoparticles formed near their magmatic source, locked in a magmatic isotopic signature, and were transported upward to the epithermal environment and deposited there. Perhaps the surface properties of the nanoparticles and/or colloids is precisely what keeps them entrained in the upward moving fluids and brings them to the point of deposition that perhaps result in the textures described below.
2. Ore Textures
Evidence of silica and precious-metal nanoparticles has been observed in ores from the 11 deposits and districts shown in
Figure 1. Most of the bonanza deposits shown in
Figure 1 are mid-Miocene in age and have been interpreted to be related to the initial emergence of the Yellowstone Hotspot [
14,
27], with the exception of bonanza veins in the Republic district of Washington which are Eocene [
28]. Irrespective of their age or possible geotectonic origin, all of the deposits considered here have additional similarities not described above. These include a banded nature of the veins, composed of successively deposited layers of ore and gangue minerals; and that chalcopyrite is typically the most abundant sulfide phase present in the highest-grade Au-Ag ores. The latter is also similar to the above-mentioned Japanese deposits, and at Hishikari there is a stronger statistical correlation between Au and Cu. Copper is by far the most abundant base metal in the bonanza ores [
8,
9]. In the US deposits, textural evidence indicates that ore and gangue minerals were deposited episodically and repeatedly, such that ores exhibiting the most number of banding events typically have the highest grades [
2]. Because these episodic/banded textures are best exhibited by the Sleeper and Buckskin National deposits they will be used here to illustrate these features. These two deposits also represent “end-member” mineralogical types of ores of the 11 deposits shown in
Figure 1. Sleeper represents ores (similar to Jumbo and National) where electrum is by far the most abundant mineral of any variety in the bonanza ore; and Buckskin National represents the opposite situation, where naumannite is by far the most abundant ore mineral and electrum only occurs rarely (similar to DeLamar, Silver City, ID, USA). Most of the rest contain significantly more naumannite than electrum, and by value of contained metals, they would be considered “gold” ores (such as at Midas and Ivanhoe-Hollister, Nevada; War Eagle and Florida Mountains, Silver City, ID, USA).
Bonanza ore textures from Sleeper have been documented previously [
1,
2] primarily with the intent to illustrate that
both silica and electrum nanoparticles were important in forming those ores and perhaps others elsewhere. More recently, Saunders [
29] discussed one implication of the 100 s of episodes of gold deposition at Sleeper, suggesting that each perhaps represented a discrete (short) time interval for each gold layer formation, and further suggested that perhaps the entire bonanza ore-forming event might have been much shorter than previously thought (a possibility also suggested by Heinrich
et al. [
23] Simmons and Brown [
30], and Heinrich [
31]).
In the Sleeper “main” vein (
Figure 2), many electrum-depositing events can be seen even at the cm-scale. Some hand samples of bonanza ores from Sleeper show up to 50 different electrum-rich bands, which represents successive deposition (coating) of electrum on the vein walls over time [
2]. Individual electrum-rich bands are typically 50%–70% by volume of electrum (
Figure 2) and at the Sleeper deposit electrum is often the only ore mineral in the bands. Opal typically (perhaps slightly (re)crystallized) and trace amounts of adularia form the remainder of the electrum bands. Intervening silica bands often exhibit textures suggesting amorphous silica precursors as well (often crystallized gels), and also locally include abundant adularia [
2]. As documented by Saunders [
2] and Saunders and Schoenly [
18,
19], electrum-rich bands consist aggregates (“forests”) of fractal electrum dendrites with tree-like shapes (
Figure 3) that formed by electrum and silica colloid aggregation. Although they form by a fractal-growth process, the dendrites are excellent examples of “natural” fractals, which are self-similar over a number of scales. Such electrum fractals can range from <0.1 mm in size to >10 cm in diameter, with the largest fractal dendrites yet observed from the National deposit [
3,
11,
12].
Figure 2.
Photograph of multiple electrum-rich bands (>10) and opaline silica from the Sleeper “main” vein, Sleeper deposit, Nevada formed from the aggregation of electrum and silica nanoparticles. (Center of vein is toward the top of the photograph). Note: All that “glitters” is electrum in this image. In detail, the electrum-rich bands are made of “forests” of individual 3-dimensional, “self-organized” fractal dendrites (see
Figure 3). Additional details about these textures are described elsewhere [
2,
18,
19].
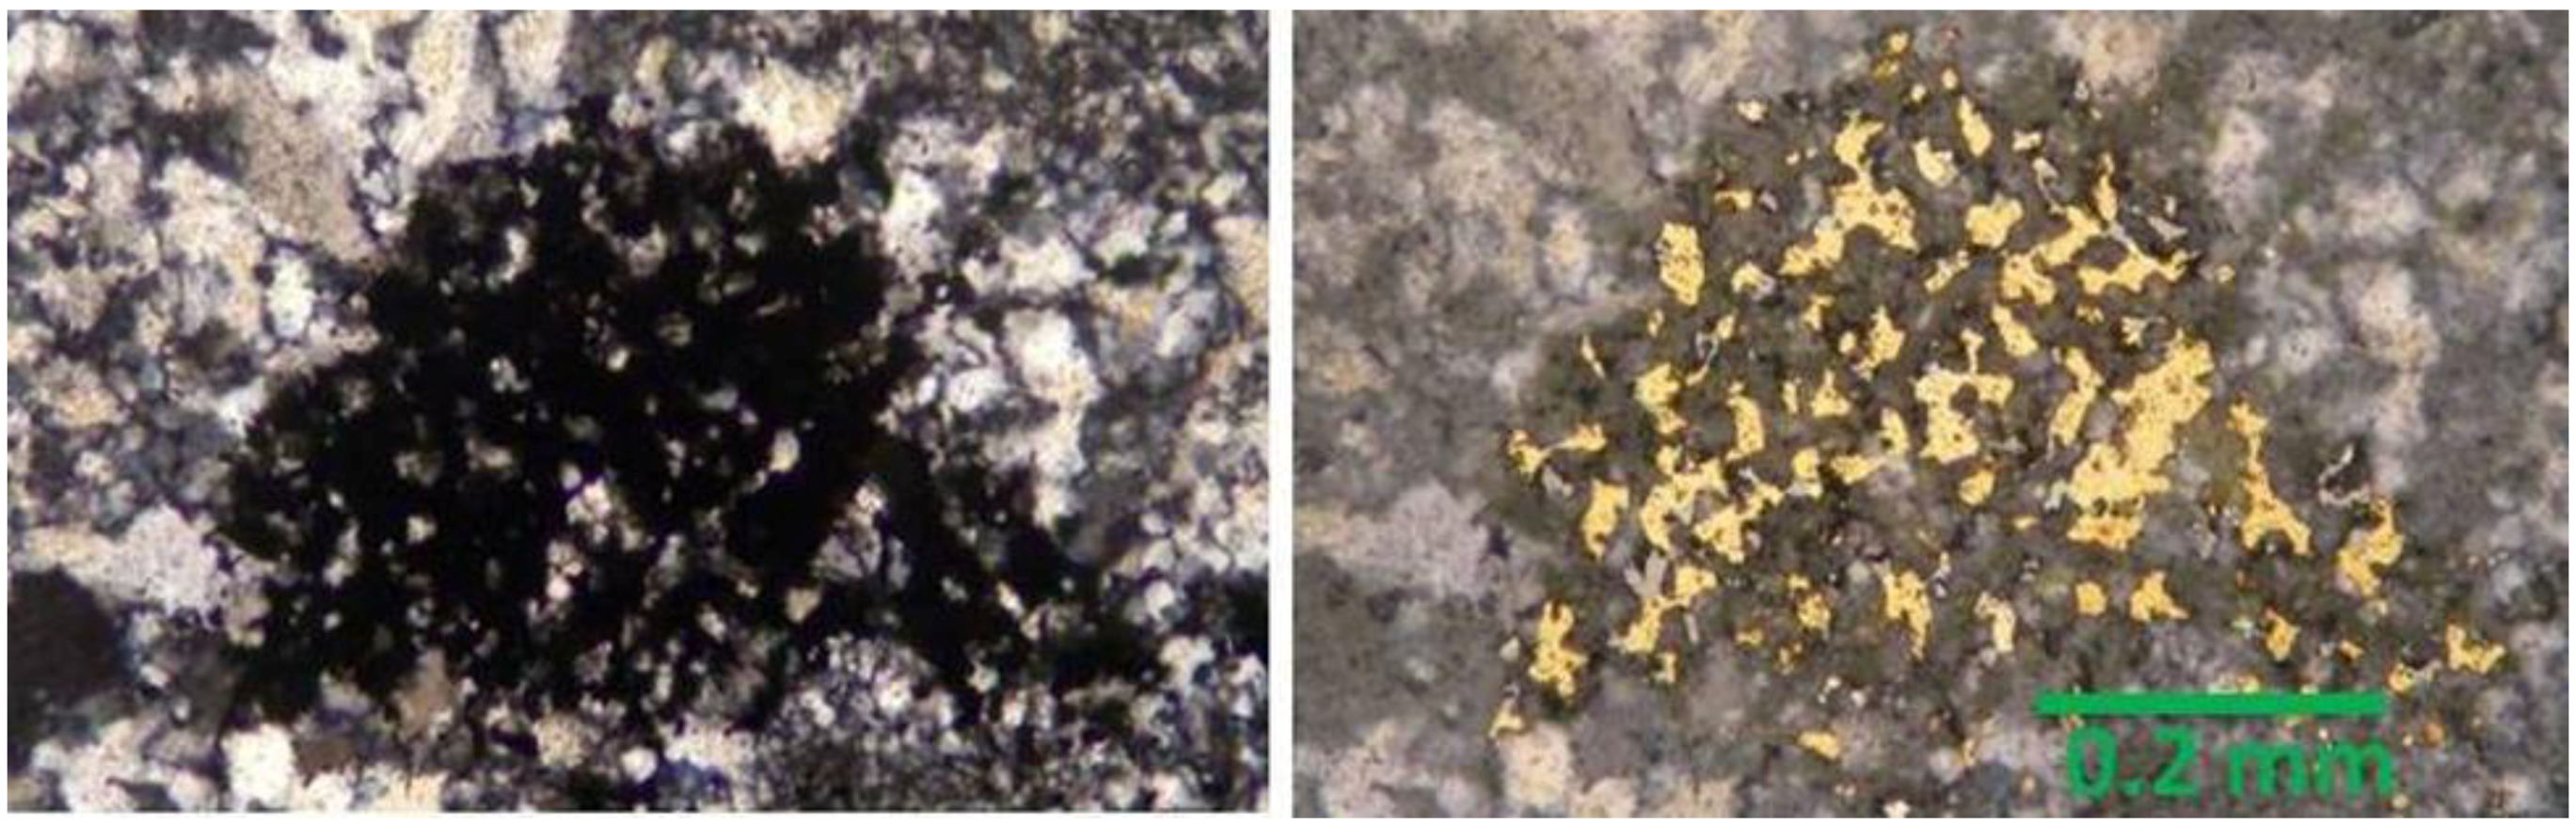
Figure 3.
Photomicrographs of a single fractal dendrite from an electrum-rich band, similar to those shown in
Figure 2 (from a polished thin section). This is a 30 µm-thick slice through a feature that is ~1 mm in diameter.
Left: transmitted light, polars not crossed. Opaque phase is electrum, dark gray is barely (re)crystallized opal, and white is fine-grained quartz;
Right: Same view as in left image, transmitted and reflected light, polars partially crossed. Note: dendrite is composed of nothing but opal and electrum (yellow) and opal is virtually opaque with polars crossed.
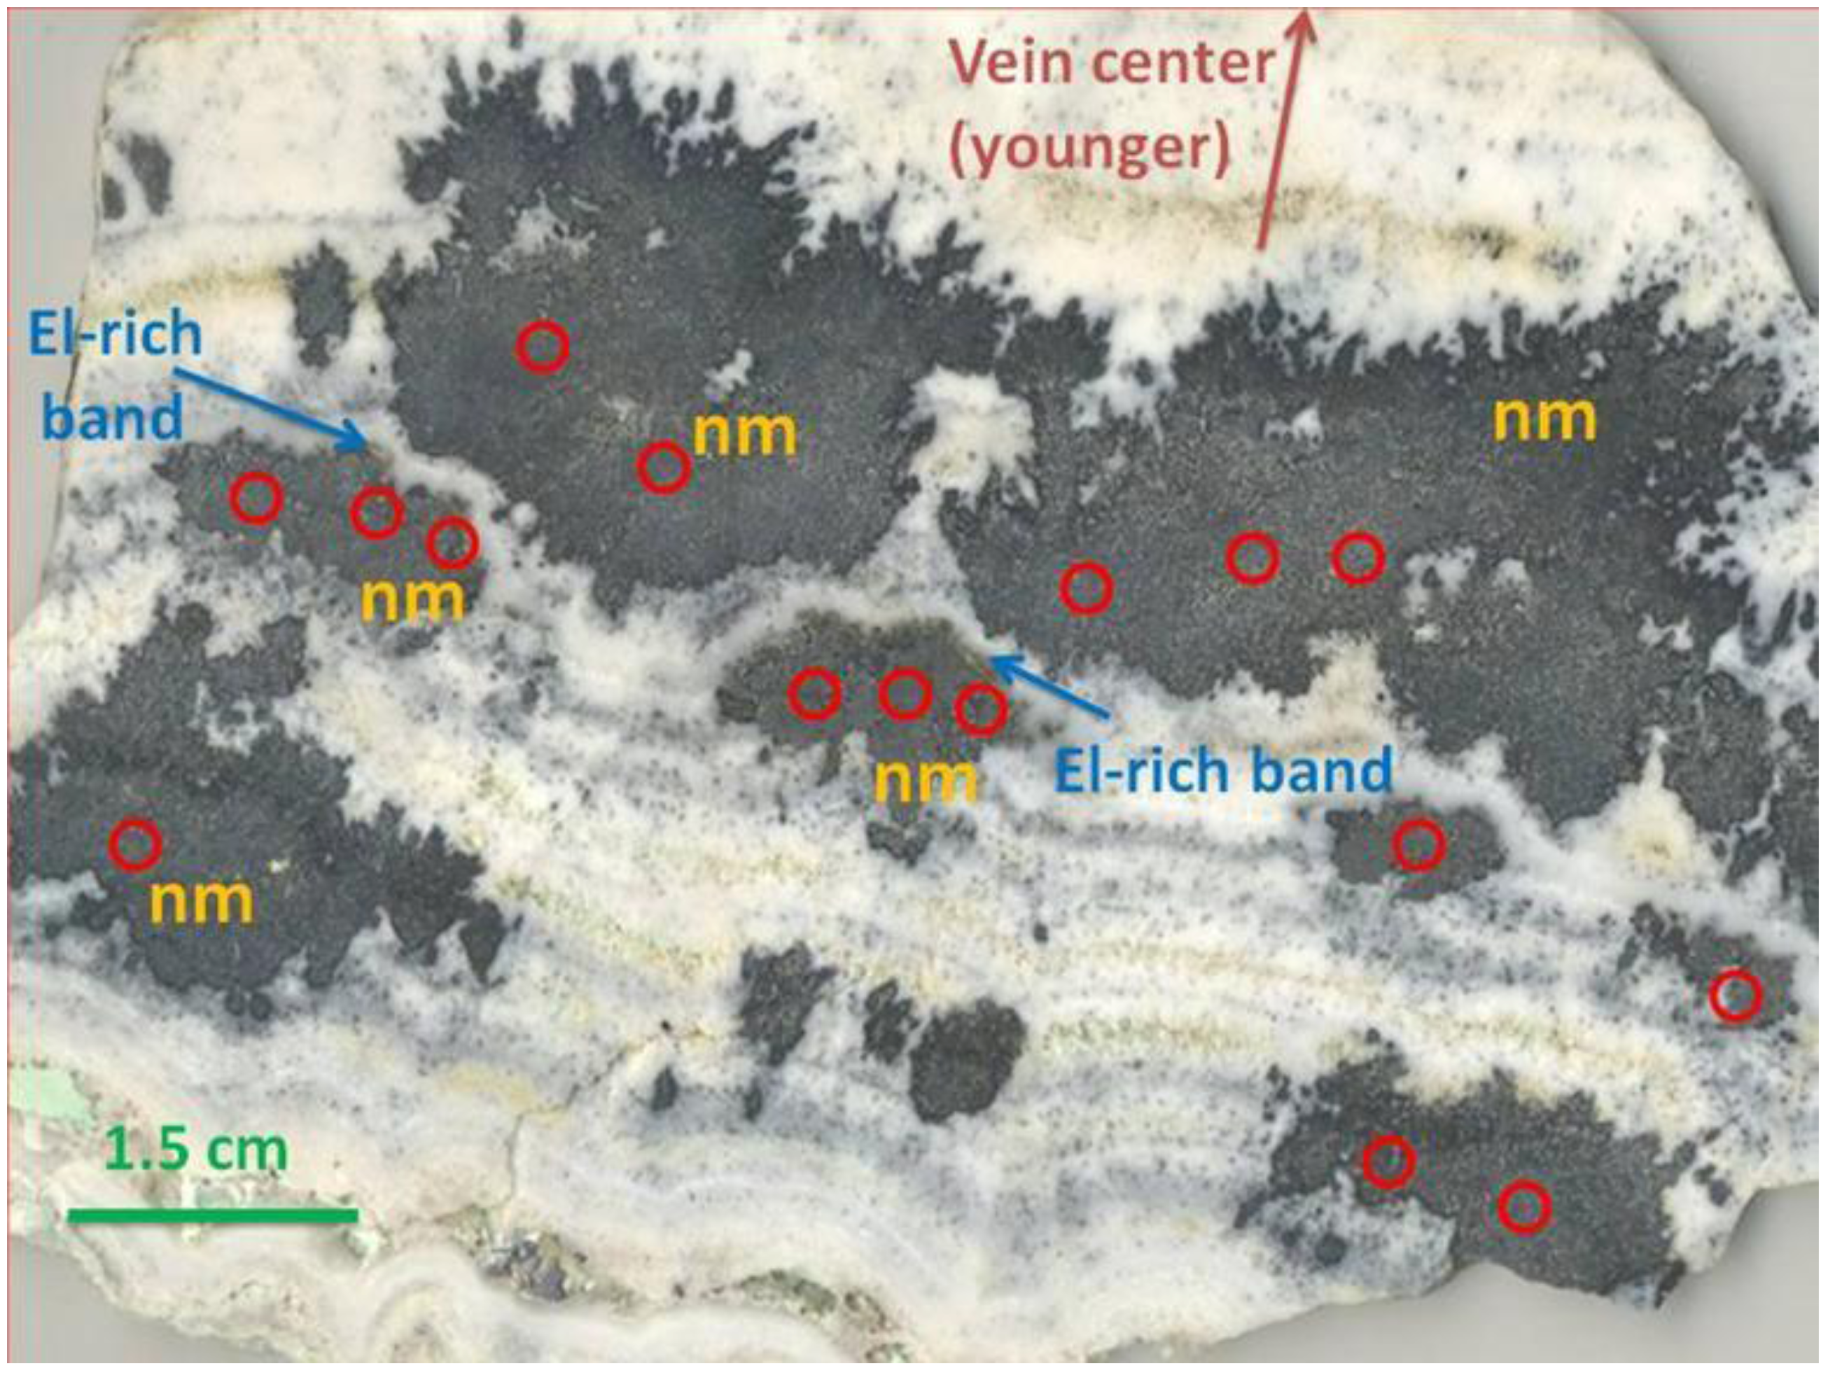
Figure 4.
Photograph of large naumannite (nm) dendrites in multiple bands from the Bell vein, Buckskin National Deposit, Nevada (National District). A single electrum rich-band is labeled, and it has a very similar morphology to those documented from the Sleeper deposit, but clearly represents one finite episode of essentially electrum-only deposition. Red circles denote location of electrum grains within naumannite dendrites, and their distribution suggests that there were at least three gold-rich depositional events while naumannite dendrites were growing. Additional details of Buckskin National mineralogy and textures can be found in Vikre [
20] and Saunders
et al. [
4].
The National and Buckskin National deposits (
Figure 1) are both located in the National district and are only a few km apart, but differ significantly in the abundance of ore minerals in the bonanza ores [
20]. Highest grade ores from Buckskin National are banded and contain large and spectacular fractal naumannite drendites (
Figure 4) that formed episodically. As in the case of the fractal electrum dendrites from Sleeper, the dendrites point toward the center of the vein. Electrum in these ores is typically rarely observed [
20]. However, in the sample shown in
Figure 4, electrum is fairly abundant as inclusions in naumannite dendrites, and it appears to have been incorporated into the dendrites at discrete time intervals, but perhaps more significantly, a single electrum-rich band occurs in at least one instance after one stage of naumannite dendrite formation ceased (
Figure 4). This texture has not been seen by the author (or documented) at Buckskin National previously, and represents a rare electrum >> naumannite stage of ore deposition there. In detail, the electrum-rich band consists of a number of fractal electrum dendrites (
Figure 5) that are very similar to those seen in the Sleeper deposit and thus probably also formed by electrum nanoparticle aggregation along the vein wall at that time.
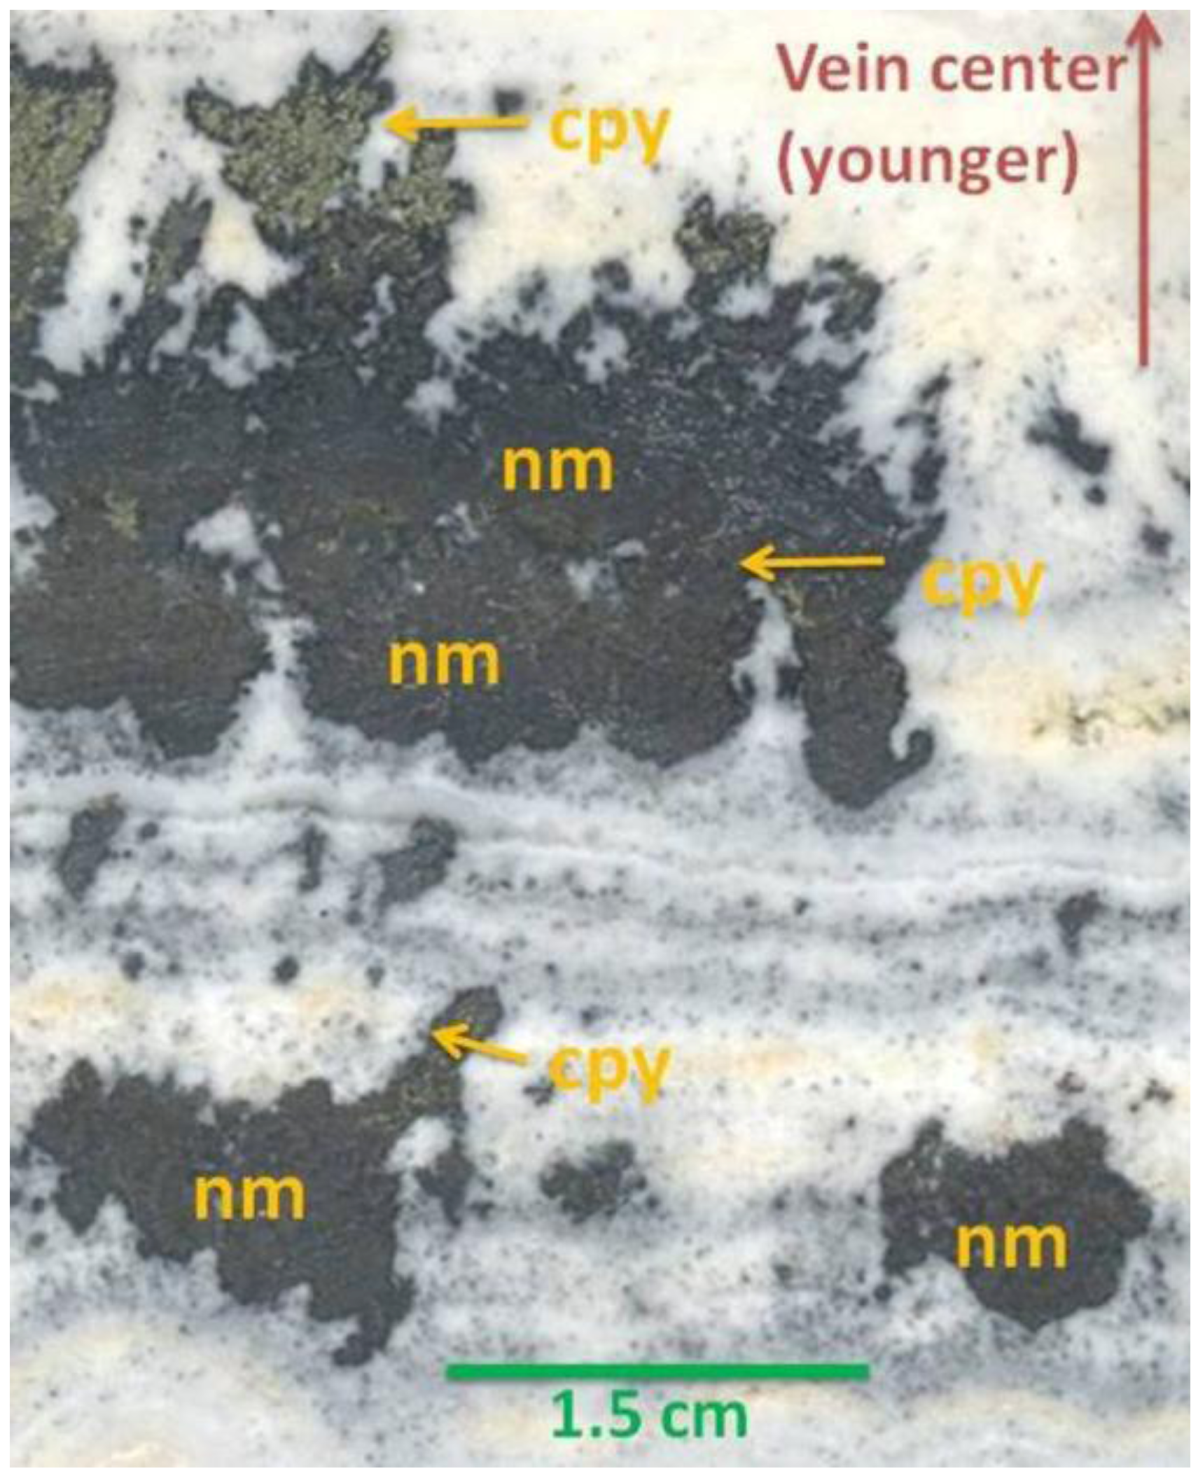
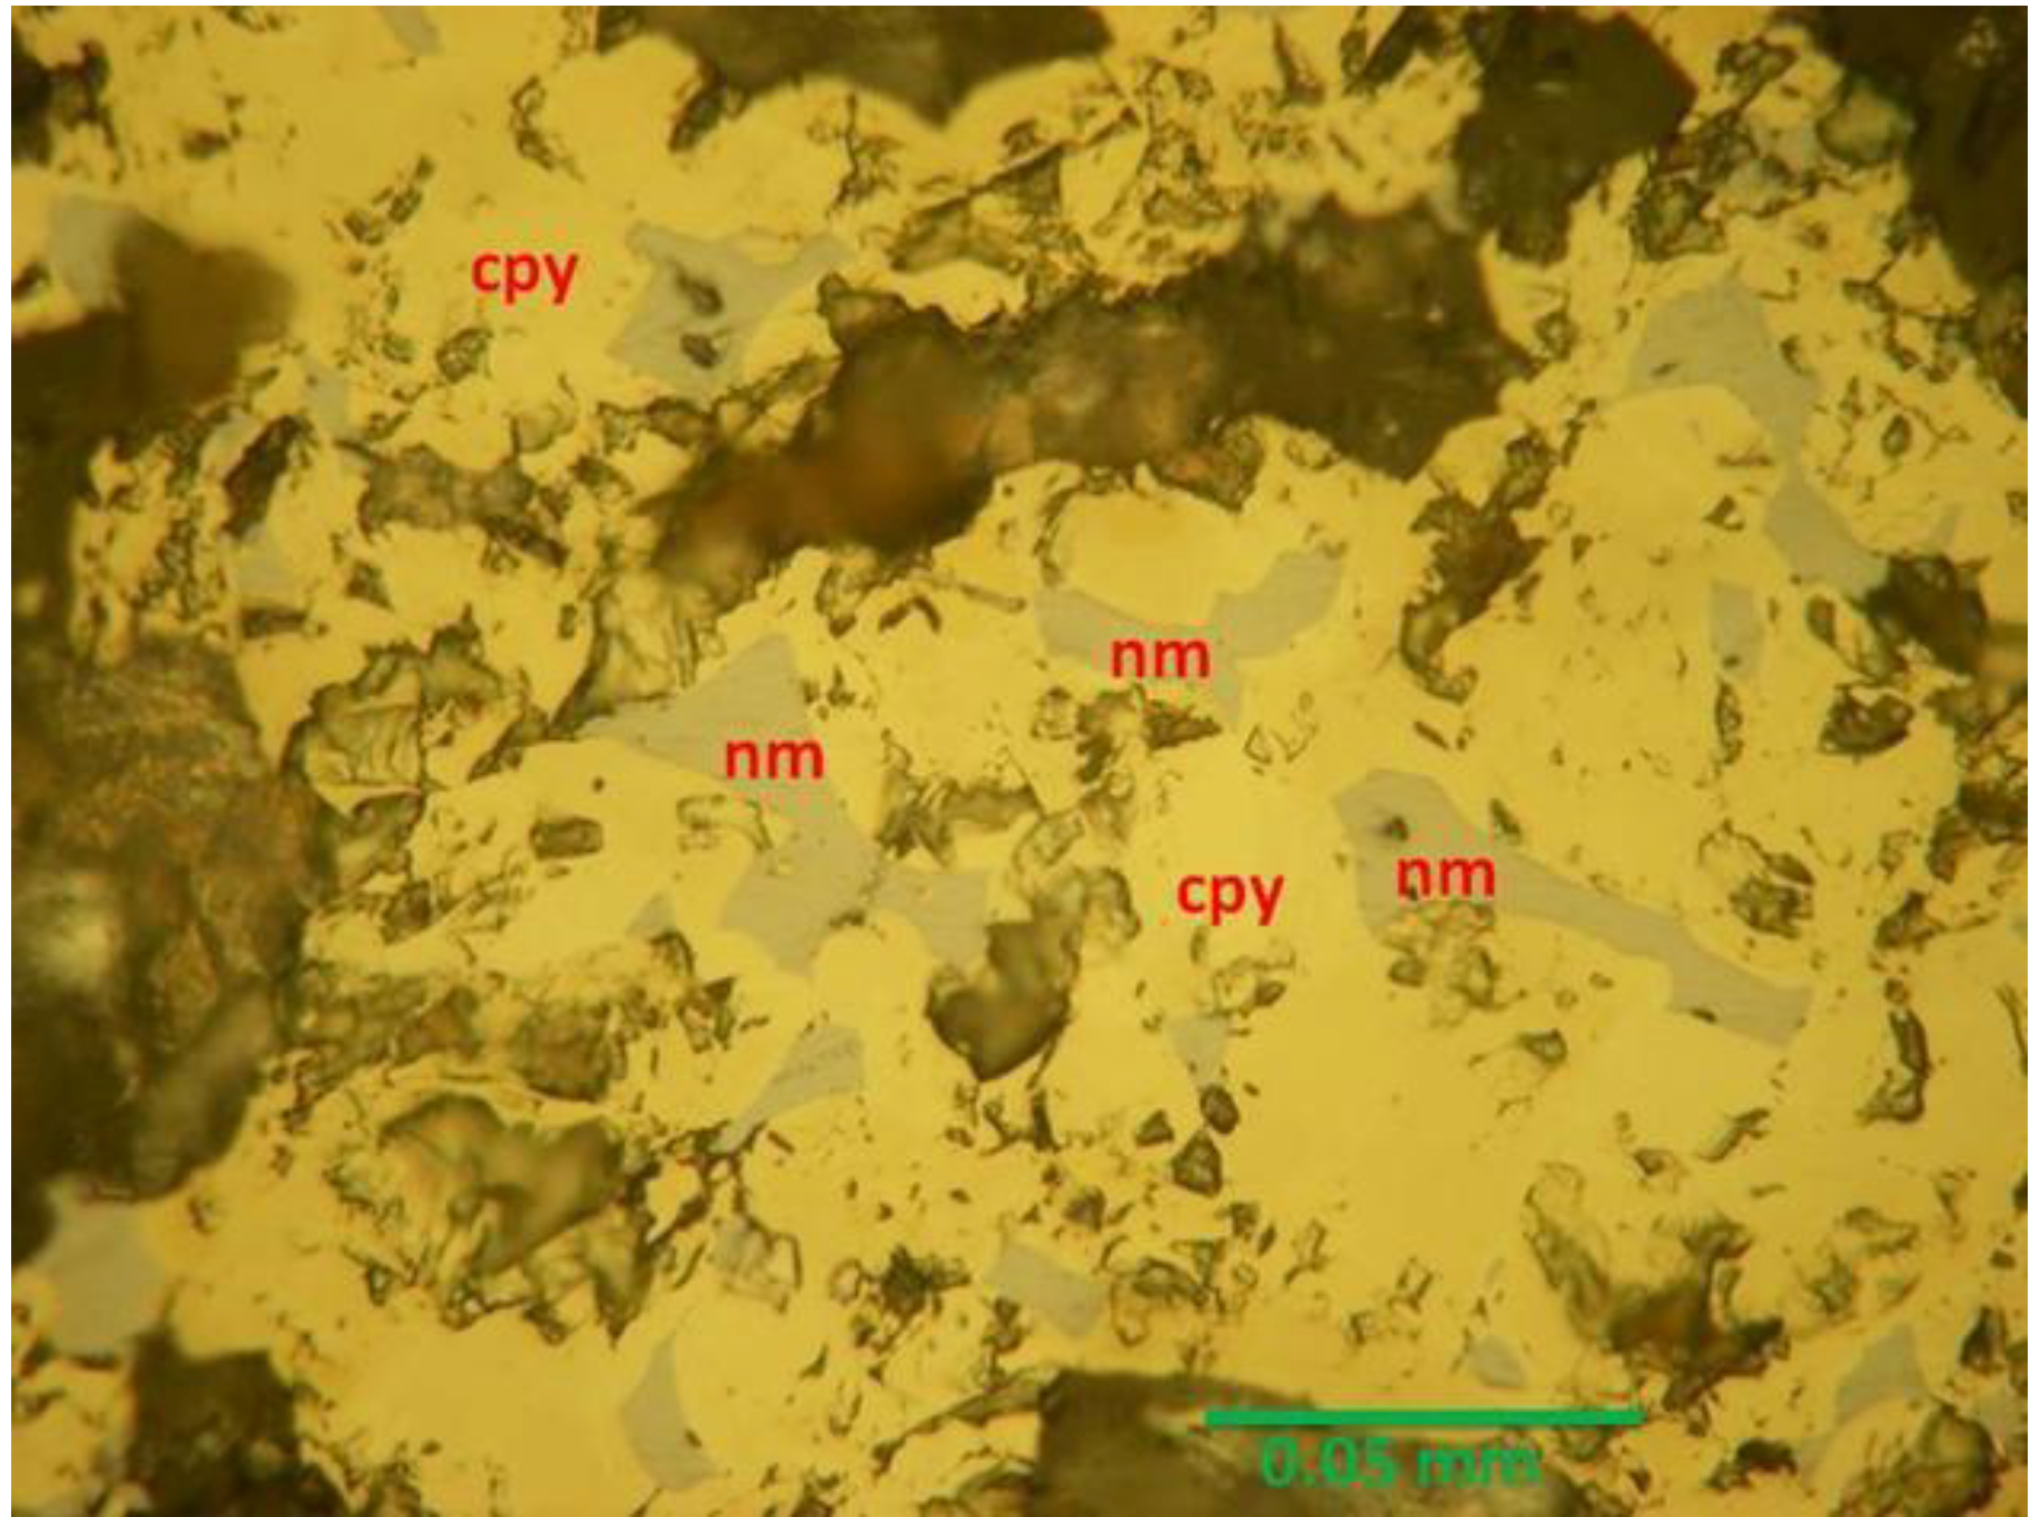
Another sample from the Bell vein, Buckskin National, shows that chalcopyrite was also introduced episodically in the ore (
Figure 6). It generally appears to have been deposited late in the naumannite dendrite growth in the various bands. In detail, chalcopyrite appears to encrust and replace naumannite in the dendrites, leaving un-replaced “islands” of naumannite (
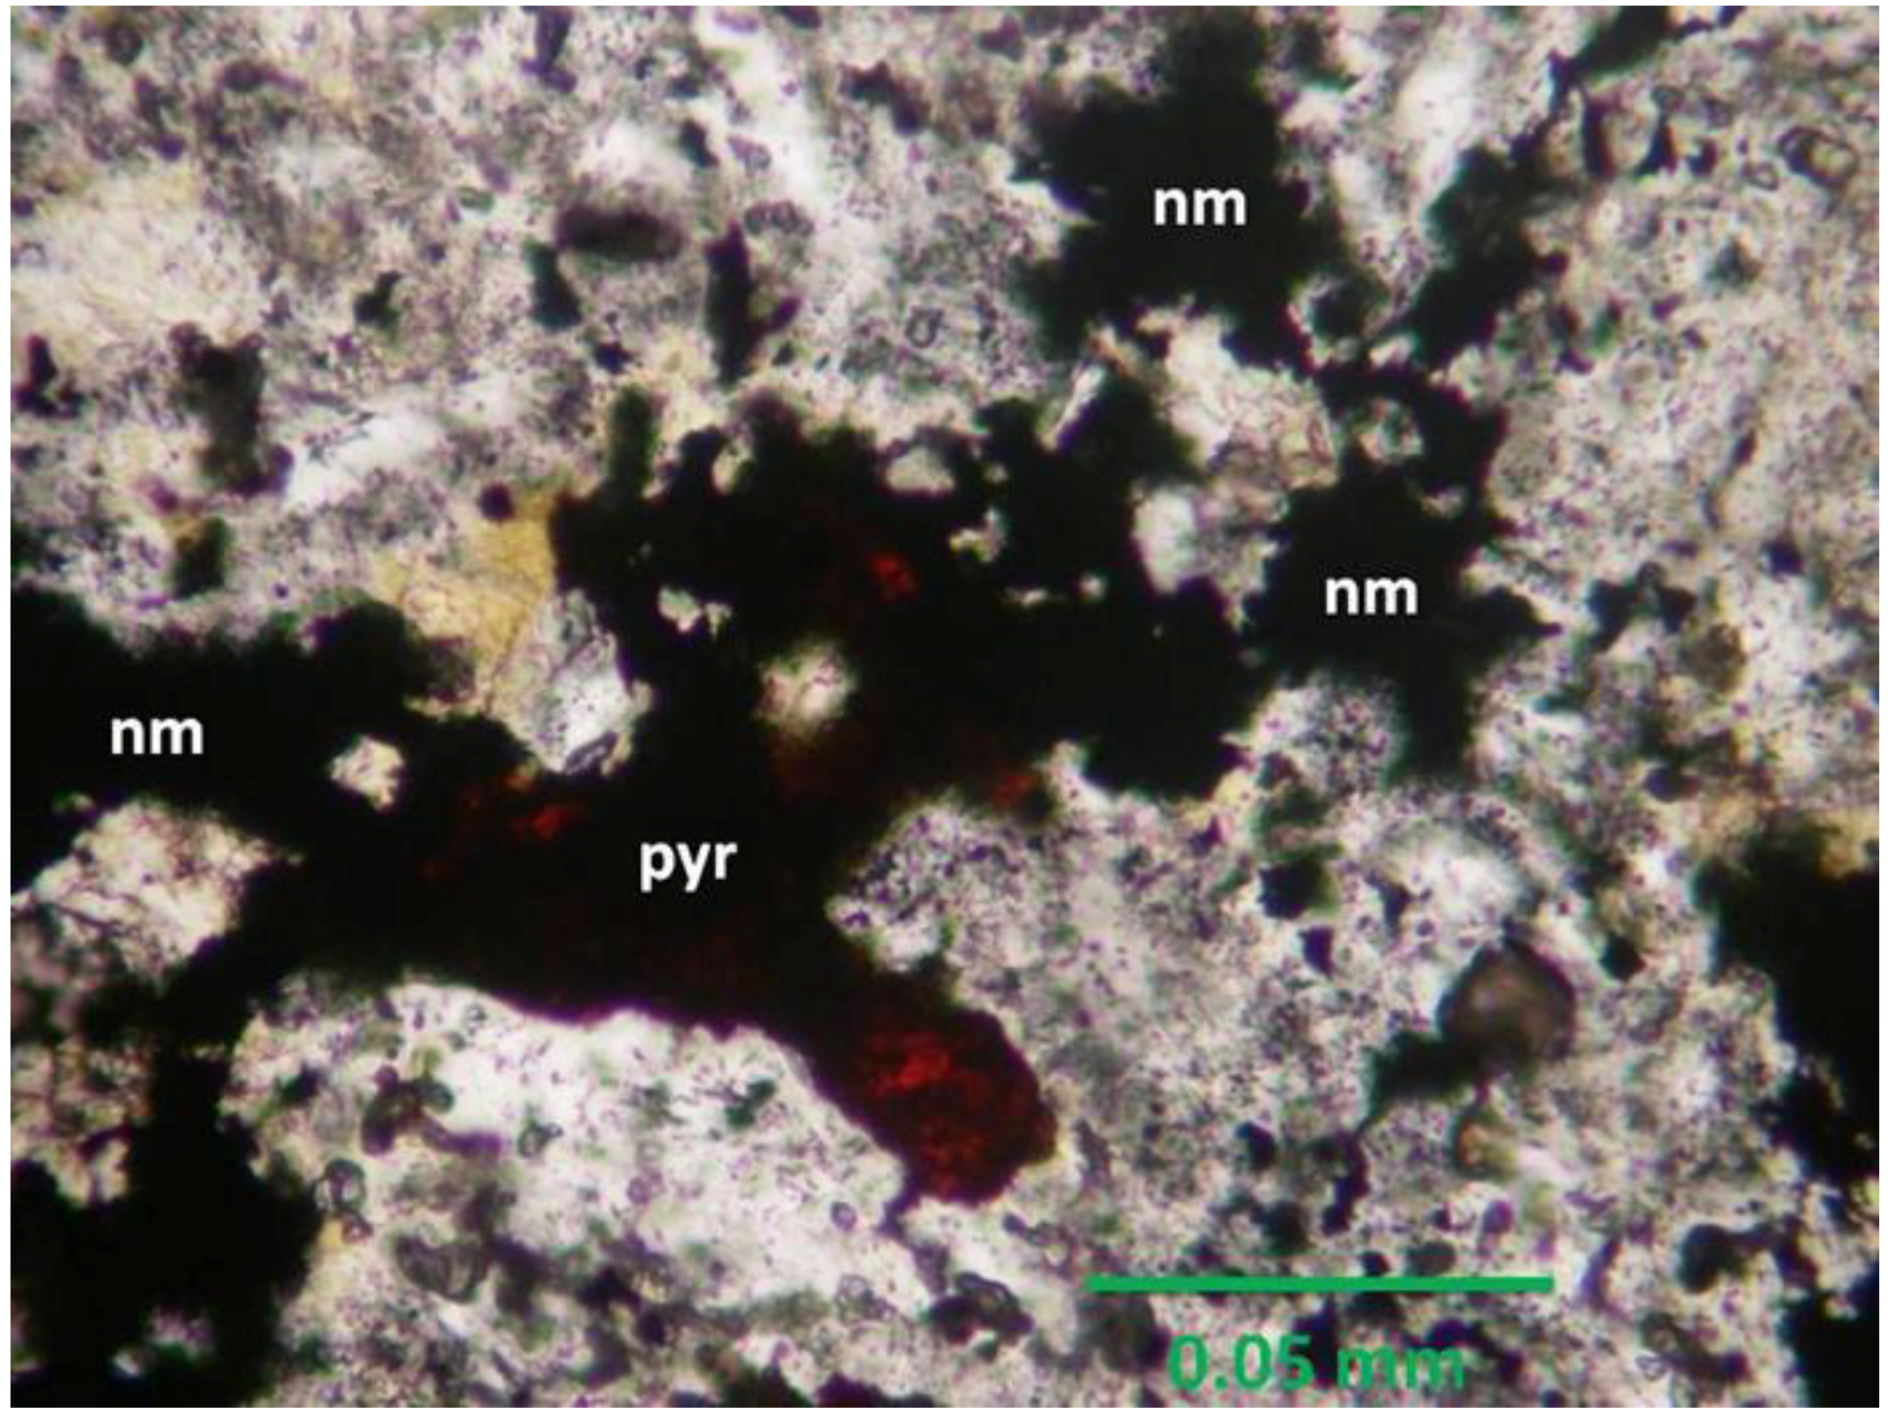
Figure 7). Locally, other precious-metal and sulfide minerals can also be found in the naumannite dendrite and may be part of the dendrite “structure”, as in the case of pyrargyrite shown in
Figure 8.
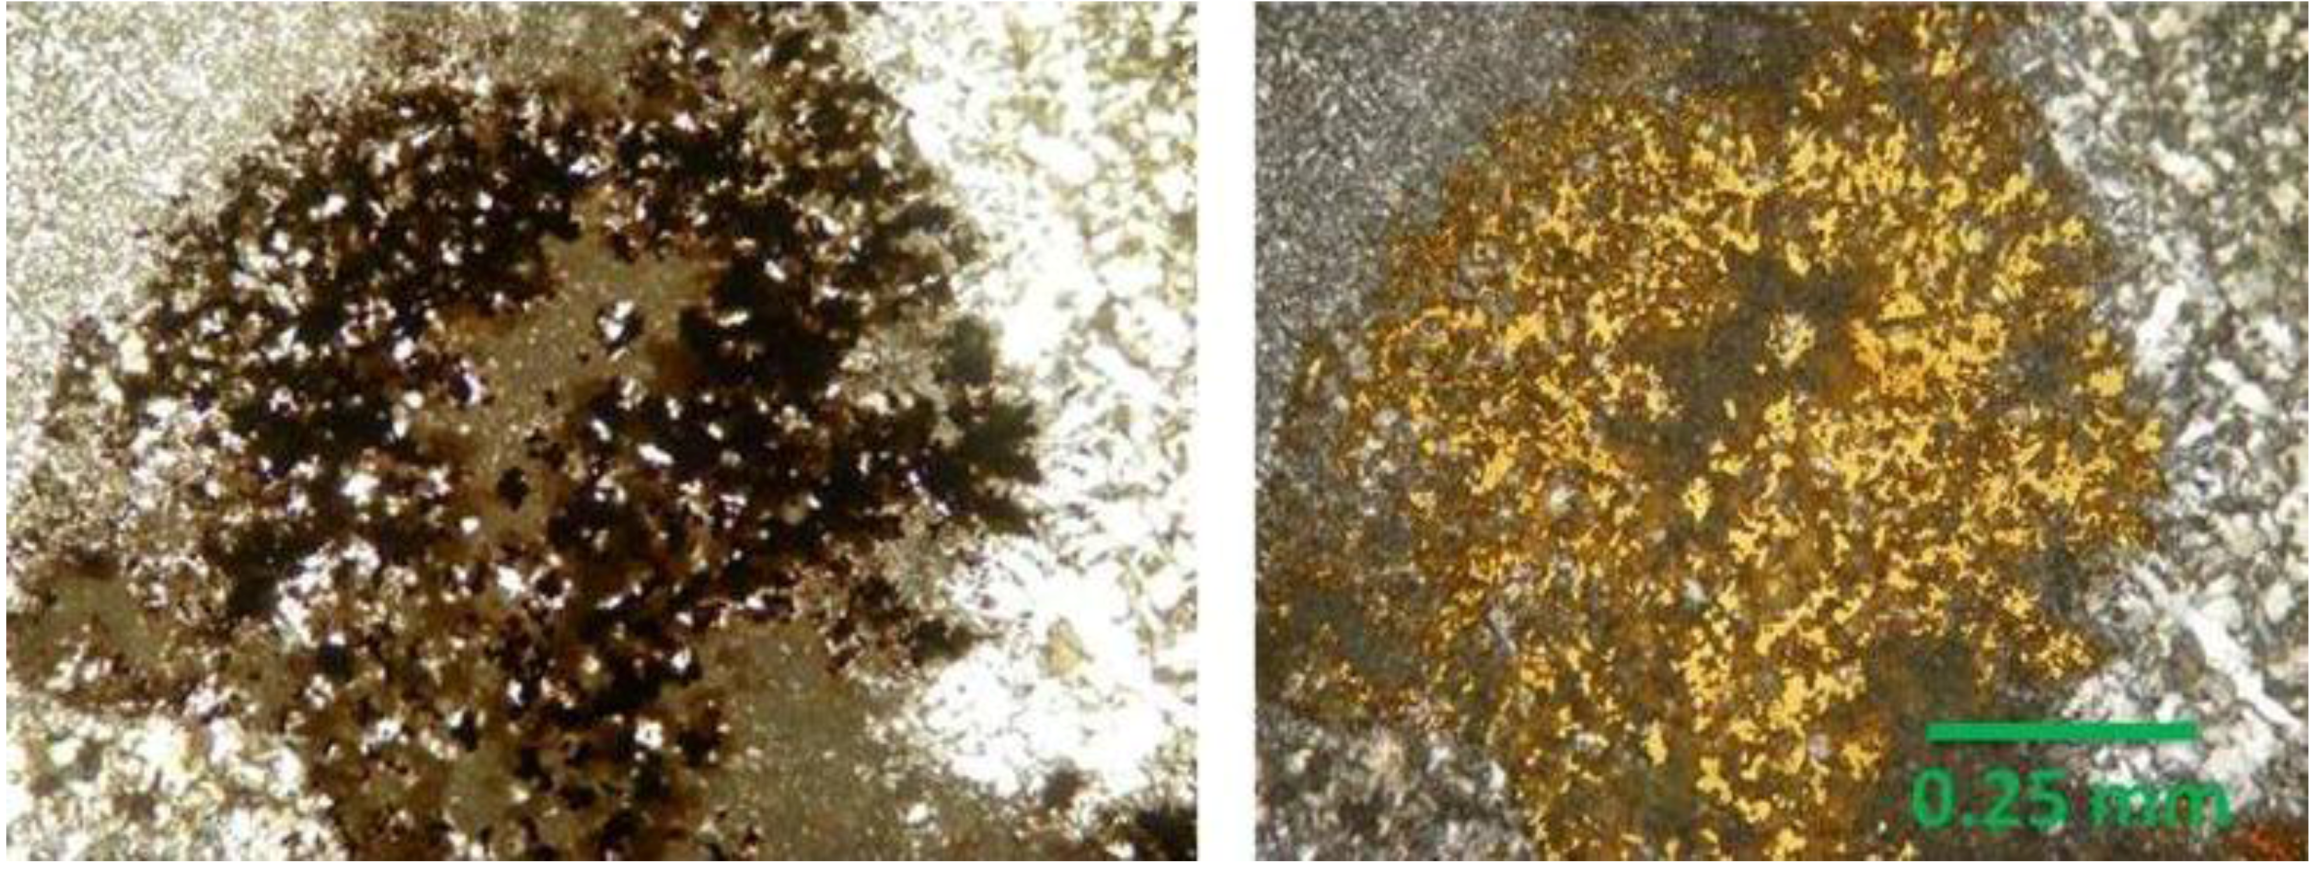
Figure 5.
Photomicrographs of a single electrum dendrite from the electrum-rich band shown in
Figure 4. Note similarity to
Figure 3 from the Sleeper Deposit.
Left: Transmitted light, polars crossed, opaques consist of >95% electrum;
Right: Same view as at left, transmitted and reflected light. The gray reflective phase is a minor amount of naumannite, also contributing to the structure of the dendrite.
Figure 6.
Photograph of another sample of bonanza Au-Ag ore from the Bell vein, Buckskin National deposit, showing three discrete episodes where chalcopyrite (cpy) is a major ore mineral. In all three examples here, chalcopyrite is deposited on the outer edge of the naumannite (nm) dendrites, although that is more difficult to see in the middle chalcopyrite-depositing event as two different naumannite bands are in close proximity.
Figure 7.
Photomicrograph (reflected light) of chalcopyrite-rich zone from top of
Figure 6. It appears that chalcopyrite (cpy) is encrusting and replacing the former “top” of the naumannite dendrite, and naumannite (nm) is present only as un-replaced “islands” in massive chalcopyrite.
Figure 7.
Photomicrograph (reflected light) of chalcopyrite-rich zone from top of
Figure 6. It appears that chalcopyrite (cpy) is encrusting and replacing the former “top” of the naumannite dendrite, and naumannite (nm) is present only as un-replaced “islands” in massive chalcopyrite.
Figure 8.
Photomicrograph of a portion of one of the naumannite (nm) dendrites shown in
Figure 6, where pyrargyrite (pyr, red) locally composes part of the dendrite (transmitted light, polars not crossed).
Figure 8.
Photomicrograph of a portion of one of the naumannite (nm) dendrites shown in
Figure 6, where pyrargyrite (pyr, red) locally composes part of the dendrite (transmitted light, polars not crossed).
3. Discussion
Barton
et al. [
32] and Roedder [
33] have documented that even relatively slow-moving hydrothermal solutions can transport colloidal-sized particles in ore-forming systems, and that those particles sometimes can be trapped as solid inclusions in fluid inclusions (as opposed to forming as true daughter phases). Kouzmanov
et al. [
34] also documented that Au-Ag solid nanoparticles were trapped in fluid inclusions (in the deep porphyry environment) they analyzed for metal contents using laser-ablation-ICP-MS. Brown [
35] documented that colloidal precious-metal alloys and metal sulfides, along with silica colloids, formed due to boiling (by a controlled pressure drop) in a geothermal well at Ohaaki (formerly known as Broadlands), New Zealand. Brown also calculated for the first time how much dissolved gold was apparently present in that geothermal reservoir. Similarly, Fournier [
16,
17] documented the transport of silica colloids in hydrothermal fluids, and proposed gold may attach to them. Further Lindgren [
11] states: “
Gold is easily brought into the colloidal state and as such may be transported in solutions of colloidal silica.” Saunders [
1] demonstrated that silica and gold (electrum) colloids of similar size apparently were physically transported together and codeposited to form the spectacularly-high grade ores from the Sleeper deposit. More recent studies [
3,
4,
12] documented conclusively that naumannite forms colloidal or nano-sized particles in some bonanza epithermal ores of western USA, and can be physically transported to the site of ore deposition. This contribution documents that chalcopyrite is a ubiquitous ore mineral present in these bonanza ores, and proposes (by analogy to former presence of electrum, naumannite and silica colloids in the same ores) that it too was physically transported to the site of ore deposition.
Sulfide nanoparticles have been described previously, particularly Fe-sulfide phases e.g., [
36,
37]. Bacteria-mediated ZnS formation has also been documented, and sphalerite formed by this process commonly occurs as self-organized spheroidal particles that are ~100 nm in diameter, which in turn composed of smaller aggregated nanoparticles of ZnS [
38,
39,
40,
41]. Chalcopyrite nanoparticles are routinely synthesized for their use in “nano” technological applications [
42] and amorphous biogenic Cu(Fe)-S nanoparticles have also been documented by Saunders
et al. [
41] forming in groundwater under sulfate-reducing conditions. No doubt other base-metal sulfide nanoparticles also form in black smoker settings along with FeS nanoparticles. Nano-scale inclusions of chalcopyrite in sphalerite have had a long history of debate concerning their origin [
43] but a “direct” colloidal origin of those textures was ruled out by Barton and Bethke [
43]. Thus suffice it to say that sulfide nanoparticles have been documented in the literature, and perhaps their formation is a common phenomenon but is probably not well preserved due to post-depositional changes, metamorphism,
etc., and only a few studies have been done on actual hydrothermal solutions such that by Yucel
et al. [
37].
Assuming that both metal “alloys” (electrum, naumannite) and sulfide nanoparticles form in the epithermal deposits discussed here, and their deposition leads to the textures documented here (and most likely their extreme high grades), an important question is
where do they form? Saunders [
1,
2] proposed that they formed in the shallow epithermal setting due to boiling and were also deposited there. However, new reconnaissance Pb-isotope [
21] and Re-Os data [
44] suggest that the electrum has locked in a deep, primitive isotopic signature not consistent with it nucleating at a shallow depth. Additional isotopic studies are ongoing to better evaluate that initial interpretation. However, for the sake of this discussion, why might such particle form deep below the normal epithermal setting, and why would be they be entrained in the hydrothermal fluid? With regards to the latter, Yucel
et al. [
37] calculated using Stoke’s Law that a 200 nm (colloidal size by the definition set forth here) pyrite particle would have a settling velocity in a stagnant aqueous solution of 1.43 m/year, and thus even a slow moving fluid could easily carry it along during flow. The density of electrum would require perhaps a faster moving fluid than for entraining pyrite nanoparticles, but earliest formed particles would be 1–2 orders of magnitude smaller than the particle size used in Yucel
et al.’s calculation [
37]. Why would they be entrained as opposed to sticking to pore/fracture walls? Again, we know little of nanoparticle physical behavior for metal alloys or sulfides, but it is possible that surface charge considerations are even more important than for colloid-sized particles discussed by Saunders [
1,
2], and thus there could be a natural repulsion of the nanoparticles by the pore walls (and from their own surfaces as the nanoparticles approach each other). As nanoparticles move up they grow bigger, which ultimately can lead to their sticking to each other and/or surfaces of other mineral phases by a process called orthokinetic aggregation [
1]. Orthokinetic aggregation is caused by increasing the momentum (mass × velocity) of a nanoparticle such that they can overcome surface-charge repulsion, allowing them collide and stick. In the epithermal environment, boiling of the hydrothermal solutions may accelerate the particles causing orthokinetic aggregation.
With regards to why or how the nanoparticles might form at depth, one can only speculate on this point. Gold crystals (~10
−6 m in diameter) grew in a silica tube inserted into a fumarole vent (T = 800 °C) at Colima volcano, Mexico [
45] attesting to the capability of super-critical (magmatic?) fluids to transport gold, which is consistent with recent findings from laser-ablation ICP-MS fluid inclusion studies e.g., [
22,
23]. Kamenov
et al. [
21] and Saunders
et al. [
14] proposed that basaltic magmas were the source of gold and related elements in the mid-Miocene western USA ores. If a low-density, volatile-rich and metal-rich magmatic fluid is rereleased from such a magma chamber or separates from a denser brine, as suggested by Heinrich
et al. [
23,
24], then several hundred degrees of cooling likely would be an effective mechanism of saturating the fluid with respect to the nanoparticle minerals electrum, naumannite, and chalcopyrite as it moves up through the porphyry-to-epithermal setting. Perhaps some laboratory experiments could be designed to test this hypothesis. However, Yucel
et al. [
37] showed that FeS nanoparticle formation had occurred prior to the mixing of discharging high temperature hydrothermal fluids with cold seawater in a seafloor “black smoker”, suggesting transport of them for some distance below the surface in that setting.
It is proposed here that the episodic deposition of ore minerals in the ores that are the subject of this communication is best explained by episodic and periodic incursion of low-density magmatic fluids (“vapors”) rich in metals. Previously, Saunders [
2] proposed that the formation of 100 s of gold-rich bands at the Sleeper deposit was a function of episodic boiling in that system. It has been demonstrated [
30,
35] that boiling is an effective gold-depositional process in geothermal fluids significantly
under-saturated with respect to gold prior to boiling. But does this conclusion hold for gold-rich ore forming fluids such as interpreted by Saunders and Schoenly [
18] for deposits such as Sleeper? Saunders [
29] revisited the episodic boiling model for Sleeper, and documented that hydrothermal solutions were boiling even during times
between gold depositional events there. Thus if episodic boiling did not cause multiple gold-silver depositional events recorded in bonanza ores from Sleeper and other deposits considered here, then what did? Perhaps the simplest explanation might be episodic degassing of a magma chamber at depth, with subsequent “vapor-phase” transport of metals up into the epithermal setting, and ultimately the magmatic-vapors were absorbed by the heated groundwater in the shallow subsurface. Clearly much more study of bonanza Au-Ag ore formation is warranted.
Although perhaps best evident in LS epithermal deposits from Nevada, Idaho, and Washington of the western USA such as those discussed here, gold/electrum nanoparticles might also be locally important in some bonanza epithermal ores such as in Japan [
5,
6,
7,
8,
9,
10] and elsewhere in western USA such as McLaughlin, California [
26], and the Sunnyside gold mine [
46] of the Silverton district, San Juan Mountains, Colorado. High-grade Sunnyside ores contained discrete electrum/gold-rich depositional events that also appear to have formed by colloid aggregation (
Figure 9). Further, recent exploration core drilling at the historic Haile mine in the Carolina Slate belt of South Carolina, (which is probably a metamorphosed LS epithermal deposit: author’s interpretation only) has encountered bonanza mineralization with spectacular textures reminiscent of silica and gold textures from Sleeper (
Figure 10). Finally, the well-documented extremely fine-grained gold grains typical of Carlin-type deposits perhaps could be due to some degree of physical transport of gold nanoparticles [
47].
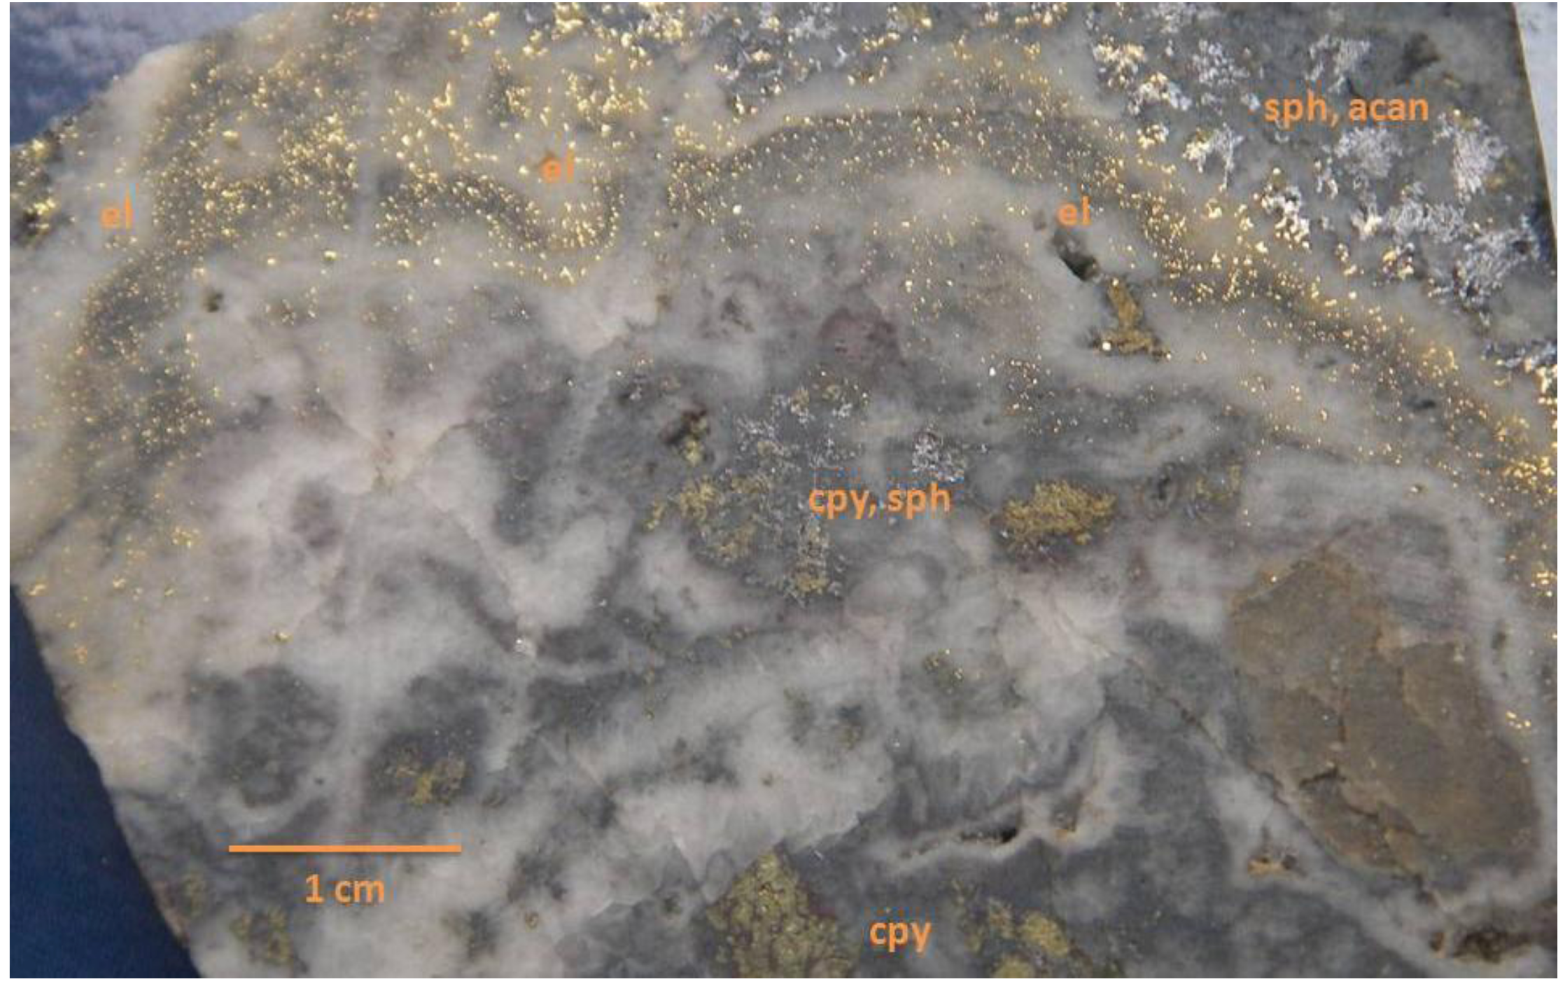
Figure 9.
Photograph of electrum-silica only depositional event apparently formed by aggregation of electrum and silica colloids, from the Sunnyside mine, Silverton, Colorado (author’s sample). Abbreviations: el = electrum; sph = sphalerite; acan = acanthite; cpy = chalcopyrite.
Figure 9.
Photograph of electrum-silica only depositional event apparently formed by aggregation of electrum and silica colloids, from the Sunnyside mine, Silverton, Colorado (author’s sample). Abbreviations: el = electrum; sph = sphalerite; acan = acanthite; cpy = chalcopyrite.
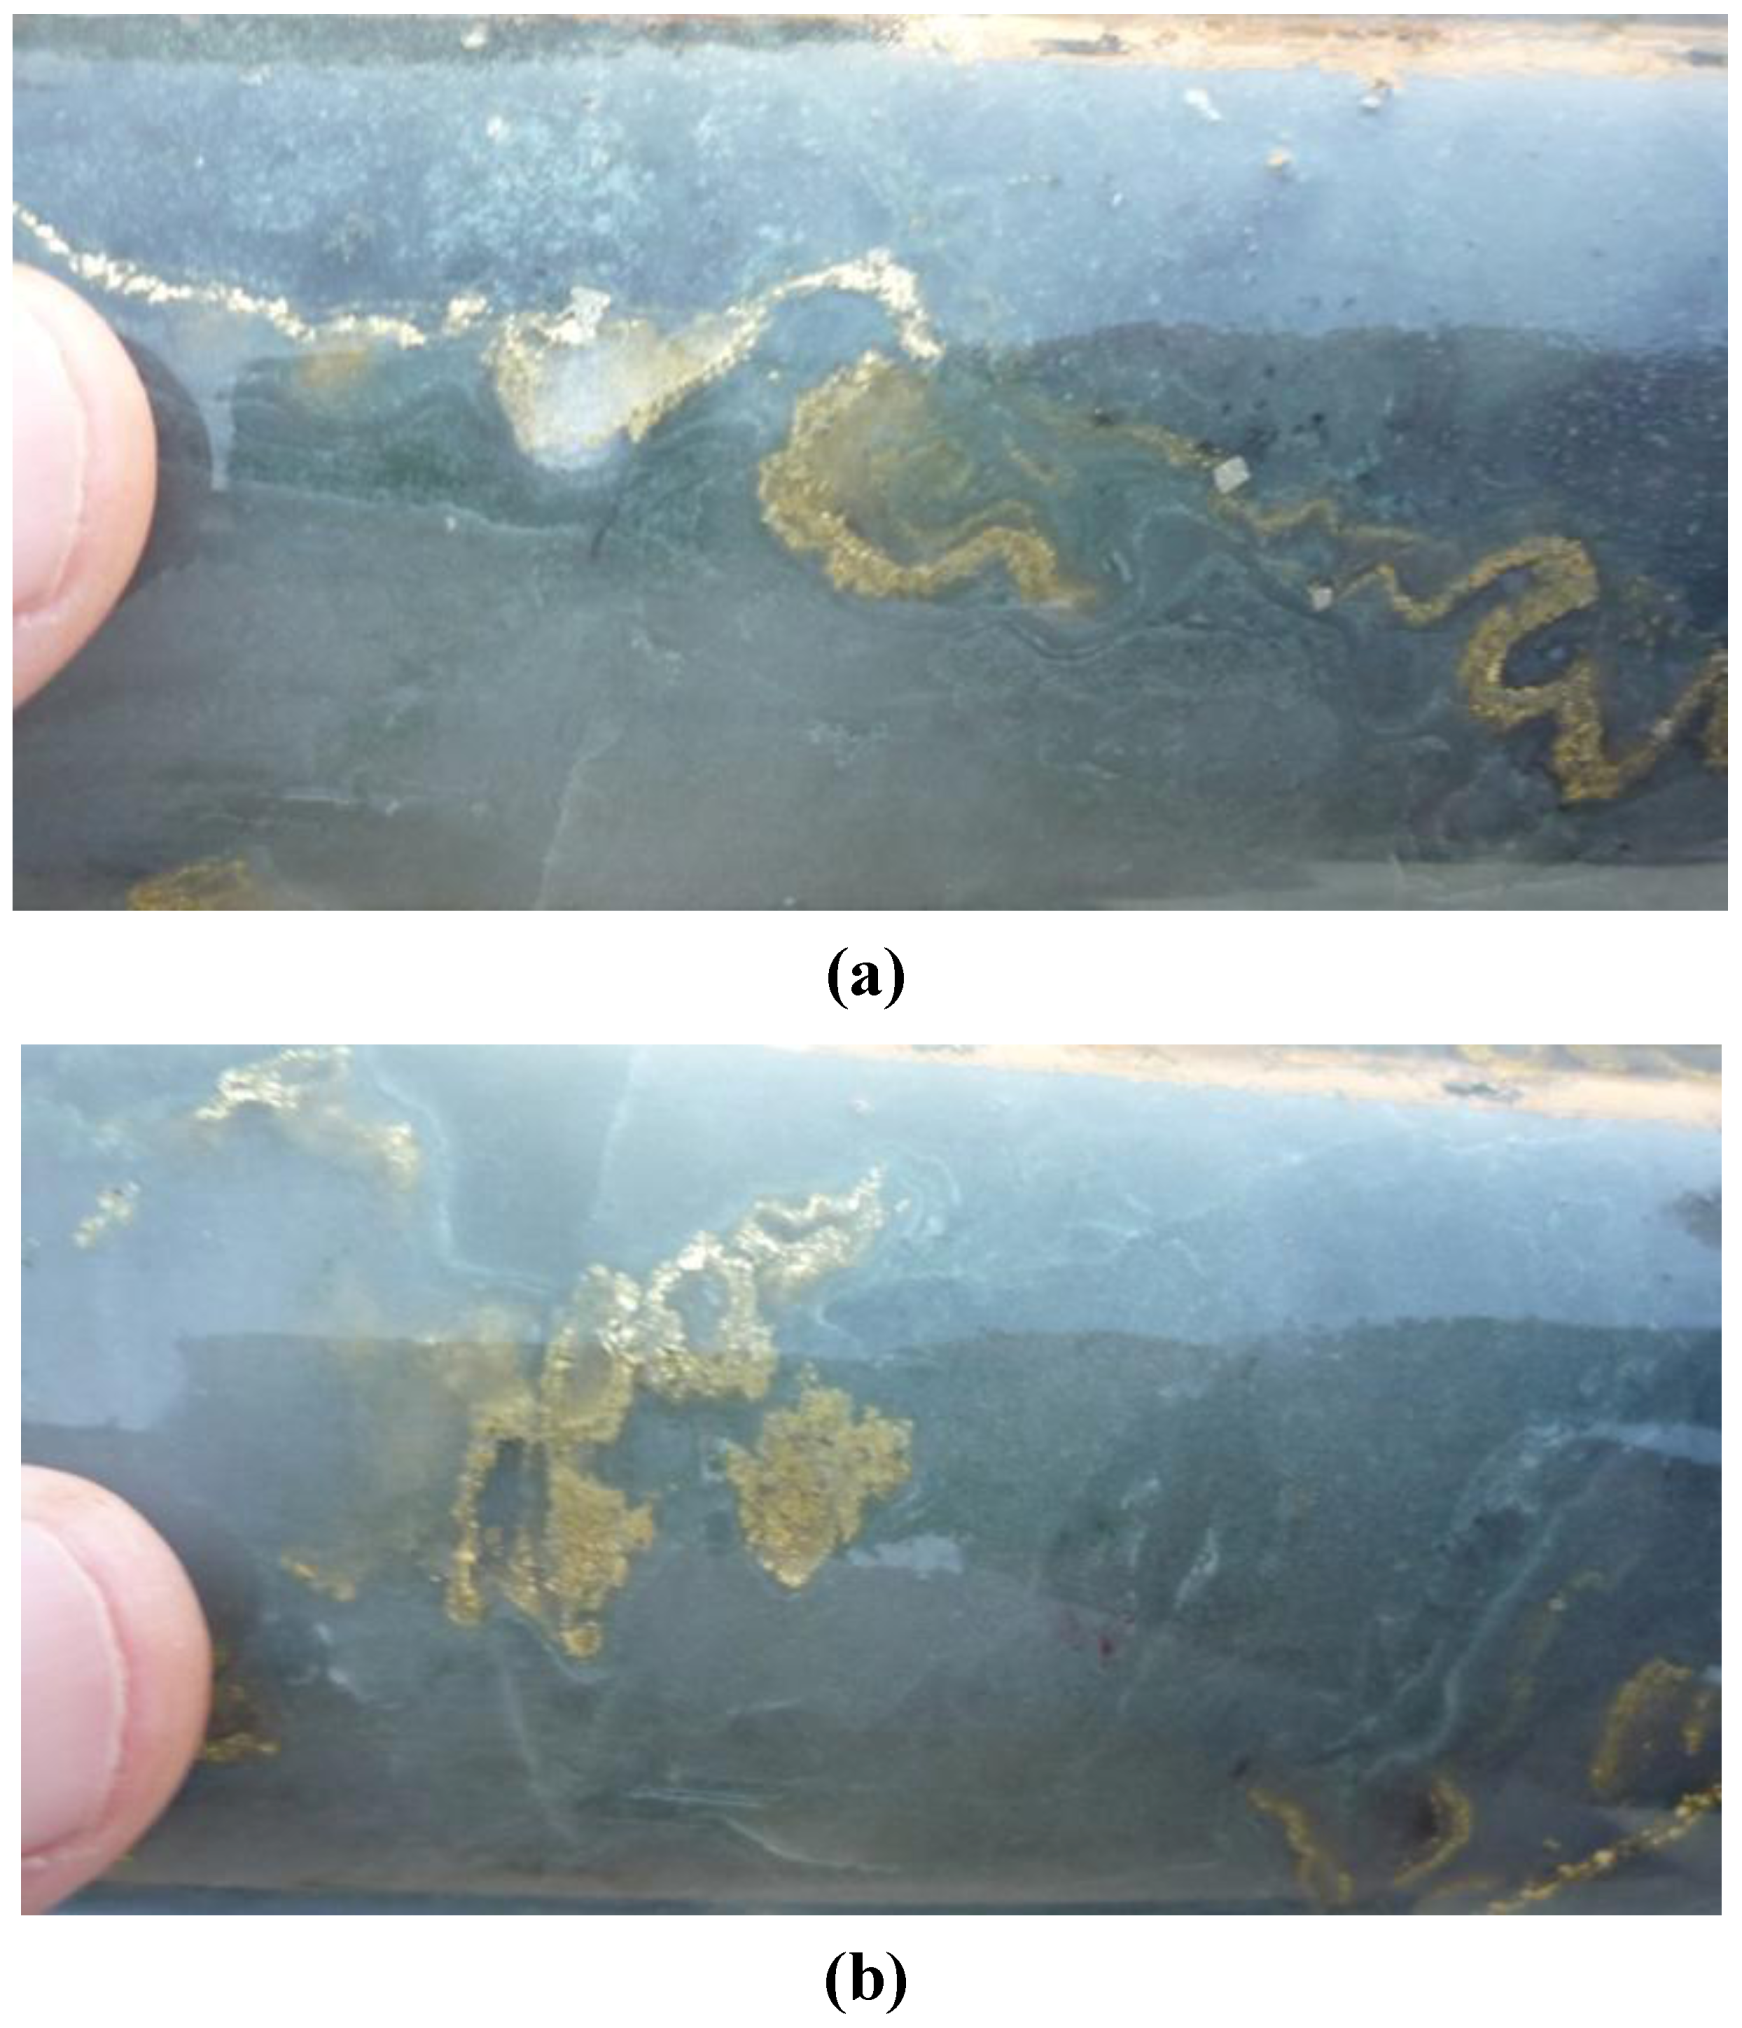
Figure 10.
Photographs of diamond drill core from recent (2010) exploration drilling at the Haile deposit, South Carolina. Electrum bands (gold) are interpreted here to be formed similar to those from Sleeper and Buckskin National: by aggregation of electrum nanoparticles. Compare to
Figure 2. Photographs are courtesy of Romarco Minerals.
