Article

Dehydration and Rehydration of Carbonated Fluor- and Hydroxylapatite

1
Department of Chemistry, Franklin & Marshall College, Lancaster, PA 17603, USA
2
Department of Earth and Planetary Sciences and The Center for Materials Innovation, Washington University in St. Louis, St. Louis, MO 63130-4899, USA
*
Author to whom correspondence should be addressed.
Minerals 2012, 2(2), 100-117; https://doi.org/10.3390/min2020100
Submission received: 12 January 2012 / Revised: 19 March 2012 / Accepted: 21 March 2012 / Published: 30 March 2012

Abstract

:
The recent definitive deuterium solid state NMR spectroscopic evidence for structural water in fluor- and hydroxylapatites has prompted our study of the conditions necessary for the removal and reincorporation of this important structural feature of apatites. Thermal gravimetric analysis of 20 synthetic carbonated calcium hydroxylapatite (CCaApOH) samples and nine carbonated calcium fluorapatite (CCaApF) samples has been used to determine the amount of structural and adsorbed water in each sample. No correlation between the weight percent and number of moles of structural water and the weight percent carbonate in CCaApOH and CCaApF has been found. In contrast, there appears to be a relationship between the amount of adsorbed water and the carbonate concentration in the fluorapatites prepared with a two hour digestion time, as well as in the hydroxylapatites prepared with one hour digestion periods, presumably due to the effect of carbonate on crystallite size. Structural water can be removed from the apatite lattice, primarily above 200 °C, but heating to over 550 °C is required for complete removal. This water can be partly reincorporated through an apparently kinetically-controlled process that is enhanced by an increase in time and/or temperature. We speculate that the incorporation of structural water occurs at the beginning of the formation of the apatite structure, approximately coincident with the incorporation of carbonate. We also speculate that water is both removed and reincorporated by proton transfers from water molecules to hydroxide ions.

Graphical Abstract

1. Introduction

The presence of water in apatite (Ca10(PO4)6(OH)2 = CaApOH) has long been a topic of debate [1,2,3,4,5,6,7,8,9,10,11,12,13,14,15]. Our detection of a 2H NMR resonance of D2O in the lattice of both carbonated calcium hydroxylapatite (CCaApOH) and carbonated calcium fluorapatite (CCaApF) prepared in D2O provided unambiguous evidence for the presence of water within the lattice of both of these apatites [16]. Calcium ions reside in two types of sites in apatite, one in which calcium is bonded only to oxygens, i.e., Ca(1), and another site in which calcium is bonded to both oxygens and a monovalent anion, i.e., Ca(2). We have proposed that the water molecules are likely located between the monovalent anions that are positioned in the channels created by the Ca(2) ions.
Given that apatites are notoriously hygroscopic and that some workers have assumed that they contain structural water in addition to this adsorbed water, it is not surprising that previous work has been carried out on the dehydration of apatites. Early studies are accurately summarized by LeGeros et al. [5]. Some of these studies were accomplished on biological apatite and thus were confounded by the presence of organic matter. The study by LeGeros et al. [5] on both dental apatites and synthetically precipitated apatites showed that the adsorbed water was reversibly removed and readsorbed below 200 °C, whereas the water released between 200 °C and 400 °C was irreversibly lost and caused a contraction in the a-axis [5]. Moreover, the a-axis is larger in aqueously precipitated apatites than in those “mineral or synthetic apatites from nonaqueous systems” [5].
An aspect of apatite that has not been well documented previously is the effect of carbonate substitution in apatite on the amount of water that it structurally incorporates. The fact that there are two well-recognized mechanisms by which carbonate can enter the apatite structure [17] makes this question particularly interesting. Carbonate can substitute for either the monovalent anion in the channels (called A-type substitution) or for tetrahedral phosphate groups (B-type susbstitution). In both cases, substitution involves a mismatch in the ionic charges, which leads to the development of vacancies in other ion sites. Intriguingly, LeGeros and colleagues [17] said that there are no carbonate substitutes for OH in hydroxylapatite if water is involved in the synthesis. Subsequent research confirmed that only minor (at the level of 10–15%) A-type substitution of carbonate for OH occurs in low-temperature synthetic or in biological apatite [18,19].
The objectives of this study were to: (a) determine the relationship between the amount of structural water and the carbonate content, (b) characterize the evolution and reincorporation of structural water, and (c) determine the effect of dehydration and rehydration on the structure of carbonated hydroxyl- and fluorapatites.

2. Experimental Section

2.1. Synthesis

Samples of CCaApOH were synthesized from readily soluble sources of calcium, phosphate, and carbonate in a pH-buffered aqueous solution. All water used in the synthesis was double-deionized (Milli-Q) or deionzied and passed through a hydroxylapatite column. Nitrogen gas was bubbled through the water for ca. six hours to remove carbon dioxide. The NaOH solutions were freshly prepared after each 5–6 syntheses, and the solution bottles were sealed with Parafilm to prevent contamination by carbon dioxide. Magnetic stirrers were used for mixing.
Approximately 250 mL of water was heated to the desired temperature (typically 60 °C or 80 °C) in a large beaker. According to the desired final carbonate to phosphate ratio, a specific amount of NaHCO3 (Acros-Organics, 99.5%) was dissolved in the water. The pH was elevated to and maintained at 9.0 ± 0.3 (Hanna Instruments pH 209 meter with a Thermo Ross Sure-Flow combination reference/pH electrode) through addition of 0.1M NaOH (Acros, 97%). To the heated carbonate solution, 25 mL of a 0.15M Ca(NO3)2·4H2O (99%, Sigma-Aldrich, St. Louis, MO, USA) solution and 25 mL of a 0.09 M NaH2PO4·H2O (Aldrich, 98%) solution were added at a rate of 1 mL/min from separate burettes. After addition of the calcium and phosphate solutions, the mixture was stirred and kept at 60 °C (some syntheses were also performed at 80 °C) for 2 hours (some for 1 h). After this equilibration time, stirring was discontinued, and the mixture was allowed to cool to room temperature and then was filtered through a glass filter crucible of medium porosity. The product powder was washed three times with warm water, and then dried at 120 °C in a vacuum pistol or dried in an evacuated vacuum dessicator for a minimum of 24 h.
The synthesis of CCaApF followed the same procedure used for CCaApOH, except that a 0.6 M NaF solution was added simultaneously with and at the same rate as the addition of the calcium and phosphate solutions.

2.2. Sample Analysis and Characterization

Carbonate analysis. The weight percent carbonate in each sample was determined via C, H, N combustion elemental analysis or from the weight loss between 600 °C and 800 °C in TGA analyses. A standard curve for TGA weight loss converted to carbonate wt% was constructed using the results of combustion analyses performed by Schwarzkopf Microanalytical Laboratories (Woodside, NY, USA) or Galbraith Laboratories (Knoxville, TN, USA).
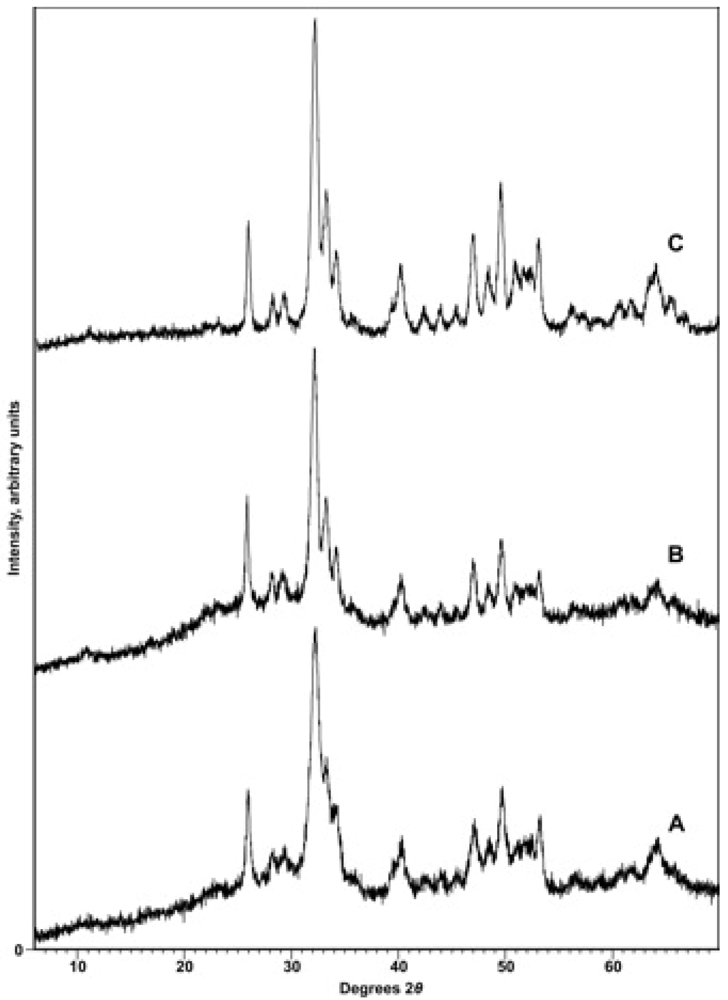
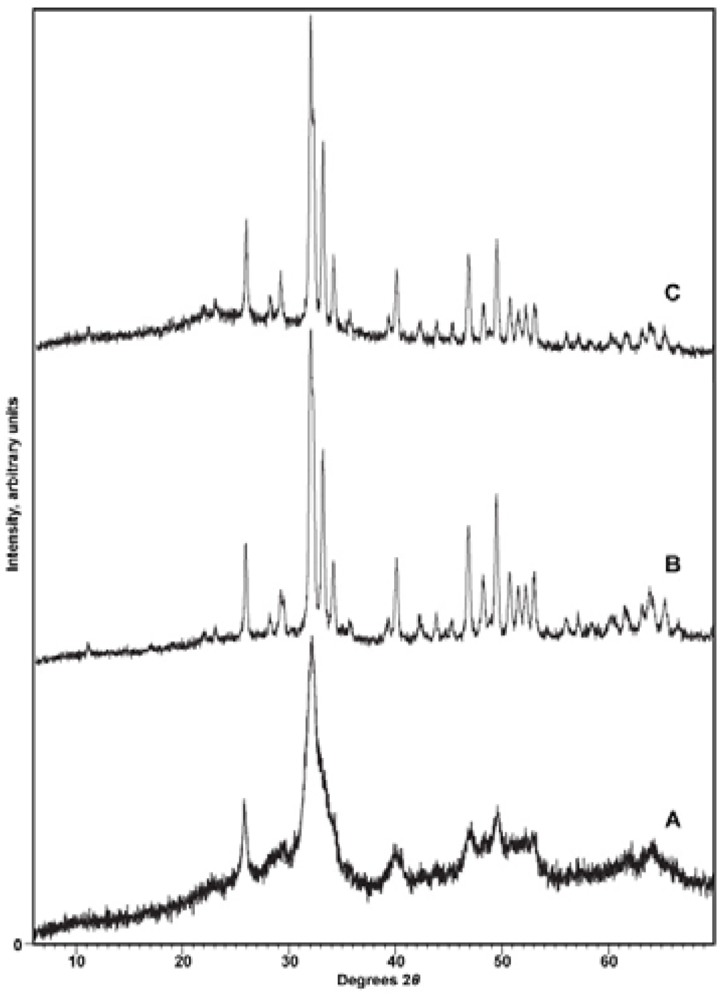
X-ray diffraction. To confirm the identity of the precipitate and to reveal any contaminating phases (particularly CaCO3), samples were subjected to X-ray diffraction analysis with either a Phillips 3520 X-ray diffractometer producing Cu-Kα radiation in conjunction with a monochromator or a PANalytical X’Pert PRO MPD (Multi-Purpose Diffractometer) Theta-Theta System with Cu-Kα radiation (λ = 1.54060 Å). Instrumental settings included a step size of 0.02° 2-theta and a dwell time of 1 s over the analysis range of 2 to 60° 2-theta. The scans were analyzed using the program PANalytical X’Pert HighScore Plus (Version 2.2e). Sample diffraction patterns were compared with the ICDD powder X-ray diffraction pattern database (PDF Release 2) using the HighScore Plus search-match algorithm. X-ray diffractograms were also used to detect other phases present in the synthetic apatites, particularly CaCO3, and to look for patterns of changing crystallinity of the samples.
Cell parameters were determined using the PANalytical X’Pert PRO MPD diffractometer with samples mounted in 16 mm cavity slides with a step size of 0.02 2-theta over the range 15 to 70° 2-theta. The entire XRD pattern was profile-fitted by determining the profile for each individual peak and ultimately fitting the entire scan. The indexing method used was usually McMaille, but in some circumstances the Treor method was employed. The unit cell candidate was chosen by its high figure of merit relative to other candidates, its symmetry, and the absence of un-indexed peaks. Although the uncertainties in the cell parameters were generally within ±0.0007 Å for a single measurement, repeated measurements in some cases produced larger errors, more of the order of ±0.002 Å.
Raman microprobe analysis. Raman spectroscopy was used to further characterize the phosphate phase in the precipitate and to reveal the presence of contaminating phases more sensitively than by powder X-ray diffraction. The integrated, fiber-optically coupled microscope-spectrometer-detector confocal Raman system used in this study is from Kaiser Optical (Ann Arbor, Michigan). The HoloLab Series Research Raman Spectrometer was configured for 532-nm laser excitation, and it covered the spectral range of 0 to 4300 Δcm−1 with a resolution of 2.5 cm−1 using an Andor high-resolution, thermoelectrically cooled CCD array detector. Analyses of powders were made using an Olympus 80× objective with an N.A. of 0.75 or an Olympus 50x objective with an N.A. of 0.55. Each Raman analysis represents the average of 32 acquisitions of 4 seconds each. Every sample underwent 3 to 5 analyses. The laser power was 10 mW at the sample surface, and the diameter of the beam was one to several micrometers at the sample surface. The focus was optimized so as to obtain the maximum signal:noise ratio.
The program GRAMS 32 (Galactic, Salem, NH, USA) was used to deconvolve appropriate Raman peaks into their component spectral bands. The bands were modeled as mixed Gaussian and Lorentzian in form, in order to derive the wavenumber position, width at half-maximum intensity, and area of the bands.

2.3. Thermogravimetric Analysis

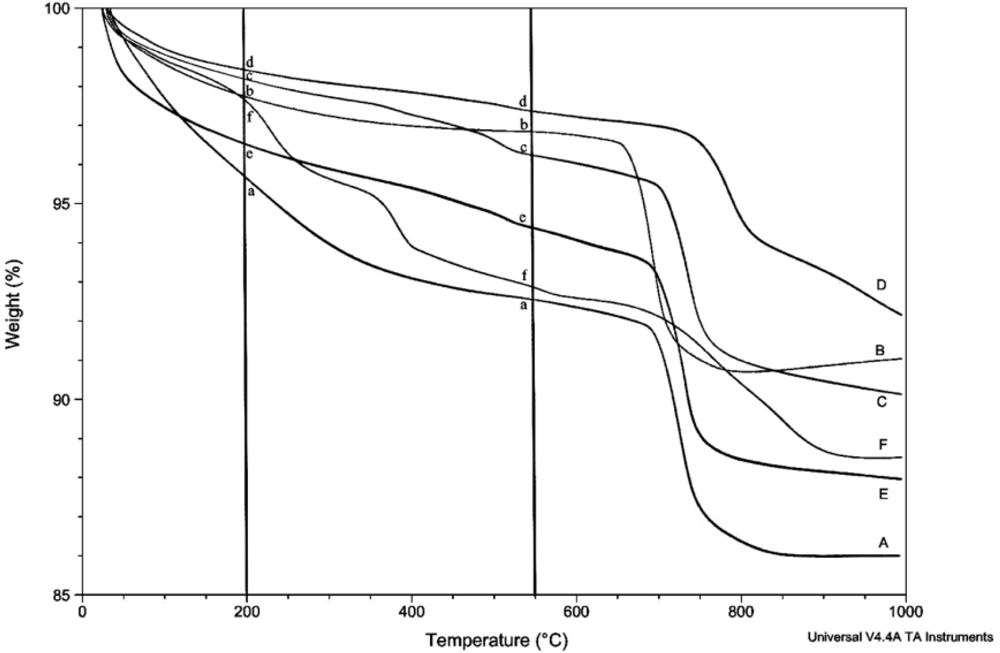
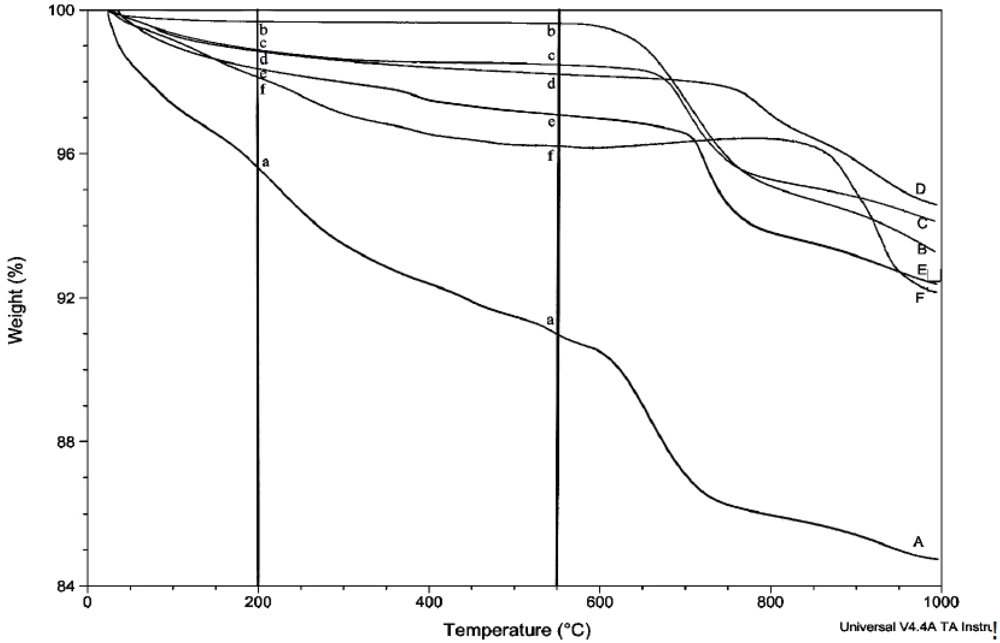
The amount of structural and adsorbed water in the samples was determined by thermogravimetric analysis (TGA) using the TA Instruments TGA Q500. Unless otherwise stated, thermograms were obtained using a balance flow of 40 mL/min and a sample flow of 60 mL/min of dry nitrogen gas. Samples of 7–20 mg were heated to 1,000 °C at a rate of 15 °C/min. The relative uncertainty for the measurement of weight loss in multiple scans is estimated to be about 8%. Linear regression lines are shown for most plots involving weight loss, but correlation coefficients are not given because of their generally low values and limited utility.

2.4. Rehydration Experiments

Prior to rehydration experiments, the purity of the phase was checked by XRD, and after vacuum drying for 24 h, TGA was used to measure the amount of water in the apatite. The weight percent lost between room temperature and 200 °C was taken to be adsorbed water, while the weight percent lost between 200 °C and 550 °C indicated the loss of structural water.
For each rehydration experiment four 50 mg samples of an apatite were dehydrated by heating in four ceramic crucibles in a muffle furnace for 2 h at 550 °C. These samples were then either immersed in water for 2 h at room temperature (22 °C), immersed in boiling water for 2 h, immersed in water for 4 days at room temperature, or immersed in water for 4 days at 100 °C. The rehydrations were performed in 100 mL round-bottom flasks with magnetic stirring using double-deionized (Milli-Q) water previously saturated with nitrogen gas. The samples were filtered by suction with Buchner funnels and dried in vacuo (4 torr) for at least 24 hours. The dried samples were analyzed by TGA and XRD.

3. Results

3.1. Characterization of Compounds

Raman spectroscopic analysis confirmed that the only phosphate phase present is CCaApOH or CCaApF, as appropriate to the given experiment. No other carbonate-bearing phase was detected; for instance, no calcite (CaCO3) was found. The overwhelming dominance of B-type substitution of carbonate for phosphate was confirmed by the detection of only the peak at ~1,073 Δcm−1. No peak was detected at ~1,108 Δcm−1, as would be expected for A-type substitution of carbonate for the monovalent anion [20]. The exact detection limits for the latter spectral peak are not known. The presence of 10–15% of the total carbonate in A-type substitution, as typically reported for low-temperature (including biological) apatite [19], cannot be ruled out. The higher the carbonate concentration of the precipitated apatite, the broader the ν1 symmetric P-O stretch band at about 960 Δcm−1, indicating that the internal atomic ordering of the phase decreased as carbonate concentration increased. The intensity of the O-H stretching band for hydroxyl at ~3,570 Δcm−1 decreased as carbonate concentration increased as expected, based on the dominant B-type substitution as discussed below.
The presence of the correct apatite phase and the absence of CaCO3 at greater than the detection limit of 0.3% was confirmed by powder X-ray diffraction. Cell parameters were determined for each apatite with a different carbonate content.
The decrease in the a-axis value of approximately 0.1 Å over a carbonate concentration range of 14% and the increase in the c-axis of 0.06 Å over the same range strongly suggest that carbonate has substituted for phosphate (i.e., B-type substitution) in our hydroxylapatites [6,17,18,21]. For the fluorapatites the a-axis decreased by about 0.09 Å over a carbonate concentration range of 12%, while the c-axis increased by about 0.03 Å [22]. The maximum observed substitution value of ca. 16 wt.% carbonate in our syntheses is also consistent with B-type substitution; A-type substitution can accommodate a maximum of only 6 wt.% carbonate [21]. Based on both Raman and X-ray diffraction data, we have adopted the B-site formula Ca10−x(PO4)6−x(CO3)x(X)2−x, where X = F or OH, as an appropriate stoichiometric formulation of our apatites.

3.2. Structural Water

We have used thermogravimetric analysis to determine the weight percent structural water as a function of the carbonate composition in both the hydroxyl and fluor series of apatites. Weight loss from 200 °C to 550 °C was selected as the temperature range most indicative of water tightly constrained within the apatite lattice. LeGeros et al. [5] used the range of 200 °C to 400 °C, while Ivanova et al. [6] chose the range of 150 °C to 500 °C for the loss of structural water. The release of water from room temperature to 200 °C can be attributed to adsorbed or surface water, although most studies use a value closer to 150 °C as the upper limit of adsorbed water [6]. Elliot’s 1994 summary [18] of previous thermal decomposition studies demonstrated release of lattice water from 120 °C to 400–500 °C. Holcomb and Young have suggested that structural water continues to be released above 550 °C [23]. Füredi-Milhofer et al. identified the release of water by mass spectrometry in two major intervals, one centered at 88 °C, the other at 225 °C [24]. Because carbonate decomposition begins in the 600 °C to 650 °C region, 550 °C is a pragmatic upper limit for the identification of structural water by TGA. In fact, our TGA scans show that most of the weight loss between 200 °C and 550 °C occurs below 400 °C.
Figure 1 displays the weight percent structural water in 20 hydroxylapatites prepared using a two-hour digestion time. The weight percent values are clustered about three, consistent with values found by LeGeros et al. [5] for both enamel and synthetic CCaApOH, and are not dependent on the carbonate concentration of the apatite. Weight losses between 100 °C and 450 °C of about 3 wt.% for synthetic non-stoichiometric hydroxylapatites have also been observed by Reyes-Gasga et al. [25].
Figure 1. Weight percent structural water and molecules of water per unit cell as a function of weight percent carbonate in 20 carbonated hydroxylapatite samples synthesized with two hour digestion periods at 60°C. Black diamonds indicate weight percent structural water and gray squares indicate molecules of water per unit cell. Hollow markers indicate a synthesis and digestion at 80°C.
Minerals 02 00100 g001
The number of water molecules per unit cell (mpuc) was obtained by assuming that carbonate substitutes for phosphate and that this substitution is accompanied by vacancies in both calcium and hydroxyl sites, as depicted in the B-type formula Ca10−x(PO4)6−x(CO3)x(OH)2−x. Conversion of weight percent carbonate, as obtained from either TGA or combustion analysis, to a B-type formula, followed by use of weight percent structural water to produce a hydrate formula Ca10−x(PO4)6−x(CO3)x(OH)2−x(H2O)y provides the number of moles (molecules) of structural water per formula unit (cell). Three interesting conclusions can be derived from Figure 1. The first is that there is no obvious dependence of the structural water content on the carbonate content of the apatite. The second is that the number of molecules per unit cell shows a greater regularity than does the weight percent water. The third conclusion is that the average mpuc is 1.5 for the hydroxylapatites.
Weight percent adsorbed water as determined by weight loss from room temperature to 200 °C is shown in Figure 2, from which it is clear that there is considerably more scatter than that observed for structural water.
Figure 2. Weight percent adsorbed water as a function of weight percent carbonate in 20 carbonated hydroxylapatite samples synthesized with two-hour digestion periods at 60°C. Hollow diamonds indicate a synthesis and digestion at 80°C. The linear regression line for all points is shown.
Minerals 02 00100 g002
The greater scatter is not surprising given the many variables that can affect the surface area of the apatite crystallites and consequently their ability to adsorb water. These variables include: (a) method of synthesis, generally the more rapid the rate of addition of reagents in a precipitation reaction the smaller the particle size; (b) digestion time and temperature, longer times and higher temperatures giving rise to more mature, larger particles; (c) method and duration of drying, including mechanical details such as the amount of sample dried and the extent of exposed surface area.
The effect of digestion time on adsorbed water is illustrated by the weight loss for compounds prepared with a one-hour digestion (rather than the two-hour digestion period shown in Figure 2) in Figure 3. For one-hour digestion the scatter in weight percent of adsorbed water is greater than for a two-hour period, and an upward trajectory with increasing carbonate concentration is noticeable.
For the fluorapatites, made by a two-hour digestion process, the weight percent structural water and the adsorbed water are presented in Figure 4 and Figure 5, respectively. The adsorbed water relationship (Figure 5) shows less scatter than that of the hydroxyl analog (Figure 3), and also shows a more distinct correlation with weight percent carbonate. By comparison with the hydroxylapatites, the effect of carbonate in restricting crystallite size [26] is more obvious in the synthesis using the two-hour digestion period for the fluorapatites. It is important to notice that the average mpuc of 1.6 is essentially the same as that for the hydroxyl analogs.
Figure 3. Weight percent adsorbed water as a function of weight percent carbonate in carbonated hydroxylapatite samples synthesized with one-hour digestion periods. Hollow diamonds indicate a synthesis and digestion at 80°C as opposed to the 60°C synthesis and digestion of the other samples. The regression line is for all samples prepared with a one-hour digestion period.
Minerals 02 00100 g003
Figure 4. Weight percent structural water (black diamonds) and molecules per unit cell (gray squares) in fluorapatites prepared with a two-hour digestion period at 60°C as a function of weight percent carbonate.
Minerals 02 00100 g004
Figure 5. Weight percent adsorbed water in fluorapatites prepared with a two-hour digestion at 60°C as a function of weight percent carbonate.
Minerals 02 00100 g005

3.3. Rehydration

We also investigated the ease with which structural water can be replaced in the apatite lattice after dehydration. These experiments consisted of the dehydration of small amounts of apatite samples with different carbonate compositions in a muffle furnace at 550 °C for two hours, followed by immersion (with magnetic stirring) in: (a) water for 2 hours at 22 °C, (b) water for 4 days at 22 °C, (c) water at 100 °C for 2 hours, and (d) water at 100 °C for 4 days. Samples were filtered by suction, dried in vacuo for 24 h and then analyzed by XRD and TGA. Figure 6 shows the TGA plots of a hydroxylapatite containing 13.4 wt.% carbonate that had been rehydrated under different conditions. The difference in the weight loss at the beginning and end of the 200 °C to 550 °C interval (essentially the slope of the line in this area) indicates that the effectiveness of rehydration is a stronger function of rehydration temperature than duration. Thus, scans E and F of samples rehydrated at 100 °C show considerably more reincorporation of water than scans C and D on samples rehydrated at 22 °C.
The same is true for the rehydration of the CCaApF sample shown in Figure 7. The “double drop” seen in scan F after the rehydration experiment at 100 °C for four days appears in several of the TGA scans obtained under these conditions for both fluor- and hydroxylapatites and suggests the possible release of water molecules at two distinct temperatures.
Figure 6. TGA scans for CCaApOH sample containing 13.4 wt% carbonate after it had been processed under the following conditions: (A) the synthesized sample after in vacuo drying; (B) the sample after dehydration at 550 °C; (C) the dehydrated sample after immersion in water for 2 h at 22°C; (D) the dehydrated sample after immersion in water for 4 days at 22°C; (E) the dehydrated sample after immersion in water for 2 h at 100°C and (F) the dehydrated sample after immersion in water for 4 days at 100°C. The decrease in weight from 200°C to 550°C is used to determine structural water.
Minerals 02 00100 g006
Figure 7. TGA scans for CCaApF sample containing 10.5 wt% carbonate after it had been processed under the following conditions: (A) the synthesized sample after in vacuo drying; (B) the sample after dehydration at 550°C; (C) the dehydrated sample after immersion in water for 2 h at 22°C; (D) the dehydrated sample after immersion in water for 4 days at 22°C; (E) the dehydrated sample after immersion in water for 2 h at 100 °C; and (F) the dehydrated sample after immersion in water for 4 days at 100°C. The decrease in weight from 200°C to 550°C is used to determine structural water.
Minerals 02 00100 g007
A total of six apatites—three hydroxyl- and three fluorapatites—with different carbonate concentrations were subjected to these rehydration experiments. The results show no discernible relationship between the extent of rehydration of the apatites and their concentration of carbonate. Consequently, we have summarized the effect of rehydration temperature and time by averaging the wt% water released in each of the three carbonated CCaApOH samples as well as the wt% water released in each of the three CCaApF samples. As shown in Figure 8 and Figure 9, on average, samples dehydrated at 550 °C are not completely rehydrated even after four days or immersion at 100 °C. Additionally in these experiments, the temperature of rehydration seems to be a more important factor than the duration of the rehydration.
The XRD patterns of CCaApOH and CCaApF samples are shown in Figure 10 and Figure 11, respectively. For the CCaApOH sample there is a considerable decrease in full width at half maximum (FWHM) after dehydration; the decrease in full width at half maximum for CCaApF is much less. For both apatites, there is little change in peak positions after dehydration and rehydration, and the rehydrated samples have FWHM values similar to those of the dehydrated samples.
Dehydration at 300 °C did not have a significant effect on the XRD peak widths of three CCaApF samples, and rehydration of these samples for 2 h at 22 °C resulted in peak widths about the same as those of the original and dehydrated samples. The same behavior was observed for the one CCaApOH sample examined. Thus, although 300 °C is sufficient to remove a significant amount of water from the lattice, the temperature may not be high enough to enlarge the crystallites. Consistent XRD peak positions document that removal of water from the apatite lattice does not change the structure of the lattice, whereas peak narrowing indicates an increase in crystallite size. Because our method of water removal involves heating, we cannot separate the effects of temperature from those of water loss as causes for the increase in crystallite size. Interestingly, replacement of at least some of the water after dehydration produces crystallites with about the same (or in same cases larger) size.
Figure 8. Average weight percent structural water from TGA analyses in CCaApOH samples containing 3.8, 12.8, and 13.4 wt.% carbonate. Treatment includes (A) the synthesized sample after in vacuo drying; (B) the sample dehydrated at 550°C; (C) the dehydrated sample after immersion in water for 2 h at 22°C; (D) the dehydrated sample after immersion in water for 4 days at 22°C; (E) the dehydrated sample after immersion in water for 2 h at 100°C and (F) the dehydrated sample after immersion in water for 4 days at 100°C. The average standard deviation of the average of the three samples for treatments A–F is 0.4%.
Minerals 02 00100 g008
Figure 9. Average weight percent structural water (from TGA analysis) in CCaApF samples containing 1.5, 7.6, and 10.5 wt.% carbonate. Treatment includes (A) the synthesized sample after in vacuo drying; (B) the sample dehydrated at 550°C; (C) the dehydrated sample after immersion in water for 2 h at 22°C; (D) the dehydrated sample after immersion in water for 4 days at 22°C; (E) the dehydrated sample after immersion in water for 2 h at 100°C; and (F) the dehydrated sample after immersion in water for 4 days at 100 °C. The average standard deviation of the average of the three samples for treatments A–F is 0.4%.
Minerals 02 00100 g009
Figure 10. XRD patterns for CCaApOH containing 12.8 wt% carbonate; (A) after in vacuo drying; (B) after dehydration at 550°C; and (C) after rehydration for 4 days at 100 °C.
Minerals 02 00100 g010
Figure 11. XRD patterns for CCaApF containing 7.6 wt% carbonate; (A) after in vacuo drying; (B) after dehydration at 550°C; and (C) after rehydration for 4 days at 100°C.
Minerals 02 00100 g011
Subtle changes in the structure of the apatites were monitored by measuring unit cell parameters from a full pattern analysis of the XRD patterns. The bar graphs in Figure 12 and Figure 13 portray the a- and c-axis lengths as a function of the treatment of the precipitated CCaApX. In most cases, the cell parameters of the treated samples are within about 0.02 Å of those of the originally precipitated apatite. Note, however, the larger changes in the a-axis after dehydration of the CCaApF samples. In all cases, dehydration produced an increase in the a-axis and a decrease in the c-axis. Upon dehydration our samples showed a larger change in the a-axis for the fluoraptites, but a larger change in the c-axis for the hydroxylapatites.
Figure 12. Variation in a-axis length for two fluor- and two hydroxylapatites, showing the effect of dehydration and rehydration.
Minerals 02 00100 g012
Figure 13. Variation in c-axis length for two fluor- and two hydroxylapatites, showing the effect of dehydration and rehydration.
Minerals 02 00100 g013

4. Discussion

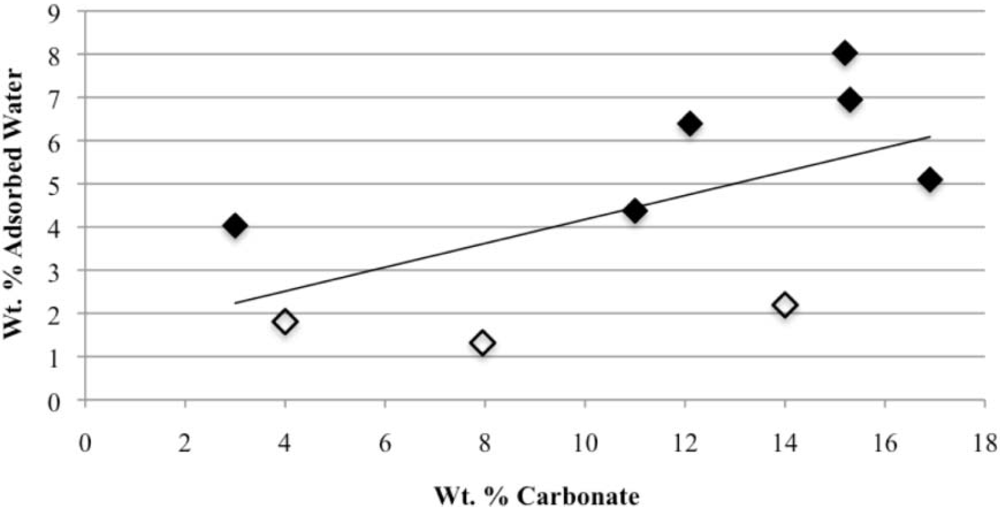
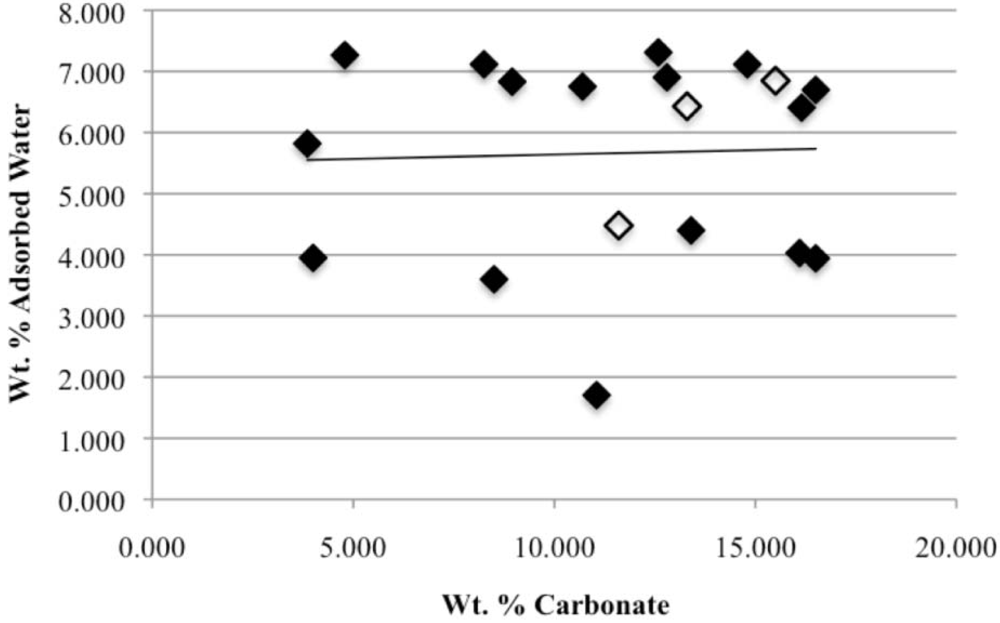
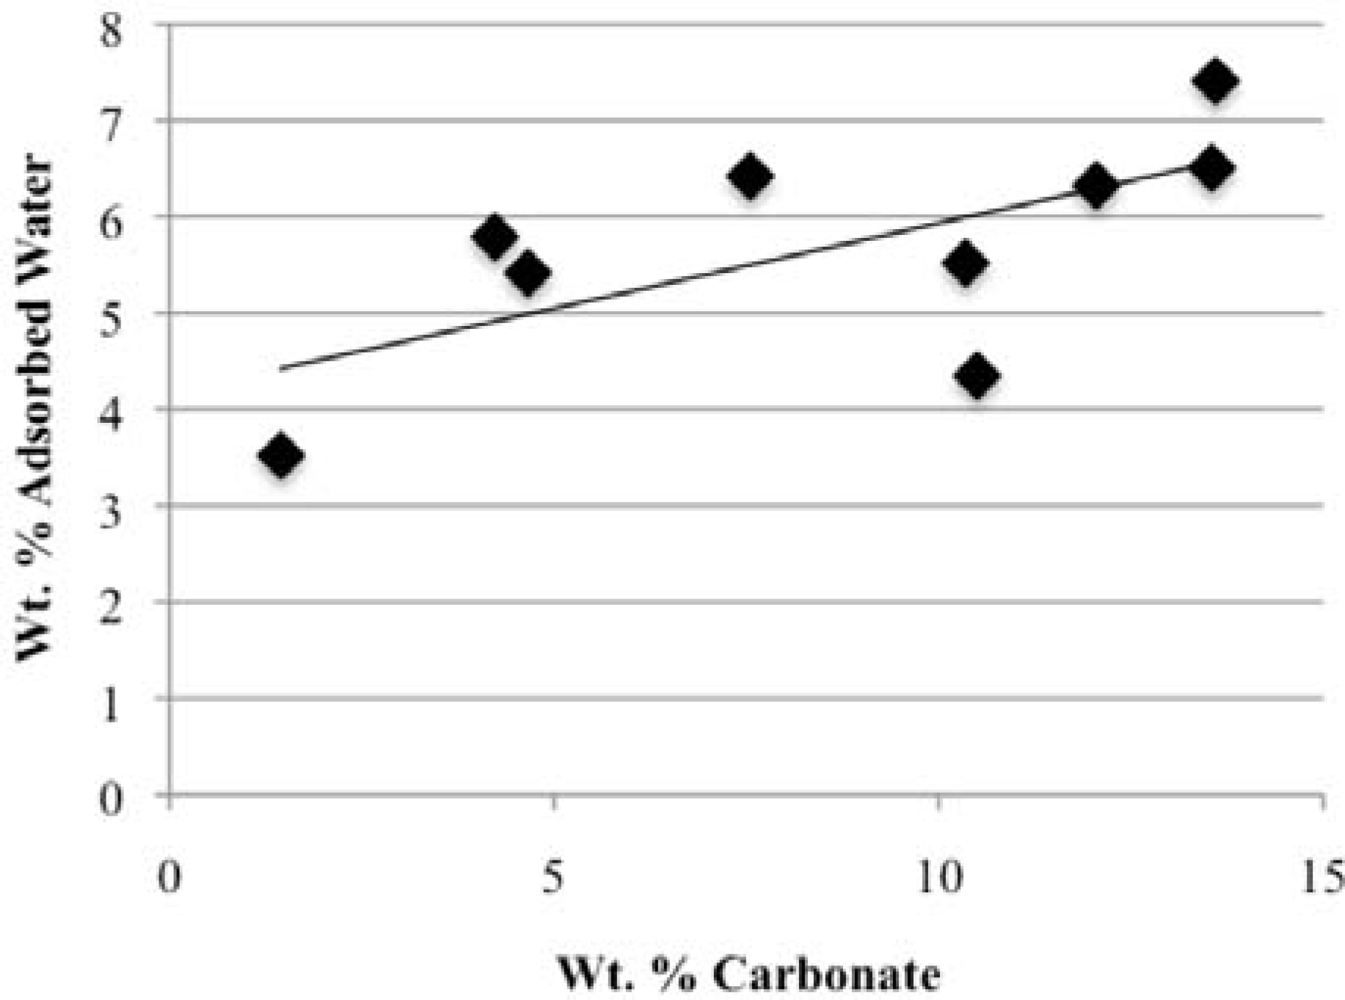
Our study has revealed a number of important characteristics of calcium hydroxyl- and fluorapatites. First, there is a positive correlation between the concentrations of adsorbed water and carbonate. This correlation most likely is the result of a decrease in crystallite size (and consequent increase in surface area) as carbonate content increases [27,28]. This correlation with adsorbed water is seen in our CCaApF samples prepared with a two-hour digestion time and in CCaApOH samples prepared with a one-hour digestion time. Presumably, a shorter time for crystal maturation amplifies this relationship between carbonate concentration and abundance of adsorbed water.
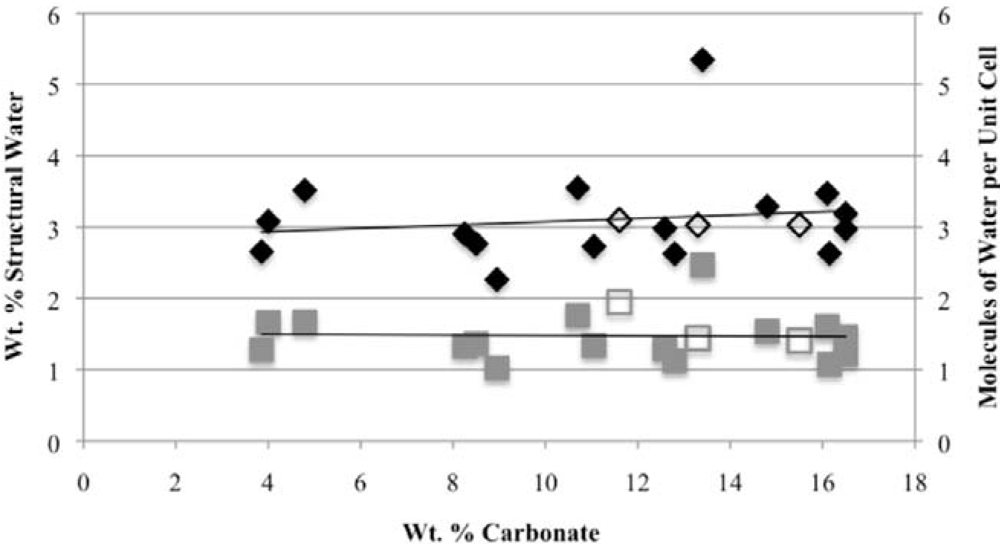
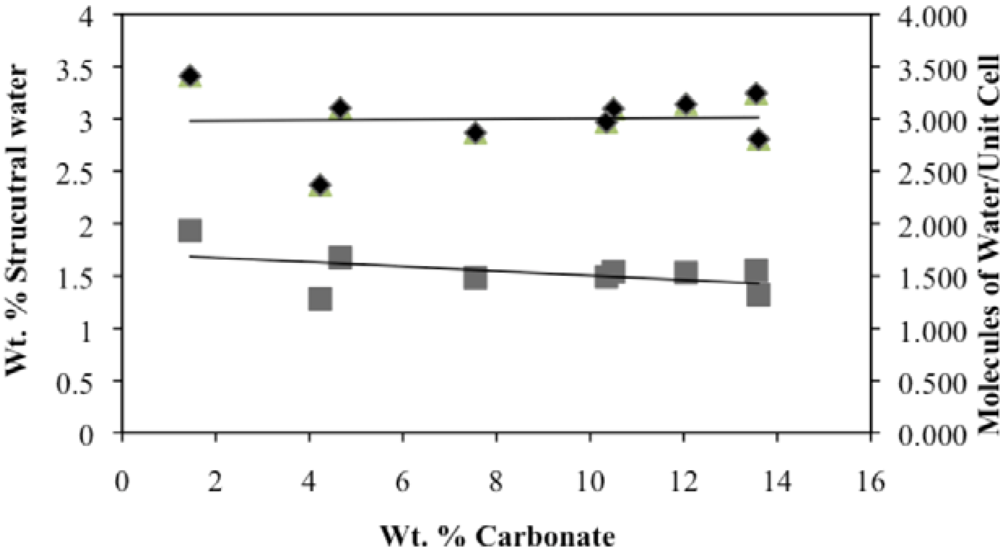
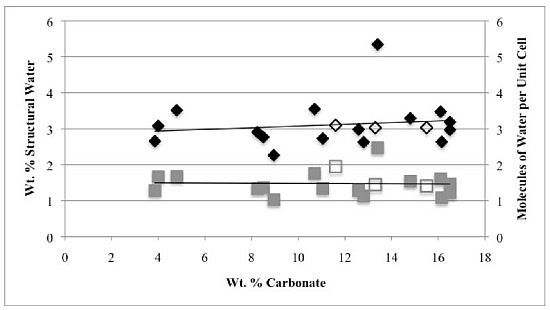
Second, the number of molecules of structural water per unit cell is independent of the carbonate concentration, with an average value of 1.5–1.6 for both hydroxyl- and fluorapatites. These values, based on direct TGA measurements, compare favorably with the modeled values of Wilson et al. [8,29] of 1.05 for a Na-bearing CCaApOH with 12.5 wt% carbonate and 1.97 for a Ca-deficient hydroxylapatite based on Rietveld refinement of XRD data. Because the Ca10(PO4)6(X)2 unit cell contains a total of two X ions (X = F or OH), our number of proposed water molecules per unit cell is close to the total number of X groups in the uncarbonated apatite. If, as we suggest below, the water molecules occupy space between the X ions along the c-axis, then the maximum number of water molecules per unit cell would be two. Of course, the molecules might also occupy hydroxide or fluoride vacancies, which could result in a maximum mpuc value of greater than two.
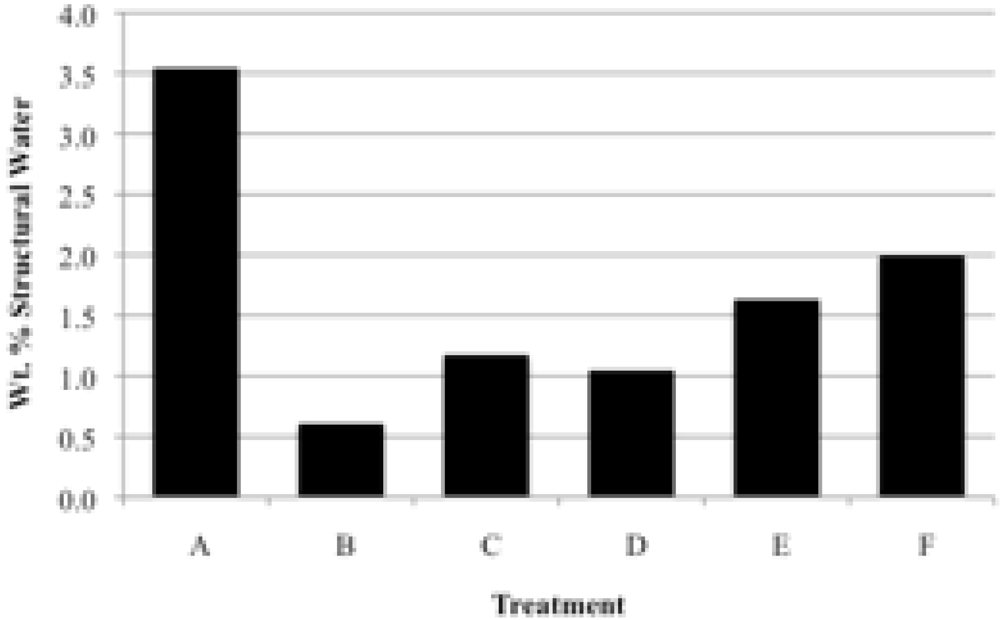
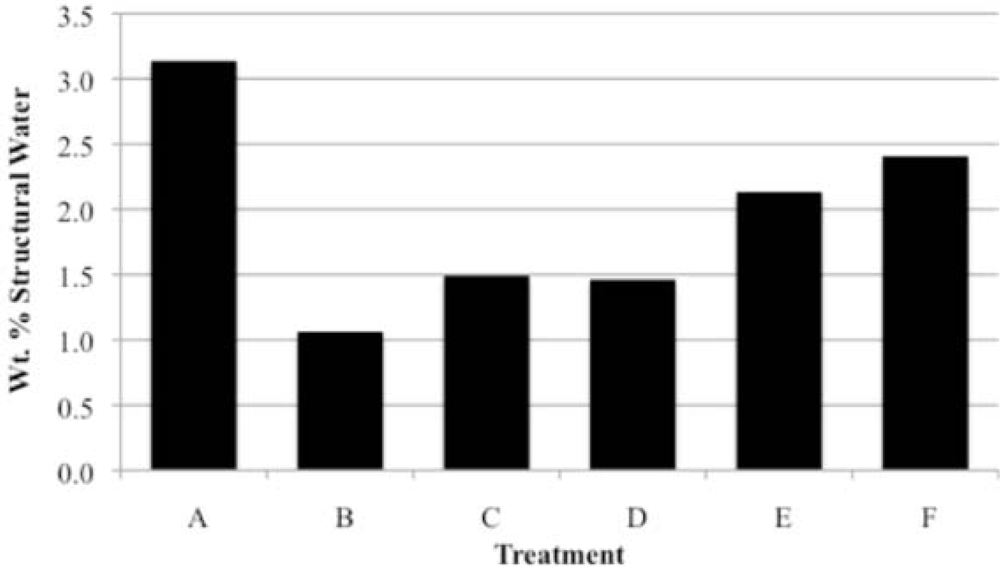
Third, structural water in CCaApOH and CCaApF can be removed by heating, but is only partially replaced by immersion of the dehydrated apatite in water. Fourth, the extent of rehydration is strongly increased by an increase in temperature and less strongly by an increase in immersion time. Fifth, crystallite size is increased by thermally-induced dehydration, probably as a result of the effect of temperature in decreasing crystal strain and increasing the stability of the crystallites. Crystallite size also is increased by rehydration, likely a result of increased time and/or temperature as well as the diffusion-stimulated dissolution/reprecipitation process for crystal growth.
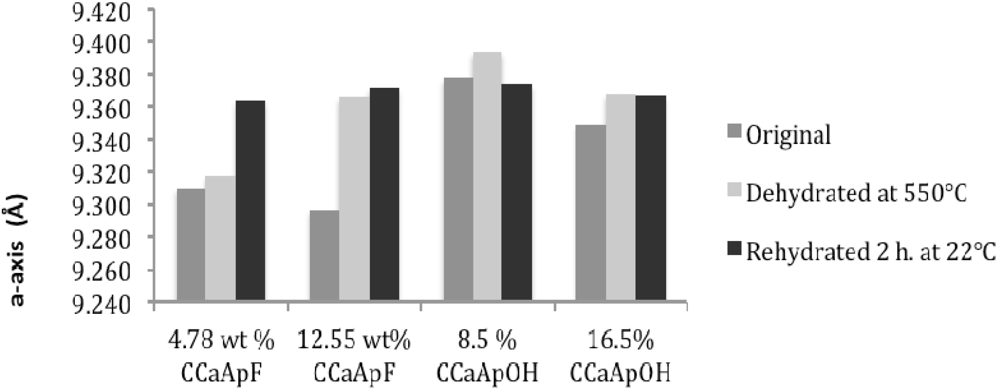
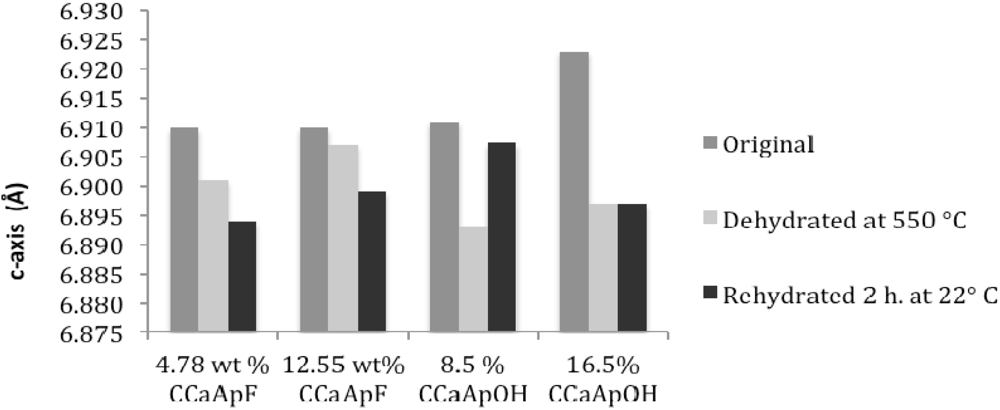
Sixth, both dehydration and rehydration lead to a generally small (<0.02 Å) increase in a-axis and a decrease in c-axis value relative to the lengths of the axes in the original hydrated apatite. The slightly longer a-axis of tooth enamel compared to precipitated hydroxylapatite has been attributed to the presence of lattice water [5,23]. Holcomb and Young observed a contraction in the a-axis of about 0.014 Å at about 300 °C, which they attributed to loss of structural water [23]. LeGeros et al. [5] found a decrease in the a-axis of a synthetic carbonated hydroxylapatite upon heating from 200 °C to 400 °C, which they inferred was due to water loss. This result was followed by a significant increase in the a-axis during heating to 800 °C, which they attributed to loss of carbonate. Their work also shows that after heating to 550 °C the a-axis is longer than the length at 200 °C [5]. Hence, the larger values obtained by us for the a-axis after heating to 550 °C are in agreement with the findings of LeGeros et al. [5]. The larger value for the a-axis after heating to 550 °C is likely due in part to thermal expansion of the lattice [6,19]. Although the removal of a species from a structure would normally suggest a decrease in “size” of the structure, it is possible that the presence of water in the c-axis channels (see below) provides for increased attraction of ions to these H-bonding, dipolar water molecules. Such attraction in turn may produce anisotropic contraction leading to a slight decrease in the a-axis and an increase in the c-axis relative to the anhydrous apatite. It should be noted that there is more variability in the a- and c-axis data after rehydration at 22 °C for 2 h.
Two simple models can be envisaged to account for these observations. The first involves the formation of the apatite structure in a two-step process. In the first step the structure begins to assemble by ion aggregation, and portions of the hexagonal structure form with water molecules in the channels defined by the Ca(2) cations. In the presence of carbonate ions, the second step involves replacement of phosphate ions by carbonate ions (in type-B substitution) and evolution of the structure. In the carbonated apatite structure, the accommodation of water molecules does not require widening of the channels in the concomitant removal of Ca(2) and hydroxyl ions. Rather, the water molecules are present in the nascent structure that is formed before substitution occurs. A second model involves simultaneous incorporation of water and carbonate into a poorly ordered phase. This model does not suffer from the kinetically unlikely replacement of carbonate for phosphate necessary in the first model. Both models rationalize the lack of relationship between carbonate and water content. Because a total of two molecules of water per unit cell can fit between the monovalent anions in the channels this model also accounts for the nearly constant value of mpuc of close to two.
Dehydration requires an increase in kinetic energy sufficient to evacuate water molecules from the channels, which presumably exit primarily at basal crystallite terminations along the c-axis [19,23]. With a c-axis length of ca 7 Å, only about 7 to 10 unit cells stacked along the c-axis provide structures of the appropriate length for a newly formed crystallite. For water molecules toward the interior of the crystallite, the energy required for expulsion will be greater than for those closer to the terminations. It is therefore expected that removal of all of the structural water would be difficult and that water expulsion would occur over a range of temperatures.
Because water is confined in the solid apatite and translationally free in the surrounding liquid water, removal of the structural water molecules from the solid is an entropically favored process. Moreover, dehydration is an enthalpically unfavorable process (∆H > 0) because of the stronger hydrogen-bonding and charge-dipole interactions within the apatite relative to those in bulk water. Because the temperature dependence of the equilibrium between structural water and bulk water is controlled by the enthalpy change for the dehydration process, an increase in temperature should increase the amount of water displaced during dehydration. For the reverse process of rehydration, an increase in temperature should decrease the amount of water replaced into the structure of the apatite. However, rehydration appears to be mainly a rate-driven process that benefits primarily from the kinetic energy of the bulk water molecules and their rate of diffusion into and through the apatite structure.
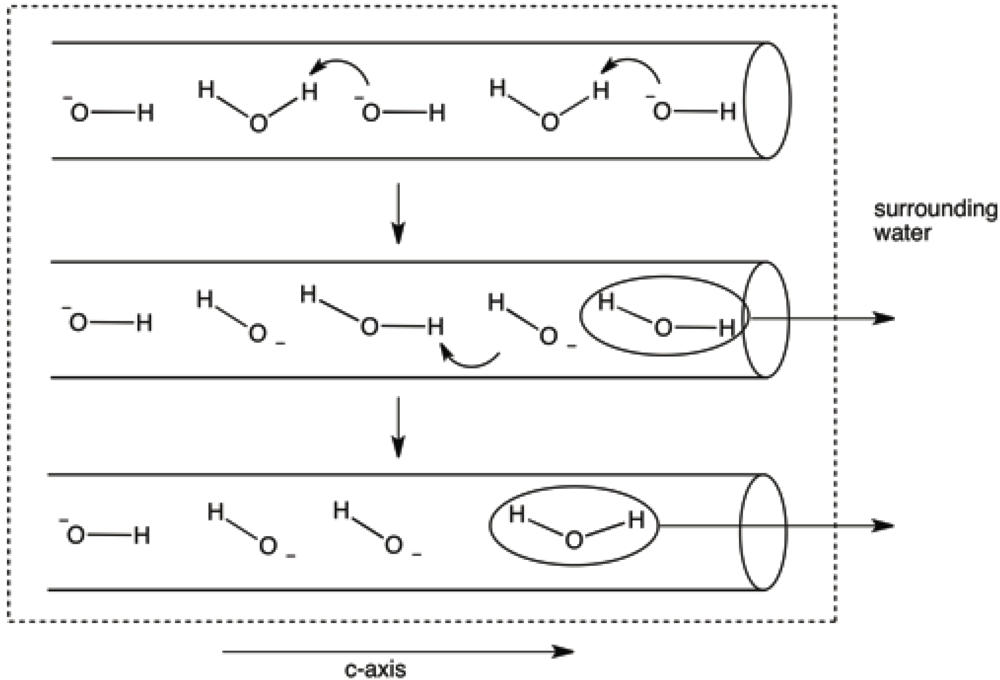
It seems likely that water would enter, and leave, the structure through termination sites of the c-axes. One could further speculate that the passage of water molecules (both during dehydration and rehydration) through the c-axis channels might occur, especially at higher temperatures, by transfer of a proton from a water molecule to a neighboring hydroxide ion (see Figure 14), resulting in expulsion of water molecules at the basal termini and an increase in hydroxide ions in the channel. Eventually, repulsion of proximate hydroxide ions and attractions to other ions would result in movement of the ions to their lowest energy lattice positions, and dehydration would be complete. This mechanism would be consistent with the well-known observation that the hydroxide ion concentration in carbonated and non-stoichiometric apatites increases as a function of temperature [4,23,30,31,32,33,34,35,36].
Figure 14. Model invoking proton transfers from water molecules to hydroxide ions in the c-axis channels. This model eliminates the necessity for translation of water molecules past hydroxide ions as the former exit the c-axis terminus.
Minerals 02 00100 g014
Other researchers have proposed that the lattice water molecules occupy hydroxide vacancies [5,11,37,38,39]. The processes of both dehydration and rehydration therefore increase diffusion along the c-axis channels possibly stimulating recrystallization. These changes are also consistent with our observations of changes in peak widths in XRD patterns.

5. Conclusions

Our work has demonstrated that there is no correlation between the amount and number of moles of structural water and the weight percent carbonate in CCaApOH and CCaApF. There does appear to be a correlation, however, between the amount of adsorbed water and the carbonate concentration in the fluorapatites studied, as well as in those hydroxylapatites prepared with only one hour digestion periods. This relationship presumably reflects the long-acknowledged [30] decrease in apatite crystal size with increasing carbonate concentration. Structural water can be removed from the apatite lattice, but only at temperatures above approximately 200 °C. Considerably higher temperatures are required for complete removal. This water can be at least partly reincorporated, in a process that is apparently kinetically-controlled and enhanced by an increase in time and/or temperature.
We speculate that the incorporation of structural water occurs at the beginning of the formation of the apatite structure, approximately coincident with the incorporation of carbonate. This model rationalizes the lack of dependence of the amount of structural water on the percent carbonate incorporated into the lattice (and the number of hydroxyl vacancies produced). We also speculate that water is both removed and reincorporated by transfer of a proton from a water molecule to a hydroxide ion, thereby forming adjacent water molecules and leaving a hydroxide ion. A succession of these proton-transfer steps during dehydration eventually results in water molecules at the c-axis terminus of the crystallite, where they diffuse into the surrounding water or environment.

Acknowledgments

We are indebted to Franklin & Marshall College for support from the Lucille and William Hackman endowment, the Blake Pepinsky Chemistry Student Research Fund, and the Fred Suydam Research Fund.

References

  1. McConnell, D. The crystal structure of bone. Clin. Orthop. 1962, 23, 253–268. [Google Scholar]
  2. McConnell, D. Crystal chemistry of bone mineral: Hydrated carbonate apatites. Am. Mineral. 1970, 55, 1659–1669. [Google Scholar]
  3. Simpson, D.R. The nature of alkali carbonate apatites. Am. Miner. 1964, 49, 363–376. [Google Scholar]
  4. Biltz, M.M.; Pellegrino, E.D. The hydroxyl content of calcified tissue mineral. Calcif. Tissue Int. 1971, 36, 259–263. [Google Scholar]
  5. LeGeros, R.Z.; Bonel, G.; Legros, R. Types of “H2O” in human enamel and in precipitated apatites. Calcif. Tissue Int. 1978, 26, 111–118. [Google Scholar]
  6. Ivanova, T.I.; Frank-Kamenetaskaya, O.V.; Kol’tsov, A.B.; Ugolkov, V.L. Crystal structure of calcium-deficient carbonated hydroxyapatite. Thermal decomposition. J. Solid State Chem. 2001, 160, 340–349. [Google Scholar] [CrossRef]
  7. Wilson, R.M.; Elliott, J.C.; Dowker, S.E.P.; Smith, R.I. Rietveld structure refinement of precipitated carbonate apatite using neutron diffraction data. Biomaterials 2004, 25, 2205–2213. [Google Scholar]
  8. Wilson, E.E.; Awonusi, A.; Morris, M.D.; Kohn, D.H.; Tecklenburg, M.M.J.; Beck, L.W. Three structural roles for water in bone observed by solid-state NMR. Biophys. J. 2006, 90, 3722–3731. [Google Scholar]
  9. Yesinowski, J.; Eckert, H. Hydrogen environments in calcium phosphates: Proton MAS NMR at high spinning speeds. J. Am. Chem. Soc. 1987, 109, 6274–6282. [Google Scholar]
  10. Sfihi, H.; Rey, C. 1-D and 2-D double heteronuclear magnetic resonance study of the local structure of type b carbonate fluoroapatite. In Magnetic Resonance in Colloid and Interface Science, Nato ASI Series II; Fraissard, J., Lapina, B., Eds.; Kluwer Academic Publishers: Alphen aan den Rijn, The Netherlands, 2002; pp. 409–422. [Google Scholar]
  11. Kaflak-Hachulska, A.; Samoson, A.; Kolodziejski, W. 1H MAS and 1H CP/MAS NMR study of human bone mineral. Calcif. Tissue Int. 2003, 73, 476–486. [Google Scholar]
  12. Kolmas, J.; Kolodziejski, W. Concentration of hydroxyl groups in dental apatites: A solid-state 1H MAS NMR study using inverse 31P-1H cross-polarization. Chem. Commun. 2007, 4390–4392. [Google Scholar]
  13. Cho, G.; Wu, Y.; Ackerman, J.L. Detection of hydroxyl ions in bone mineral by solid-state NMR spectroscopy. Science 2003, 300, 1123–1127. [Google Scholar]
  14. Sandström, D.E.; Jarlbring, M.; Antzutkin, O.N.; Forsling, W. A spectroscopic study of calcium surface sites and adsorbed iron species at aqueous fluorapatite by means of 1H and 31P MAS NMR. Langmuir 2006, 22, 11060–11064. [Google Scholar]
  15. Mason, H.E.; McCubbin, F.M.; Smirnov, A.; Phillips, B.L. Solid-state NMR and IR spectroscopic investigation of the role of structural water and F in carbonate-rich fluorapatite. Am. Mineral. 2009, 94, 507–516. [Google Scholar]
  16. Yoder, C.H.; Pasteris, J.D.; Worcester, K.N.; Schermerhorn, D.V. Structural water in carbonated hydroxylapatite and fluorapatite: Confirmation by solid state 2H NMR. Calcif. Tis. Int. 2011, 90, 60–67. [Google Scholar]
  17. LeGeros, R.Z.; Trautz, O.R.; Klein, E.; LeGeros, J.P. Two types of carbonate substitution in the apatite structure. Experientia 1969, 25, 5–7. [Google Scholar]
  18. Elliot, J.C. Structure and chemistry of the apatites and other calcium orthophosphates. In Studies in Inorganic Chemistry; Elsevier: Amsterdam, The Netherlands, 1994; Volume 18. [Google Scholar]
  19. Elliott, J.C. Calcium phosphate biominerals. In Phosphates-geochemical, Geobiological, and Materials Importance; Kohn, M.J., Rakovan, J., Hughes, J.M., Eds.; Reviews in Mineralogy and Geochemistry, Mineralogical Society of America: Chantilly, VA, USA, 2002; Volume 48, pp. 427–453. [Google Scholar]
  20. Penel, G.; Leroy, G.; Rey, C.; Bres, E. MicroRaman spectral study of the PO4 and CO3 vibrational modes in synthetic and biological apatites. Calcif. Tissue Int. 1998, 63, 475–481. [Google Scholar]
  21. Pan, Y.; Fleet, M.E. Compositions of the apatite-group minerals: Substitution mechanisms and controlling factors. In Phosphates-Geochemical, Geobiological, and Materials Importance; Kohn, M.J., Rakovan, J., Hughes, J.M., Eds.; Reviews in Mineralogy and Geochemistry, Mineralogical Society of America: Chantilly, VA, USA, 2002; Volume 48, pp. 13–49. [Google Scholar]
  22. Rosseeva, E.V.; Buder, J.; Simon, P.; Schwarz, U.; Frank-Kamenetskaya, O.V.; Kneip, R. Synthesis, characterization, and morphogenesis of carbonated fluorapatite-gelatine nanocomposites: A complex biomimetic approach toward the mineralization of hard tissues. Chem. Mater. 2008, 20, 6003–6013. [Google Scholar] [CrossRef]
  23. Holcomb, D.W.; Young, R.A. Thermal decomposition of human tooth enamel. Calcif. Tissue Int. 1980, 31, 189–201. [Google Scholar]
  24. Füredi-Milhofer, H.; Hlady, V.; Baker, F.S.; Beebe, R.A.; Wikholm, N.W. Temperature-programmed dehydration of hydroxyapatite. J. Colloid Interface Sci. 1979, 70, 1–9. [Google Scholar]
  25. Reyes-Casga, J.; Garcia-Garcia, R.; Arellano-Jimenez, M.J.; Sanchez-Pastenes, E.; Tiznado-Orozco, G.E.; Gill-Chavarria, I.M.; Gomez-Casga, G. Structural and thermal behaviour of human tooth and three synthetic hydroxyapaties from 20 to 600 °C. J. Phys. D Appl. Phys. 2008, 41. [Google Scholar]
  26. Baig, A.A.; Fox, J.L.; Young, R.A.; Wang, Z.; Hsu, J.; Higuchi, W.I.; Chhettry, A.; Zhuang, H.; Otsuka, M. Relationships among carbonated apatite solubility, crystallite size, and microstrain parameters. Calcif. Tissue Int. 1999, 64, 437–449. [Google Scholar] [CrossRef]
  27. Termine, J.D.; Eanes, E.D.; Greenfield, D.J.; Nylen, M.U.; Harper, R.A. Hydrazine-deproteinated bone mineral: Physical and chemical properties. Calcif. Tissue Int. 1973, 12, 73–90. [Google Scholar]
  28. Rey, C.; Combes, C.; Drouet, C.; Sfihi, H.; Barroug, A. Physico-chemical properties of nanocrystalline apatites: Implications for biominerals and biomaterials. Mater. Sci. Eng. C 2007, 27, 198–205. [Google Scholar] [Green Version]
  29. Wilson, R.M.; Elliott, J.C.; Dowker, S.E.P.; Rodriguez-Lorenzo, L.M. Rietveld refinements and spectroscopic studies of the structure of Ca-deficient apatite. Biomaterials 2005, 26, 1317–1327. [Google Scholar]
  30. Termine, J.D.; Lundy, D.R. Hydroxide and carbonate in rat bone mineral and its synthetic analogues. Calcif. Tissue Int. 1973, 13, 73–82. [Google Scholar]
  31. Rey, C. Apatite chanel and zeolite-like properties. In Hydroxyapatite and Related Materials; Brown, P.W., Constanz, B., Eds.; CRC Press: Boca Raton, FL, USA, 1994; pp. 257–262. [Google Scholar]
  32. Rey, C.; Miquel, J.L.; Facchini, L.; Legrand, A.P.; Glimcher, M.J. Hydroxyl groups in bone mineral. Bone 1995, 16, 583–586. [Google Scholar]
  33. Shi, J.; Klocke, A.; Zhang, M.; Bismayer, U. Thermal behavior of dental enamel and geologic apatite: An infrared spectroscopic study. Am. Mineral. 2003, 88, 1866–1871. [Google Scholar]
  34. Pasteris, J.D.; Wopenka, B.; Freeman, J.J.; Rogers, K.; Valsami-Jones, E.; van der Houwen, J.A.M.; Silva, M.J. Lack of OH in nanocrystalline apatite as a function of degree of atomic order: Implications for bone and biomaterials. Biomaterials 2004, 25, 229–238. [Google Scholar]
  35. Etok, S.E.; Valsami-Jones, E.; Wess, T.J.; Hiller, J.C.; Maxwell, C.A.; Rogers, K.D.; Manning, D.A.C.; White, M.L.; Lopez-Capel, E.; Collins, M.J.; et al. Structural and chemical changes of thermally treated bone apatite. J. Mater. Sci. 2007, 42, 9807–9816. [Google Scholar]
  36. Kuhn, L.; Grypas, M.D.; Rey, C.C.; Wu, Y.; Ackerman, J.L.; Glimcher, M.J. A comparison of the physical and chemical differences between cancellous and cortical bovine bone mineral at two ages. Calcif. Tissue Int. 2008, 83, 146–154. [Google Scholar]
  37. Joris, S.J.; Amberg, C.H. The nature of the deficiency in nonstoichiometric hydroxyapatite. II. Spectroscopic studies of calcium and strontium hydroxyapatite. J. Phys. Chem. 1971, 75, 3172–3178. [Google Scholar] [CrossRef]
  38. De Maeyer, E.A.P.; Verbeeck, R.M.H.; Naessens, D.E. Stoichiometry of Na+- and CO32−-containing apatites obtained by hydrolysis of monetite. Inorg. Chem. 1993, 32, 5709–5714. [Google Scholar]
  39. Wilson, E.E.; Awonusi, A.; Morris, M.D.; Kohn, D.H.; Tecklenburg, M.M.J. Three structural roles for water in bone observed by solid-state NMR. Biophys. J. 2006, 90, 3722–3731. [Google Scholar]

