
Thermally Induced Bentonite Alterations in the SKB ABM5 Hot Bentonite Experiment
by
 , and
, and
Ritwick Sudheer Kumar
1,*, 
Carolin Podlech
1,
Georg Grathoff
1,
Laurence N. Warr
1 and
Daniel Svensson
2 1
Institute of Geography and Geology, University of Greifswald, 17489 Greifswald, Germany
2
Department of Research and Safety Assessment, SKB—Swedish Nuclear Fuel and Waste Management Company, SE-102 40 Stockholm, Sweden
*
Author to whom correspondence should be addressed.
Minerals 2021, 11(9), 1017; https://doi.org/10.3390/min11091017
Submission received: 11 August 2021
/
Revised: 10 September 2021
/
Accepted: 14 September 2021
/
Published: 18 September 2021
(This article belongs to the Special Issue Clay Mineral Transformations after Bentonite/Clayrocks and Heater/Water Interactions from Lab and Large-Scale Tests)
Abstract
:Pilot sites are currently used to test the performance of bentonite barriers for sealing high-level radioactive waste repositories, but the degree of mineral stability under enhanced thermal conditions remains a topic of debate. This study focuses on the SKB ABM5 experiment, which ran for 5 years (2012 to 2017) and locally reached a maximum temperature of 250 °C. Five bentonites were investigated using XRD with Rietveld refinement, SEM-EDX and by measuring pH, CEC and EC. Samples extracted from bentonite blocks at 0.1, 1, 4 and 7 cm away from the heating pipe showed various stages of alteration related to the horizontal thermal gradient. Bentonites close to the contact with lower CEC values showed smectite alterations in the form of tetrahedral substitution of Si4+ by Al3+ and some octahedral metal substitutions, probably related to ferric/ferrous iron derived from corrosion of the heater during oxidative boiling, with pyrite dissolution and acidity occurring in some bentonite layers. This alteration was furthermore associated with higher amounts of hematite and minor calcite dissolution. However, as none of the bentonites showed any smectite loss and only displayed stronger alterations at the heater–bentonite contact, the sealants are considered to have remained largely intact.
1. Introduction
Bentonite barriers are currently being considered for the sealing of high-level radioactive waste (HLRW) repositories to encapsulate the waste safely and prevent the circulation of hydrous fluids. Bentonites are types of clays formed commonly as an alteration product of volcanic ash, with a high content (typically >60%) of smectite minerals [1]. Smectites have the unique property of swelling in the presence of water, which leads to extremely low permeabilities (values in 10−13 m·s−1 for highly compacted bentonites [2]), ideal for sealing underground cavities. Therefore, bentonites are likely to be installed in future engineered radioactive waste sites that use the multibarrier storage concept [3].
An important part of evaluating the suitability of bentonite barriers is to test their performance in pilot repository sites where materials are emplaced under constrained conditions for several years [3,4,5,6]. It is also important to determine how the bentonite properties respond to more extreme HLRW conditions, in particular when subjected to elevated temperatures [7,8]. High-temperature conditions are known to increase the rate of smectites alterations significantly [9,10], and may therefore lead to the eventual breakdown of the clay seal in HLRW repositories. The SKB (Swedish Nuclear Fuel and Waste Management Company, Stockholm, Sweden) has been testing the performance of bentonite barriers for many years in a granite formation at a depth of 500 m using the currently favored KBS-3 (kärnbränslesäkerhet, nuclear fuel safety) concept at a test site in the Äspö Hard Rock Laboratory [5]. The SKB conducted a series of six ABM (alternative buffer material) experiments between 2006 and 2017 using a range of compacted bentonites simulating different temperatures and water saturation conditions [11,12,13,14,15], where the ABM3, ABM4 and ABM6 tests are still running and are expected to be excavated in 2024.
The ABM5 test, which is the subject of this study, was installed in 2012 and excavated in June 2017. This experiment was placed in a tunnel at a depth of approximately 420 m as part of the Äspö Hard Rock Laboratory site. It contained twelve compacted bentonites, of which the following five were the subject of this study: MX-80, FEBEX, Asha-NW BFL-L, Rokle and Ibeco SEAL M-90. ABM5 differed from previous tests in that notably high temperatures were reached (150–250 °C) compared to the 80–130 °C conditions of the ABM1–2 tests. As a result, it represents one of the hottest bentonite experiments yet conducted in an underground rock laboratory [16]. In addition, the ABM5 series also suffered conditions related to fracturing of the host rock, uncontrolled water inflow and boiling [16] and, as a result, possibly experienced steam–bentonite interactions. All these conditions make ABM5 of particular interest for studying one of the worst-case scenarios of an HLRW repository. Previous studies of the ABM test materials have revealed localized bentonite alterations induced by thermal, mineralogical and geochemical conditions in the underground experimental environment [11,12,13,14,15,16]. A notable decrease in swelling pressure was documented in some of the Na-bentonites in the ABM1 test, attributed to interlayer cation exchange of Ca2+ replacing Na+ [11]. A decrease in exchangeable Na+ and Mg2+ cations and an increase in Ca2+ cations were also documented in some ABM2 investigations [13,15]. Based on differences in the Na/Mg cation ratio, Dohrmann and Kaufhold [15] suggested that cation exchange was influenced by possible water loss caused by the pressure drop recorded in the ABM2 experiment. Moreover, a reduction in cation exchange capacity (CEC) by 5.5 cmol·kg−1 near the heating tube–bentonite contact zone was documented by Dohrmann et al. [13] in some bentonites following underground alterations in the ABM2 experiment.
Investigations of some ABM1 and ABM2 materials also revealed localized increases in the Fe2O3 content due to corrosion of the heating tube [12,14], the occasional accumulation of organic carbon and anhydrite [12] as well as minor dissolution of clinoptilolite and cristobalite [12]. In addition, the formation of a tri-octahedral smectite phase, possibly saponite, was identified in some samples from the bentonite–heater contact [12,14].
The hot bentonite ABM5 experimental setup contained ring-shaped bentonite blocks inserted through an iron tube of 3 m height and 10 cm diameter, which contained three 1000 W heaters inside. The three heaters were positioned as follows: (1) along the whole test length (main heater), (2) at a depth of 0 to 1 m (top heater) and (3) at a depth of 2 to 3 m (bottom heater), in order to achieve an equal distribution of temperature [5]. Each compacted bentonite block had an average thickness of 10 cm, an inner diameter of 11 cm and an outer diameter of 27.7 cm. A pressure of 100 MPa corresponding to a load of 5089 kN was applied to the bentonites for compaction [5]. The outermost slot between the bentonite blocks and the surrounding rock was filled with gravel and titanium tubes of 6 mm diameter used for artificial saturation. The chemistry of these artificial fluids was assumed to be Na-Ca-Cl-dominated groundwater [17]. There was also an additional water inflow to the experimental system through a fracture located 0.8 m beneath the floor [16]. The gravel around the bentonite blocks distributed water slowly and evenly through the system. Thermocouples were installed in five blocks (3rd, 9th, 15th, 21st and 27th block) to measure the internal temperature variations. Within each of the five bentonite blocks (Table 1) three thermocouples were installed at 0.5 cm, 4 cm and 7 cm from the bentonite–heater interface and, in the same five block positions, a thermocouple was installed in the heating tube’s interior [5].
In ABM5, the starting temperature was regulated to 50 °C to avoid any boiling due to the increased water pressure in the surrounding gravel filter. The temperature was later increased to 150 °C and then to 250 °C for almost six months in 2016 before final excavation of the materials for investigation (Table 1) [16]. As a result, boiling occurred in the experiment as the pressure could not be maintained. The first mineralogical results published by Kaufhold et al. [16] described reactions similar to those occurring in previous experiments. Dissolution and precipitation of carbonate and sulfur phases were reported. Notable Fe corrosion and an increase in the total amount of Mg2+ at the heater contact zone were also reported.
In this contribution, the nature of the mineral alterations under these extreme HLRW repository conditions is further documented and discussed. The prime aim of the study was to establish more specifically the changes in smectite composition occurring in the ABM5 bentonite blocks subjected to enhanced thermal conditions and to relate these changes to the more general alteration features.
2. Materials and Methods
The following set of five bentonite samples were obtained: (1) Asha NW BFL-L(ANB) from the depth of 2.7 to 2.8 m (3rd block), (2) Ibeco SEAL M-90 (IBS) from the depth of 1.9 to 2 m (11th block), (3) FEBEX (FEB) from the depth of 1.7 to 1.8 m (13th block), (4) Rokle (ROK) from the depth of 1.6 to 1.7 m (14th block) and (5) MX-80 from the depth of 0 to 0.1 m (30th block) (Table 1). The origin of the MX-80, IBS, ROK, ANB and FEB bentonites were from Wyoming (USA), Askana (Georgia), the Kadan Basin (Prague, Czech Republic), Kutch (India) and Almeria (Spain), respectively [5]. The assumed temperatures for each of the five bentonites were selected based on the location of thermocouples (Table 1). The samples of the ABM5 test package were cut down into arc-shaped slices vertically and then sliced horizontally into two halves. The bentonite blocks were tightly sealed in air-tight sealed bags and stored in this state prior to analysis. Machine cutting marks were visible on sample surfaces when the bags were opened and sampled in the laboratory. All the instruments used for analyses are housed in the mineralogical laboratories of the University of Greifswald, Germany.
2.1. Sampling Strategy
For detailed analysis of each bentonite, four specimens were extracted horizontally from each section. Vertical sampling was not possible as only one of the blocks was obtained from SKB for the study, but the largest alteration was assumed to occur horizontally due to the thermal gradient. Each arc-shaped bentonite block obtained had a 9 to 10 cm radius and a vertical height of 4.5 to 5.5 cm (approximately half of the total bentonite block’s height). The top or bottom of each block represented either a bentonite–bentonite contact zone or a machine-cut face. A 1-cm-thick surface portion of the sample material was removed to avoid impurities from the bentonite–bentonite contacts and areas of minor deformation associated with machine cutting. The 8 to 10 cm portion was also removed from each block due to gravel impurities present in the outer circle. Samples were extracted from the bentonite block–heating tube contact zone (0.1 cm) and at 1, 4 and 7 cm away from the heating pipe in order to study material subjected to the horizontal thermal gradient (Figure 1). The relative humidity of the laboratory during the sampling and further analyses deviated between 45–50% at 23–25 °C.
2.2. X-ray Diffraction (XRD) Analysis
Bulk (whole rock) powder mineral assemblages were determined by XRD analysis using a Bruker D8 Advance diffractometer with CoKα-radiation (40 kV, 30 mA). The samples were micronized using a Glen Creston McCrone micronizing mill to a particle size of <10 µm. The micronized samples were prepared as random powders without any preferred particle orientations by placing them in sample holders using the side-loading technique [18]. Random powders were measured from 3° to 100° 2θ using a step size of 0.02° 2θ with a divergence slit set to 0.5° and a scanning rate of 1° 2θ/minute. The software EVA (Bruker) and the Profex database [19] were used for mineral identification.
For detailed clay mineral analysis, 1 g of each sample was sieved (<63 µm) and the <2 µm size fraction separated gravitationally using Stokes’ law [18]. The <2 µm clay suspension was oriented on a glass slide (45 mg/cm2) and then measured in an air-dried condition, after ethylene glycol saturation (24 h) and after heating up to 550 °C for one hour to identify the clay mineral assemblages [18]. The oriented slides were measured from 4° to 40° 2θ using a step size of 0.02° 2θ with a divergence slit set to 1° and a scanning rate of 1° 2θ/minute.
The random powder samples were quantified by Rietveld refinement using the software Profex/BGMN (Version 3.14.3, Nicola Doebelin, RMS Foundation, Bettlach, Switzerland) [19]. Two separate smectite structure files (a one-water layer, Na-smectite, and a two-water layer, Ca-smectite) were applied for quantifying these phases in the program (Figure 2). This procedure obtained a better fit, considering the smectites have varying interlayer compositions and amounts of adsorbed water [20]. For these two structure files, all settings other than the interlayer parameter and the layer factor parameter were refined globally to avoid distinct refinement factors such as b1l and k2l (profile-shaping parameters) in the quantification [21]. The mineral species quantified at <1% were considered uncertain unless distinct reflections were observed over the entire XRD pattern. The level of error involved in the quantitative analyses is considered to be similar to those reported by Kemp et al. [22]. Using similar methods, they measured errors of ±1% for >50 wt.%, ±5% for 50 to 20 wt.% and ±10% for <10 wt.%.
2.3. Cation Exchange Capacity (CEC) and Exchangeable Cations (EC)
The CEC was determined using the Cu-trien method [23,24] by adding 150 mg of micronized sample to 50 mL of ultrapure water and ultrasonically dispersing it. For each sample, the CEC was determined twice to check the reproducibility of the results. The measurements showed an average standard deviation of ±5.7 cmol·kg−1.
The suspension obtained after CEC measurement was used to quantify the exchangeable cations by atomic absorption spectroscopy (AAS). The relative Ca2+, Na+, Mg2+ and K+ cation concentrations were determined using the calibration curve method [25].
2.4. Smectite Purification and Energy-Dispersive X-ray (EDX) Spectroscopy
The chemical composition of purified smectites was measured by energy-dispersive X-ray spectroscopy (EDX). Purification and preparation of the samples was undertaken using the methodology described by Podlech et al. [26]. The degree of purity of the separates was controlled by transmission electron microscopy examination using a JEOL JEM-2100Plus instrument. For this study, a ZEISS EVO MA10 scanning electron microscope (SEM) with an EDAX element analyzer was used. The measurements were performed at a 10.5 mm working distance, with an accelerating voltage of 15 kV, a 6000× magnification and a dwell time of 100 µs. Thirty frames per map were measured for three EDX sections per sample, and the average values (n = 3) were used to quantify the smectite’s composition. The calculated element-specific mean deviations in weight percentage (wt.%) from the EDX mapping were 0.25 for Na (0–5 wt.%), 0.14 for K (0–5 wt.%), 0.35 for Ca (0–5 wt.%), 0.16 for Mg (0–5 wt.%), 0.40 for Al (0–16 wt.%), 0.72 for Si (0–35 wt.%) and 0.36 for Fe (0–10 wt.%). The obtained oxide chemistries, the EDX analyses were normalized to 100%.
The composition of the smectites was calculated using the structural formula method (SFM) [27,28]. The calculations were done on the basis of 11 oxygen atoms equivalent per half unit cell (e·phuc−1). While evaluating the EDX maps, traces of impurities such as chlorine, sulfur and titanium were identified in most smectites. The sulfur and titanium impurities were neglected in calculating the smectite oxide compositions and structural formulae. The atomic percentage of Cl− and associated Na+ was also removed, assuming minor NaCl impurities to be present. The di-octahedral smectite structure was used for the SFM calculations by restricting the octahedral occupancy to a maximum of 2. The SFM method has its limitations in calculating octahedral charges when Fe3+ and Fe2+ are not separately measured. In this study, the Fe content was assumed to be Fe3+ as it is considered to be the dominant form in di-octahedral smectites, based on published studies [29]. The presence of minor impurities in purified mineral specimens may also lead to erroneous SFM calculations. For example, the ROK smectite fraction was found to contain traces of hematite and therefore considered unsuitable for study.
2.5. pH Measurements
The relative pH values for all samples were determined with a pH meter. For this, 50 mg of each bentonite micronized powder was dispersed in 40 mL of double-distilled water using an ultrasonic homogenizer (clay to water ratio 1:800). The suspensions were kept on a shaking table at 110 rpm for one week before measurement.
3. Results
3.1. Sample Observations
When removed from the air-tight bags, most bentonite blocks, except the ANB material, quickly disintegrated when extracting portions for study, revealing that significant changes in physical properties occurred following alteration after ABM5. All the bentonites, except ANB, were dry at the contact zone and up to 4–6 cm away, but were moist in the deeper sections. The ANB sample was comparatively rigid and moist throughout and could withstand the pressure of a hand drill while sampling. A dark coloration was observed in all of the bentonite blocks in the contact zone region. The MX-80 bentonite block displayed a noticeable color change when visibly examined, ranging from dark-orangish brown at the contact zone to a light-yellowish gray in the outer circle (Figure 3a,b). The FEB and IBS bentonite blocks did not show any visible color variations except minor darkening of the area in the contact zone with the heating tube.
3.2. XRD Random Powder and Oriented Preparations
The random powder patterns of MX-80 bentonite sections showed mineralogical differences throughout the sample. Hematite was only observed in the 0.1 cm sample whereas gypsum occurred in samples up to 4 cm from the contact, but was not observed at 7 cm (Table 2). A 0.303 nm XRD peak, representative of calcite, was detected at 7 cm. The smectite XRD reflections at 1.24 nm in the 0.1 cm sample shifted to between 1.27 nm and 1.48 nm at 4 and 7 cm distance from the heated tube. This change is considered to represent different hydration states due to cation exchange reactions within the MX-80 smectite. All other bentonite samples did not show significant differences in XRD random powder patterns, and hence mineral content, within the horizontal sections.
Quantitative analysis of the MX-80 bentonite showed recognizable variations in the abundance of hematite, gypsum and calcite across the sections, despite being low in abundance (<1.3 wt.%; Table 3). The MX-80 bentonite showed a consistent trend of increasing amounts of calcite away from the contact. The calcite content increased, between 0.1 cm and 7 cm, from 0.1 to 1.3 wt.%. In contrast, only the 0.1 cm sample of MX-80 bentonite showed the presence of hematite. A similar calcite gradient was observed in ANB bentonite, as described in the MX-80 section. However, all the other minerals in ANB bentonite showed no change across the sampled block. The ROK bentonite showed a steady decrease in the quantity of hematite away from the contact zone (from 2.6 wt.% to 0.5 wt.%). However, no other specific mineral abundance trends were observed in the ROK bentonite section.
Based on mineral quantifications, the formation of calcite and hematite appears to occur in only two of the five bentonites and none of the bentonites showed significant indication of any smectite loss. The IBS and FEB bentonites revealed no specific differences in the XRD patterns following their refinement (Table 3).
3.3. Relative pH Measurements
The MX-80 bentonite showed a distinct pattern of decreasing pH from slightly basic to acidic when moving toward the heater contact zone from the outer rim. All other bentonites did not show statistically relevant pH variations (Figure 4).
3.4. Cation Exchange Capacity and Exchangeable Cations
In the MX-80, FEB and IBS bentonites, the CEC was seen to decrease towards the contact zone. In contrast, ROK and ANB showed no changes in the CEC (Table 4).
A relative decrease in exchangeable Na+ cations towards the contact zone was observed in the MX-80, ANB, FEB and ROK bentonites. In addition, a minor increase in exchangeable K+ cations towards the contact zone were also observed in the MX-80, ANB and ROK bentonites. In contrast, the IBS samples showed no significant differences in the exchangeable cations measured (Table 4).
3.5. Smectite Purification and Energy-Dispersive X-ray Spectroscopy (EDX)
Several differences regarding the smectite layer charge distribution (tetrahedral vs. octahedral charges) and the metal content of the sites were observed in different bentonite samples.
The amount of tetrahedral Si content decreased towards the contact in the MX-80, IBS and FEB bentonites (Figure 5a, Table 5 and Table 6). This was accompanied by an increase in tetrahedral Al towards the contact in these bentonites (Table 6), which led to an increase in tetrahedral charges close to the heating tube. In addition, an increase in the total structural Fe content towards the contact was also observed in the octahedral sheets of the MX-80 and IBS bentonites (Figure 5b). The deviations in these metals led to significant changes in both tetrahedral and octahedral charges of the ABM5 sections close to the heating tube compared to the less altered bentonite located 7 cm from the contact (Table 6). Tetrahedral charges increased toward the contact, whereas octahedral charges decreased in the same direction in the case of MX-80 and IBS bentonites. In contrast, the ANB bentonite showed a decrease in both octahedral and tetrahedral charges, whereas the FEB material showed an increase in both. The overall change in the total layer charge for all studied smectites therefore showed no consistent pattern of alteration. The decrease in tetrahedral Si and increase in octahedral Fe was notably high between the 0.1 cm and 1 cm samples for all of the studied bentonites, except ROK.
4. Discussion
4.1. Thermal Gradient and Boiling
The five-year-long ABM5 test represents an exceptional underground rock experiment that underwent extreme temperatures and boiling conditions. Furthermore, the temperature was not distributed equally in all of the bentonites, and, as a result, a diverse range of thermal conditions occurred (Figure 6). According to the temperature measurements of the interior of the tube, the ROK, FEB and IBS bentonites even reached maximum temperatures approaching 250 °C, whereas ANB and MX-80 bentonites experienced lower temperature readings of 156 °C and 188 °C, respectively. Peak temperatures in the 3rd, 9th and 15th block positions were also reached in January 2017, while the peak temperatures in the 21st and 27th blocks occurred later in March 2017. These readings therefore indicate that the vertical thermal distribution in the upper and lower parts of the ABM5 package was not uniform. As a result of the complex thermal history, a fair comparison between the five studied bentonites is therefore not easy to draw. The high-temperature (∼250 °C) readings in the 9T, 15T and 21T (T: thermocouples) are also likely to reflect the boiling event that affected this part of the experiment setup (Figure 6).
4.2. Mineralogical Alteration of the Bentonite Blocks and Reaction Mechanisms
The Rietveld refinement and EDX-SEM analyses indicate that more significant mineralogical alterations of the ABM5 bentonites occurred at the contact with the heating tube as a response to the high temperatures and possible oxidative environment. Significant differences in smectite composition and the CEC occurred as well as minor differences in the abundance of hematite and calcite.
4.2.1. Smectite Alteration
Extreme temperatures have been shown to cause a decrease in the silica content of smectites in a number of previous studies [31,32]. One of the possible reasons for the silica loss in ABM5 can be explained by the selective dissolution of tetrahedral Si and substitution by Al, where the amount of reaction increases significantly with temperature [32]. Moreover, steam formed as part of the boiling event in the ABM5 may have also enhanced the dissolution of silica in the bentonites. The possibility of steam–silica interactions and silica dissolution in this type of material have been documented in a study by Heuser et al. [33]. The ABM5 study confirmed this specific type of temperature-related reaction with the highest degree of silica substitution observed in the contact zone of the IBS, MX-80 and FEB bentonites. These changes in tetrahedral metals led to an increase in the negative tetrahedral charge and were commonly accompanied by the substitution of octahedral Al3+ and Mg2+ by Fe3+ that resulted in a decrease in octahedral layer charges. As there was also an increase in the Fe content of the smectites at the contact (Figure 7, Table 6), it is likely that this metal was derived from corrosion of the heating tube or by the oxidation of pyrite. The exact reasons behind these substitutions remain unclear and require further study.
The slight increase in interlayer K+ (Table 4) and total layer charges (Table 6) towards the heater contact zone observed in two of the ABM5 bentonites (MX80 and FEB) is of particular interest. Similar increases in smectite layer charge and K+ fixation were observed in laboratory experiments that studied the smectite to illite conversion [34], and are generally considered to reflect the initial stages of illitization. However, based on these experiments as well as the available kinetic models [9,10] for the smectite to illite conversion, it is evident that the degree of smectite alteration was actually quite low for temperatures that reached 250 °C, as in the FEB and ROK bentonites at the heater contact. At this specific location, the temperatures were equivalent to the experimental conditions used by Huang et al. [9], where significant amounts of illitization occurred during a time period of just 30 days compared to the 5 years of reaction time characterizing the ABM5 test. Although there were probably differences in the clay to fluid ratio’s, the slow reaction progress is best explained by a low activity of K+ in the conditions of the repository test, and this highlights the importance of using bentonites with low concentrations of K+ by avoiding those with significant quantities of K-bearing minerals. In this context, all of the bentonites of this investigation contained <5 wt.% K-feldspar content and no micaceous minerals (Table 3). However, the reason why the MX80 and FEB bentonites showed an increase in total layer charge, compared to the other bentonites (IBS and ANB) that showed a decrease, is not yet apparent, but it does appear to be related to the type of octahedral metal substitutions that occurred (Table 6, Figure 7).
4.2.2. Mineral Abundance Variations in Hematite and Calcite
The higher hematite content in the contact zone has been attributed to iron corrosion in a number of previous studies [12,14,16]. The source of iron in the ABM5 experimental setup could have been derived from the heating tube, which would indicate the mobility of iron. The heating tube used in the ABM5 test was manufactured using P235TR1 carbon steels [5].
The ABM5 experiment was not a completely closed experiment. Kaufhold et al. [16] mentioned a fracture in the host rock 0.8 m beneath the floor. As internal fractures were observed in the experimental setup of ABM5, there is a possibility that groundwater flowed in the system carrying oxygen within.
However, hematite occurring at the heater contact was not common to all five bentonites. Only ROK and MX-80 bentonites showed a specific increase in hematite abundance. A further explanation may be the oxidation of the pyrite present in both of these bentonites. Pyrite oxidation results in the formation of sulfuric acid and Fe2+, creating an acidic environment that favors the corrosion of the carbon steel. Such environments can also lead to the dissolution of carbonate minerals such as calcite, forming CO2 as a byproduct [35]. CO2 can later dissolve in the interstitial water creating carbonic acid, further increasing the system’s acidity [35]. The Fe2+ cations formed as a byproduct of pyrite oxidation then later oxidize to the Fe3+ oxidation state, resulting in the formation of hematite [35,36]. Verron et al. [37] studied bentonite mixtures with pyrite and carbonates at 100 °C and observed the dissolution of calcite and the formation of minerals such as hematite, anhydrite and beidellite, although the latter two minerals were not investigated in the ABM5 investigation.
The decrease in calcite abundance observed at the heater contact in the MX-80 and ANB bentonites also indicate enhanced dissolution under more acidic conditions. This calcite dissolution can also be best explained as a byproduct of pyrite oxidation [37]. The pH measurements of the MX-80 bentonite showed slightly acidic pH in the samples near the heating tube and slightly basic pH towards the 7 cm section. Calcite dissolution and precipitation in some bentonites were also reported in previous ABM studies by Kaufhold et al. [14,16].
4.3. Cation Exchange Capacities and Exchangeable Cations
The analyzed CEC pattern from this study agrees with Dohrmann et al. [13], who described CEC values for the ABM2 bentonites, which were, on average, 5.5 cmol·kg−1 lower than the reference materials. The current study shows an average of 10.8 cmol·kg−1 decrease in CEC for 0.1 cm samples compared to the 7 cm samples. The high-temperature conditions of the heating tube–bentonite interface clearly negatively influenced the CEC of bentonites at this location.
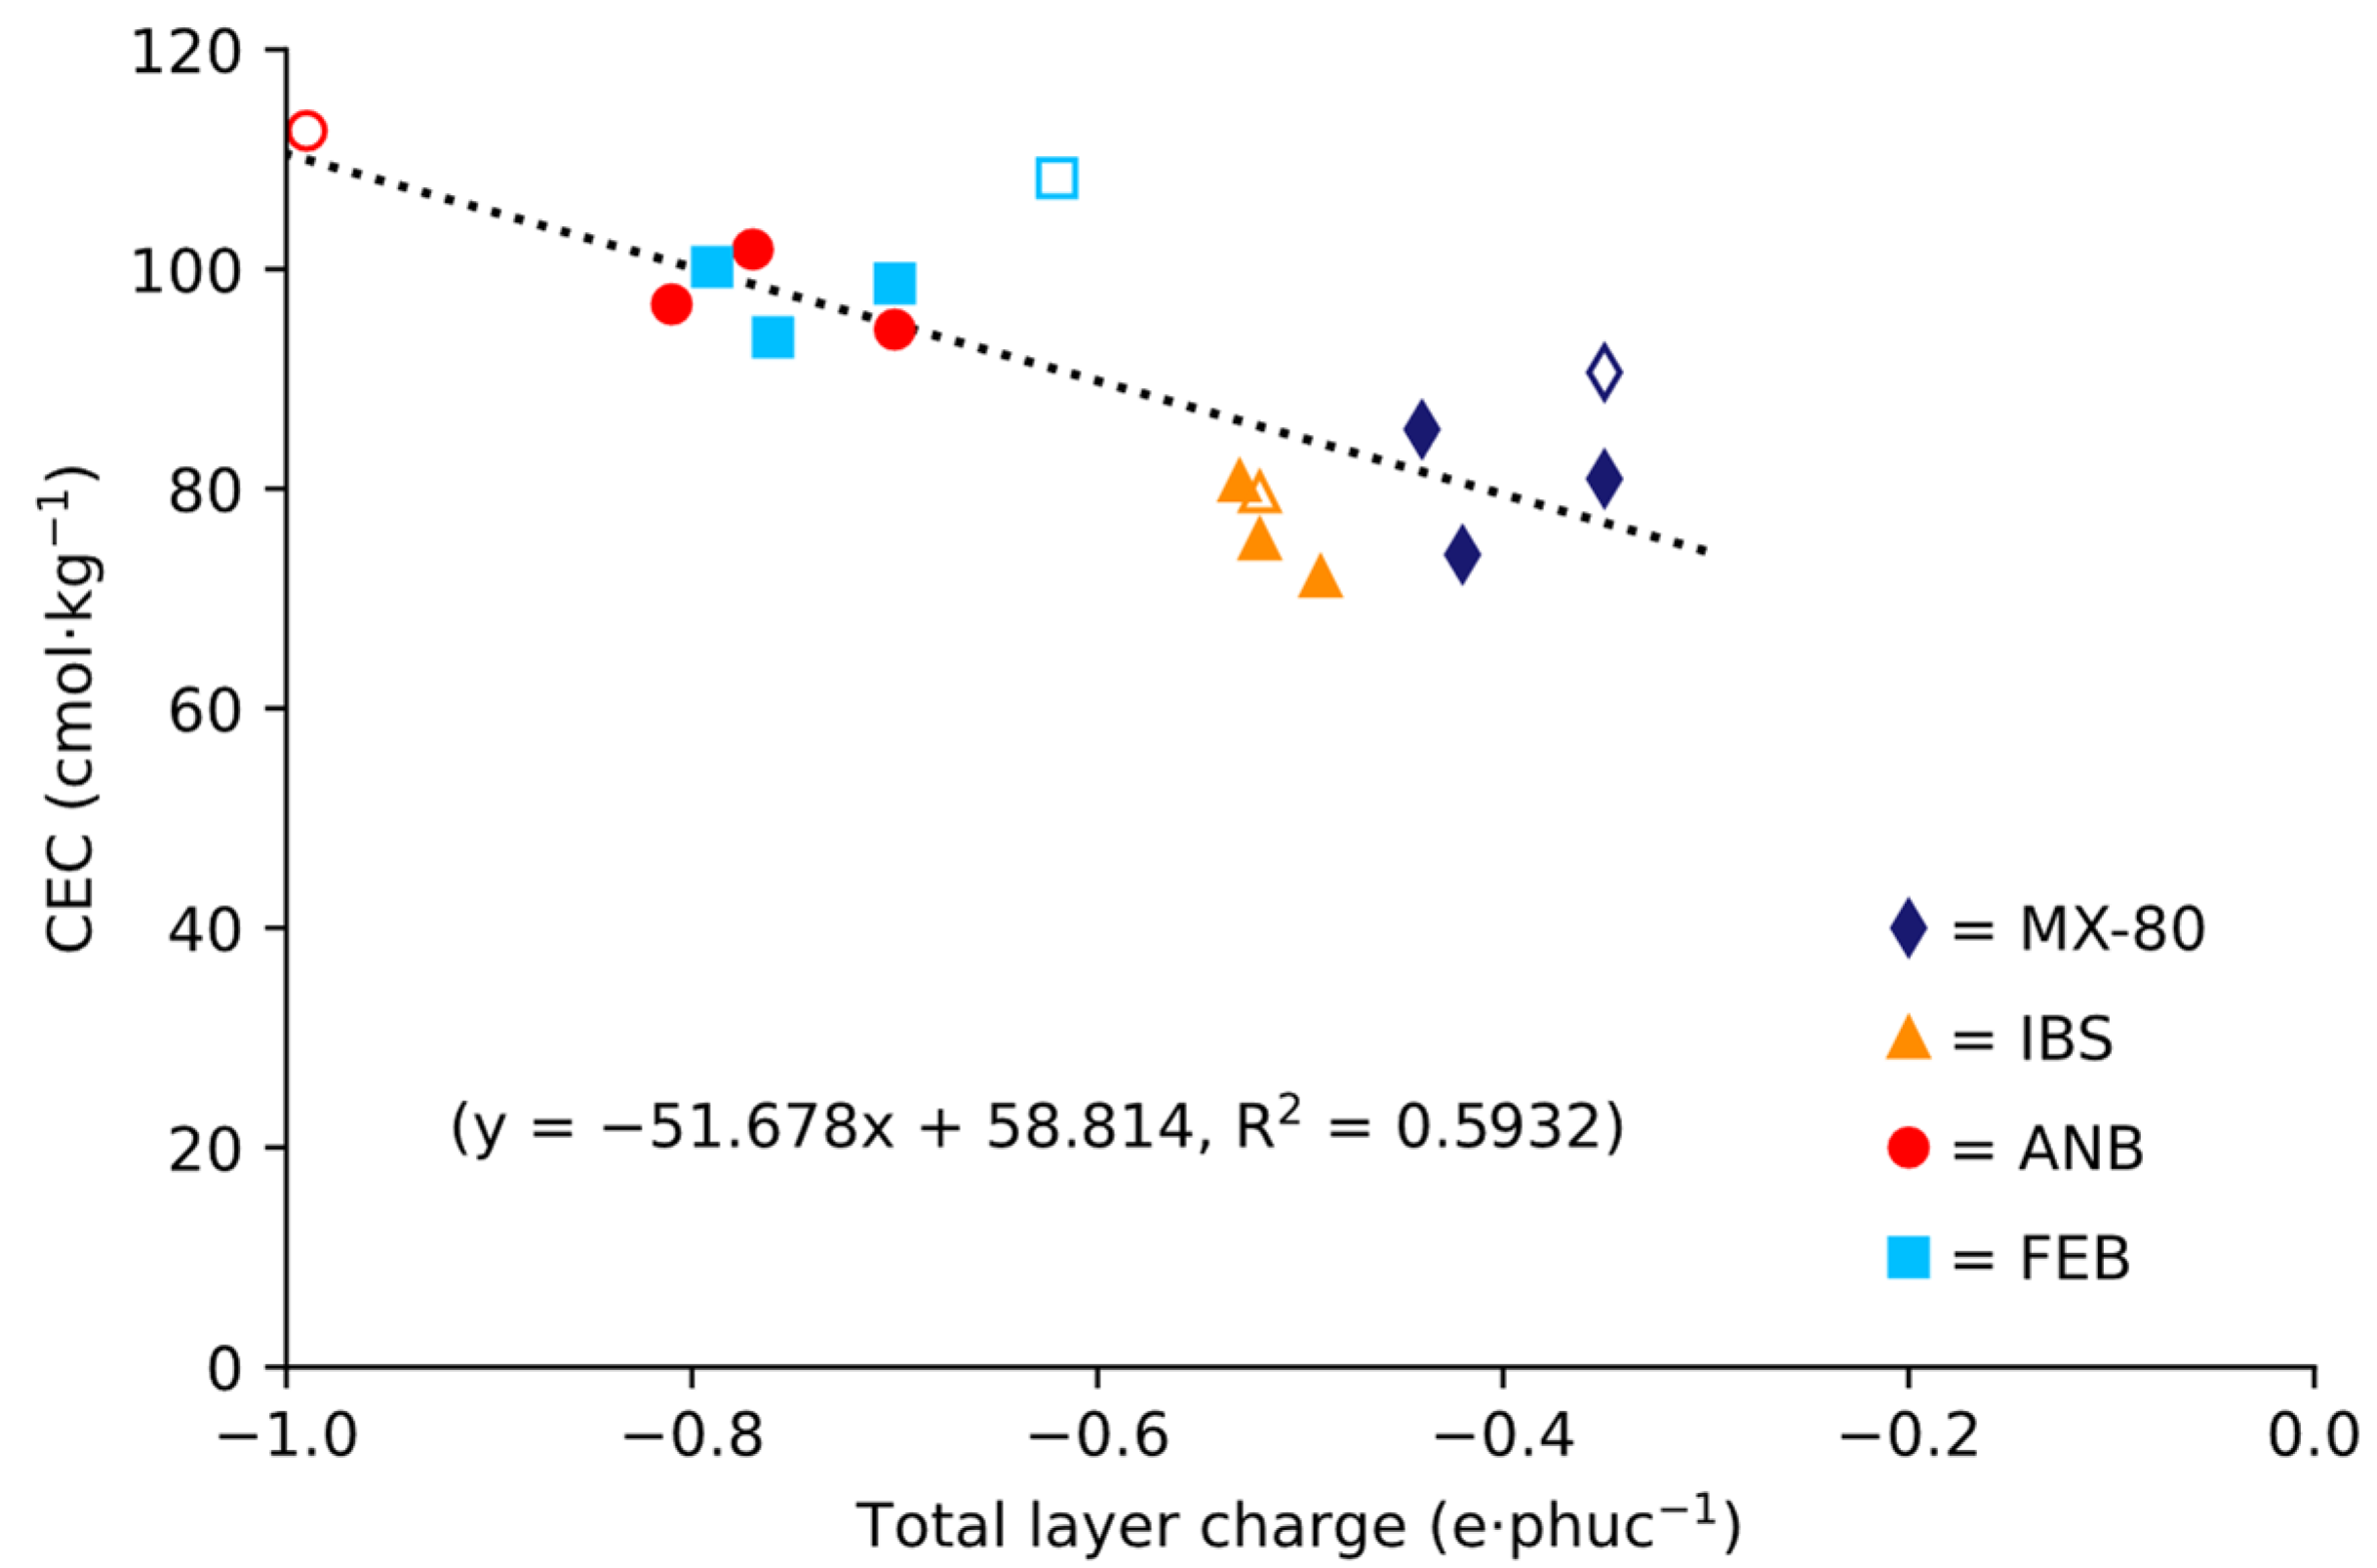
One of the possible reasons for the decrease in the CEC of smectite could be a decrease in layer charge as documented by a number of studies [24,38]. The low layer charges of smectite observed in the 0.1 cm samples of ANB and IBS bentonites support this idea and the correlation fit between CEC and the total layer charges does indicate that a general trend exists between the two parameters (Figure 8).
Another reason for the decrease in CEC can be explained by the generation of steam during the ABM5′s boiling event. Hot water vapor leading to a reduction in the CEC of Na-smectites has been experimentally demonstrated by Heuser et al. [33], and the ABM2 experiment, which shows a similar CEC pattern, also suffered a similar boiling event but at a lower temperature range.
5. Conclusions
- (1)
- The SKB ABM5 in situ test provided an important opportunity to investigate bentonite stability under extreme repository conditions that included elevated temperatures, fractured host rock, groundwater inflow and boiling. Mineral alterations and CEC variations occurred mainly at the contact with the heater tube, whereas little effect was detected at 7 cm distance.
- (2)
- Smectite alteration occurred by the substitution of tetrahedral Si4+ by Al3+ and possible substitution of Al3+ and Mg2+ by Fe3+ were detected. These substitution reactions most commonly resulted in an increase in tetrahedral charges and a decrease in octahedral charges.
- (3)
- The increase in octahedral Fe in the smectite near the contact zone was sourced from corrosion of the carbon steel heating tube and/or by the oxidation of pyrite, which locally led to increased acidity.
- (4)
- Minor dissolution of calcite and neoformation of hematite at the bentonite contacts with the heater tube was also related to the high-temperature, acidic and partly oxidizing conditions associated with the extreme conditions of fracturing and boiling occurring in the ABM5 test.
Author Contributions
Conceptualization; R.S.K., G.G., L.N.W. and C.P.; methodology, R.S.K., G.G., L.N.W. and C.P.; validation, R.S.K., C.P., G.G. and L.N.W.; formal analyses, R.S.K.; investigation, R.S.K. and C.P.; resources, D.S., L.N.W. and G.G.; writing—original draft preparation, R.S.K., L.N.W., G.G. and C.P.; writing—review and editing, all authors.; visualization, R.S.K.; supervision, G.G. and L.N.W.; project administration, G.G. and L.N.W.; funding acquisition, L.N.W. All authors have read and agreed to the published version of the manuscript.
Funding
This project was conducted within the framework of the UMB1 program on reaction mechanisms in bentonite barriers, which was financed by the Federal Ministry of Economics and Technology (BMWi). Project number 02E11344C. We also acknowledge the support for the Article Processing Charge from the DFG (German Research Foundation, 393148499) and the Open Access Publication Fund of the University of Greifswald.
Data Availability Statement
The data presented in this study are partially available on request from the corresponding author.
Acknowledgments
The authors are grateful to Markus Peltz (UG) for his suggestions with Rietveld refinement and SEM-EDX analyses. We would also like to thank Gabriele Wiederholt (UG), Robert Mrotzek (UG) and Florian Krebs (UG) for their help with the analytical work. This study used DFG-funded XRD and TEM instrumentation (project numbers 108031954 and 428027021) and an EFRE-funded SEM (project numbers GHS-15-0006).
Conflicts of Interest
The authors declare no conflict of interest.
References
- Christidis, G.E. Origin of the Bentonite Deposits of Eastern Milos, Aegean, Greece: Geological, Mineralogical and Geochemical Evidence. Clays Clay Miner. 1995, 43, 63–77. [Google Scholar] [CrossRef]
- Pusch, R. Permeability of Highly Compacted Bentonite; SKBF/KBS TR 80-16; Svensk Kärnbränslehantering AB: Stockholm, Sweden, 1980. [Google Scholar]
- Sellin, P.; Leupin, O.X. The Use of Clay as an Engineered Barrier in Radioactive-Waste Management—A Review. Clays Clay Miner. 2014, 61, 477–498. [Google Scholar] [CrossRef]
- Karnland, O.; Olsson, S.; Dueck, A.; Birgersson, M.; Nilsson, S.; Erikson, T.E.; Rosburg, B. Long Term Test of Buffer Material at the Äspö Hard Rock Laboratory, LOT Project—Final Report on the A2 Test Parcel; TR-09-29; Svensk Kärnbränslehantering AB: Stockholm, Sweden, 2009. [Google Scholar]
- Sandén, T.; Nilsson, U.; Andersson, L.; Svensson, D. ABM45 Experiment at Äspö Hard Rock Laboratory—Installation Report; P-18-20; Svensk Karnbransleforsorjning AB: Stockholm, Sweden, 2018. [Google Scholar]
- Torres, E.; Turrero, M.J.; Moreno, D.; Sánchez, L.; Garralón, A. FEBEX In-Situ Test: Preliminary Results of the Geochemical Characterization of the Metal/Bentonite Interface. Procedia Earth Planet. Sci. 2017, 17, 802–805. [Google Scholar] [CrossRef]
- Karnland, O.; Olsson, S.; Nilsson, U. Mineralogy and Sealing Properties of Various Bentonites and Smectite-Rich Clay Materials; TR-06-30; Svensk Kärnbränslehantering AB: Stockholm, Sweden, 2006. [Google Scholar]
- Kaufhold, S.; Dohrmann, R. Distinguishing between more and less suitable bentonites for storage of high-level radioactive waste. Clay Miner. 2016, 51, 289–302. [Google Scholar] [CrossRef] [Green Version]
- Huang, W.-L. An Experimentally Derived Kinetic Model for Smectite-to-Illite Conversion and Its Use as a Geothermometer. Clays Clay Miner. 1993, 41, 162–177. [Google Scholar] [CrossRef]
- Elliott, W.C.; Matistoff, G. Evaluation of Kinetic Models for the Smectite to Illite Transformation. Clays Clay Miner. 1996, 44, 77–87. [Google Scholar] [CrossRef]
- Svensson, D.; Dueck, A.; Nilsson, U.; Olsson, S.; Sandén, T.; Lydmark, S.; Jägerwall, S.; Pedersen, K.; Hansen, S. Alternative Buffer Material—Status of the Ongoing Laboratory Investigation of Reference Materials and Test Package 1; TR-11-06; Svensk Karnbransleforsorjning AB: Stockholm, Sweden, 2011. [Google Scholar]
- Kaufhold, S.; Dohrmann, R.; Sandén, T.; Sellin, P.; Svensson, D. Mineralogical investigations of the first package of the alternative buffer material test—I. Alteration of bentonites. Clay Miner. 2013, 48, 199–213. [Google Scholar] [CrossRef]
- Dohrmann, R.; Olsson, S.; Kaufhold, S.; Sellin, P. Mineralogical investigations of the first package of the alternative buffer material test—II. Exchangeable cation population rearrangement. Clay Miner. 2013, 48, 215–233. [Google Scholar] [CrossRef]
- Kaufhold, S.; Dohrmann, R.; Götze, N.; Svensson, D. Characterization of the second parcel of the alternative buffer material (ABM) Experiment—I mineralogical reactions. Clays Clay Miner. 2017, 65, 27–41. [Google Scholar] [CrossRef]
- Dohrmann, R.; Kaufhold, S. Characterization of the Second Package of the Alternative Buffer Material (ABM) Experiment—II Exchangeable Cation Population Rearrangement. Clays Clay Miner. 2017, 65, 104–121. [Google Scholar] [CrossRef]
- Kaufhold, S.; Dohrmann, R.; Ufer, K.; Svensson, D.; Sellin, P. Mineralogical Analysis of Bentonite from the ABM5 Heater Experiment at Äspö Hard Rock Laboratory, Sweden. Minerals 2021, 11, 669. [Google Scholar] [CrossRef]
- Dueck, A.; Johannesson, L.-E.; Kristensson, O.; Olsson, S. Report on Hydro-Mechanical and Chemical-Mineralogical Analyses of the Bentonite Buffer in Canister Retrieval Test; TR-11-07; Svensk Kärnbränslehantering AB: Stockholm, Sweden, 2011. [Google Scholar]
- Moore, D.M.; Reynolds, R.C. X-ray Diffraction and the Identification and Analysis of Clay Minerals, 2nd ed.; Oxford University Press: Oxford, UK, 1997; ISBN 9780195087130. [Google Scholar]
- Doebelin, N.; Kleeberg, R. Profex: A graphical user interface for the Rietveld refinement program BGMN. J. Appl. Crystallogr. 2015, 48, 1573–1580. [Google Scholar] [CrossRef] [Green Version]
- Ufer, K.; Stanjek, H.; Roth, G.; Dohrmann, R.; Kleeberg, R.; Kaufhold, S. Quantitative phase analysis of bentonites by the Rietveld method. Clays Clay Miner. 2008, 56, 272–282. [Google Scholar] [CrossRef]
- Ufer, K.; Kleeberg, R. Parametric Rietveld refinement of coexisting disordered clay minerals. Clay Miner. 2015, 50, 287–296. [Google Scholar] [CrossRef]
- Kemp, S.J.; Smith, F.W.; Wagner, D.; Mounteney, I.; Bell, C.P.; Milne, C.J.; Gowing, C.J.B.; Pottas, T.L. An Improved Approach to Characterize Potash-Bearing Evaporite Deposits, Evidenced in North Yorkshire, United Kingdom. Econ. Geol. 2016, 111, 719–742. [Google Scholar] [CrossRef] [Green Version]
- Meier, L.P.; Kahr, G. Determination of the Cation Exchange Capacity (CEC) of Clay Minerals Using the Complexes of Copper(II) Ion with Triethylenetetramine and Tetraethylenepentamine. Clays Clay Miner. 1999, 47, 386–388. [Google Scholar] [CrossRef]
- Środoń, J.; MaCarty, D.K. Surface area and layer charge of smectite from CEC and EGME/H2O-retention measurements. Clays Clay Miner. 2008, 56, 155–174. [Google Scholar] [CrossRef]
- García, R.; Báez, A.P. Atomic Absorption Spectrometry (AAS). In Atomic Absorption Spectroscopy; Akhyar Farrukh, M., Ed.; InTech: Rijeka, Croatia, 2012; ISBN 978-953-307-817-5. [Google Scholar]
- Podlech, C.; Matschiavelli, N.; Peltz, M.; Kluge, S.; Arnold, T.; Cherkouk, A.; Meleshyn, A.; Grathoff, G.; Warr, L.N. Bentonite Alteration in Batch Reactor Experiments with and without Organic Supplements: Implications for the Disposal of Radioactive Waste. Minerals 2021, 11, 932. [Google Scholar] [CrossRef]
- Ross, C.; Hendricks, S.B. Minerals of the Montmorillonite Group, Their Origin and Relation to Soils and Clays; Professional Paper 205-B; USGS: Reston, VA, USA, 1945. [Google Scholar]
- Stevens, R.E. A system for calculating analyses of micas and related minerals to end members. U.S. Geol. Surv. Bull. 1946, 950, 101–119. [Google Scholar]
- Wolters, F. Classification of Montmorillonites. Ph.D. Thesis, Universität Karlsruhe, Karlsruhe, Baden-Württemberg, Germany, 2005. [Google Scholar]
- Warr, L.N. IMA–CNMNC approved mineral symbols. Mineral. Mag. 2021, 85, 291–320. [Google Scholar] [CrossRef]
- Olsson, S.; Karnland, O. Mineralogical and chemical characteristics of the bentonite in the A2 test parcel of the LOT field experiments at Äspö HRL, Sweden. Phys. Chem. Earth Parts A/B/C 2011, 36, 1545–1553. [Google Scholar] [CrossRef]
- Leupin, O.X.; Birgersson, M.; Karnland, O.; Korkeakoski, P.; Sellin, P.; Mäder, U.; Wersin, P. Technical Report 14-12, Montmorillonite Stability under Near-Field Conditions; National Cooperative for the Disposal of Radioactive Waste: Wettingen, Switzerland, 2014. [Google Scholar]
- Heuser, M.; Weber, C.; Stanjek, H.; Chen, H.; Jordan, G.; Schmahl, W.W.; Natzeck, C. The interaction between bentonite and water vapor. I: Examination of physical and chemical properties. Clays Clay Miner. 2014, 62, 188–202. [Google Scholar] [CrossRef]
- Sato, T.; Murakami, T.; Watanabe, T. Change in Layer Charge of Smectites and Smectite Layers in Illite/Smectite During Diagenetic Alteration. Clays Clay Miner. 1996, 44, 460–469. [Google Scholar] [CrossRef]
- Crusset, D.; Deydier, V.; Necib, S.; Gras, J.-M.; Combrade, P.; Féron, D.; Burger, E. Corrosion of carbon steel components in the French high-level waste programme: Evolution of disposal concept and selection of materials. Corros. Eng. Sci. Technol. 2017, 52, 17–24. [Google Scholar] [CrossRef] [Green Version]
- Schorr, J.R.; Everhart, J.O. Thermal Behavior of Pyrite and Its Relation to Carbon and Sulfur Oxidation in Clays. J. Am. Ceram. Soc. 1969, 52, 351–354. [Google Scholar] [CrossRef]
- Verron, H.; Sterpenich, J.; Bonnet, J.; Bourdelle, F.; Mosser-Ruck, R.; Lorgeoux, C.; Randi, A.; Michau, N. Experimental Study of Pyrite Oxidation at 100 °C: Implications for Deep Geological Radwaste Repository in Claystone. Minerals 2019, 9, 427. [Google Scholar] [CrossRef] [Green Version]
- Maes, A.; Stul, M.; Cremers, A. Layer Charge-Cation-Exchange Capacity Relationships in Montmorillonite. Clays Clay Miner. 1979, 27, 387–392. [Google Scholar] [CrossRef]
Figure 1.
Sampling locations in a bentonite block (0.1, 1, 4 and 7 cm) from heater contact to outer rim in a bentonite block, e.g., sample MX-80.
Figure 1.
Sampling locations in a bentonite block (0.1, 1, 4 and 7 cm) from heater contact to outer rim in a bentonite block, e.g., sample MX-80.

Figure 2.
X-ray diffraction pattern of the MX-80 bentonite (0.1 cm sample) showing Rietveld refinement using 1-water and 2-water layer smectite structures. (Hem, hematite; Sme, smectite; Qz, quartz; Gp, gypsum; Or, orthoclase; Ab: albite).
Figure 2.
X-ray diffraction pattern of the MX-80 bentonite (0.1 cm sample) showing Rietveld refinement using 1-water and 2-water layer smectite structures. (Hem, hematite; Sme, smectite; Qz, quartz; Gp, gypsum; Or, orthoclase; Ab: albite).
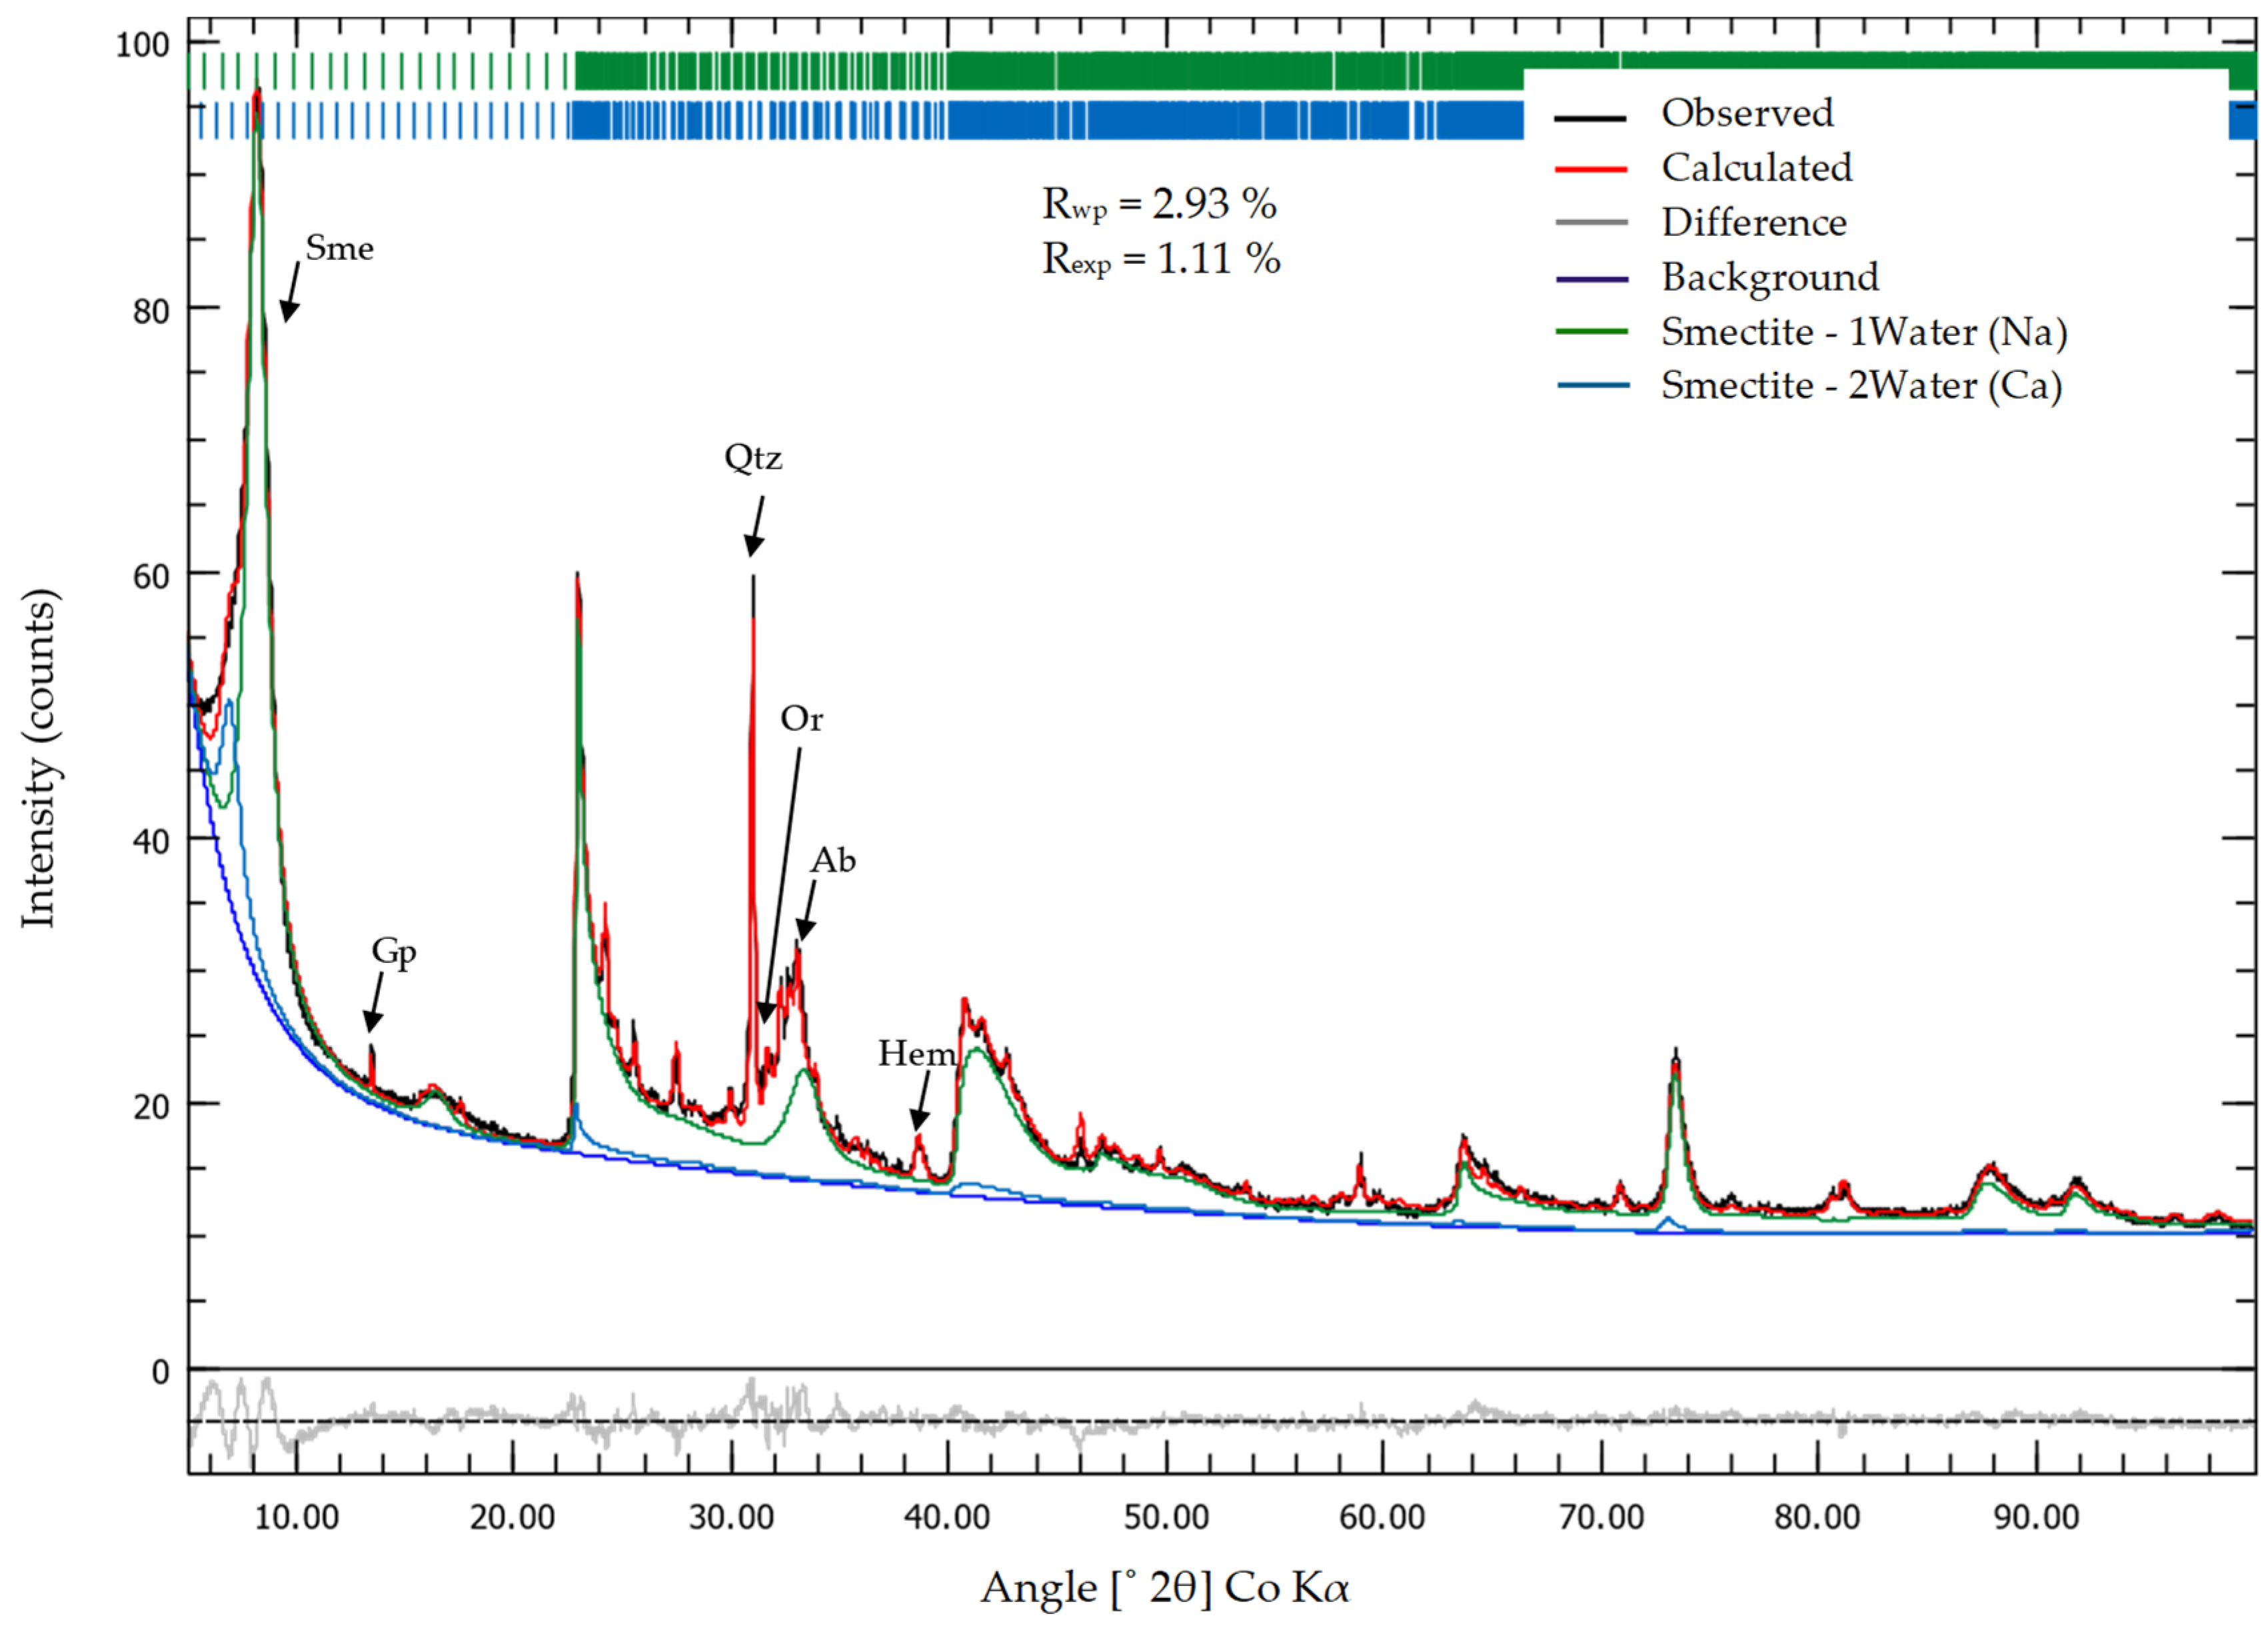
Figure 3.
(a) Image showing the contact between MX-80 bentonite and the heating tube. (b) Image showing visible color variations in MX-80 bentonite samples. Numbers in the photograph indicate distance in cm from the bentonite–heat interface.
Figure 3.
(a) Image showing the contact between MX-80 bentonite and the heating tube. (b) Image showing visible color variations in MX-80 bentonite samples. Numbers in the photograph indicate distance in cm from the bentonite–heat interface.
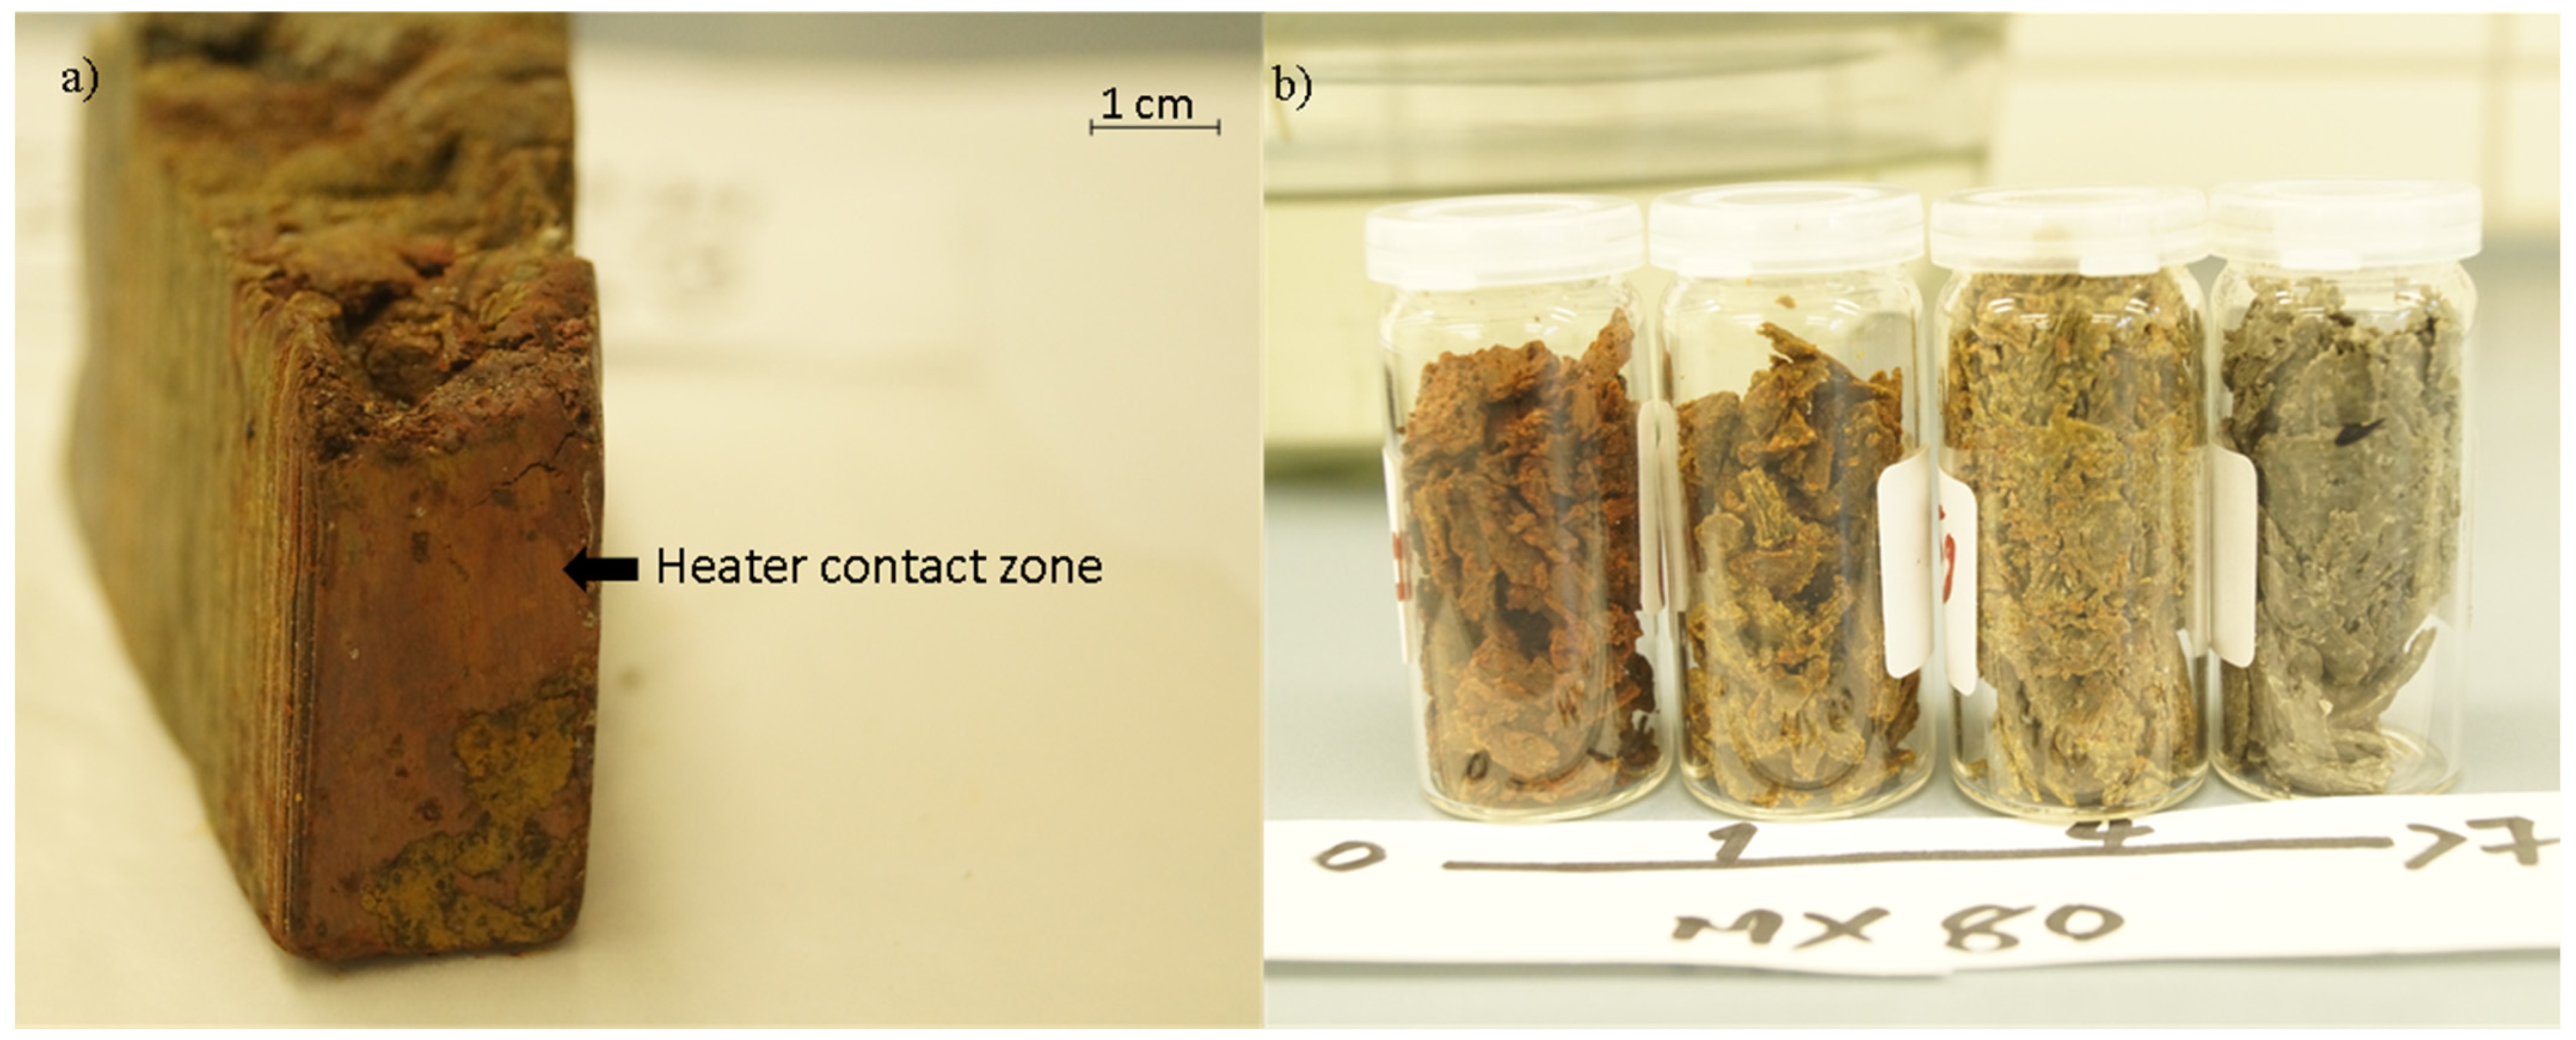
Figure 4.
Plot showing the pH values for all bentonite clay water suspensions at different distances to the heater.
Figure 4.
Plot showing the pH values for all bentonite clay water suspensions at different distances to the heater.
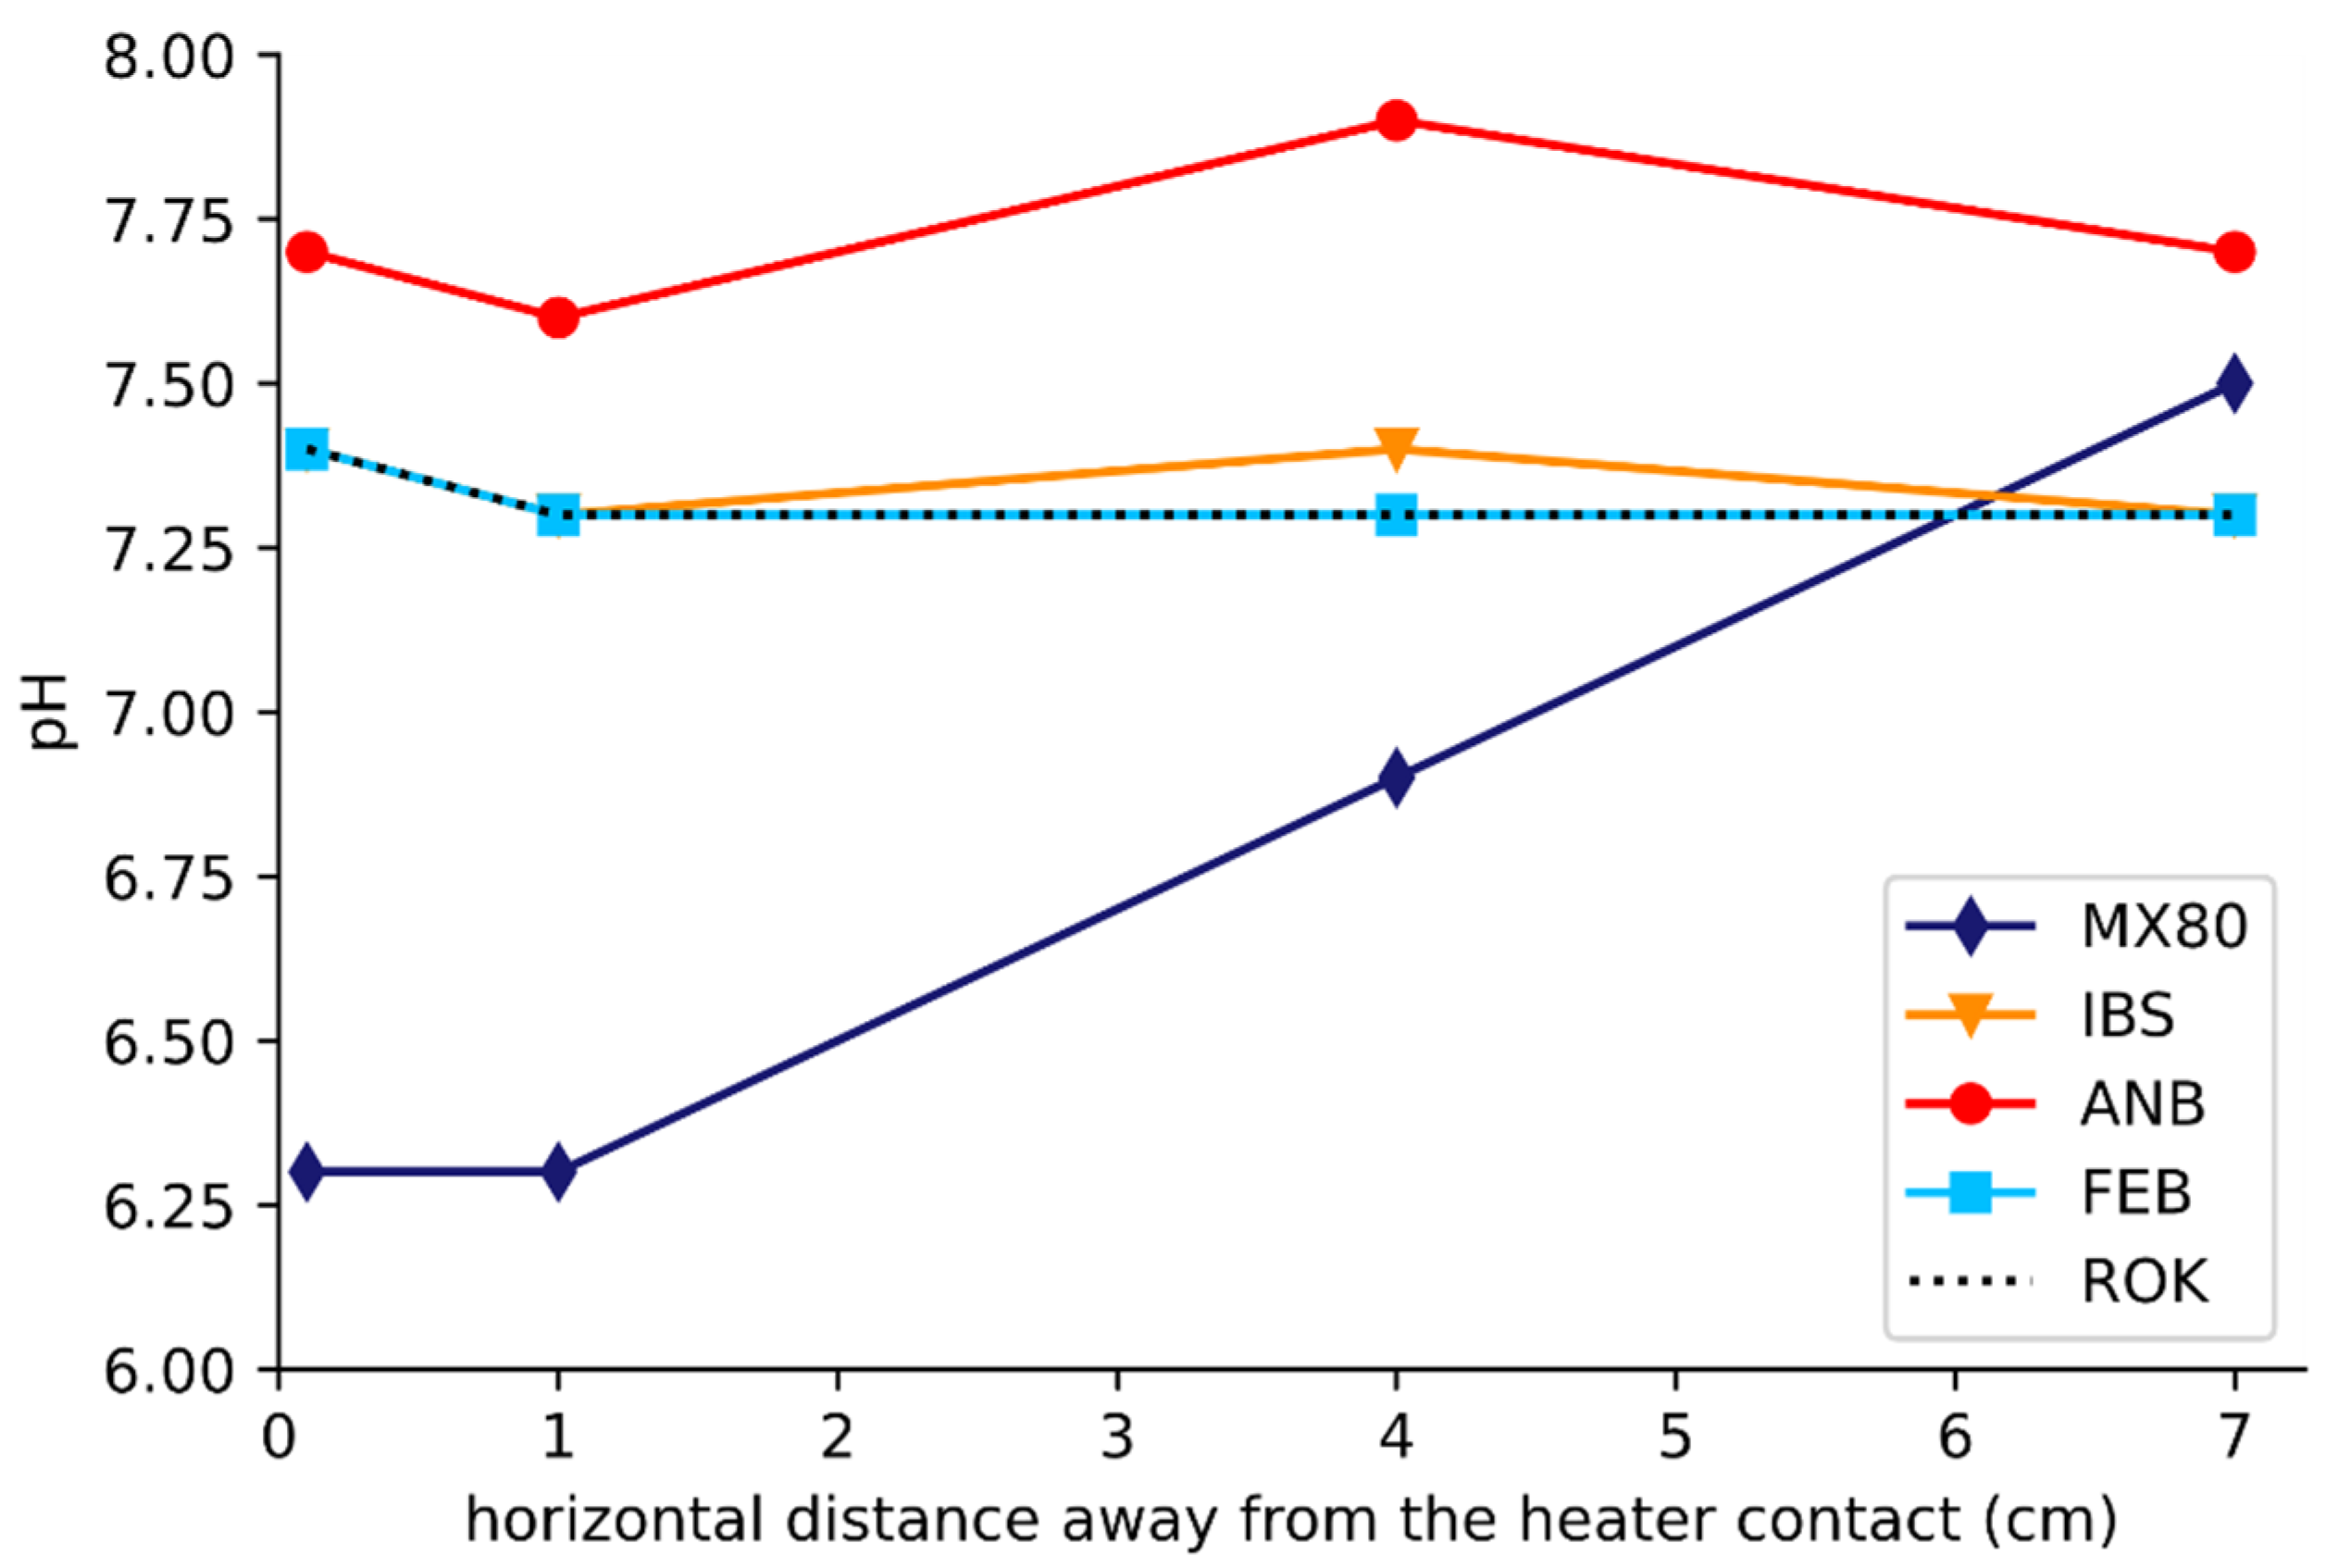
Figure 5.
Elemental distribution of (a) Si in the tetrahedral sheet and (b) total Fe content in the octahedral sheet of the smectites.
Figure 5.
Elemental distribution of (a) Si in the tetrahedral sheet and (b) total Fe content in the octahedral sheet of the smectites.
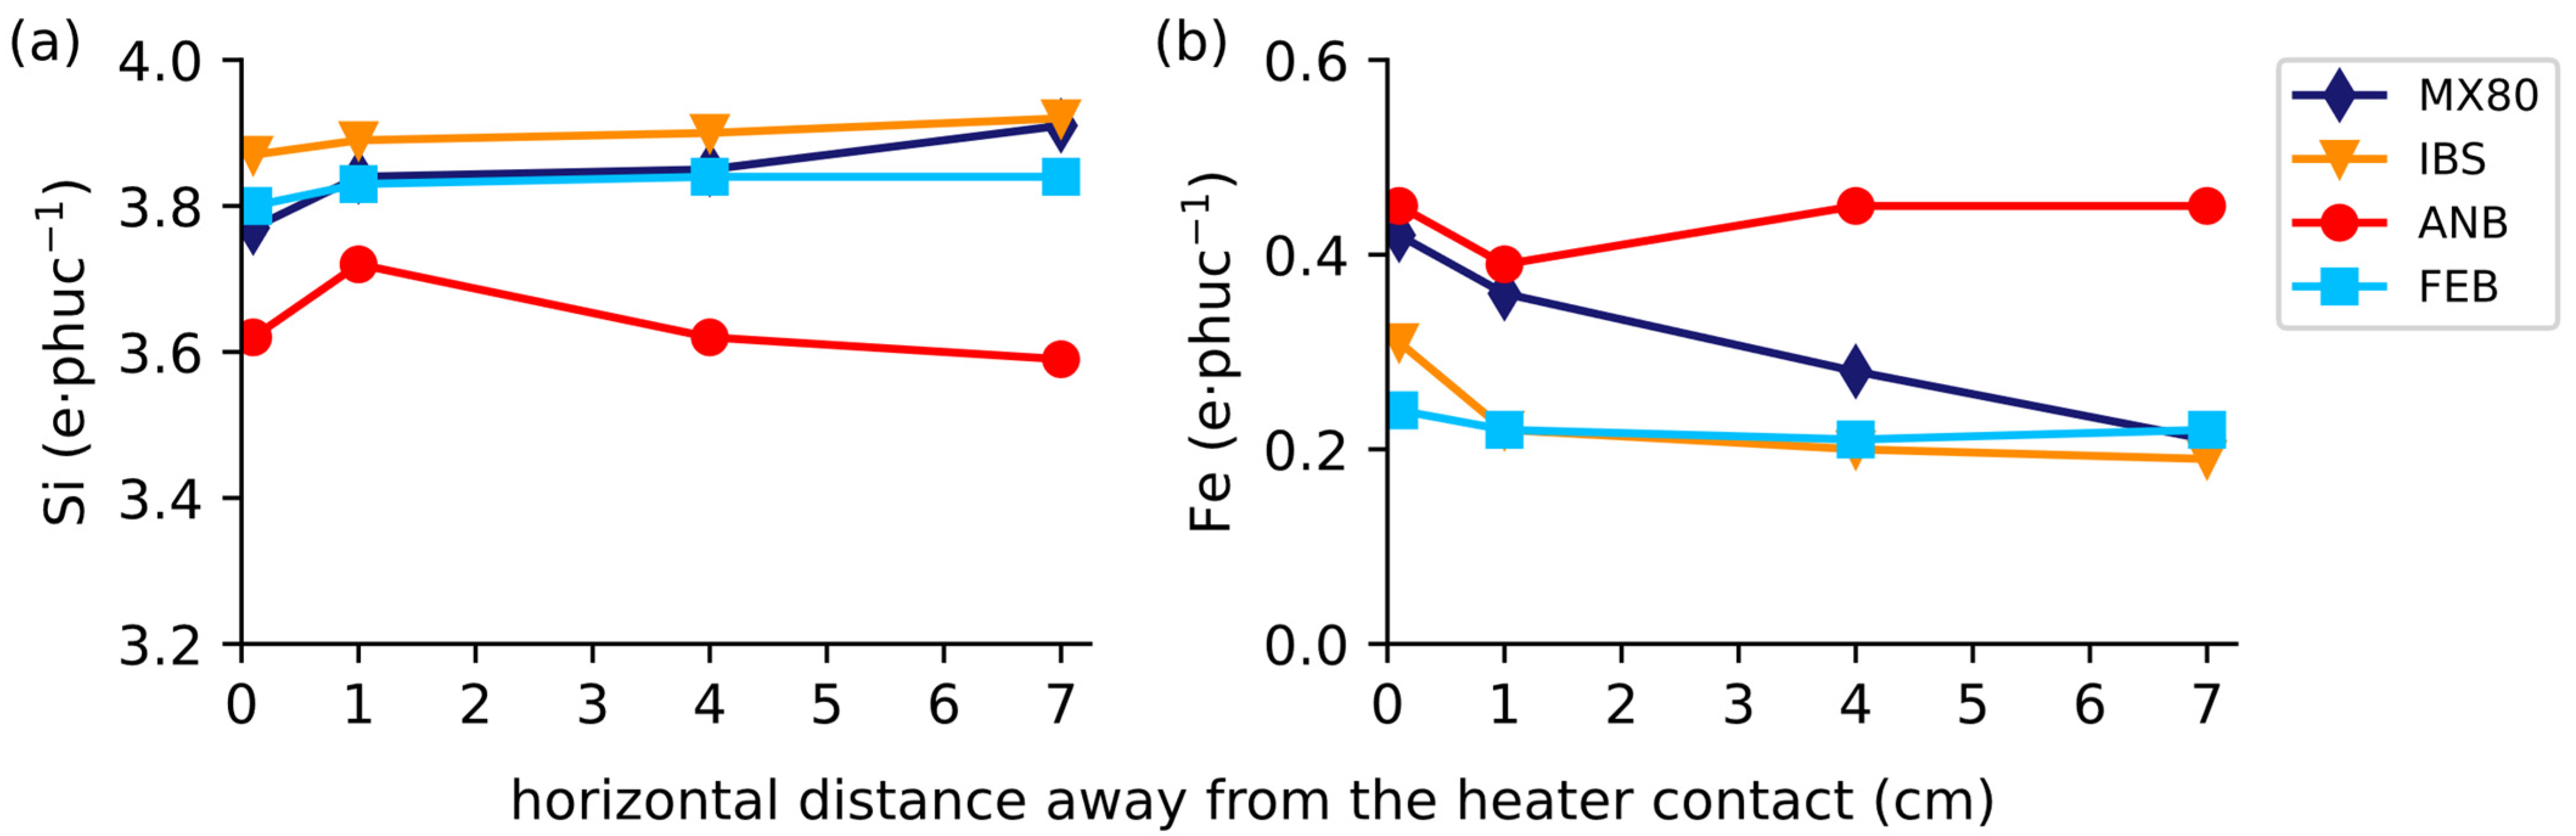
Figure 6.
Plot showing maximum thermocouple readings closest to the studied bentonites.

Figure 7.
Plot showing smectite alterations in 0.1, 1 and 4 cm samples compared to less altered material at 7 cm distance from the heated tube. TET, tetrahedral; OCT, octahedral.
Figure 7.
Plot showing smectite alterations in 0.1, 1 and 4 cm samples compared to less altered material at 7 cm distance from the heated tube. TET, tetrahedral; OCT, octahedral.

Figure 8.
Total layer charge (e·phuc−1) (Table 6) plotted against CEC values (cmol·kg−1) (Table 4). (Solid markers = values of the 0.1, 1 and 4 cm samples; open markers = values of the 7 cm sample.)

Table 1.
Depth and block position of the compacted bentonites installed in the ABM5 experiment [5] with maximum thermocouple readings from inside the heating tube. The studied bentonites are marked in green.
Table 1.
Depth and block position of the compacted bentonites installed in the ABM5 experiment [5] with maximum thermocouple readings from inside the heating tube. The studied bentonites are marked in green.
| Depth (m) | Block Number | Compacted Bentonite Blocks | Maximum Thermocouple Reading Inside the Heating Tube (°C) |
|---|---|---|---|
| 0.1 | 30 | MX-80 | - |
| 0.2 | 29 | MX-80 | - |
| 0.3 | 28 | Asha 505 | - |
| 0.4 | 27 | Calcigel | 188 |
| 0.5 | 26 | Deponit CAN | - |
| 0.6 | 25 | FEBEX | - |
| 0.7 | 24 | GMZ | - |
| 0.8 | 23 | Ibeco SEAL M-90 | - |
| 0.9 | 22 | Ikosorb | - |
| 1.0 | 21 | Kunigel V1 | 240 |
| 1.1 | 20 | MX-80 | - |
| 1.2 | 19 | Asha NW BFL-L | - |
| 1.3 | 18 | Rokle | - |
| 1.4 | 17 | Saponite | - |
| 1.5 | 16 | Asha 505 | - |
| 1.6 | 15 | MX-80 | 251 |
| 1.7 | 14 | Rokle | - |
| 1.8 | 13 | FEBEX | - |
| 1.9 | 12 | Saponite | - |
| 2.0 | 11 | Ibeco SEAL M-90 | - |
| 2.1 | 10 | Calcigel | - |
| 2.2 | 9 | Asha NW BFL-L | 251 |
| 2.3 | 8 | MX-80 | - |
| 2.4 | 7 | Ikosorb | - |
| 2.5 | 6 | GMZ | - |
| 2.6 | 5 | Kunigel V1 | - |
| 2.7 | 4 | Deponit CAN | - |
| 2.8 | 3 | Asha NW BFL-L | 156 |
| 2.9 | 2 | MX-80 | - |
| 3.0 | 1 | MX-80 | - |
Table 2.
List of minerals identified in specific sample sections. (BDL: below detection limit.)
| Bentonites | Contact Zone (0.1 cm) | 1 cm | 4 cm | 7 cm |
|---|---|---|---|---|
| MX-80 | Sme, Qz, Hem, Gp, Py, Sa, Ab, Ant, Cal, 1.0 nm mica. | Same as 0.1 cm, Hem is BDL | Same as 0.1 cm, Hem is BDL | Same as 0.1 cm, Hem, Py and Gp are BDL |
| ANB | Sme, Qz, Hem, Cal, Kln, Sd, Rt and Ant | Same as 0.1 cm | Same as 0.1 cm | Same as 0.1 cm |
| IBS | Sme, Qz, Or, Ab, Py, 1.0 nm mica. | Same as 0.1 cm | Same as 0.1 cm | Same as 0.1 cm |
| FEB | Sme, Qz, Or, Ab, Crs, Cal, 1.0 nm mica. | Same as 0.1 cm | Same as 0.1 cm | Same as 0.1 cm |
| ROK | Sme, Qz, Kln, Cal, Ant, Py, Or, Hem, Sd, 1.0 nm mica. | Same as 0.1 cm | Same as 0.1 cm | Same as 0.1 cm |
Hem, hematite; Cal, calcite; Sme, smectite; Qz, quartz; Gp, gypsum; Py, pyrite; Sd, siderite; Crs, cristobalite; Kln, kaolinite; Ann, annite; Or, orthoclase; Sa, sanidine; Ab, albite; Ant, anatase; Rt, rutile. IMA-CNMNC-approved mineral symbols [30].
Table 3.
Rietveld refinement quantifications of the five bentonites from the ABM5 experiment (data in wt.%).
Table 3.
Rietveld refinement quantifications of the five bentonites from the ABM5 experiment (data in wt.%).
| Minerals | MX80 0.1 | MX80 1 | MX80 4 | MX80 7 | ANB 0.1 | ANB 1 | ANB 4 | ANB 7 | ROK 0.1 | ROK 1 | ROK 4 | ROK 7 | IBS 0.1 | IBS 1 | IBS 4 | IBS 7 | FEB 0.1 | FEB 1 | FEB 4 | FEB 7 |
|---|---|---|---|---|---|---|---|---|---|---|---|---|---|---|---|---|---|---|---|---|
| Hem | 1.0 | - | - | - | 2.7 | 2.6 | 3.1 | 2.5 | 2.6 | 1.3 | 1.0 | 0.5 | - | - | - | - | - | - | - | - |
| Cal | 0.1 | 0.5 | 0.6 | 1.3 | 0.9 | 1.8 | 2.0 | 5.0 | 1.2 | 1.0 | 0.7 | 1.0 | - | - | - | - | 1.1 | 0.9 | 1.6 | 1.0 |
| Sme | 81.0 | 85.4 | 82.3 | 81.3 | 90. | 89.5 | 88.5 | 87.3 | 82.0 | 82.8 | 83.5 | 82.2 | 92.3 | 92.2 | 91.5 | 93.9 | 89.1 | 86.7 | 85.8 | 85.4 |
| Qz | 5.6 | 6.0 | 4.8 | 6.1 | 2.7 | 3.0 | 3.0 | 1.7 | 3.3 | 4.0 | 4.5 | 4.5 | 1.0 | 1.0 | 1.0 | 0.9 | 2.4 | 2.2 | 1.9 | 2.0 |
| Gp | 0.5 | 0.8 | 0.9 | 0.3 | - | - | - | - | - | - | - | - | - | - | - | - | - | - | - | - |
| Py | 0.3 | 0.1 | 0.2 | - | - | - | - | - | 0.2 | 0.3 | 0.2 | 0.3 | 0.1 | 0.1 | - | - | - | - | - | - |
| Sd | - | - | - | - | 0.2 | 0.3 | 0.3 | 0.4 | 0.8 | 0.9 | 0.8 | 0.6 | - | - | - | - | - | - | - | - |
| Crs | - | - | - | - | - | - | - | - | - | - | - | - | - | - | - | - | 0.3 | - | 0.3 | - |
| Kln | - | - | - | - | 2.2 | 1.9 | 2.1 | 2.4 | 2.2 | 2.1 | 1.9 | 2.3 | - | - | - | - | - | - | - | - |
| Ann | - | - | - | - | - | - | - | - | - | - | - | - | 0.8 | 0.8 | 0.7 | 0.5 | - | - | - | - |
| Or | - | - | - | - | - | - | - | - | 3.6 | 3.6 | 3.5 | 3.8 | 1.1 | 1.7 | 1.1 | 2.1 | 2.7 | 2.5 | 1.7 | 1.6 |
| Sa | 4.8 | 3.6 | 5.1 | 4.2 | - | - | - | - | - | - | - | - | - | - | - | - | - | - | - | - |
| Ab | 6.4 | 3.4 | 5.9 | 6.6 | - | - | - | - | - | - | - | - | 4.7 | 4.2 | 5.6 | 2.7 | 4.3 | 7.8 | 8.5 | 10.0 |
| Ant | 0.4 | 0.2 | 0.2 | 0.3 | 0.6 | 0.5 | 0.5 | 0.5 | 4.1 | 4.1 | 4.0 | 5.0 | - | - | - | - | - | - | - | - |
| Rt | - | - | - | - | 0.5 | 0.3 | 0.5 | 0.3 | - | - | - | - | - | - | - | - | - | - | - | - |
| Total | 100 | 100 | 100 | 100 | 100 | 100 | 100 | 100 | 100 | 100 | 100 | 100 | 100 | 100 | 100 | 100 | 100 | 100 | 100 | 100 |
Hem, hematite; Cal, calcite; Sme, smectite; Qz, quartz; Gp, gypsum; Py, pyrite; Sd, siderite; Crs, cristobalite; Kln, kaolinite; Ann, annite; Or, orthoclase; Sa, sanidine; Ab, albite; Ant, anatase; Rt, rutile. IMA-CNMNC-approved mineral symbols are used [30]; 0.1, 1, 4 and 7 indicate distance in cm from the heating tube.
Table 4.
Exchangeable cations (in ppm) and average CEC values (in cmol·kg−1), with an average standard deviation of ± 5.6 cmol·kg−1 based on two measurements for each specimen taken from the five analyzed bentonite blocks. (CO: contact zone at 0.1 cm).
Table 4.
Exchangeable cations (in ppm) and average CEC values (in cmol·kg−1), with an average standard deviation of ± 5.6 cmol·kg−1 based on two measurements for each specimen taken from the five analyzed bentonite blocks. (CO: contact zone at 0.1 cm).
| Samples | Na | K | Ca | Mg | Total Cation Charges (= Na + K + (2 × Ca) + (2 × Mg)) | Average CEC |
|---|---|---|---|---|---|---|
| MX-80 CO | 29.7 | 3.7 | 7.2 | 1.4 | 50.5 | 74 |
| MX-80 1 | 32.4 | 3.3 | 15.5 | 1.4 | 69.6 | 81 |
| MX-80 4 | 35.6 | 3.3 | 15.0 | 1.5 | 71.9 | 85 |
| MX-80 7 | 37.1 | 3.3 | 10.9 | 1.5 | 65.1 | 91 |
| IBS CO | 24.0 | 3.7 | 21.4 | 2.2 | 75.0 | 72 |
| IBS 1 | 21.7 | 3.5 | 16.6 | 2.2 | 62.8 | 75 |
| IBS 4 | 22.7 | 3.4 | 18.2 | 2.3 | 67.3 | 81 |
| IBS 7 | 26.4 | 3.6 | 23.9 | 2.8 | 83.2 | 80 |
| ROK CO | 14.8 | 2.8 | 12.2 | 3.5 | 49.0 | 104 |
| ROK 1 | 15.3 | 2.6 | 13.4 | 3.5 | 51.6 | 102 |
| ROK 4 | 16.2 | 2.5 | 15.1 | 3.7 | 56.2 | 106 |
| ROK 7 | 16.0 | 2.2 | 13.9 | 3.4 | 52.8 | 109 |
| ANB CO | 19.9 | 2.2 | 38.0 | 0.7 | 99.5 | 102 |
| ANB 1 | 19.1 | 2.0 | 36.0 | 0.7 | 94.6 | 95 |
| ANB 4 | 20.3 | 2.1 | 41.1 | 0.7 | 106.1 | 97 |
| ANB 7 | 21.6 | 1.6 | 40.1 | 0.6 | 104.7 | 113 |
| FEB CO | 17.2 | 3.2 | 21.3 | 5.4 | 73.7 | 94 |
| FEB 1 | 17.8 | 3.2 | 16.7 | 5.5 | 65.3 | 100 |
| FEB 4 | 18.5 | 3.1 | 17.7 | 5.3 | 67.5 | 99 |
| FEB 7 | 21.1 | 3.7 | 20.8 | 6.1 | 78.7 | 108 |
Table 5.
Chemical compositions of the purified smectites from the EDX measurements, shown as oxide percentages (average oxide percentages of the three mapped areas for each sample were used (Section 2.4) (CO: contact zone at 0.1 cm)).
Table 5.
Chemical compositions of the purified smectites from the EDX measurements, shown as oxide percentages (average oxide percentages of the three mapped areas for each sample were used (Section 2.4) (CO: contact zone at 0.1 cm)).
| Samples | SiO2 | Al2O3 | Fe2O3 | MgO | CaO | Na2O | K2O | Total |
|---|---|---|---|---|---|---|---|---|
| MX-80 CO | 62.4 | 22.6 | 9.2 | 2.4 | 0.3 | 2.8 | 0.3 | 100 |
| MX-80 1 | 64.1 | 22.8 | 8.1 | 2.1 | 0.4 | 2.5 | 0.1 | 100 |
| MX-80 4 | 64.4 | 23.1 | 6.3 | 2.4 | 0.6 | 3.1 | 0.2 | 100 |
| MX-80 7 | 66.0 | 23.6 | 4.7 | 2.5 | 0.9 | 2.0 | 0.2 | 100 |
| IBS CO | 64.8 | 20.7 | 6.8 | 5.1 | 1.4 | 0.5 | 0.7 | 100 |
| IBS 1 | 66.3 | 21.1 | 4.6 | 4.8 | 1.3 | 1.3 | 0.6 | 100 |
| IBS 4 | 65.4 | 20.9 | 4.5 | 5.3 | 1.7 | 1.4 | 0.8 | 100 |
| IBS 7 | 67.8 | 20.9 | 3.9 | 4.9 | 1.2 | 0.9 | 0.3 | 100 |
| ANB CO | 58.8 | 22.0 | 9.7 | 3.3 | 2.3 | 3.4 | 0.3 | 100 |
| ANB 1 | 60.9 | 20.8 | 8.5 | 4.0 | 2.1 | 3.5 | 0.2 | 100 |
| ANB 4 | 58.4 | 20.9 | 9.7 | 4.3 | 1.1 | 5.3 | 0.3 | 100 |
| ANB 7 | 57.6 | 20.7 | 9.7 | 4.1 | 2.8 | 4.9 | 0.2 | 100 |
| FEB CO | 62.7 | 20.1 | 5.2 | 5.4 | 1.5 | 4.4 | 0.6 | 100 |
| FEB 1 | 63.3 | 20.2 | 4.8 | 5.1 | 2.1 | 4.0 | 0.6 | 100 |
| FEB 4 | 63.7 | 20.6 | 4.5 | 5.1 | 1.6 | 3.8 | 0.7 | 100 |
| FEB 7 | 63.8 | 20.8 | 4.9 | 5.2 | 1.4 | 3.3 | 0.6 | 100 |
Table 6.
Calculated mineral formulae of smectites, including the charges for the tetrahedral (TET) sheet and the octahedral (OCT) sheet, as well as the total layer charges. (CO: contact zone at 0.1 cm.) (Sheet and layer charges are given in e·phuc−1.)
Table 6.
Calculated mineral formulae of smectites, including the charges for the tetrahedral (TET) sheet and the octahedral (OCT) sheet, as well as the total layer charges. (CO: contact zone at 0.1 cm.) (Sheet and layer charges are given in e·phuc−1.)
| Samples | Tetrahedral (Max 4) | Octahedral (Max 2) | Interlayer Cations | TET Charge | OCT Charge | Total Layer Charge | Interlayer Cation Charge | ||||||
|---|---|---|---|---|---|---|---|---|---|---|---|---|---|
| Si | Al | Al | Fe | Mg | K | Na | Ca | Mg | |||||
| MX80 CO | 3.77 | 0.23 | 1.38 | 0.42 | 0.20 | 0.02 | 0.30 | 0.02 | 0.02 | −0.23 | −0.20 | −0.42 | 0.40 |
| MX80 1 | 3.84 | 0.16 | 1.45 | 0.36 | 0.18 | 0.01 | 0.28 | 0.02 | 0.00 | −0.16 | −0.19 | −0.35 | 0.34 |
| MX80 4 | 3.85 | 0.15 | 1.48 | 0.28 | 0.21 | 0.01 | 0.33 | 0.04 | 0.00 | −0.15 | −0.29 | −0.44 | 0.42 |
| MX80 7 | 3.91 | 0.09 | 1.55 | 0.21 | 0.23 | 0.01 | 0.22 | 0.06 | 0.00 | −0.09 | −0.26 | −0.35 | 0.35 |
| IBS CO | 3.87 | 0.13 | 1.33 | 0.31 | 0.36 | 0.05 | 0.06 | 0.09 | 0.10 | −0.13 | −0.36 | −0.49 | 0.49 |
| IBS 1 | 3.89 | 0.11 | 1.37 | 0.22 | 0.41 | 0.06 | 0.18 | 0.10 | 0.04 | −0.11 | −0.41 | −0.52 | 0.52 |
| IBS 4 | 3.90 | 0.10 | 1.37 | 0.20 | 0.42 | 0.06 | 0.16 | 0.11 | 0.04 | −0.10 | −0.43 | −0.53 | 0.53 |
| IBS 7 | 3.92 | 0.08 | 1.38 | 0.19 | 0.42 | 0.05 | 0.16 | 0.10 | 0.05 | −0.08 | −0.43 | −0.52 | 0.52 |
| ANB CO | 3.62 | 0.38 | 1.22 | 0.45 | 0.29 | 0.03 | 0.29 | 0.15 | 0.01 | −0.38 | −0.39 | −0.77 | 0.63 |
| ANB 1 | 3.72 | 0.28 | 1.22 | 0.39 | 0.37 | 0.02 | 0.29 | 0.14 | 0.00 | −0.28 | −0.42 | −0.70 | 0.58 |
| ANB 4 | 3.62 | 0.38 | 1.14 | 0.45 | 0.39 | 0.03 | 0.53 | 0.08 | 0.00 | −0.38 | −0.43 | −0.81 | 0.71 |
| ANB 7 | 3.59 | 0.41 | 1.10 | 0.45 | 0.38 | 0.01 | 0.44 | 0.19 | 0.00 | −0.41 | −0.58 | −0.99 | 0.83 |
| FEB CO | 3.80 | 0.20 | 1.24 | 0.24 | 0.50 | 0.05 | 0.42 | 0.10 | 0.00 | −0.20 | −0.57 | −0.76 | 0.67 |
| FEB 1 | 3.83 | 0.17 | 1.27 | 0.22 | 0.46 | 0.05 | 0.35 | 0.14 | 0.00 | −0.17 | −0.62 | −0.79 | 0.68 |
| FEB 4 | 3.84 | 0.16 | 1.31 | 0.21 | 0.45 | 0.05 | 0.36 | 0.10 | 0.00 | −0.16 | −0.55 | −0.70 | 0.61 |
| FEB 7 | 3.84 | 0.16 | 1.32 | 0.22 | 0.46 | 0.05 | 0.26 | 0.09 | 0.00 | −0.16 | −0.47 | −0.62 | 0.49 |
Publisher’s Note: MDPI stays neutral with regard to jurisdictional claims in published maps and institutional affiliations. |
© 2021 by the authors. Licensee MDPI, Basel, Switzerland. This article is an open access article distributed under the terms and conditions of the Creative Commons Attribution (CC BY) license (https://creativecommons.org/licenses/by/4.0/).
Share and Cite
MDPI and ACS Style
Sudheer Kumar, R.; Podlech, C.; Grathoff, G.; Warr, L.N.; Svensson, D. Thermally Induced Bentonite Alterations in the SKB ABM5 Hot Bentonite Experiment. Minerals 2021, 11, 1017. https://doi.org/10.3390/min11091017
AMA Style
Sudheer Kumar R, Podlech C, Grathoff G, Warr LN, Svensson D. Thermally Induced Bentonite Alterations in the SKB ABM5 Hot Bentonite Experiment. Minerals. 2021; 11(9):1017. https://doi.org/10.3390/min11091017
Chicago/Turabian StyleSudheer Kumar, Ritwick, Carolin Podlech, Georg Grathoff, Laurence N. Warr, and Daniel Svensson. 2021. "Thermally Induced Bentonite Alterations in the SKB ABM5 Hot Bentonite Experiment" Minerals 11, no. 9: 1017. https://doi.org/10.3390/min11091017
Note that from the first issue of 2016, this journal uses article numbers instead of page numbers. See further details here.