1. Introduction
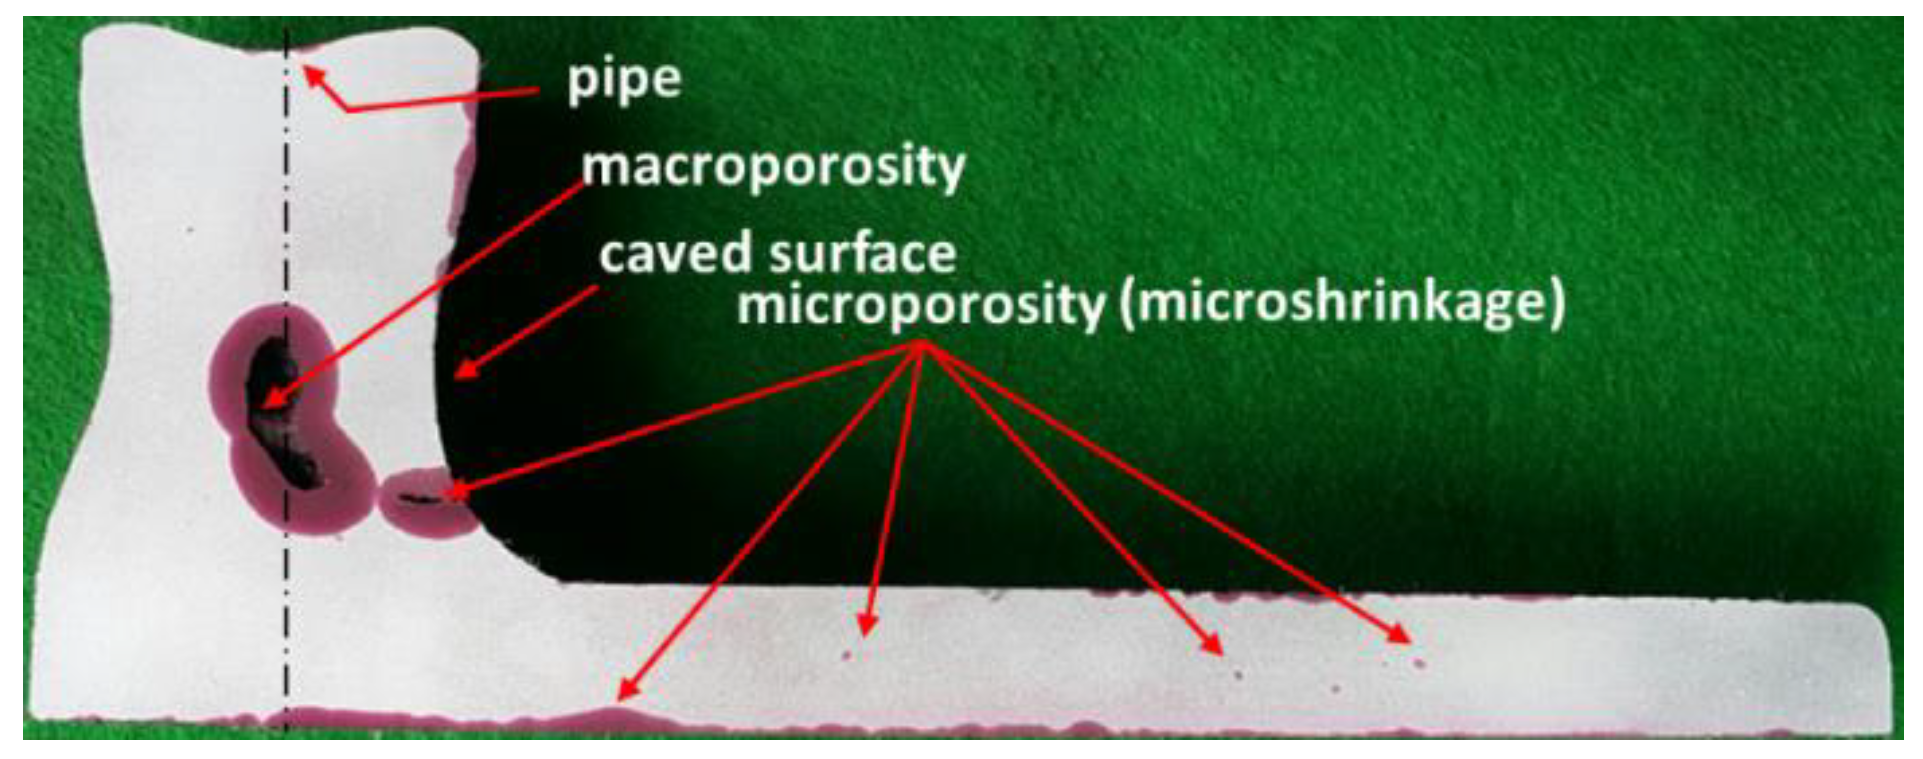
Because of the increased tendency to develop shrinkage defects, high-Si spheroidal graphite iron (SGI) presents significant challenges to the production of sound castings. The interplay between dendrite shrinkage and graphite expansion produces several shrinkage defects illustrated in
Figure 1 [
1]. Some of these defects are the result of uncompensated shrinkage (pipe, caved surfaces), some are produced by a decrease in the gas solubility in the liquid alloy (center-line microporosity) or from the mold/metal interface interaction (surface microporosity), and some can be the result of both shrinkage and gas porosity (macroporosity or enclosed shrinkage).
The literature provides abundant information on the negative effects of porosity on tensile strength, elongation, fatigue life, and hot tear initiation, particularly in the case of aluminum-based alloys (see, for example, the summary in ref. [
2]). It stands to reason that understanding porosity formation and the development of subsequent processes that can lead to its elimination in casting is not only a promising quality improvement route, but also a cost saving endeavor.
Shrinkage occurrence can be understood with the help of
Figure 2 [
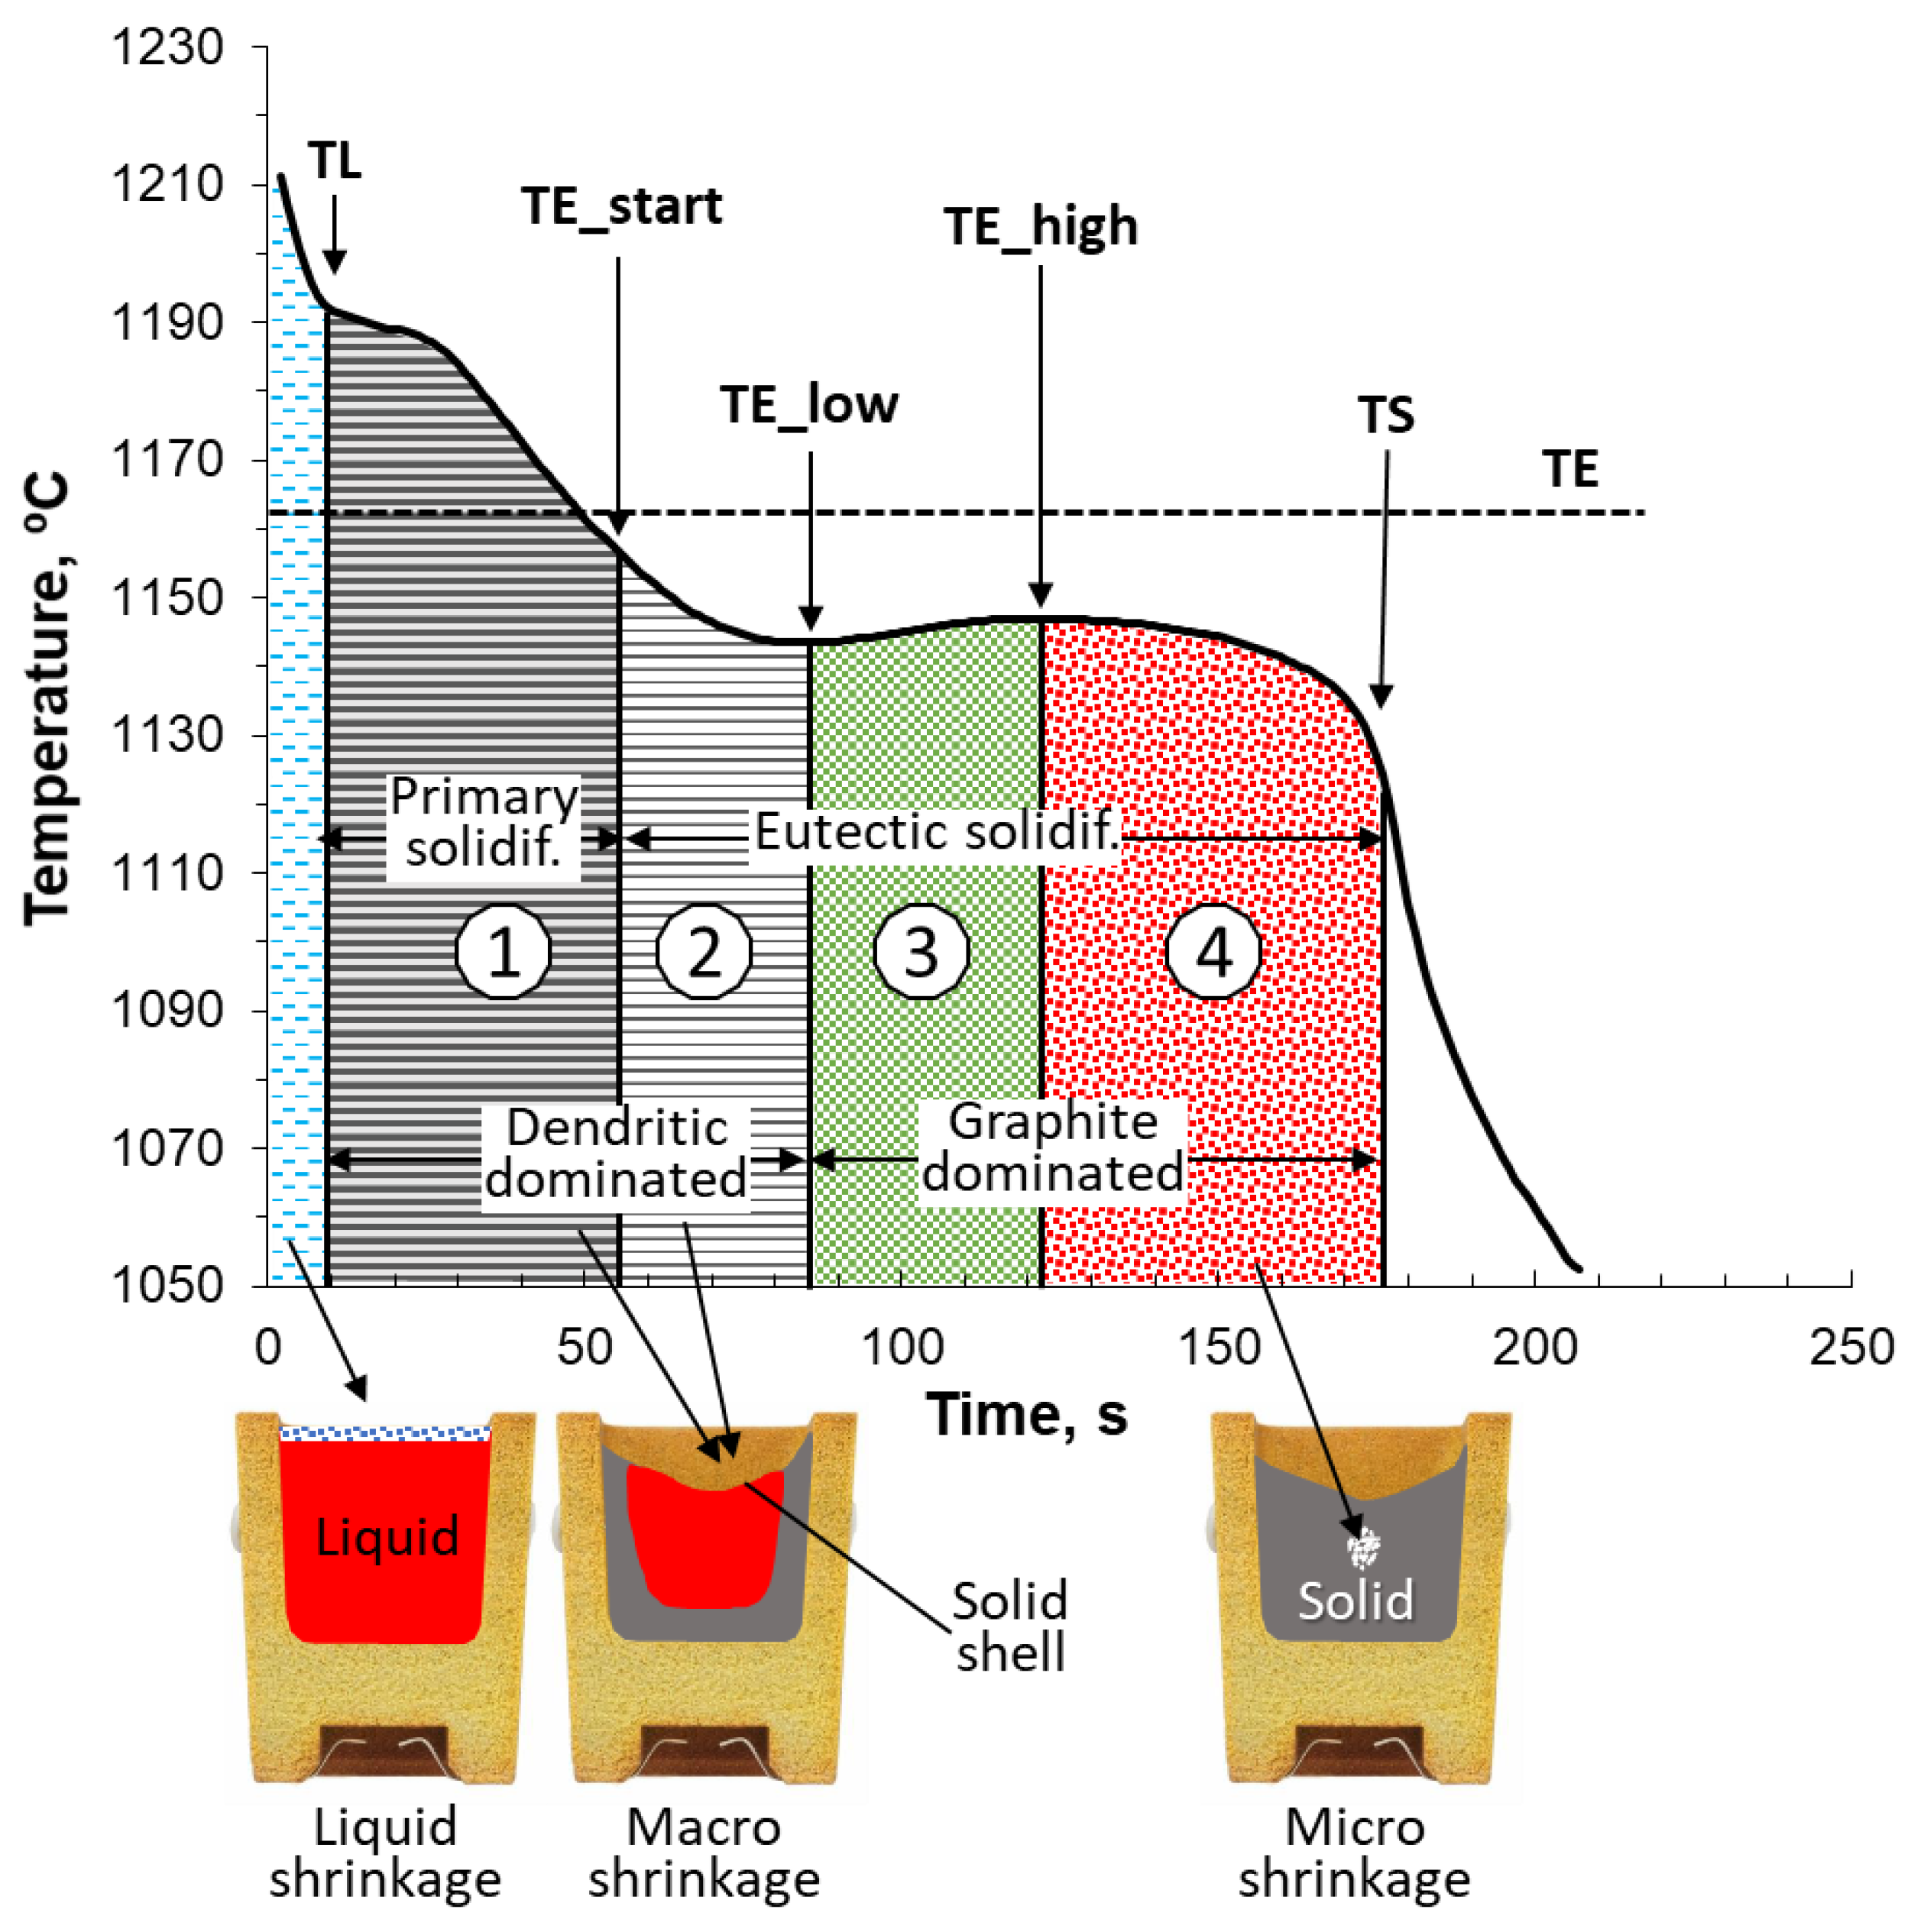
3]. Immediately after pouring, the liquid iron cools, liquid shrinkage occurs as the density of the liquid increases, and its specific volume decreases. This shrinkage is compensated by the risers. In a hypoeutectic iron, solidification then starts at
TL with the formation of dendrites that grow inward from the walls of the cup until the start of the eutectic solidification (Zone 1 on the figure). This shrinkage can also be compensated by the riser as long as the feeding channel is open. Dendritic shrinkage can extend even after the beginning of solidification, (
TE_start), as the amount of eutectic produced increases slowly over time (Zone 2). After the maximum undercooling is reached (
TE_low), fast generation of eutectic shifts the emphasis of solidification from dendritic-dominated (Zones 1 and 2) to graphite-dominated (Zones 3 and 4). In Zone 3, graphite expansion compensates for liquid and dendrite shrinking. However, in Zone 4, when the amount of eutectic generated and thus that of the graphite decreases, there is a risk of microshrinkage (microporosity) formation, because graphite expansion may become insufficient to compensate the shrinkage.
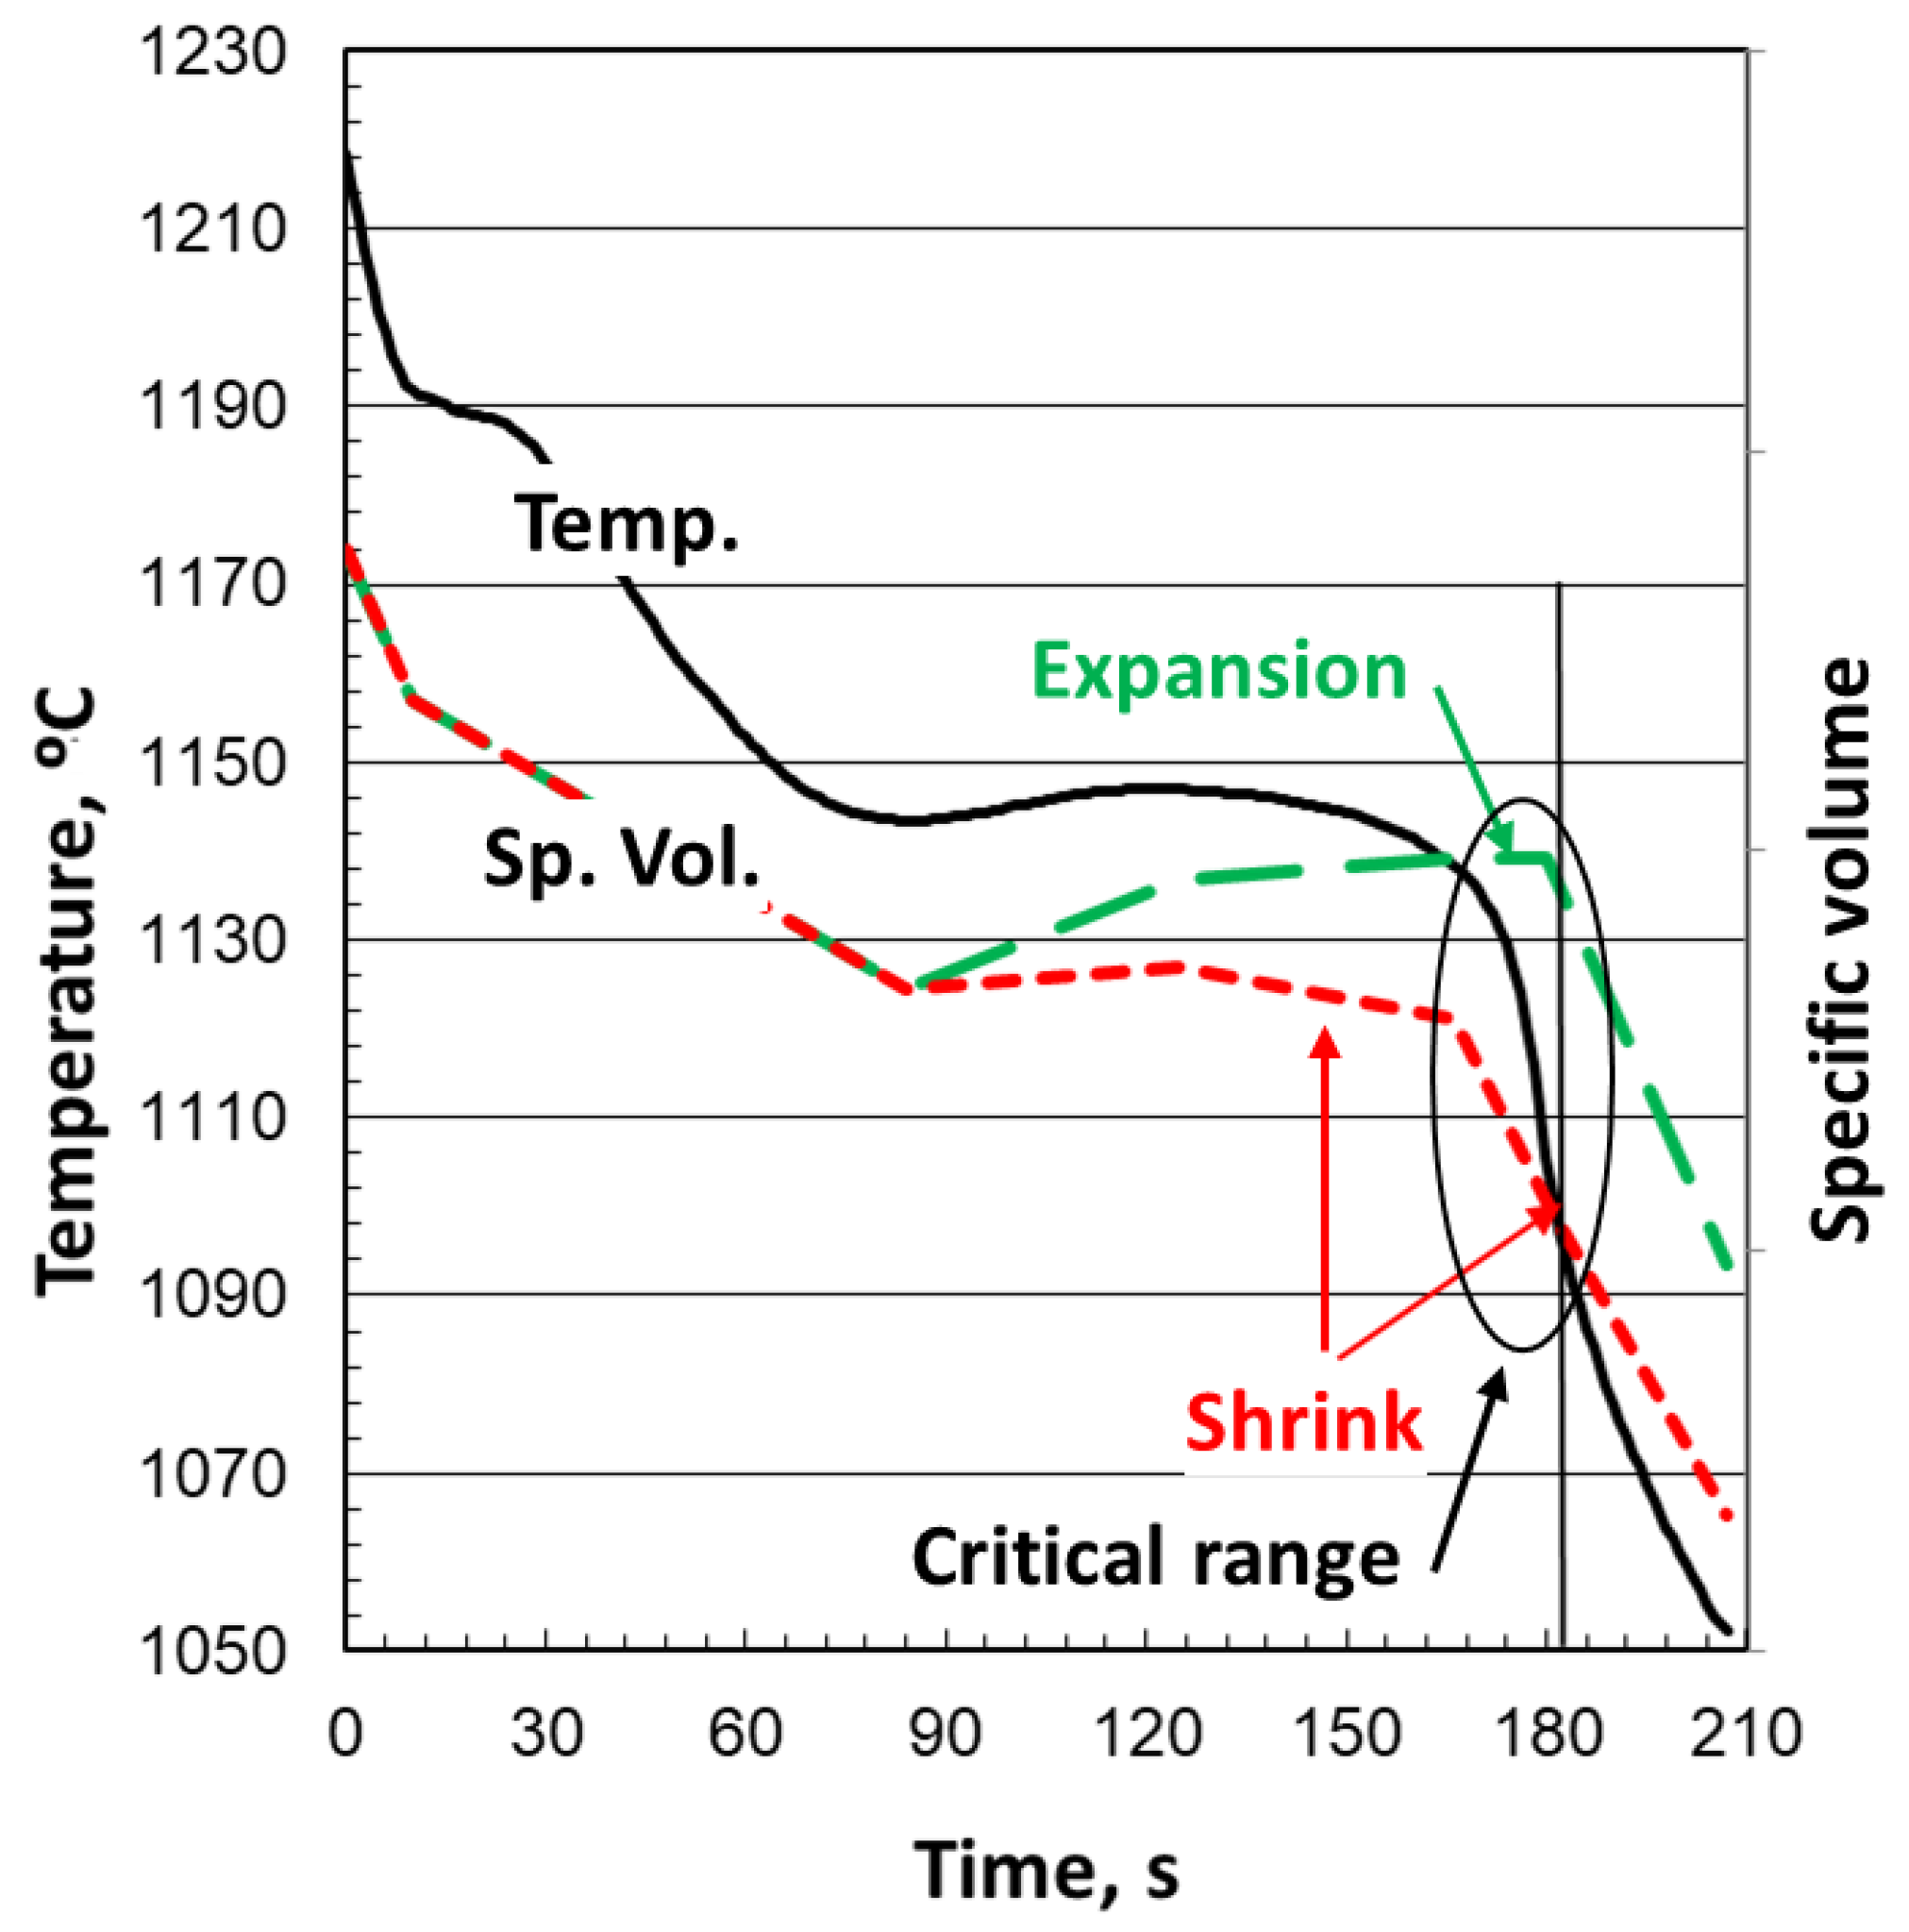
During primary solidification of hypoeutectic iron, in the dendrite-dominated solidification (
Figure 2), the liquid/austenite mixture continues to shrink as the specific volume decreases (
Figure 3). As long as the permeability of the mushy dendritic region is sufficiently high, the shrinkage is compensated by flow from the risers. Graphite expansion begins once the maximum undercooling,
TE_low, is reached and may (green line), or may not (red line), continue to the end of solidification. The final result will be expansion if enough graphite expansion occurs, or shrinkage in the case of insufficient expansion, as shown in the critical range in
Figure 3. The figure also shows a drop in expansion (green line) at the end of solidification, typically produced by decreased graphite growth in the last regions to solidify because of segregation of carbide-promoting elements. For SG iron, the mushy zone is much larger and its permeability much smaller than that of lamellar graphite (LG) iron. This restricts feeding from the riser and decreases the cooling rate. In principle, both LG and SG irons of near-eutectic or eutectic composition should exhibit expansion during solidification and therefore should not be prone to forming either cavity or porosity shrinkage. While this is true for gray iron, the ordinary manufacturing of SG iron is susceptible to shrinkage porosity because of limited graphite growth at the end of solidification, which is then dominated by austenite shrinkage. This induces specific volume decrease and produces uncompensated shrinkage in the last region to solidify, and thus porosity.
The fracture pressure in liquid state is very high; therefore, porosity cannot form without the existence of gas pores in the liquid. Indeed, according to Tiryakioglu [
4], the intrinsic fracture pressure of aluminum is of −4 GPa at its melting temperature in both liquid and solid states. The nucleation of pores that form porosity is the subject of some debate. The matter is addressed in depth for the case of steel and aluminum alloys, where some researchers attribute pore nucleation to either homogeneous or heterogeneous nucleation [
1,
5,
6,
7,
8,
9]. They contend that nucleation of gas bubbles before the beginning of solidification occurs at the mold walls and on impurities in the liquid, and that micron-size gas bubbles can be assumed to exist in the liquid following their incorporation from the turbulent flow during pouring and mold filling. However, some studies [
2] maintain that pores cannot nucleate either homogeneously or heterogeneously in liquid aluminum. Indeed, results of in situ studies on pore formation show that pores appear at low hydrogen supersaturation levels, bypassing nucleation completely [
2]. They support Campbell’s theory, according to which pores are formed by oxide bifilms [
10,
11,
12,
13,
14]. Moreover, Campbell even extended his theory to SG iron [
15].
The purpose of this article, however, is not to debate the origins of pore formation, but rather to process improvement by quantifying the size of microporosity in SG iron as a function of the chemical composition of the inoculants used.
2. Experimental Procedure
A cast iron heat (#230120) with high carbon equivalent (CE = 4.73) was produced in a 100 kg medium frequency induction furnace (250 Hz, 100 Kw). The charge of this heat consisted of 24 kg of high silicon ductile iron returns and 26 kg of high purity iron. Predetermined amounts of a commercial graphite (98.9% C, 0.03% S) and of FeSi75 alloy (74.6% Si, 0.3% Ca, 0.7% Al) were also added to the metallic charges. A small quantity of pure antimony (99.99% Sb) was introduced, in order to avoid the formation of chunky graphite. After superheating to 1500 °C, the iron was transferred into the pouring ladle for Mg treatment (sandwich method, 1.1 mass% of the batch weight, covered with steel scrap) with an Fe–Si–Mg alloy having the chemical composition 46% Si, 6.06% Mg, 0.56% Ca, 1.03% Al, and no rare earth (RE).
The final melt composition (mass%) was as follows: 3.38% C, 4.08% Si, 0.18% Mn, 0.014% P, 0.007%S, 0.044% Cr, 0.01% Mo, 0.091% Ni, 0.042% Mg, 0.01% Ti, and 0.0045% Sb.
A 0.2 mass% of commercial inoculant was deposited on the bottom of the thermal analysis (TA) cups before filling. A number of experiments were conducted, the first one without inoculation and the following five with different inoculants. The chemical compositions of the inoculants are listed in
Table 1. For each experiment, the cooling curves of the TA cups were recorded with the Thermolan
® system (V2, Veigalan Estudio 2010, S.L.U, Durango, Spain), and the cooling rates (first derivatives of the cooling curves) were calculated and plotted. The TA cups were sectioned in the middle, with the objective to detect higher shrinkage evaluated through quantitative visual microscopy (image J) for nodule count and graphite shape (roundness). A 2D analysis with the Image J software was also conducted to quantify the size of the microporosity region. The analysis does not account for the size of the caved surfaces. To identify possible nuclei, an Ultra PLUS Carl Zeiss SMT (ZEISS, Thornwood, NY, USA) (0.8 mm resolution at 30 kV) in the STEM mode was used in combination with an X-Max 20 Oxford Instruments EDX detector (Oxford Instruments, Abington, UK) with a resolution of 127 eV/mm
2. The most advanced FEG-SEM techniques such as spectra, mappings, and line scans, were applied to analyze the main elements present in the inclusions and to estimate the type of compounds which can act as nucleation sites for graphite.
3. Experimental Results and Discussion
The experimental results for the exploratory laboratory experiments are summarized in
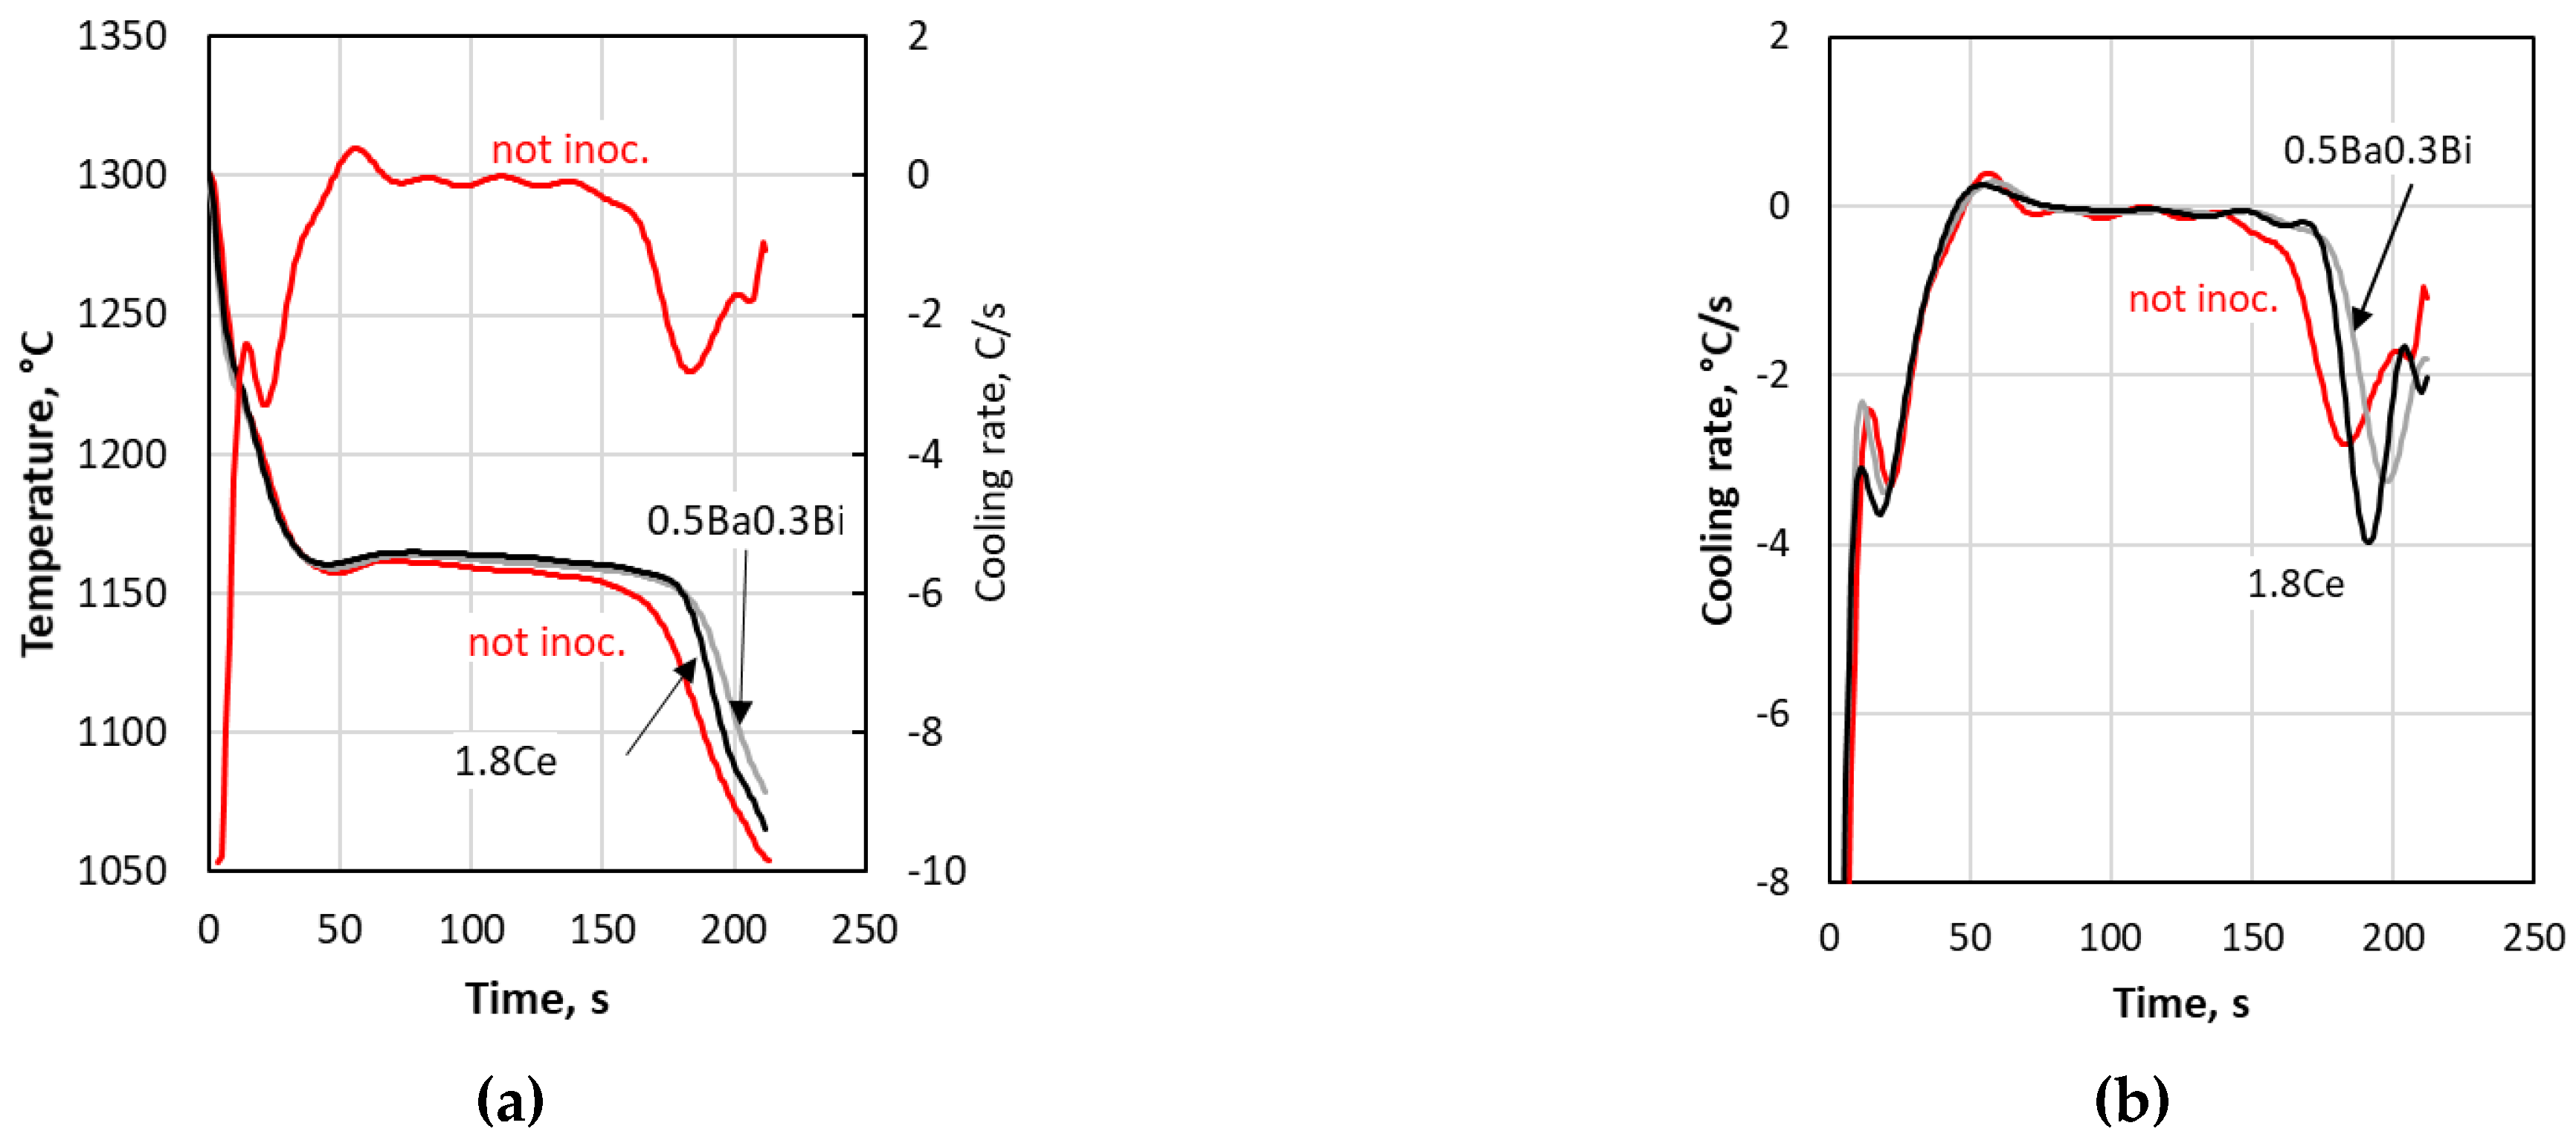
Table 2. Some examples of the cooling curve analysis of the various TA cups are given in
Figure 4. It is seen that while all the samples have the same initial cooling rates (
Figure 4a), there are significant differences in their maximum cooling rates at the end of solidification (minima of the first derivatives on
Figure 4b).
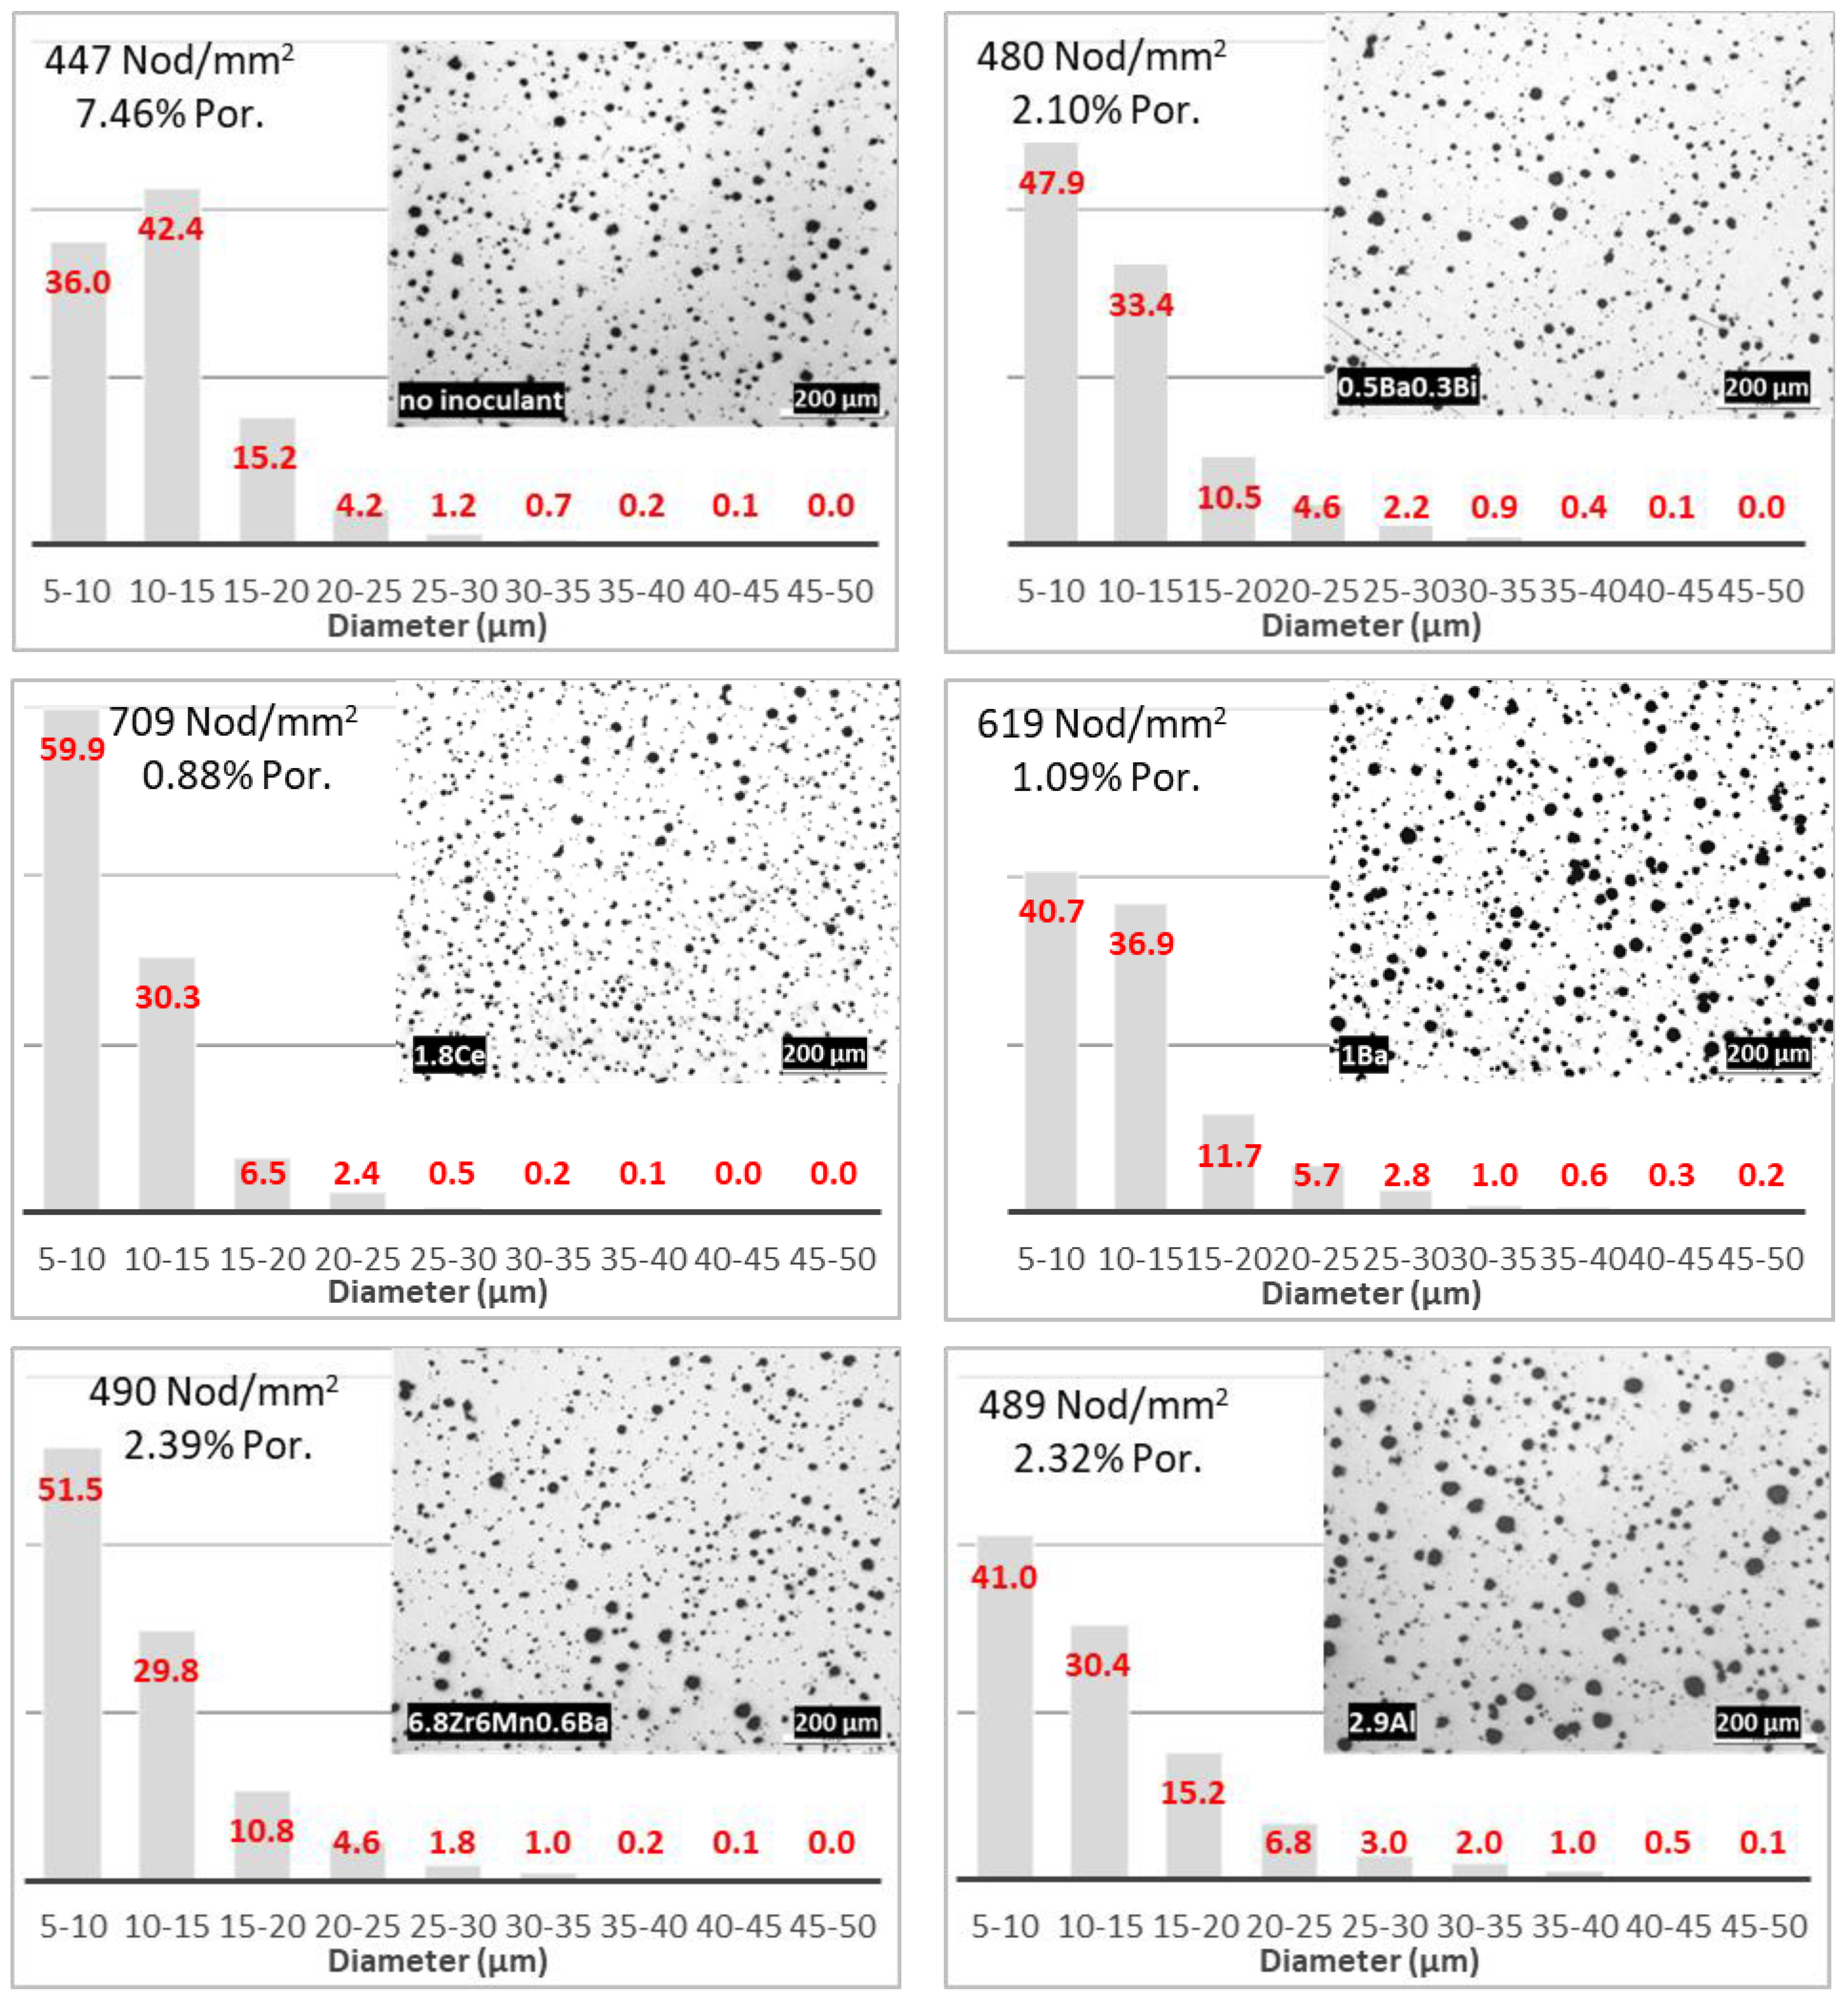
The detailed analysis of the shape and size distribution of graphite nodules revealed that although the graphite shape (roundness) was not too different between the samples (
Table 2), the size distribution of the inoculated samples moved to finer graphite as expected (
Figure 5), probably due to the high local concentrations of Si, which increased the activity of C favoring the formation of graphite. The most efficient inoculants based on the number of graphite nodules produced were Re-1.8Ce and Ilard-1Ba, with 709 and 619 nod/mm
2, respectively. However, the analysis of the size distributions in
Figure 5 reveals that while the 1.8Ce inoculant produced a distribution with 90% of the nodules in the range of 5–15 µm diameter, only 77% of the nodules in the sample showing the results for the 1Ba inoculant were in this range. Additionally, the nodule size was more uniform for the 1.8Ce-inoculated irons than for the 1Ba iron (four columns with more than 1% vs. five columns, respectively). The least efficient inoculant appeared to be 2.9Al, with a distribution spread over seven columns.
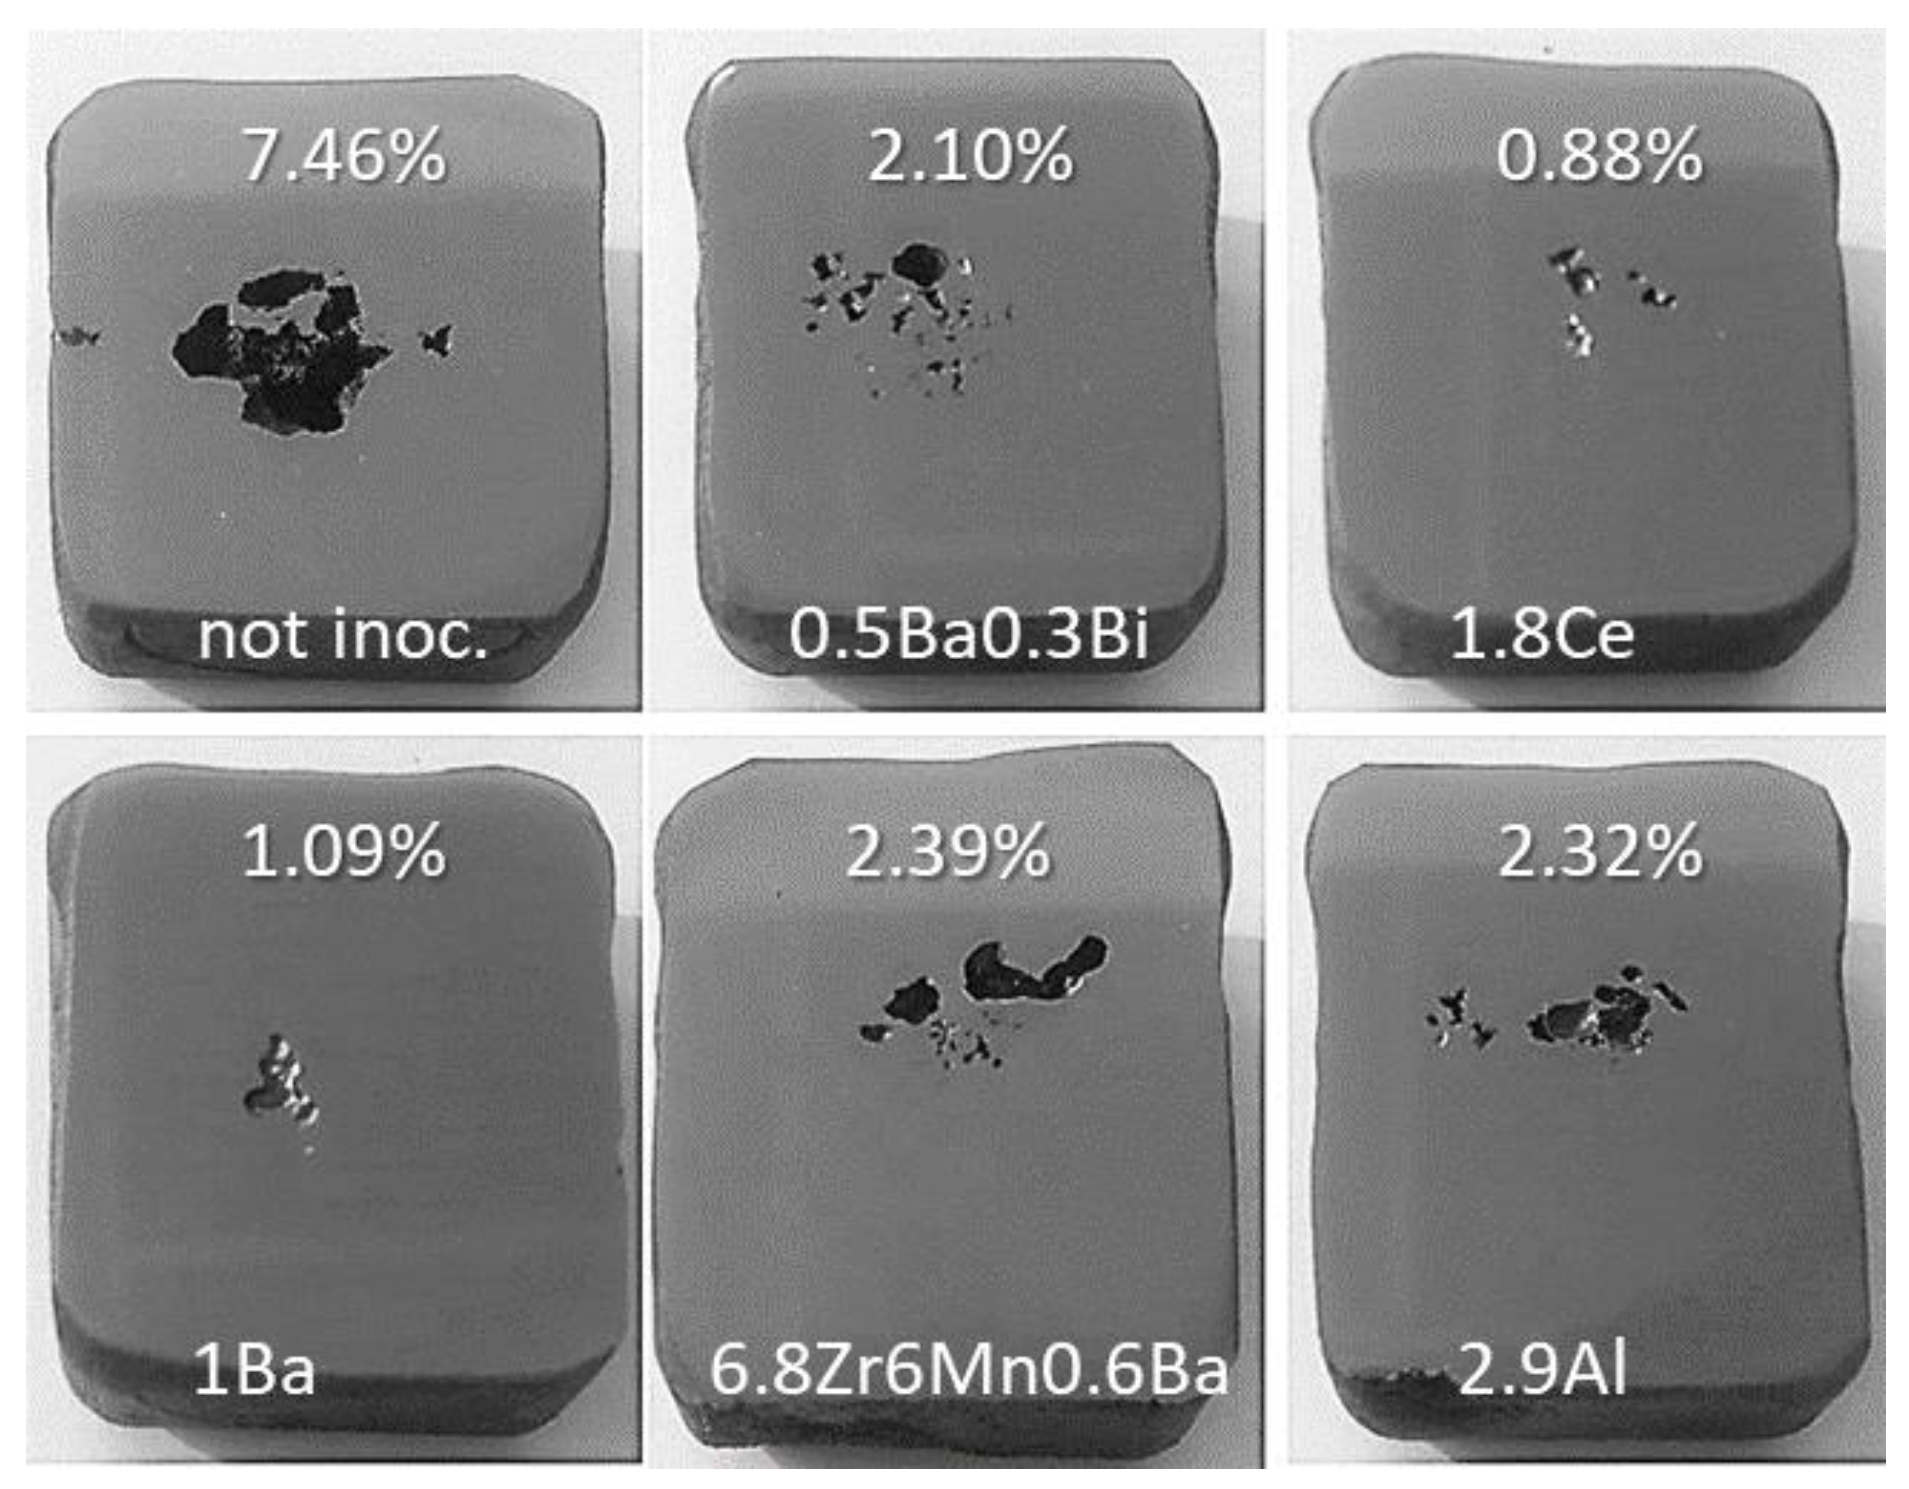
Sections of the TA cups are presented in
Figure 6, with the corresponding 2D analysis with the Image J software results for porosity in percentage. Both visual estimation and 2D image analysis results applying techniques based on contrast and grey levels analysis demonstrate that the addition of inoculants drastically reduced the shrinkage porosity. Indeed, the uninoculated sample exhibited 7.46% porosity, while the inoculated samples were all under 2.39%. Two major differences between the uninoculated and the inoculated samples are seen when analyzing the nodule count distribution graphs:
The inoculated samples have a higher overall nodule count (480–709 mm−2 for inoculated, compared to 447 mm−2 for uninoculated).
For all inoculated samples, the higher frequency of nodule distribution was for nodule diameters of 5–10 µm, while for the uninoculated sample it was in the range 10–15 µm.
The lowest porosity was measured on the TA cup inoculated with the 1.8Ce inoculant.
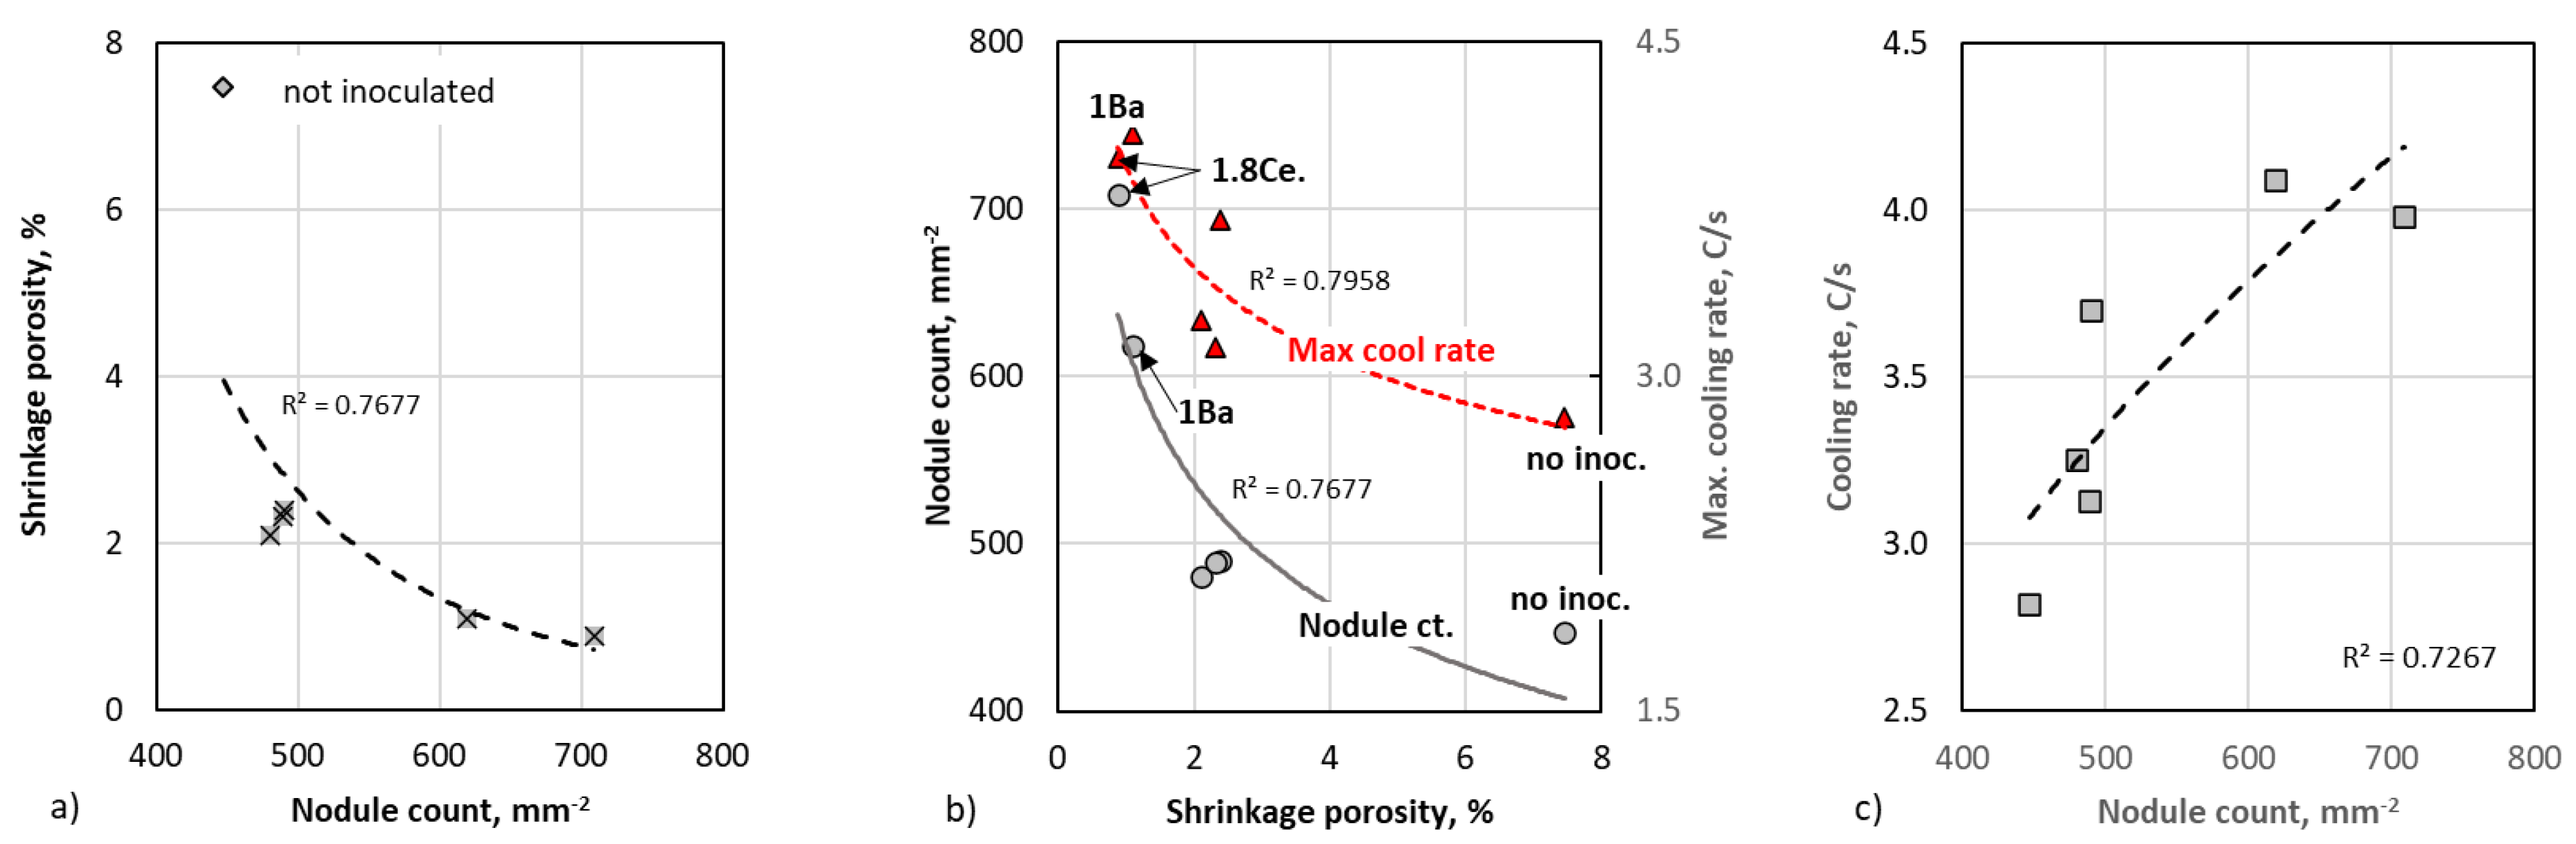
A graphic summary of the experimental data is presented in
Figure 7. From
Table 2 and this figure, it is seen that there is a clear correlation between shrinkage porosity on one hand, and the nodule count and the maximum cooling rate at the end of solidification (
CRmax), on the other hand. First, we note on
Figure 7a that that the uninoculated sample had the lowest nodule count (447 mm
−2) as expected, and additionally, by far the highest porosity (7.46%). All inoculants decreased in porosity dramatically. Then, from
Figure 7b, it can be observed that the porosity appears to be well correlated with the
CRmax, which increased as the porosity decreased. The increase in the maximum cooling rate with porosity was probably due to the fact that higher porosity decreased the thermal conductivity of the TA sample, and therefore the slope of the cooling curve. This is also illustrated on
Figure 4a, where it is seen that the end of the cooling curve of the 1.8Ce inoculant (0.88% porosity) is steeper than those of the 0.5Ba0.3Bi inoculant (2.1% porosity) and of the no-inoculant (7.46% porosity) cups. There is also a reasonable correlation between the nodule count and
CRmax (
Figure 7c).
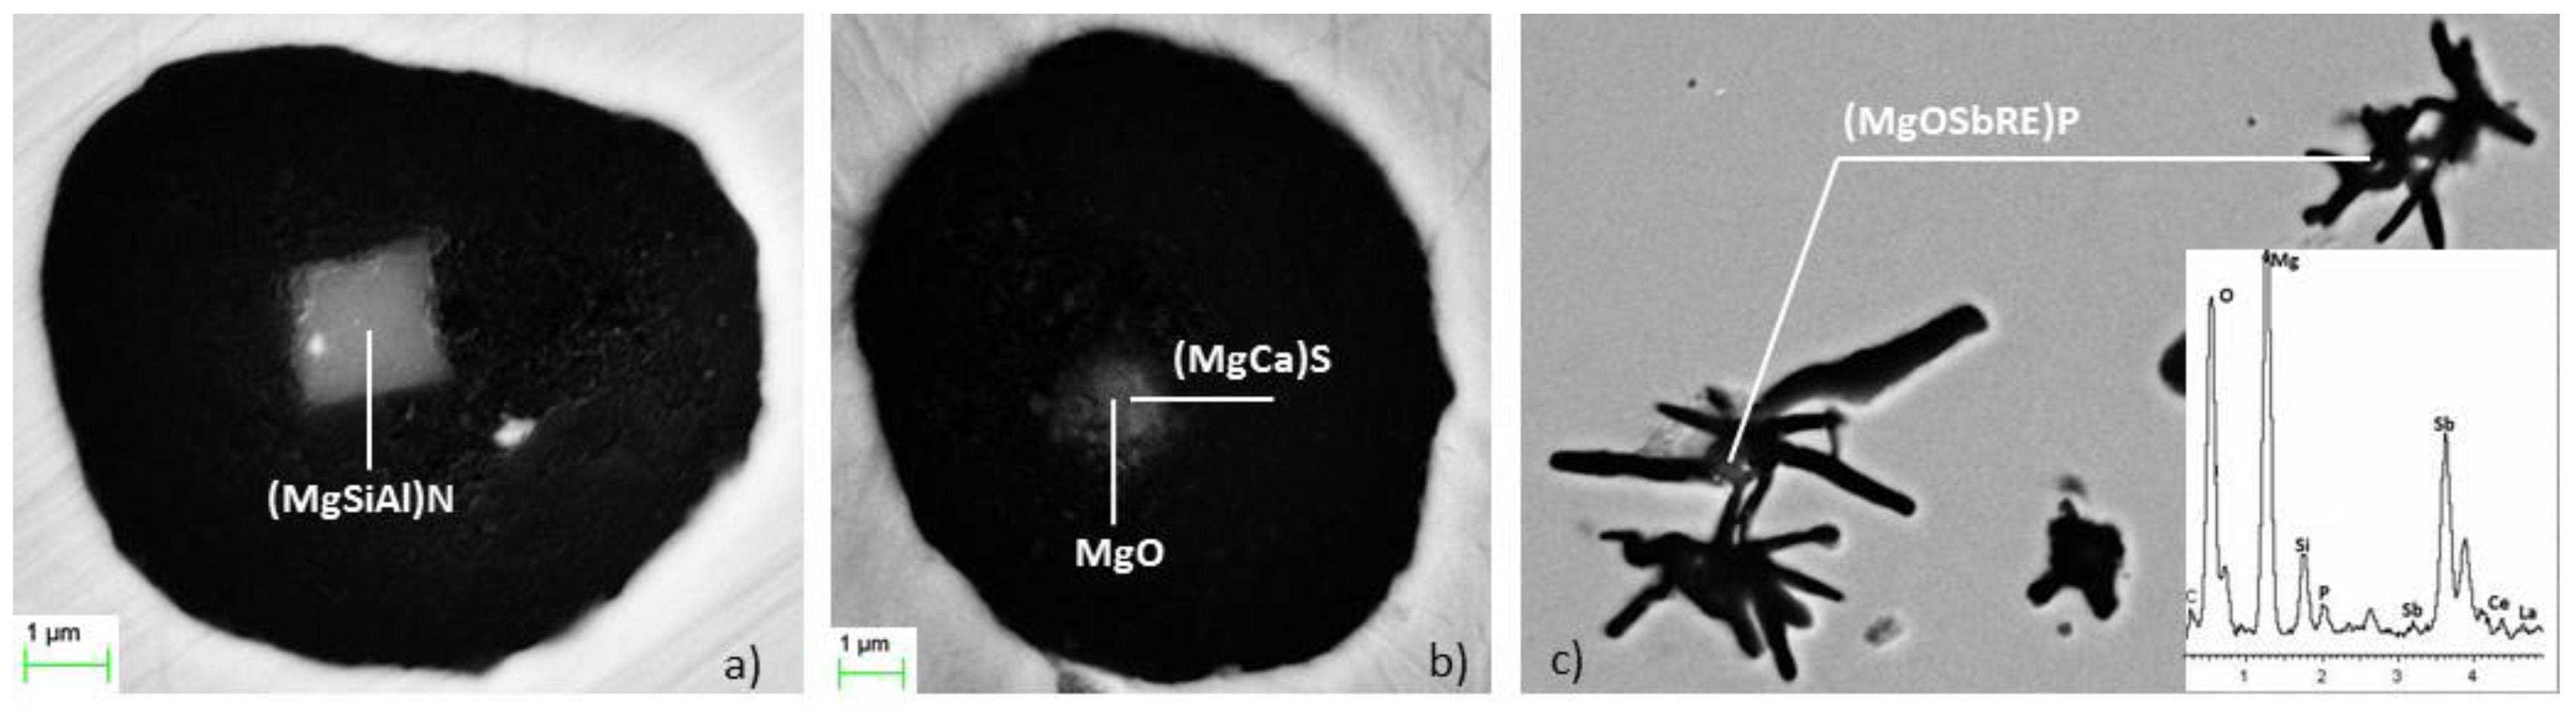
The information provided by the SEM analysis indicates that (MgSiAl)N nitrides are the predominant inclusions for all samples. They present a clear cubic and/or polygonal shape and usually appear alone as nucleation sites for graphite (
Figure 8a). Some sulfides nucleating on small Mg oxides were also observed (
Figure 8b). No Ti carbides were found because of the low level of titanium (0.010% Ti) in the base metal [
16]. Several phosphides were detected (typically in the uninoculated sample) acting always as nuclei for small spiky graphite [
17].


 ,
, 
