


Abstract
Recently, many studies have actively dealt with the issue of driver-gaze tracking for monitoring the forward gaze and physical condition. Driver-gaze tracking is an effective method of measuring a driver’s inattention that is one of the major causes of traffic accidents. Among many gaze-tracking methods, the corneal specular reflection (SR)-based method becomes ineffective, unlike in an indoor environment, when a driver’s head rotates, which makes SR disappear from input images or disperses SR in the lachrymal gland or eyelid, thereby increasing the gaze-tracking error. Besides, since a driver’s eyes in a vehicle environment need to be captured in a wide range covering his head rotation, the eye region is captured in a relatively low resolution compared to face-only images taken in indoor environments at the same resolution, making pupil and corneal SR difficult to detect accurately. To solve these problems, we propose a fuzzy-system-based method for detecting a driver’s pupil and corneal SR for gaze tracking in a vehicle environment. Unlike existing studies detecting pupil and corneal SR in both eyes, the method proposed in this research uses the results of a fuzzy system based on two features considering the symmetrical characteristics of face and facial feature points to determine the status of a driver’s head rotation. Based on the output of the fuzzy system, the proposed method excludes the eye region, which is very likely to have a high error rate of detection due to excessive head rotation, from the detection process of the pupil and corneal SR. Accordingly, the proposed method detects pupil and corneal SR only in the eye region that apparently has a low detection error rate, thereby achieving accurate detection. We use 20,654 images capturing 15 subjects (including subjects wearing glasses), who gaze at pre-set fifteen regions in a vehicle, to measure the detection accuracy of the pupil and corneal SR for each region and the gaze tracking accuracy. Our experimental results show that the proposed method performs better than existing methods.
1. Introduction
According to an investigation by the National Highway Traffic Safety Administration (NHTSA), approximately 94% of motor vehicle accidents stem from drivers, and nearly 56% of the accidents are caused by the drivers’ inattention, including distraction, drowsiness, drinking, use of cell phones, and negligence of forward gaze [1]. Some studies dealing with this issue have focused on monitoring techniques to identify the driver’s condition and prevent a traffic accident [2,3,4,5]. Among such techniques, the driver gaze tracking system uses eye information such as blinking frequency and gaze direction to check drowsy driving or monitor forward gaze, and also provides the driver with missed information. Therefore, in our research, we aim at monitoring forward gaze of driver by using our gaze tracking system to prevent the vehicle accident by the driver’s inattention.
Unlike the gaze tracking in indoor environments using a monitor, the majority of gaze-tracking studies for a real vehicle environment utilize non-wearable devices, since the various body movements of a driver along with head rotation make wearable devices detrimental to safe driving and result in changes in the position of a device, which deteriorates its accuracy significantly.
Among the tracking techniques using facial images, driver-gaze tracking using head motion estimates a driver’s gaze by calculating his head direction from the images. This method is adopted when only low-resolution images are available, or the information on a driver’s eyes is difficult to detect. However, gaze is nothing but looking at something with one’s eyes, and the head direction does not correspond perfectly with eye movement. Accordingly, the accurate tracking of a driver’s gaze needs to be based on his/her eye information. The gaze tracking based on a driver’s eye information uses pupil and corneal specular reflection (SR) which occurs in the cornea due to the near-infrared (NIR) light. Since the accuracy of the driver-gaze tracking depends on the accuracy of detecting the pupil and corneal SR, studies are increasingly being conducted on detecting the pupil and corneal SR.
However, most previous gaze-tracking studies, which were conducted in vehicle environments, could not solve the problems of inaccurate pupil or corneal SR detection, which were generated when a driver turned his head excessively to look at various spots in a vehicle (see details in Section 2). In addition, since a driver’s image including the eyes needs to be captured over a wide range to cover the rotation of his head in a vehicle environment, the eye region of this image is represented in lower resolution than in the face image taken in the same resolution in an indoor environment. Thus, it is still difficult to detect pupil and corneal SR accurately. With the motivation to solve these problems and limitations of existing studies, we propose a gaze-tracking method that uses the fuzzy-system-based pupil center and corneal reflection (PCCR) detection considering a driver’s head poses in vehicle environment. This is the goal of our study. Compared to previous works, our research has the four innovative contributions as follows.
- -
- We calculated a focus value of the eye region detected from an input image and excluded optical and motion blurs from the detection of pupil and corneal SR, which decreased the error rate of gaze tracking.
- -
- Considering the symmetrical characteristics of face and facial feature points, we set the two distance ratios between the facial feature points, which were detected to measure the status of head rotation, as two features, and used them as the two inputs of the fuzzy system.
- -
- We used a fuzzy system to measure the driver’s head rotation. Accordingly, we did not reflect the information on pupil and corneal SR, which were detected in the eye’s region of interest (ROI) while the head was turning, and thus, the error rate was high in gaze tracking. In this way, the gaze tracking accuracy could be improved.
- -
- We opened our algorithm codes and driver-gaze-tracking database (DB), which we constructed for a driver looking at fifteen points in a real vehicle and prepared for experimental purposes, to other researchers who can freely request our database by sending email to authors. We expect the methods of other studies to contribute to a fair performance evaluation.
2. Related Works
Gaze-tracking methods are either model-based or appearance-based [6]. The model-based method defines an eye as a sphere-like geometric model and calculates the gaze position by using the detected eye feature in an image. This model-based method is further divided into the corneal-reflection-based method and shape-based method. The corneal-reflection-based gaze tracking uses NIR camera and NIR illumination to calculate the gaze from the relationship between the change in the pupil’s position and the position of light reflection in the cornea [7,8,9,10,11,12,13,14,15,16,17,18,19,20,21,22,23]. The shape-based method detects the pupil or iris contour, and as the shape of the pupil or iris contour becomes elliptical according to the gaze direction, it predicts the corresponding shape of a three-dimensional (3D) spherical eye model and calculates the gaze [24]. The appearance-based method, which is adopted in some cases, uses an input image as input, treats it with a classifier, and conducts the mapping directly on the screen coordinates [25,26,27]. Therefore, this method can be applied to low-resolution images without camera calibration and geometry data. However, since the brightness of the eye image can vary according to the illumination, the accuracy of the appearance-based method may decrease, and this method needs more user-specific training data than the model-based method.
Most of the existing gaze-tracking studies have been conducted in indoor environments. Consequently, a user’s gaze is constrained to a desktop monitor, and thus, the head rotation is made little; besides, as there is no change in illumination, the brightness of the image does not change much. On the other hand, the region of a driver’s gaze is not limited to the vehicle environment, which generates a wide rotation of the gaze and head. Vehicle movement also introduces the influence of extraneous light. Thus, for accurate gaze tracking in a vehicle environment, a method that tackles the above problems needs to be adopted to detect pupil and corneal reflection accurately. For the methods of detecting gaze position in an indoor environment, one of the existing studies detected the pupil by using the difference between dark pupil and bright pupil images. In the study, an NIR light emitting diode (LED) was installed in a location far off the optical axis of an NIR camera and was switched on. In this condition, a dark pupil image was obtained by using the NIR camera. When the NIR LED was installed close to the optical axis and was switched on, the IR LED light was reflected in the cornea, and thus, the pupil appeared very bright [28]. Another research used the circular Hough transform (HT) to detect pupil edges from eye images and then to detect circles with an equivalent radius from a center. Accordingly, the overlapped portion was ultimately detected as the center of the pupil [29]. Unlike other boundary detection methods, this method is resistant to noise but suffers from the deterioration of accuracy in detecting the center of an elliptical pupil during head rotation. Leimberg et al. introduced a deformable template method that detects a pupil in the eye image by using the difference in the gray level of pixels between the elliptical template and the pupil [30]. Since the initial position of the pupil affects the processing speed, the tracking method using the active contours and particle filtering, which was introduced in [31], was used to increase the speed. However, as the processing speed for a high-resolution image was as slow as 2.2 frames per second (fps), the real-time motions of a driver in a vehicle were not processed satisfactorily. Corneal reflection is mostly detected by using the fact that when the light from the NIR LED installed near an NIR camera is reflected in the cornea, the eye image caught by the camera has the brightest point at the center [18]. In this situation, a cornea is normally the brightest point in the eye, and thus, image binarization is applied to find the cornea. However, if the eye turns right or left, the LED light is reflected not in the cornea, but rather in the lachrymal gland or eyelid, or the difference of curvature between the cornea and sclera causes two reflections or diffusion. Accordingly, it is necessary to check whether the reflection is generated from an accurate and necessary position for gaze estimation. In another research, the gaze-tracking method based on the PCCR or iris center and corneal reflection (ICCR) used a visible LED and camera instead of an NIR LED and camera [31]. However, the use of visible light and camera is vulnerable in the vehicle environment where the brightness of images changes due to extraneous light. In [4], the authors conducted the boundary segmentation of an image obtained by a wearable device after the binarization proposed in [32], and removed the eyelid over a pupil or the effect of reflection of infrared light using the ellipse fitting, which was proposed in [33], to find the pupil. Although the wearable device was lightweight, it could obstruct the driver’s view in the vehicle environment, and the discomfort of putting it on and off was inevitable. In addition, since the camera of the wearable device was located close to the eyes, high-resolution images of the eyes could be acquired, but the eyes could be found only if the device was worn in its accurate position, which was another disadvantage.
Among the existing gaze-tracking studies performed in vehicle environments, a research [3] proposed methods of identifying face rotation and eye state to detect a driver’s fatigue level. The driver’s face was searched in a visible light image by using adaptive boosting (adaboost) with adaptive template matching, and then the face thus obtained was divided into four equal regions, with the upper two regions being allocated to the eyes. In the eye regions, binarization, morphology operation, and labeling were conducted to designate a large mass as a pupil, and the center of the mass was allocated to the pupil center. The accuracy of face detection was as high as 97.2%, and the accuracy of eye region detection was similarly high. However, the eye region was set large so that binarization and other processes had a high detection error rate and the visible image was much affected by extraneous light, which resulted in the decrease in detection accuracy for the pupil center. Another research installed circular NIR illuminators at two locations around a camera, and the bright pupil and dark pupil effect and a vehicle image were used to detect a pupil. In addition, the pupil location was utilized to detect corneal reflection, which appeared bright in the dark pupil image [5]. However, as the camera and the lighting device were big, if they were positioned in front of a driver, they could obstruct the driver’s view. Besides, since both dark pupil image and bright pupil image need to be used, the processing becomes slow, which makes real-time detection unrealistic. Another disadvantage of this method is that the experiment was not conducted in a real vehicle environment. Ahlstrom et al. installed two cameras in the A-piller and behind the center console, respectively, to observe the driver’s face. They also implemented the SmartEye Pro 4.0 system (Smart Eye AB, Gothenborg, Sweden) to detect the driver’s eyes. In this way, they measured the degrees of the driver’s fatigue and inattention during real vehicle driving. However, the eye-tracking system was very expensive [34]. In addition, although the algorithm detecting the driver’s fatigue and inattention depended completely on the eye tracking, 23% of the total travel distance showed degraded reliability of the eye-tracking data. In addition, to determine the location and direction of the two cameras used in the SmartEye Pro 4.0 system, the semi-automatic calibration was to be performed at the initial stage of installation by holding a chessboard pattern in front of a camera. Unfortunately, this work can hardly be applied to a real vehicle environment. Liang et al. obtained the eye movement data of a driver by using a faceLab eye-tracking system and detected head movements by installing two cameras on the dashboard and at the edge of the steering wheel [35]. The eye movements thus obtained were used as the input of the support vector machine (SVM) model to observe the inattention of the driver. The SVM had a higher accuracy of identifying the driver’s inattention than that corresponding to logistic regression. However, the eye-tracking system was expensive, and each subject of the experiment was not allowed to wear glasses, nor eye makeup. The initial calibration for each driver demands as long as 5–15 min. Another research [36] derived the locations of a driver’s forward gaze from facial feature points by using two cameras. The cameras were installed in the A-piller and near the rear-view mirror, respectively, to follow the movements of the driver’s head. The facial feature points were collected from the obtained image and were used for 3D face modeling. A random forest classifier was used to determine the region at which the driver was gazing. However, the use of a visible light camera instead of infrared illumination increased the effect of external lighting conditions. In addition, although the accuracy of determining the region gazed by the driver was high, since there were only eight regions of forward gaze, many regions were excluded during accuracy measurement. Since the gaze tracking was based on head and not pupil movements, if the eyes alone moved without head movement, the gaze-tracking accuracy deteriorated.
Another research detected skin and non-skin regions in an input image by using skin colors learned in advance [37,38]. In the image under detection, the eye region was classified as a non-skin region. Since there were two non-skin regions, any region detected above the lip region was judged as the eye region. Within the eye region thus classified, a small window was set and a search was conducted to determine the darkest pixel region as the pupil. The optical flow algorithm of [39] was used to detect the eyes. Finally, under the assumption that the gazes of two eyes are parallel to each other, a driver’s gaze was estimated by modeling head movements based on the positions of both eyes, the points on the back of the head, which are directly opposite to each eye, and the central point on the back of the head. In this research, there was no need for measuring the distance from the head of a driver to the camera, but only the direction of gaze could be detected. Accordingly, when the head and eyes of a driver turned in opposite directions, or only the eyes moved without the head being moved, the accuracy of gaze tracking decreased. Besides, since the central position of the iris, and not the pupil, was detected, the improvement in gaze tracking was limited. The existing research [40] used the supervised descent method (SDM) tracker to extract the feature points of the eye contour, and constructed a triangular region including pupils by utilizing the feature points. After that, the center coordinates inside the triangle including pupils were calculated, and the coordinates were applied to the corresponding eye contour points in a 3D eyeball model to calculate the 3D location of a pupil. The line connecting the calculated 3D location of a pupil and the center of the eyeball was deemed a gaze direction. Since this method adopted a 3D geometric theory to model an eyeball, it did not need a certain calibration stage, and was not much affected by the change in the camera position, which are advantages. On the other hand, a wide rotation of the driver’s head and thick glasses decrease the performance and result in larger computation than in other methods. Moreover, as the central position of the iris, and not the pupil, was detected in the driver image obtained in the daytime, where an NIR illuminator was not used, the improvement in gaze-tracking accuracy was limited. Some studies used Purkinje images [41] or estimated the positions of a driver’s gaze by detecting facial feature points [42]. Illumination generally creates four reflections in the exterior and interior parts of a cornea and a lens. The method using Purkinje images focused on the reflections in the exterior part of the cornea (the first Purkinje image) and in the interior part of the lens (the forth Purkinje image) to detect gaze [41]. However, the research did not measure the quantitative accuracy of the images obtained in a real vehicle environment. Another existing research detected iris by using facial features, and conducted the binarization of the detected iris to estimate the gaze region. However, the iris was detected in only 61.6% of the experimental images, which indicated a relatively low accuracy. Besides, as the central point of the iris, and not the pupil, was detected, the improvement in gaze-tracking accuracy was limited.
All the aforementioned gaze-tracking studies, which were conducted in vehicle environments, could not solve the problems of inaccurate pupil or corneal SR detection, which were generated when a driver turned his head excessively to look at various spots in a vehicle. In addition, since a driver’s image including the eyes needs to be captured over a wide range to cover the rotation of his head in a vehicle environment, the eye region of this image is represented in lower resolution than in the face image taken in the same resolution in an indoor environment. Thus, it is still difficult to detect the pupil and corneal SR accurately. With these problems and limitations of existing studies in mind, we propose a gaze-tracking method that uses the fuzzy-system-based PCCR detection considering a driver’s head poses. Table 1 shows the comparison between previous studies and the proposed method on gaze tracking.
Table 1.
Comparison between previous studies and the proposed method on gaze tracking.
3. Materials and Methods
3.1. Overview of the Proposed Method
Figure 1 shows the overall flowchart of our fuzzy-system-based pupil and corneal reflection detection and gaze-tracking system, and we show only the rough procedure of proposed method in this Section. The detail explanations of each step of Figure 1 are included with models and equations in the following Sections.
Figure 1.
Flowchart of the proposed method.
As shown in Figure 2, a single NIR camera, which included six 850-nm NIR LEDs, was installed in front of the dashboard and captured the driver’s image. Since the 850-nm light causes little glare, it does not hinder driving. Since the NIR illumination with a shorter wavelength causes glare and blurs the boundary between the pupil and iris, we did not use it. The NIR illumination with a longer wavelength is almost invisible to its user, which is an advantage. However, the sensitivity of the camera sensor decreases and the input image becomes darker, which makes pupil detection difficult. Thus, we did not use this one as well. For the NIR camera, we removed the NIR cutting filter inside the typical universal serial bus (USB) camera [44] and added an NIR band pass filter [45].
Figure 2.
Experimental setup in a vehicle environment.
When a driver image taken by the camera was input, the driver’s facial feature points were extracted by using the dlib facial feature point tracking method [46,47] (step (2) of Figure 1, and see the details in Section 3.2). Next, two features were used as an input to the fuzzy system based on the distance ratio between feature points (step (3) of Figure 1, and see the details in Section 3.3.1). The status of head rotation (front, left side, right side) was determined according to the results of the fuzzy system (step (4) of Figure 1, and see the details in Section 3.3.2 and Section 3.3.3). Based on the status of head rotation, we determined whether the ROI for detecting eye information was both eyes or either eye (step (5) of Figure 1, and see the details in Section 3.4). Then, we calculated the focus value, which indicates the degree of image blur, to exclude seriously blurred images, which may decrease detection accuracy and make accurate gaze calculation difficult, from the eye detection information. If an image is so blurred that feature detection is impossible, the image needs to be excluded from pupil and corneal reflection detection, and another input image should be acquired (step (7) of Figure 1, and see the details in Section 3.4). When a focus value was above a certain level, we detected two centers of pupil and corneal SR and calculated the driver gaze position (steps (8) and (9) of Figure 1, and see the details in Section 3.4). In this study, we extracted gaze accuracy when a driver gazed at fifteen regions in a vehicle, as shown in Figure 3.
Figure 3.
Fifteen gaze regions in the vehicle.
3.2. Detection of Facial Feature Points
Conventional gaze tracking, which is conducted with a desktop monitor in an indoor environment, includes little rotation of a user’s head so that the eye region and feature can be easily detected in the user’s face. However, as the range of a driver’s forward gaze in a vehicle environment is over 180°, this implies wide head rotation and eye movement. Accordingly, a wide scope of the image needs to be taken to cover the range of a driver’s head movement, and the detection of the initial position of the face and eye regions affects the speed and accuracy of gaze tracking considerably. In this research, we detected a driver’s face in an input image and then extracted facial feature points from the image to detect the eye region. When facial feature points are extracted, they also include information on eye feature points, which makes the detection of the eye region efficient. We used the dlib facial feature point tracking method [46], which was based on the research in [47], to extract 68 feature points in a face image. In Figure 4 and Figure 5, the region of the extracted points from 37 to 42 corresponds to the left eye, and that of 43 to 48 is the right eye. The input image had a size of 1600 × 1200 pixels. The facial feature-point detection method was applied to an image reduced to 1/10 size by subsampling to ensure real-time detection.
Figure 4.
Positions of 68 facial feature points.
Figure 5.
Detected facial feature points in the input image.
However, as shown in Figure 6, in case a driver’s face turns excessively, the position of points detected by the dlib facial feature-point tracking method becomes erroneous. In this situation, the judgment on the status of face rotation (frontal, left side, right side) is erroneous. Besides, even if facial feature points are accurately detected, since the eye image in the excessive rotation direction does not show pupil or corneal SR satisfactorily, accurate detection is still difficult, and errors in gaze tracking are likely to increase. To solve this problem, we adopted the fuzzy inference system, which is explained in Section 3.3, and used a method of setting the eye ROI, which enabled robust identification of the rotation status and accurate detection of pupil and corneal SR, even after an error in facial feature points occurred.
Figure 6.
Errors of detected facial feature points.
3.3. Determination of the Head Rotation Status Based on the Output of the Fuzzy System
3.3.1. Calculation of Two Features Considering the Symmetrical Characteristics of Face and Facial Feature Points for the Inputs to the Fuzzy System
In general, human face in the captured image is symmetrical based on the vertical line on nose when he or she gazes at frontal position. However, his or her head is rotated in order to gaze at left or right position, his or her face in the captured image is not symmetrical. In this research, considering the symmetrical characteristics of face and facial feature points, we used two features (1 and 2) as inputs to the fuzzy inference system. Feature 1 is the distance ratio of right cheek boundary to the center of two nostrils over left cheek boundary to the center of two nostrils. To be specific, it is the ratio between the distance () from the x coordinate of feature point 34 to the x coordinate of feature point 2 on the left cheek and the distance () from the x coordinate of feature point 34 to the x coordinate of feature point 16 on the right cheek. Feature 1 is defined as in Equation (2) below.
Feature 2 is the distance ratio of right eye (lower) boundary to nose tip over left eye (lower) boundary to nose tip. It is the ratio between the distance () from the x coordinate of the nose tip feature point 31 to the x coordinate of the left eye feature point 41 and the distance () from the x coordinate of the nose tip feature point 31 to the x coordinate of the right eye feature point 48. Feature 2 is defined as in Equation (4) below.
Like the center point between nostrils (feature point 34), the nose tip (feature point 31) also moves along with head rotation. However, since the input image reflects the movement of the nose tip more than the center point between the nostrils during head rotation, the status of head rotation depends more on feature 2. This is because the nose tip is closer to a camera than the center point between the nostrils. In addition, the jawline often makes the distinction between the face and neck difficult, which also makes the accurate detection of feature points in this region more difficult. On the other hand, the feature points of the eyes are accurately detected with high reliability.
Based on the symmetrical characteristics of face and facial feature points, and are similar to 1 in case that there is no head rotation (frontal direction). We did not consider the position of the pupil for calculating feature 2 because pupils can rotate without head rotation, and this does not reflect an accurate status of head rotation. The eye tails (feature points 37, 40, 43, and 46) were not used either. This is because those points are not well observed when a face turns excessively, which could cause an error in detecting feature points. Using these two features as the inputs to fuzzy system, our system determines the status of driver’s head rotation (frontal, left, or right direction).
3.3.2. Design of Fuzzy Membership Function and Rule Table
We divided the gaze region into the frontal, left, and right sides of the driver’s seat. To create an input membership function, we conducted feature normalization of data for each of five subjects and then presented a distribution. The performance evaluation in Section 4 utilized the data of fifteen additional subjects to ensure a fair experiment. For feature normalization, we did Min-Max normalization of the distribution of features 1 and 2, which had been obtained by gazing at the regions 1 (far left), 2 (frontal), and 5 (far right), and then illustrated the result in Figure 7. The reason for the selection of feature distributions for the regions 1, 2, and 5 is that the distributions of the far left region 1 with the smallest feature value, region 2 facing the driver’s seat, and the far right region 5 with the largest feature enabled the Min-Max normalization and showed the direction of the frontal region, which was the reference region. Each feature had the smallest value by gazing at region 1, which was in the far left side, while it had the largest value by gazing at region 5, which was in the far right side. In the normalization, the smallest feature value obtained by gazing at region 1 was set to 0, and the largest feature value obtained by gazing at region 5 was set to 1, as shown in Figure 7. The feature values of region 2 corresponded to the case where a driver looked forward. These values were set to middle values. As shown in Figure 7, when a driver gazed at the left and frontal regions, the feature values showed more overlap than in other cases. It is because the vehicle used for the experiment had its driver’s seat on the left side, and the location difference between the frontal region (2) and the left side region (1) was smaller than the location difference between the frontal region (2) and the right side region (5). For this reason, the distributions of feature values obtained by gazing at the frontal region (2) and the left side region (1) were more overlapped.
Figure 7.
Distributions of two features for the fuzzy system.
That is, in Figure 7, L (low), M (medium), and H (high) present the distributions of feature values, which were obtained by gazing at the left side region (1 in Figure 3), the frontal region (2 in Figure 3), and the right side region (5 in Figure 3), respectively. We created an input membership function by using the distributions, as shown in Figure 8. The changed position of each membership function is determined based on the position of the data of left side (red color), frontal (green color), and right side (blue color) of Figure 7. The peak position of the M membership function was determined based on the geometric center in the distribution of feature values of the frontal region in Figure 7. In this research, we used a linear function in the form of an input membership function. Linear membership functions have been widely used in the fuzzy system because the algorithm is less complex with faster calculation compared to that with the nonlinear membership function [48,49,50]. For fair experiments, these distributions are obtained five drivers’ data, and the data of these people are not included for performance evaluation in Section 4.2.
Figure 8.
Fuzzy input membership function. (a) Feature 1; (b) Feature 2.
In addition, we used two output membership functions, which are L and H in Figure 9, and they are designed by the experience of developer. L corresponds to the excessive rotation of a subject’s head, while H indicates another case where a subject’s head rotation was moderate enough to facilitate the detection of eye features (pupil center and corneal SR) in both eyes. In the case of L, the eye features were detected only in either eye that was better captured by a camera based on features 1 and 2. Besides, as the excessive rotation of a driver’s face is less frequent than otherwise in a normal driving condition (a driver looks forward in most cases), we designed the H function to be slightly larger than the L function in Figure 9.
Figure 9.
Fuzzy output membership function.
Table 2 below presents the fuzzy rule used in this research. As mentioned above, when the output of the fuzzy system is Low (L), it means that the rotation of a subject’s head is excessive and thus the eye features (pupil center and corneal SR) are detected only in a single eye, which is closer to the camera. On the other hand, High (H) indicates non-excessive head rotation that enabled the detection of features in both eyes. In addition, as we stated above, the L (low), M (medium), and H (high) of features 1 and 2 in Figure 7 show the distributions of feature values, which were obtained from a driver’s gaze at the left side region (Region 1 in Figure 3), the frontal region (Region 2 in Figure 3), and the right side region (Region 5 in Figure 3), respectively. Based on this and the experience of developer, we defined the rule table below.
Table 2.
Fuzzy rule table.
3.3.3. Acquisition of the Output of the Fuzzy System by Defuzzification
In previous researches, various fuzzy modeling approaches were adopted [51,52,53,54]. In [51], they showed the method for the design of generic two-degree-of-freedom (2-DOF), linear and fuzzy, controllers dedicated to a class of integral processes specific to servo systems. In addition, they presented four 2-DOF linear proportional integral (PI) controller structures that are designed by the extended symmetrical optimum method to ensure the desired overshoot and settling time. In [52], continuing the study of the multi-adjoint concept lattices, authors presented that the common information to the two sided concept lattices generated from the two possible residual implications associated to a non-commutative conjunctor, could be seen as a sublattice of the Cartesian product of both concept lattices. In addition, they presented a working example which showed the flexibility and expressive power of the use of t-concepts. In [53], authors presented a novel method for fuzzy medical image retrieval (FMIR) using vector quantization (VQ) with fuzzy signatures in conjunction with fuzzy S-trees. They also compared the proposed method with that using normalized compression distance (NCD) instead of fuzzy signatures and fuzzy S-tree. In [54], in order to make use of merits of fuzzy c-means (FCM) algorithm and artificial bee colony (ABC) algorithm, authors proposed a hybrid algorithm (IABCFCM) based on improved ABC and FCM algorithms. They showed that the IABCFCM algorithm helped the FCM clustering escape from local optima and provides better experimental results on the well known data sets. In [55], authors presented a novel system-augmentation method to the delay-dependent reliable piecewise-affine H∞ static output feedback (SOF) control for nonlinear systems with time-varying delay and sensor faults in the piecewise-Markovian-Lyapunov-functional-based framework. In [56], they also showed the robust and reliable H∞ SOF control for nonlinear systems with actuator faults in a descriptor system framework. Through simulation studies, the effectiveness of the proposed method is confirmed.
In previous researches [57,58], the analyses of reliability schemes of fuzzy system are presented. In [57], they addressed the problem of delay-dependent robust and reliable H∞ SOF control for uncertain discrete-time piecewise-affine (PWA) systems with time delay and actuator failure in a singular system setup. In [58], authors dealt with the problem of reliable and robust H∞ SOF controller synthesis for continuous-time nonlinear stochastic systems with actuator faults. In addition, they showed the effectiveness and advantages of the proposed method by simulation examples.
In case a fuzzy system uses two inputs, the IF-THEN rule is normally applied [59], and the output is acquired by AND operation or operation depending on the relationship between the input and output. The fuzzy system proposed in this research considered both feature 1 and feature 2 simultaneously to determine the output, and accordingly, the AND operation was incorporated into the IF-THEN rules. As feature 1 (f1) and feature 2 (f2), which we use in this research, can have “Low”, “Medium”, or “High”, as shown in Table 2, (Gf1L(f1), Gf1M(f1), Gf1H(f1)) and (Gf2L(f2), Gf2M(f2), Gf2H(f2)) can be obtained by the input membership functions (Gf1L(·), Gf1M(·), Gf1H(·), Gf2L(·), Gf2M(·), and Gf2H(·)) in Figure 10a,b. Nine pairs of combinations are obtained from the result as follows: (Gf1L(f1), Gf2L(f2)), (Gf1L(f1), Gf2M(f2)), (Gf1L(f1), Gf2H(f2)), … (Gf1H(f1), Gf2H(f2)). From these nine pairs of combinations, nine inference values (IV) are derived through Max and Min rules [48] and the fuzzy rule of Table 2.
Figure 10.
Example of obtaining outputs by input membership functions. (a) Output values for feature 1; (b) Output values for feature 2.
For example, as in Figure 10a,b, if f1 = 0.4, f2 = 0.2, the output value obtained by the input membership function is (Gf1L(0.4) = 0.48, Gf1M(0.4) = 0.64, Gf1H(0.4) = 0.28), (Gf2L(0.2) = 0.26, Gf2M(0.2) = 0.65, Gf2H(0.2) = 0). As mentioned above, based on these six output values, nine combinations can be derived as follows: (0.48(L), 0.26(L)), (0.48(L), 0.65(M)), (0.48(L), 0(H)), … (0.28(H), 0(H)). In addition, each combination can have one value of IV according to the Min rule, Max rule, and the fuzzy rule table (Table 2). In the case of (0.48(L), 0.26(L)), the application of Min rule and fuzzy rule of Table 2 (If “Low” and “Low”, then “Low”) results in 0.26 (Low) for IV. In case of (0.28(H), 0.26(L)), IV becomes 0.28(H) by applying the Max rule and fuzzy rule of Table 2 (If “High” and “Low”, then “High”). In this way, we acquired inference values for nine combinations. Table 3 presents the result.
Table 3.
Examples of IV, obtained by the Min and Max rules and fuzzy rule table of Table 2.
By applying various defuzzification methods and the output membership function that has IV values as inputs, we can acquire the final output value of the fuzzy system, as shown in Figure 11.
Figure 11.
Examples of getting the output value of the fuzzy system through various defuzzification methods: (a) first of maxima (FOM), last of maxima (LOM), middle of Maxima (MOM) and (b) bisector of area (BOA), center of gravity (COG).
In fact, there are many types of defuzzification methods [60,61,62], and among them, first of maxima (FOM), middle of Maxima (MOM), last of maxima (LOM), center of gravity (COG), and bisector of area (BOA) are frequently applied. FOM, MOM, and LOM determine a fuzzy output value by calculating the maximum inference value in the output membership function. FOM selects the minimum output value among maxima as the fuzzy output value. MOM selects the medium between the maximum and minimum among maxima as the fuzzy output value. LOM takes the maximum output value among maxima as the fuzzy output value. BOA is the method of calculating the fuzzy output value through half of the area of the region defined by every inference value. COG acquires the center of gravity for the region defined by every inference value to calculate the fuzzy output value. If we see the final output values obtained by each method for any input value in Figure 11a, when the maxima IV are assumed to be 0.65(L) and 0.65(H), FOM, LOM, and MOM determine O1, O2, and (O1 + O2)/2, respectively, as output values. In Figure 11b, when every IV obtained by the process of Table 3 is assumed to be 0.65(H) and 0.28(L), COG and BOA determine O3 and O4, respectively, as output values.
If the obtained output value of the fuzzy system is over the threshold, the H operation (detection of the pupil center and corneal SR in both eyes) is conducted. On the other hand, if the obtained output value is below the threshold, the L operation (detection of the pupil center and corneal SR only in either eye that is closer to a camera) is conducted.
3.4. Detection of the Two Centers of the Pupil and Corneal SR, and Calculating Gaze Position
As in Section 3.3.3, if an eye ROI is set by a fuzzy system, then, we calculated the focus value, which indicates the degree of image blur, to exclude seriously blurred images, which may decrease detection accuracy and make accurate gaze calculation difficult, from the eye detection information. For calculating focus value, 5 × 5 mask is convolved in the eye ROI, and the focus value is obtained based on the summation of magnitude by the mask [63]. If an image is so blurred that feature detection is impossible, the image needs to be excluded from pupil and corneal reflection detection, and another input image should be acquired (step (7) of Figure 1). When a focus value was above a certain level, we detected two centers of pupil and corneal SR and calculated the driver gaze position (steps (8) and (9) of Figure 1).
With the focused image, pupil detection needs to be conducted in an eye ROI image of 140 × 140 pixels with the center of feature points of the eye in Figure 4 taken as a reference. Figure 12 shows the pupil detection flowchart used in this research. After an ROI image is processed by histogram stretching, image binarization is performed (step (2) of Figure 12 and Figure 13c). Even after the binarization is carried out, parts other than the pupil may be included according to the threshold. Such parts are removed by morphological processing. Then, component labeling and size filtering are conducted to remove noise regions (step (3) of Figure 12 and Figure 13d). As the next step, based on the boundary found by canny edge detection, a convex hull algorithm is implemented to find the convex outermost boundary line (step (5) and Figure 13f). Depending on the relative position of a pupil with respect to the NIR illuminator of Figure 2, corneal SR is generally located at various points in an input image. When such an SR exists on the pupil boundary, pupil boundary distortion is caused and an error in boundary detection occurs. In this research, we attempted to solve this problem by subtracting the outermost boundary (Figure 13f) found by convex hull and the binarization image (Figure 13g) for detecting corneal reflection (step (7) of Figure 12 and Figure 13h). Besides, as a pupil is mostly elliptical, ellipse fitting is performed to obtain the boundary, center position, and size information of a more realistic pupil (step (8) of Figure 12 and Figure 13i).
Figure 12.
Flowchart of the proposed pupil center detection method.
Figure 13.
Steps for pupil center detection: (a) Eye region of interest (ROI); (b) histogram stretching; (c) binarization for pupil detection; (d) morphological processing and size filtering; (e) canny edge detection; (f) convex hull; (g) binarization for corneal specular reflection (SR) detection; (h) subtraction of (g) from (f) for boundary distortion correction; (i) ellipse fitting; and (j) pupil center detection.
Since every frame of the consecutive images captured in real time does not change the size of the pupil much, if the size of the ellipse, which is made of the boundary obtained by the above process, in other words, the size of the pupil is larger or smaller than the average elliptical size of the previous five frames by a certain value (T), the error of pupil fitting is attributed to the threshold for pupil detection in step (2), and thus, this threshold is modified and the steps (1)–(8) of Figure 12 are repeated. In other words, in case the size of a detected ellipse is larger than the average size of the previous five frames, the threshold is lowered to detect a pupil again. On the other hand, if the size of the detected ellipse is smaller, the threshold is increased to try the detection of a pupil again. When the detected ellipse has a size similar to the average size of the previous five frames, it is concluded that the pupil detection has been done correctly, and the center of the ellipse is designated as the pupil center (step (12) of Figure 12 and Figure 13j).
Figure 14 shows the flowchart of corneal SR detection that is performed in the eye ROI after a pupil center has been obtained. Since corneal SR usually has a higher level of brightness than other regions, image binarization is conducted to distinguish between corneal SR and the other part, which is step (1). However, depending on the distance between the driver and a camera, the ROI may include skin around the eyes, or if the driver’s skin looks bright due to an external illuminator, the upper and lower skin of the eyelid may be detected as corneal SR. Besides, in case the driver wears glasses, the glass lens can generate a large reflection depending on the curvature of the lens, and head rotation makes a small reflection in a lachrymal gland or eyelid. Therefore, to detect corneal SR accurately, the noise region is removed by component labeling and size filtering (step (2) of Figure 14). Since corneal SR is usually located near the pupil, any candidate that is closest to the pupil center is ultimately detected as corneal SR (step (4) of Figure 14).
Figure 14.
Flowchart of corneal SR detection.
Unlike the monitor with pixel coordinates on it, no pixel coordinate for the gazed object could be acquired in a vehicle and user calibration was not possible in advance. Therefore, this research measured the gaze accuracy as follows. As mentioned in Section 3.3.2, another five users other than the fifteen subjects for whom database for performance evaluation was constructed, were asked to gaze at the fifteen gaze regions of Figure 3 once in numerical order. Meanwhile, we obtained the average PCCR vector of each region and set it as the reference point of the gaze position for each region. In addition, we determined the region, which had the shortest Euclidean distance from the PCCR vector obtained from the data of 15 subjects for performance evaluation, as the final gaze region (see the details in Section 4.2).
4. Results
4.1. Experimental Data and Environment
Since there was no open driver database obtained with the NIR illuminator or NIR camera in a real vehicle environment, we built our own database consisting of the images of fifteen subjects, of whom three persons wore glasses, to evaluate the performance of the proposed method. We captured images while each driver looked at the fifteen gaze regions three times, which are shown in Figure 3, in almost real-world driving conditions. Each participant was allowed to behave naturally while gazing at each region, as if he was driving on real roads. There was no restriction on posture or any separate instruction. If the participants had to look at the fifteen regions while driving a car in real traffic, a car accident would be very likely, and therefore, it would be difficult to let them gaze at the regions accurately. Thus, to conduct the experiment under conditions that were as close as possible to real driving conditions (including vehicle vibration and extraneous light), we obtained the images in an idling vehicle (model name of SM5 New Impression by Renault Samsung [64]) at various places (from daylight road to parking garage). We also attempted to identify the effect of various extraneous lights by acquiring experimental data at various times of the day (morning, afternoon, and night). A single laptop computer was dedicated for our data acquisition and every processing work. The specification of the computer was 2.80 GHz CPU (Intel® Core™ i5-4200H (Intel Corp., Santa Clara, CA, USA)) and 8 GB RAM. The gaze detection system in Figure 2, which had been developed for this research, included a camera and an illuminator, and each of these devices was connected to the laptop computer by a single USB line for power supply. As shown in Figure 2, the devices were installed right in front of the dashboard, but they did not obstruct the dashboard. In all, 20,654 images were obtained from the experiment. We opened our algorithm codes and the driver-gaze tracking DB, where each driver looks at fifteen regions in a real vehicle environment designed for the experiment, to other researchers who can freely request our database by sending email to authors. Thus, we expect that our system will be fairly evaluated by other researchers’ methods. We developed our algorithm by using Microsoft Visual Studio 2013 [65] and also used the C++ programming language, OpenCV (version 2.4.9 (Intel Corp., Santa Clara, CA, USA)) library [66], and Boost (version 1.55.0) library [67].
4.2. Performance Evaluation
In the first experiment, we measured the accuracy in determining the status of head rotation based on the output of the fuzzy system, which was explained in Section 3.3. To find the output of the fuzzy system, which was closest to the status of head rotation in the real image, we applied Min and Max rules to five defuzzification methods, and thus presented the output for all the images by ten methods. Then, the agreement between the output and the manually determined status of head rotation (left region, right region, frontal region) in the real images (ground-truth data) was defined as performance as shown in Equation (5), which is presented in Table 4 below.
where Nk and Mk are the image number of correctly determined status of head rotation and the total image number of status of head rotation, respectively. k of 0, 1, and 2 shows the status of head rotation of left region, frontal region, and right region, respectively.
Table 4.
Accuracy of determining the status of head rotation according to five defuzzification methods with Min and Max rules (units: %).
It turns out that the COG method with Min rule produced the highest accuracy of 98.4%. Accordingly, this research adopted the COG method with Min rule.
In addition, we compared the accuracies of determining the status of head rotation in case of using symmetrical shapes for input and output membership functions of Figure 8 and Figure 9. In the input membership functions of symmetrical shape, the intersection point between L and H function with the peak point of M exist at 0.5 of horizontal axis of Figure 8. In the output membership functions of symmetrical shape, the intersection point between L and H function exists at 0.5 of horizontal axis of Figure 9. By comparing the Table 4 and Table 5, the accuracies with our proposed membership functions are higher than those using symmetrical shapes for input and output membership functions. That is because our input membership functions are designed based on the feature distributions of Figure 7, and our output membership functions are designed based on the ground explained in Section 3.3.2.
As the next experiment, we evaluated the accuracy of detecting the pupil center and corneal SR center with the proposed method. Table 6 presents the error of the detected pupil center. The detection error was expressed by the Euclidean distance between the position directly displaying the pupil center ground truth in the experimental images and the pupil center detected by the method proposed in this paper as shown in Equation (6).
where (, ) and (, ) are the ground truth pupil center and the pupil center detected by our method in the ith image frame, respectively. P is the total number of experimental images.
Table 6.
Pupil detection error with the proposed and previous methods (unit: pixels).
The pupil center detection error for each of fifteen gaze regions was compared between the previous method [23] and the proposed method with or without the fuzzy system.
As seen in Table 6, there is a large difference of detection error between the two methods. The reason is as follows. The previous method was applied to the images of a subject’s face captured in a narrow range in an indoor environment where the head of the subject had little movement. The pupil detection error in such images was much different from that of the proposed method, which was applied to images captured in a wide range in a vehicle environment where a driver’s head rotates widely. In addition, as shown in Figure 12 (steps (9)–(11)), there is another difference between these two methods in considering the pupil size of the previous frame to determine a binarization threshold. Next, this research used the dlib facial feature point tracking method to find facial and eye feature points and to detect a pupil in eye feature points. This method produced lower detection error for the eye region than the previous method that designated the eye region based on corneal SR. This difference also affected performance. Table 6 shows that the right gaze zones (target zones 4, 5, 8, 11, and 14 in Figure 3), which hold large head rotation, indicate a significant difference in error between the proposed and previous methods. The frontal zone 2 also shows a large difference in error. This is because, as zone 1 that is next to zone 2 was classified as a left side zone, there was a variation in two input feature values used in the fuzzy system for the gazes at zones 1 and 2, respectively, which resulted in the output of either Low (detection in one eye) or High (detection in both eyes) in the fuzzy system. Consequently, the detection error increased.
In addition, as shown in Figure 15b and Figure 16, when the reflection of glasses is near the pupil region in an eye image, the accuracy of pupil or corneal SR detection deteriorates. As for the comprehensive performance, the pupil center detection error of the previous method was measured to be 7.88 pixels on average. When the proposed fuzzy system-based method detected the pupil center for both eyes in every image without judgment regarding suitable eye for the detection, the performance was measured to be 4.94 pixels on average. Finally, when the performance of the proposed fuzzy system-based method was measured by excluding one eye that belonged to a more erroneous direction for pupil center detection due to head rotation, the performance was measured to be 4.06 pixels, which indicated an improvement.
Figure 15.
Resulting image of pupil center detection with our method: (a) Correct detection images; (b) Incorrect detection images (ellipse represents the pupil boundary, and cross shows the center of the pupil).
Figure 16.
Examples of failure of detecting the pupil and corneal SR of left eye. The detected pupil boundary is shown by a red circle whereas the detected corneal SR is indicated by a green point. Image is respectively captured when a user looks at (a) the region 15, and (b) the region 2 of Figure 3.
As shown in Table 7, in the comparison of error for the gaze zones (1, 4, 5, 8, 11, 14), which mainly have the fuzzy system result of Low and hold wide head rotation, it turns out that the performance measurements with and without the fuzzy system were 2.81 pixels and 4.39 pixels, respectively, which indicates greater improvement in performance than in Table 6.
Table 7.
Pupil detection error with the proposed and previous methods in case of large head rotation (unit: pixels).
Figure 15 shows examples of pupil center detection using the proposed method. As shown in Figure 15a, the pupil center has been well detected irrespective of the gaze position and reflection from the glasses. Figure 15b shows the examples of incorrect detection. As the detection error of the dlib facial feature point tracking method, the incorrect pupil-center detection occurred when the eye ROI was incorrectly set; a large reflection in the glasses obstructed the pupil.
As the next step, we compared the error of corneal SR detection between the proposed and previous methods. As in Table 6 and Table 7, the detection error was expressed by the Euclidean distance between the ground truth position of the corneal SR center displayed manually in experimental images and the corneal SR center detected by the proposed method as shown in Equation (7).
where (, ) and (, ) are the ground truth center of corneal SR and the corneal SR center detected by our method in the ith image frame, respectively. P is the total number of experimental images. Observing the performance variation with the proposed method without the fuzzy system in each zone, the accuracy of corneal SR reflection is found to be improved compared to the previous method [23] even in the frontal zones. This is apparently because the aforementioned corneal SR detection algorithm was improved by modifying the threshold and binarization range to remove erroneous detection due to skin brightness during binarization in the ROI and by removing too small or too large candidates from the corneal SR when a reflection is formed in the eyelid, lachrymal gland, or glasses. The previous method showed an average error of 5.62 pixels, while the proposed method without fuzzy system had an average error of 3.12 pixels, and the proposed method with a fuzzy system showed 2.48 pixels on average, which indicates an improvement in performance as shown in Table 8.
Table 8.
Corneal SR detection error with the proposed and previous methods (unit: pixels).
In addition, we compared the error only for the gaze zones (1, 4, 5, 8, 11, 14), of which the result for the fuzzy system is usually Low, and which hold a wide range of head rotations; as shown in Table 9, when the fuzzy system was not used, the performance was measured to be 4.4 pixels, and when the fuzzy system was used, the measured performance was 3.6 pixels. This indicates a larger improvement in performance than in Table 8.
Table 9.
Corneal SR detection error with the proposed and previous methods in case of large head rotation (unit: pixels).
The examples of corneal SR detection using the proposed method are shown in Figure 17. The images of Figure 17a are examples of correctly detected corneal SR. Reflection in glasses and small reflections in the lachrymal gland have not been detected as corneal SR. Besides, even when a narrowed eye hid a part of the corneal SR, it was correctly detected. Figure 17b shows erroneous detection images. A large reflection in the sclera overlapped with the corneal SR, or there existed other incorrect SR by glasses surface, or eyelid hided the part of corneal SR.
Figure 17.
Resulting images of the corneal SR detection with our method: (a) Correct detection images; (b) Incorrect detection images. Cross shows the center of the corneal SR.
As the final goal of this research was to detect pupil and corneal reflections accurately, which was to improve gaze accuracy in driver-gaze tracking, the next experiment compared gaze-tracking accuracy for the fifteen regions in Figure 3. Unlike the monitor with pixel coordinates on it, no pixel coordinate for the gazed object could be acquired in a vehicle and user calibration was not possible in advance. Therefore, this research measured the gaze accuracy as follows. As mentioned in Section 3.3.2, another five users other than the fifteen subjects for whom database for performance evaluation was constructed, were asked to gaze at the fifteen gaze regions of Figure 3 once in numerical order. Meanwhile, we obtained the average PCCR vector of each region and set it as the reference point of the gaze position for each region. In addition, we determined the region, which had the shortest Euclidean distance from the PCCR vector obtained from the data of fifteen subjects for performance evaluation, as the final gaze region. Table 10 below presents the ratios between the calculated gaze region through the Euclidean distance and the image agreeing with the real gaze region. The accuracy was measured by the strictly correct estimation rate (SCER) and the loosely correct estimation rate (LCER). SCER is the agreement between the ground-truth gaze region and the gaze region judged in the input image as shown in Equation (8). LCER is the agreement between the region covering the ground-truth gaze region and its neighboring region and the gaze region judged in the input image as shown in Equation (9).
where S and T are the image number of correct gaze detection and the total number of experimental images, respectively.
where S′ and T are the image number of correct gaze detection considering the neighboring regions and the total number of experimental images, respectively. For example, the neighboring regions of target zone 6 are 7, 9, and 10 as shown in Figure 3 and Table 10. Therefore, if the calculated gaze position by our method belongs to zone 7 although driver actually gazes at zone 6, this is counted as correct gaze detection in case of LCER whereas this is not counted as correct gaze detection in case of SCER.
Table 10.
Strictly correct estimation rate (SCER) and loosely correct estimation rate (LCER) with the proposed and previous methods (unit: %).
In comparison with the previous method, there was an improvement in the gaze-tracking accuracy. Besides, using the fuzzy system resulted in an improvement in accuracy compared to that without it. As shown in Table 11, in the comparison of the accuracy of the gaze regions (1, 4, 5, 8, 11, and 14) where the fuzzy system result was mostly Low and the head rotation occurred in a wide range, we can see that the use of the fuzzy system caused a larger improvement in the gaze-tracking accuracy than otherwise.
Table 11.
SCER and LCER with the proposed and previous methods in case of large head rotations (unit: %).
Again, we compared the gaze-tracking accuracy between another previous method [68] and the proposed method. This previous method adopted Alexnet [69] among the convolutional neural networks (CNN) for tracking the gaze position. As shown in Table 12, the proposed method produced a higher accuracy in gaze tracking than in the previous method [68].
Table 12.
SCER and LCER with the proposed and previous methods (unit: %).
Our next comparison was made between the proposed method and the Tobii system [14]. Since the Tobii system did not allow the user calibration information to be stored beforehand in an indoor desktop monitor environment and to be used later in a vehicle environment, we installed the Tobii system at the same point of Figure 2, where our gaze-tracking system had been installed in the vehicle used for the experiment. Then, we conducted the user calibration of the Tobii system for four available points (near 2, 3, 9, and 10 in Figure 3), and measured the SCER accuracy for fifteen regions of Figure 3. Since the Tobii system could not obtain the user calibration data when a subject’s face and eyes turned excessively for user calibration, the calibration was conducted only for the four available points in the vehicle. In particular, since the system was originally designed for a desktop monitor with a small screen, the experiment in a vehicle with a wide gaze range did not produce any gaze detection result for the regions 1, 4, 5, 6, 7, 8, 11, 14, and 15 of Figure 3. The average SCER with the Tobii system in Table 13 excludes such failures of gaze detection. That is, for fair comparison, we show the SCERs by our method and Tobii system in Table 13 on same gaze zones excluding the points 1, 4, 5, 6, 7, 8, 11, 14, and 15 in Figure 3. From Table 13, it turns out that the gaze-tracking performance of the proposed method is better than that of the Tobii system.
Table 13.
Comparison of SCERs obtained with the proposed method and with the Tobii system (unit: %).
Finally, we measured the processing time of the proposed method. The total processing time of each image was about 27 ms, and the speed was approximately 37 (1000/27) frames per second, which indicated the possibility of real-time operation and the low computational complexity of our method.
5. Discussion and Conclusions
In this research, we have proposed a new fuzzy-system-based pupil and corneal SR detection method for the accurate tracking of a driver’s gaze in a vehicle environment. Unlike indoor environments, the vehicle environment is greatly affected by extraneous light. Accordingly, we used a robust camera equipped with NIR LEDs and NIR BPF. To accurately detect pupil and corneal SR for a driver’s gaze tracking in a vehicle environment, the nose tip and the center between the nostrils were taken as a reference point, and the ratios between the facial feature points with each reference point were used as two input to a fuzzy system. The status of head rotation was measured based on the output of fuzzy system. When the head rotation was excessive, since the eye region belonging to the direction of rotation was very likely to cause an erroneous detection, we did not try to detect the eye features (pupil and corneal reflection) in the region, which could reduce the detection errors of eye features and consequent gaze detection error. By performing the experiment with fifteen regions at which a driver usually gazes in actual vehicle environments, we could confirm that the proposed method had higher accuracy than the previous methods and commercialized gaze-tracking systems. These are the advantages of our method.
However, in case that large SR on glasses surface (hiding pupil and corneal SR) occurs with driver wearing glasses, the centers of pupil and corneal SR could not be detected although our fuzzy system correctly determined the status of head rotation. This is the main disadvantage and limitation of our system.
To solve these, we would consider designing the gaze tracking device including dual NIR illuminators which are at the opposite positions based on camera. With this device, if one illuminator makes the large SR on glasses surface, then our system automatically turns off the illuminator and on the other illuminator to capture the eye image where large SR on glasses surface does not exist. In addition, we will evaluate the performance of the proposed method in various driving conditions, and also conduct a research to improve the performance by using stereo cameras.
Acknowledgments
This research was supported by the Basic Science Research Program through the National Research Foundation of Korea (NRF) funded by the Ministry of Education (NRF-2015R1D1A1A01056761), by the Basic Science Research Program through the National Research Foundation of Korea (NRF) funded by the Ministry of Education (NRF-2017R1D1A1B03028417), and by the National Research Foundation of Korea (NRF) grant funded by the Korea government (MSIP; Ministry of Science, ICT & Future Planning) (NRF-2017R1C1B5074062).
Author Contributions
Dong Eun Lee and Kang Ryoung Park designed the proposed system, and wrote paper. Hyo Sik Yoon and Hyung Gil Hong helped to implement the algorithm of facial feature detection and experiments.
Conflicts of Interest
The authors declare no conflict of interest.
References
- Singh, S. Critical Reasons for Crashes Investigated in the National Motor Vehicle Crash Causation Survey; Traffic Safety Facts Crash Stats. Report No. DOT HS 812 115; National Highway Traffic Safety Administration: Washington, DC, USA, February 2015.
- Li, Z.; Li, S.E.; Li, R.; Cheng, B.; Shi, J. Online detection of driver fatigue using steering wheel angles for real driving conditions. Sensors 2017, 17, 495. [Google Scholar] [CrossRef] [Scilit] [PubMed]
- Diddi, V.K.; Jamge, S.B. Head pose and eye state monitoring (HEM) for driver drowsiness detection: Overview. Int. J. Innov. Sci. Eng. Technol. 2014, 1, 504–508. [Google Scholar]
- Schneider, E.; Dera, T.; Bartl, K.; Boening, G.; Bardins, S.; Brandt, T. Eye movement driven head-mounted camera: It looks where the eyes look. In Proceedings of the IEEE International Conference on Systems, Man and Cybernetics, Waikoloa, HI, USA, 10–12 October 2005; pp. 2437–2442. [Google Scholar]
- Ji, Q.; Zhu, Z.; Lan, P. Real-time nonintrusive monitoring and prediction of driver fatigue. IEEE Trans. Veh. Technol. 2004, 53, 1052–1068. [Google Scholar] [CrossRef] [Scilit]
- Hansen, D.W.; Ji, Q. In the eye of the beholder: A survey of models for eyes and gaze. IEEE Trans. Pattern Anal. Mach. Intell. 2010, 32, 478–500. [Google Scholar] [CrossRef] [Scilit] [PubMed]
- Guestrin, E.D.; Eizenman, M. General theory of remote gaze estimation using the pupil center and corneal reflections. IEEE Trans. Biomed. Eng. 2006, 53, 1124–1133. [Google Scholar] [CrossRef] [Scilit] [PubMed]
- Noureddin, B.; Lawrence, P.D.; Man, C.F. A non-contact device for tracking gaze in a human computer interface. Comput. Vis. Image Underst. 2005, 98, 52–82. [Google Scholar] [CrossRef] [Scilit]
- Morimoto, C.H.; Koons, D.; Amir, A.; Flickner, M.; Zhai, S. Keeping an eye for HCI. In Proceedings of the 12th Brazilian Symposium on Computer Graphics and Image Processing, Campinas, Brazil, 17–20 October 1999; pp. 171–176. [Google Scholar]
- Yoo, D.H.; Chung, M.J. A novel non-intrusive eye gaze estimation using cross-ratio under large head motion. Comput. Vis. Image Underst. 2005, 98, 25–51. [Google Scholar] [CrossRef] [Scilit]
- Cho, C.W.; Lee, H.C.; Gwon, S.Y.; Lee, J.M.; Jung, D.; Park, K.R.; Kim, H.-C.; Cha, J. Binocular gaze detection method using a fuzzy algorithm based on quality measurements. Opt. Eng. 2014, 53, 053111-1–053111-22. [Google Scholar] [CrossRef] [Scilit]
- Morimoto, C.H.; Mimica, M.R.M. Eye gaze tracking techniques for interactive applications. Comput. Vis. Image Underst. 2005, 98, 4–24. [Google Scholar] [CrossRef] [Scilit]
- Shih, S.-W.; Liu, J. A novel approach to 3-D gaze tracking using stereo cameras. IEEE Trans. Syst. Man Cybern. Part B 2004, 34, 234–245. [Google Scholar] [CrossRef] [Scilit]
- Tobii. Available online: http://www.tobii.com (accessed on 7 March 2017).
- SMI. Available online: http://www.smivision.com/ (accessed on 7 March 2017).
- Zhu, Z.; Ji, Q. Novel eye gaze tracking techniques under natural head movement. IEEE Trans. Biomed. Eng. 2007, 54, 2246–2260. [Google Scholar] [PubMed]
- Ohno, T.; Mukawa, N. A free-head, simple calibration, gaze tracking system that enables gaze-based interaction. In Proceedings of the Symposium on Eye Tracking Research & Applications, San Antonio, TX, USA, 22–24 March 2004; pp. 115–122. [Google Scholar]
- Talmi, K.; Liu, J. Eye and gaze tracking for visually controlled interactive stereoscopic displays. Signal Process. Image Commun. 1999, 14, 799–810. [Google Scholar] [CrossRef] [Scilit]
- Cho, D.-C.; Kim, W.-Y. Long-range gaze tracking system for large movements. IEEE Trans. Biomed. Eng. 2013, 60, 3432–3440. [Google Scholar] [CrossRef] [Scilit] [PubMed]
- Huang, Y.; Wang, Z.; Tu, X. A real-time compensation strategy for non-contact gaze tracking under natural head movement. Chin. J. Electron. 2010, 19, 446–450. [Google Scholar]
- Lee, J.M.; Lee, H.C.; Gwon, S.Y.; Jung, D.; Pan, W.; Cho, C.W.; Park, K.R.; Kim, H.-C.; Cha, J. A new gaze estimation method considering external light. Sensors 2015, 15, 5935–5981. [Google Scholar] [CrossRef] [Scilit] [PubMed]
- Lee, H.C.; Luong, D.T.; Cho, C.W.; Lee, E.C.; Park, K.R. Gaze tracking system at a distance for controlling IPTV. IEEE Trans. Consum. Electron. 2010, 56, 2577–2583. [Google Scholar] [CrossRef] [Scilit]
- Jung, D.; Lee, J.M.; Gwon, S.Y.; Pan, W.; Lee, H.C.; Park, K.R.; Kim, H.-C. Compensation method of natural head movement for gaze tracking system using an ultrasonic sensor for distance measurement. Sensors 2016, 16, 110. [Google Scholar] [CrossRef] [Scilit] [PubMed]
- Villanueva, A.; Cabeza, R.; Porta, S. Eye tracking: Pupil orientation geometrical modeling. Image Vis. Comput. 2006, 24, 663–679. [Google Scholar] [CrossRef] [Scilit]
- Baluja, S.; Pomerleau, D. Non-intrusive gaze tracking using artificial neural networks. Adv. Neural Inf. Process. Syst. 1993, 6, 753–760. [Google Scholar]
- Williams, O.; Blake, A.; Cipolla, R. Sparse and semi-supervised visual mapping with the S3GP. In Proceedings of the IEEE Computer Society Conference on Computer Vision and Pattern Recognition, New York, NY, USA, 17–22 June 2006; pp. 230–237. [Google Scholar]
- Xu, L.-Q.; Machin, D.; Sheppard, P. A novel approach to real- time non-intrusive gaze finding. In Proceedings of the British Machine Vision Conference, Southampton, UK, 14–17 September 1998; pp. 428–437. [Google Scholar]
- Morimoto, C.H.; Koons, D.; Amir, A.; Flickner, M. Pupil detection and tracking using multiple light sources. Image Vis. Comput. 2000, 18, 331–335. [Google Scholar] [CrossRef] [Scilit]
- Bozomitu, R.G.; Păsărică, A.; Cehan, V.; Rotariu, C.; Barabasa, C. Pupil centre coordinates detection using the circular Hough transform technique. In Proceedings of the 38th IEEE International Spring Seminar on Electronics Technology, Eger, Hungary, 6–10 May 2015; pp. 462–465. [Google Scholar]
- Leimberg, D.; Vester-Christensen, M.; Ersbøll, B.K.; Hansen, L.K. Heuristics for speeding up gaze estimation. In Proceedings of the Svenska Symposium i Bildanalys, Malmø, Sweden, 10–11 March 2005; pp. 1–4. [Google Scholar]
- Hansen, D.W.; Pece, A.E.C. Iris tracking with feature free contours. In Proceedings of the IEEE International Workshop on Analysis and Modeling of Faces and Gestures, Nice, France, 17 October 2003; pp. 208–214. [Google Scholar]
- Zhu, D.; Moore, S.T.; Raphan, T. Robust pupil center detection using a curvature algorithm. Comput. Methods Programs Biomed. 1999, 59, 145–157. [Google Scholar] [CrossRef] [Scilit]
- Fitzgibbon, A.; Pilu, M.; Fisher, R.B. Direct least square fitting of ellipses. IEEE Trans. Pattern Anal. Mach. Intell. 1999, 21, 476–480. [Google Scholar] [CrossRef] [Scilit]
- Ahlstrom, C.; Kircher, K.; Kircher, A. A gaze-based driver distraction warning system and its effect on visual behavior. IEEE Trans. Intell. Transp. Syst. 2013, 14, 965–973. [Google Scholar] [CrossRef] [Scilit]
- Liang, Y.; Reyes, M.L.; Lee, J.D. Real-time detection of driver cognitive distraction using support vector machines. IEEE Trans. Intell. Transp. Syst. 2007, 8, 340–350. [Google Scholar] [CrossRef] [Scilit]
- Tawari, A.; Trivedi, M.M. Robust and continuous estimation of driver gaze zone by dynamic analysis of multiple face videos. In Proceedings of the IEEE Intelligent Vehicles Symposium, Dearborn, MI, USA, 8–11 June 2014; pp. 344–349. [Google Scholar]
- Smith, P.; Shah, M.; da Vitoria Lobo, N. Determining driver visual attention with one camera. IEEE Trans. Intell. Transp. Syst. 2003, 4, 205–218. [Google Scholar] [CrossRef] [Scilit]
- Smith, P.; Shah, M.; da Vitoria Lobo, N. Monitoring head/eye motion for driver alertness with one camera. In Proceedings of the International Conference on Pattern Recognition, Barcelona, Spain, 3–7 September 2000; pp. 636–642. [Google Scholar]
- Bergen, J.R.; Anandan, P.; Hanna, K.J.; Hingorani, R. Hierarchical model-based motion estimation. In Proceedings of the European Conference on Computer Vision, Santa Margherita Ligure, Italy, 19–22 May 1992; pp. 237–252. [Google Scholar]
- Vicente, F.; Huang, Z.; Xiong, X.; De la Torre, F.; Zhang, W.; Levi, D. Driver gaze tracking and eyes off the road detection system. IEEE Trans. Intell. Transp. Syst. 2015, 16, 2014–2027. [Google Scholar] [CrossRef] [Scilit]
- Batista, J.P. A real-time driver visual attention monitoring system. In Proceedings of the 2nd Iberian Conference on Pattern Recognition and Image Analysis, Estoril, Portugal, 7–9 June 2005; pp. 200–208. [Google Scholar]
- Fridman, L.; Lee, J.; Reimer, B.; Victor, T. “Owl” and “Lizard”: Patterns of head pose and eye pose in driver gaze classification. IET Comput. Vis. 2016, 10, 308–313. [Google Scholar] [CrossRef] [Scilit]
- Sigut, J.; Sidha, S.-A. Iris center corneal reflection method for gaze tracking using visible light. IEEE Trans. Biomed. Eng. 2011, 58, 411–419. [Google Scholar] [CrossRef] [Scilit] [PubMed]
- ELP-USB500W02M-L36. Available online: http://www.elpcctv.com/5mp-ultra-wide-angle-hd-usb-camera-board-with-mpeg-format-p-83.html (accessed on 11 September 2017).
- 850 nm CWL, 10 nm FWHM, 25 mm Mounted Diameter. Available online: https://www.edmundoptics.com/optics/optical-filters/bandpass-filters/850nm-cwl-10nm-fwhm-25mm-mounted-diameter (accessed on 11 September 2017).
- Dlib C++ Library. Real-Time Face Pose Estimation. Available online: http://blog.dlib.net/2014/08/real-time-face-pose-estimation.html (accessed on 7 March 2017).
- Kazemi, V.; Sullivan, J. One millisecond face alignment with an ensemble of regression trees. In Proceedings of the IEEE Conference on Computer Vision and Pattern Recognition, Columbus, OH, USA, 23–28 June 2014; pp. 1867–1874. [Google Scholar]
- Zhao, J.; Bose, B.K. Evaluation of membership functions for fuzzy logic controlled induction motor drive. In Proceedings of the IEEE Annual Conference of the Industrial Electronics Society, Sevilla, Spain, 5–8 November 2002; pp. 229–234. [Google Scholar]
- Bayu, B.S.; Miura, J. Fuzzy-based illumination normalization for face recognition. In Proceedings of the IEEE Workshop on Advanced Robotics and Its Social Impacts, Tokyo, Japan, 7–9 November 2013; pp. 131–136. [Google Scholar]
- Barua, A.; Mudunuri, L.S.; Kosheleva, O. Why trapezoidal and triangular membership functions work so well: Towards a theoretical explanation. J. Uncertain Syst. 2014, 8, 164–168. [Google Scholar]
- Precup, R.-E.; Preitl, S.; Petriu, E.M.; Tar, J.K.; Tomescu, M.L.; Pozna, C. Generic two-degree-of-freedom linear and fuzzy controllers for integral processes. J. Frankl. Inst. 2009, 346, 980–1003. [Google Scholar] [CrossRef] [Scilit]
- Medina, J.; Ojeda-Aciego, M. Multi-adjoint t-concept lattices. Inf. Sci. 2010, 180, 712–725. [Google Scholar] [CrossRef] [Scilit]
- Nowaková, J.; Prílepok, M.; Snášel, V. Medical image retrieval using vector quantization and fuzzy S-tree. J. Med. Syst. 2017, 41, 1–16. [Google Scholar] [CrossRef] [Scilit] [PubMed]
- Kumar, A.; Kumar, D.; Jarial, S.K. A hybrid clustering method based on improved artificial bee colony and fuzzy C-Means algorithm. Int. J. Artif. Intell. 2017, 15, 40–60. [Google Scholar]
- Wei, Y.; Qiu, J.; Lam, H.-K. A novel approach to reliable output feedback control of fuzzy-affine systems with time-delays and sensor faults. IEEE Trans. Fuzzy Syst. 2016. [Google Scholar] [CrossRef] [Scilit]
- Wei, Y.; Qiu, J.; Karimi, H.R. Reliable output feedback control of discrete-time fuzzy affine systems with actuator faults. IEEE Trans. Circuits Syst. I 2017, 64, 170–181. [Google Scholar] [CrossRef] [Scilit]
- Qiu, J.; Wei, Y.; Karimi, H.R.; Gao, H. Reliable control of discrete-time piecewise-affine time-delay systems via output feedback. IEEE Trans. Reliab. 2017, 1–13. [Google Scholar] [CrossRef] [Scilit]
- Wei, Y.; Qiu, J.; Lam, H.-K.; Wu, L. Approaches to T–S fuzzy-affine-model-based reliable output feedback control for nonlinear itô stochastic systems. IEEE Trans. Fuzzy Syst. 2017, 25, 569–583. [Google Scholar] [CrossRef] [Scilit]
- Klir, G.J.; Yuan, B. Fuzzy Sets and Fuzzy Logic—Theory and Applications; Prentice-Hall: Upper Saddle River, NJ, USA, 1995. [Google Scholar]
- Defuzzification Methods. Available online: https://kr.mathworks.com/help/fuzzy/examples/defuzzification-methods.html (accessed on 7 September 2017).
- Leekwijck, W.V.; Kerre, E.E. Defuzzification: Criteria and classification. Fuzzy Sets Syst. 1999, 108, 159–178. [Google Scholar] [CrossRef] [Scilit]
- Broekhoven, E.V.; Baets, B.D. Fast and accurate center of gravity defuzzification of fuzzy system outputs defined on trapezoidal fuzzy partitions. Fuzzy Sets Syst. 2006, 157, 904–918. [Google Scholar] [CrossRef] [Scilit]
- Lee, H.C.; Lee, W.O.; Cho, C.W.; Gwon, S.Y.; Park, K.R.; Lee, H.; Cha, J. Remote gaze tracking system on a large display. Sensors 2013, 13, 13439–13463. [Google Scholar] [CrossRef] [Scilit] [PubMed]
- Renault Samsung SM5. Available online: https://en.wikipedia.org/wiki/Renault_Samsung_SM5 (accessed on 7 September 2017).
- Visual Studio 2013. Available online: https://www.visualstudio.com/en-us/vs (accessed on 11 September 2017).
- OpenCV. Available online: http://opencv.org (accessed on 11 September 2017).
- Boost C++ Library. Available online: http://www.boost.org (accessed on 11 September 2017).
- Choi, I.-H.; Hong, S.K.; Kim, Y.-G. Real-time categorization of driver’s gaze zone using the deep learning techniques. In Proceedings of the International Conference on Big Data and Smart Computing, Hong Kong, China, 18–20 January 2016; pp. 143–148. [Google Scholar]
- Krizhevsky, A.; Sutskever, I.; Hinton, G.E. Imagenet classification with deep convolutional neural networks. In Advances in Neural Information Processing Systems 25; Curran Associates, Inc.: New York, NY, USA, 2012; pp. 1097–1105. [Google Scholar]
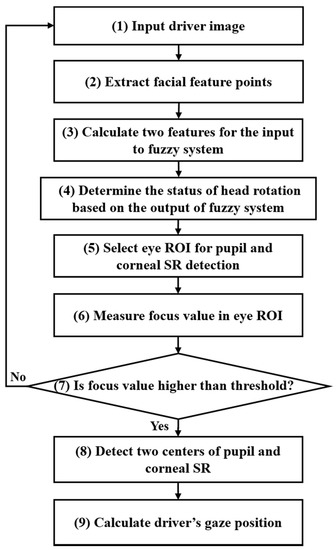
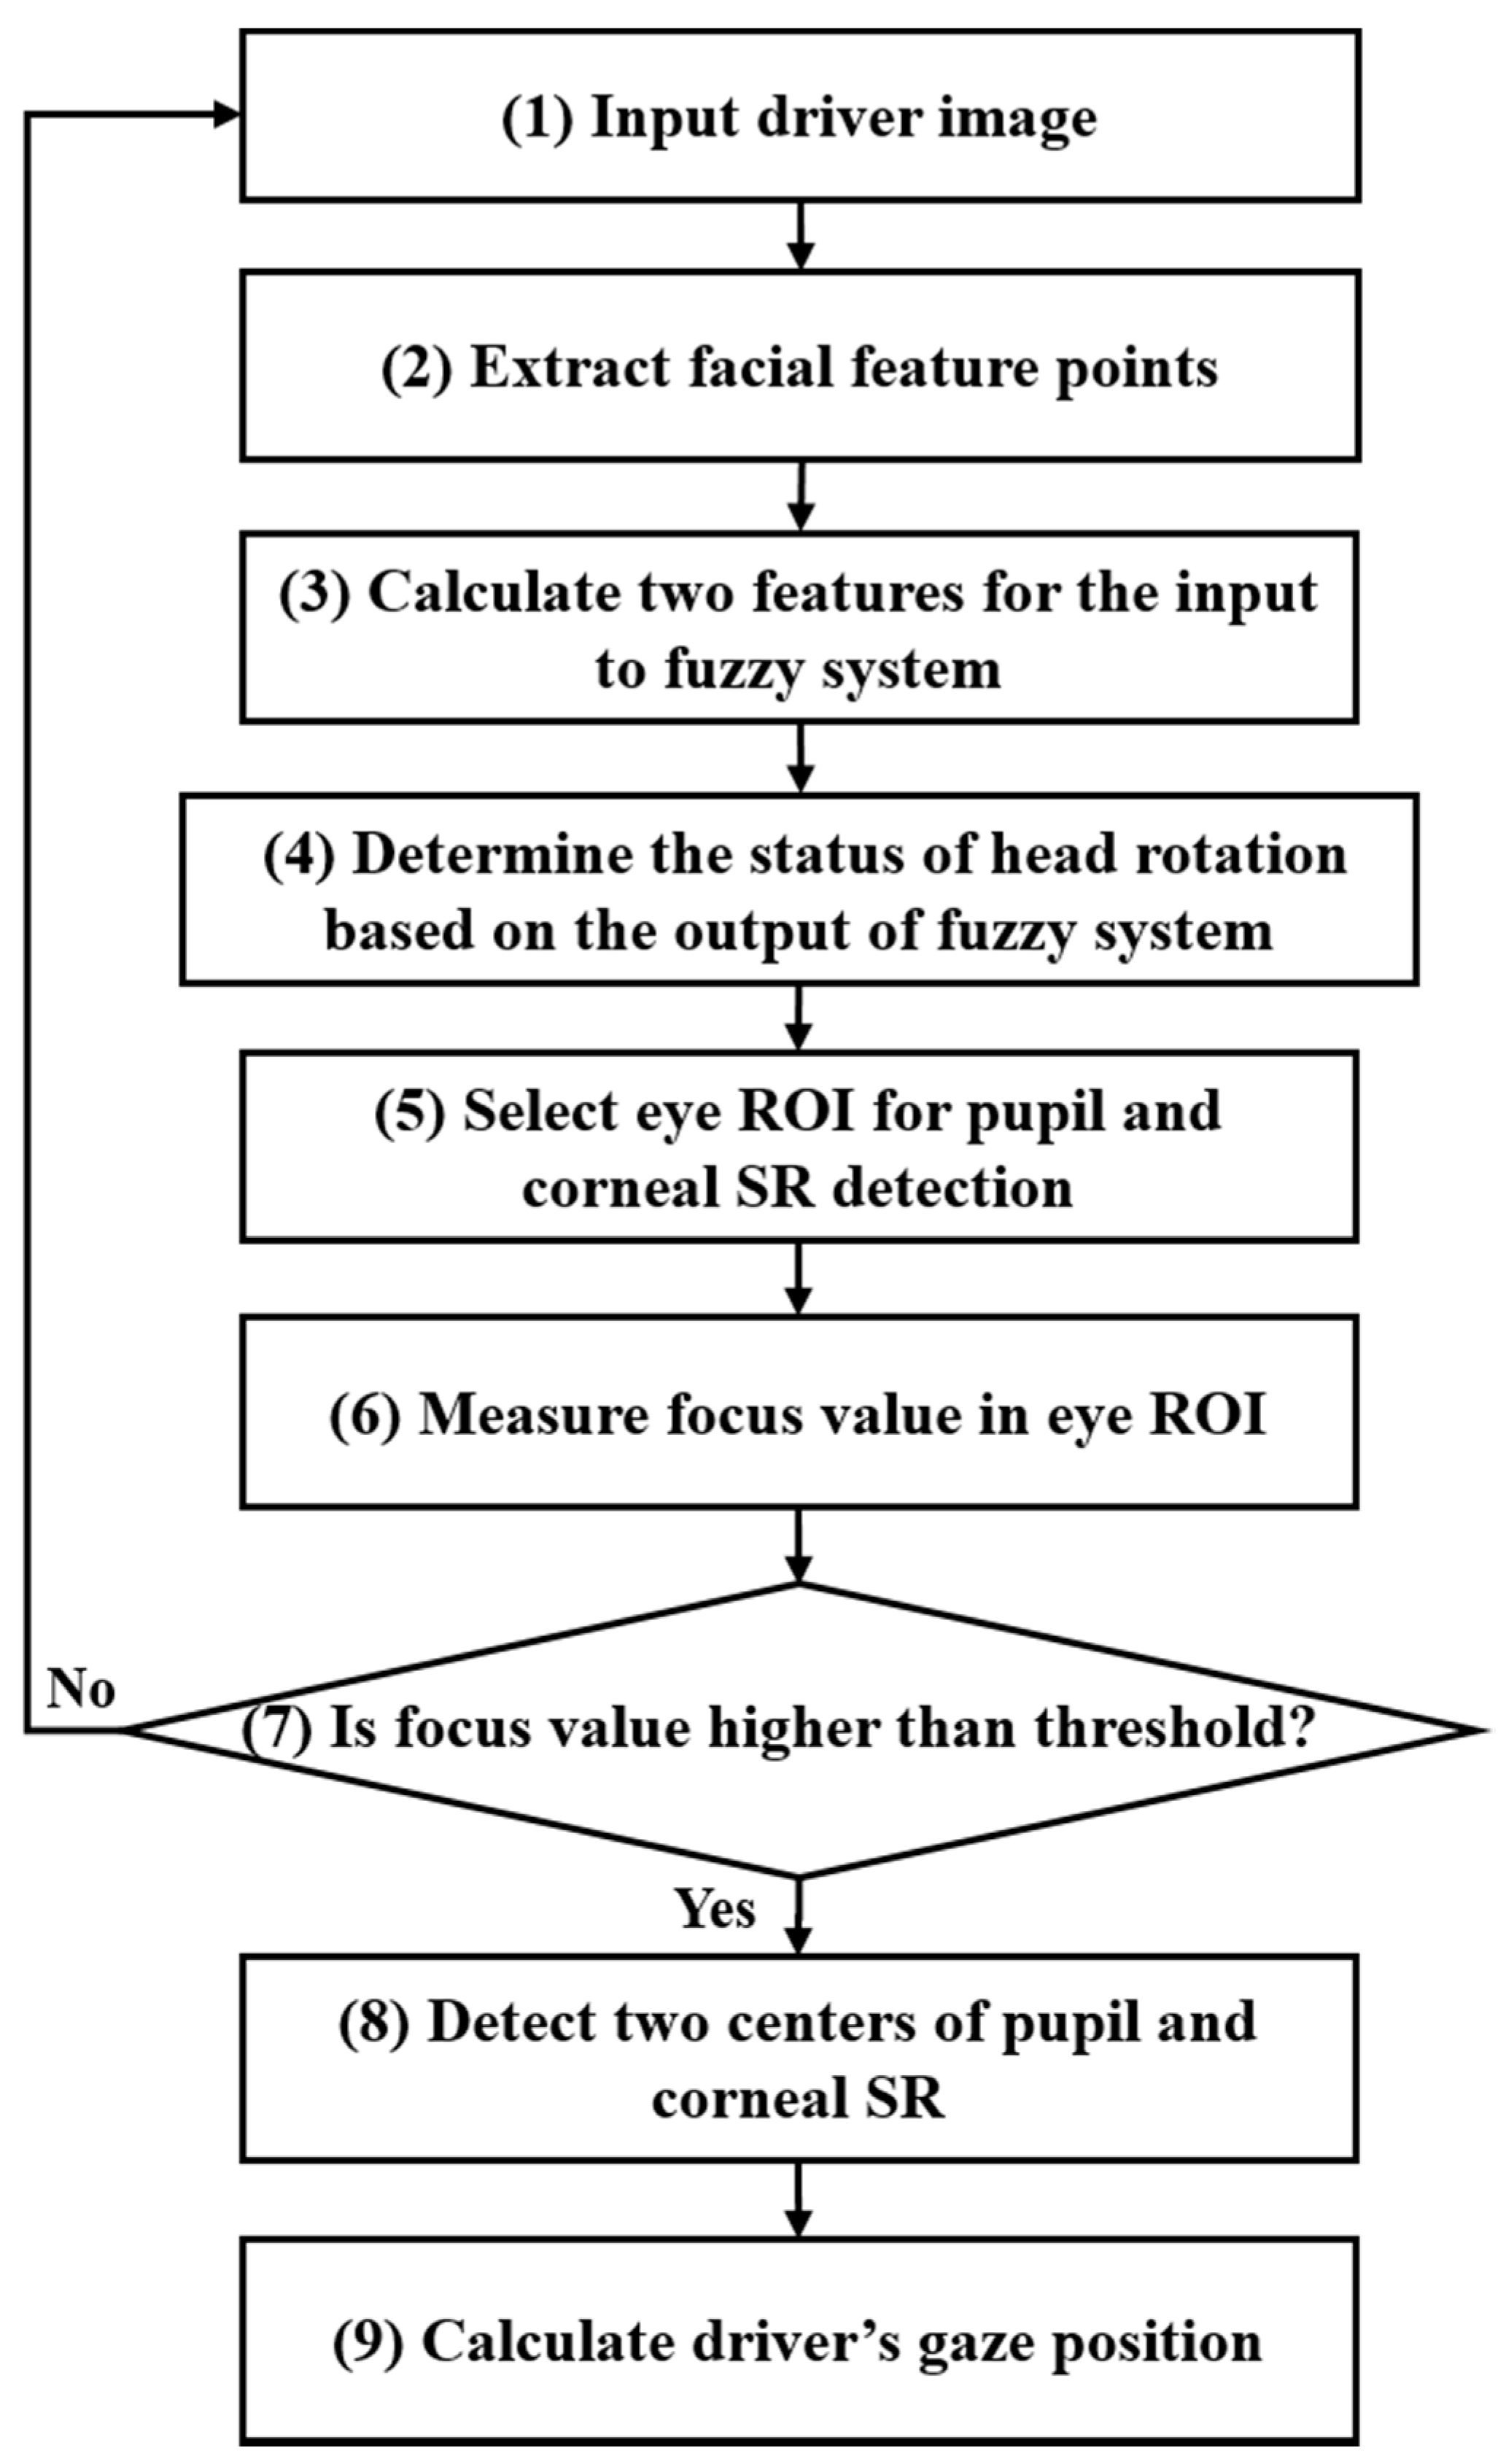
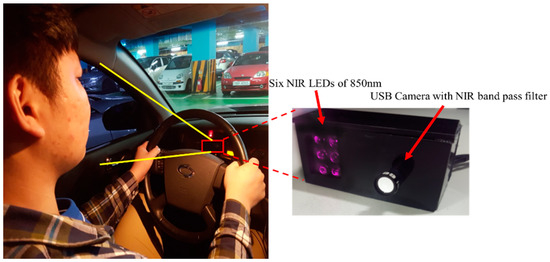
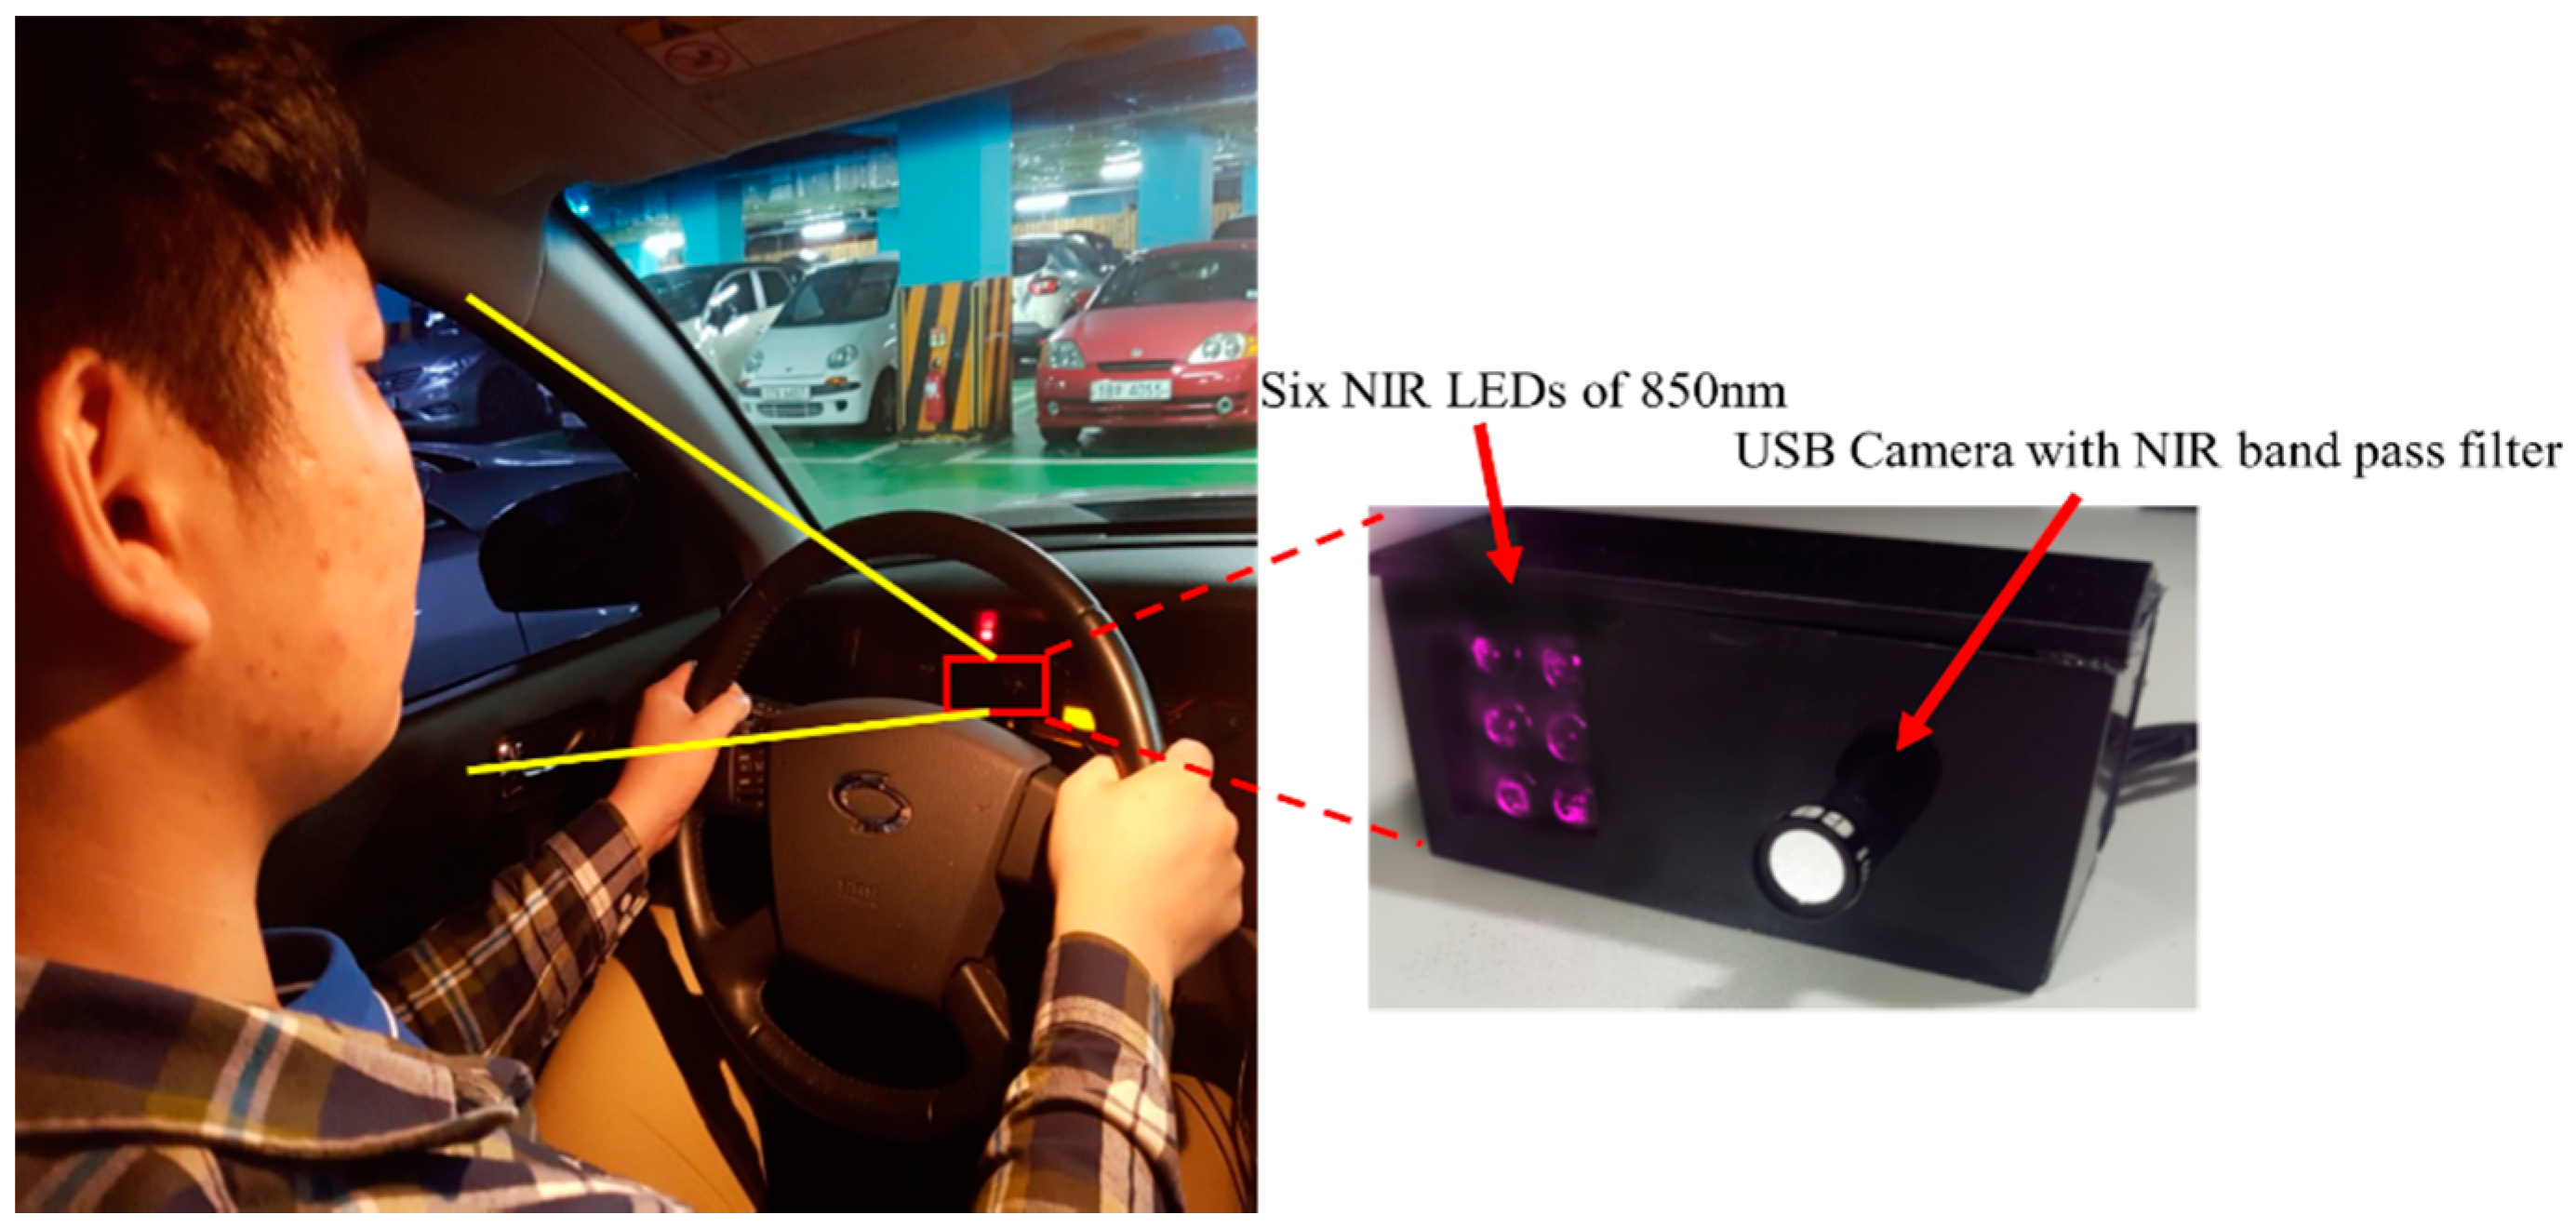
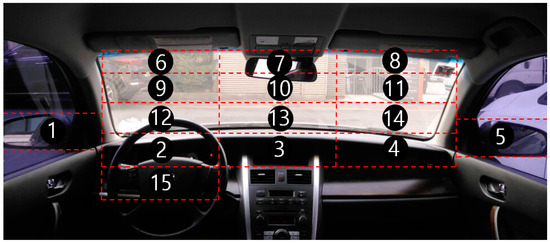
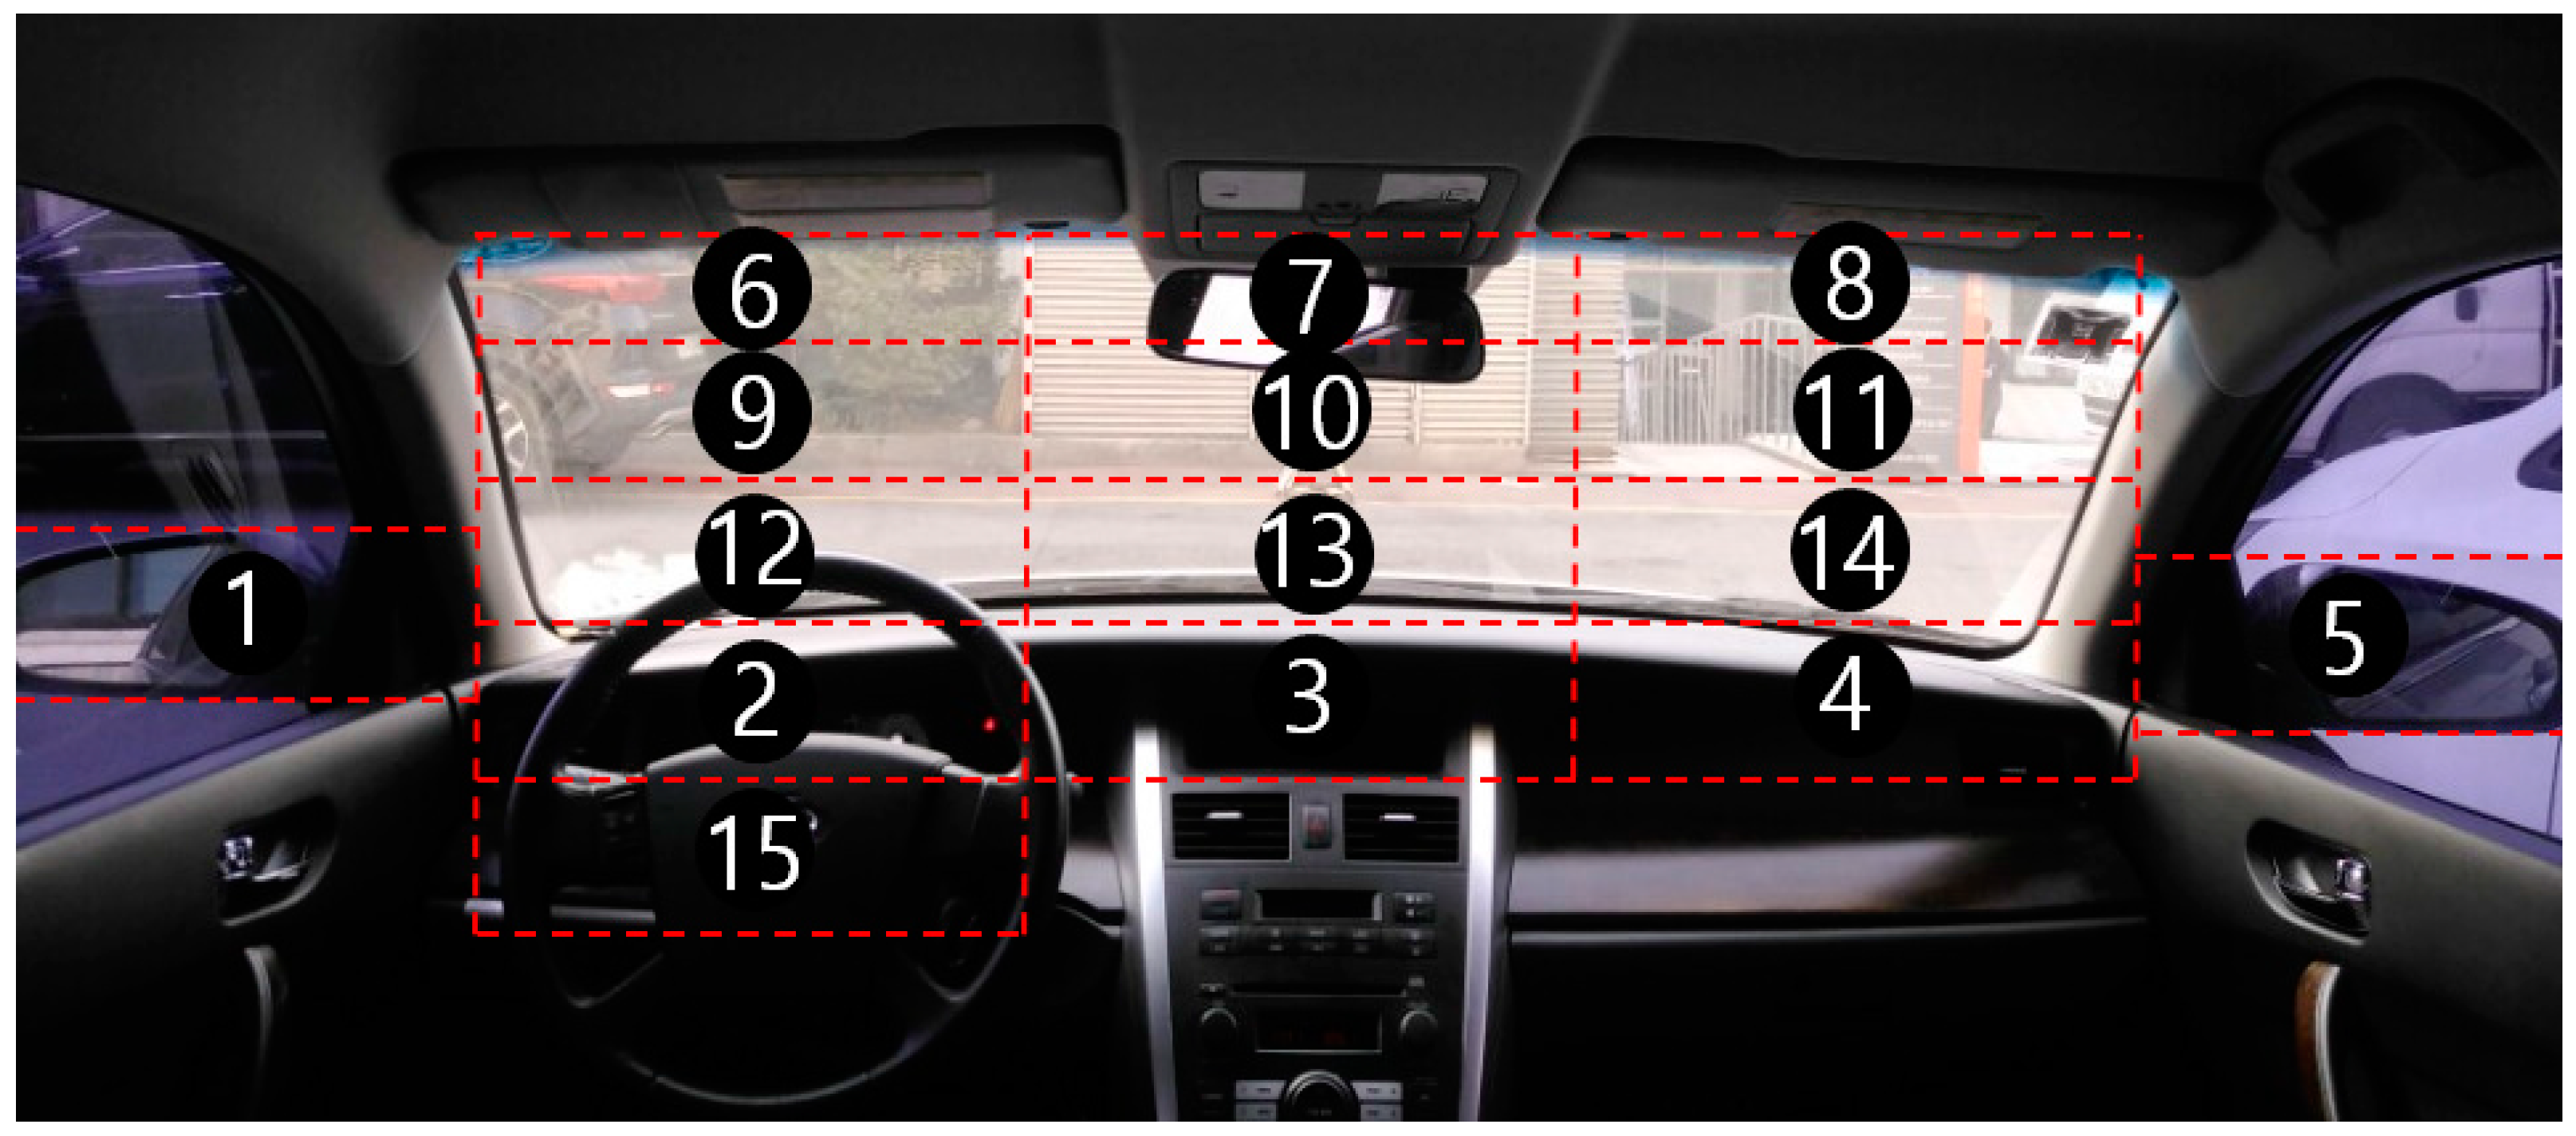
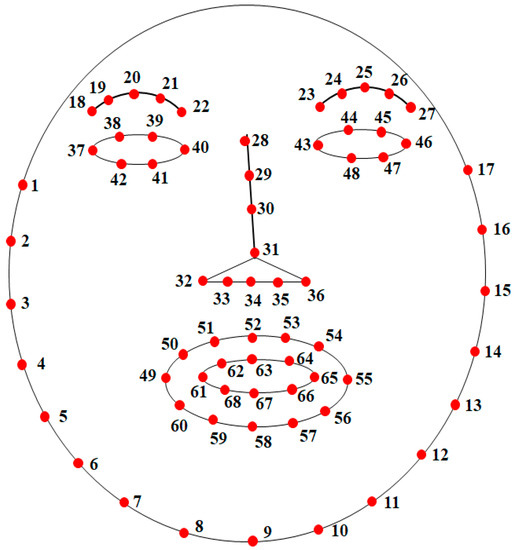
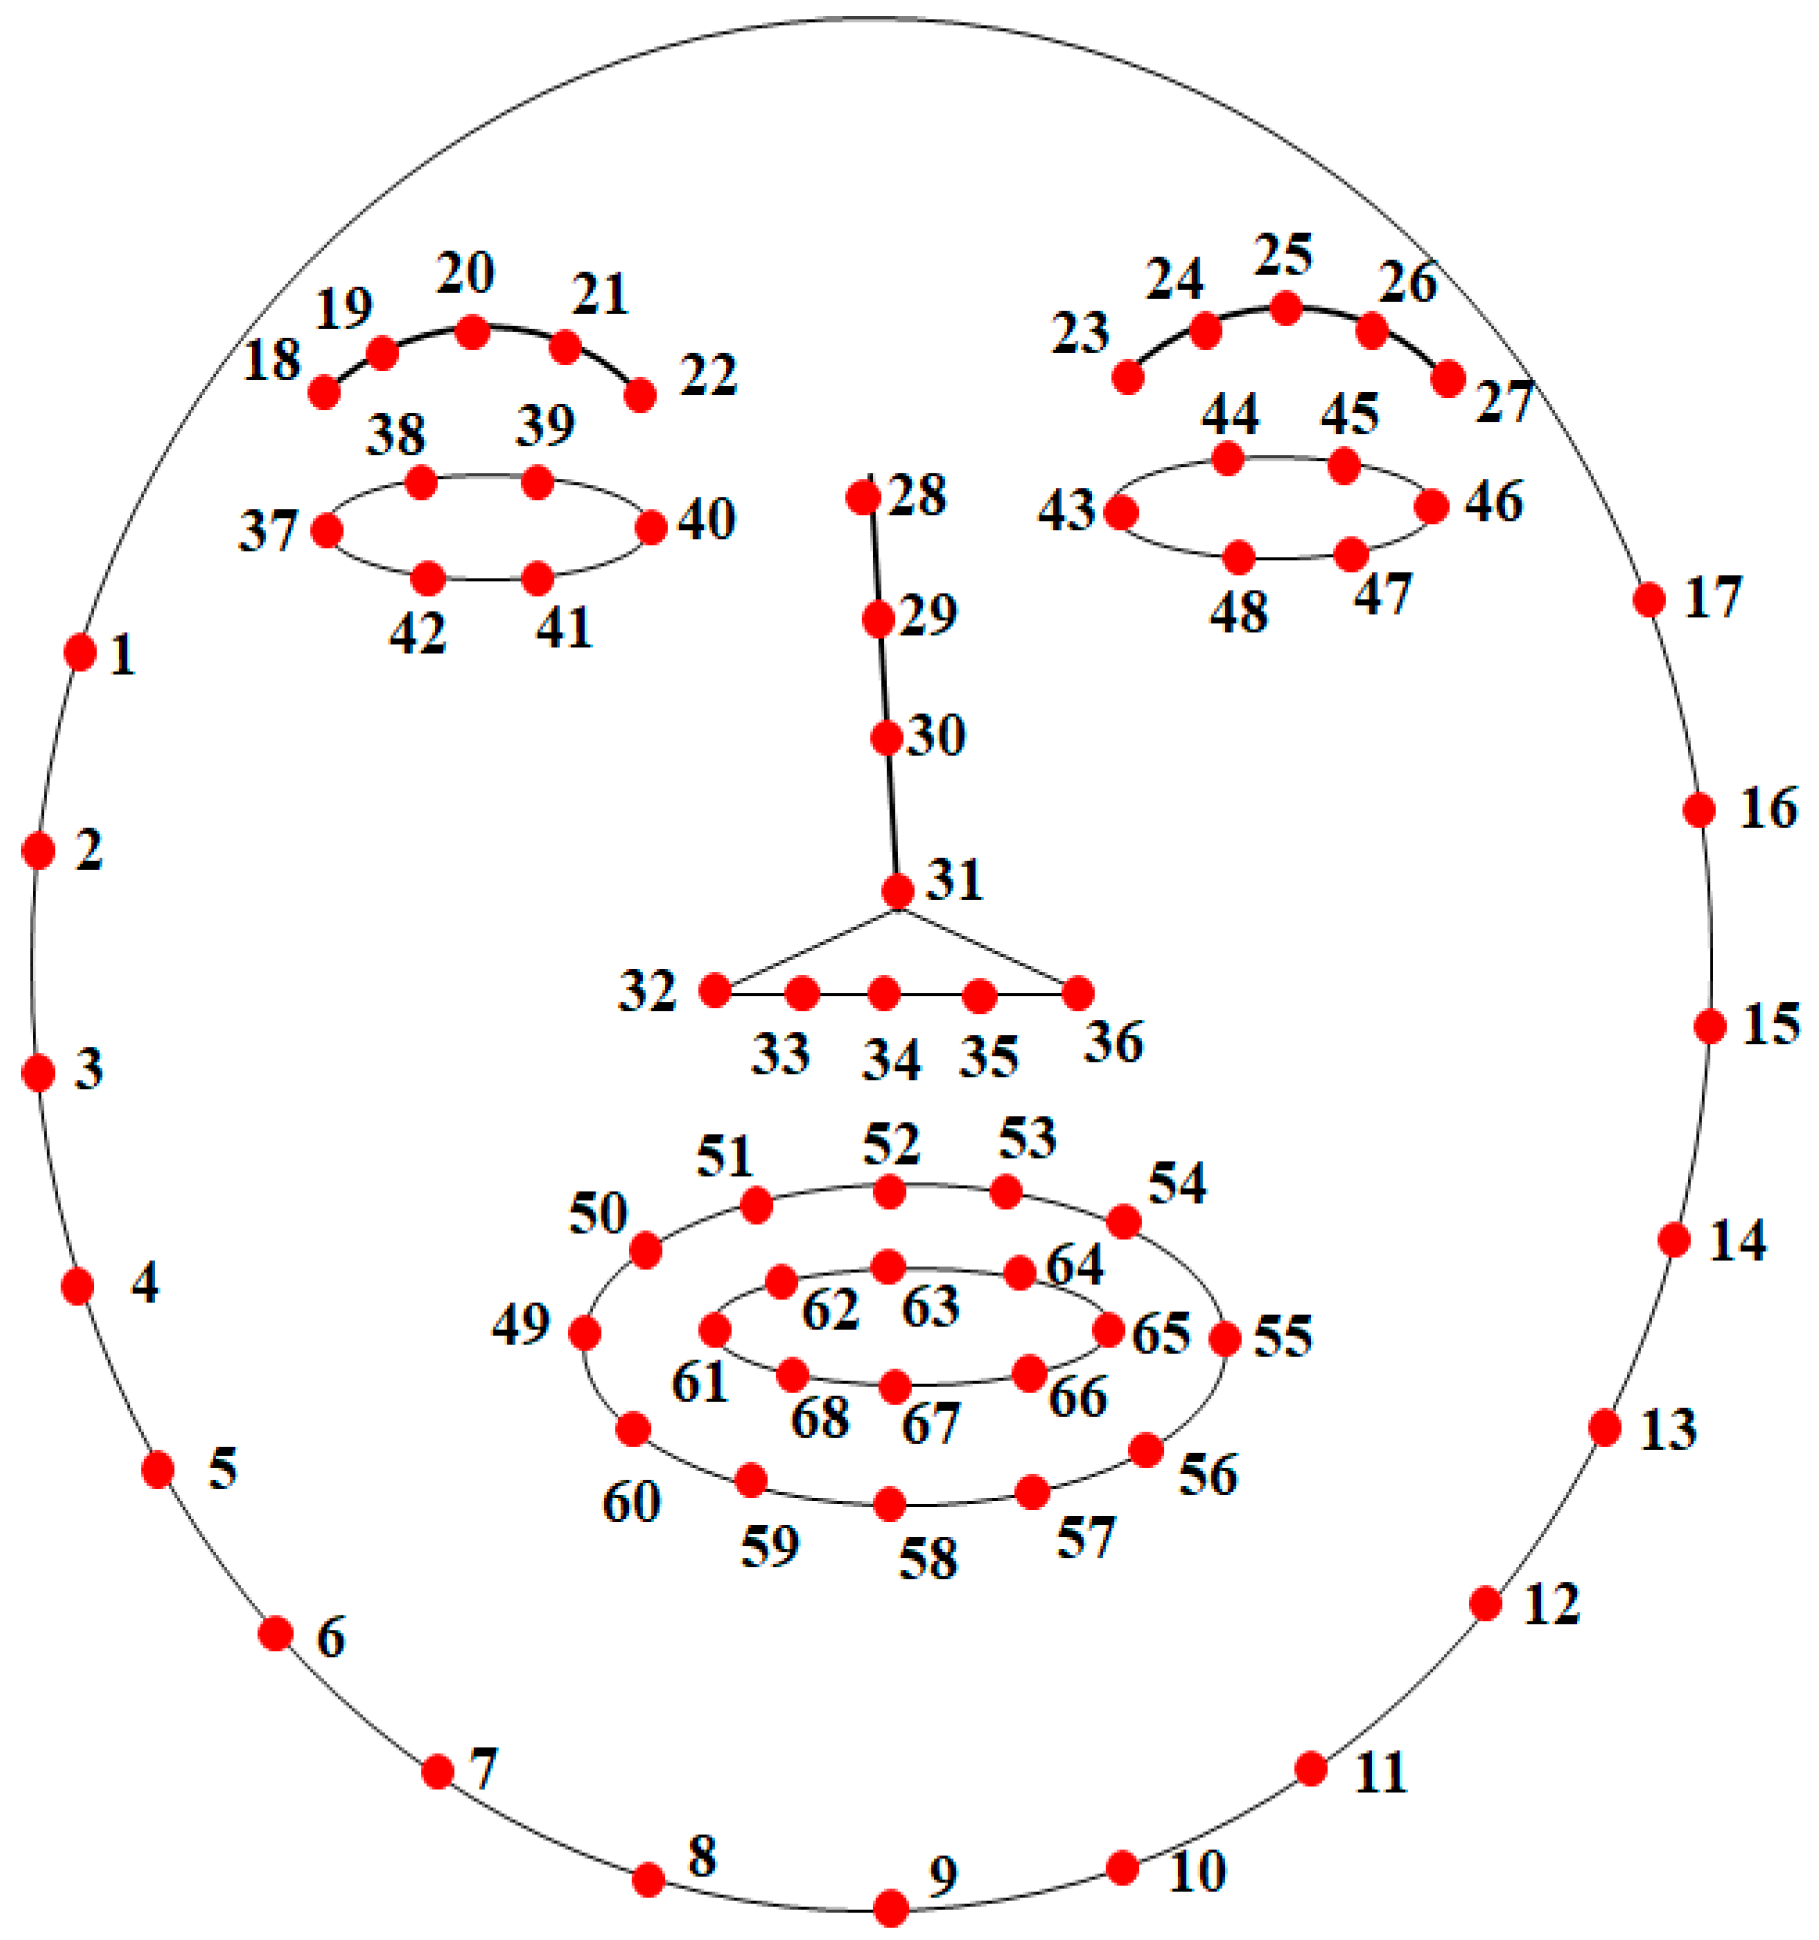
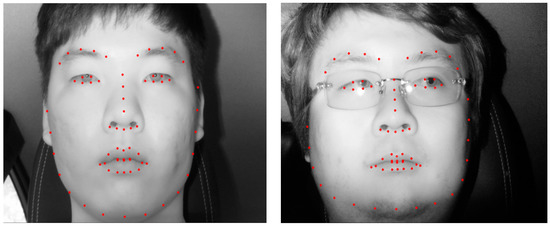
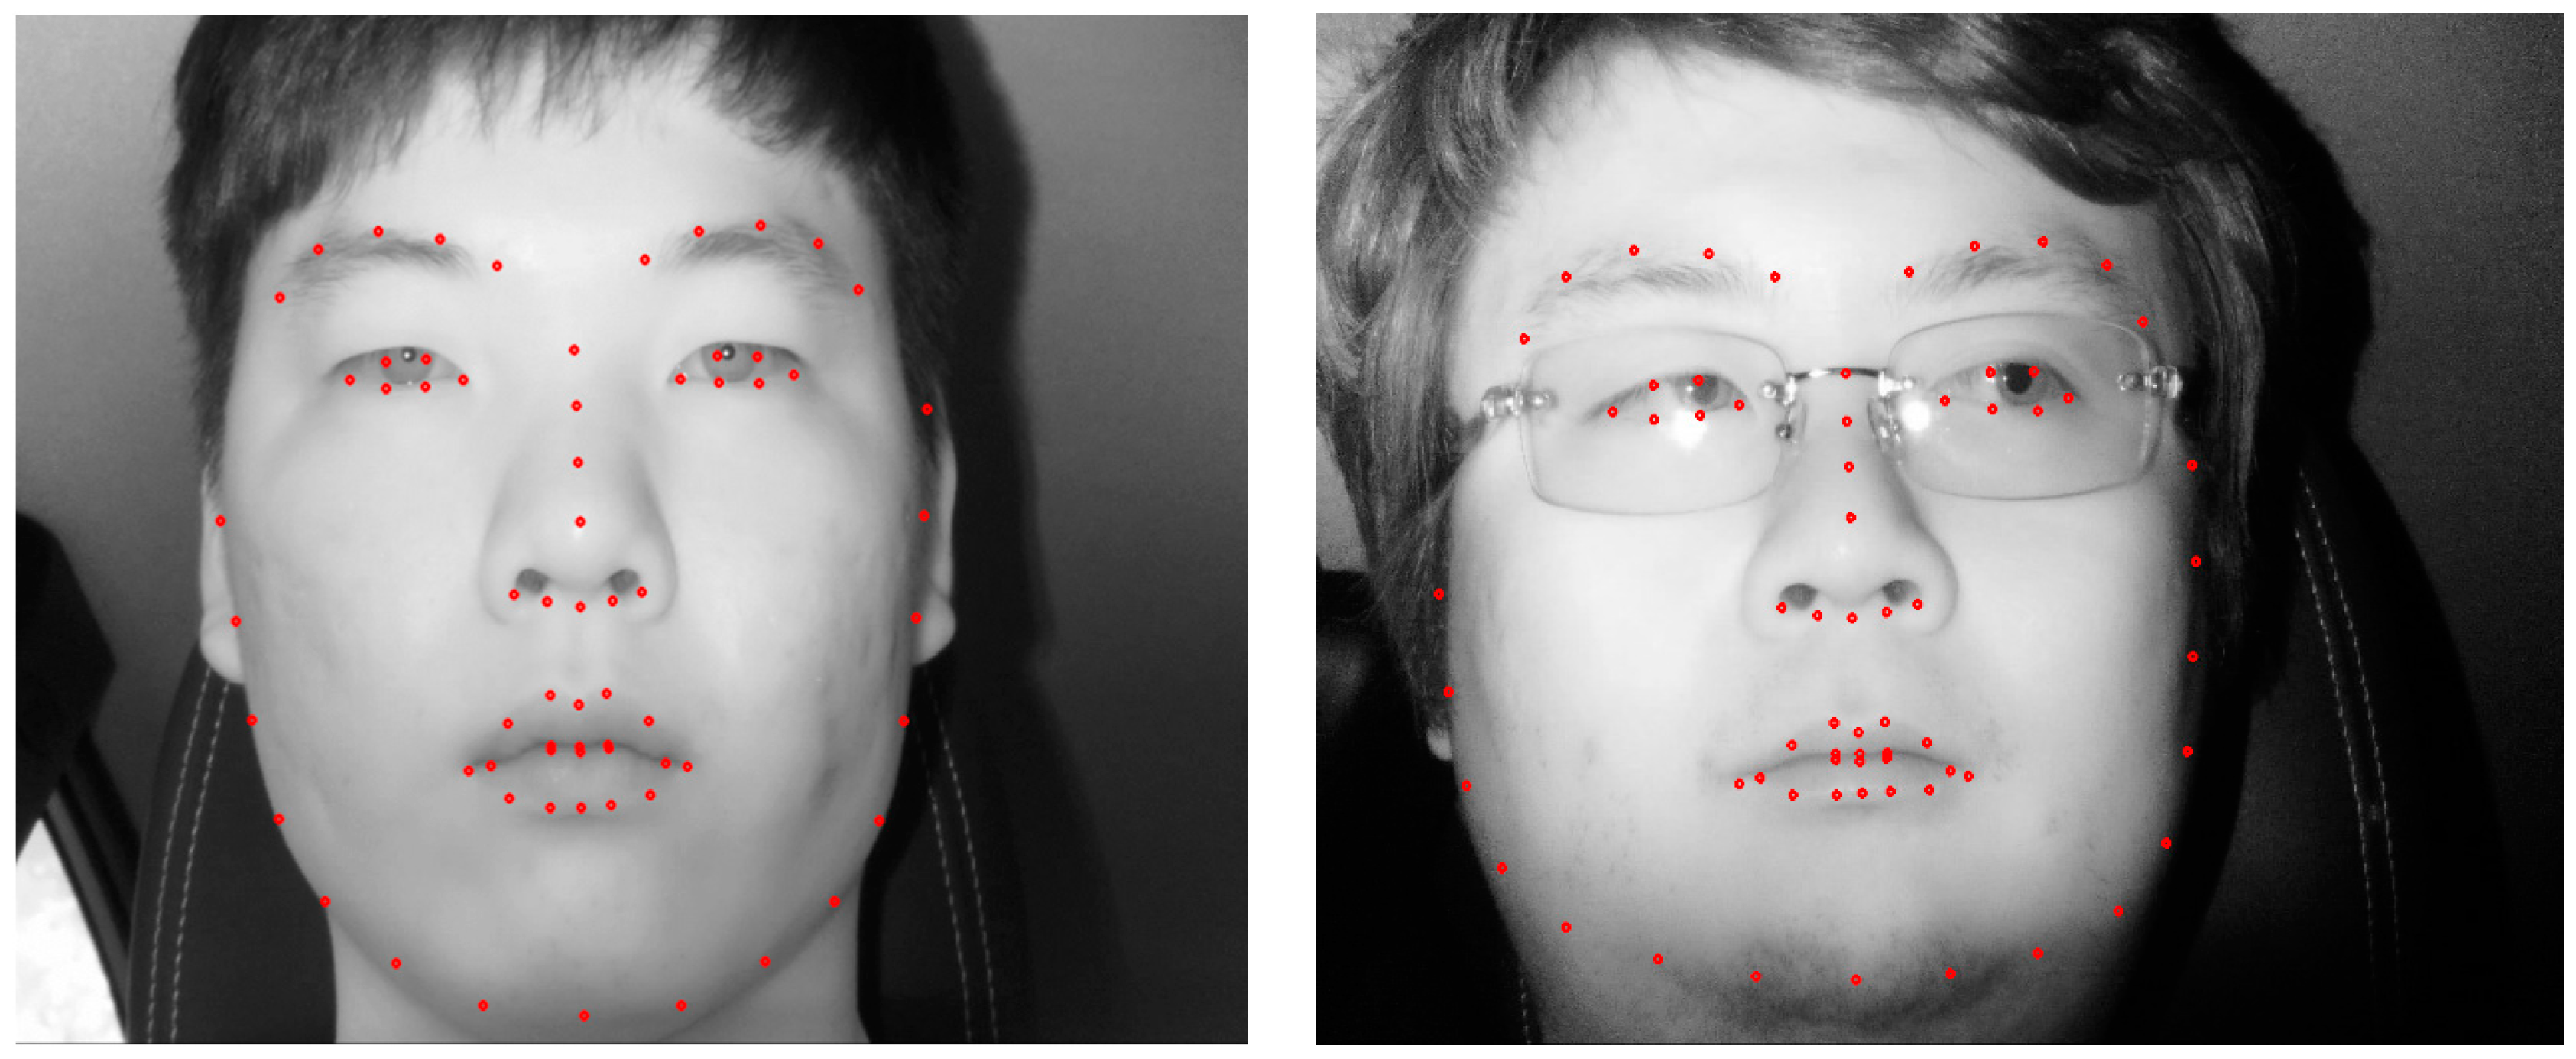
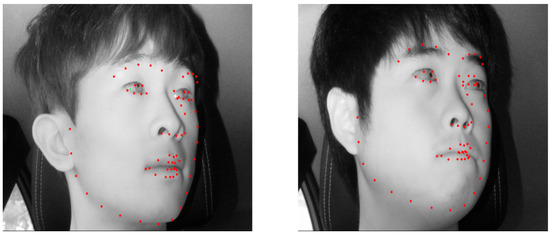
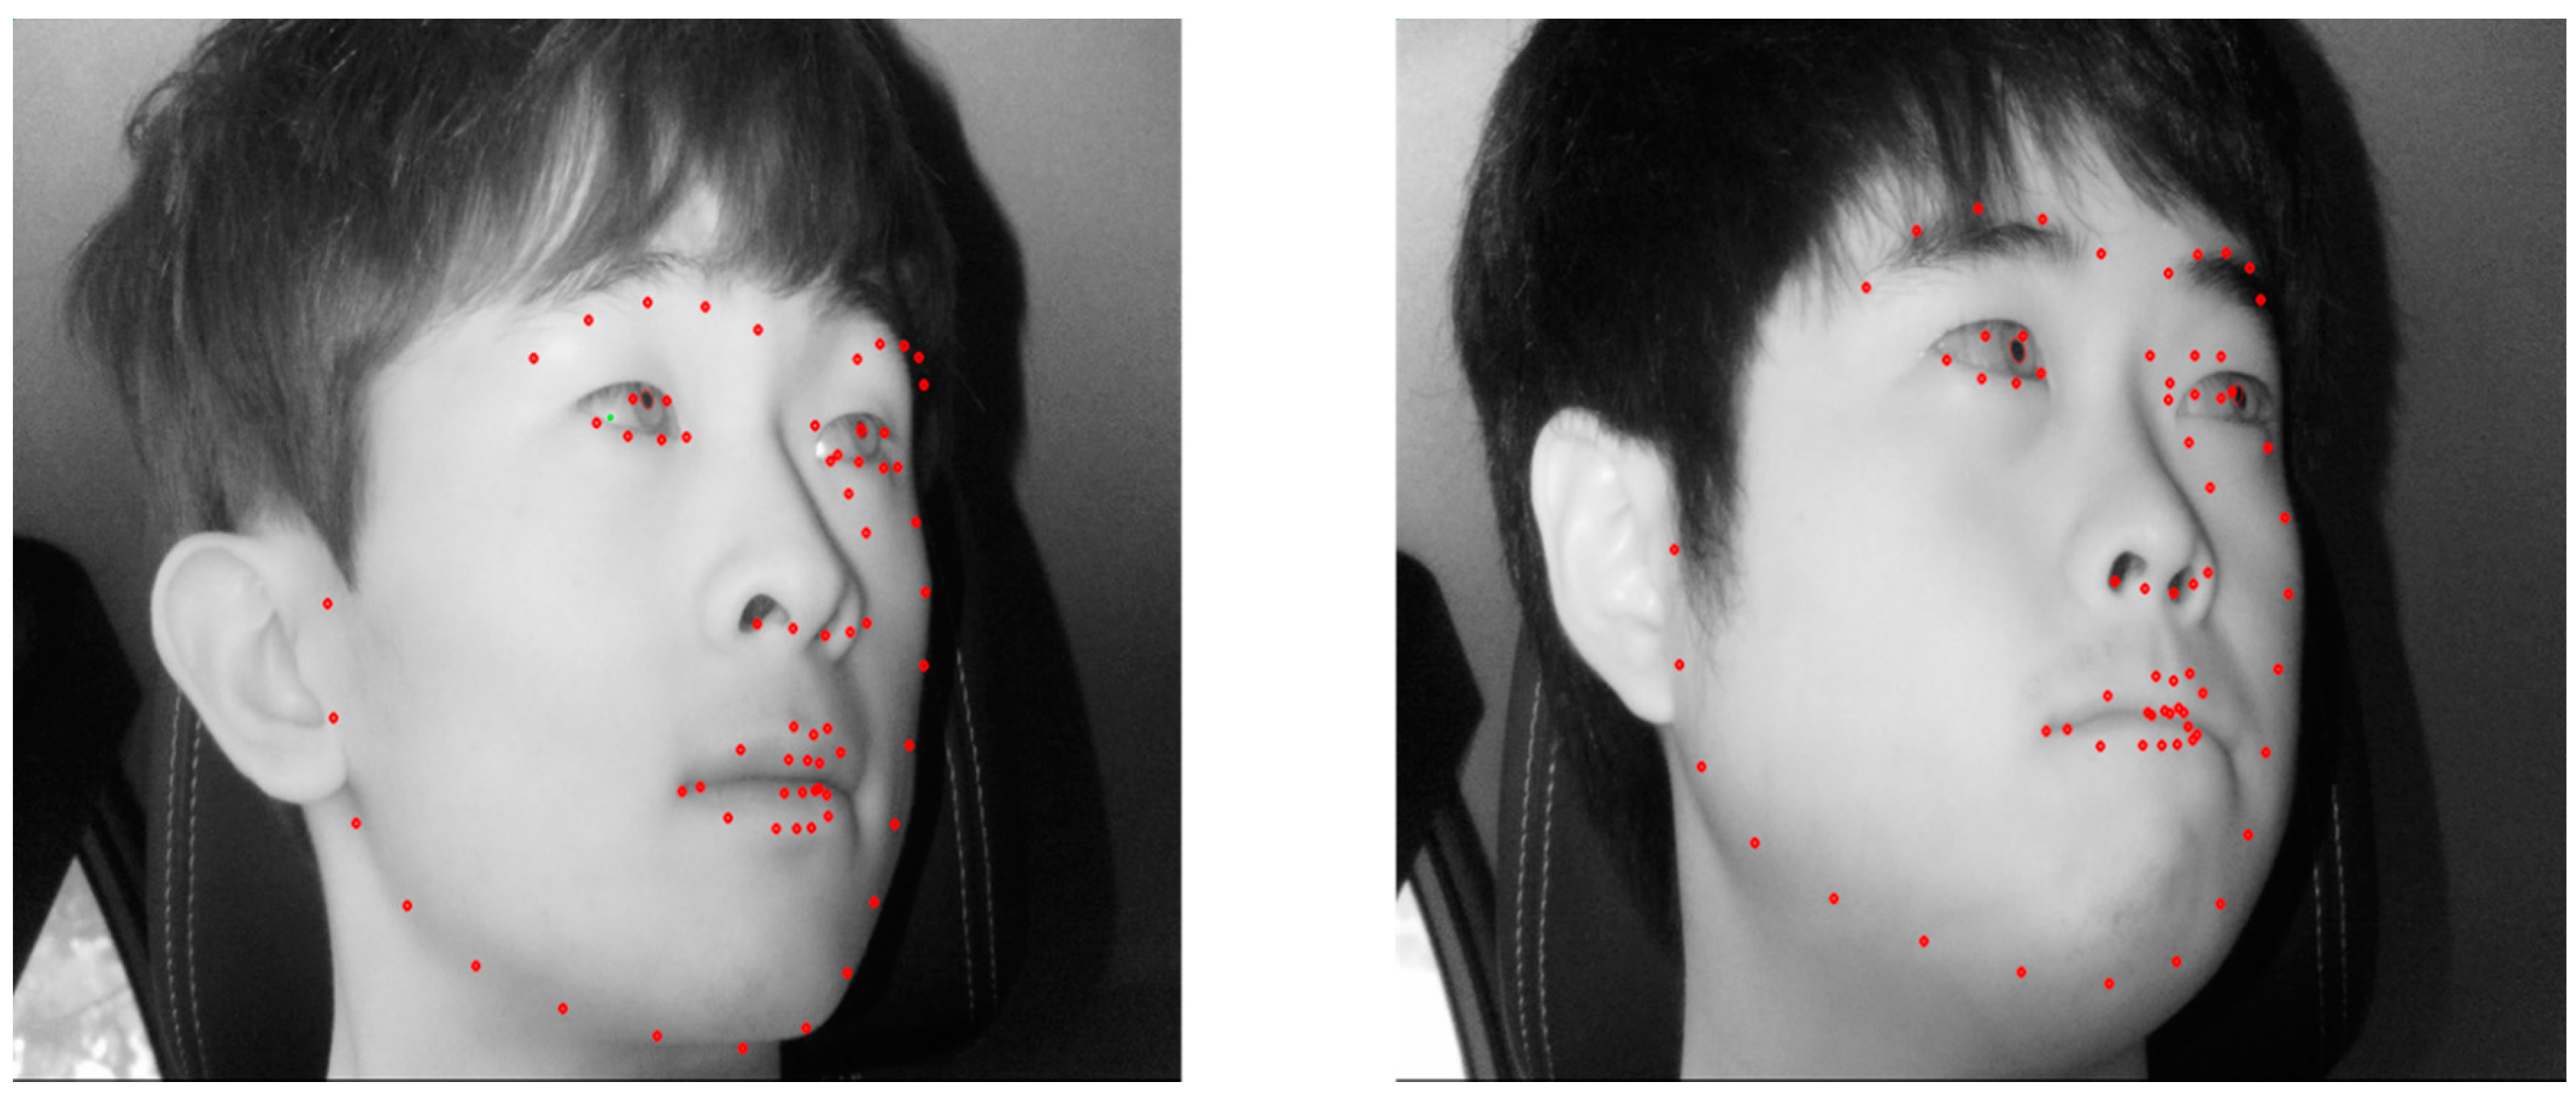
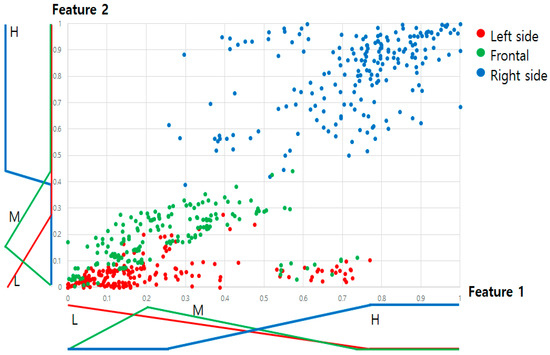
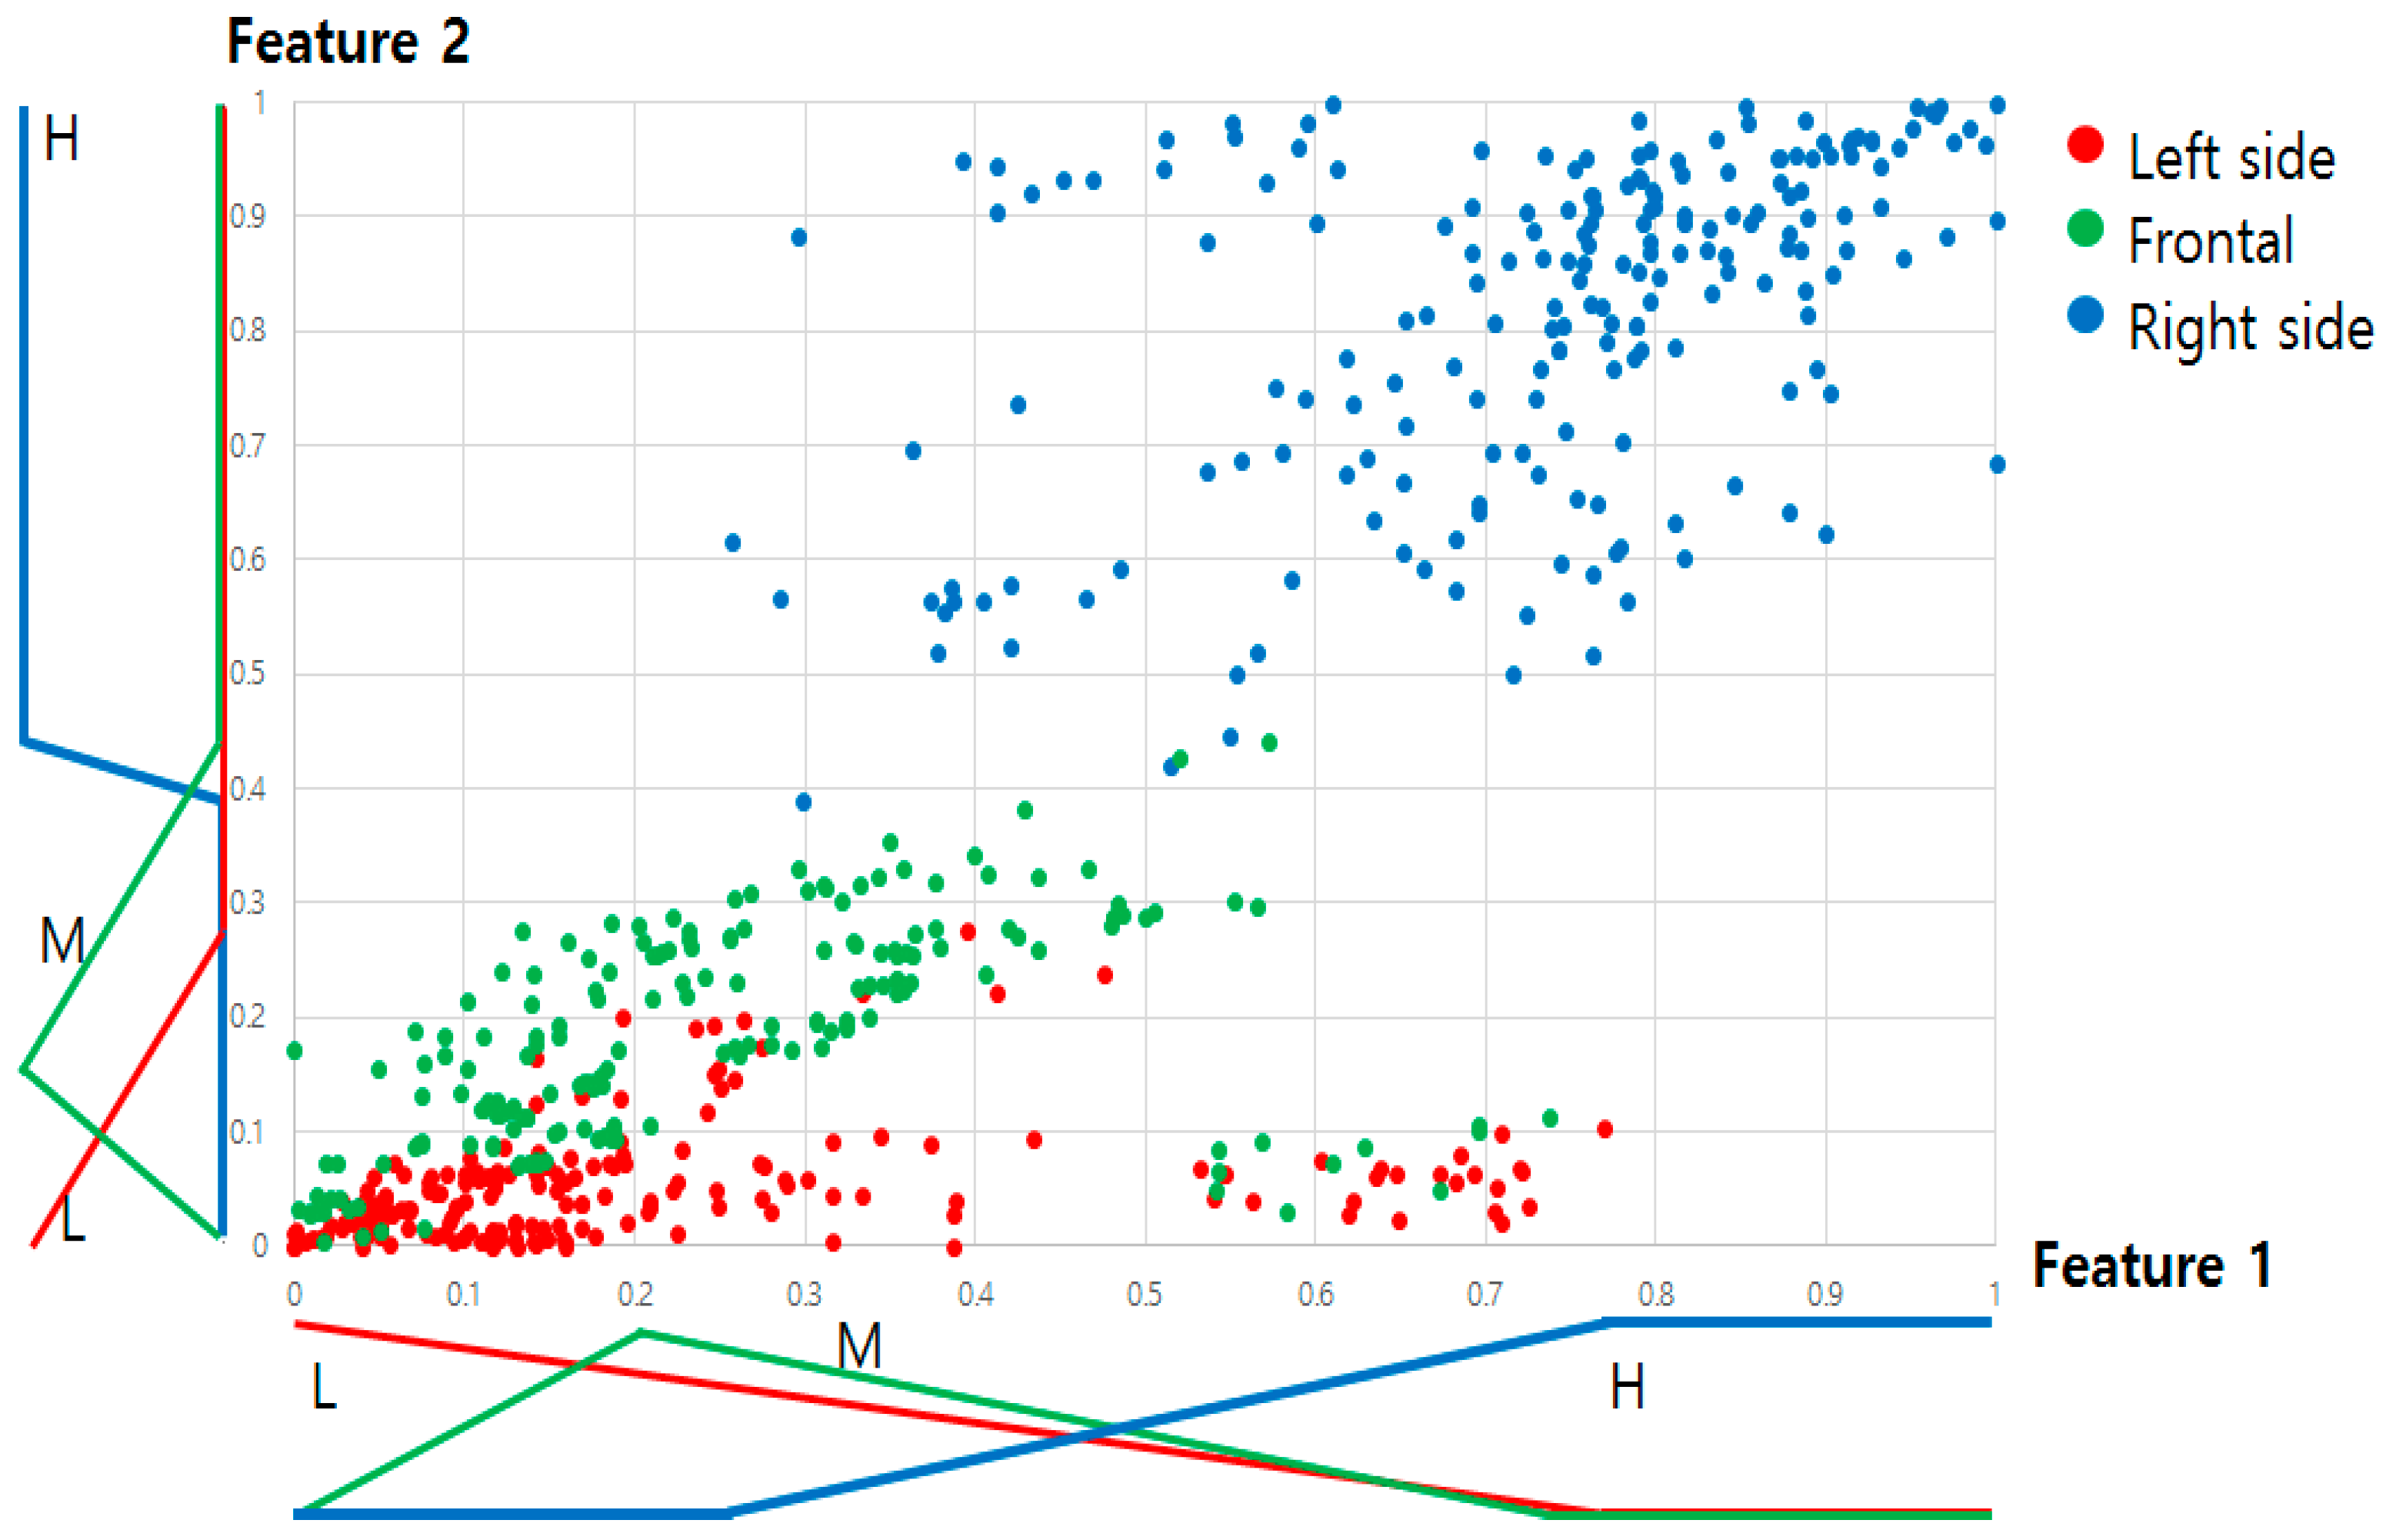
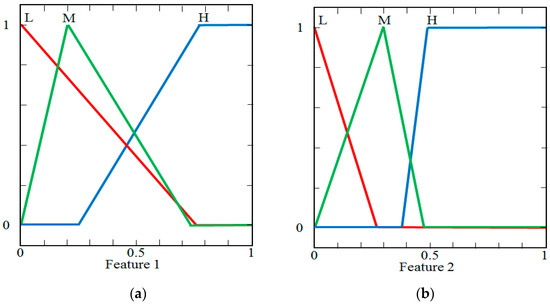
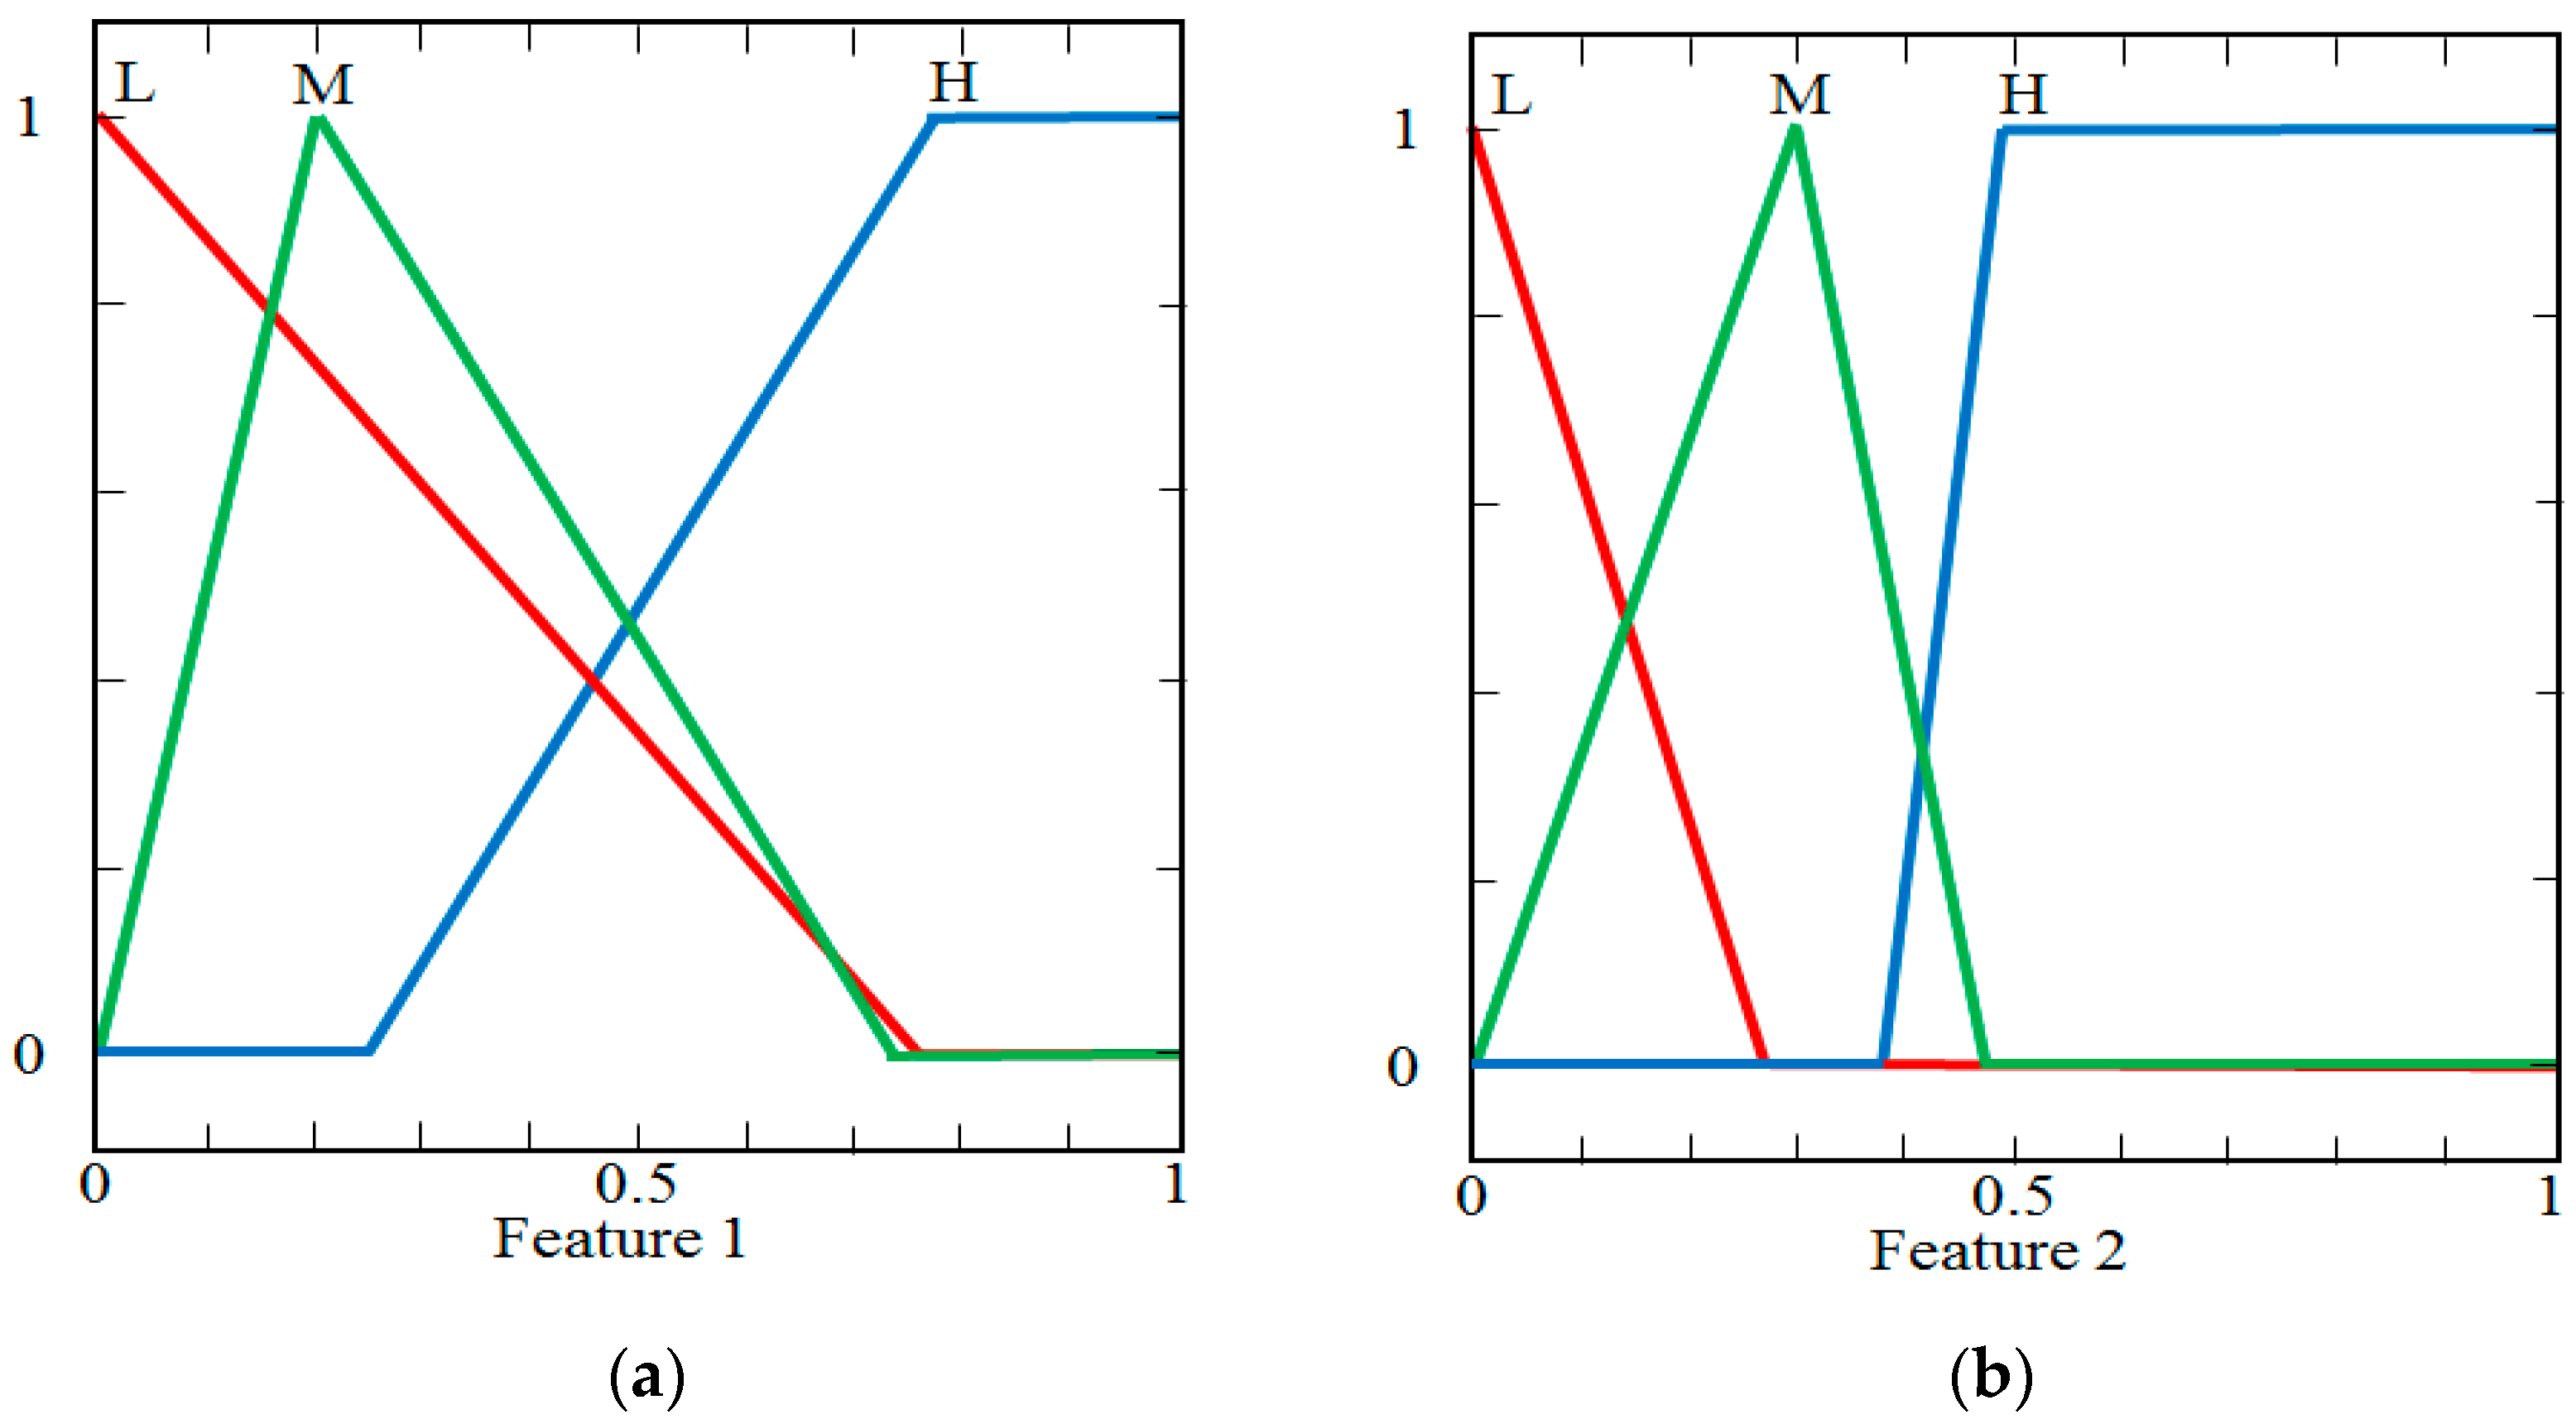
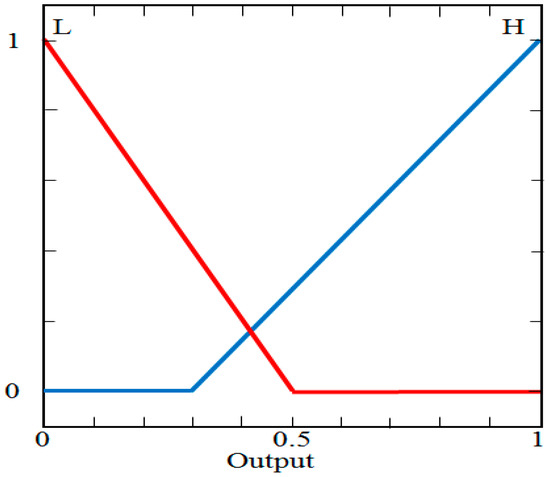
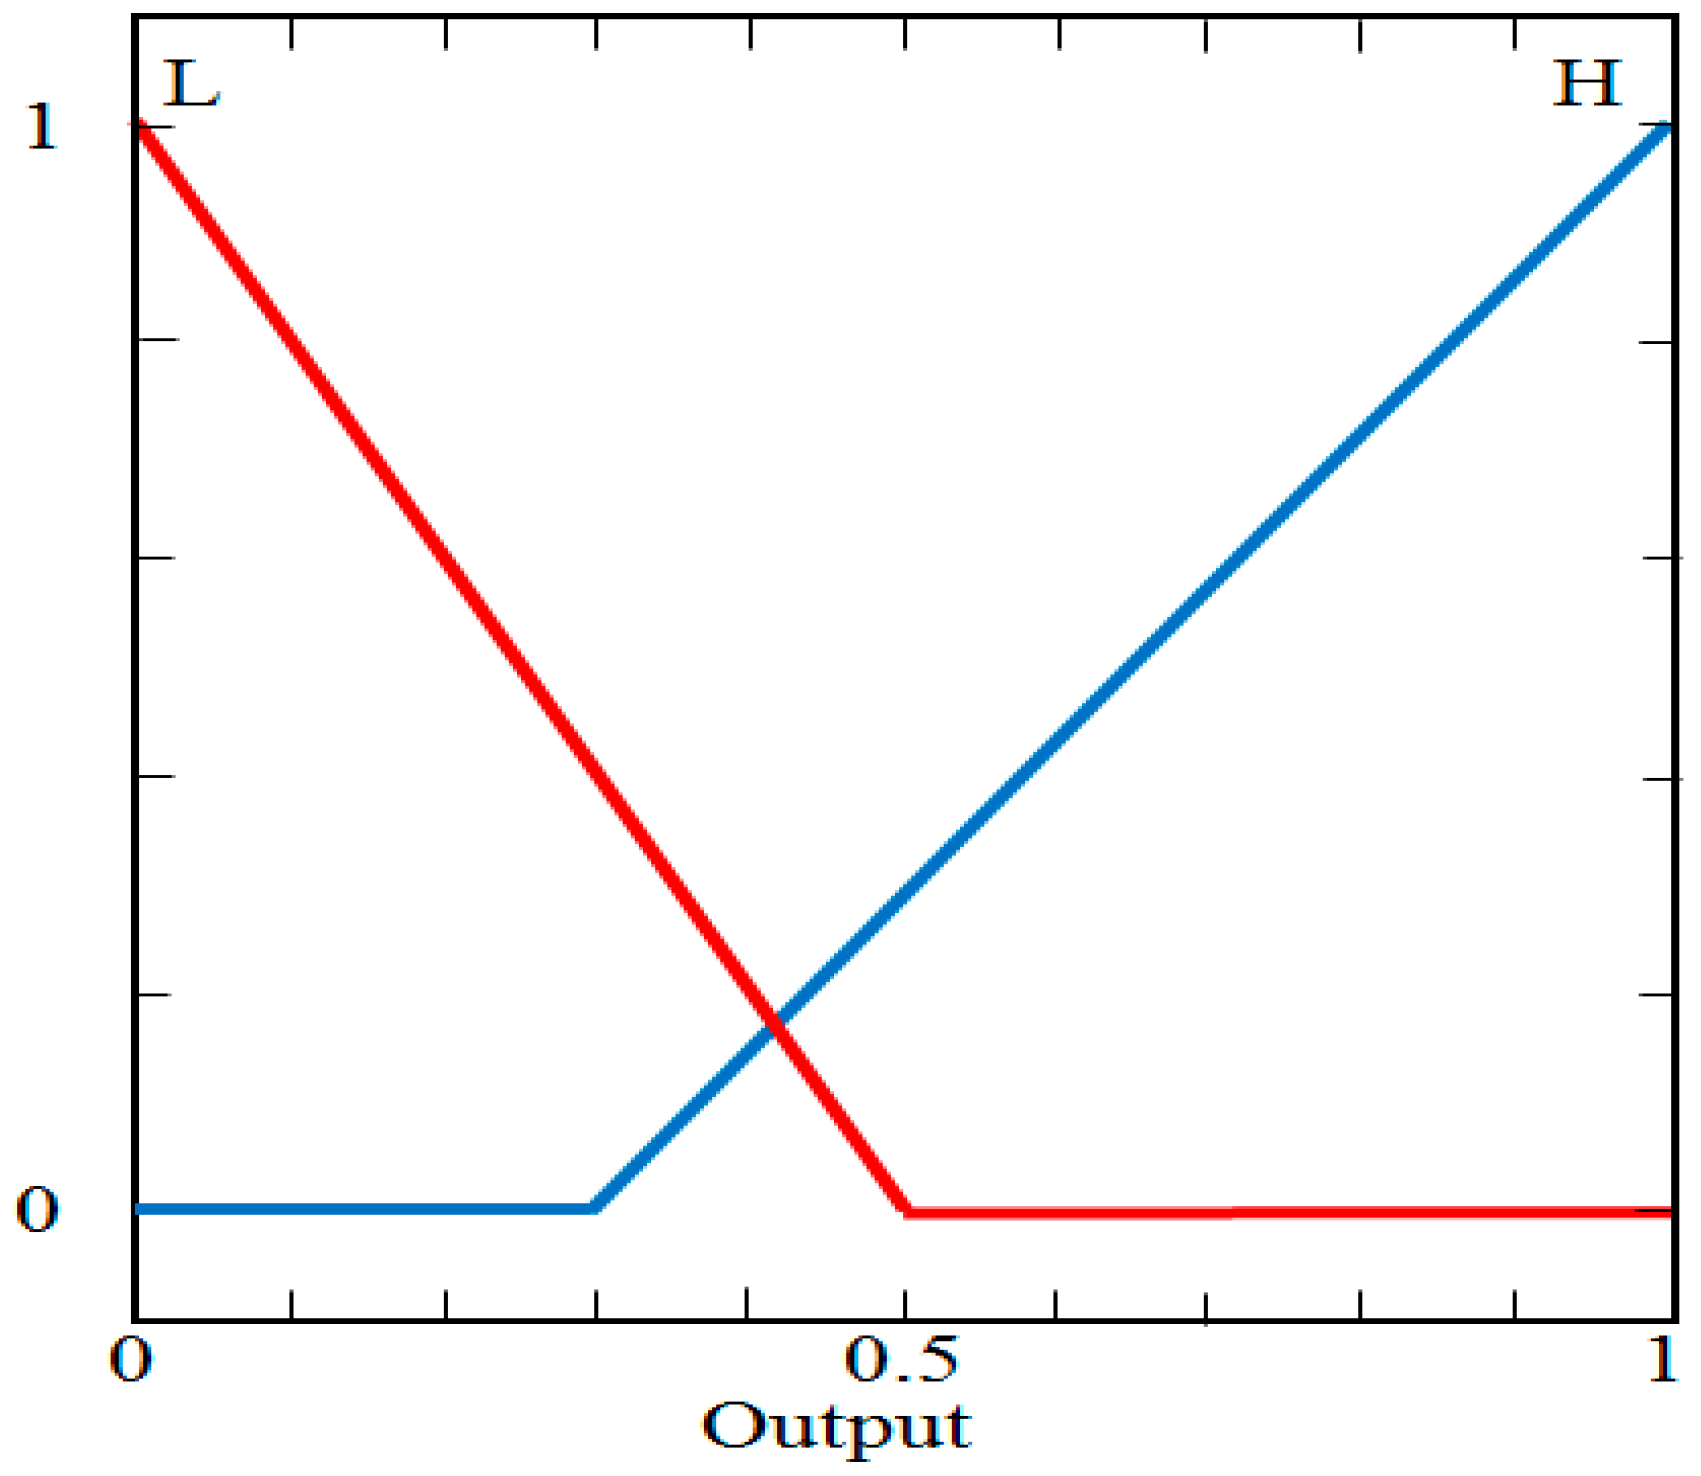
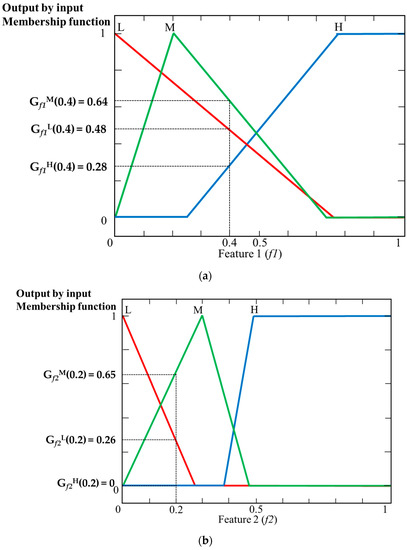
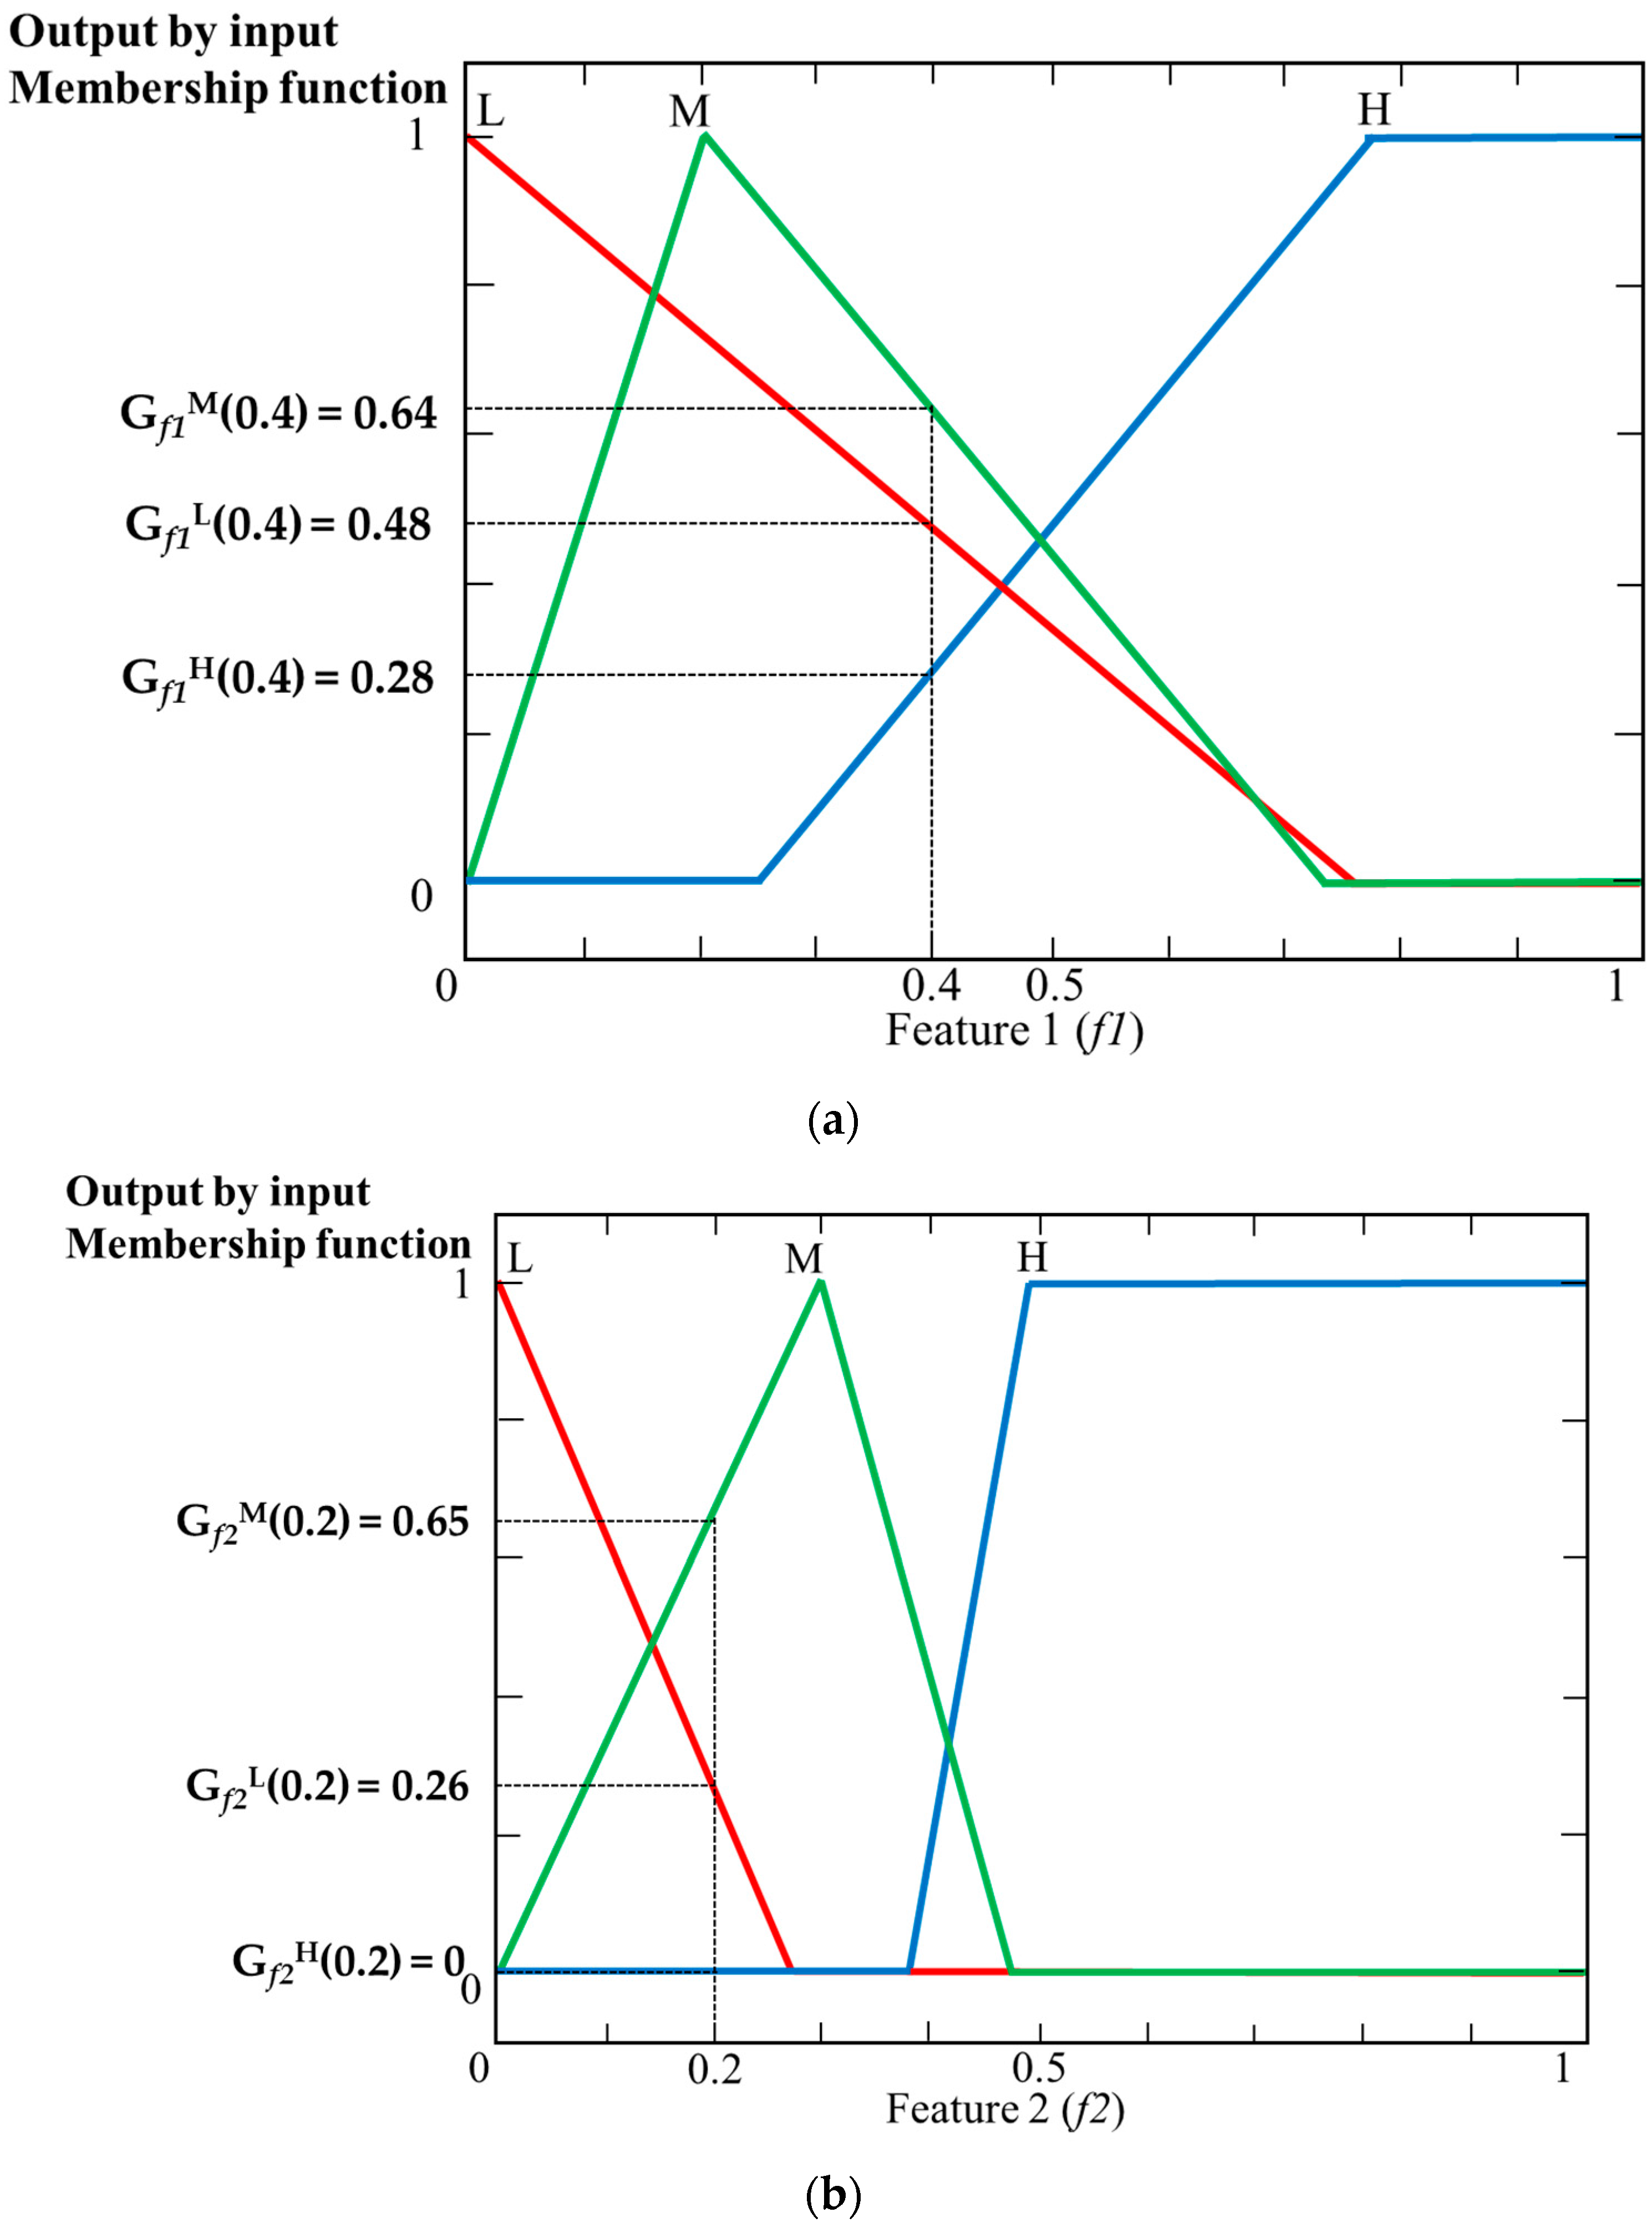
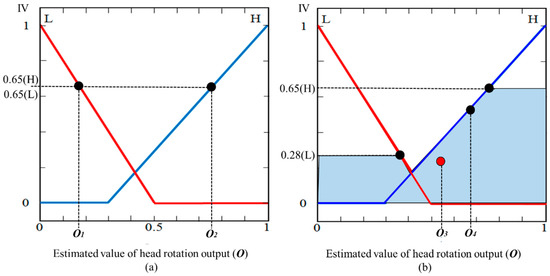
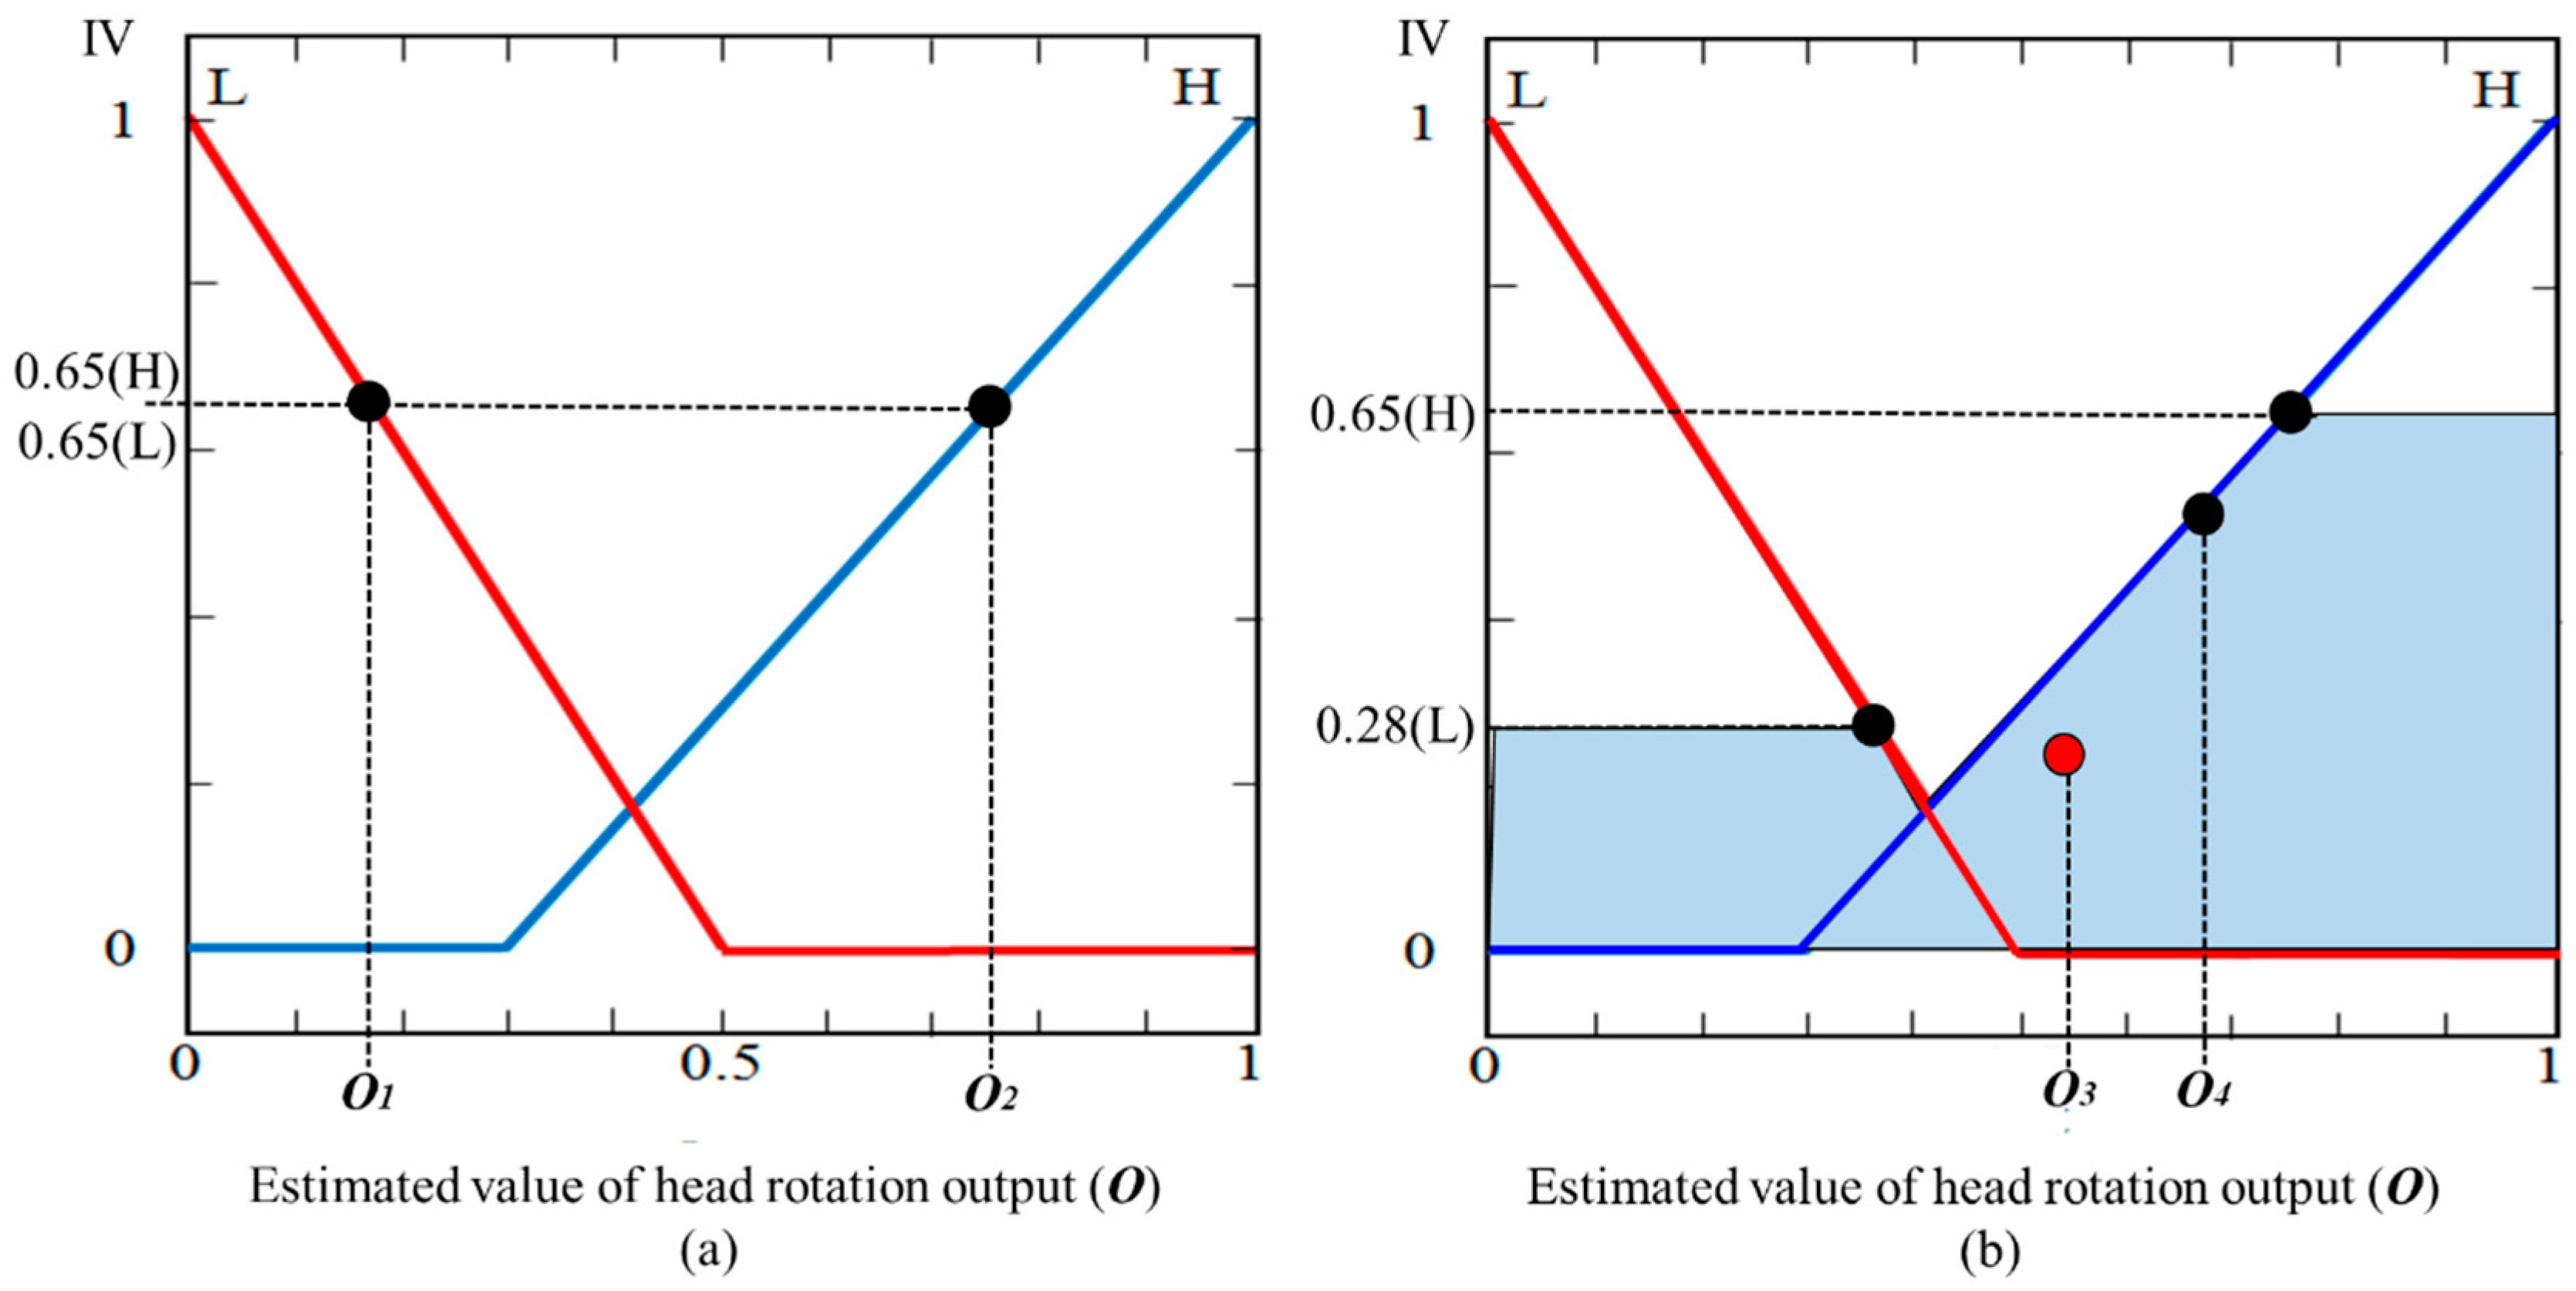
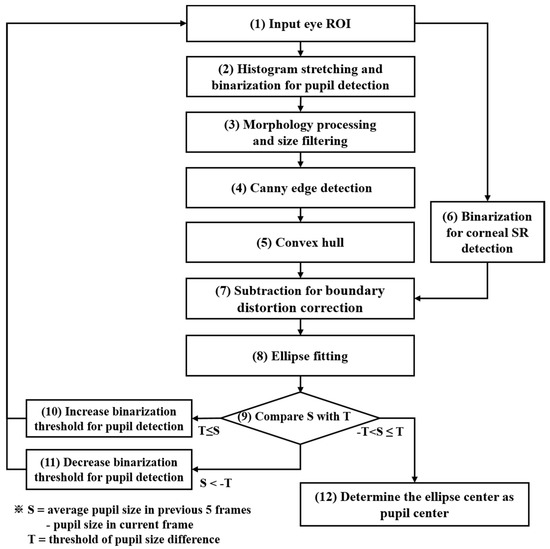
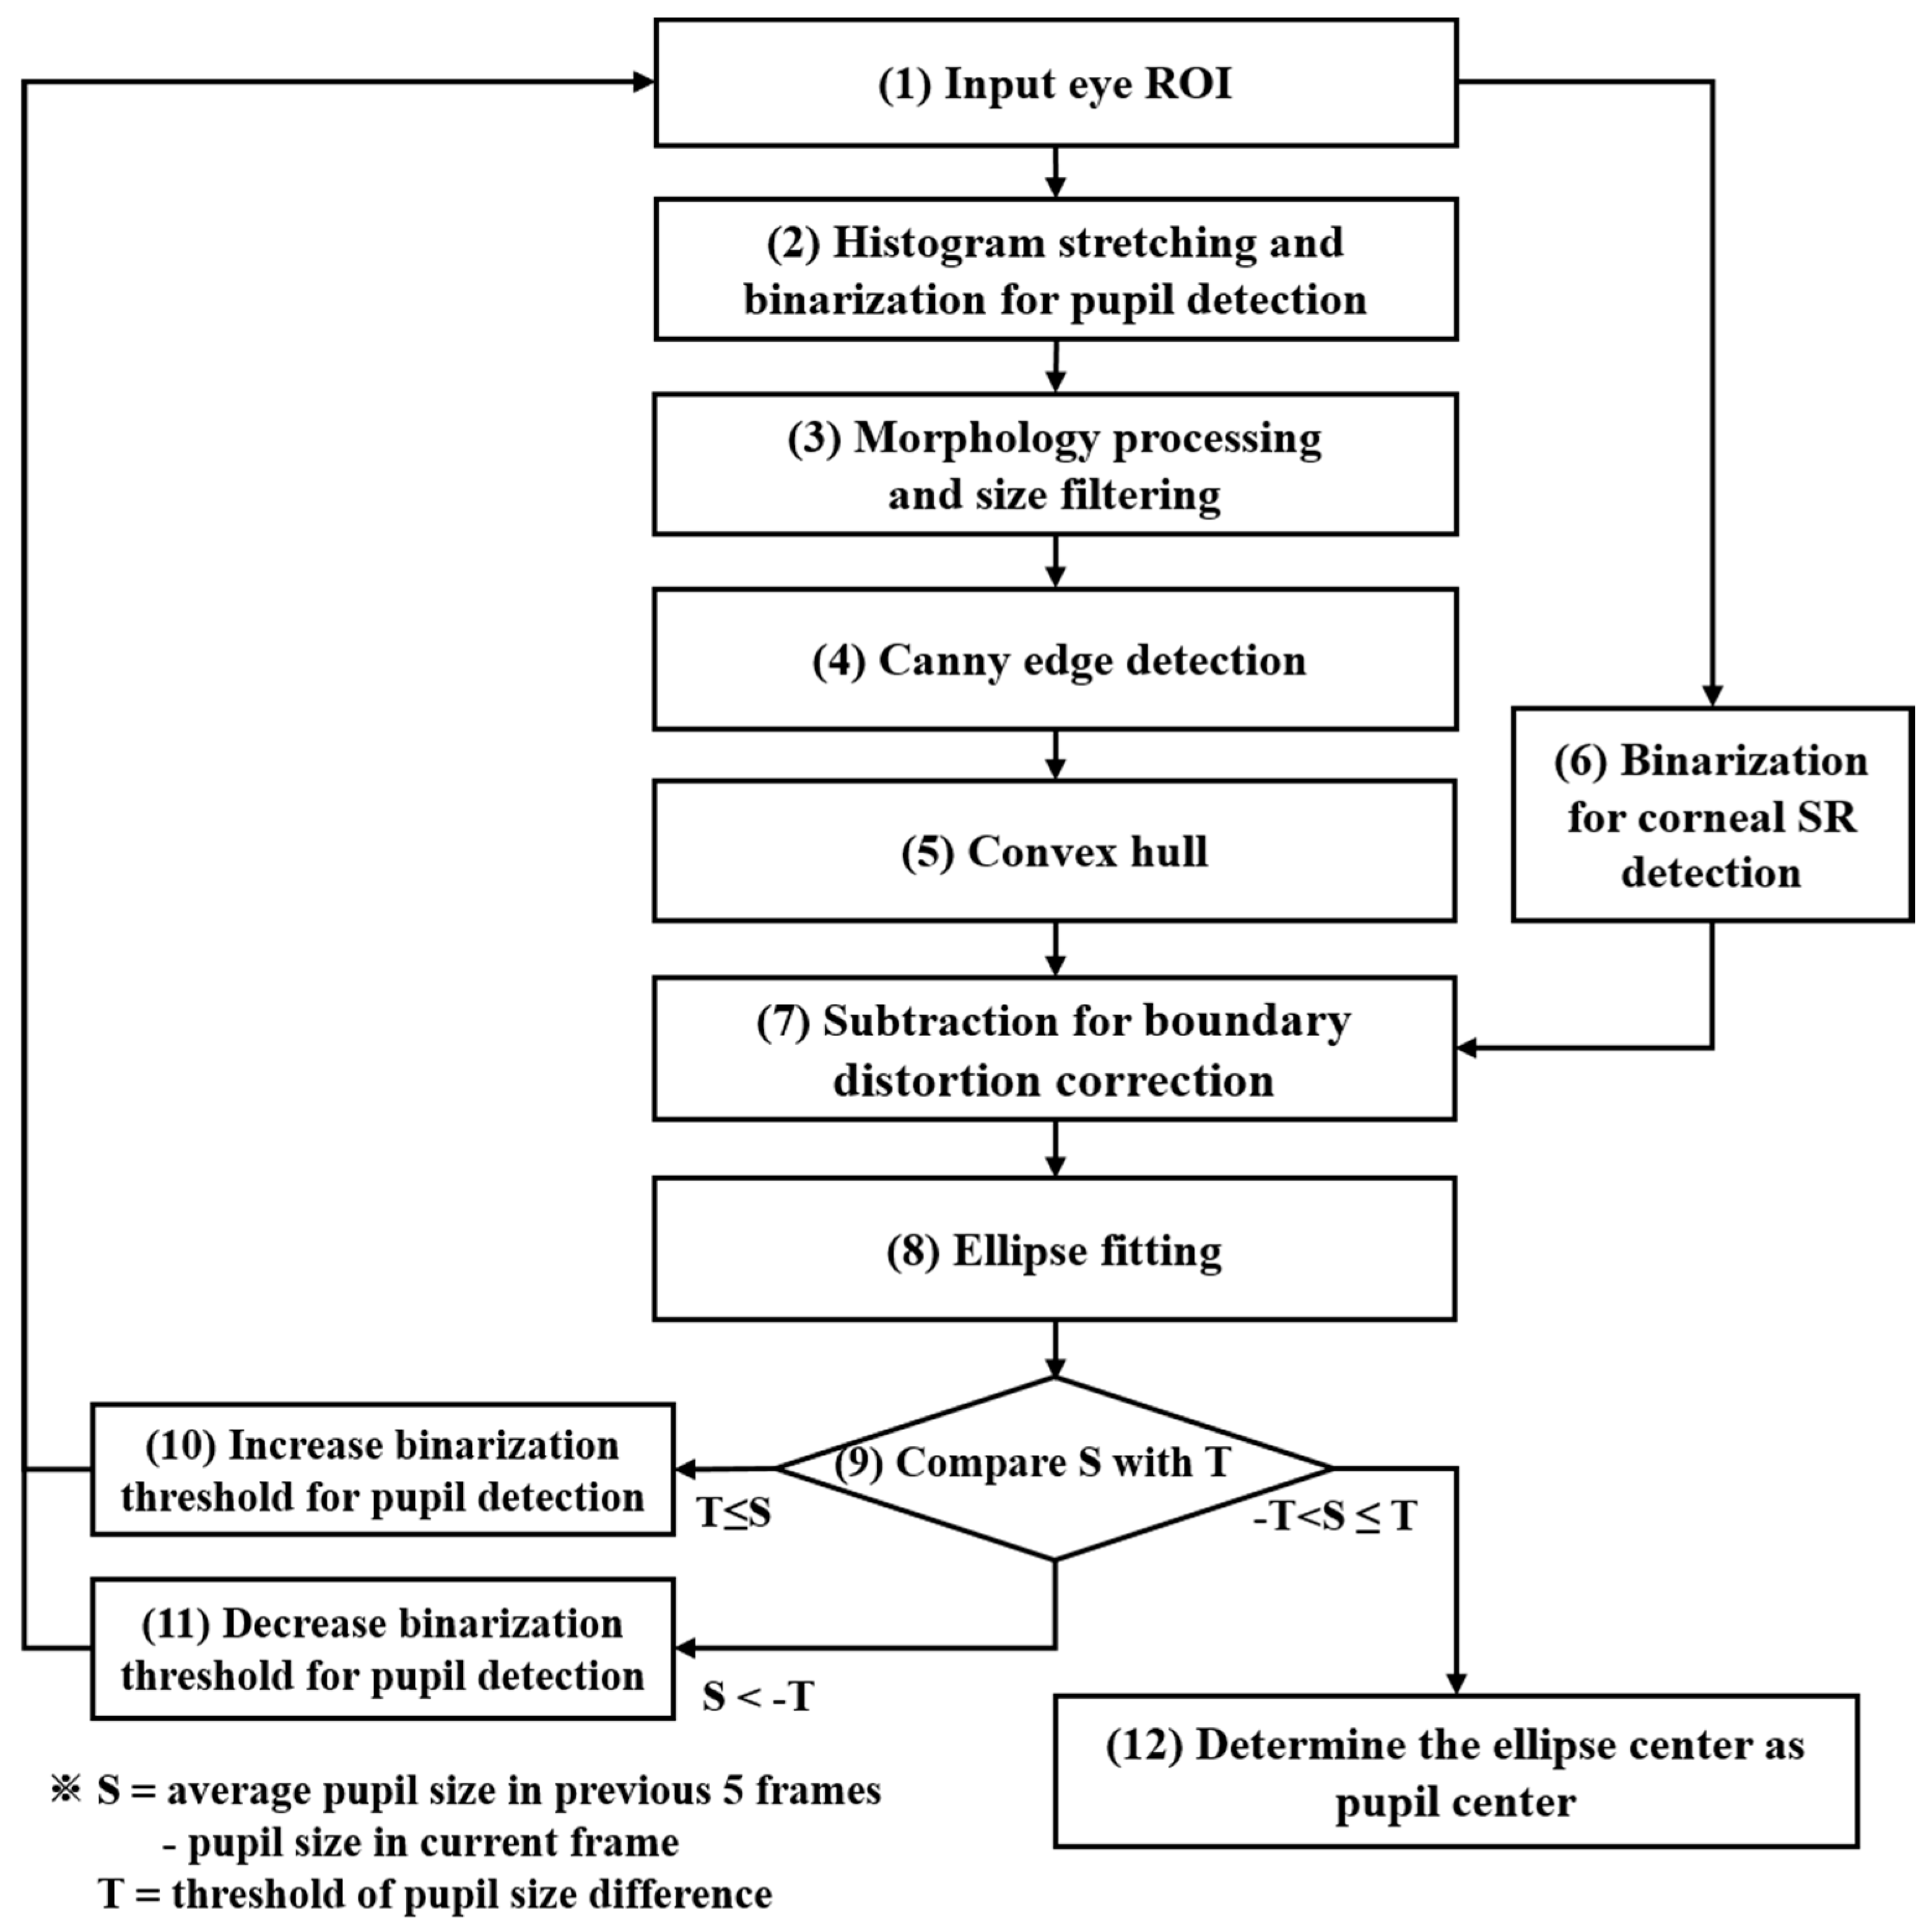
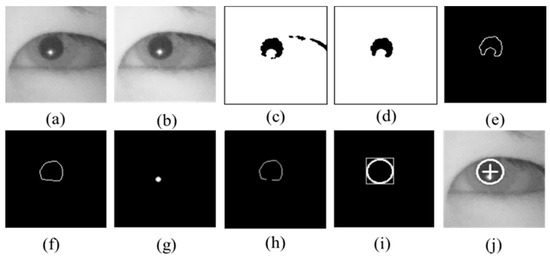
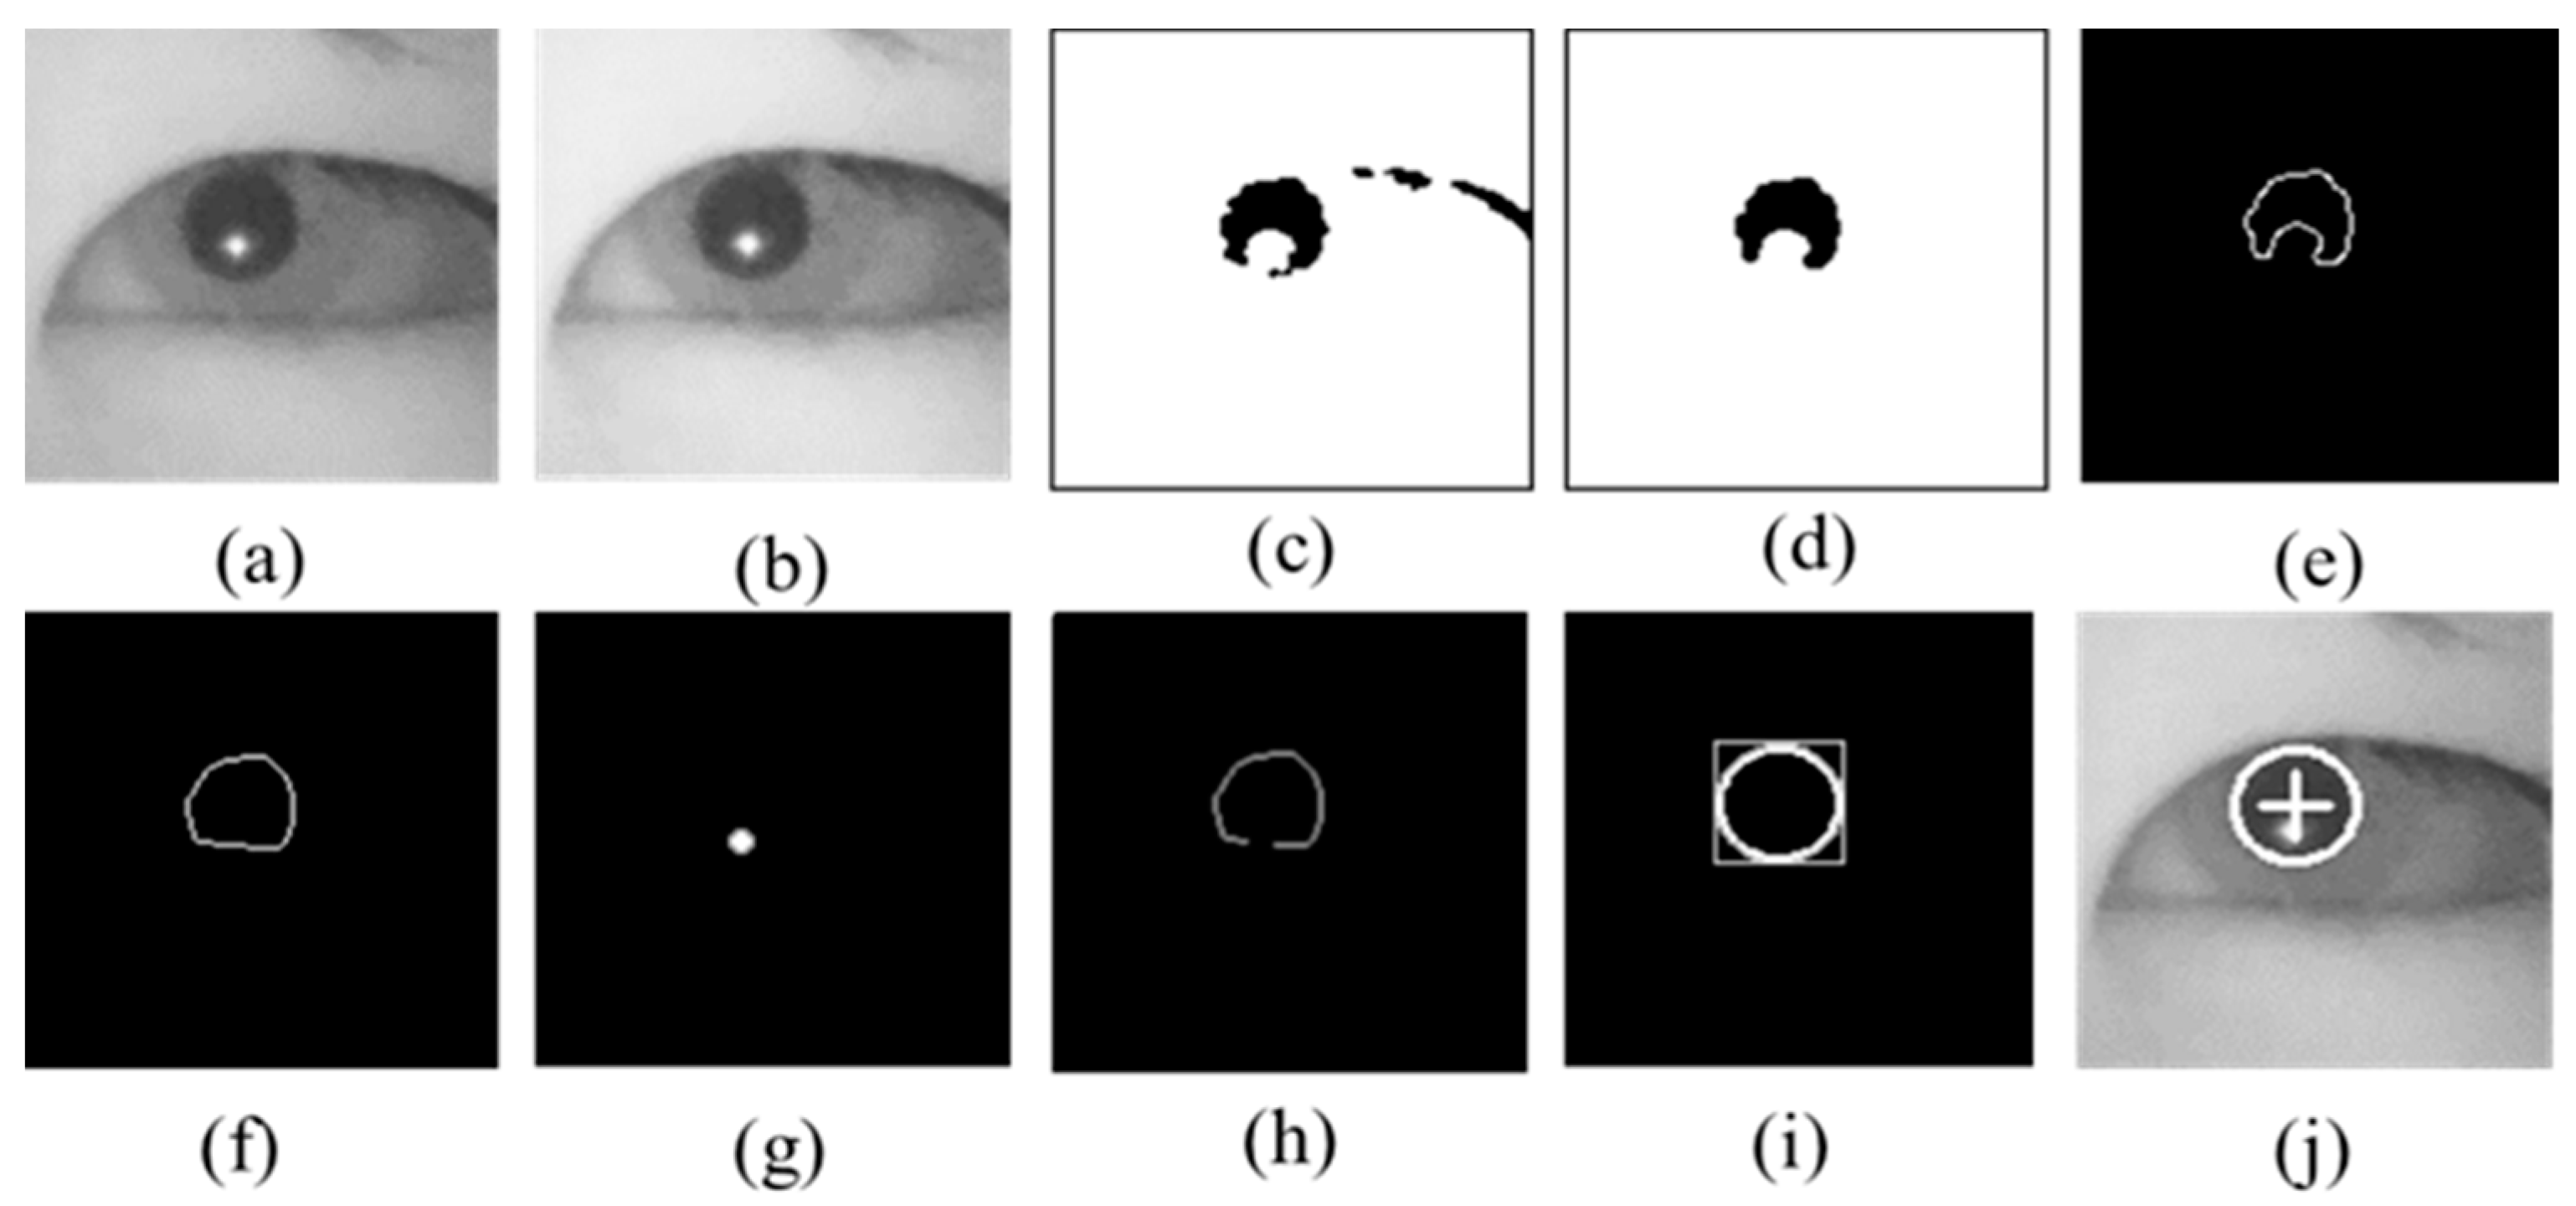
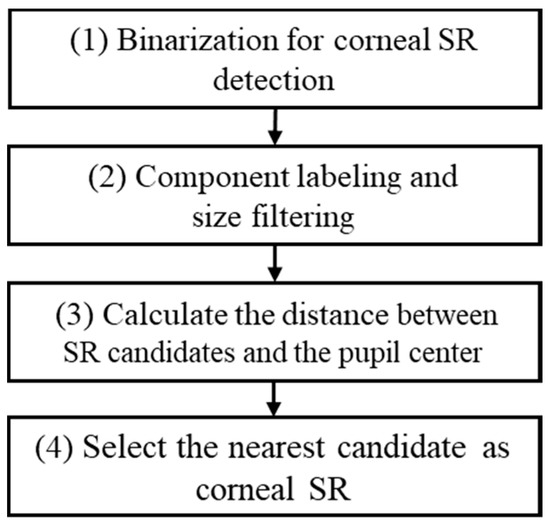
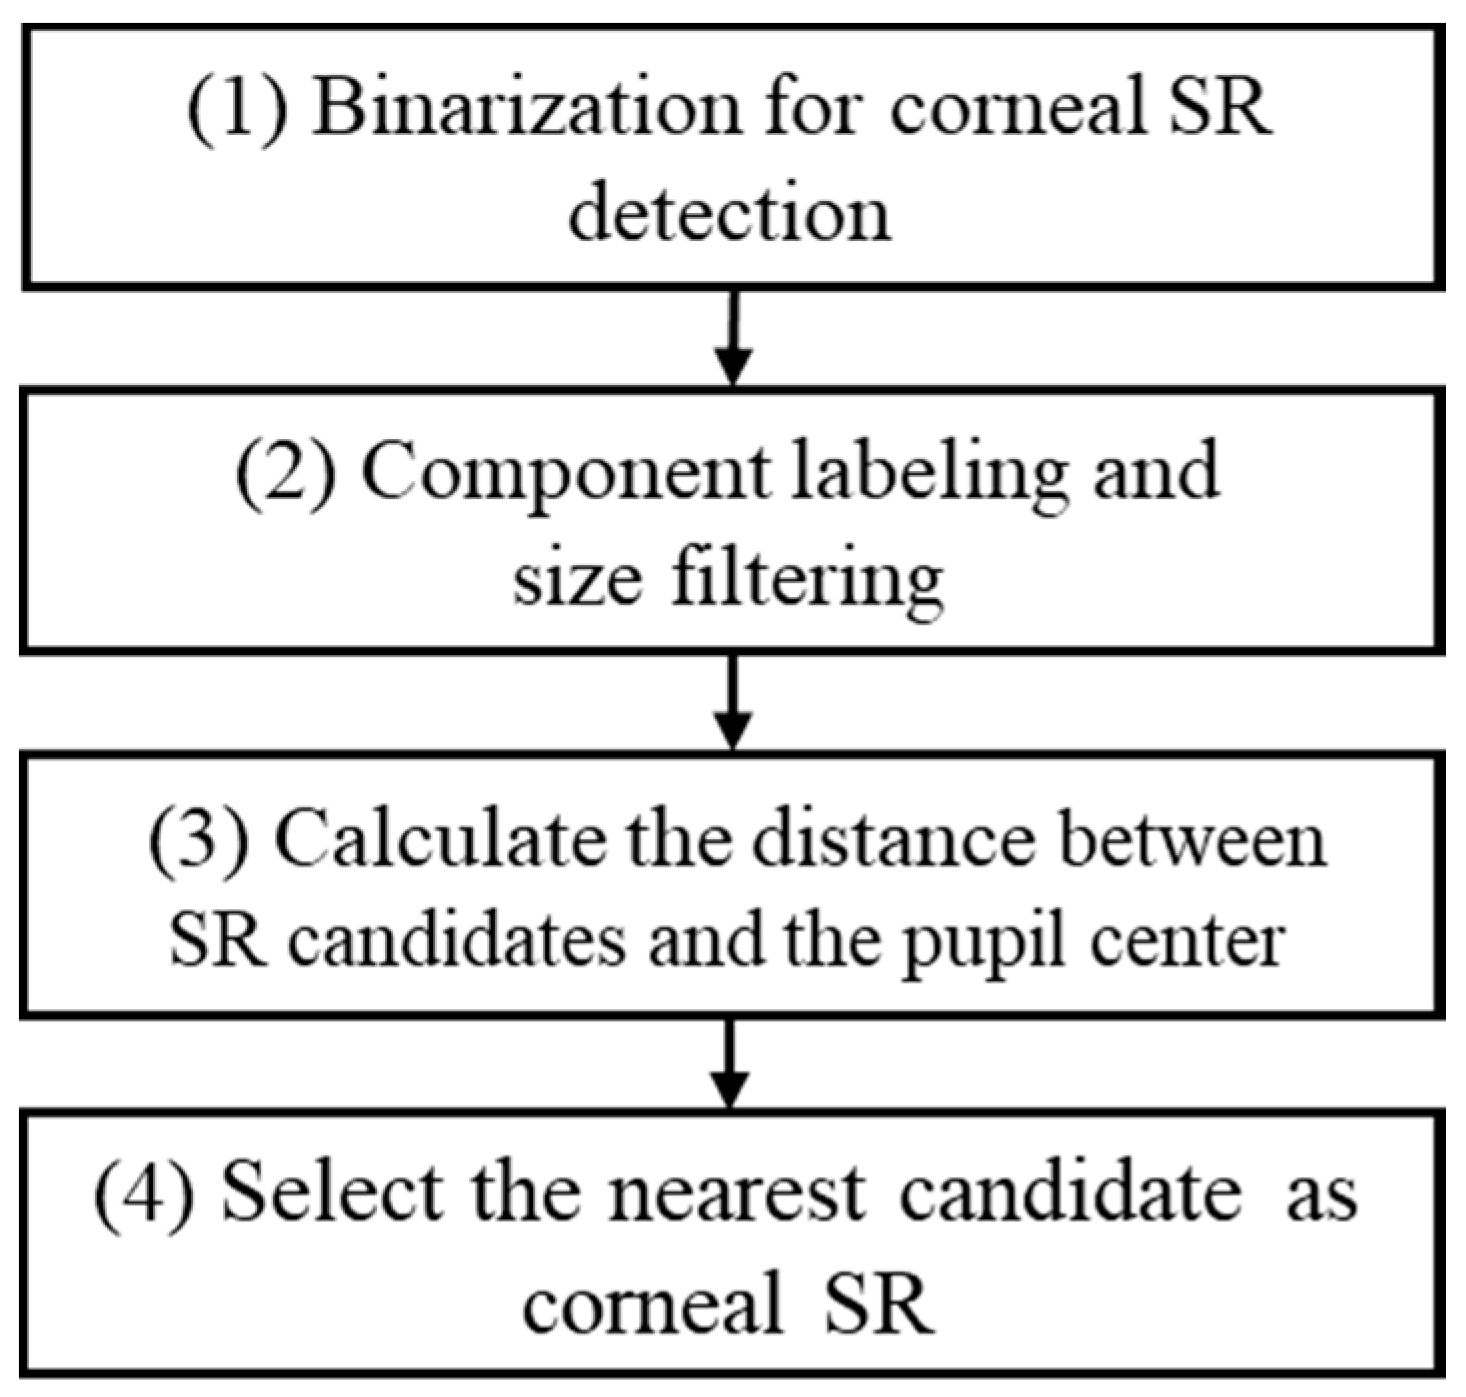
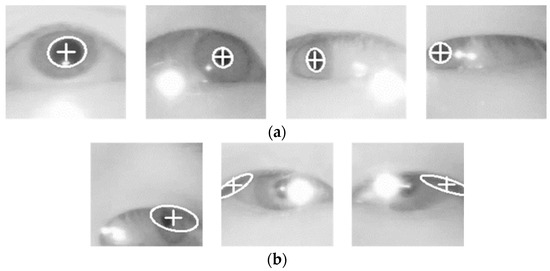
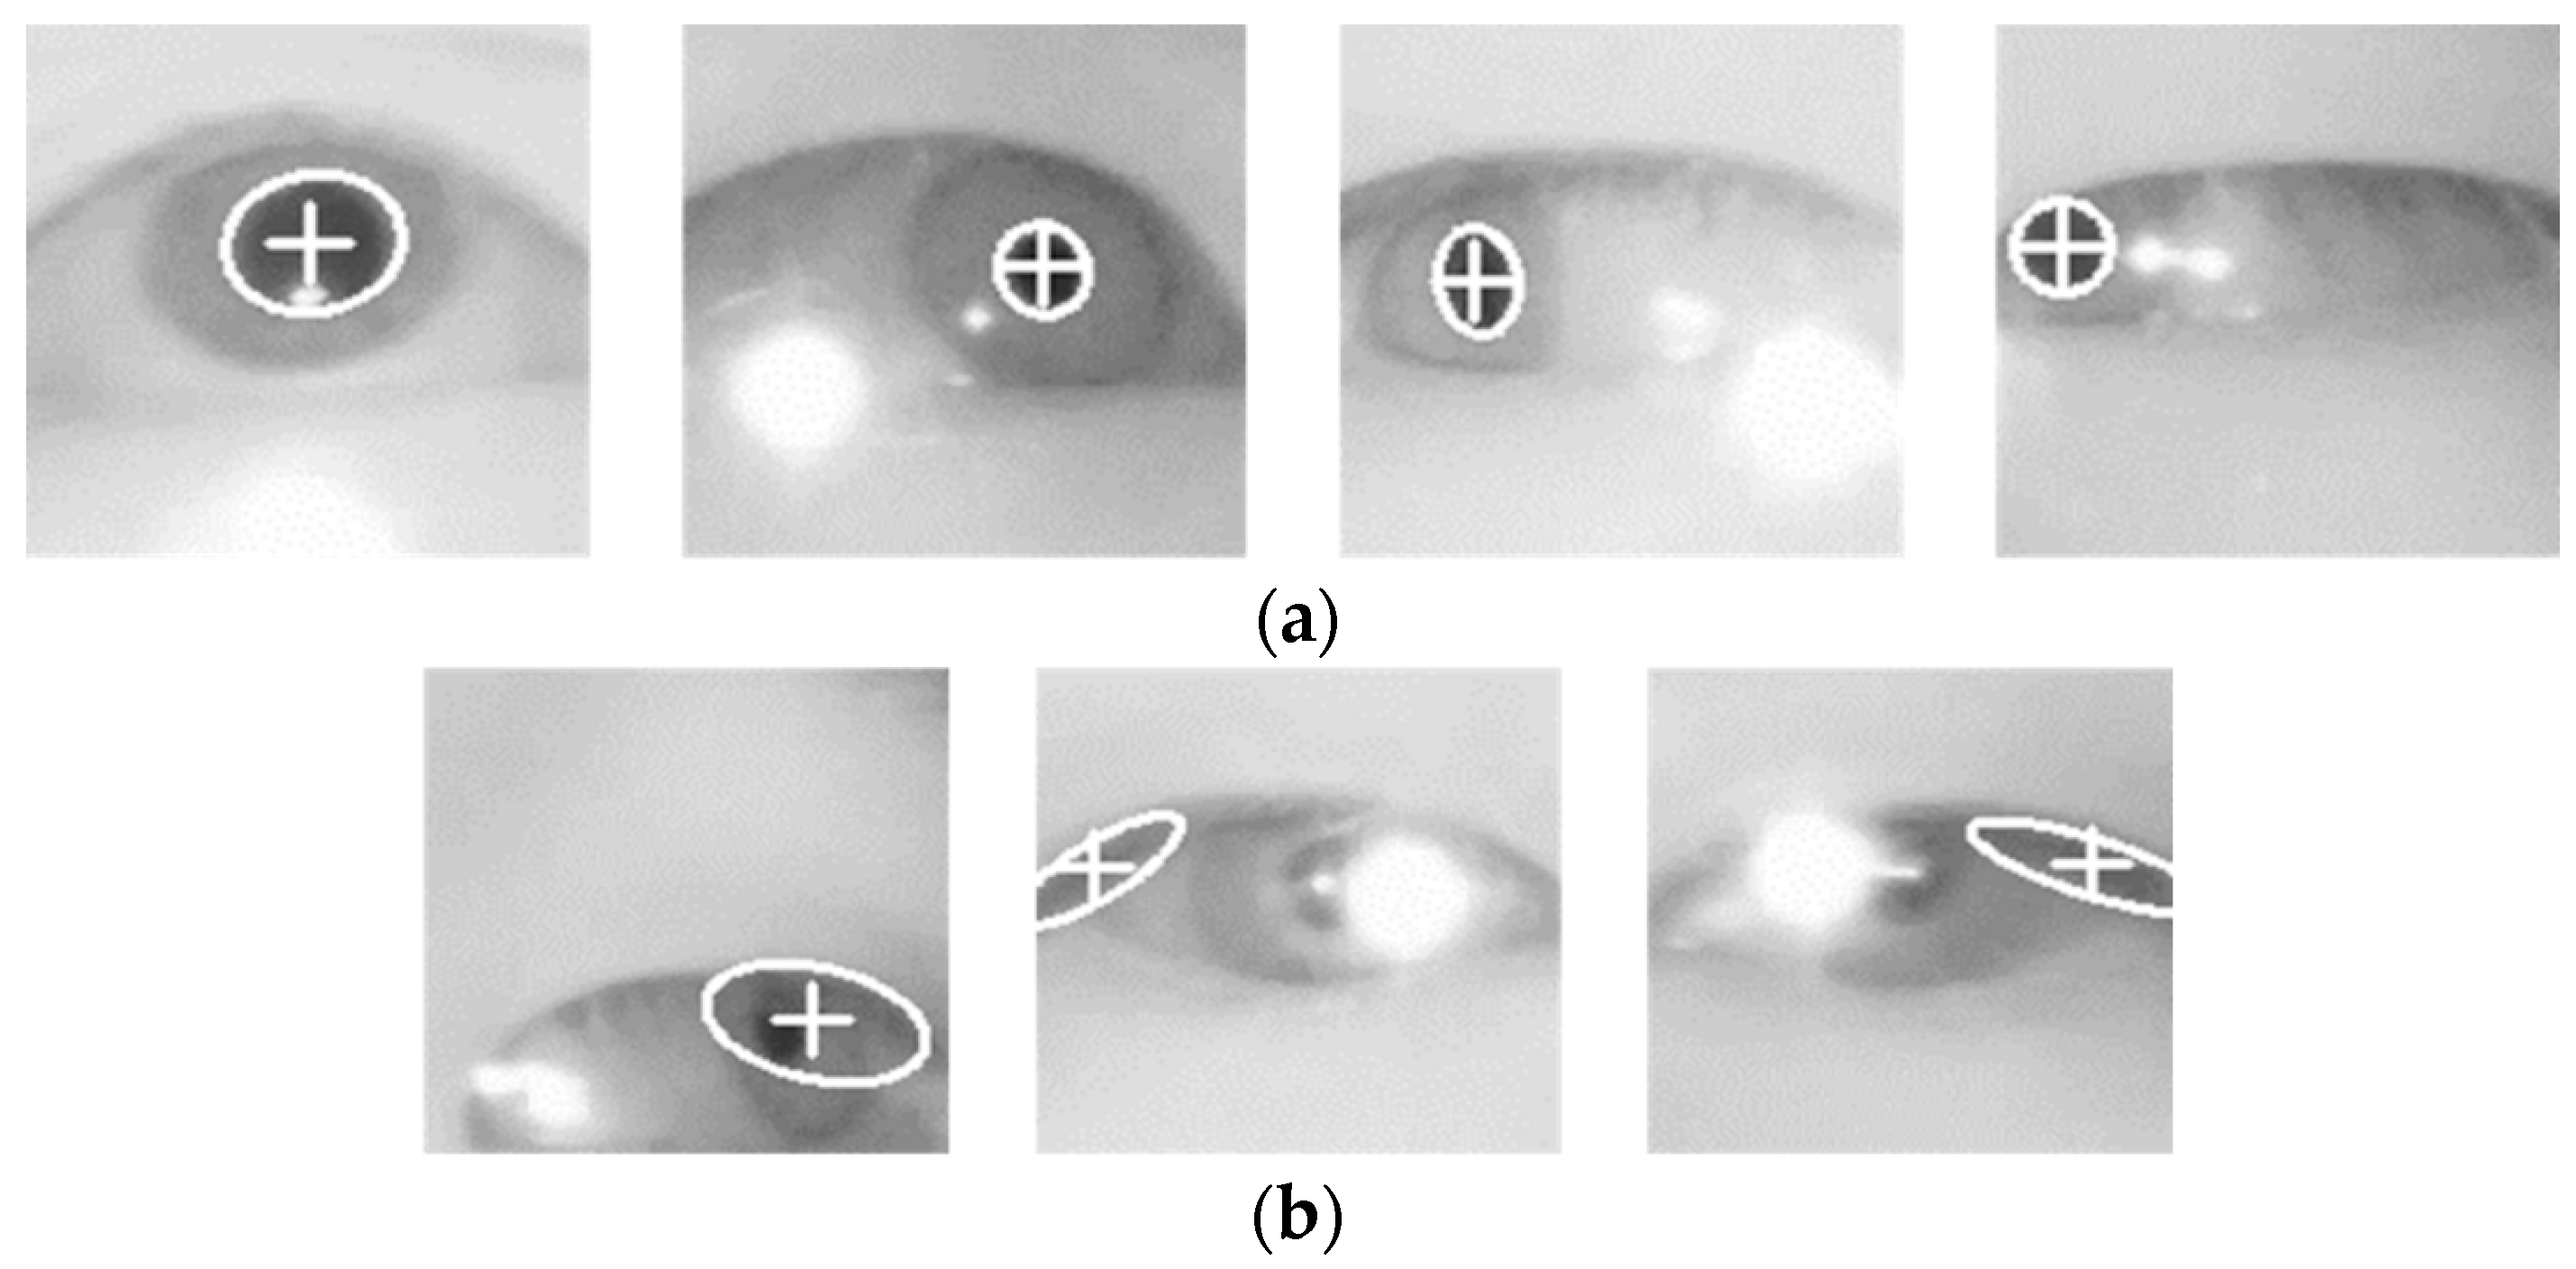
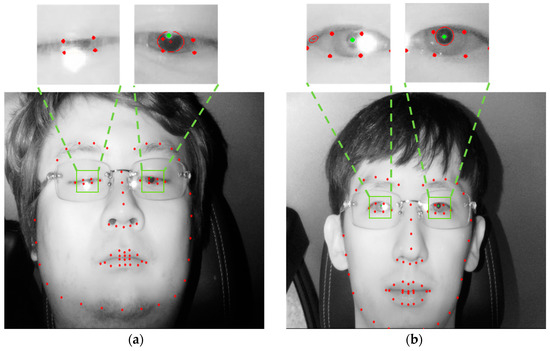
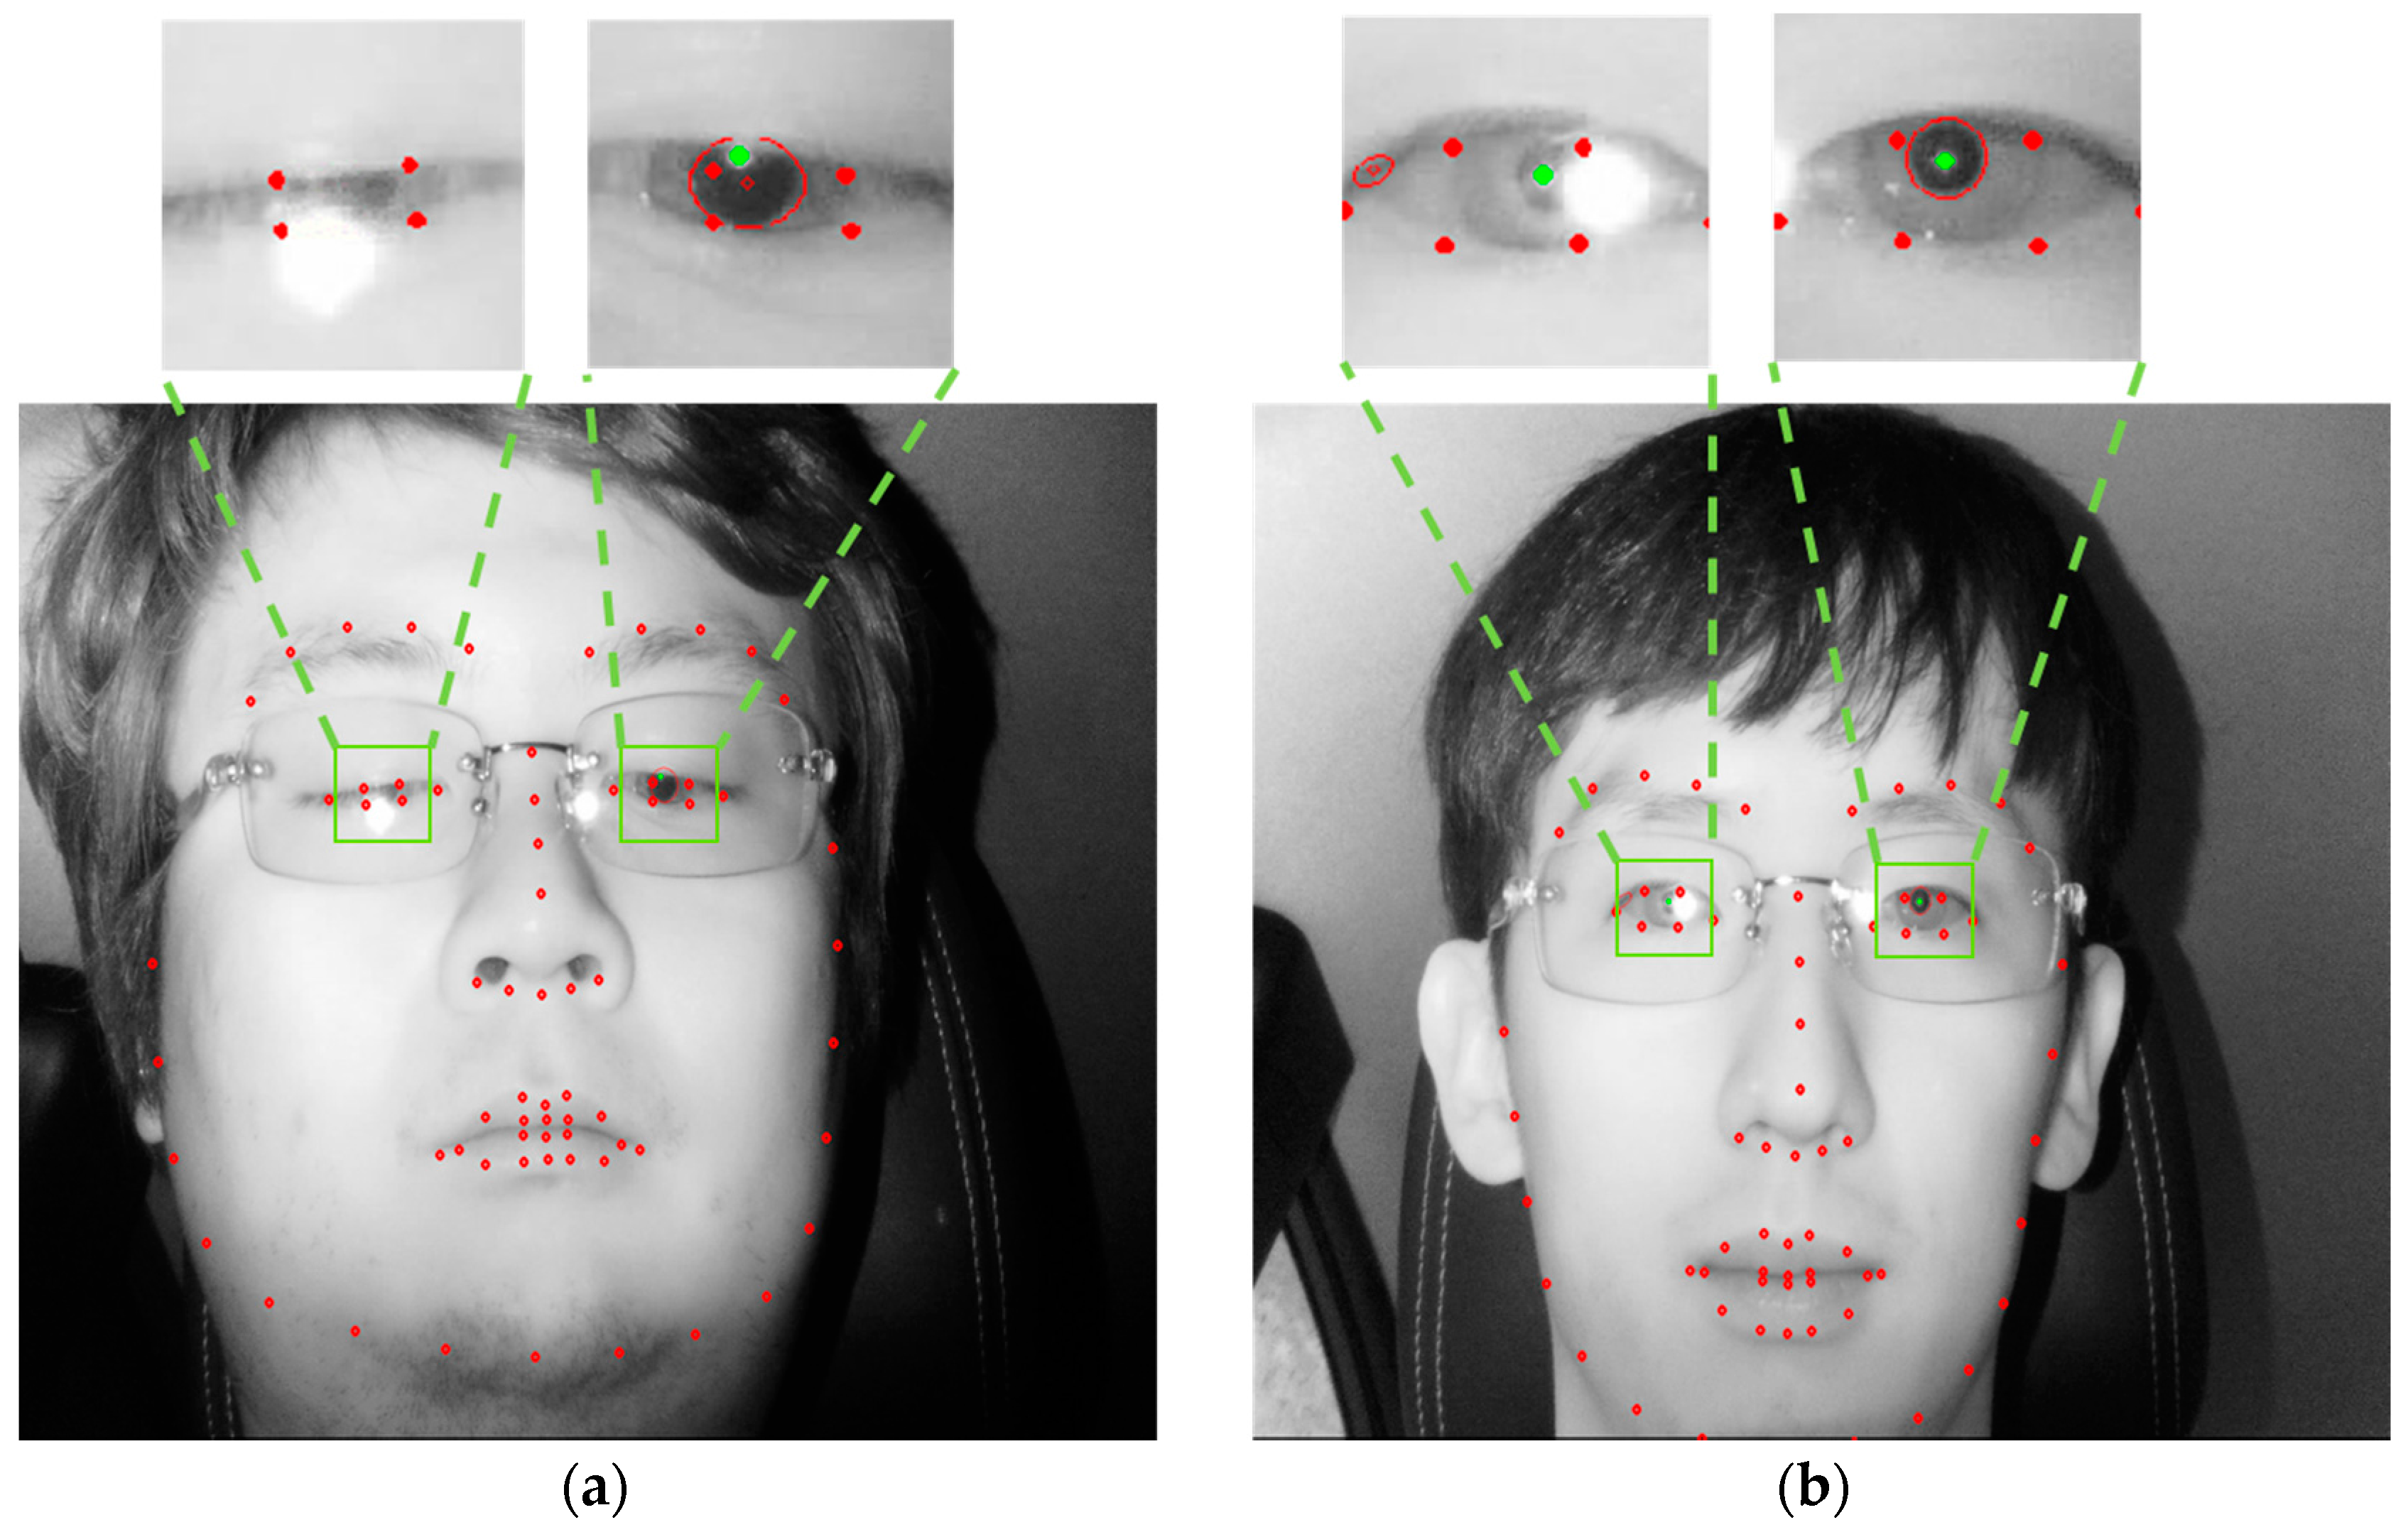
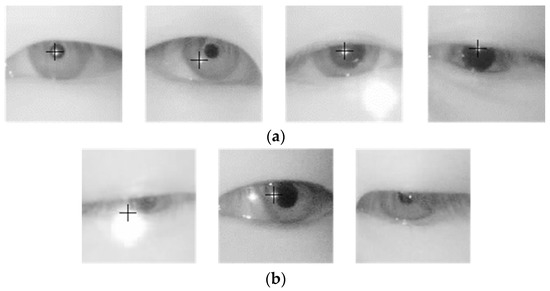
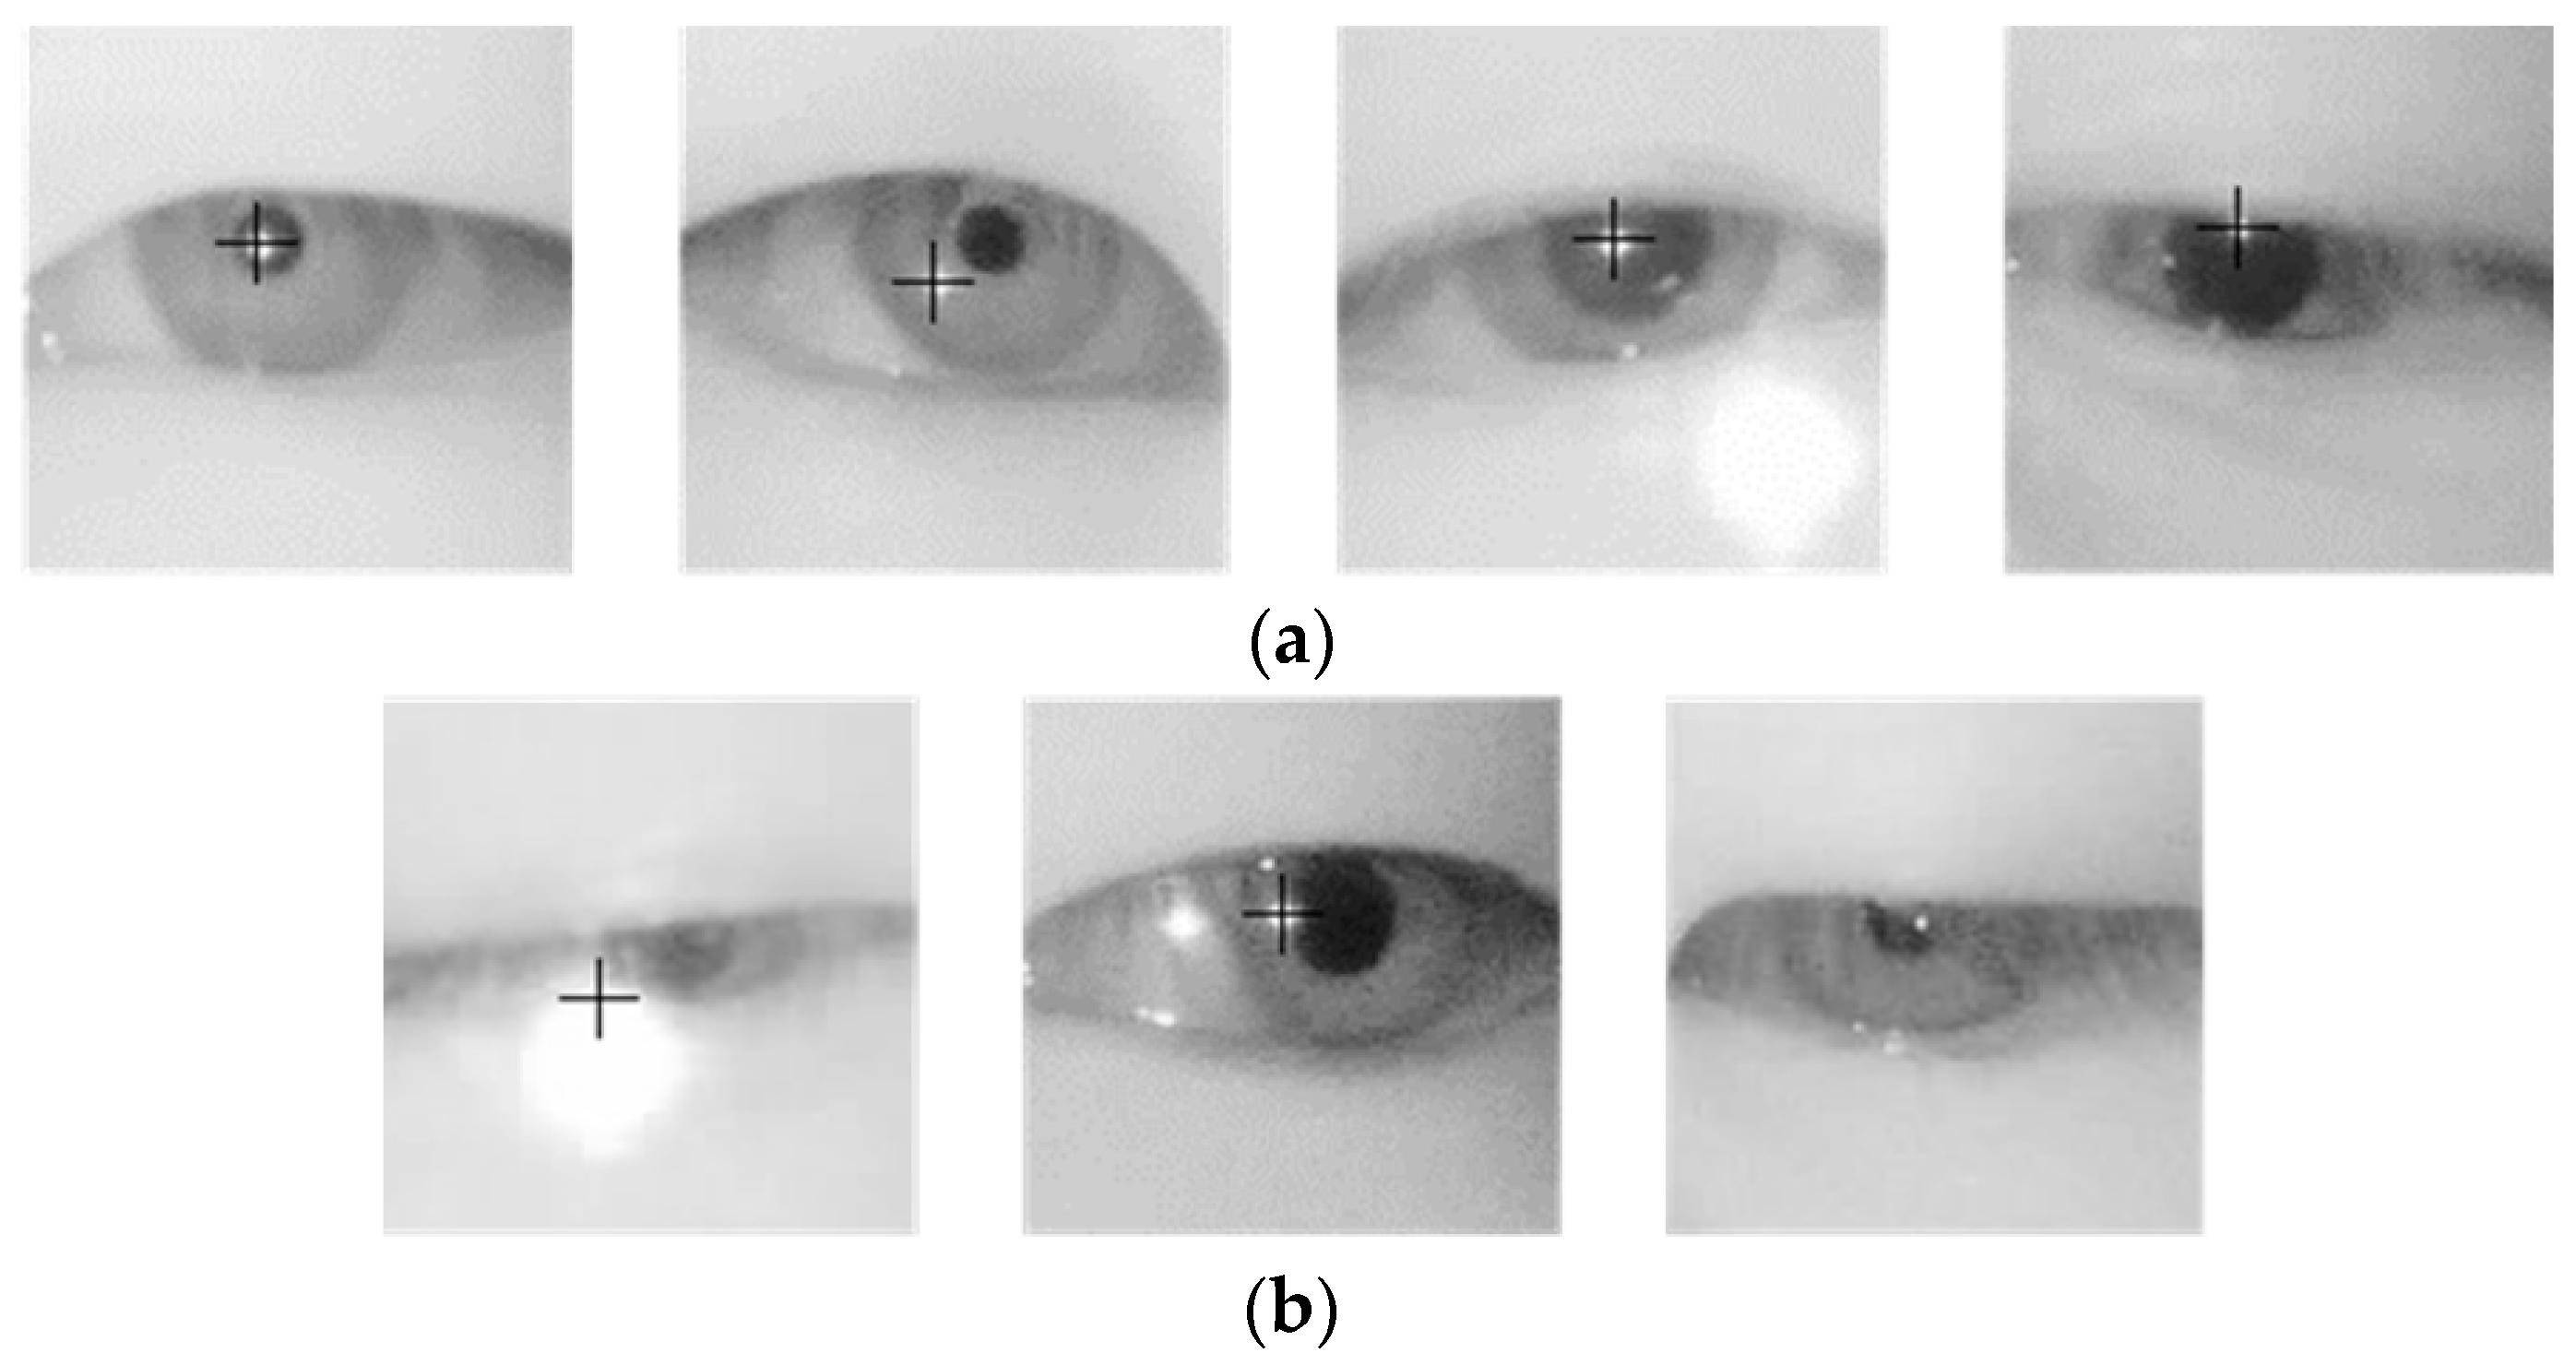

© 2017 by the authors. Licensee MDPI, Basel, Switzerland. This article is an open access article distributed under the terms and conditions of the Creative Commons Attribution (CC BY) license (http://creativecommons.org/licenses/by/4.0/).