Article

Power Spectral Deviation-Based Voice Activity Detection Incorporating Teager Energy for Speech Enhancement

1
Department of Electronic Engineering, Inha University, Incheon 402-751, Korea
2
Korea Electrotechnology Research Institute (KERI), 111 Hanggaul ro, Sangrok Gu, An-San shi, Kyunggi Do 426-170, Korea
3
Department of Electrical and Electronic Engineering, Xi’an Jiaotong-Liverpool University, Suzhou 215000, China
*
Author to whom correspondence should be addressed.
Symmetry 2016, 8(7), 58; https://doi.org/10.3390/sym8070058
Submission received: 11 April 2016 / Accepted: 1 July 2016 / Published: 6 July 2016
(This article belongs to the Special Issue Symmetry in Systems Design and Analysis)

Abstract

:
In this paper, we propose a robust voice activity detection (VAD) algorithm to effectively distinguish speech from non-speech in various noisy environments. The proposed VAD utilizes power spectral deviation (PSD), using Teager energy (TE) to provide a better representation of the PSD, resulting in improved decision performance for speech segments. In addition, the TE-based likelihood ratio and speech absence probability are derived in each frame to modify the PSD for further VAD. We evaluate the performance of the proposed VAD algorithm by objective testing in various environments and obtain better results that those attained by of the conventional methods.

1. Introduction

In speech signal processing, such as speech recognition and noise suppression (NS), the role of voice activity detection (VAD) algorithms is crucial for better performance in noisy environments [1]. To determine the presence or absence of speech, VAD algorithms are usually designed using certain decision rules that are derived from feature parameters that distinguish speech segments from other waveforms. To improve VAD performance, a feature parameter that can sufficiently specify the characteristics of speech and be robust in noisy environments is urgently needed. Traditionally, parameters that specify the characteristics of speech are based on short-time energy, spectral energy, or zero-crossing rate (ZCR). All of these parameters, however, are sensitive to noise and cannot fully specify the characteristics of a speech signal. Therefore, several other parameters have also been proposed, including power spectral deviation (PSD), linear prediction coefficients (LPCs), likelihood ratio (LR), and pitch [2,3]. Although these parameters are quite effective in expressing the characteristics of a speech signal, VAD performance using such parameters remains poor in adverse environments.
In this paper, we propose a novel approach to VAD algorithm, in which the PSD based on Teager energy (TE) [4,5], is derived in order to represent the improvement difference between speech and a noise signal in temporal statistical variations, instead of conventional PSD, which is used as one of the features for VAD in the IS-127 noise suppression algorithm and is known to provide robust performance under noisy conditions [2]. It has been experimentally observed that the TE operator can enhance discriminability between speech and noise and further suppress noise components [5,6]. Additionally, in the proposed method, the LR based on TE is used as a weighting factor and the speech absence probability (SAP) derived from the TE-based LR is adopted as a smoothing parameter for further improved PSD modification in various noisy environments [3,7]. The performance of the proposed algorithm is evaluated by an objective comparison and is demonstrated to be better than the conventional method.

2. Review of Teager Energy

In this section, we briefly review the Teager energy (TE) operator, which is used successfully in various speech applications. For a discrete speech signal x ( n ) , the TE operation is defined, as given by [4,5]:
Ψ d [ x ( n ) ] = x ( n ) 2 x ( n + 1 ) x ( n 1 )
In practice, the clean speech signal x ( n ) is corrupted by the additive noise signal d ( n ) . Assuming that speech is degraded by uncorrelated additive noise, the observed noisy speech signal y ( n ) is given by:
y ( n ) = x ( n ) + d ( n )
where x ( n ) and d ( n ) are zero-mean and independent. Based on this, the TE of y ( n ) is obtained by:
Ψ d [ y ( n ) ] = Ψ d [ x ( n ) ] + Ψ d [ d ( n ) ] + 2 Ψ ˜ d [ x ( n ) , d ( n ) ]
where Ψ d [ y ( n ) ] , Ψ d [ x ( n ) ] , and Ψ d [ d ( n ) ] are the TE of noisy speech, clean speech and additive noise, respectively. Further, the cross-TE Ψ ˜ d [ x ( n ) , d ( n ) ] of x ( n ) and d ( n ) can be computed as follows:
Ψ ˜ d [ x ( n ) , d ( n ) ] = x ( n ) d ( n ) 0.5 x ( n 1 ) d ( n + 1 ) 0.5 x ( n + 1 ) d ( n 1 )
Since x ( n ) and d ( n ) are zero-mean and independent, the expected value of the cross-TE is zero. Thus, the expected value of Ψ d [ y ( n ) ] is approximated as follows:
E { Ψ d [ y ( n ) ] } = E { Ψ d [ x ( n ) } + E { Ψ d [ d ( n ) }
In fact, the TE of clean speech is much higher than that of noise. Therefore, Ψ d [ d ( n ) ] is negligible compared to Ψ d [ x ( n ) ] as given by [4]:
E { Ψ d [ y ( n ) ] } E { Ψ d [ x ( n ) }
For this reason, the corrupted noise signal can be suppressed by the TE operator and feature parameters that allow better discrimination between speech and noise to be obtained from the enhanced signal.

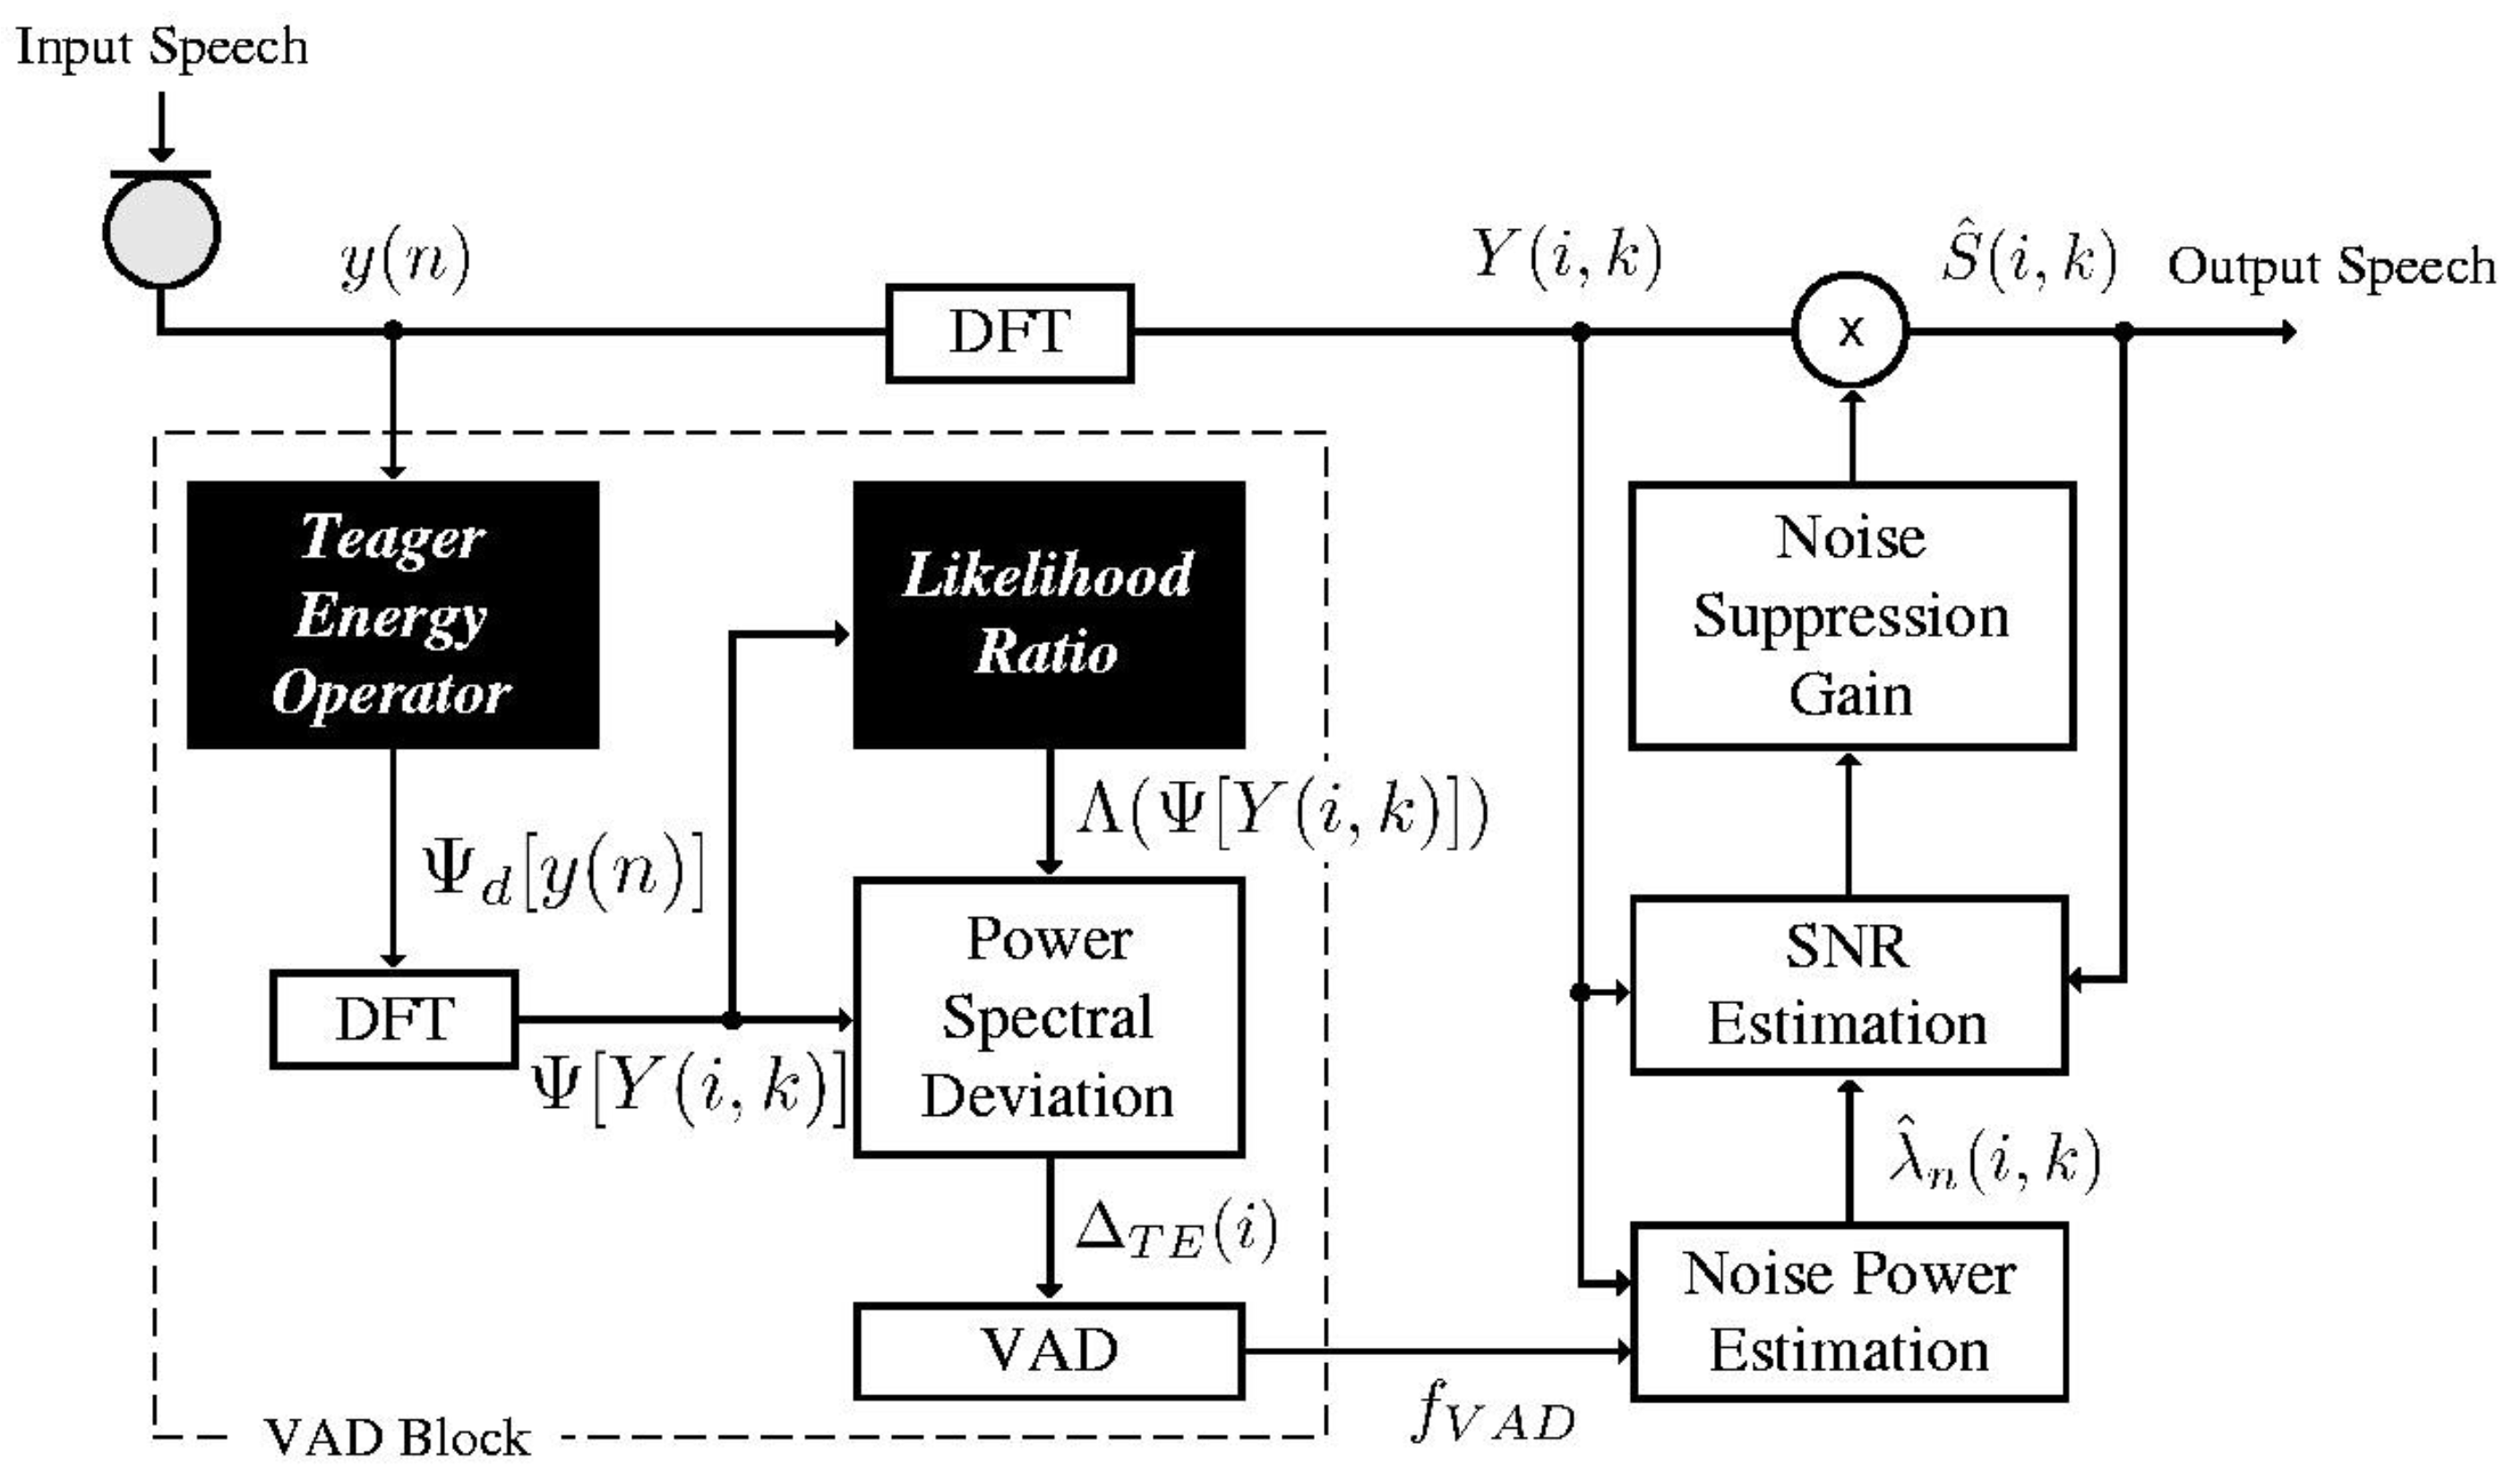
3. Proposed VAD Algorithm Based on the Power Spectral Deviation of Teager Energy

In the previous section, we noted that the TE operator provides better discriminability of speech from noise compared with other methods. Based on this, we propose a novel VAD algorithm using PSD based on TE. We consider TE-based PSD (TE-PSD) for the feature parameter of VAD, in which the TE-based LR and SAP are introduced to modify the proposed PSD. Figure 1 presents an overall block diagram of the proposed VAD algorithm. For this, the proposed TE-PSD Δ T E ( i ) is derived by:
Δ T E ( i ) = log 10 ( β ( i ) M k = 1 M | Y T E ( i , k ) Y ¯ T E ( i , k ) | )
where M (=16) denotes the total band size of each frame and Y T E ( i , k ) with time index i and frequency index k represents the estimated power spectrum | Ψ [ Y ( i , k ) ] | 2 of noisy speech based on TE. Here, Ψ [ Y ( i , k ) ] denotes an estimate of the Fourier spectrum of noisy speech based on TE, compared to the conventional Fourier spectrum Y ( i , k ) in the discrete Fourier transform domain. In Equation (7), β ( i ) is the weighting factor used to achieve improved performance on the PSD and is derived from Ψ [ Y ( i , k ) ] as follows [8]:
β ( i ) = k = 1 M Λ ( Ψ [ Y ( i , k ) ] )
where Λ ( Ψ [ Y ( i , k ) ] ) is the TE-based LR computed in the k th frequency bin under the assumption that noise and speech are statistically independent and characterized by zero-mean complex Gaussian distributions as given by [3,8]:
Λ ( Ψ [ Y ( i , k ) ] ) p ( Ψ [ Y ( i , k ) ] | H 1 ) p ( Ψ [ Y ( i , k ) ] | H 0 ) = 1 1 + ς ( i , k ) exp [ η ( i , k ) ς ( i , k ) 1 + ς ( i , k ) ]
where the TE-based a posteriori signal-to-noise ratio (SNR) η ( i , k ) and the TE-based a priori SNR ς ( i , k ) are defined by [3,8]:
η ( i , k ) | Ψ [ Y ( i , k ) ] | 2 σ d ( i , k ) , ς ( i , k ) σ x ( i , k ) σ d ( i , k )
In Equation (10), σ x ( i , k ) and σ d ( i , k ) are the variance of the speech and estimated noise, respectively, based on TE. Additionally, Y ¯ T E ( i , k ) in Equation (7) is the long-term smoothed power spectral estimate calculated during the previous sub-band. The proposed VAD algorithm is further improved by a smoothing parameter that uses SAP p ( H 0 | Ψ [ Y ( i ) ] ) based on TE for modifying Y ¯ T E ( i , k ) as follows:
Y ¯ T E ( i , k ) = ( 1 p ( H 0 | Ψ [ Y ( i ) ] ) ) Y ¯ T E ( i 1 , k ) + p ( H 0 | Ψ [ Y ( i ) ] ) Y T E ( i , k )
where H 0 ( = 1 H 1 ) indicates speech absence and p ( H 0 | Ψ [ Y ( i ) ] ) , which can be derived from Bayes’ rule is simply obtained by using the previous estimated weighting factor β ( i ) , such that [8]:
p ( H 0 | Ψ [ Y ( i ) ] ) = p ( H 0 ) k = 1 M p ( Ψ [ Y ( i , k ) ] | H 0 ) p ( H 0 ) k = 1 M p ( Ψ [ Y ( i , k ) ] | H 0 ) + p ( H 1 ) k = 1 M p ( Ψ [ Y ( i , k ) ] | H 1 ) = 1 1 + q k = 1 M Λ ( Ψ [ Y ( i , k ) ] ) = 1 1 + q β ( i )
in which q = p ( H 1 ) / p ( H 0 ) is set to 0.0625, which is the appropriate value chosen from experiments in order to obtain good performance in various noisy environments [8].
Finally, in the proposed VAD algorithm, speech segments are decided by the decision rule as follows:
f V A D = { s p e e c h , i f   Δ T E ( i ) > T n o n s p e e c h , o t h e r w i s e
In Figure 2, we give an example of the feature parameters estimated by the conventional method and by the proposed TE-PSD method. From Figure 2d,e, we can see that the feature parameters of the conventional scheme insufficiently discriminate between speech and noise, since the conventional LR [3] and PSD [2] are sensitive to noise. In contrast, it is evident that in noisy conditions, the proposed TE-based method yielded a better representation of the VAD decision compared with the conventional methods. Based on these results, from Figure 2f, it can be seen that the proposed VAD method performs well by taking advantage of the TE-based approach and allows the noise power estimate λ ^ n ( i , k ) to be updated by the decision rule in Equation (13) during non-speech with the following averaging rule:
λ ^ n ( i , k ) = α n λ ^ n ( i 1 , k ) + ( 1 α n ) | Y ( i , k ) | 2
in which the smoothing parameter α n is set to 0.9.

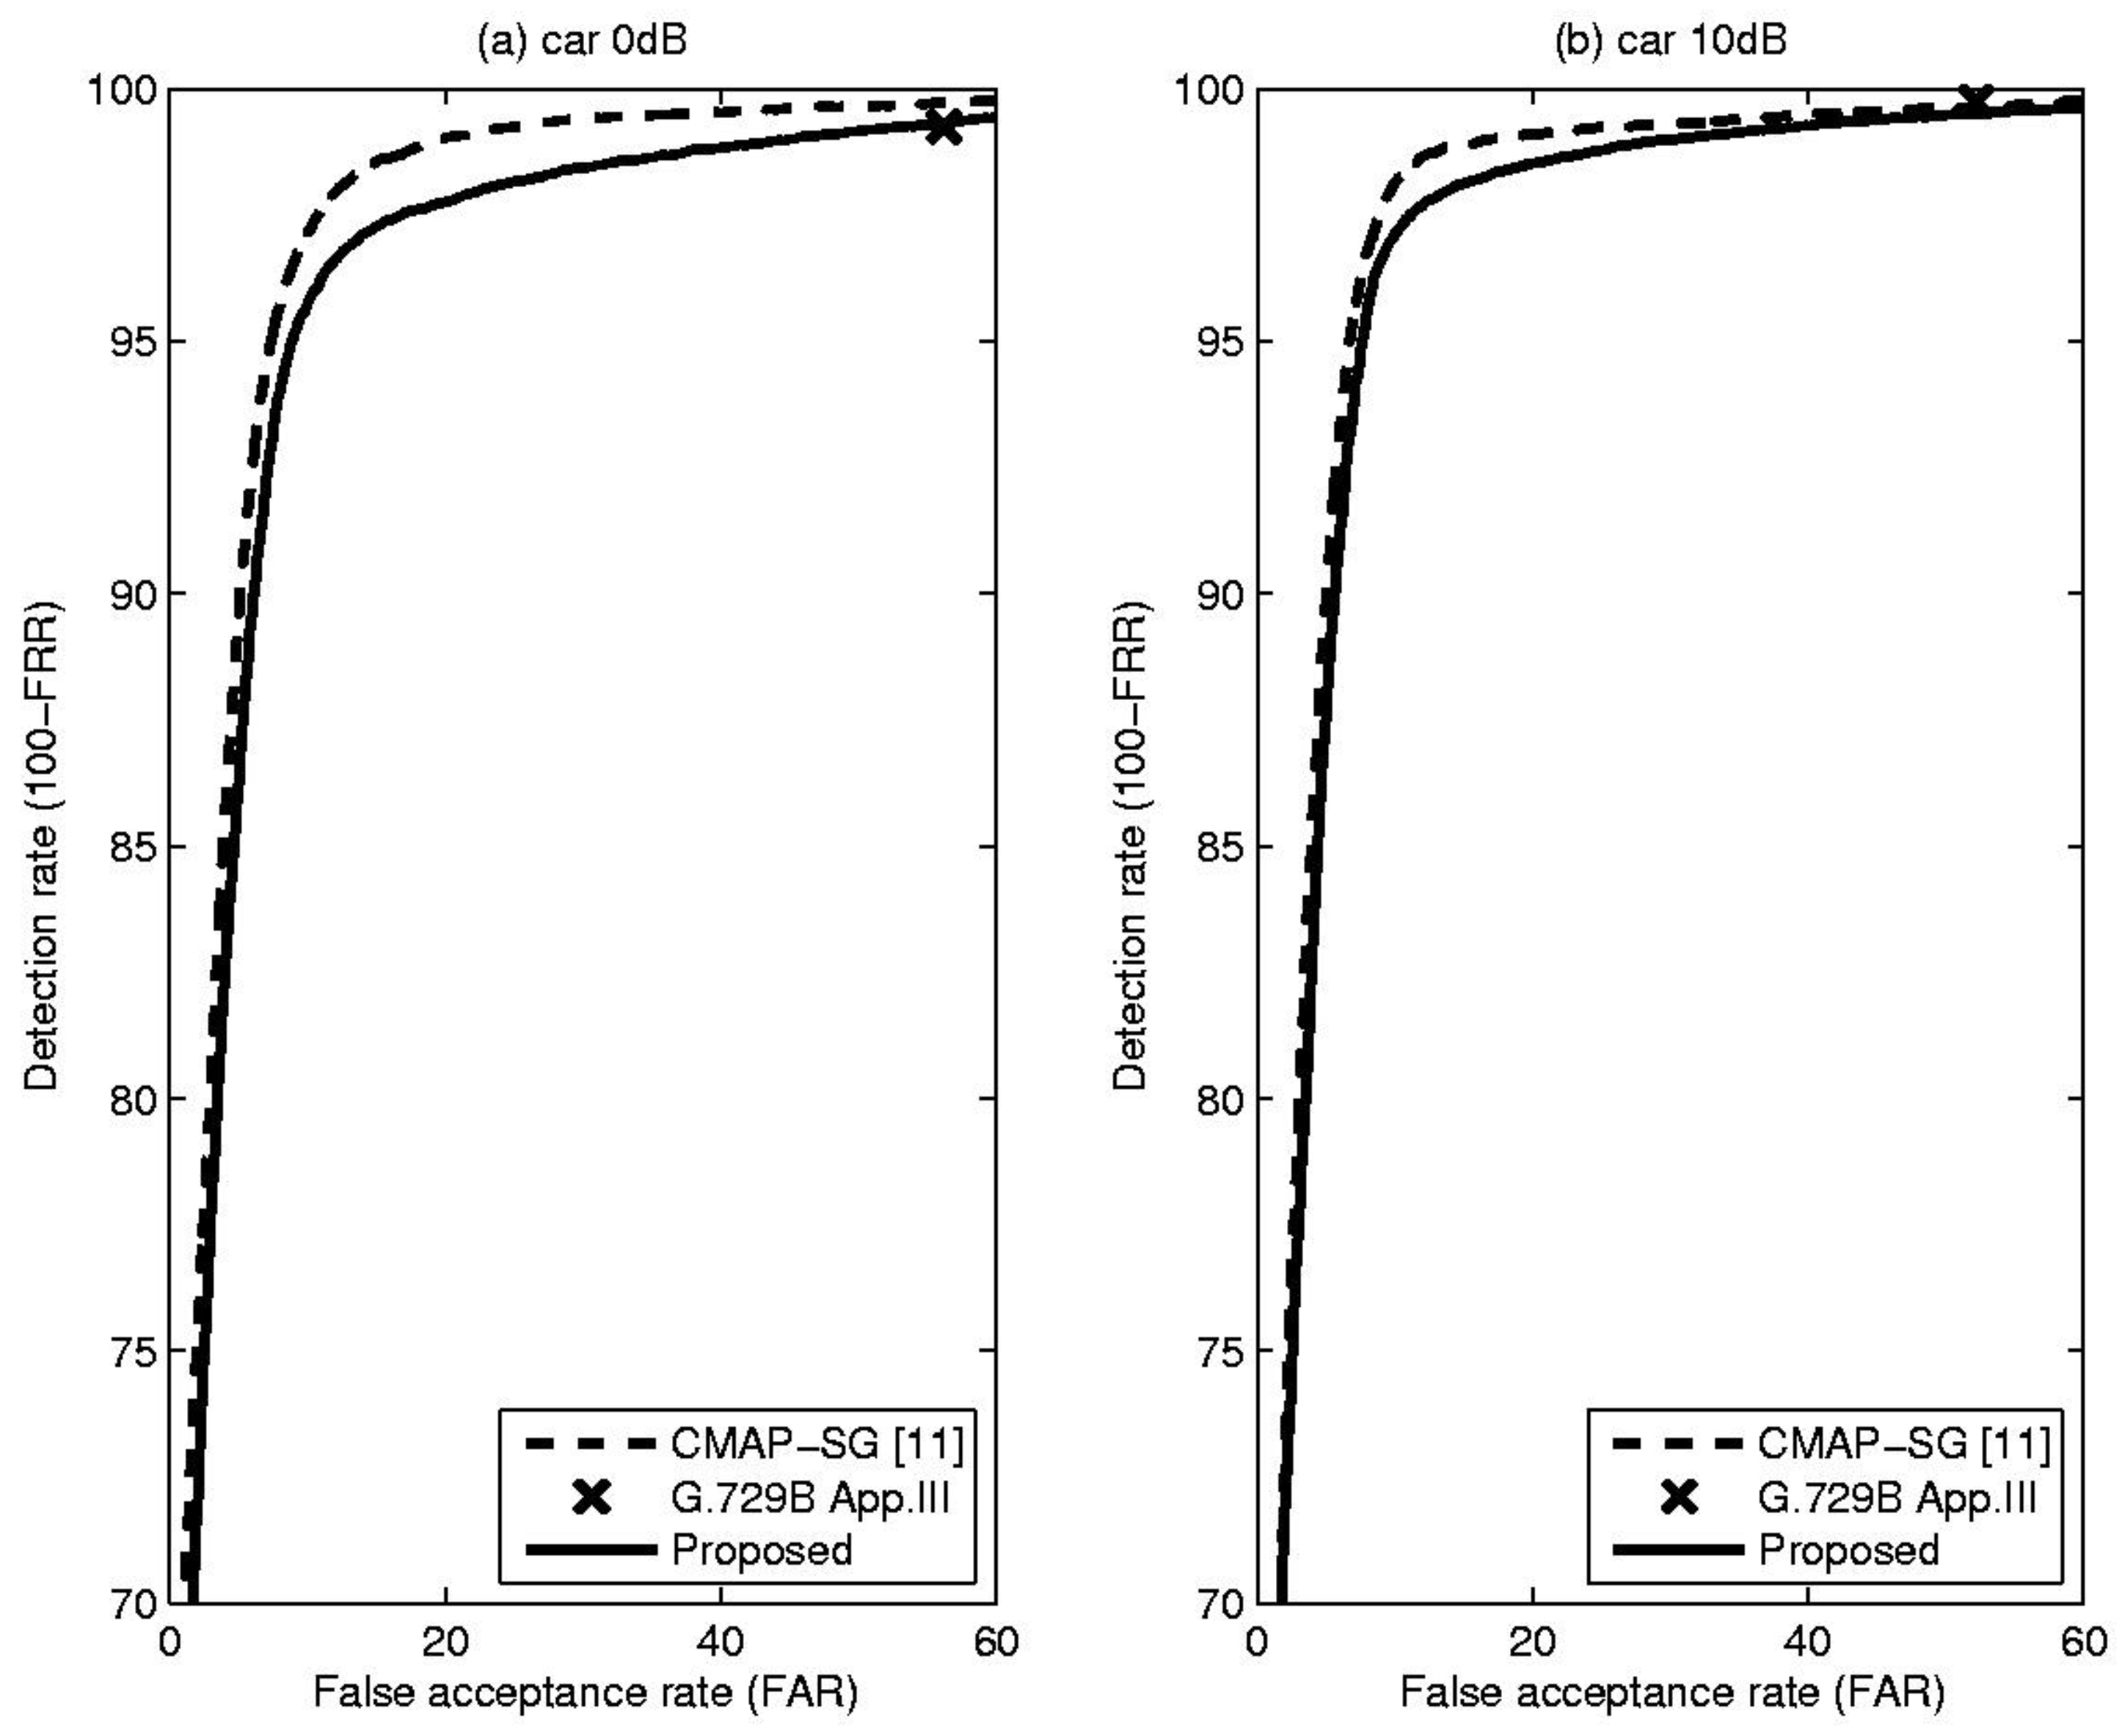
4. Experiments and Results

The proposed VAD method was adopted for NS algorithms using suppression gain based on minimum mean square error estimation [9] and was evaluated by objective comparison experiments under various noise conditions. For the test material [10], 456 s of speech data were recorded by four males and four females and were sampled at 8 kHz. To evaluate VAD performance, we first made reference decisions on the clean speech material by labeling it manually at each 10 ms frame. The proportion of hand-marked speech frames was 57.1% and consisted of 44.0% voiced sounds and 13.1% unvoiced sounds. In addition, to consider various noise environments, three types of noise sources (babble, car, and office noises) were added to the clean speech waveform at SNRs of 0, 5, 10, and 15 dB.
Table 1 shows comparative results, including total error rate (TER), false rejection rate (FRR) and false acceptance rate (FAR), for the proposed method and the CMAP-SG algorithm [11] which is an LR-based VAD algorithm that incorporates spectral variation. In addition, to show that the performance of the proposed method is acceptable in practice, the result of the well-known standard VAD algorithm, ITU-T G.729B Appendix III, is included for each condition [12]. From these results, it is evident that the proposed VAD algorithm outperformed or was comparable to conventional methods in terms of overall detection accuracy under the given noise conditions. This fact could be confirmed by Figure 3, Figure 4 and Figure 5, showing the receiver operating characteristics (ROC) that are insensitive to parameter tuning, since they are a trade-off between detection rate (100-FRR) and FAR [10]. Based on these characteristics, we can see the overall performance differences of the previously discussed methods. From the Figure 3, Figure 4 and Figure 5, the proposed TE-based VAD yielded higher or equivalent performance compared with the conventional method.
In addition, for an objective comparison of speech quality, we evaluated the objective quality of the output signal as obtained by the NS algorithm from which the VAD algorithms based on the conventional and proposed scheme are adopted. For the test material, 90 test phrases with a sampling rate of 8 kHz were used as the experimental data. Each phrase consisted of two different meaningful sentences and lasted 8 sec. In order to evaluate speech quality, we utilized the perceptual evaluation of speech quality (PESQ, ITUT P.862) [13], which is a worldwide applied industry standard for objective speech quality testing. The results of the PESQ scores for the evaluated methods are presented in Table 2. Table 2 illustrates that the proposed approach performed comparably to the conventional methods under the given noise conditions and achieved a meaningful performance improvement over conventional methods, especially for low SNRs.

5. Conclusions

In this paper, we have proposed a novel VAD algorithm using TE-based PSD. Furthermore, to improve the performance of the proposed algorithm, TE-based LR and SAP are applied as modification of TE-based PSD. Compared to conventional VAD algorithms (CMAP-SG [11] and G.729B App III), the performance of the proposed technique under various noise environments was superior in objective tests of speech detection accuracy, ROCs, and PESQ.

Acknowledgments

This research was supported by the KERI Primary Research Program through the Korea Research Council for Industrial Science & Technology funded by the Ministry of Science, Information & Communication Technology and Future Planning (No. 16-12-N0101-44).

Author Contributions

Sang-Kyun Kim wrote this manuscript; Sang-Ick Kang, Young-Jin Park, Sanghyuk Lee and Sangmin Lee contributed to the writing, direction and content and also revised the manuscript.

Conflicts of Interest

The authors declare no conflict of interest.

References

  1. Karray, L.; Mokbel, C.; Monne, J. Solutions for robust speech/non-speech detection in wireless environment. In Proceedings of the IEEE 4th Workshop, Interactive Voice Technology for Telecommunications Applications IVITA’98, Torino, Italy, 29–30 September 1998; pp. 166–170.
  2. TIA/EIA/IS-127. Enhanced Variable Rate Codec, Speech Service Option 3 for Wideband Spread Spectrum Digital Systems, 1996.
  3. Sohn, J.; Kim, N.S.; Sung, W. A statistical model-based voice activity detection. IEEE Signal Process. Lett. 1999, 6, 1–3. [Google Scholar] [CrossRef]
  4. Jabloun, F.; Cetin, A.E.; Erzin, E. Teager energy based feature parameters for speech recognition in car noise. IEEE Signal Process. Lett. 1999, 6, 259–261. [Google Scholar] [CrossRef]
  5. Chen, S.-H.; Wu, H.-T.; Chang, Y.; Truong, T.K. Robust voice activity detection using perceptual wavelet-packet transform and Teager energy operator. Pattern Recognit. Lett. 2007, 28, 1327–1332. [Google Scholar] [CrossRef]
  6. Evangelopoulos, G.; Maragos, P. Multiband modulation energy tracking for noisy speech detection. IEEE Trans. ASLP 2006, 14, 2024–2038. [Google Scholar] [CrossRef]
  7. McAualy, R.J.; Malpass, M.L. Speech enhancement using a soft-decision noise suppression filter. IEEE Trans. Acoust. Speech Signal Process. 1980, 28, 137–145. [Google Scholar] [CrossRef]
  8. Kim, N.S.; Chang, J.-H. Spectral enhancement based on global soft decision. IEEE Signal Process. Lett. 2000, 7, 108–110. [Google Scholar]
  9. Ephraim, Y.; Malah, D. Speech enhancement using a minimum mean-square error short-time spectral amplitude estimator. IEEE Trans. Acoust. Speech Signal Process. 1984, 32, 1109–1121. [Google Scholar] [CrossRef]
  10. Ramirez, J.; Segura, J.C. An effective subband OSF-based VAD with noise reduction for robust speech recognition. IEEE Trans. Speech Audio Process. 2005, 13, 1119–1129. [Google Scholar] [CrossRef]
  11. Kim, S.K.; Chang, J.H. Voice activity detection based on conditional MAP criterion incorporating the spectral gradient. Signal Process. 2012, 92, 1699–1705. [Google Scholar] [CrossRef]
  12. ITU-T. Appendix III: G.729 Annex B Enhancement in Voice-Over-IP Applications-Option 2, 2005.
  13. ITU-T. Recommendation P.862, Perceptual Evaluatioon of Speech Quality (PESQ), an Objective Method for end-to-end Speech Quality Assessment of Narrowband Telephone Networks and Speech Codecs, 2001.
Figure 1. Block diagram of the proposed voice activity detection (VAD) algorithm.
Symmetry 08 00058 g001
Figure 2. (a) Noisy speech waveform (office noise, signal-to-noise ratio (SNR) = 0 dB); (b) Clean speech waveform; (c) Teager energy (TE) waveform; (d) VAD based on power spectral deviation (PSD); (e) VAD based on likelihood ratio (LR); (f) VAD based on the proposed method.
Symmetry 08 00058 g002
Figure 3. (a) Receiver operating characteristics (ROC) curve for the babble at 0 dB SNR; (b) ROC curve for the babble at 10 dB SNR.
Symmetry 08 00058 g003
Figure 4. (a) ROC curve for the office at 0 dB SNR; (b) ROC curve for the office at 10 dB SNR.
Symmetry 08 00058 g004
Figure 5. (a) ROC curve for the car at 0 dB SNR; (b) ROC curve for the car at 10 dB SNR.
Symmetry 08 00058 g005
Table 1. Comparison of total error rate (TER), false rejection rate (FRR) and false acceptance rate (FAR) among the method of the CMAP-SG, the G.729B App. III and the proposed TE-PSD technique.
EnvironmentsCMAP-SGG.729B App. IIIProposed
NoiseSNR (dB)TERFRRFARTERFRRFARTERFRRFAR
Babble022.7627.7017.9521.5519.5424.3419.5222.5816.69
516.8618.1515.0216.247.4328.5015.0417.0314.50
1010.098.9711.2813.113.2326.868.304.8911.79
158.217.1610.4212.451.6727.477.534.5110.24
Office016.9413.6821.4716.2815.2817.6615.3215.9015.27
515.7811.9321.1314.879.1322.8712.079.6314.53
1010.846.7916.4812.845.0323.709.776.8712.84
158.162.8115.5712.112.6125.358.025.3611.05
Car06.021.8311.8523.940.7556.236.825.078.78
55.621.7810.9422.440.5652.916.534.398.65
105.511.6910.8221.970.2552.216.112.969.84
155.341.6010.5320.340.1748.415.862.848.94
Table 2. Perceptual evaluation of speech quality (PESQ) scores obtained from the proposed VAD algorithm based on proposed TE-PSD with those yielded by the conventional method under various noise environments.
EnvironmentsPESQ
NoiseSNR (dB)CMAP-SG [11]Proposed
Office01.848 ± 0.0131.891 ± 0.016
52.193 ± 0.0092.225 ± 0.012
102.556 ± 0.0062.583 ± 0.008
152.841 ± 0.0042.859 ± 0.006
Babble01.982 ± 0.0182.055 ± 0.023
52.362 ± 0.0162.425 ± 0.022
102.674 ± 0.0092.711 ± 0.011
152.965 ± 0.0082.997 ± 0.009
Car03.152 ± 0.0023.151 ± 0.002
53.443 ± 0.0013.439 ± 0.002
103.694 ± 0.0013.692 ± 0.001
153.944 ± 0.0013.941 ± 0.001

