Article

Top-N Recommender Systems Using Genetic Algorithm-Based Visual-Clustering Methods

by
Ukrit Marung
1,
Nipon Theera-Umpon
1,* and
Sansanee Auephanwiriyakul
2
1
Department of Electrical Engineering, Faculty of Engineering, Chiang Mai University, Chiang Mai 50200, Thailand
2
Department of Computer Engineering, Faculty of Engineering, Chiang Mai University, Chiang Mai 50200, Thailand
*
Author to whom correspondence should be addressed.
Symmetry 2016, 8(7), 54; https://doi.org/10.3390/sym8070054
Submission received: 6 April 2016 / Revised: 16 June 2016 / Accepted: 17 June 2016 / Published: 24 June 2016
(This article belongs to the Special Issue Symmetry in Systems Design and Analysis)

Abstract

:
The drastic increase of websites is one of the causes behind the recent information overload on the internet. A recommender system (RS) has been developed for helping users filter information. However, the cold-start and sparsity problems lead to low performance of the RS. In this paper, we propose methods including the visual-clustering recommendation (VCR) method, the hybrid between the VCR and user-based methods, and the hybrid between the VCR and item-based methods. The user-item clustering is based on the genetic algorithm (GA). The recommendation performance of the proposed methods was compared with that of traditional methods. The results showed that the GA-based visual clustering could properly cluster user-item binary images. They also demonstrated that the proposed recommendation methods were more efficient than the traditional methods. The proposed VCR2 method yielded an F1 score roughly three times higher than the traditional approaches.

Graphical Abstract

1. Introduction

There has been an explosion, in recent years, of the number of websites available on the internet. This can result in the user being inundated by a great number of websites to view, highlighting the subject matter and providing reams of information, most of which will be irrelevant for the users’ needs. To solve this problem, the recommender system (RS) has been developed to filter the information on the internet by choosing only the most appropriate information for the user. There are some helpful surveys in the literature. The details of several methods and algorithms involved in content-based recommender systems were provided in [1]. The details of methods including their limitations in content-based, collaborative and hybrid recommendation systems were described in [2].
The main methods of the RS can be classified into several groups, such as, content-based [3,4], collaborative filtering [3,4,5,6,7,8,9], feature-based [10,11,12,13], demographic-based algorithms [14], etc. The collaborative filtering is widely applied in the area of the RS [3,4,6,7,15,16]. This algorithm may be classified into two categories including the user-based and item-based algorithms. In the user-based algorithm, the system generates the top-N recommendation based on similarity among users. On the other hand, in the item-based algorithm, the system generates the top-N recommendation based on similarity among items. There have been some attempts made to improve the RS performance. The hybrid between collaborative filtering and sequential pattern analysis yielded better recommendation performance [17]. The personal models achieve better personalized RSs [18,19,20]. User-created tags were also exploited to improve the performance of collaborative filtering [21]. It was found that sequential bias in product reviews was harmful to the RS performance and should be removed before performing the recommendation [22]. Local and global features of a social graph were used in the calculation of a transitive node-similarity measure in online social networks to enhance friend recommendations [23]. The best subset of a user’s friend, i.e. the inferred circles of friends, was used in the online social network recommendation system [24]. The ensemble learning of several recommendation systems, e.g., SVD, Neighborhood-Based Approaches, Restricted Boltzmann Machine, Asymmetric Factor Model and Global Effects was utilized to produce the final recommendation result [25].
Although there are many recommendation algorithms developed to improve the performance of the RS, they still need to overcome the cold-start and sparsity problems [26]. The cold-start problem occurs when the RS does not have enough information about a new user and/or a new item. The sparsity problem occurs when the frequency of the purchased items is too small. There are many algorithms used to address the cold-start problem. A probabilistic graph was used to represent an implicit social network and then probabilistic graph-based measure was used to produce the final prediction in the social network recommender system [27]. The predictive feature-based regression based on the pairwise user preferences was used to leverage all available user and item information [28]. The hybrid taxonomy-based recommender (HTR) was built based on the assumption that there was a relation between users’ item preferences and taxonomy preferences [29]. The cold-start hybrid taxonomy-based recommender (CSHTR) based on the closest taxonomic preferences cluster was built accordingly to cope with the cold-start problem. To solve the new user problem, the item-based collaborative filtering [7], feature-based [11], fuzzy-based [30], and behavior-based [31] methods were proposed. Furthermore, the fuzzy-based and feature-based methods were used to solve the new product problem [11,30,31]. Prediction of missing information was applied prior to the collaborative filtering to ease the cold-start problem [32]. In addition, combining the collaborative filtering with personal agents [26], using the fuzzy-based method [30], and combining the collaborative and content-based filtering methods [4] were applied to solve the sparsity problem.
However, all aforementioned methods have limitations. In the fuzzy-based method, the performance of the method depends on the expert who creates the fuzzy rule base. The personal information is difficult to collect in the combination between collaborative filtering and personal agent’s methods. When using the combining collaborative and content-based filtering method and the feature-based method, the attributes (features) of items have to be chosen properly. Different types of items, such as books, movies, songs, etc. usually have a different set of useful attributes. Therefore, the RS of each type of item has to be developed separately. Above all, the algorithms still have problems when the cold-start and sparsity problems occur together. These problems lead to low performance in recommendations in the real-world data sets.
Some methods based on matrix manipulation were proposed for recommendation problems. The social matrix factorization was proposed for the recommendation system [33]. A matrix factorization was applied to perform a recommendation in social networks [34]. It can handle the transitivity of trust and trust propagation. Multiple collaborative filtering tasks in different domains were considered [35]. The rating in each domain was modeled by the probabilistic matrix factorization. The knowledge was transferred across different domains using the correlation between domains. Multi-scale spectral decomposition method (MSEIGS) was utilized in inductive matrix completion (IMC) to find the top-k eigenvectors or top-k result in recommender systems [36]. The MSEIGS provides a comparable result with the other methods with smaller computation time. An extension of matrix factorization called tensor factorization (TF), an N-dimensional tensor of user-item-context, allowed additional dimensions of different context-type representations [37]. Information (blog) was represented as a vertex of a hypergraph while blogs in the same set were represented by hyperedges [38]. The proposed multilevel clustering algorithm is utilized to segment a hypergraph. To achieve a final optimized recommender set, the authors utilized some optimization methods.
The objective of this research is to solve the cold-start and sparsity problems using the visual-clustering method. The visual-clustering method (VCM) was initially proposed by our research group to cluster data in binary images [39]. Its clustering performance was not investigated numerically. Besides the initial clustering results, our clustering method was not utilized in any problem. In this present work, we describe the VCM in more detail and apply it to the recommendation problem. Six methods for the RS are proposed. The first is the visual-clustering recommendation (VCR1) method. The idea behind this method is to apply the clustering technique to cluster the users and items in a binary image. Then, we use the information in the derived clusters to generate the top-N recommended items to an active user. The second method is the hybrid between the VCR1 and user-based methods, namely the VCR-UB1. The third method is the hybrid between the VCR1 and item-based methods, the VCR-IB1. The other three proposed methods are derived similarly with a new fitness function during cluster generation. We test the clustering performance on three synthetic and two real-world data sets. The performances of the top-N RSs are tested on two real-world data sets by using the precision, recall, and F1 scores as evaluation measures. The proposed methods are also compared with three traditional methods including the frequency-based, user-based, and item-based methods. In previous works, recommendation performances were usually evaluated on entire data sets. That means the entire data sets were used as the training set and the test was performed on the training set. This leads to doubt about the generalization of the previous results. Hence, in this work, the ten-fold cross-validation is chosen to cope with this problem.
This paper is organized as follows. In Section 2, we review and describe related methods. The framework of the experiments is given in Section 3. The experimental results on synthetic and real-world data sets and the respective discussions are presented in Section 4. The conclusion is drawn in Section 5.

2. Methodology

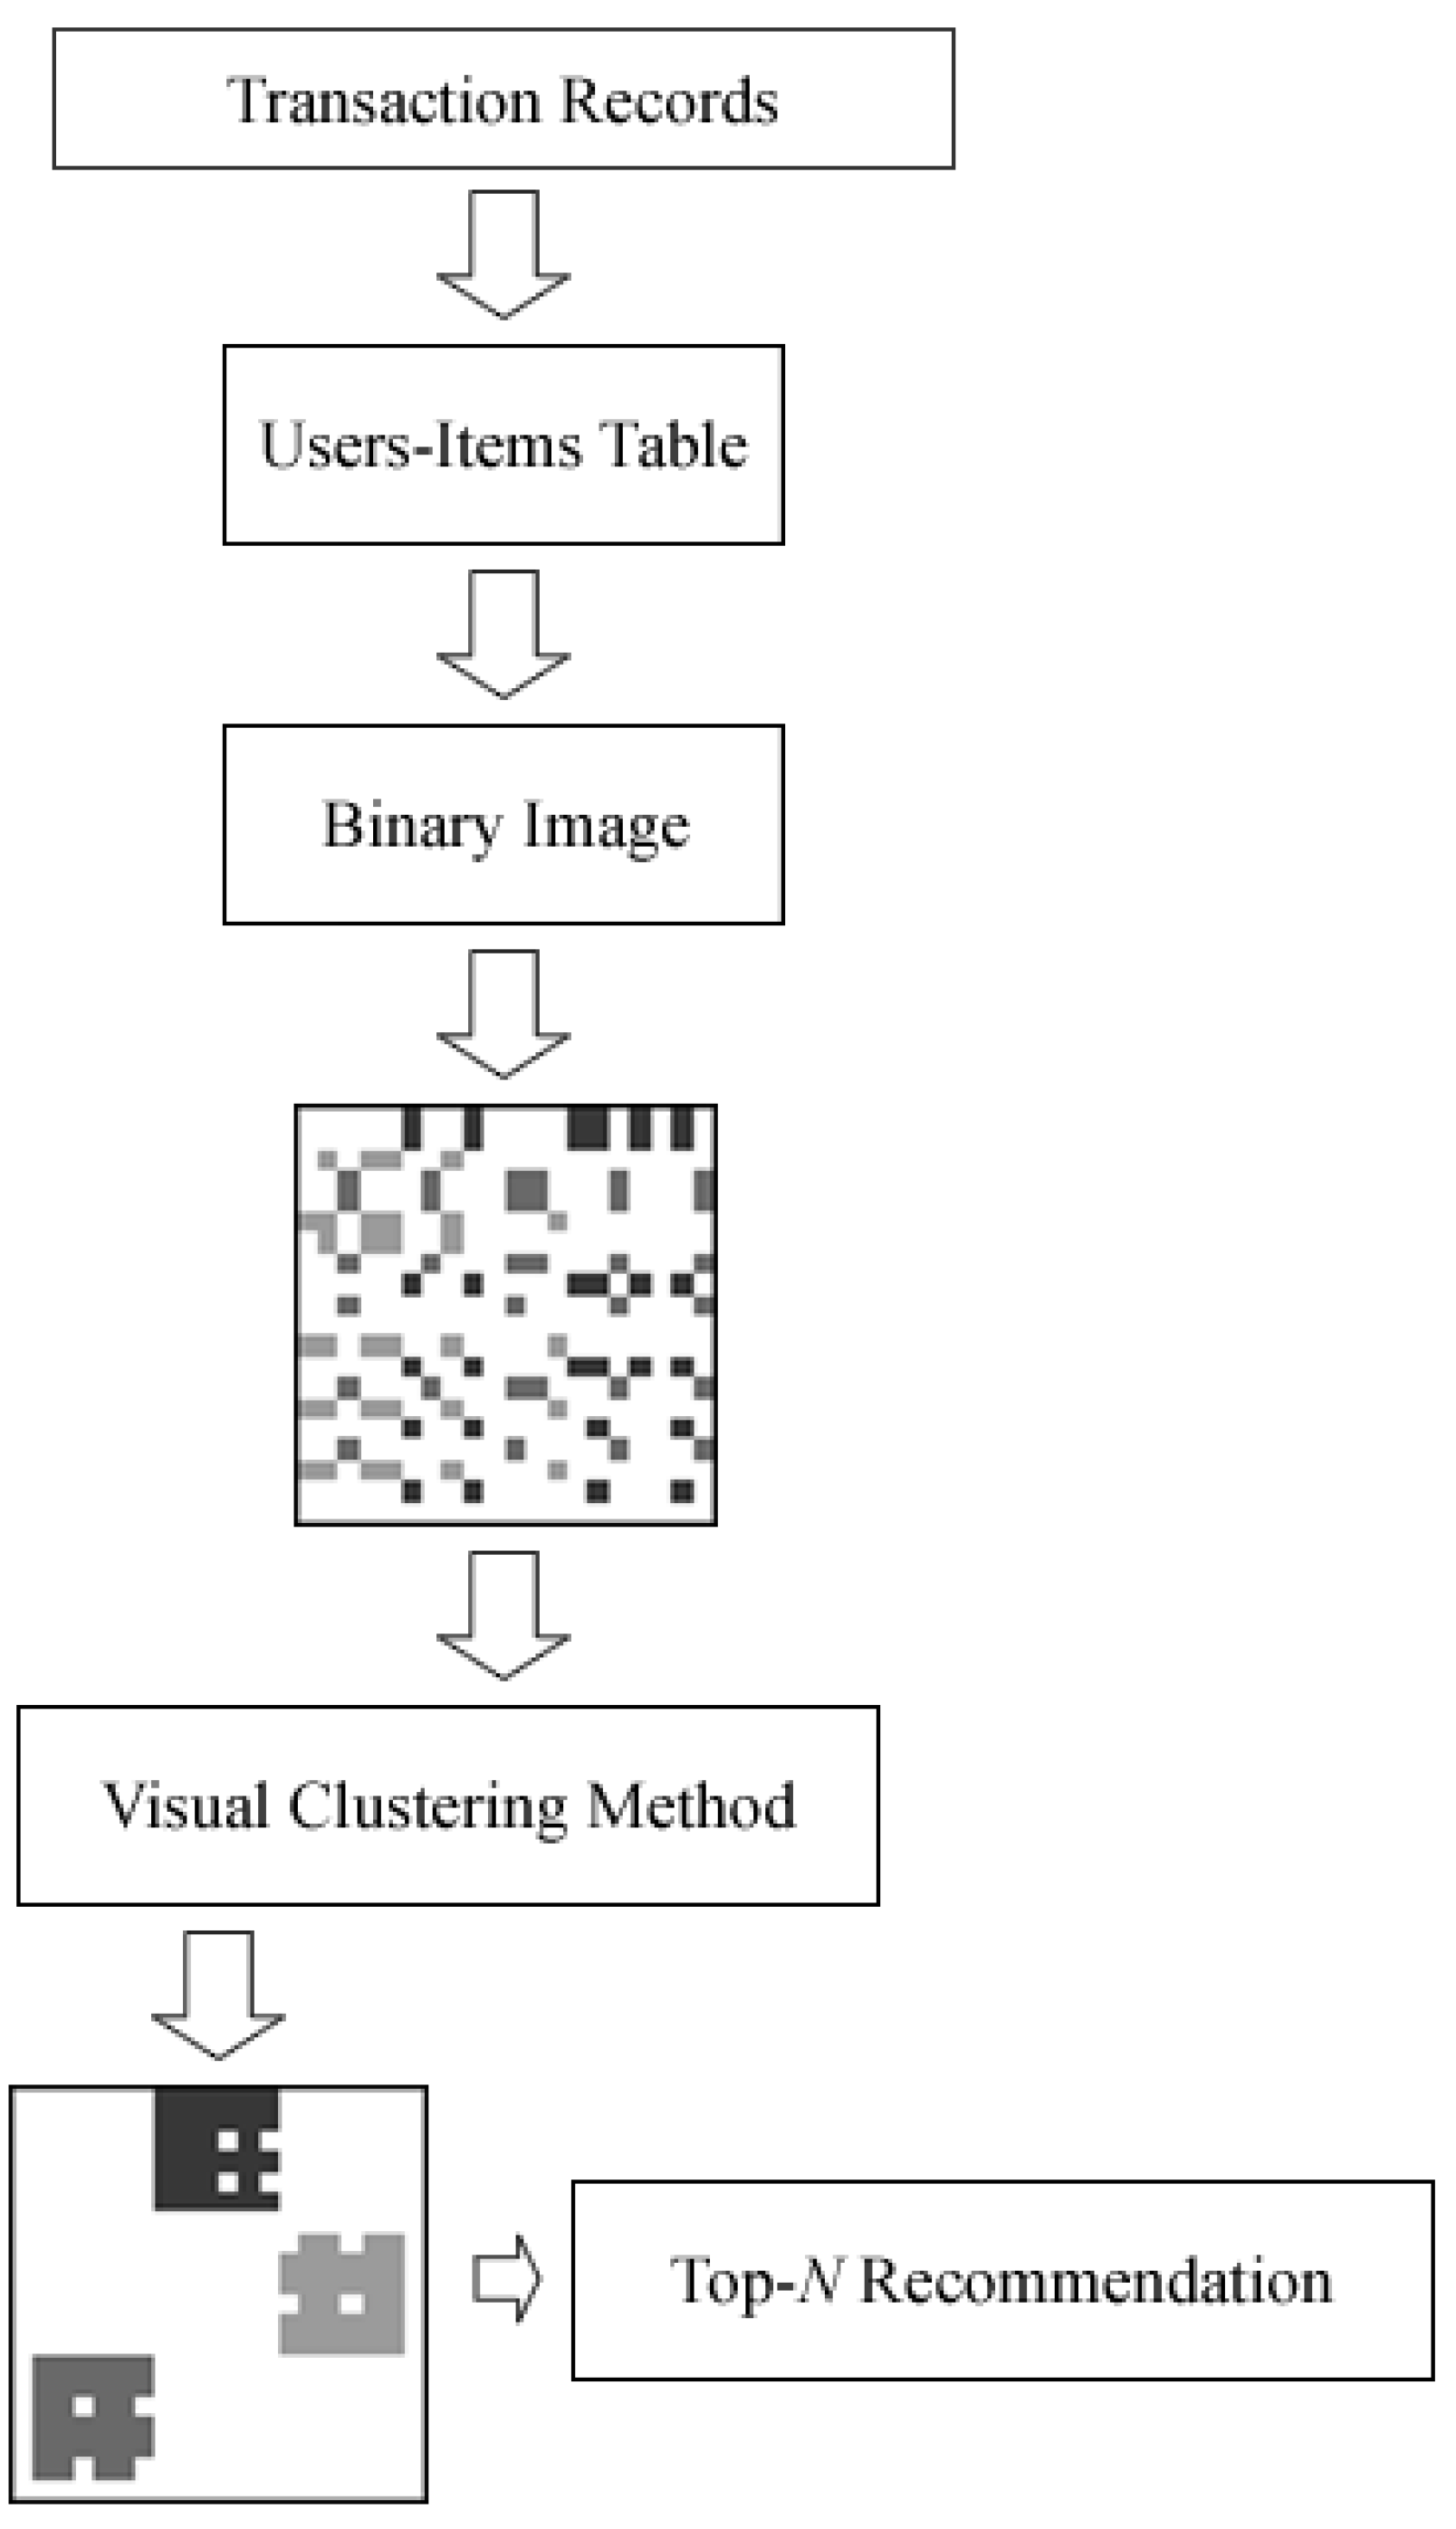
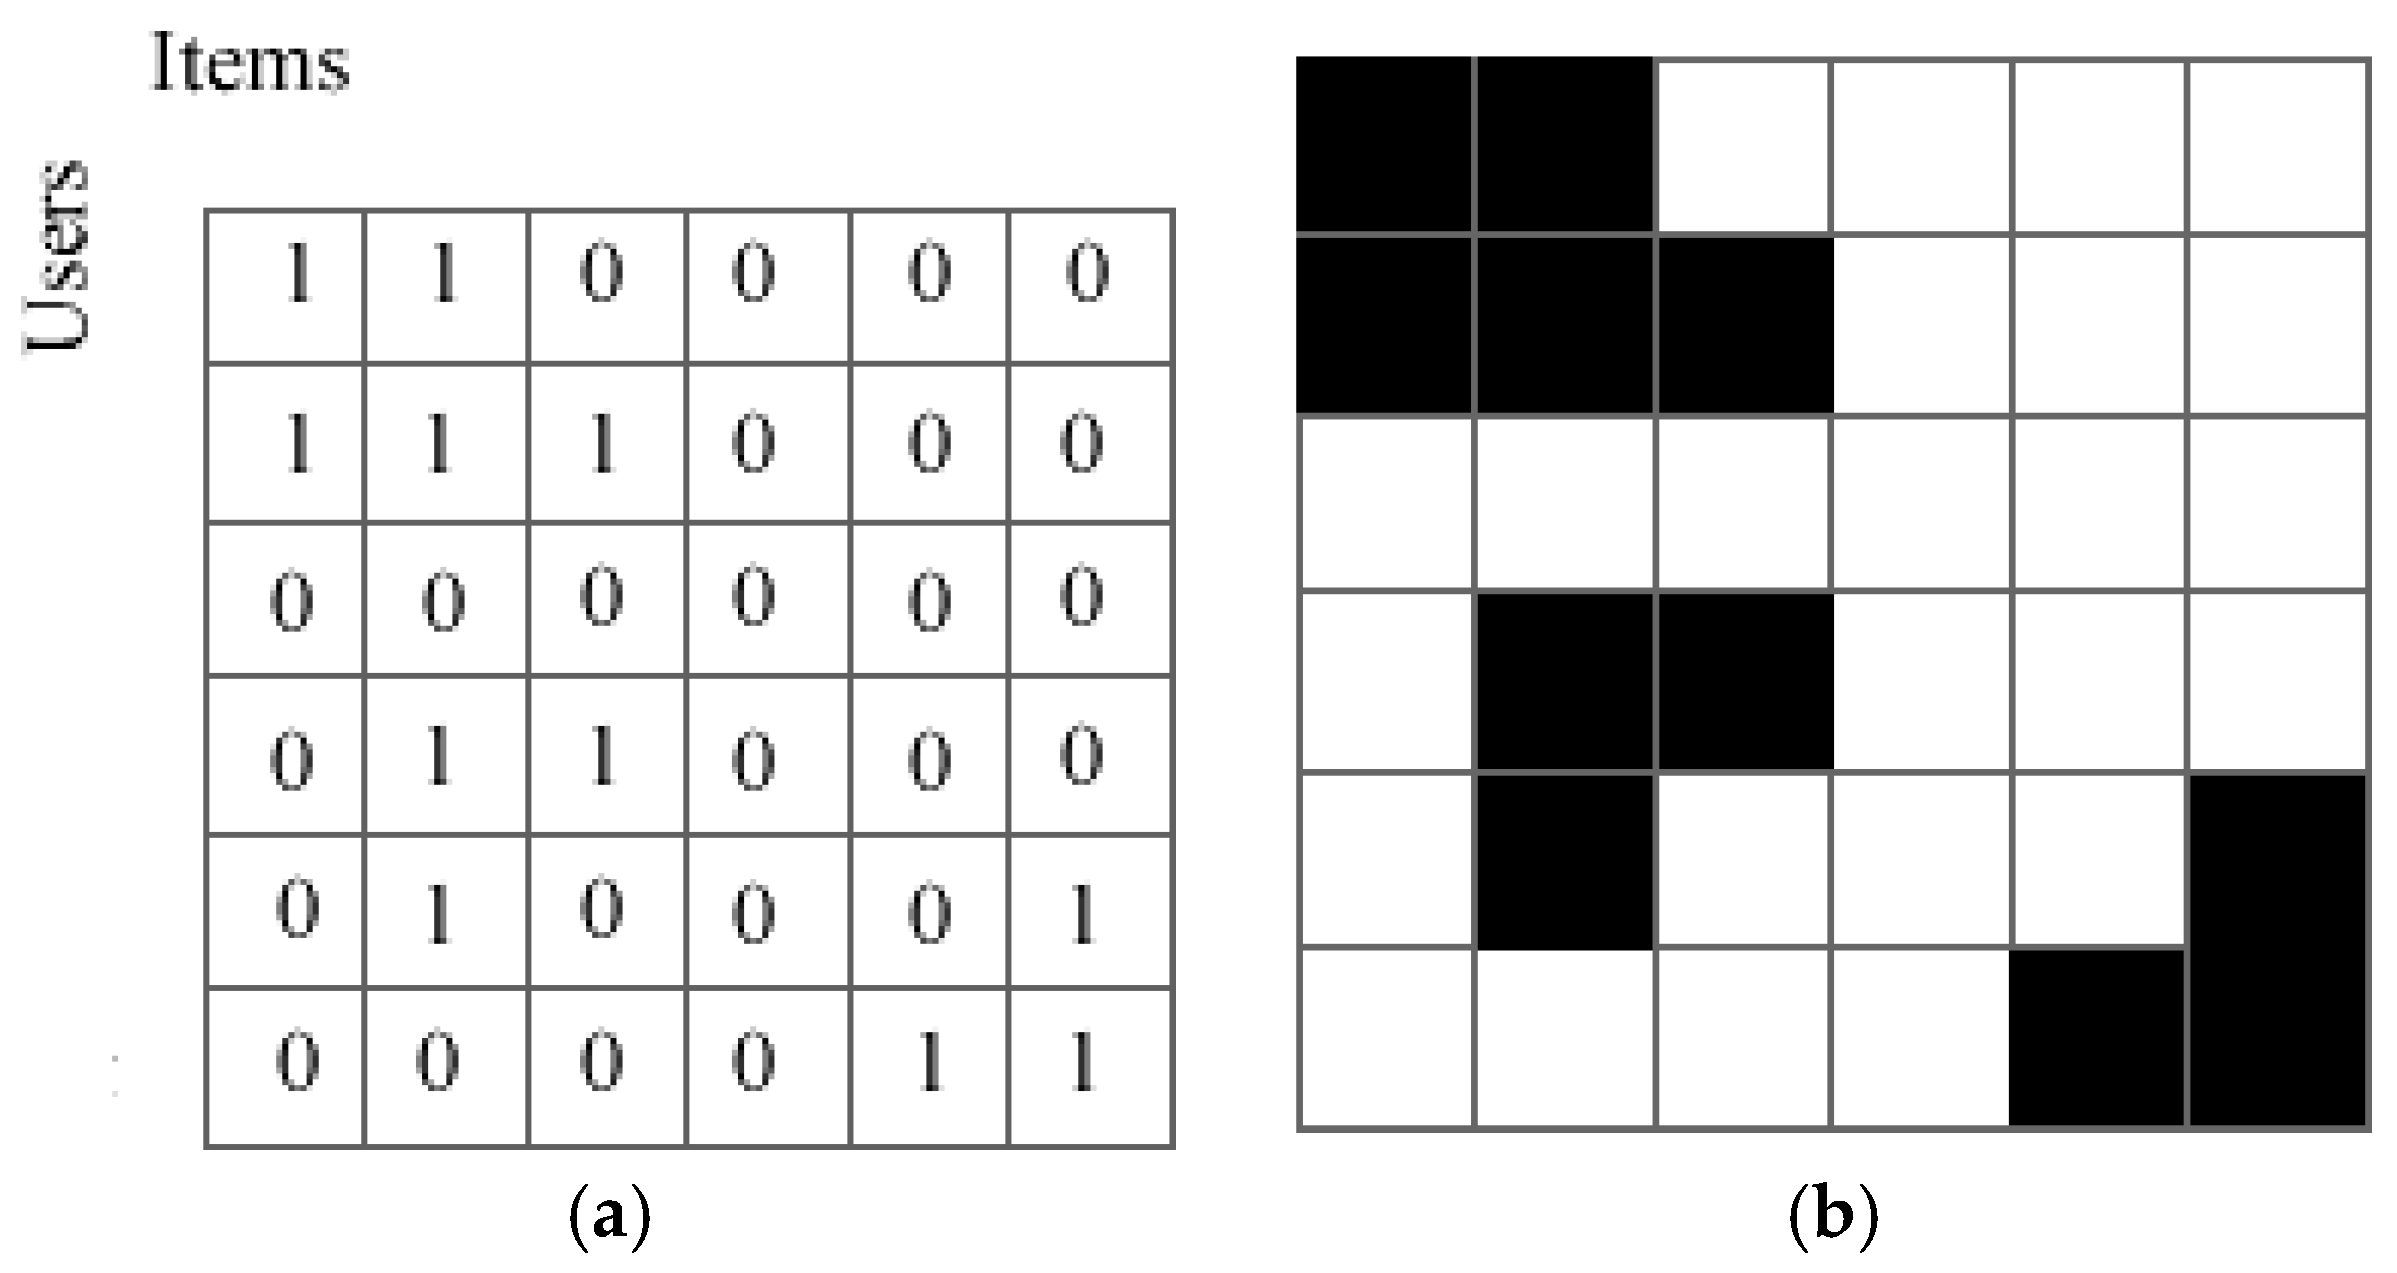
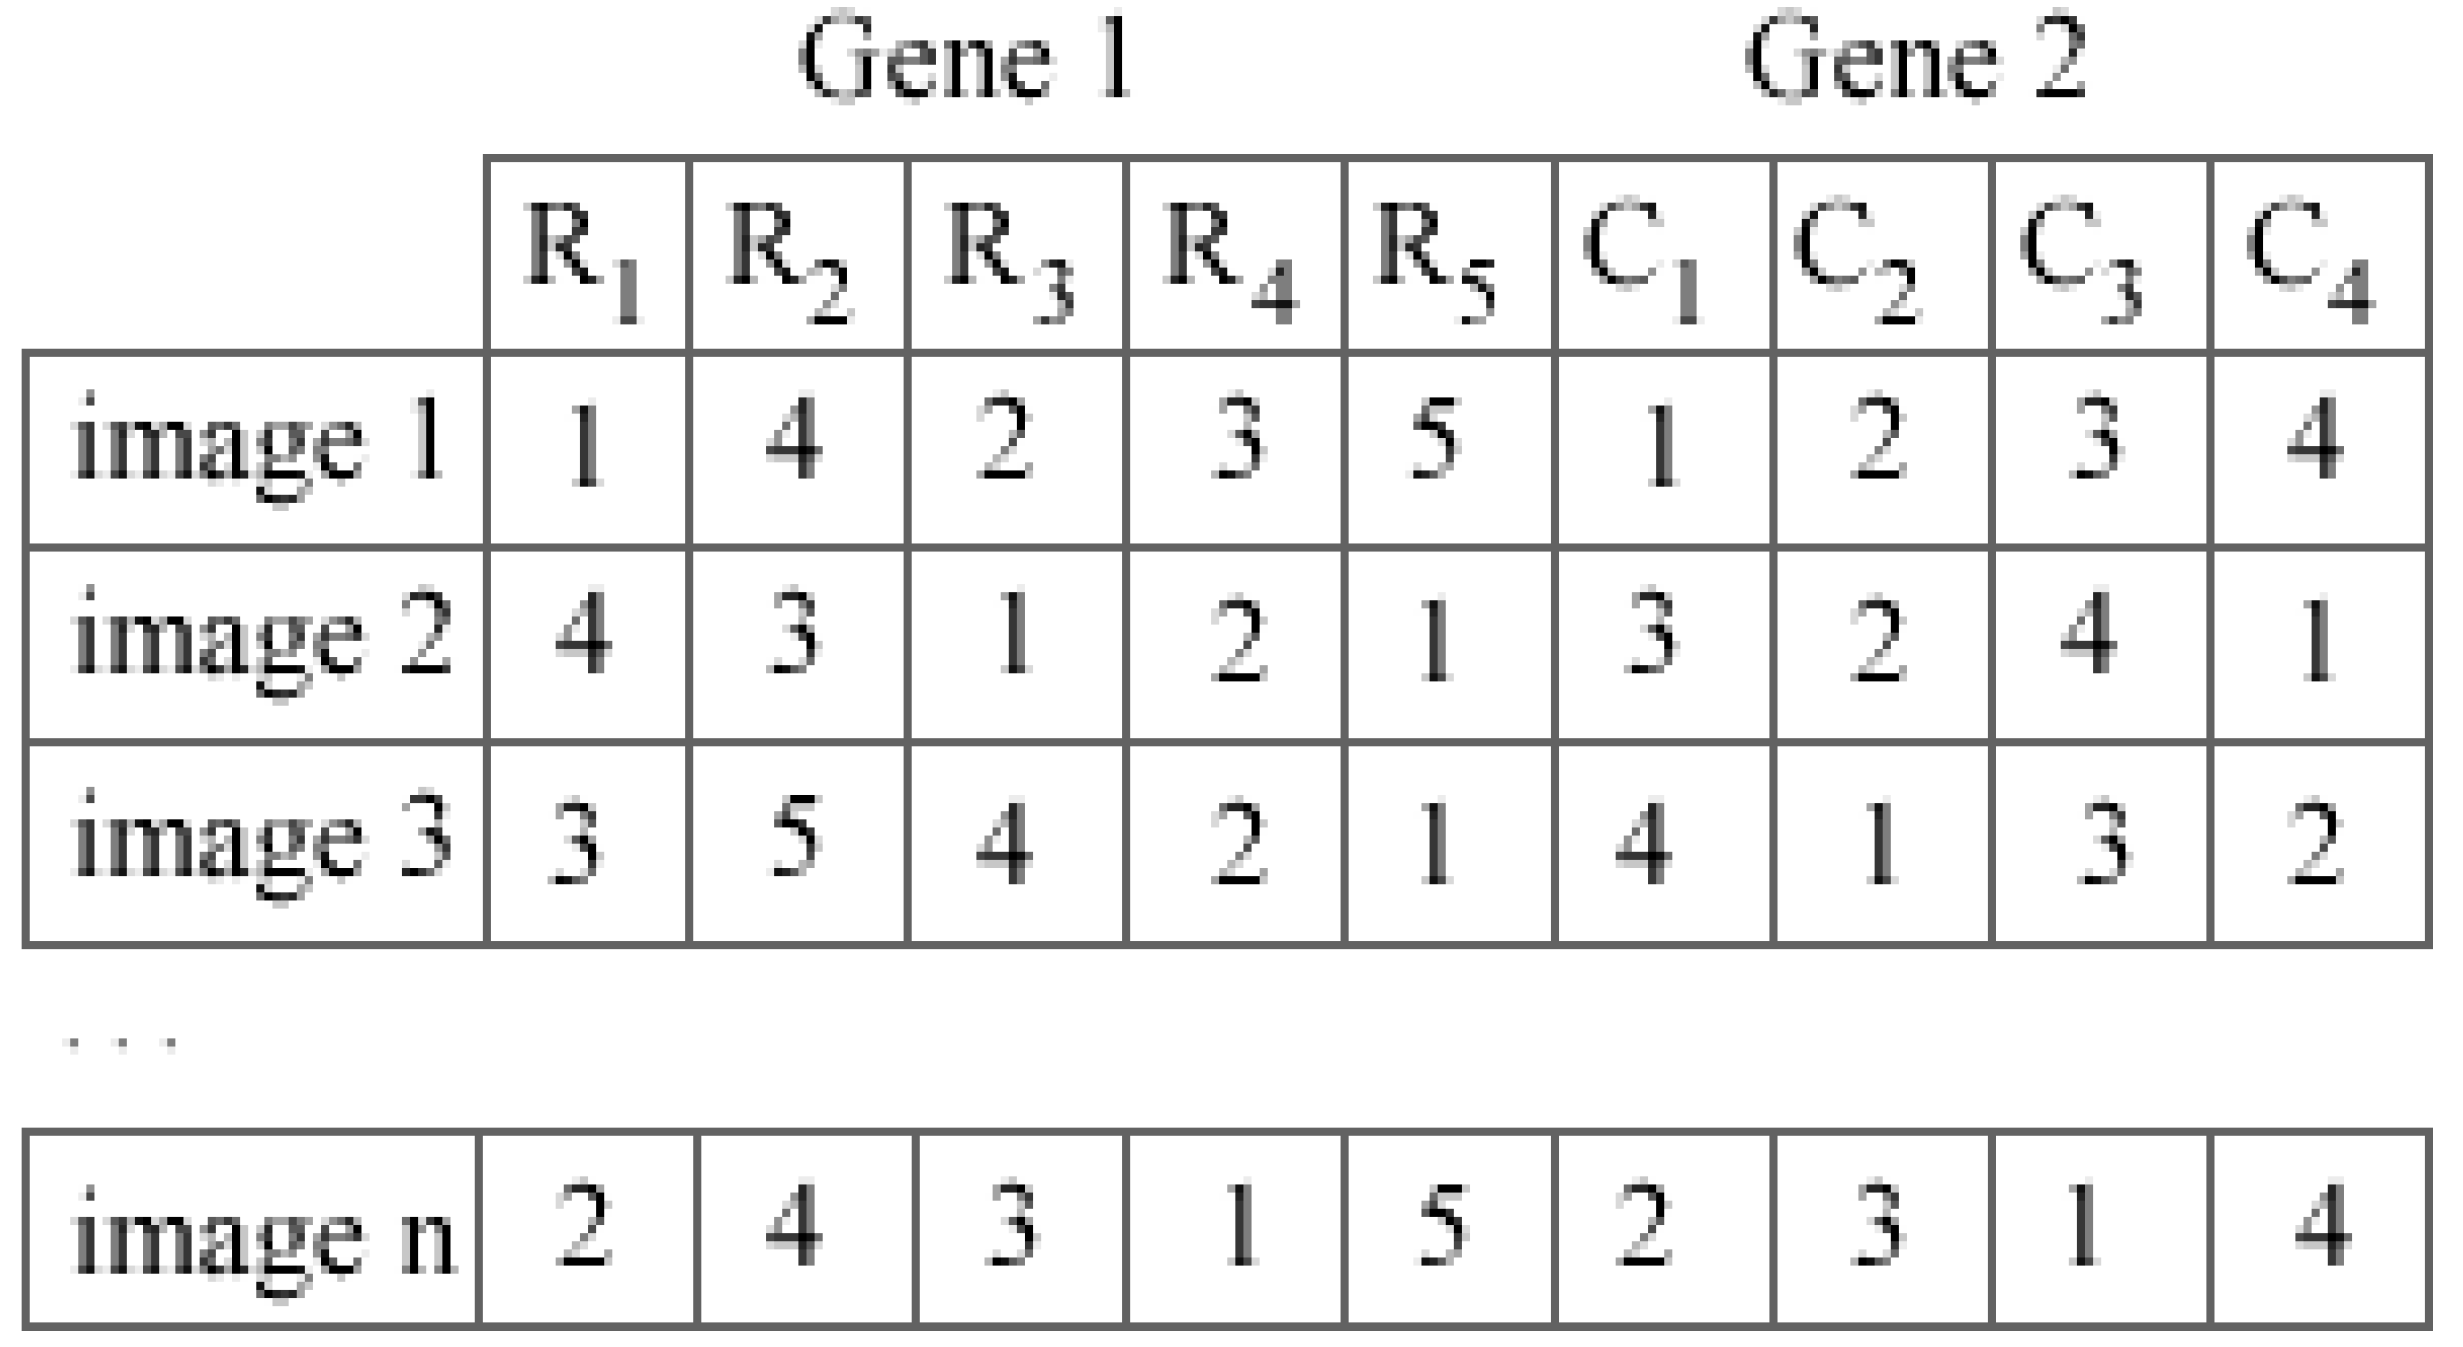
2.1. Proposed Genetic Algorithm-Based Visual-Clustering Method

As a heuristic search algorithm that mimics the process of natural evolution, the genetic algorithm (GA) has been widely applied to many applications in different RSs [5,39,40,41,42]. In the process of the GA, there are five parts: the initial population, evaluation, reproduction, crossover operation, and mutation operation. The population of the GA is a group of chromosomes consisting of genes (an array of values). By mimicking the natural selection, the chromosomes with a high fitness value are selected into a mating pool. The reproduction process occurs in the pool by copying individual chromosomes to the next generation. The crossover operation creates children from the parents based on the pairing process. The mutation operation aims to maintain genetic diversity from one generation of the population to the next.
The model of the proposed top-N recommendation systems is shown in Figure 1. In the proposed methods, the process can be divided into three parts. Firstly, we create the user-item table from the purchased transaction as shown in Figure 2a. Then the user-item table is mapped into a binary image as respectively shown in Figure 2b. Secondly, we propose a method to cluster the users and items in the binary image. Finally, we develop methods for the RS based on the clustered image to recommend items to an active user.
We initially proposed the visual-clustering method (VCM) and found that it was able to cluster data in binary images [39]. However, the analytical evaluation of clustering performance and the usefulness of the clustered images were not investigated. In this work, the VCM is described in more detail. We also apply the VCM to more data sets and extend it to cope with the recommendation problem.
The idea of the VCM is to search for possible clusters in a binary image by interchanging positions of rows and columns. One may think about using the exhaustive search to solve the problem. Unfortunately, the complexity of exhaustive search method is I! × J! in the scenario of I users and J items which is way too large. Meanwhile, the complexity of the GA in this problem is O(n(I + J)), where n is the number of the chromosomes in population (binary images in this case). This is the reason that the GA is selected to find the optimized clusters in this research. The five steps of typical GA, i.e., the initial population, evaluation, reproduction, crossover, and mutation, are applied here. The detailed information is as follows.
In the process of initial population, the positions of rows and columns in a binary image are randomly interchanged to generate each chromosome. There are two genes in a chromosome, i.e., the first gene represents the users (rows) and the second gene represents the items (columns). Figure 3 shows an example of the initial population in the five-user four-item scenario.
The process of evaluation selects the chromosomes with high fitness values into the mating pool. In our previous work, we clustered objects in images but further applications, like recommendation, had never been performed [39]. In the previous work, the number of clusters and the compactness of objects in the image were used to determine the fitness value, i.e.,
Fitness i = a 1 ( 1 α i ) + a 2 β i
α i = N i max j ( N j ) ,     i , j = 1 , 2... , n
and
β i = C i max j ( C j ) ,     i , j = 1 , 2... , n
where Fitnessi is the fitness function calculated for the ith binary image. Parameters a1 and a2 are weight parameters. αi is the normalized number of clusters, βi is the normalized compactness, Ni is the number of clusters, and Ci is the average compactness in the ith binary image. The compactness of a cluster (connected component) is defined as:
Compactness = ( cluster perimeter ) 2 4 π ( cluster area )
n is the number of the binary images, i.e., the number of chromosomes in population. This fitness function is high for the image with a small number of clusters and the shape of each cluster is close to the circle.
In this research, a new fitness function is proposed for clustering. The idea is to improve the weakness of the previous fitness function in [39] for the recommendation problem. We found that compactness in the previous function might not be a good indicator of a well-grouped cluster in this problem. For the recommendation problem, a well-grouped cluster can be of any shape, either circle, rectangle, elongated, etc., with many four-connected pixels. Therefore we discard the compactness in this research, but add three more factors and the new fitness function is
Fitness i = a 1 ( 1 α i ) + a 2 ( 1 β i ) + a 3 γ i + a 4 δ i
β i = N s , i max j ( N s , j ) ,     i , j = 1 , 2... , n
γ i = P l , i max j ( P l , j ) ,     i , j = 1 , 2... , n
δ i = P s , i max j ( P s , j ) ,     i , j = 1 , 2... , n
αi is defined as in Equation (2) to deal with the number of clusters. βi is used to deal with the number of small clusters. The number of small clusters in the ith image is denoted by Ns,i. We do not want to have many small clusters, therefore Ns,i should be small. In this research, the clusters with less than four pixels are considered as small clusters. The size of a large cluster (though it does not need to be the largest cluster) is taken into account in γi. Pl,i denotes the number of pixels in the large cluster in the ith image. In this research, Pl,i is the number of pixels of the third largest cluster in the image. Similarly, the size of a small cluster (though not necessarily the smallest) is taken into account in δi. Ps,i denotes the number of pixels in the small cluster in the ith image. In this research, Ps,i is the number of pixels of the smallest cluster with larger than three pixels. It is worth noting that the values of Pl,i and Ps,i are not from the largest and smallest clusters, but the order-statistics are utilized instead. This is to provide more robustness in term of the size variation. The bottom line is that the fitness value will be large when pixels in the image are well-clustered (small αi), the number of small clusters is small (small βi), the third largest cluster is large (large γi), and the smallest cluster with more than three pixels is large (large δi).
Reproduction is the process of matching in individual chromosomes which are copied according to the fitness values. The chromosomes with higher fitness values have higher probability to be selected. Table 1 shows the sample chromosomes, fitness values, and corresponding probabilities in the five-user four-item scenario and the number of chromosomes in population (n) equals four. Two chromosomes are selected from the mating pool of nk chromosomes to produce two new chromosomes, where nk is the number of the surviving chromosomes which is set to be half of n in this research. This reproduction process is repeated until nnk chromosomes are generated.
Crossover operation is the creation of children from the parents which are selected in the pairing process [39,41,43]. We design the crossover operation to only cross the values within a gene. For example, consider chromosome 1 (Parent 1) and chromosome 2 (Parent 2), if these are selected from the population in Table 1:
Parent 1 = 1 4 2 3 5 | 1 2 3 4
Parent 2 = 4 3 1 2 5 | 3 2 4 1
then, the chromosomes are randomly selected to process numbers 3, 1, and 2 from gene 1 and 1, 2, and 4 from gene 2, i.e.,
Parent 1 = 1 4 2 3 5 | 1 2 3 4
Parent 2 = 4 3 1 2 5 | 3 2 4 1
Child 1 = _ 4 _ _ 5 | _ _ 3 _
Child 1 = 3 4 1 2 5 | 2 4 3 1
Child 2 = 4 _ _ _ 5 | 3 _ _ _
Child 2 = 4 1 2 3 5 | 3 1 2 4
Finally, the parents are replaced with new children; for example, Child 1 is _ 4 _ _ 5 | _ _ 3 _. Based on encountering a missing process number, the missing data from Parent 2 are filled in by Child 1. The outcomes of the crossover process are Child 1 = 3 4 1 2 5 | 2 4 3 1 and Child 2 = 4 1 2 3 5 | 3 1 2 4.
In the mutation operation, it is designed to allow interchanging of the positions only within the same gene. To replace the selected point, another point within the same gene is randomly selected. For example, according to the value in column 5 (value is 5) in chromosome 2 (Table 1), after mutation, the values of the new chromosome are 5 3 1 2 4 | 3 2 4 1.

2.2. Recommendation Engine

The detailed information of the user-based and item-based collaborative filtering is widely available in the literature. Therefore, the following methods are briefly described. In the user-based top-N recommendation algorithm (UB), the top-N recommended items are produced by calculating the similarity between an active user with other users who had made similar purchase [15]. To generate a recommendation, the user-based collaborative filtering algorithm creates the top-N recommendations from a neighborhood of users by using the most frequent item recommendation technique. On the other hand, in the item-based top-N recommendation algorithm (IB), the RS produces the top-N items to an active user by calculating the similarity between items [44]. This algorithm uses item-to-item similarity to compute the relation between the items. The frequency-based method (FB) is another basic method. The RS sorts the frequency count of the purchased items and produces the N most frequent items that have not yet been purchased to an active user.
The recommendation engine is the main process of the RS and we have developed six of them. The first recommendation engine, the visual-clustering recommendation (VCR), directly uses the information in the clusters derived from the VCM to generate the top-N items to an active user. The top-N most frequent items in the derived clusters that the active user’s purchased items belong to will be recommended. It is worth noting that the active user can initially purchase items in different clusters. In this case, we recommend items by considering frequencies of purchased items in all related clusters. The second recommendation engine generates the top-N most frequent items in a similar manner but by using the union of the VCR and IB outputs from the derived clusters. The third recommendation engine performs similarly, though it uses the union of the VCR and UB outputs from the derived clusters. The other three engines are derived similarly but use the fitness function in Equation (5) to generate the clusters.

2.3. Evaluation Measures

In this study, we evaluate the performance of the RS by using precision, recall, and F1 score because they have been widely used to evaluate the performance of the top-N RS [15,31,44,45,46]. Precision is defined as the ratio of the number of elements in the hit set to the number of elements in the recommendation set, i.e.,
precision = # of hits  # of recommended items
Recall is defined as the ratio of the number of the elements in the hit set to the number of purchased items, i.e.,
recall = # of hits # of purchased items
The F1 score or F-measure can be derived from precision and recall, i.e.,
F 1 = 2 × precision × recall precision + recall

3. Experimental Framework

There are two parts of the experiments. The first part was designed to investigate the clustering performance. Both synthetic and real-world data sets were used to test the proposed clustering methods. In the second part, recommendation performance of the proposed methods was investigated. Two real-world data sets were exploited. As mentioned earlier, precision, recall, and F1 score were applied to evaluate the performance of the top-N RSs.

3.1. Data Descriptions

The data sets used in the experiments can be divided into two groups, i.e., the synthetic data sets and real-world data sets. In the synthetic data set, three original images are generated. The three images have the size of 20 × 20, 34 × 34, and 48 × 48. There are three, five, and seven clusters in the three images, respectively. Each cluster in the images contains 24 pixels. For each image, the rows are randomly interchanged. The process is repeated with the columns. The derived images are the row-interchanged and column-interchanged version of the corresponding original ones.
There are four real-world data sets used in the experiments. The first data set is the transaction of purchasing from Gazelle.com, legwear and legcare e-tailer collected by Blue Martini Software on KDD-CUP2000 (KDD). In this data set, there are 3465 purchases in total by 1831 customers. However, a great deal of important data is missing, including the customer ID, item ID, the number of purchases in some transactions. Hence, after removing those incomplete transactions, there are 1697 customers and 247 items. However, there are only 271, 110, and 14 customers who purchased at least two, three, and four items, respectively. Moreover, there are only 102 items that were purchased at least twice. The second data set is our private data. It is the transaction of purchasing at Thaiherbs-Thaimassage shop (TTS) [47]. The data set consists of 371 customers and 175 items. However, there are only 112 and 55 customers who purchased at least two and three items, respectively. There are only 95 items that were purchased at least twice.
The third data set is the restaurant and consumer data set (RCM) collected by the Department of Computer Science, National Center for Research and Technological Development in Mexico. This data set contains 1161 ratings for 130 restaurants rated by 138 users. The fourth data set is the transaction of visiting the entree Chicago restaurant (ECR), collected by the Department of Information and Computer Science, the University of California, Irvine. We chose only the transactions recorded in the 4th quarter of 1996. Each user is presented by a session of user interaction with the system. There are 1786 users (sessions) and 674 restaurants. These four data sets have the sparsity problem, i.e., the frequency of the purchased items is too small. Therefore, they are suitable for the recommendation performance evaluation of the proposed methods.
As we know, it is impossible to evaluate the recommendation performance using the information of customers who purchased only one item in total. To make the recommendation possible, we use only 110 customers who purchased at least three items in the KDD data set and use only 112 customers who purchased at least two items in the TTS data set. We selected 115 users who rated at least four times for the RCM data set. For the ECR data set, we selected 611 users who visited at least five times. Hence, the size of the KDD data set is 110 customers and 247 items, whereas that of the TSS data set is 112 customers and 175 items. For the RCM and ECR data sets, the sizes are 115 customers/130 restaurants and 611 customers/386 restaurants, respectively. After the selection, the sparsity levels of the KDD, TTS, RCM, and ECR data sets are very high at 0.986, 0.969, 0.939, and 0.983 respectively.

3.2. Parameter Setting

From extensive experiments, the related parameters are chosen as follows. In the GA parameter setting, we set up the parameters as follows: size of population is 80, mutation rate is 0.01, and crossover rate is 0.6. The weights of our previously proposed fitness function (see Equation (1)) are set to 0.5 for both a1 and a2. For the presently proposed fitness function (see Equation (5)), the weights a1, a2, a3 and a4 are set to 0.2, 0.2, 0.3, and 0.3, respectively. In the RSs, the neighborhood size of the user-based and item-based top-N RSs is limited to ten. The number N of the top-N RSs is set to five (i.e., top-5 recommendation).

3.3. Cross-Validation

When the data sets are not officially divided into the training and test sets but we need to have training and test sets to evaluate generalization properties of the recommendation methods, the cross-validation method is a standard solution of the aforementioned limitation. In our experiments, the ten-fold cross-validation was performed. We briefly describe the cross-validation here. In the ten-fold cross-validation, the entire data are divided into ten groups with approximately same size. In the first validation, the first group is kept as the test set or validation set while the nine remaining groups are used as the training set. In our case, the data in the training set are used to create the clustered image. The derived clustered image is then used to provide recommended items to the customers in the test set. The recommendation evaluation is performed on this test set. The process is repeated with the remaining groups ten times. Hence, each data will be used as the test data whose information has never been used in the training process. In this study, there will be ten values for each evaluation measure from ten validations. For each evaluation measure, we report the results in terms of the average of those ten values.

4. Experimental Results and Discussion

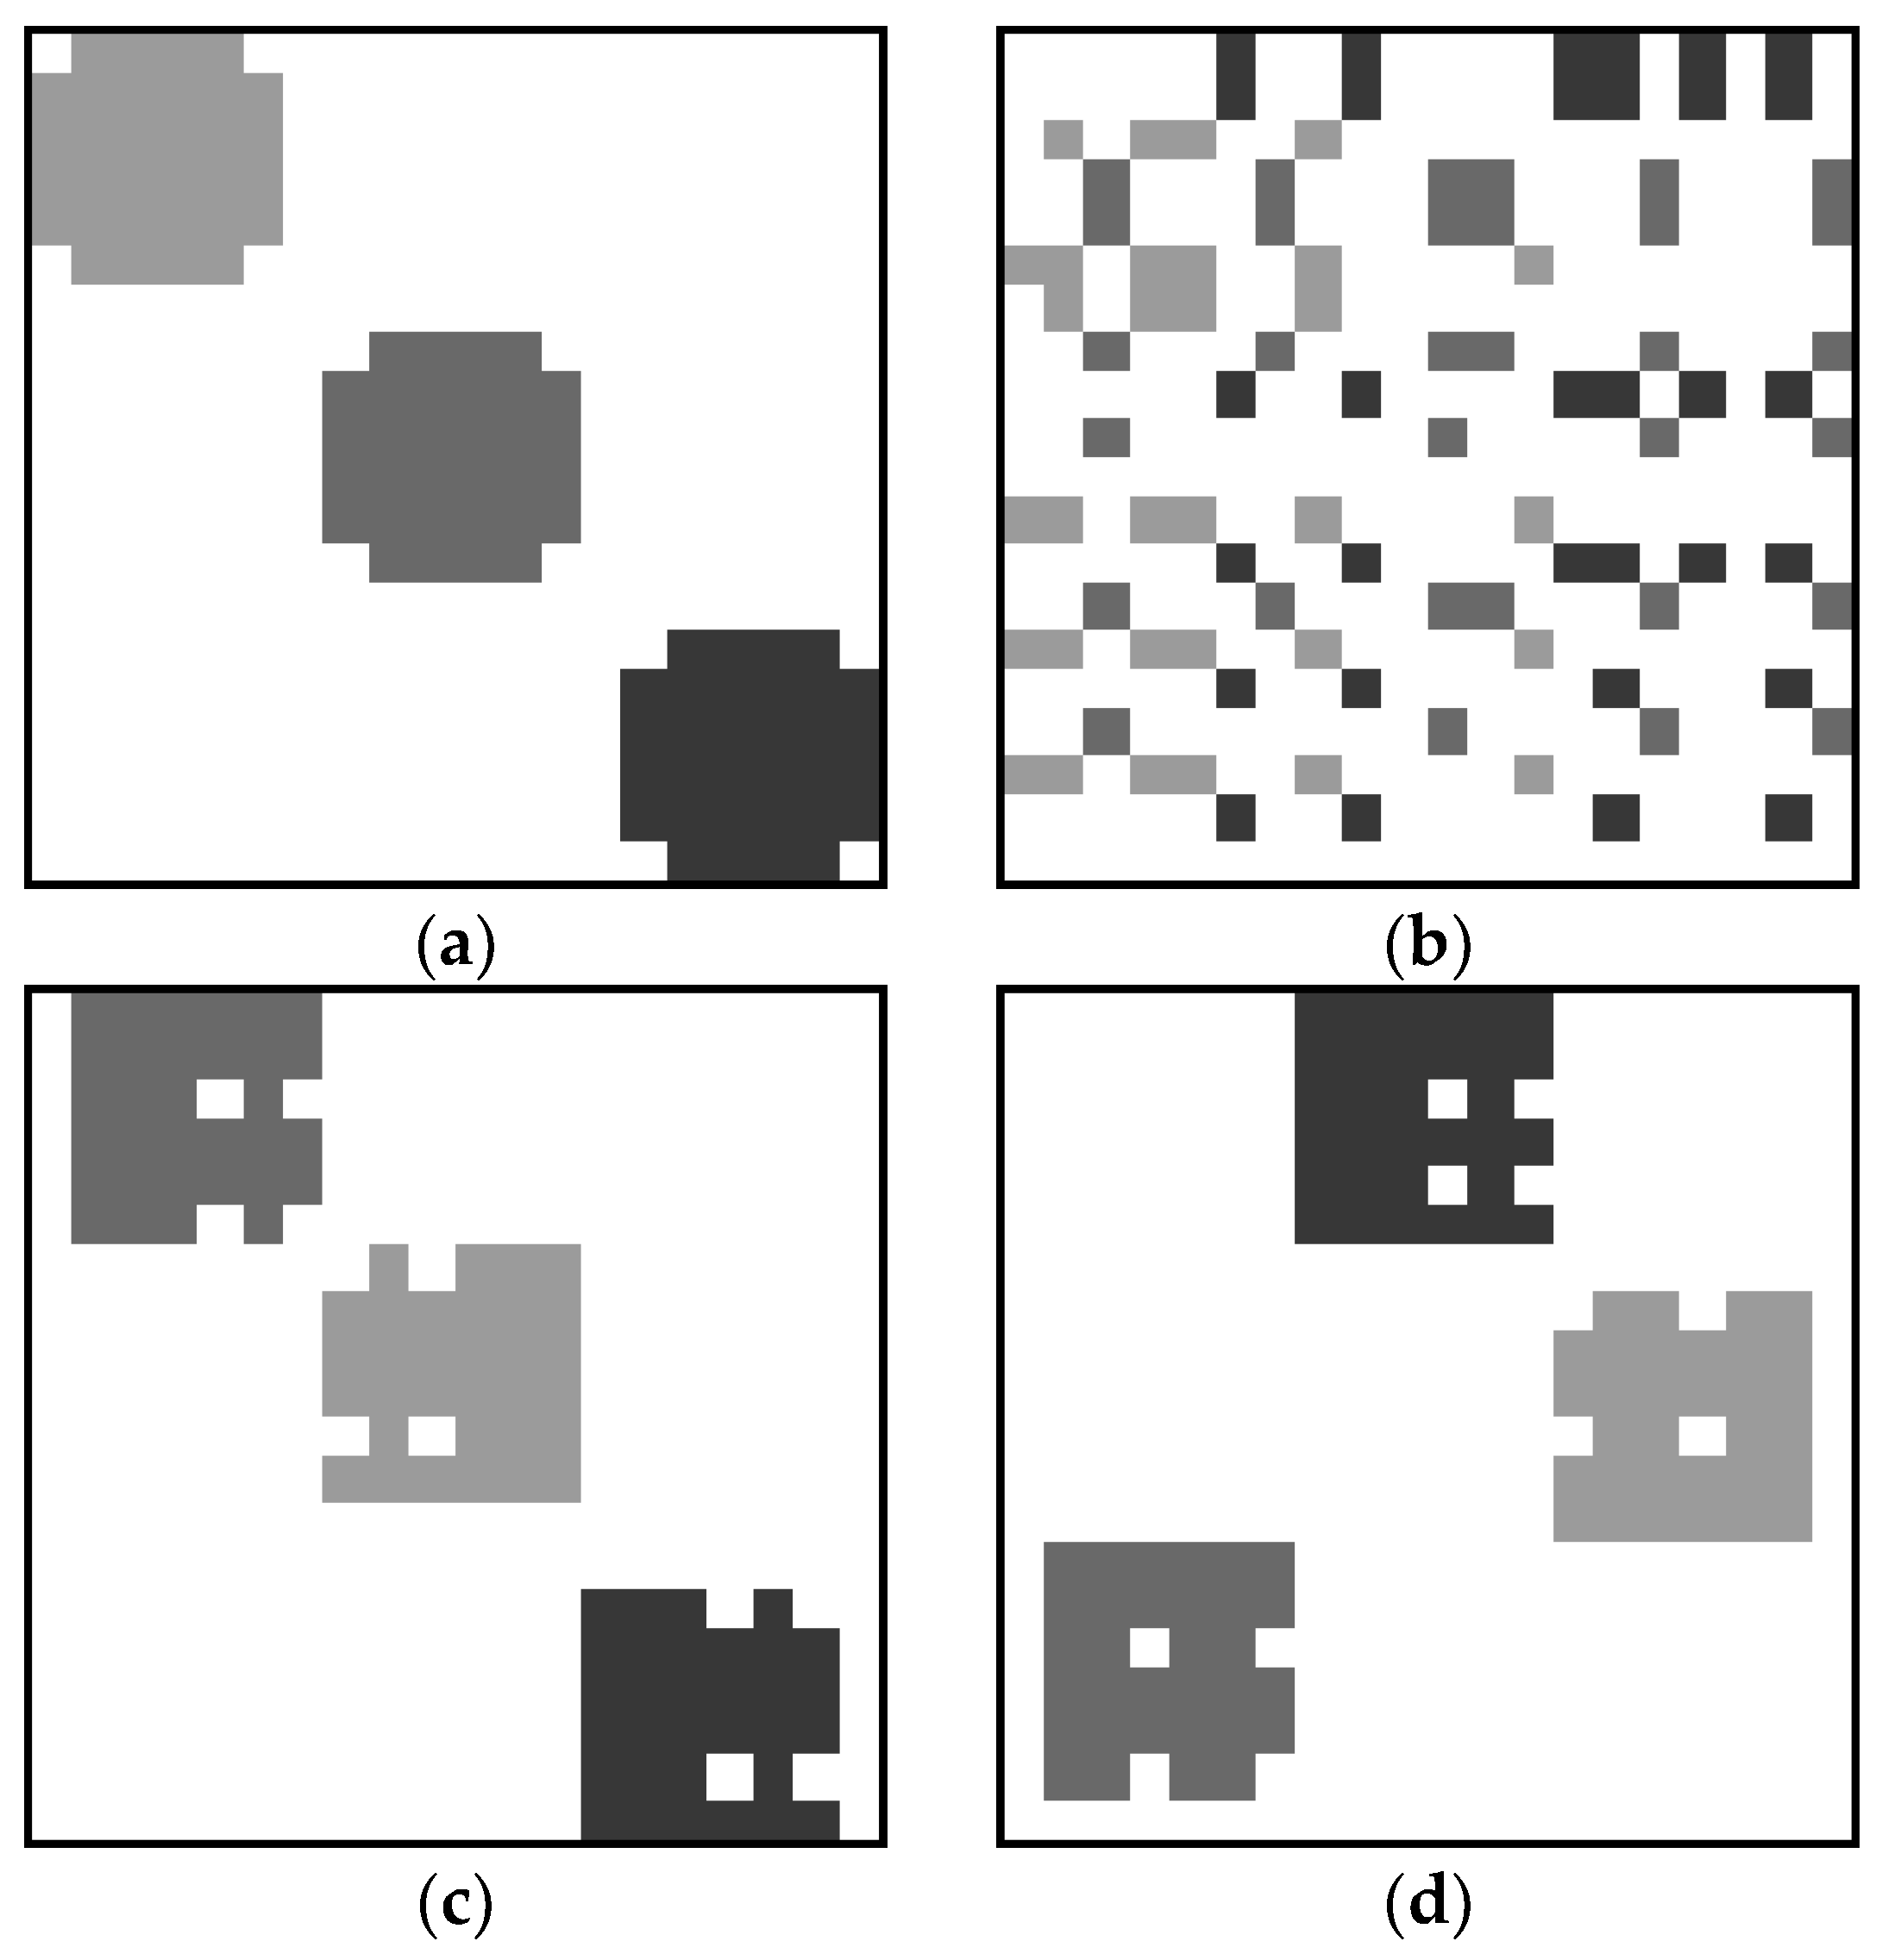
4.1. Clustering Results

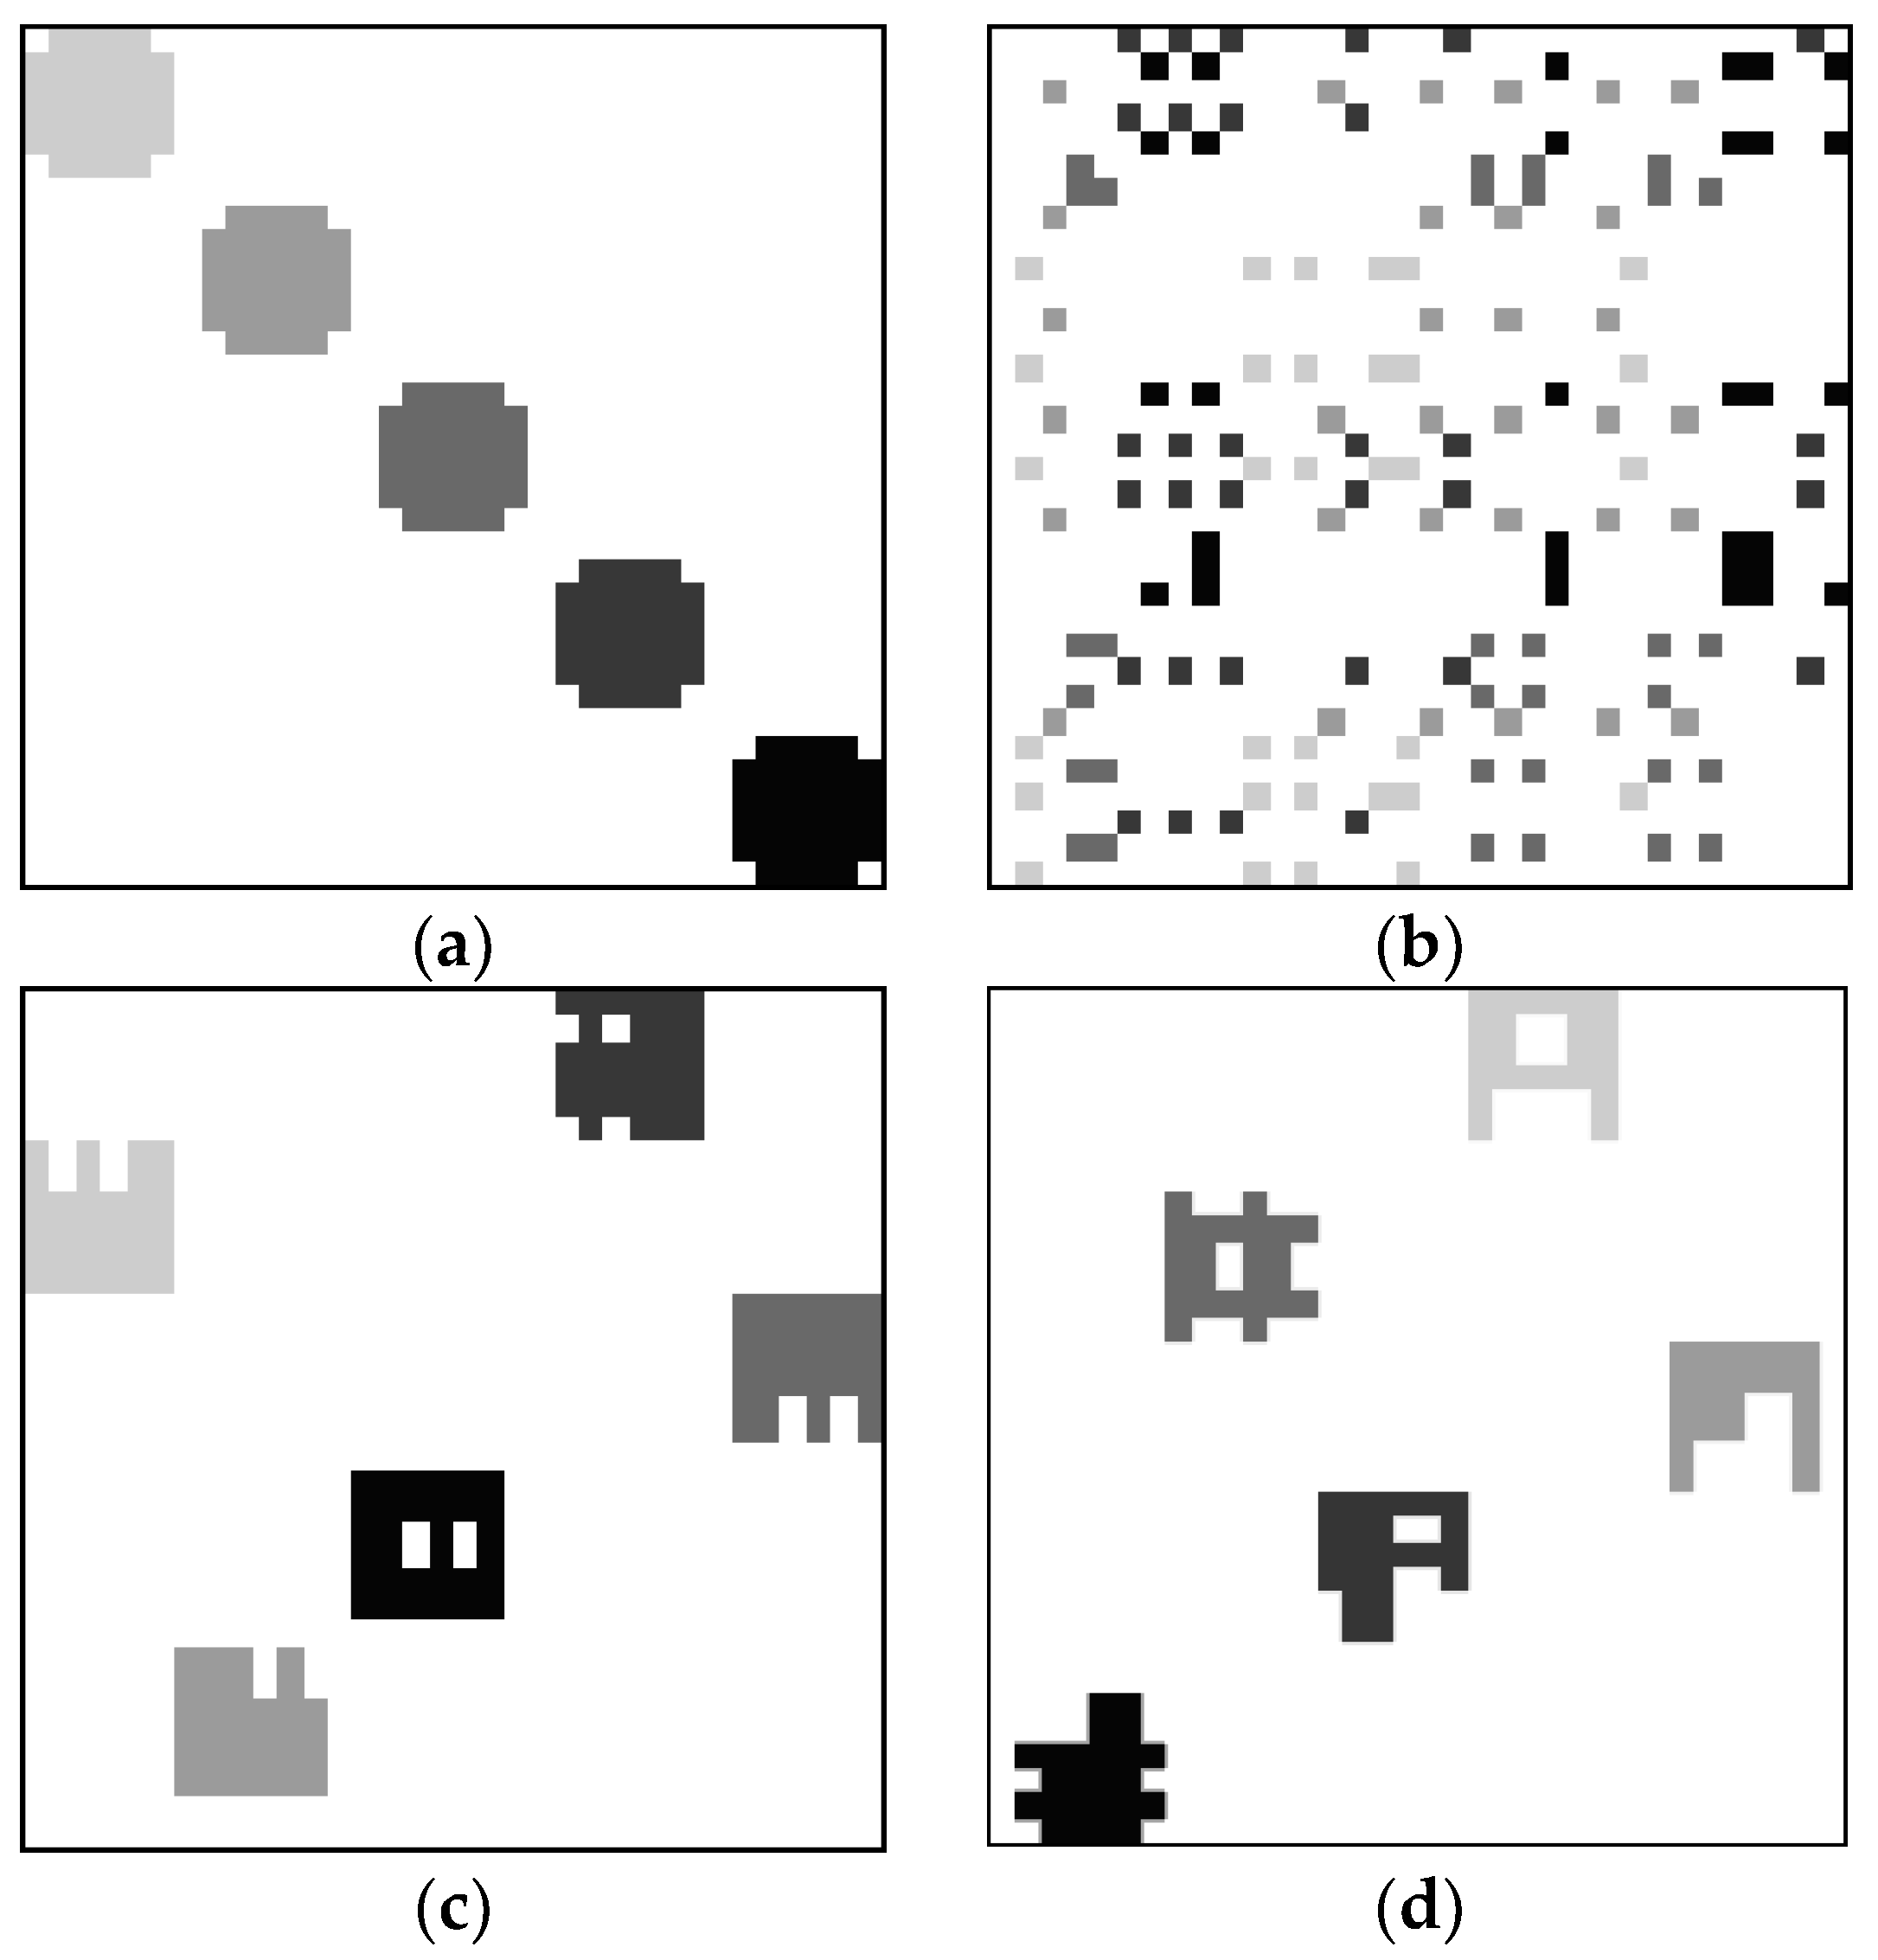
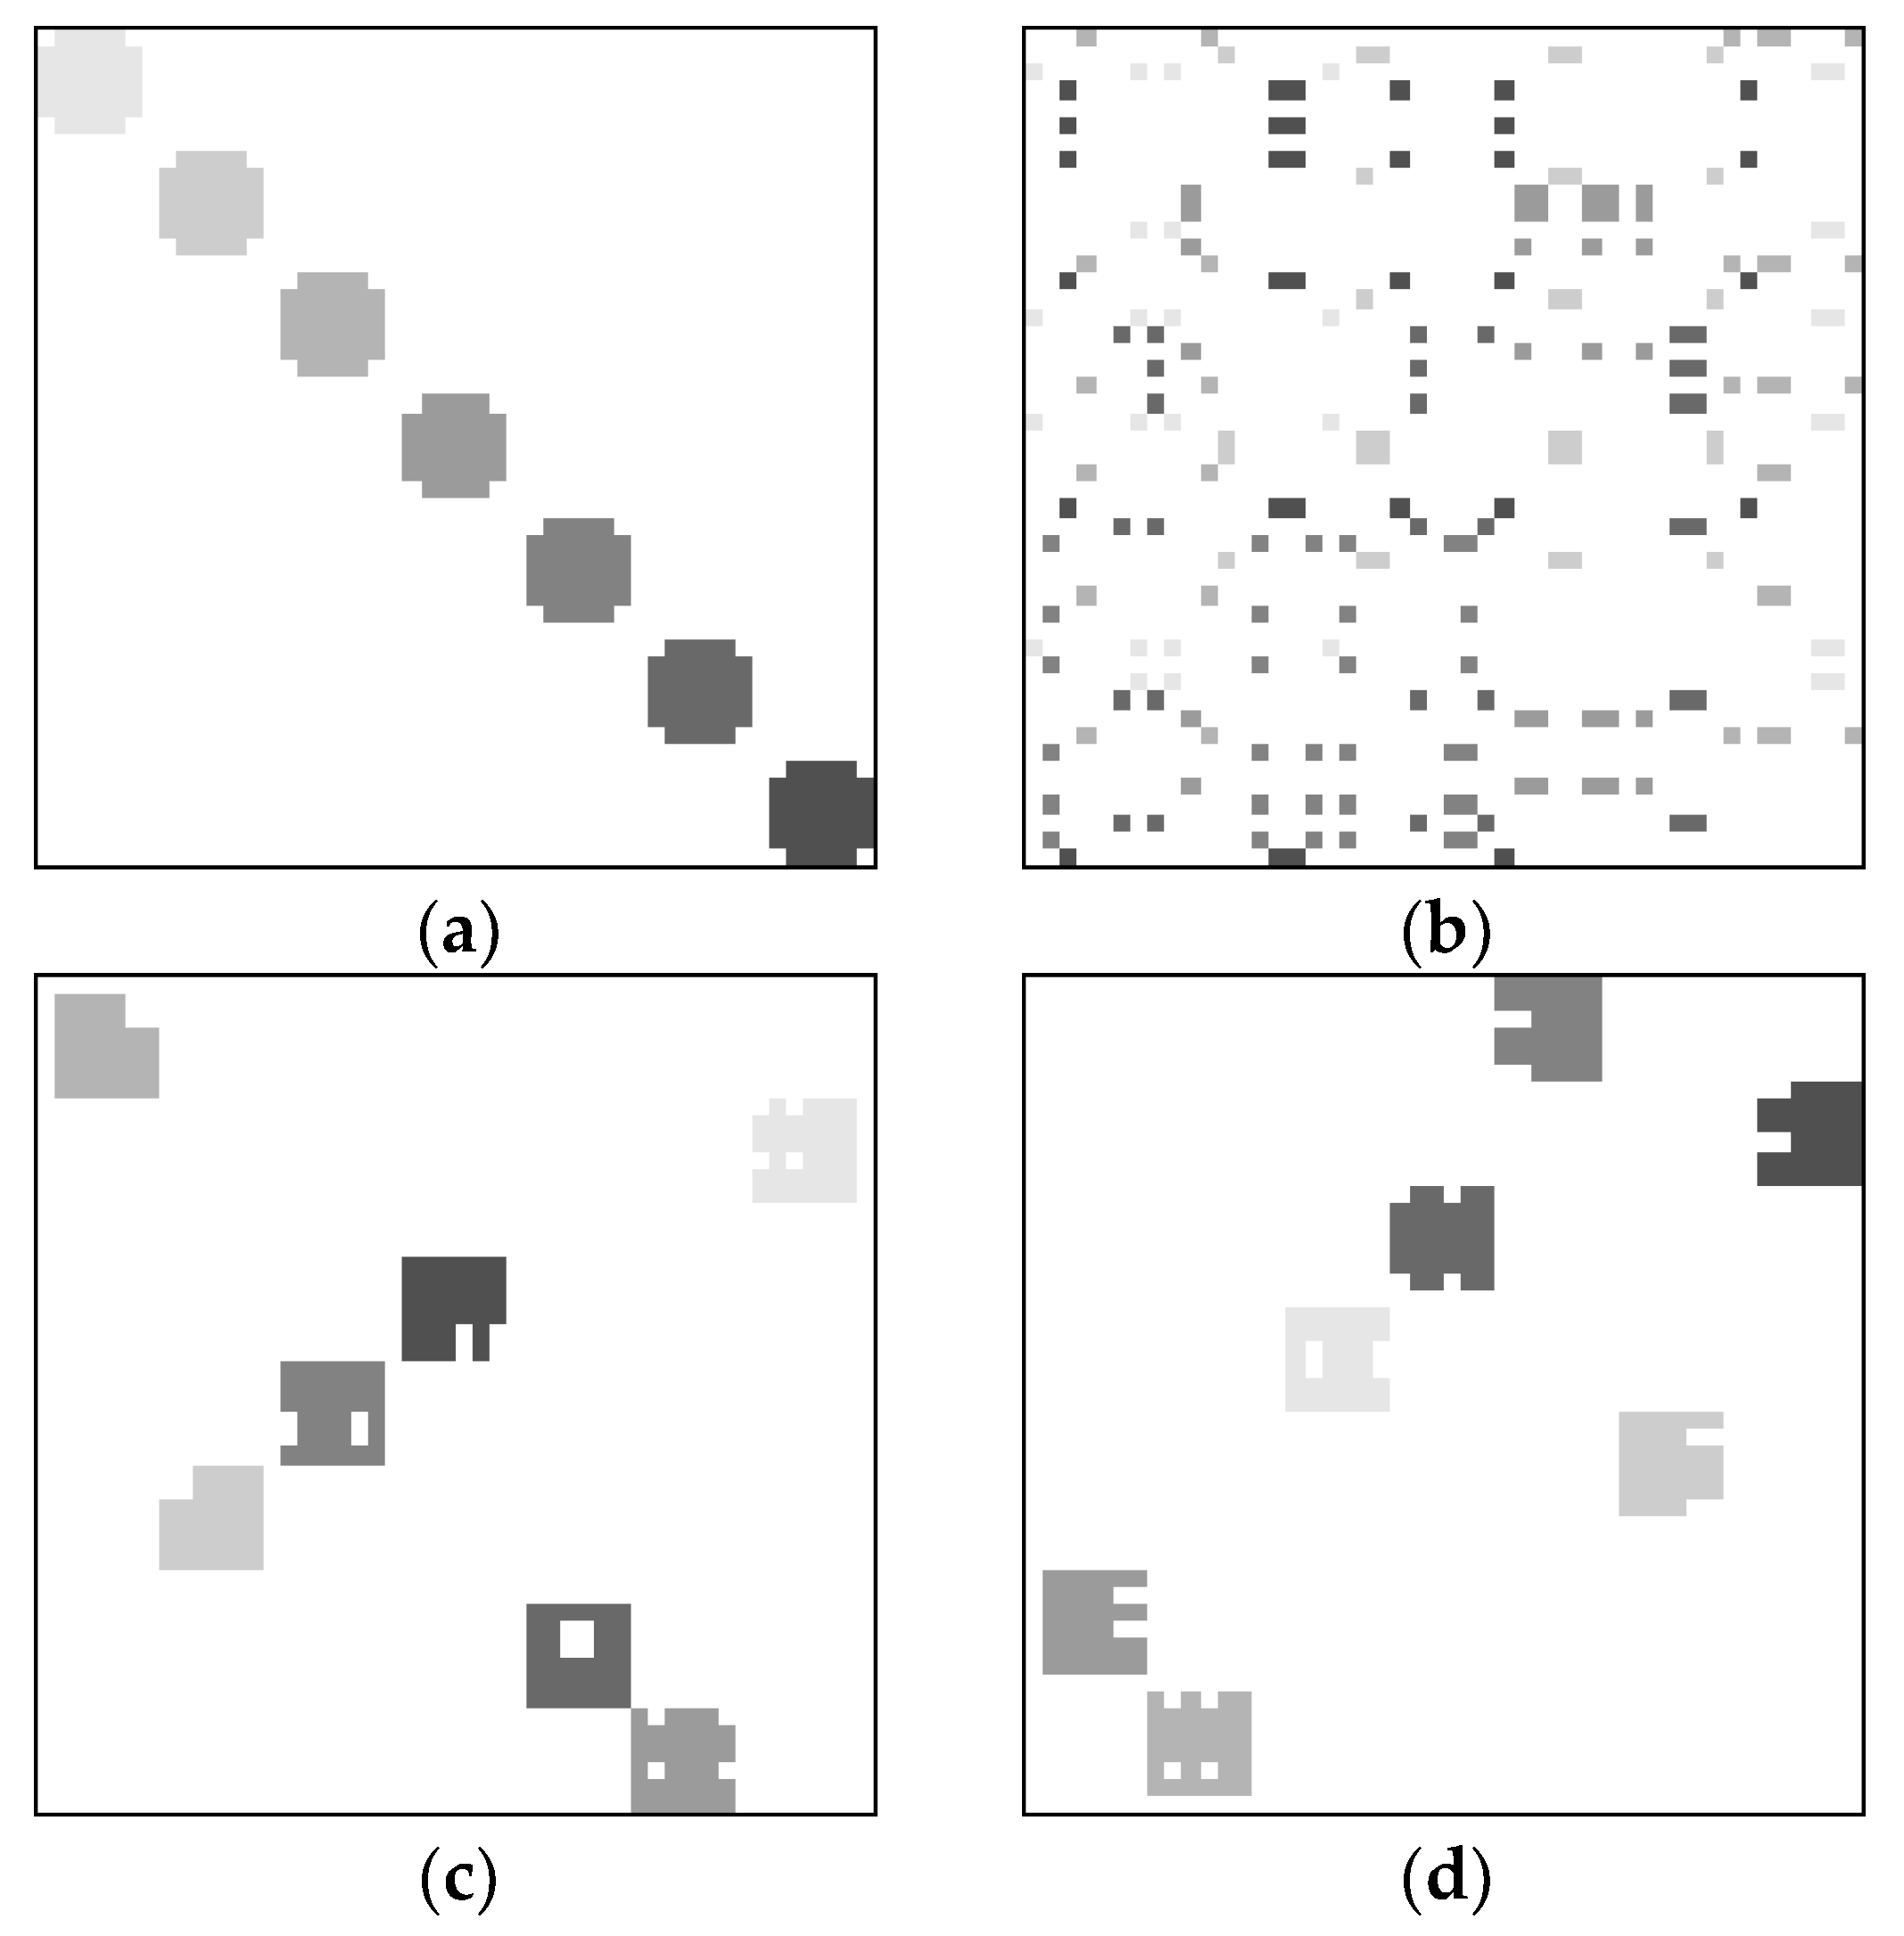
4.1.1. Clustering Results on Synthetic Data Sets

In real-world data sets, it is extremely difficult or impossible to evaluate whether a clustering method is able to properly cluster the users and items. Hence, three synthetic data sets were created to represent the data sets with prior known ground truth. Figure 4a, Figure 5a and Figure 6a show the original binary images containing three, five, and seven clusters, respectively. It should be noted that all three original images are actually binary. The gray level versions are shown here so that we can visualize the clustering performances. To indicate the elements in the same or different cluster, we label elements in the same cluster using the same gray level. For the elements in different clusters, the gray levels are different. Figure 4b, Figure 5b and Figure 6b show the corresponding images after randomly interchanging rows and columns. After applying our previously proposed VCM [39], the clustering results are shown in Figure 4c, Figure 5c and Figure 6c, respectively. Furthermore, the results using our presently proposed VCM are shown in Figure 4d, Figure 5d and Figure 6d, respectively. It can be clearly seen that both VCMs achieve three, five, and seven clusters, respectively. Although the shape and location of each cluster is different from the original one due to changes of rows and columns, the members in each cluster are the same as that in the original image. This emphasizes that the VCMs are able to properly cluster the users and items in a binary image.
Even though the VCMs achieve the correct number of clusters and correct members in each cluster, it is interesting to examine the value of compactness in each case. We consider the summation of compactness values of all objects in each image before and after clustering. It should be noted that, by the definition of compactness in Equation (4), the larger value implies a less compact object. For the three-cluster data set, the total compactness value before clustering (Figure 4b) is 7.639. After clustering, the total compactness values are 3.397 and 4.063 by using our previously proposed VCM (Figure 4c) and the presently proposed VCM (Figure 4d), respectively. The results show that our previously proposed VCM yields more overall compact clusters. It is not surprising to have these results because we take into account the compactness in our previously proposed VCM, while it is discarded in the presently proposed VCM. Likewise, for the five-cluster data set, the total compactness values of the image before clustering, after clustering using the previously proposed, and presently proposed VCMs are 12.732, 6.448, and 9.376. The total compactness values for the seven-cluster data set are 17.825, 7.808, and 8.062 for the three scenarios, respectively. All of the results suggest that the compactness of the clusters in each image have been properly taken care of by the previously proposed VCM. On the other hand, the presently proposed VCM yields less compact objects. However, as we mentioned in Section 2.1, a good cluster in the RS is not necessarily compact. That is the idea of the new fitness function in the presently proposed VCM. The recommendation results confirm the validity of this idea as shown later on in Section 4.2.

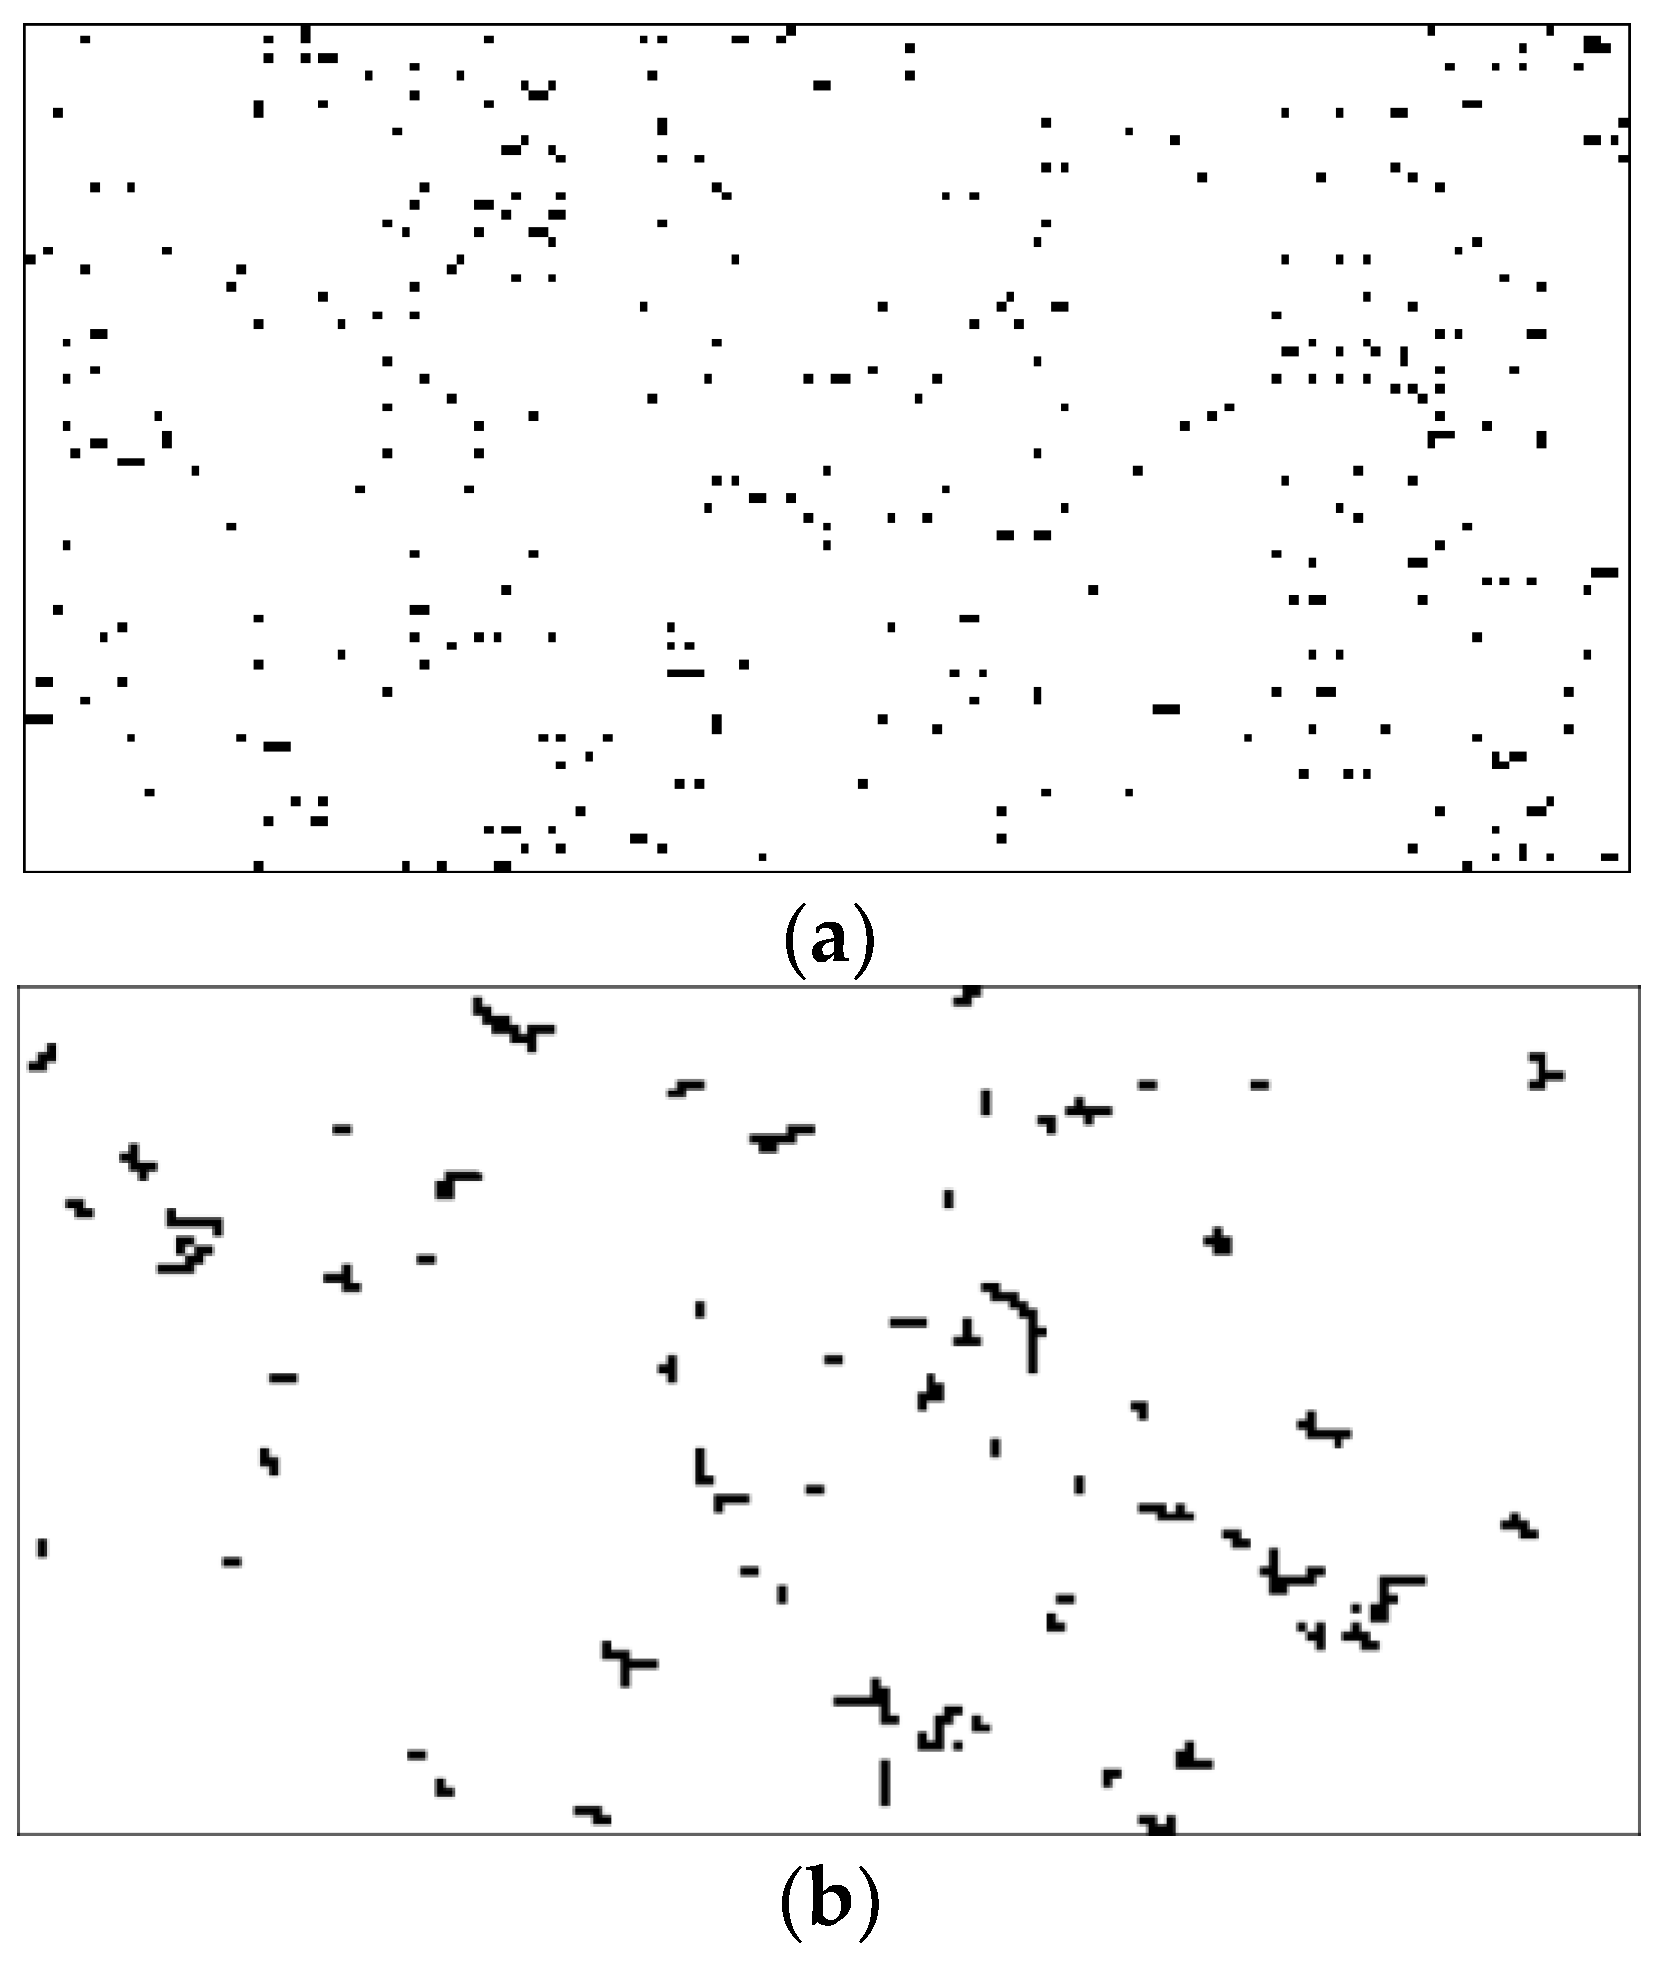
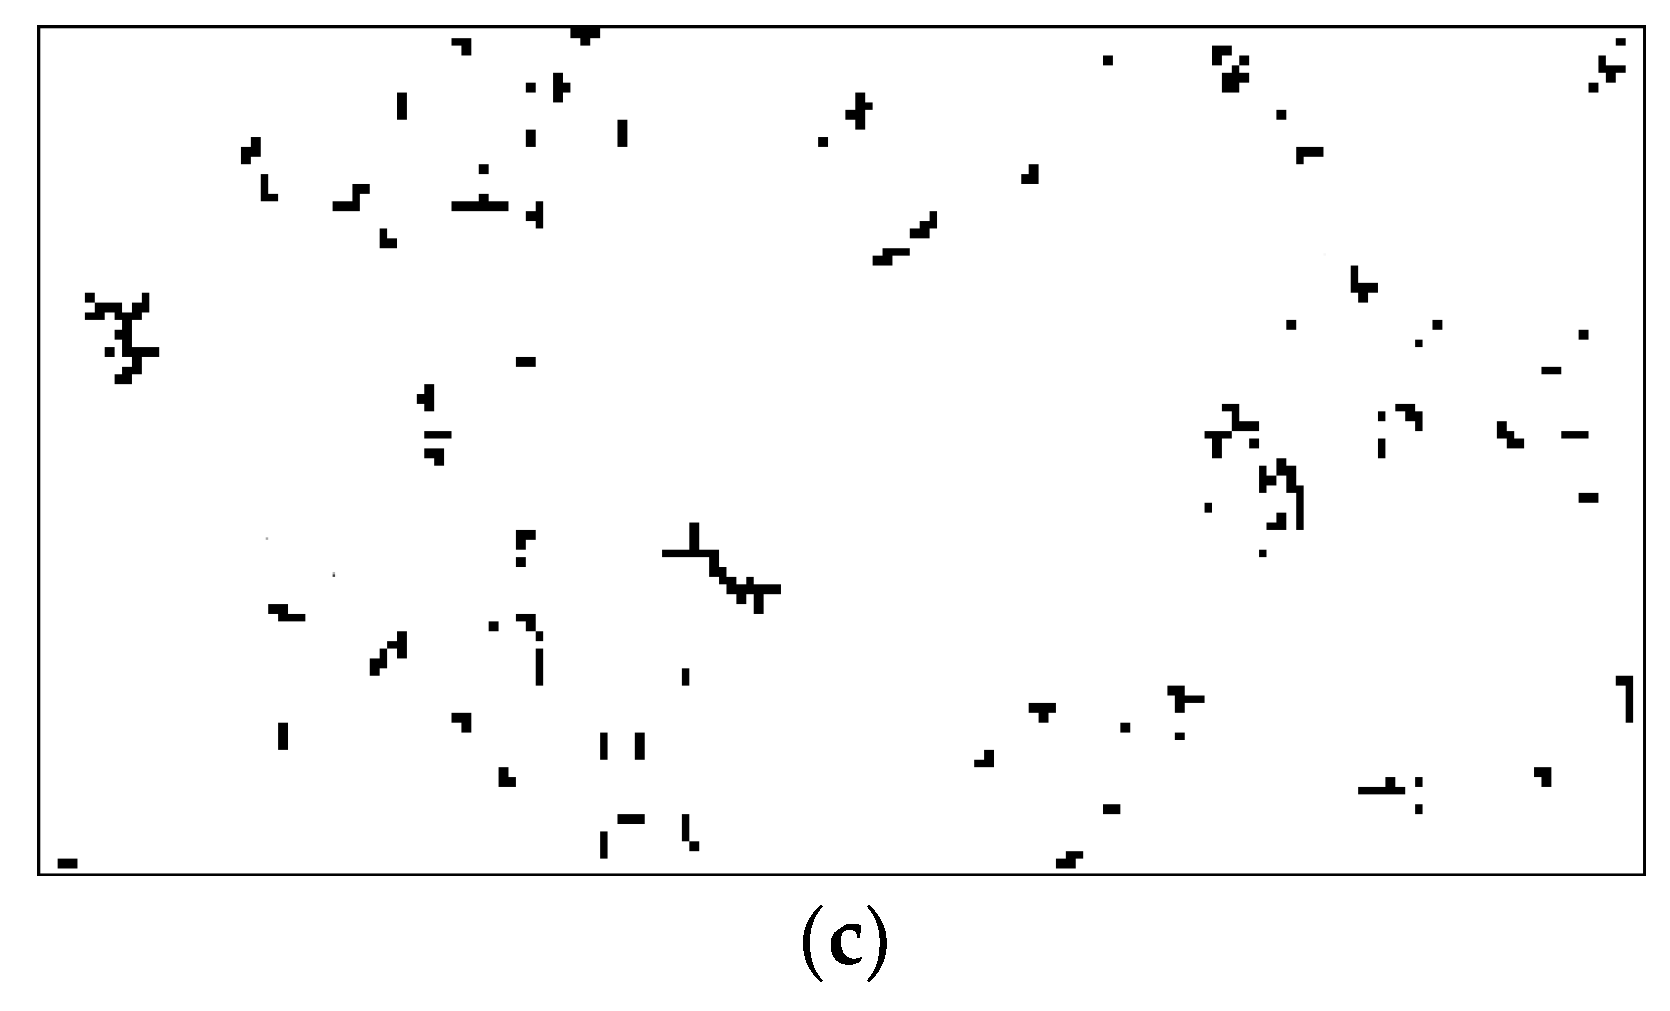
4.1.2. Clustering Results on Real-World Data Sets

The clustering results using the VCMs on the three synthetic data sets confirm that both proposed VCMs are able to cluster the information in binary images. The VCMs are then applied to cluster the users and items in the four real-world data sets. We show only the clustering results from the first two data sets. Figure 7a shows the original KDD image. The clustering results using our previously proposed VCM and the presently proposed VCM are shown in Figure 7b,c, respectively. Figure 8a shows the original TTS image, whereas the corresponding clustering results using our previously proposed VCM and the presently proposed VCM are shown in Figure 8b,c, respectively. The results clearly show that the VCMs are able to cluster the users and items in the two real-world data sets as the resulting images have much less numbers of clusters than those in the corresponding original images. The information in the derived clusters can be used in the RSs.

4.2. Top-5 Recommendation Results

In the recommendation experiments, the top-5 RSs were evaluated on the four real-world data sets. We intentionally created the cold-start problem by considering the recommendation only for new users with one or two items chosen in the baskets. This created the scenario that the RS does not have enough information about its new users, i.e., the cold-start problem. Moreover, the ten-fold cross-validation was performed to cope with the generalization of the results. It is worth noting that our previously proposed VCM has never been applied to the recommendation problem. Hence, we investigate its performance in the recommendation here. The RSs based on the derived clustered images using the VCM in [39] and the presently proposed VCM are called VCR1 and VCR2, respectively. We also proposed the hybrid versions of both VCRs by combining each of them to the traditional user-based (UB) and item-based (IB) RSs as described in Section 2.2. The combination of the VCR1 and UB is called the VCR-UB1. Likewise, the combination of the VCR1 and IB is called the VCR-IB1. The terms VCR-UB2 and VCR-IB2 are derived by the same manner, but using the VCR2. We compared the performance of all six proposed methods, i.e., VCR1, VCR-IB1, VCR-UB1, VCR2, VCR-IB2, and VCR-UB2, with the traditional methods, i.e., FB, UB, and IB. Because the ten-fold cross-validation was applied, we report the results using the average of each evaluation measure over all ten validations.
For the KDD data set, the customers who purchased at least three items were selected. Thus, each item was randomly selected for addition into the basket of the active user. We considered two scenarios here. Firstly, the user selected one item into the basket and we had to recommend other items. Secondly, the user selected two items into the basket and we had to complete the recommendation. Table 2 shows the average precision, average recall, and average F1 of the nine methods on the KDD data set based on the two scenarios. The corresponding standard deviation from each ten-fold cross-validation is also shown.
For the TTS data set, we selected only the customers who purchased at least two items. Hence, only one item was randomly selected into the basket of the active user, we then completed the recommendation. Table 3 shows the average precision, average recall, and average F1 of the nine methods on the TTS data set.
For the RCM and ECR data sets, we considered the scenarios that one to five restaurants were chosen. The average precision, average recall, and average F1 of the nine methods on the RCM and ECR data sets are shown in Table 4 and Table 5.
The recommendation results on the four real-world data sets are similar. The proposed methods, i.e., the VCR1 and VCR2, perform better than the traditional methods, i.e., IB, UB, and FB. On average, VCR2 is the best among all nine methods. This confirms that the proposed VCMs can cluster the data and the new fitness function works better than the previous one.
Using the combinations of the VCR1 and UB or IB yield better F1 than using the VCR1 alone. In fact, these combinations do not provide much help in the precision. However, they always help in the recall. That is the reason why combining with UB or IB can enhance the recommendation performance of the VCR1. However, these combinations do not work with the VCR2. They sometimes deteriorate the recommendation performance of the VCR2. For the KDD data set, when two items are selected into the basket, the recommendation performance is better than the case when only one item is selected. This is not surprising because when there are two items in the basket, we have more information of the user-item relationship. As a result, the recommended items are more likely to be chosen than in the case of one-item selection. This is the same for the ECR data set. When two or three restaurants are chosen, the better recommendation performances are achieved compared to when only one or two restaurants are chosen. This is also true for the RCM data set; when two restaurants are chosen, the better recommendation performance is achieved compared to when only one restaurant is chosen. However, when three restaurants are chosen, the performance worsens. This is due to the fact that most of the customers rated only a handful of restaurants. For example, there are only 38 customers who rated more than 10 restaurants. This makes it more difficult to have the correct items in the top-N recommendation when the number of items in the basket is larger because more correct items are already placed in the basket and there are not many left in the recommendation pool.
We also performed the comparison indirectly with other existing methods. The comparison between different methods is not straightforward because the ways of data preprocessing/cleaning are different. For the KDD data set, a cold-start eliminating method with an improved most frequency item-extracting algorithm for top-N recommendation yielded the F-measure value of 0.146 (20 neighbors were used) [48] which is a little bit better than what we achieved. It should be noted that the numbers of users and items in [48] are 1426 and 207, respectively, are less than what we have here. For the RCM data set, the fusion method using contextual features in [49] yielded the precision of 0.07–0.08 and the recall of 0.30–0.32. Meanwhile, it can be seen in Table 4 that the proposed methods yielded comparable recall but much better precision. For the ECR data set, we compare our results to other methods directly because we used data from one-quarter only due to computation time constraint. The previous method using contextual information as virtual items in [50] yielded an F1 measure of 0.225 using collaborative filtering and 0.341 using association rules.
Memory required to run each of the proposed methods may not be a problem here because the main portion is for storing the binary images. The memory required for a set of binary images is nIJ bits, where n is the number of the binary images (set to 80 in this research), I is the number of users, and J is the number of items. Hence, the memory required to store binary images during the clustering (training) process for the KDD, TTS, RCM, and ECR data sets are approximately 27 KB, 19 KB, 18 KB, and 235 KB, respectively. For the recommendation (testing) process, only one final binary image is required for each data set. We tested the proposed methods on a computer with i5 CPU, 4 GB RAM, running on Windows 10, 64-bit operating system. Please be reminded that 10-fold cross-validation was performed in our experiments; the average computation times to cluster images in each cross-validation for the KDD, TTS, RCM, and ECR data sets are 4 h 34 min, 4 h 44 min, 4 h 19 min, 10 h 30 min, respectively. These are the approximated computation times for these data sets in a real-world application. However, in our experiments, the clustering processing for each data set was performed ten independent times (ten-fold cross-validation). Therefore, the times taken in our experiments were about ten times those. On the other hand, the recommendation time is very quick. The computation times for each recommendation for the KDD, TTS, RCM, and ECR data sets are 0.9 ms, 1.0 ms, 1.1 ms, and 2.1 ms, respectively.

5. Conclusions

To solve the cold-start and sparsity problems in the recommender systems (RS), we have developed recommendation methods based on clustered user-item images. In this study, we improved a clustering method by changing the fitness function in the genetic algorithm and applying it to the recommendation problem. The proposed clustering methods worked very well with a set of synthetic data sets whose ground truths were known a priori. Even though the clustering results look good visually, it is extremely hard to evaluate whether they work properly in more complicated scenarios like that in the real-world recommendation data sets. We, therefore, further applied results from the clustering methods to generate top-5 recommendations to active users with VCR1 and VCR2. We also combined both methods with the user-based method (UB) or item-based method (IB).
Four real-world data sets were used, i.e., the transaction of purchasing collected by Blue Martini Software on KDD-CUP2000 (KDD), the transaction of purchasing at Thaiherbs-Thaimassage shop (TTS) [47], the restaurant and consumer data set (RCM) collected by the Department of Computer Science, National Center for Research and Technological Development in Mexico, and the entree Chicago restaurant (ECR) data set collected by the University of California, Irvine. The proposed methods were tested on both real-world data sets using ten-fold cross-validation. The evaluation measure used here included precision, recall, and F1 score. The proposed VCRs and their respective combinations with UB and IB were compared with three traditional methods, i.e., frequency-based, user-based, and item-based methods. The recommendation results showed that the VCR2 was the best among all nine methods tested. This confirms that changing the fitness function yields better clustering results. The combinations with UB or IB help the VCR1, but deteriorate the performance of the VCR2. In real application, the actual purchase by a new user can be used directly to update the current clusters by setting the pixels at the corresponding user and items to one. The purchasing frequencies of those items are also updated. Therefore, these clusters can be updated without reclustering the entire data set. This proposed method is very useful for e-commerce applications. The results from the VCR2 are currently used for the recommendation at the website of Thaiherbs-Thaimassage shop.
Unlike other clustering methods proposed for recommendation problems, our proposed methods provide the visualization of user-item interactions in the clustered images. Each cluster possesses many useful characteristics that the system owners can extract and use later on. We hope that the clustered images will cull a great deal more new information from these transactions/ratings than is currently possible with existing methods. It should be noted that it is theoretically feasible to implement the proposed methods on an extremely large data set, i.e., millions of customers and millions of items. However, it is not presently practical due to technological limitations. Judging from the speed of computation machine development, however, we believe that more powerful computers or a new kind computation machine that can handle such complexity will be available on the market in the near future.

Acknowledgments

We would like to thank the Office of the Higher Education Commission, Thailand for supporting this study by grant fund under the Strategic Scholarships for Frontier Research Network for the Ph.D. Program Thai Doctoral degree. We wish to thank Blue Martini Software for contributing datasets on KDD-CUP 2000. We acknowledge the University of California, Irvine and the National Center for Research and Technological Development in Mexico for their contributions on the ECR and RCM data sets, respectively. We would like to thank Thaiherbs-Thaimassage shop for letting us collect the valuable data. The authors would like to thank the anonymous reviewers very much for their valuable comments leading to the vast improvement of this work.

Author Contributions

All authors participated in several technical discussions on this research including the problem statements and their solutions. Ukirt Marung conducted the data collection and experiments. All authors prepared the initial manuscript and its corresponding revisions and proofread the final version.

Conflicts of Interest

The authors declare no conflict of interest.

References

  1. Lops, P.; Gemmis, M.; de Semeraro, G. Content-based Recommender Systems: State of the Art and Trends. In Recommender Systems Handbook; Ricci, F., Rokach, L., Shapira, B., Kantor, P.B., Eds.; Springer US: New York, NY, USA, 2011. [Google Scholar]
  2. Adomavicius, G.; Tuzhilin, A. Toward the next generation of recommender systems: A survey of the state-of-the-art and possible extensions. IEEE Trans. Knowl. Data Eng. 2005, 17, 734–749. [Google Scholar] [CrossRef]
  3. Melville, P.; Mooney, R.J.; Nagarajan, R. Content-boosted collaborative filtering for improved recommendations. In Proceedings of the Eighteenth National Conference on Artificial Intelligence, Edmonton, AB, Canada, 28 July–1 August 2002.
  4. Salter, J.; Antonopoulos, A. Cinema screen recommender agent: Combining collaborative and content-based filtering. IEEE Intell. Syst. 2006, 21, 35–41. [Google Scholar] [CrossRef]
  5. Zhang, F.; Chang, H. A collaborative filtering algorithm employing genetic clustering to ameliorate the scalability issue. In Proceedings of the IEEE International Conference on e-Business Engineering, Shanghai, China, 24–26 October 2006.
  6. Gong, S. Joining case-based reasoning and item-based collaborative filtering in recommender systems. In Proceedings of the Second International Symposium on Electronic Commerce and Security 2009, Nanchang, China, 22–24 May 2009.
  7. Linden, G.; Smith, B.; York, J. Amazon.com recommendations item-to-item collaborative filtering. IEEE Internet Comput. 2003, 7, 76–80. [Google Scholar] [CrossRef]
  8. Bogdanova, G.; Georgieva, T. Using error-correcting dependencies for collaborative filtering. Data Knowl. Eng. 2008, 66, 402–413. [Google Scholar] [CrossRef]
  9. Yakut, I.; Polat, H. Arbitrarily distributed data-based recommendations with privacy. Data Knowl. Eng. 2012, 72, 239–256. [Google Scholar] [CrossRef]
  10. Adomavicius, G.; Kwon, Y. New recommendation techniques for multicriteria rating systems. IEEE Intell. Syst. 2007, 22, 48–55. [Google Scholar] [CrossRef]
  11. Weng, S.-S.; Liu, M.-J. Feature-based recommendations for one-to-one marketing. Expert Syst. Appl. 2004, 26, 493–508. [Google Scholar] [CrossRef]
  12. Lee, Y.-H.; Hu, P.J.-H.; Cheng, T.-H.; Hsieh, Y.-F. A cost-sensitive technique for positive-example learning supporting content-based product recommendations in B-to-C e-commerce. Decis. Support Syst. 2012, 53, 245–256. [Google Scholar] [CrossRef]
  13. Kagie, M.; van Wezel, M.; Groenen, P.J.F. A graphical shopping interface based on product attributes. Decis. Support Syst. 2008, 46, 265–276. [Google Scholar] [CrossRef]
  14. Dai, Y.; Ye, H.; Gong, S. Personalized recommendation algorithm using user demography information. In Proceedings of the Second International Workshop on Knowledge Discovery and Data Mining 2009, Moscow, Russia, 23–25 January 2009.
  15. Sarwar, B.; Karypis, G.; Konstan, J.; Riedl, J. Analysis of recommendation algorithms for e-Commerce. In Proceedings of the 2nd ACM conference on Electronic commerce, Minneapolis, MN, USA, 17–20 October 2000.
  16. Luo, X.; Liu, H.; Gou, G.; Xia, Y.; Zhu, Q. A parallel matrix factorization based recommender by alternating stochastic gradient decent. Eng. Appl. Artif. Intell. 2012, 25, 1403–1412. [Google Scholar] [CrossRef]
  17. Choi, K.; Yoo, D.; Kim, G.; Suh, Y. A hybrid online-product recommendation system: combining implicit rating-based collaborative filtering and sequential pattern analysis. Electron. Commer. Res. Appl. 2012, 11, 309–317. [Google Scholar] [CrossRef]
  18. Kim, H.-N.; Ha, I.; Lee, K.-S.; Jo, G.-S.; El-Saddik, A. Collaborative user modeling for enhanced content filtering in recommender systems. Decis. Support Syst. 2011, 51, 772–781. [Google Scholar] [CrossRef]
  19. Blanco-Fernandez, Y.; Lopex-Nores, M.; Pazos-Arias, J.J.; Garcia-Duque, J. An improvement for sementics-based recommender systems grounded on attaching temporal information on ontologies and user profiles. Eng. Appl. Artif. Intell. 2011, 24, 1385–1397. [Google Scholar] [CrossRef]
  20. Moreno, A.; Vallas, A.; Isern, D.; Marin, L.; Barras, J. SigTur/E-Destination: Ontology-based personalized recommendation of tourism and leisure activities. Eng. Appl. Artif. Intell. 2013, 26, 633–651. [Google Scholar] [CrossRef]
  21. Kim, H.-N.; Ji, A.-T.; Ha, I.; Jo, G.-S. Collaborative filtering based on collaborative tagging for enhancing the quality of recommendation. Electron. Commer. Res. Appl. 2010, 9, 73–83. [Google Scholar] [CrossRef]
  22. Piramuthu, S.; Kapoor, G.; Zhou, W.; Mauw, S. Input online review data and related bias in recommender systems. Decis. Support Syst. 2012, 53, 418–424. [Google Scholar] [CrossRef]
  23. Symeonidis, P.; Tiakas, E.; Manolopoulos, Y. Transitive Node Similarity for Link: Prediction in Social Networks with Positive and Negative Links. In Proceedings of the Fourth ACM Conference on Recommender Systems, RecSys 2010, Barcelona, Spain, 26–30 September 2010.
  24. Yang, X.; Steck, H.; Liu, Y. Circle-based Recommendation in Online Social Networks. In Proceedings of the 18th ACM SIGKDD International Conference on Knowledge Discovery and Data Mining, KDD 2012, Beijing, China, 12–16 August 2012.
  25. Jahrer, M.; Töscher, A.; Legenstein, R. Combining Predictions for Accurate Recommender Systems. In Proceedings of the 16th ACM SIGKDD International Conference on Knowledge Discovery and Data Mining, KDD 2010, Washington, DC, USA, 25–28 July 2010.
  26. Good, N.; Schafer, J.B.; Konstan, J.A.; Borchers, A.; Sarwar, B.; Herlocker, J.; Riedl, J. Combining collaborative filtering with personal agents for better recommendations. In Proceedings of the Sixteenth National Conference on Artificial Intelligence and the Eleventh Innovative Applications of Artificial Intelligence Conference Innovative Applications of Artificial Intelligence, Orlando, FL, USA, 18–22 July 1999.
  27. Leroy, V.; Cambazoglu, B.B.; Bonchi, F. Cold Start Link Prediction. In Proceedings of the 16th ACM SIGKDD International Conference on Knowledge Discovery and Data Mining, KDD 2010, Washington, DC, USA, 25–28 July 2010.
  28. Park, S.-T.; Chu, W. Pairwise Preference Regression for Cold-start Recommendation. In Proceedings of the Third ACM Conference on Recommender Systems, RecSys 2009, New York, NY, USA, 22–25 October 2009.
  29. Weng, L.T.; Xu, Y.; Li, Y.; Nayak, R. Exploiting Item Taxonomy for Solving Cold-Start Problem in Recommendation Making. In Proceedings of the 2008 20th IEEE International Conference on Tools with Artificial Intelligence, Dayton, OH, USA, 3–5 November 2008.
  30. Cao, Y.; Li, Y. An intelligent fuzzy-based recommendation system for consumer electronic products. Expert Syst. Appl. 2007, 33, 230–240. [Google Scholar] [CrossRef]
  31. Park, Y.-J.; Chang, K.-N. Individual and group behavior-based customer profile model for personalized product recommendation. Expert Syst. Appl. 2009, 36, 1932–1939. [Google Scholar] [CrossRef]
  32. Kim, H.-N.; El-Saddik, A.; Jo, G.-S. Collaborative error-reflected models for cold-start recommender systems. Decis. Support Syst. 2011, 51, 519–531. [Google Scholar] [CrossRef]
  33. Yu, L.; Pan, R.; Li, Z. Adaptive Social Similarities for Recommender Systems. In Proceedings of the Fifth ACM Conference on Recommender Systems, RecSys 2011, Chicago, IL, USA, 23–27 October 2011.
  34. Jamali, M.; Ester, M. A Matrix Factorization Technique with Trust Propagation for Recommendation in Social Networks. In Proceedings of the Fourth ACM Conference on Recommender Systems, RecSys 2010, Barcelona, Spain, 26–30 September 2010.
  35. Zhang, Y.; Cao, B.; Yeung, D.-Y. Multi-Domain Collaborative Filtering. In Proceedings of the Twenty-Sixth Conference on Uncertainty in Artificial Intelligence (UAI2010), Catalina Island, CA, USA, 8–11 July 2010.
  36. Si, S.; Shin, D.; Dhillon, I.S.; Parlett, B.N. Multi-Scale Spectral Decomposition of Massive Graphs. In Proceedings of the Advances in Neural Information Processing Systems 27, Montréal, QC, Canada, 8–13 December 2014.
  37. Karatzoglou, A.; Amatriain, X.; Baltrunas, L.; Oliver, N. Multiverse Recommendation: N-dimensional Tensor Factorization for Context-aware Collaborative Filtering. In Proceedings of the Fourth ACM Conference on Recommender Systems, RecSys 2010, Barcelona, Spain, 26–30 September 2010.
  38. Luo, Y.; Hu, J.; Wei, X. Blog Recommender Based on Hypergraph Modeling Clustering Algorithm. In Proceedings of the 2013 Fourth World Congress on Software Engineering, WCSE 2013, Hong Kong, China, 3–4 December 2013; pp. 231–235.
  39. Marung, U.; Theera-Umpon, N.; Auephanwiriyakul, S. Visual clustering method using genetic algorithm and image manipulation. In Proceedings of the 2011 International Symposium on Intelligent Signal Processing and Communications Systems, Chiang Mai, Thailand, 7–9 December 2011.
  40. Linqi, L.; Li, C. Hybrid personalized recommended model based on genetic algorithm. In Proceedings of the 4th International Conference on Wireless Communications, Networking and Mobile Computing, Dalian, China, 12–14 October 2008.
  41. Kim, K.-J.; Ahn, H. A recommender system using GA k-means clustering in an online shopping market. Expert Syst. Appl. 2008, 34, 1200–1209. [Google Scholar] [CrossRef]
  42. Dorn, C.; Skopik, F.; Schall, D.; Dustdar, S. Interaction mining and skill-dependent recommendations for multi-objective team composition. Data Knowl. Eng. 2011, 70, 866–891. [Google Scholar] [CrossRef] [PubMed]
  43. Goldberg, D.E. Genetic Algorithms in Search, Optimization, and Machine Learning; Addison-Wesley Publishing: Boston, MA, USA, 1989. [Google Scholar]
  44. Karypis, G. Evaluation of item-based top-N recommendation algorithms. In Proceedings of the Tenth International Conference on Information and Knowledge management, McLean, VA, USA, 6–11 November 2000.
  45. Herlocker, J.L.; Konstan, J.A.; Terveen, L.G.; Riedl, J.T. Evaluating collaborative filtering recommender systems. ACM Trans. Inf. Syst. 2004, 22, 5–53. [Google Scholar] [CrossRef]
  46. Lin, P.; Yang, F.; Yu, X.; Xu, Q. Personalized e-commerce recommendation based on ontology. In Proceedings of the International Conference on Internet Computing in Science and Engineering 2008, Harbin, China, 28–29 January 2008.
  47. Thaiherbs-Thaimassage Shop. Available online: http://www.thaiherbs-thaimassage.com/ (accessed on 1 October 2015).
  48. Li, C.; Liang, C.-Y. Cold-start eliminating method of collaborative filtering based on n-sequence access analytic logic. Syst. Eng. Theory Pract. 2012, 7, 1537–1545. [Google Scholar]
  49. Vargas-Govea, B.; Gonzalez-Serna, J.B.; Ponce-Medellan, R. Effects of relevant contextual features in the performance of a restaurant recommender system. In Proceedings of the Workshop on Context-Aware Recommender Systems, Chicago, IL, USA, 23 October 2011.
  50. Domingues, M.A.; Jorge, A.M.; Soares, C. Using contextual information as virtual items on top-N recommender systems. In Proceedings of the Workshop on Context-Aware Recommender Systems, New York, NY, USA, 25 October 2009.
Figure 1. Model of the proposed top-N recommendation systems.
Symmetry 08 00054 g001
Figure 2. (a) User-item table; (b) Binary image.
Symmetry 08 00054 g002
Figure 3. Example of the initial population.
Symmetry 08 00054 g003
Figure 4. (a) Original 3-cluster binary image; (b) Row-column-interchanged binary image; (c) Result of Figure 4b using our previously proposed VCM; (d) Result of Figure 4b using our presently proposed VCM.
Symmetry 08 00054 g004
Figure 5. (a) Original 5-cluster binary image; (b) Row-column-interchanged binary image; (c) Result of Figure 5b using our previously proposed VCM; (d) Result of Figure 5b using our presently proposed VCM.
Symmetry 08 00054 g005
Figure 6. (a) Original 7-cluster binary image; (b) Row-column-interchanged binary image; (c) Result of Figure 6b using our previously proposed VCM; (d) Result of Figure 6b using our presently proposed VCM.
Symmetry 08 00054 g006
Figure 7. (a) Original KDD image; (b) Clustering result of Figure 7a using our previously proposed VCM; (c) Clustering result of Figure 7a using our currently proposed VCM.
Symmetry 08 00054 g007aSymmetry 08 00054 g007b
Figure 8. (a) Original TTS image; (b) Clustering result of Figure 8a using our previously proposed VCM; (c) Clustering result of Figure 8a using our currently proposed VCM.
Symmetry 08 00054 g008
Table 1. Sample chromosomes and fitness values.
IChromosomeFitnessPi
11 4 2 3 5 | 1 2 3 40.100.075
24 3 1 2 5 | 3 2 4 10.620.466
33 5 4 1 2 | 4 1 3 20.390.293
42 4 3 1 5 | 2 3 1 40.220.166
Table 2. Recommendation performance comparison on KDD data set when one and two items are selected into the basket (average ± standard deviation, evaluated on test sets of 10-fold cross-validation).
MethodOne ItemTwo Items
PrecisionRecallF1PrecisionRecallF1
UB0.03 ± 0.010.07 ± 0.020.04 ± 0.010.05 ± 0.020.11 ± 0.050.07 ± 0.02
IB0.04 ± 0.020.07 ± 0.040.05 ± 0.020.04 ± 0.020.11 ± 0.050.06 ± 0.03
FB0.02 ± 0.010.03 ± 0.010.02 ± 0.010.01 ± 0.010.05 ± 0.030.02 ± 0.01
VCR10.05 ± 0.030.08 ± 0.040.06 ± 0.050.07 ± 0.050.11 ± 0.060.09 ± 0.05
VCR-UB10.04 ± 0.030.08 ± 0.050.05 ± 0.040.06 ± 0.020.16 ± 0.050.09 ± 0.03
VCR-IB10.05 ± 0.040.12 ± 0.100.07 ± 0.050.07 ± 0.030.19 ± 0.070.10 ± 0.04
VCR20.07 ± 0.050.11 ± 0.100.09 ± 0.060.09 ± 0.050.19 ± 0.070.12 ± 0.05
VCR-UB20.05 ± 0.040.11 ± 0.100.07 ± 0.050.05 ± 0.040.15 ± 0.100.08 ± 0.05
VCR-IB20.05 ± 0.040.11 ± 0.100.07 ± 0.050.05 ± 0.030.17 ± 0.080.08 ± 0.04
Table 3. Recommendation performance comparison on TTS data set when one item is selected into the basket (average ± standard deviation, evaluated on test sets of 10-fold cross-validation).
MethodPrecisionRecallF1
UB0.13 ± 0.080.24 ± 0.150.17 ± 0.10
IB0.09 ± 0.040.19 ± 0.130.12 ± 0.06
FB0.07 ± 0.030.16 ± 0.100.10 ± 0.05
VCR10.14 ± 0.080.21 ± 0.120.16 ± 0.09
VCR-UB10.15 ± 0.060.30 ± 0.140.18 ± 0.10
VCR-IB10.15 ± 0.070.28 ± 0.150.18 ± 0.10
VCR20.28 ± 0.130.40 ± 0.170.33 ± 0.15
VCR-UB20.18 ± 0.060.42 ± 0.180.24 ± 0.08
VCR-IB20.19 ± 0.060.44 ± 0.200.25 ± 0.09
Table 4. Recommendation performance comparison on RCM data set when one to three restaurants are selected (average ± standard deviation, evaluated on test sets of 10-fold cross-validation).
MethodOne RestaurantTwo RestaurantsThree Restaurants
PrecisionRecallF1PrecisionRecallF1PrecisionRecallF1
UB0.21 ± 0.110.19 ± 0.100.20 ± 0.090.14 ± 0.040.17 ± 0.060.16 ± 0.040.12 ± 0.080.16 ± 0.070.14 ± 0.07
IB0.19 ± 0.100.17 ± 0.080.18 ± 0.090.18 ± 0.100.20 ± 0.110.19 ± 0.100.14 ± 0.090.14 ± 0.080.14 ± 0.08
FB0.14 ± 0.070.08 ± 0.040.10 ± 0.050.12 ± 0.070.08 ± 0.050.09 ± 0.060.12 ± 0.100.08 ± 0.050.10 ± 0.07
VCR10.22 ± 0.070.38 ± 0.100.28 ± 0.080.17 ± 0.080.25 ± 0.140.20 ± 0.090.15 ± 0.040.20 ± 0.090.17 ± 0.06
VCR-UB10.22 ± 0.110.31 ± 0.130.26 ± 0.110.15 ± 0.090.24 ± 0.140.18 ± 0.100.13 ± 0.100.21 ± 0.120.16 ± 0.11
VCR-IB10.20 ± 0.110.29 ± 0.130.24 ± 0.110.19 ± 0.130.33 ± 0.180.24 ± 0.140.14 ± 0.090.25 ± 0.150.18 ± 0.10
VCR20.22 ± 0.100.34 ± 0.150.27 ± 0.110.21 ± 0.060.32 ± 0.080.25 ± 0.050.17 ± 0.060.25 ± 0.090.20 ± 0.06
VCR-UB20.20 ± 0.110.28 ± 0.160.23 ± 0.120.16 ± 0.070.25 ± 0.120.20 ± 0.080.13 ± 0.110.25 ± 0.150.17 ± 0.11
VCR-IB20.20 ± 0.110.30 ± 0.150.24 ± 0.120.19 ± 0.080.32 ± 0.150.24 ± 0.100.15 ± 0.120.29 ± 0.200.20 ± 0.13
Table 5. Recommendation performance comparison on ECR data set when one to three restaurants are selected (average ± standard deviation, evaluated on test sets of 10-fold cross-validation).
MethodOne RestaurantTwo RestaurantsThree Restaurants
PrecisionRecallF1PrecisionRecallF1PrecisionRecallF1
UB0.36 ± 0.100.26 ± 0.070.30 ± 0.120.33 ± 0.110.29 ± 0.150.31 ± 0.120.28 ± 0.070.29 ± 0.070.28 ± 0.07
IB0.37 ± 0.120.25 ± 0.100.30 ± 0.110.39 ± 0.070.33 ± 0.110.36 ± 0.090.35 ± 0.070.39 ± 0.110.37 ± 0.08
FB0.12 ± 0.070.16 ± 0.070.14 ± 0.070.13 ± 0.060.17 ± 0.100.15 ± 0.070.11 ± 0.040.17 ± 0.110.13 ± 0.05
VCR10.40 ± 0.050.63 ± 0.070.49 ± 0.050.40 ± 0.040.60 ± 0.070.48 ± 0.040.38 ± 0.030.61 ± 0.040.47 ± 0.03
VCR-UB10.33 ± 0.050.46 ± 0.060.38 ± 0.050.34 ± 0.050.53 ± 0.080.41 ± 0.060.28 ± 0.030.40 ± 0.020.33 ± 0.02
VCR-IB10.37 ± 0.020.48 ± 0.030.42 ± 0.020.38 ± 0.030.60 ± 0.050.47 ± 0.030.37 ± 0.030.73 ± 0.050.49 ± 0.03
VCR20.42 ± 0.070.37 ± 0.060.39 ± 0.060.41 ± 0.040.45 ± 0.050.43 ± 0.040.38 ± 0.020.61 ± 0.030.47 ± 0.02
VCR-UB20.36 ± 0.050.55 ± 0.050.44 ± 0.040.33 ± 0.050.54 ± 0.070.41 ± 0.050.28 ± 0.030.53 ± 0.020.37 ± 0.02
VCR-IB20.38 ± 0.050.52 ± 0.070.44 ± 0.050.39 ± 0.070.60 ± 0.110.47 ± 0.090.38 ± 0.030.73 ± 0.040.50 ± 0.03

