Article

Cloud-Based Parameter-Driven Statistical Services and Resource Allocation in a Heterogeneous Platform on Enterprise Environment

1
Department of Computer Information and Science, Korea University, Sejong 30019, Korea
2
Department of Computer Science and Engineering, Seoul Women’s University, Seoul 01797, Korea
*
Author to whom correspondence should be addressed.
Symmetry 2016, 8(10), 103; https://doi.org/10.3390/sym8100103
Submission received: 31 July 2016 / Revised: 14 September 2016 / Accepted: 20 September 2016 / Published: 29 September 2016
(This article belongs to the Special Issue Symmetry in Systems Design and Analysis)

Abstract

:
A fundamental key for enterprise users is a cloud-based parameter-driven statistical service and it has become a substantial impact on companies worldwide. In this paper, we demonstrate the statistical analysis for some certain criteria that are related to data and applied to the cloud server for a comparison of results. In addition, we present a statistical analysis and cloud-based resource allocation method for a heterogeneous platform environment by performing a data and information analysis with consideration of the application workload and the server capacity, and subsequently propose a service prediction model using a polynomial regression model. In particular, our aim is to provide stable service in a given large-scale enterprise cloud computing environment. The virtual machines (VMs) for cloud-based services are assigned to each server with a special methodology to satisfy the uniform utilization distribution model. It is also implemented between users and the platform, which is a main idea of our cloud computing system. Based on the experimental results, we confirm that our prediction model can provide sufficient resources for statistical services to large-scale users while satisfying the uniform utilization distribution.

1. Introduction

Recent impacts on industry around the world have had an important technical role because of the Internet, connected devices and sensor networks. A fundamental key are cloud-based services, which have had a substantial impact on companies worldwide.
Using a simple wired connection through the Internet, people may be anxious to know about the status of their information, i.e., data. This data should include recent updates from websites, mobile devices, and even micro-scale, or nano-scale sensors [1]. Likewise, when an individual need to find information regarding anything, the first thing that comes to mind is searching the Internet [2]. It is now popular that our current society is deeply engaged with data services, i.e., valuable data, hereinafter “Big Data”, and other data-related services. It should be noted that people may not find any necessary data without its associated website or linked resources, such as social network services or other Internet sites. Thus, the importance of recent technology developments cannot be ignored.
Sufficient information from a webpage is the basic entry point into the knowledge of, or an entry point into, the organization [3]. It is the logical point from where a visitor gets attracted to, and obtains the first impression about, an organization. Therefore, the presence of technical investigations regarding cloud-based services and data analysis are basic elements that affect all dimensions of our lives. It is common knowledge that we cannot live without experiencing the Internet or other connected technologies [4].
Furthermore, we present a parameter-driven data analysis associated with a cloud computing environment by performing a statistical analysis considering the application workload and the server capacity. Additionally, we propose a service prediction model using a polynomial regression model. Our cloud-based services and data analysis are used in a heterogeneous platform cloud computing environment. It should be noted that for large-scale users, our testing environments are setup as a Software-as-a-Service (SaaS) and provide parameter-driven statistical results along with cloud-based services and data analysis.
A number of virtual machines (VMs) are operated and loaded in one specific server for a general parameter-driven statistical analysis in our testing cloud computing environment. To see the performance of overall cloud computing environments, a main key factor is the data and information delivery procedure. In this case, our data and information mining and cloud-based services are carried out in our special-purpose testing environment. As parameter-driven service requests and results are also transmitted between users and the heterogeneous platform, this system performance is related to the overall system performance.
We investigate the status of each cloud server with an increasing number of VMs and performance issues. It should be noted that the server capacities are determined by three resources (i.e., CPU, memory, and network) of the enterprise cloud computing environment. In a given large-scale enterprise cloud computing environment, the VMs for cloud-based services are assigned to each server with a special methodology to satisfy uniform utilization distribution, and it is implemented between the users and platform, which is a main idea of our cloud computing system.
Our results show that the importance of appearance of data analysis on servers is underestimated. However, our cloud-based parameter-driven test results are very unique approaches so that we can, easily, see the value that our research can bring to the cloud computing environment in general. We also confirm that the statistical Big Data and information mining model can provide a concrete idea for large-scale enterprise users at a utilization rate less than 100% and satisfying the uniform utilization distribution.
The remainder of this paper is organized as follows: Section 2 explains the statistical and data mining model provided, and discusses the methodology of the heterogeneous platform; in Section 3, we discuss the software model design and the results that show how the heterogeneous platform is influenced by the cloud environment; in Section 4 the resource management method is shown; in Section 5, we discuss service and performance issue based on our proposed model, along with a comparison of the different results; and Section 6 concludes the paper.

2. Statistical Data and Information Mining Model for a Heterogeneous Platform

2.1. Statistical Data Mining Model

Prior to research, statistical analysis is used on some set of common criteria, such as information from websites of the top 100 liberal arts universities. Along with this data, we also checked the user’s request to the cloud server throughout the Internet. At the same time, some responses are also returned back to the users simultaneously. These procedures are carried on each different platform where some specific data, i.e., valuable data, is transmitted. It should be noted that statistical analysis for the user’s data is required for better performance and website improvement.
In this paper, we chose the statistical analysis for some certain criteria that are related to data and applied it to the cloud server for comparison results. Our emphasis is to check whether or not the cloud-based data analysis and service fulfills the requirement of enterprise environments. The current data analysis is related to the previous research done on the top 100 liberal arts universities’ websites [3]. We also extended the number of criteria and changed the set of universities’ pages based on the statistical analysis. We have some set of criteria: (i) image size; (ii) number of images per page; (iii) number of background colors (i.e., are those colors white, gray, black, light blue); (iv) background and text crash; (v) number of colors used for fonts; (vi) emphasis indication; (vii) Java script; (viii) page loading sequence; (ix) search box; (x) email and news content layout; (xi) descriptive links; (xii) horizontal line usage; (xiii) multiple fonts; (xiv) capital letters; (xv) page length; and (xvi) white space usage, etc.
With the great advancement of the Internet, we can analyze the data by using a statistical model—how efficiently are the CPU, memory, i.e., resources [5,6,7], used. After the information mining and data modeling, our next target is resource management due to the limitations in large-sized environments; in other words, enterprise cloud computing environments.
Once we have a cloud-based statistical service, then our aim is to investigate the main benefit of statistical data analysis on enterprise environments.

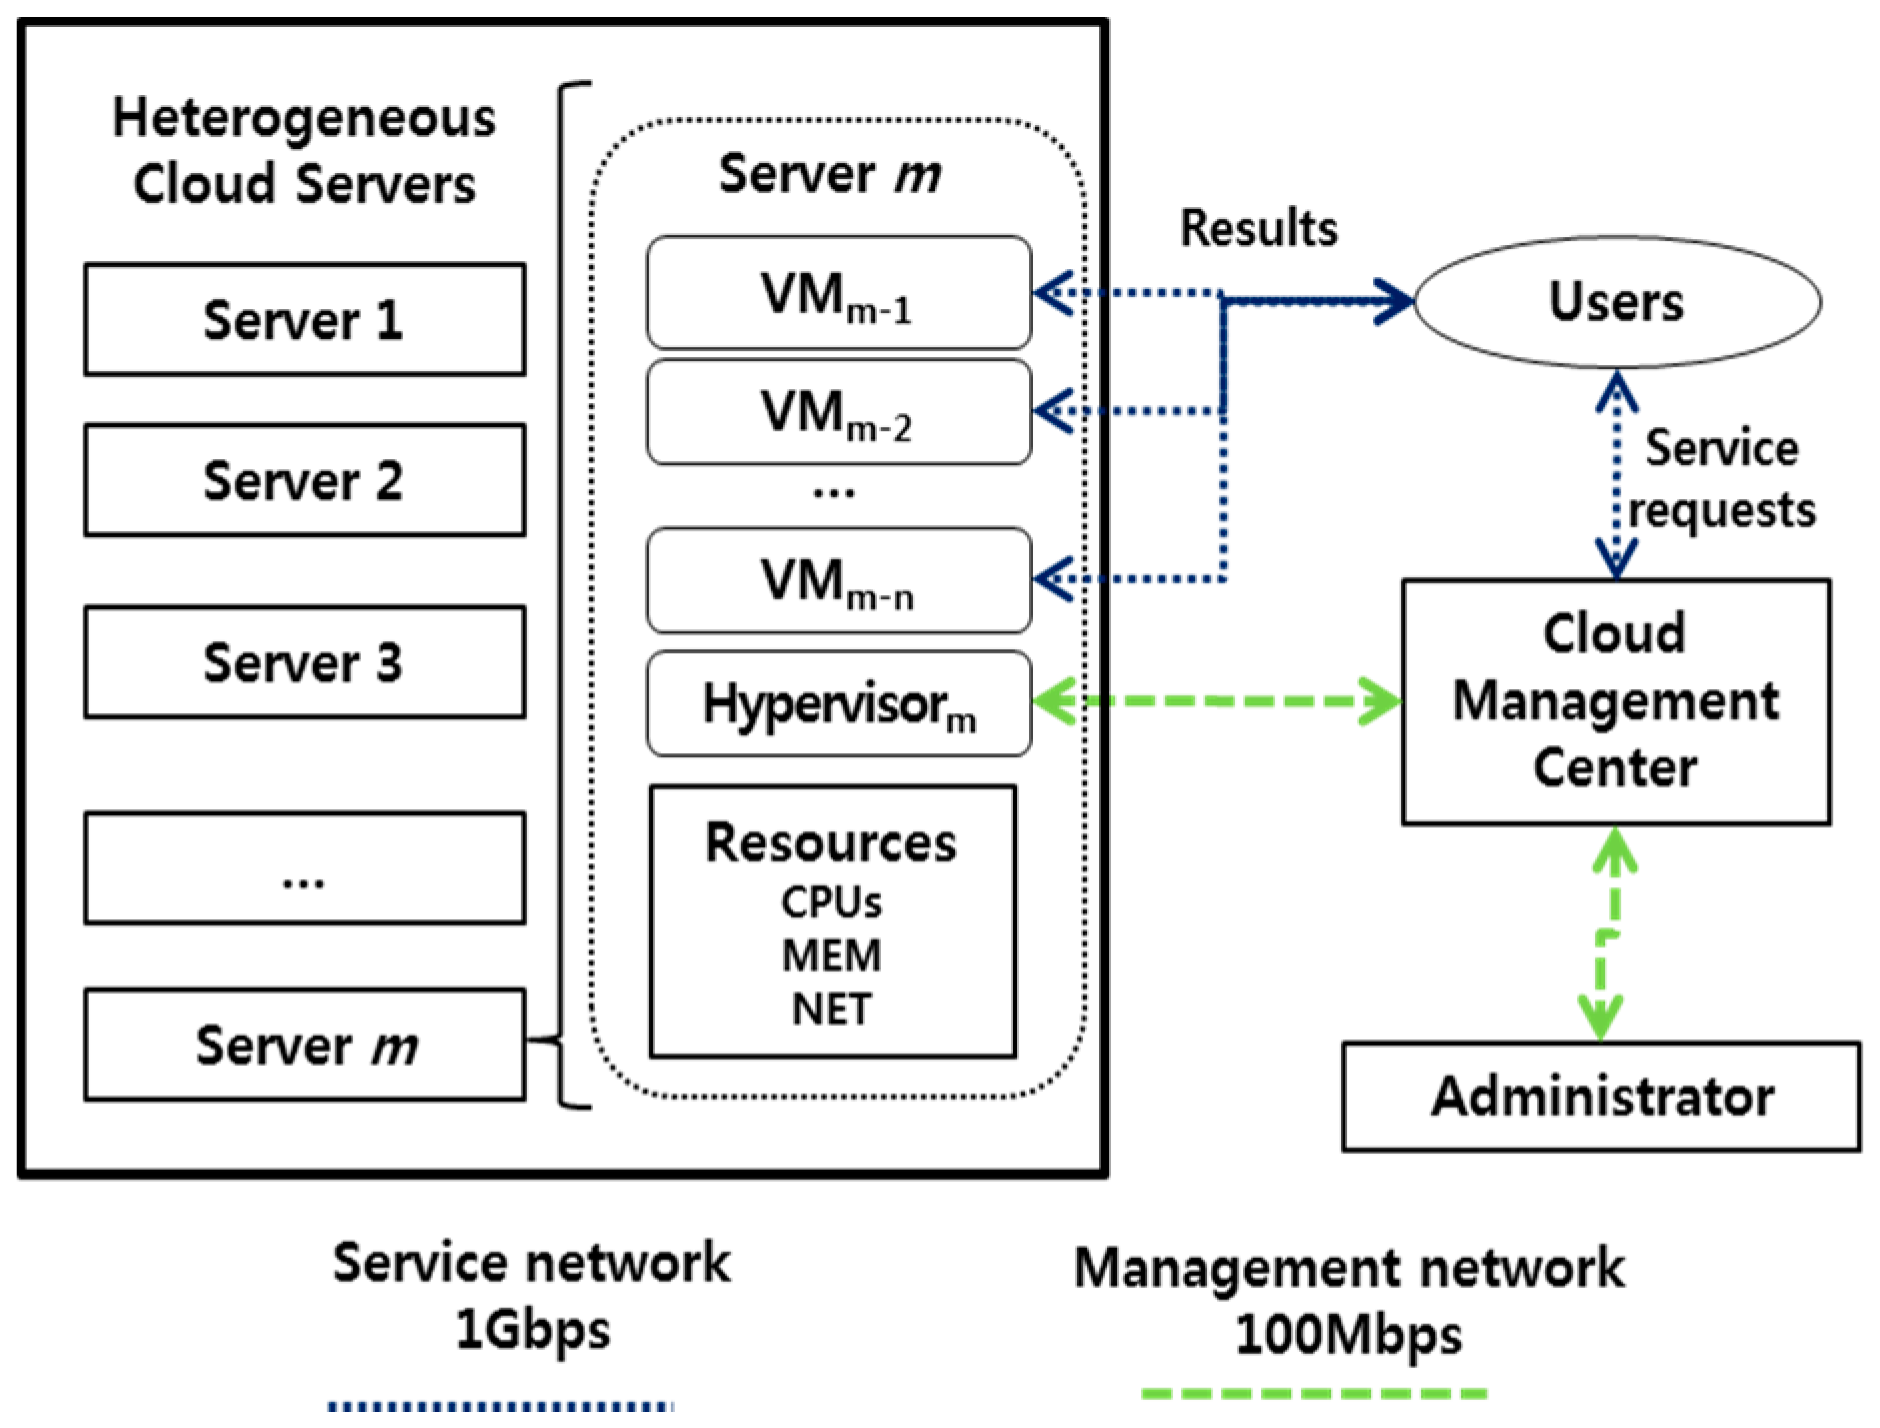
2.2. Cloud Computing for a Heterogeneous Platform

Using data analysis for our set of criteria was useful and this data was delivered into the cloud server without any time delay. While the cloud server is working there are several thousand host servers and several hundred thousand virtual machines (VMs) existing.
In order to fully support the large-scale users, the cloud computing services are run perfectly over the Internet [8,9]. These proofs are also assigned on each cloud server and VMs. In this case, the VMs for users are manually pre-assigned to each server during offline processing by an administrator, and managed in standby mode instead of in shutdown mode when users choose to terminate cloud computing services.
We analyze the rate of utilization for cloud computing environments and enterprise systems by conducting a cloud-based data analysis, taking into account the server capacity degradation with an increased number of VMs. It should be noted that the overall system resources, i.e., CPU, memory, and network, are also a part of a set of criteria.
We also simulate the rate of utilization by using a mathematical model and realistic specifications of the software, VMs, and platform.
In this paper, we propose a novel method to find the optimal distribution ratio of VMs with a utilization rate prediction model for a given large-scale cloud computing environment. Our platform specifications can be defined as a heterogeneous platform, and one set of software and VM are executed between the specific user and the assigned server.
To provide sufficient resources for the statistical services required by large-scale users, we design the “cloud-based statistical services” as shown in Figure 1. In general, we recognized that the different types of cloud computing services are referred to as Software-as-a-Service (SaaS), Platform-as-a-Service (PaaS), Infrastructure-as-a-Service (IaaS), and Desktop-as-a-Service (DaaS), all of which can provide cloud services to users [10,11,12,13,14,15,16,17]. With these cloud computing services, DaaS is increasingly being utilized by enterprises because of the efficiency and convenience it offers in terms of management of centralized desktop administration [12,13,14,15,16,17], which uses the virtualization technique based on virtual desktop infrastructure for cloud services. For this reason, we exploit the idea of SaaS and DaaS, and implement the cloud-based statistical services in a heterogeneous platform for large-scale users.
Figure 1 shows a diagrammatic representation of the statistical Big Data and information mining model for cloud computing, which consists of the Cloud Management Center (i.e., CMC), and VM servers. The CMC manages user access for users wanting to request the remote statistical analysis services, and connects several VM servers. Additionally, the CMC manages the states of the VMs, and connects the several VM servers. The VM servers are running user applications. Note that in our cloud computing system, a VM is provided per user for statistical analysis. Note that the VMs for users can be manually pre-assigned to each server during offline processing by an administrator, and managed in the standby mode instead of in the shutdown mode when users are receiving the results of the statistical analysis. In addition, the networks are managed by network separation to ensure stable services [18,19,20,21,22] with a management network and a user network. User access and the management of VM states occur through the management network [23].

3. Cloud-Based Statistical Analysis

3.1. Data Analysis

While we are focused on the resource allocation methods and distribution, one of the significant contributions is a data analysis which was collected from open websites. The analysis of the collected data was performed [4] and statistical results are also compared using cloud services.
For our statistical data analysis, we present a cloud-based data service (websites) associated with a set of criteria classifications and parameters. The criteria of the cloud-based data analysis are strictly adhering to the given principles without any exceptions or intermediate criterion. Statistical criteria classification results have been tabulated for comparison purposes as shown in Table 1.
The users can examine the website from the cloud services and get a clear picture on compliance with the criteria classification, such as a query service with some image use, loading of images, and/or Java scripts used, etc. [8]. It should be noted that not all of the pages could be evaluated for the effectiveness of website design. The majority of the cloud service providers which originated from the cloud server are complying with the criteria so, with respect to our parameter, are very important to validate. We can predict that the cloud-based statistical analysis is providing the most significant impact on the heterogeneous platform among other cloud services.
In this case, most universities follow the general guidelines for the first appearing website [9]. It is worth mentioning that, in some cases, the number of background images per page is very difficult to determine since the design of the page is not uniformly organized. The main reason for the high compliance of scripts (Java scripts) criteria is probably the fact that this criterion limits the website designer to sufficiently create the required classes and objects. Furthermore, we found that most of the universities’ webpages, on average, utilize approximately 1.83 pages to represent their information, which means most of the universities use almost two screens per page.

3.2. Parameter Classification

We present that out of 20 criteria, the mean for the 20 criteria is 12.45 with a standard deviation of 1.8167. Our investigation into the websites of top 100 liberal arts university websites has revealed that software developers are not strictly complying with the principles of good design as enumerated in the literature reviews on website design.
In Table 2, we have some statistical results by service identification parameters by representing the number used (#), mean, standard deviation, and standard error mean, etc. It should be noted that five criteria have been particularly ignored, which are: (i) the number of images used on the page; (ii) emphasis of information using bright colors, using Java script; (iii) using webmail; (iv) using a horizontal line at the bottom of page; and (v) exceeding the page limit.
These statistical results are of some meaning for the better design of websites, which means cloud-based statistical services are transmitted through the Internet and/or large-scale cloud environments.
Despite those statistical data services from the heterogeneous platform, this shows that they have enough cloud-based data services and appropriate information content to qualify as cloud environments.
The bottom line is it is not an easy solution to check all website pages. However, our cloud-based parameter-driven data mining results are successfully deployed. To configure a necessary data service is not an easy task for a complete statistical data analysis and information based on criteria with parameter classification.

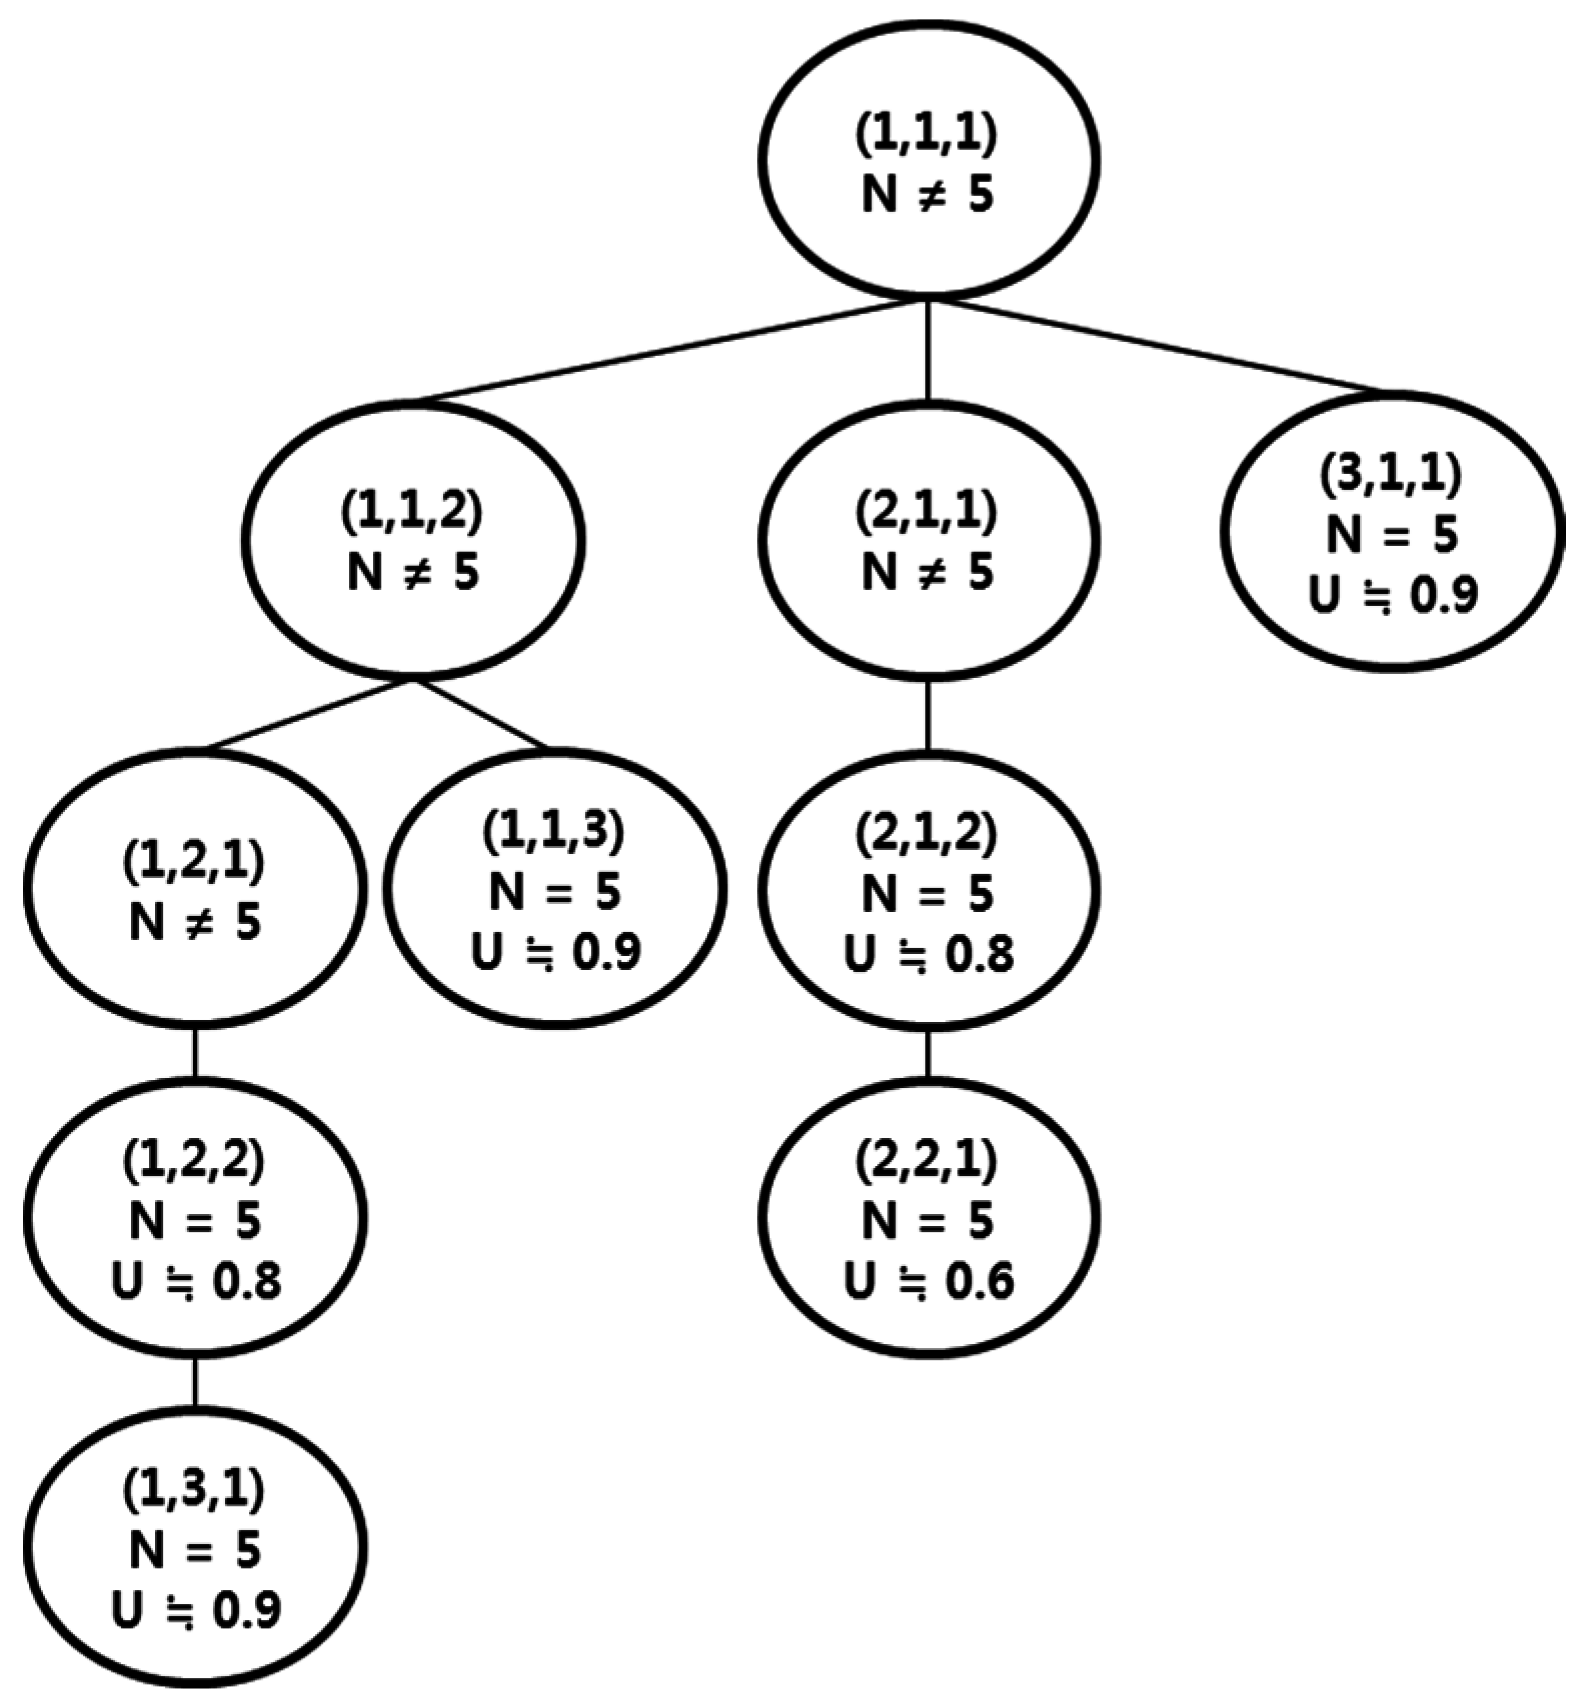
4. Resource Allocation Method

In this section, we express a method to distribute the VMs into different types of cloud servers with the utilization rate prediction model by using resource allocation methods. There are several tools, such as CloudSim, GreenCloud, iCanCloud, SimGrid, and GridSim [24,25,26,27,28,29,30], which can be used to simulate cloud computing systems and provide testbeds for the simulation [31] and verification of resource allocation methods, although, while these simulation tools can analyze the performance of cloud computing platforms toward resource allocation (i.e., VM allocation), they do not consider the characteristics of enterprise cloud computing platforms based on virtual desktop infrastructure (VDI).
In this paper, we analyzed the utilization of VDI services by defining the workload, the capacity of cloud server resources, by using Equation (1). It should be noted that we focus on the CPU, the memory, and the network utilization rate in the rate of cloud server utilization and represent these utilizations as UCPU, UMEM, and UNET, respectively. Furthermore, U represents the utilization rate of a number of applications running on the cloud servers for one second and, thus the VM allocation method should be designed to ensure that U is less than 1 (i.e., U ≤ 1) to provide sufficient resources to large-scale users. The average of each of the three factors (CPU, memory, and networking) are shown in Equation (1):
U ¯ = { U C P U ¯ ,   U M E M ¯ ,   U N E T ¯ }
CPU capacity of a cloud server depends on the number of VMs, because the hypervisor requires CPU, memory, and network resources to manage the VMs. That is, the resources of CPU and memory capacity decrease as NVM increases. Although the hypervisor also requires the network resource, it can be neglect. To observe the performance degradation ratio of CPU and memory with an increased number of VMs, we measured the performance of a benchmark program (i.e., OpenSSL benchmark [32]) on a cloud server as shown in Figure 2. OpenSSL is an open source project that provides a robust, commercial-grade, and full-featured toolkit for some secure sockets layer (SSL) protocols [33]. In the results, we can find the performance degradation ratio of the CPU and memory by implementing the prediction model.
This performance degradation ratio can be obtained by using a pre-experimental test, and it can be predicted by using regression model D(n). We use the polynomial regression model shown in Equation (2). It should be noted that, since D(n) depends on the VM and platform specifications, we should obtain the polynomial coefficients by using a pre-experimental test in a given cloud platform environment (i.e., the type of hypervisor being used) at least once. In this work, we determine the performance degradation ratio by using OpenSSL-bench [24], and design the D(n). For example, we set the cloud platform, and then measured the CPU performance by increasing the number of VMs. Finally, we obtain the polynomial coefficients and design the D(n):
D ( n ) = a k n k + a k 1 n k 1 + +   a n +   a 0
The utilization rate can be represented by the workload (i.e., WCPU, WMEM, and WNET) divide-by capacity (i.e., CCPU, CMEM, and CNET). With Equation (2), we design the utilization rate prediction model for the CPU and memory (i.e., MEM) for the given heterogeneous cloud servers, as shown in Equations (3) and (4), respectively. The index of the server is denoted as i, and the VMs in each server denoted as j. For example, if 20 VMs are running on the two cloud servers, and the uniform distribution of VMs are eight and 12, N1 is 8 (i.e., i = 1) and N2 is 12 (i.e., i = 2), respectively. Additionally, we assume that the workload of each CPU and MEM are similar to provide statistical services for one user.
U C P U ¯ = { j = 1 N i W C P U _ j D C P U _ i ( N i ) × C C P U _ i } ,  where  i = 1 ,   2 ,     M
U M E M ¯ = { j = 1 N i W M E M _ j D M E M _ i ( N i ) × C M E M _ i } ,  where  i = 1 ,   2 ,     M
In our proposed cloud computing system, we exploit the network separation mode [22] to assign the network resources to each VM. This ensures that the network resources are stably managed. The network workload depends on the number of VMs and, thus, the network utilization rate is represented by Equation (5). It should be noted that it can be neglected in order to manage the network resources by the hypervisor.
U N E T ¯ = { j = 1 N i W N E T _ j C N E T _ i } ,  where  i = 1 ,   2 ,     M
From the utilization rate prediction model with Equations (3)–(5), we can assign the VMs into each server while satisfying the load uniform distribution.
N ¯ = { N 1 ,   N 2 ,   ,   N n } ,
where, N = N 1 +   N 2 +   N n
s . t .   U 1 ¯ ( N 1 )     U 2 ¯ ( N 2 )       U n ¯ ( N n )
To find the optimal VM distribution ratio, we exploit the idea of depth-first search approach. For example, when five VMs and three servers are given, the tree of the average utilization rate with various VM distribution can be conducted as shown in Figure 3. Note that we determine the optimal VM distribution as the average CPU utilization rate because the CPU is a relatively scarce resource compared with the resources of memory and the network. Finally, we can find the node that has the minimum utilization (i.e., average utilization) with a depth-first search approach satisfying N = 5.

5. Services and Performance

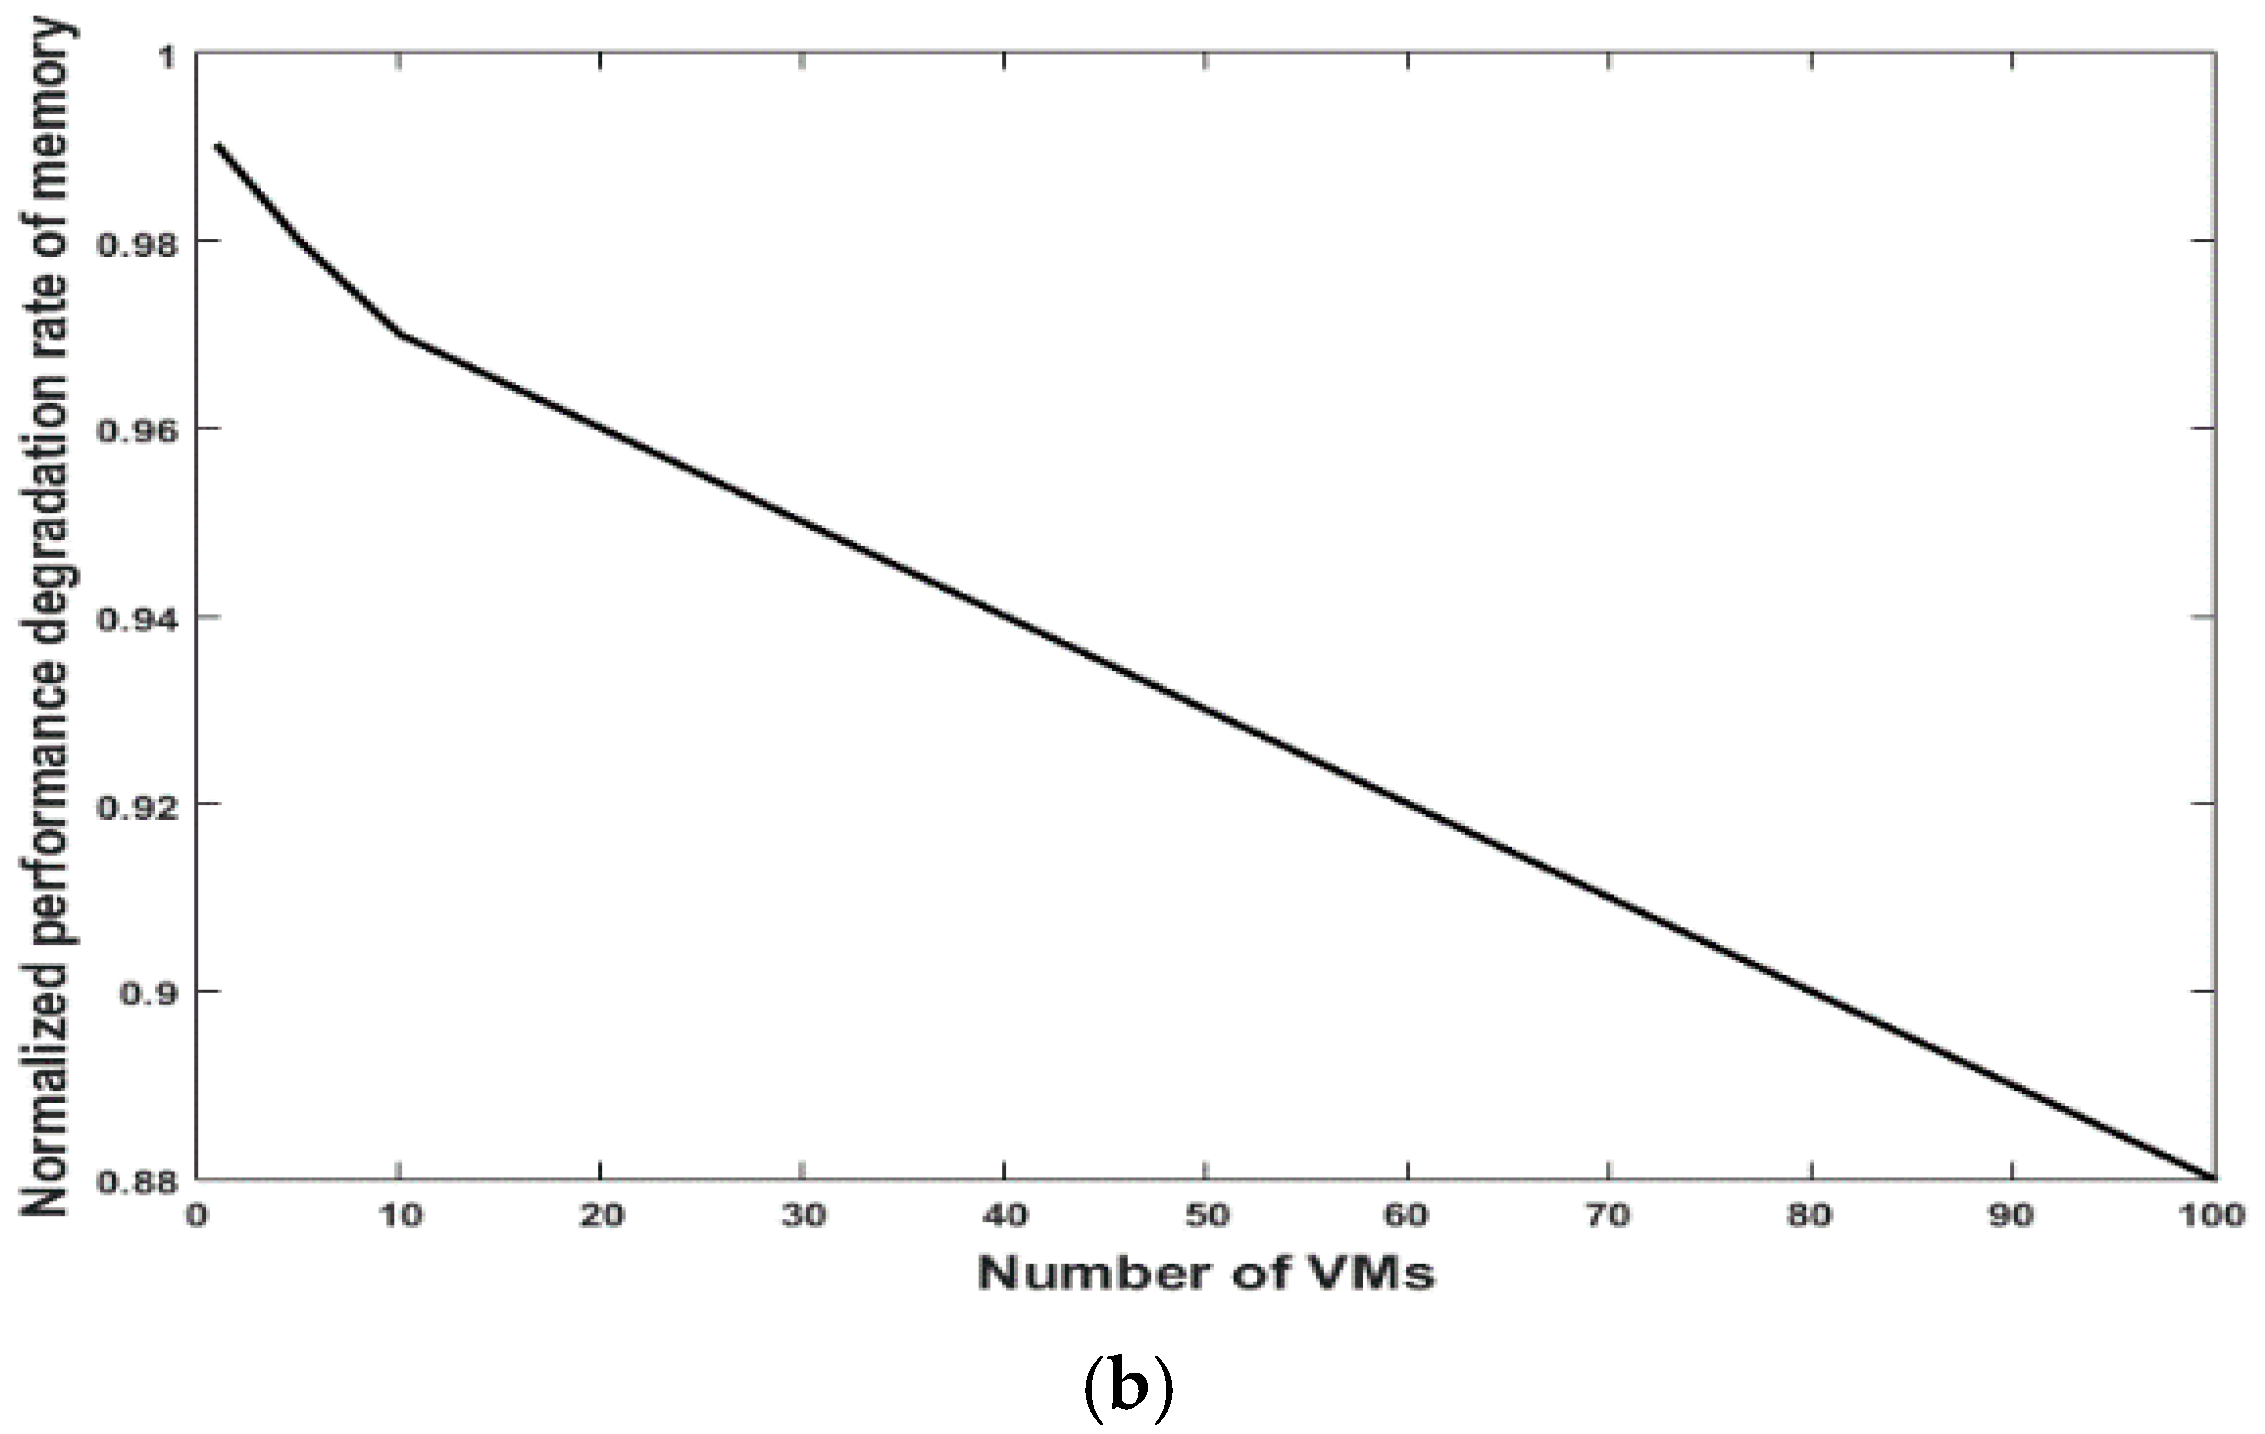
5.1. Performance Issue
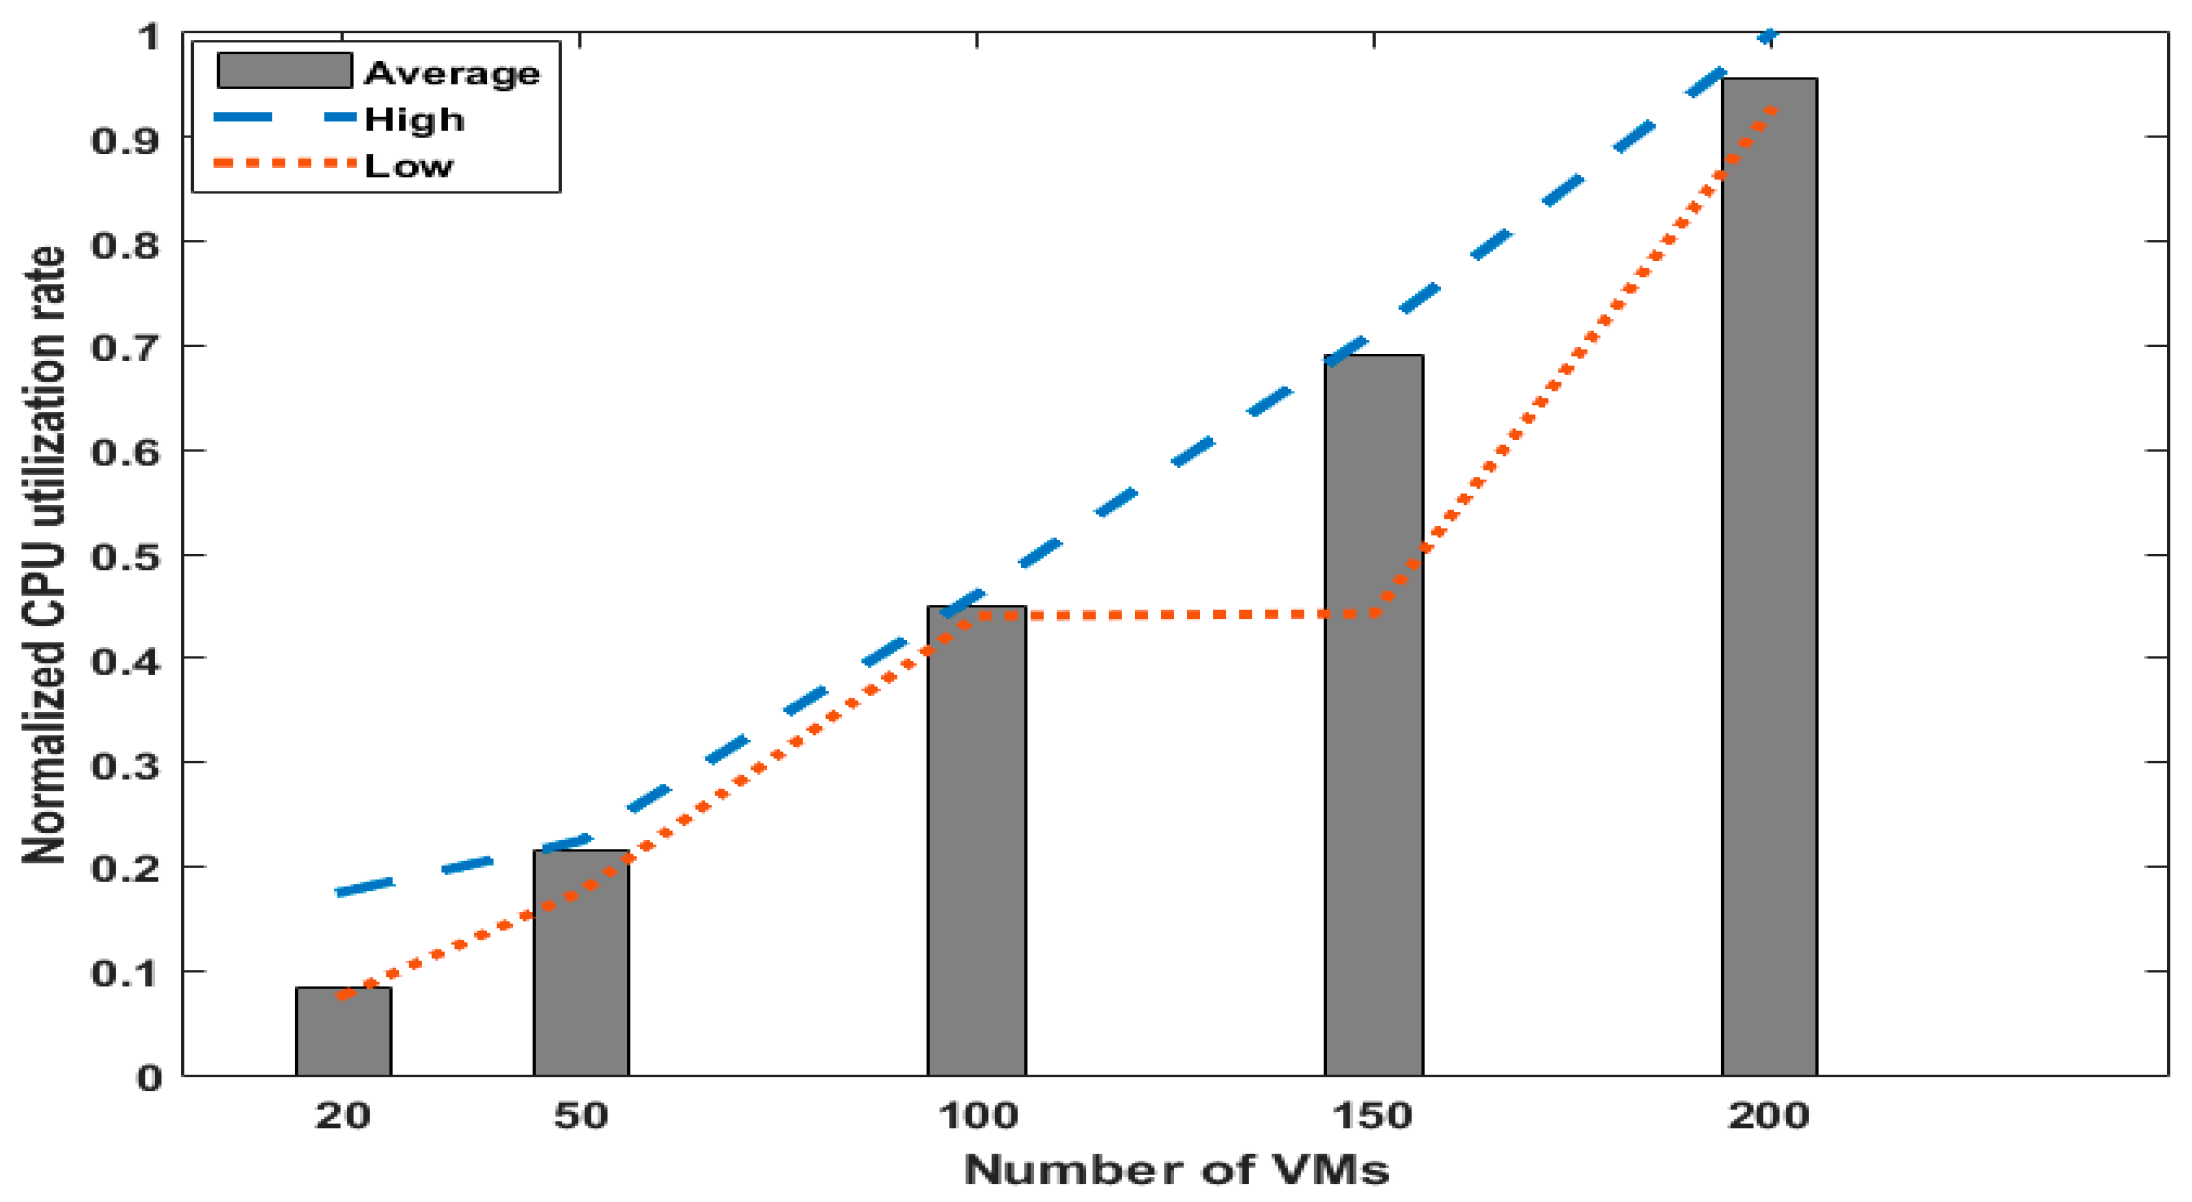
We used three different types of servers to comprise the cloud computing system based on heterogeneous platforms for statistical analysis services, which are summarized in Table 3. In server #1, the CPU clock, the memory size, and network bandwidth were 2.7 GHz, 396 GB, and 1GB. The number of CPU cores was 24, and a Windows VM was used. In server #2, the CPU clock, the memory size, and network bandwidth were 2.7 GHz, 396 GB, and 1GB, consisted of 20 cores, and a Linux VM was used (i.e., OS: Linux, CPU: 2.7 GHz, 1 core, and RAM: 500 MB). In server #3, the CPU clock, the memory size, and network bandwidth were 3.4 GHz, 32 GB, and 1 GB, consisted of four cores, and a Linux VM was used. Additionally, we used Windows 7-based VMs, which are configured as 2.7 GHz and one core, with 2 GB RAM. Furthermore, we configured the hypervisor as a Linux KVM and Virtual Box [34,35].
We conducted the performance degradation functions for each server by using cubic polynomial regression analysis. Table 4 shows the performance degradation parameters for CPU and memory in the cloud computing system. With an increased number of VMs (i.e., NVM), the performance of each server was degraded. Note that these results enabled us to obtain the performance degradation ratio (i.e., D(n)) for an increasing NVM.

5.2. Results

We first distribute the VMs into the different types of severs by using an optimal distribution method based on a depth-first search approach, considering the performance degradation ratio. Note that we distributed the VMs into the servers with a focus on the CPU utilization rates. Table 5 shows the optimal distribution of VM allocation in a given heterogeneous cloud computing system and the total number of VMs. Note that the possible number of VMs assignment into each server were 115, 140, and six, respectively. Since the performance of server #3 was lower than the others, a low number of VMs were allocated into sever #3. Additionally, server #1 can provide the largest capacity (i.e., 24 cores) compared to server #2, but a higher number of VMs was allocated to server #2. The reason is that the performance degradation ratio of server #2 was smaller than that of server #1.
Figure 4 shows the average, low, and high CPU utilization rates of servers with a given the number of VMs (i.e., the number of total VMs were 20, 50, 100, 150, and 200, respectively). The average CPU utilization rates were 0.08, 0.21, 0.45, 0.69, and 0.95, respectively. In contrast, the low CPU utilization rates were 0.07, 0.17, 0.43, 0.44, and 0.92, and the high CPU utilization rates were 0.17, 0.22, 0.46, 0.71, and 0.95, respectively. In the 20 and 150 VM conditions, the deviation of the low and high utilization rates was more severe than others. The reason is that server #3 sensitively affects the low and high CPU utilization rates because server #3 can be assigned a smaller number of VMs than the others. In the results, we confirmed that the proposed approach can distribute the VMs into each server while ensuring uniform load distribution and remain under the 100% CPU utilization rates.
Figure 5 shows the average, low, and high memory utilization rates of servers. Note that we focus on static memory assignment mode, which can provide higher speed and stability than dynamic mode. In the results, the average memory utilization rates were 0.05, 0.13, 0.28, 0.44, and 0.61, respectively. In contrast, the low memory utilization rates were 0.04, 0.05, 0.1, 0.11, and 0.15, and the high memory utilization rates were 0.05, 0.14, 0.31, 0.47, and 0.68, respectively. Although our experimental test servers tended to have larger memory sizes, we confirmed that the proposed approach can distribute the VMs into each server and remain under the 100% memory utilization rates.
Finally, we measured the network utilization rates with various numbers of VMs. In the network utilization rates, we focus on network separation mode; thus, the network utilization rates depend on the number of VMs. Figure 6 shows the average, low, and high network utilization rates with various numbers of VMs. The average network utilization rates were 0.05, 0.12, 0.24, 0.37, and 0.50, respectively. In contrast, the low network utilization rates were 0.04, 0.05, 0.10, 0.11, and 0.15, and the high network utilization rates were 0.05, 0.13, 0.27, 0.41, and 0.57, respectively. In the results, we confirmed that the proposed approach can distribute the VMs into each server and remain under the 100% network utilization rates.

6. Conclusions

In this paper, our results show a cloud-based service with statistical analysis for a heterogeneous platform. We also presented a cloud-based data analysis service and evaluated a result with a resource allocation method. The principles of good design account for a framework, keeping in perspective a decent appearance, adequate information representation, ease of navigation, functional utility for both the users and the visitors, and capability of supporting computers. These principles are not hard and fast and can vary under different situations, particularly if we assume that these websites are being viewed on modern computers with latest operating systems that allow Java scripting. Similar reasoning can be put forward for other criteria.
We conclude that principles of good design are not adequately sufficient to account for various ideas for website development, but have adequately evolved to be acceptable principles for the majority of website design standards. Especially, to provide sufficient resources and a prediction model of the statistical analysis services required by large-scale enterprise system, we designed “cloud-based statistical analysis services” and provided the performance of cloud services considering the characteristics of cloud computing environments. Based on the experimental results, we confirm that the proposed approach of the prediction model can provide the sufficient resources for cloud-based statistical services to enterprise users at less than 100% utilization.

Acknowledgments

This work has been supported by the Basic Science Research program through NRF, 2015R1C1A1A02037688, 2014R1A1A2059115. This work was supported by the research grant from Seoul Women’s University in 2016.

Author Contributions

S. L. developed stimuli, interpreted the results and wrote the manuscript; T. J. supervised the project, conducted behavioral data analysis and wrote the paper. Authorship must be limited to those who have contributed substantially to the research reported.

Conflicts of Interest

The authors declare no conflict of interest.

References

  1. Zeithaml, V.A.; Parasuraman, A.; Malhotra, A. Service Quality Delivery through Web Sites: A Critical Review of Extant Knowledge. J. Acad. Mark. Sci. 2002, 30, 362–375. [Google Scholar] [CrossRef]
  2. Kleinberg, J.M. Authoritative soxszurces in a hyperlinked environment. J. ACM 1999, 46, 604–632. [Google Scholar] [CrossRef]
  3. Felton, J.; Mitchella, J.; Stinsona, M. Web-based student evaluations of professors: The relations between perceived quality, easiness and sexiness. Assess. Eval. High. Educ. 2004, 29, 91–108. [Google Scholar] [CrossRef]
  4. Alsaadi, E.; Abdallah, T. Internet of things: Features, challenges, and vulnerabilities. Int. J. Adv. Comput. Sci. Inform. Technol. 2015, 4, 1–13. [Google Scholar]
  5. Rajamony, R.; Elnozahy, M. Measuring Client-Perceived Response Times on the WWW. In USITS; IBM Austin Research Laboratory: Austin, TX, USA, 2001. [Google Scholar]
  6. Gurak, L.J.; Logie, J. Internet Protests, from Text the Web. In Cyberactivism: Online Activism in Theory and Practice; MCcaughey, M., Ayers, M.D., Eds.; Routledge: London, UK, 2003. [Google Scholar]
  7. Piccoli, G.; Brohman, M.K.; Watson, R.T.; Parasuraman, A. Net-Based Customer Service Systems: Evolution and Revolution in Web Site Functionalities. Decis. Sci. 2014, 35, 423–455. [Google Scholar] [CrossRef]
  8. Jeong, T.; Lee, J.; Yoo, S.; Lee, W. Statistical Analysis for Information and Data Mining based on Parameter Classification. In Proceedings of the 7th International Conference on Internet (ICONI 2005), Kuala Lumpur, Malaysia, 13–16 December 2015.
  9. Tan, F.B.; Tung, L.L.; Xu, Y. A study of web-designers’ criteria for effective business-to-consumer (B2C) websites using the repertory grid technique. J. Electron. Commer. Res. 2009, 10, 165–170. [Google Scholar]
  10. Velte, T.; Velte, A.; Elsenpeter, R. Cloud Computing: A Practical Approach; McGraw-Hill: New York, NY, USA, 2010. [Google Scholar]
  11. Dillon, T.; Chen, W.; Chang, E. Cloud Computing: Issues and Challenges. In Proceedings of the IEEE International Conference on AINA, Perth, Australia, 20–23 April 2010.
  12. Chang, B.R.; Tsai, H.-F.; Chen, C.-M. Empirical Analysis of Server Consolidation and Desktop Virtualization in Cloud Computing. Math. Probl. Eng. 2013, 2013. [Google Scholar] [CrossRef]
  13. Yang, X.; Xie, N.; Wang, D.; Jiang, L. Study on Cloud Service Mode of Agricultural Information Institutions. In Proceedings of the Springer CCTA, Beijing, China, 18–20 September 2013.
  14. Choi, B. Effective Transmission method for High-Quality DaaS (Desktop as a Service) on Mobile Environments. Adv. Sci. Technol. Lett. SERSC 2014, 46, 48–51. [Google Scholar]
  15. Calyam, P.; Rajagopalan, S.; Seetharam, S.; Selvadhurai, A.; Salah, K.; Ramnath, R. Design and Verification of Virtual Desktop Cloud Resource Allocations. Elsevier Commun. Netw. Cloud 2014, 68, 110–122. [Google Scholar] [CrossRef]
  16. Escherich, M.; Kitagawa, M. Market Trends: Worldwide. In Desk-Based PCs Are Battling on 2012; Gartner: Stamford, CT, USA, 2012. [Google Scholar]
  17. Atwal, R.; Shiffler, G.; Vasquez, R. Forecast Analysis: PC Forecast Assumptions. In Worldwide 2011–2015 4Q11 Update Gartner; Gartner: Stamford, CT, USA, 26 January 2012. [Google Scholar]
  18. Donepudi, H.; Bhavineni, B.; Galloway, M. Designing a Web-Based Graphical Interface for Virtual Machine Management. In Information Technology: New Generations; Springer: Cham, Switzerland, 2016; pp. 401–411. [Google Scholar]
  19. Brecher, C.; Obdenbusch, M.; Herfs, W. Towards Optimized Machine Operations by Cloud Integrated Condition Estimation. In Machine Learning for Cyber Physical Systems; Springer: Berlin/Heidelberg, Germany, 2016; pp. 23–31. [Google Scholar]
  20. Guru, S.; Hanigan, I.C.; Nguyen, H.A.; Burns, E.; Stein, J.; Blanchard, W.; Lindenmayer, D.; Clancy, T. Development of a cloud-based platform for reproducible science: A case study of an IUCN Red List of Ecosystems Assessment. Ecol. Inform. 2016. [Google Scholar] [CrossRef]
  21. Pandi, K.M.; Somasundaram, K. Energy Efficient in Virtual Infrastructure and Green Cloud Computing: A Review. Indian J. Sci. Technol. 2016, 9. [Google Scholar] [CrossRef]
  22. Xu, X.C. Design Considerations for Reliable Data Transmission and Network Separation. Appl. Mech. Mater. 2015, 738, 1146–1149. [Google Scholar] [CrossRef]
  23. Calheiros, R.; Ranjan, R.; Beloglazov, A.; Rose, C.; Buyya, R. CloudSim: A toolkit for modeling and simulation of cloud computing environments and evaluation of resource provisioning algorithms. Softw. Pract. Exp. 2010, 41, 24–50. [Google Scholar] [CrossRef]
  24. Garg, S.; Buyya, R. NetworkCloudSim: Modelling Parallel Applications in Cloud Simulations. In Proceedings of the IEEE International Conference on UCC, Melbourne, VIC, Australia, 5–8 December 2011.
  25. Kliazovich, D.; Bouvry, P.; Audzevich, Y.; Khan, S. GreenCloud: A Packetlevel Simulator of Energy-aware Cloud Computing Data Centers. J. Supercomput. 2010, 62, 1263–1283. [Google Scholar] [CrossRef]
  26. Network Simulator 2. Available online: http://www.isi.edu/nsnam/ns (accessed on 9 November 2015).
  27. Jrad, F.; Tao, J.; Streit, A. Simulation-based Evaluation of an Intercloud Service Broker. In Proceeding of the Conference on Cloud Computing, GRIDs, and Virtualization, Nice, France, 22–27 July 2012.
  28. Castane, G.; Nunez, A.; Carretero, J. iCanCloud: A Brief Architecture Overview. In Proceeding of the IEEE International Symposium on Parallel and Distributed Processing with Applications, Madrid, Spain, 10–13 July 2012.
  29. Casanova, H.; Legrand, A.; Quinson, M. SimGrid: A Generic Framework for Large-Scale Distributed Experiments. In Proceeding of the IEEE International Conference on Computer Modeling and Simulation, Cambridge, UK, 1–3 April 2008.
  30. Buyya, R.; Manzur, M. GridSim: A Toolkit for the Modeling and Simulation of Distributed Resource Management and Scheduling for Grid Computing. Concurr. Comput. Pract. Exp. 2002, 14, 1175–1220. [Google Scholar] [CrossRef]
  31. Jeong, T. Theoretical and Linearity Analysis for Pressure Sensors and Communication System Development. Int. J. Distrib. Sens. Netw. 2014, 10. [Google Scholar] [CrossRef]
  32. Graziano, C. A Performance Analysis of Xen and KVM Hypervisors for Hosting the Xen Worlds Project; Master of Science, Iowa State University: Ames, IA, USA, 2011. [Google Scholar]
  33. OpenSSL. Available online: https://www.openssl.org/ (accessed on 31 July 2016).
  34. Kivity, A.; Kamay, Y.; Laor, D.; Lublin, U.; Ligouri, A. KVM: The Linux Virtual Machine Monitor. In Proceedings of the Linux Symposium, Ottawa, ON, Canada, 27–30 June 2007; pp. 225–230.
  35. Li, P. Selecting and using virtualization solutions: Our experiences with VMware and VirtualBox. J. Comput. Sci. Coll. 2010, 25, 11–17. [Google Scholar]
Figure 1. Statistical data and information mining model for cloud computing with heterogeneous platforms.
Symmetry 08 00103 g001
Figure 2. An example of the performance degradation rate of the CPU and memory (CPU: 2.7 GHz and 20 cores, and 396 GB Random Access Memory (RAM); (a) the performance degradation rate of the CPU; and (b) the performance degradation rate of memory.
Symmetry 08 00103 g002aSymmetry 08 00103 g002b
Figure 3. Tree structure of average utilization rates for an optimal Virtual Machine (VM) distribution.
Symmetry 08 00103 g003
Figure 4. CPU utilization rates with various numbers of VMs.
Symmetry 08 00103 g004
Figure 5. Memory utilization rates with various numbers of VMs.
Symmetry 08 00103 g005
Figure 6. Network utilization rates with various numbers of VMs.
Symmetry 08 00103 g006
Table 1. Statistical criteria classification of cloud-based parameter-driven data services.
Criteria ClassificationComply with the Criteria (%)Do Not Comply with the Criteria (%)No Data (%)
Query Service with Image Use (600 × 400 pixels or smaller)78%13%9%
Loading of Images (Use no more than three images per page)14%84%2%
Loading of Images (No more than four colors per page)98%2%
Images (Indicate emphasis with bright color)15%85%
Scripts (Not using Java script)12%88%
Way of Expression (Display text on the page first while graphics is loading)79%21%
Search box (Use or not)59%41%
News information (Use or not)90%10%
Web mail (Use or not)2%98%
Segmented Order (Break up content with topics and sub-topics, headings, or horizontal lines, or use headers)73%27%
Links (Make links within a document descriptive)58%42%
Lines (Use horizontal line at the bottom of page)34%66%
Single Fonts (Avoid using multiple fonts)96%4%
Letter Size (Not use all capital letters)97%3%
White Space (Use or not)86%14%
Page Length (No single pages)30%70%
Table 2. Statistical results by service identification parameters.
Service ParametersN (#)MeanStd. DeviationStd. Error Mean
PIC_SIZE840.97620.153370.01673
IM_3990.14140.350220.03520
N_BG_COL1001.87000.970840.09708
BG1000.81000.394280.03943
BG_BLACK1000.12000.326600.03266
FON_COL1000.25000.435190.04352
FONT_31000.03000.171450.01714
BR_COL1000.16000.368450.03685
JAVA_SC970.88660.318730.03236
BEF_GRP1000.79000.409360.04094
SEAR_BOX1000.59000.494310.04943
CUR_EVEN1000.90000.301510.03015
WEB_MAIL1000.02000.140710.01407
SEPAR1000.73000.446200.04462
LINK1000.58000.496040.04960
HOR_LINE1000.34000.476100.04761
MUL_FONT1000.97000.171450.01714
CAP_LETT1000.02000.140710.01407
SEP_SPA1000.87000.338000.03380
LG_PAGE1001.83000.682460.06825
Table 3. Each server specifications and hypervisor in cloud systems.
ServersServer SpecificationsHypervisor
Server #1CPU: 2.7 GHz, 24 cores
RAM: 396 GB
Network: 1 GB
Linux (KVM) [33]
Server #2CPU: 2.7 GHz, 20 cores
RAM: 396 GB
Network: 1 GB
Linux (KVM) [33]
Server #3CPU: 2.7 GHz, 4 cores
RAM: 32 GB
Network: 1 GB
Windows (Virtual Box) [34]
Table 4. Performance degradation parameters for CPU and memory in cloud systems.
Servers and Resourcesd(Ni)
a3a2a1a0
Server #1 (i = 1)CPU−6.9 × 1071.1 × 104−7.3 × 1030.9
MEM4.0 × 1097.3 × 1075.4 × 1030.9
Server #2 (i = 2)CPU−2.0 × 1074.5 × 105−3.9 × 1031.0
MEM−6.8 × 1081.2 × 105−1.6 × 1030.9
Server #3 (i = 3)CPU1.2 × 102−1.0 × 1013.2 × 1021.0
MEM5.9 × 108−1.3 × 1051.6 × 1031.0
Table 5. Optimal distribution of VM allocations for cloud systems.
# of Total VMsOptimal Distribution of VMs
Server #1Server #2Server #3
208111
5022271
10043552
15065832
200821153

