Peripheral Contour Grouping and Saccade Targeting: The Role of Mirror Symmetry

Abstract
: Integrating shape contours in the visual periphery is vital to our ability to locate objects and thus make targeted saccadic eye movements to efficiently explore our surroundings. We tested whether global shape symmetry facilitates peripheral contour integration and saccade targeting in three experiments, in which observers responded to a successful peripheral contour detection by making a saccade towards the target shape. The target contours were horizontally (Experiment 1) or vertically (Experiments 2 and 3) mirror symmetric. Observers responded by making a horizontal (Experiments 1 and 2) or vertical (Experiment 3) eye movement. Based on an analysis of the saccadic latency and accuracy, we conclude that the figure-ground cue of global mirror symmetry in the periphery has little effect on contour integration or on the speed and precision with which saccades are targeted towards objects. The role of mirror symmetry may be more apparent under natural viewing conditions with multiple objects competing for attention, where symmetric regions in the visual field can pre-attentively signal the presence of objects, and thus attract eye movements.1. Introduction
Symmetry abounds in our surroundings, both in natural objects and artifacts, which is one of the reasons why it has been hypothesized to be of significance for the way we process and organize visual input. Mirror symmetry in particular is known to be a highly salient property which human observers can rapidly and accurately detect in simple geometric patterns as well as dot patterns or patterns consisting of line fragments [1–4]. It has long been postulated that vertical mirror symmetry at the point of fixation has a special status due to the corresponding bilateral symmetry in the human visual system [5,6]. Nevertheless, mirror symmetry detection is still possible with different symmetry axes and at locations throughout the visual field (for comprehensive reviews of the literature, see [7–9]).
Human observers' remarkable sensitivity to symmetry raises the question whether symmetry is used as a cue in visual processing, for instance in determining figure-ground relations and locating the contours of objects in visual scenes (for a recent review of the literature on grouping and figure-ground organization, see [10]). Most of the literature concerned with symmetry in vision has focused on the detection of symmetry per se, but the ease with which symmetry can be distinguished from asymmetry of course says little about whether symmetry is used as a cue for figure-ground organization or perceptual grouping. Theoretically, symmetry is termed a nonaccidental property, meaning that symmetry or skewed symmetry in proximal stimuli—retinal images—can be used to reliably infer symmetry in the distal stimuli, the objects in the environment. As such, it features as one of the invariant edge properties of geons, the basic components out of which object representations are structured according to Biederman's Recognition-By-Components theory [11]. This theory postulates that knowledge of these invariant properties allows us to recognize object regardless of viewing angle [11,12], and it has been shown that skewed symmetry in proximal stimuli is indeed used to infer mirror symmetry in distal stimuli [13–15].
However, while symmetry was suggested as a grouping principle by one of the principal founders of Gestalt psychology, Wertheimer [16], and Bahnsen [17] already demonstrated the possible use of symmetry as a figure-ground cue in the early 20th century, empirical research focusing specifically on symmetry as a cue to perceptual grouping phenomena such as contour integration has been scant. Machilsen, Pauwels and Wagemans [18] were the first to investigate the role of vertical mirror symmetry in perceptual grouping using the modern psychophysical paradigm of contour integration. Contour integration refers to the process by which paths of Gabor elements embedded in distracter Gabors are perceptually grouped provided they are in sufficiently close proximity to each other and have orientations and positions consistent with a smooth contour (e.g., [19–22]; see [23] for a recent review).
Contour integration in itself can thus be thought of as a demonstration of the Gestalt principles [16] of proximity and good continuation, but the paradigm can also be employed to investigate whether additional grouping principles, such as those of closure and symmetry, influence the integration process. There is indeed evidence for stronger or faster integration for closed versus open contours [22,24] (see [25] for an important caveat) and recently Machilsen et al. [18] showed a beneficial effect of symmetry on contour integration in central vision. In their experiments, the detection of closed contour shapes in briefly presented stimuli—presentation duration varied from 100 to 350 ms, adjusted for each observer via an adaptive procedure during the training phase of the experiment—was more robust to the jittering of the orientations of the individual contour elements for symmetric than for asymmetric contours.
This robustness of perceptual grouping to perturbations by orientation jitter in central vision is just one very specific aspect of visual processing, however. In natural viewing conditions, fast and accurate integration of closed contour shapes should also take place in peripheral vision, in order to quickly locate objects in, and aid efficient scanning of, visual scenes. The symmetry detection literature suggests that humans are less sensitive to symmetry in the visual periphery than in central vision (in some cases to the point of rendering symmetry detection impossible, e.g., with the noisy high spatial frequency dot patterns used in [26]), but different studies have shown varying degrees of impairment depending on the stimuli and task, and generally the decrease in performance with increasing eccentricity is gradual [27–29]. Further evidence for human observers' sensitivity to symmetry across the visual field comes from eye movement studies. While most models that predict human fixations on natural images compute saliency from local contrast (e.g., [30]), Kootstra, de Boer and Schomaker [31] developed a saliency model based on local symmetry which proved to offer more precise predictions of fixation locations, leading those authors to suggest that symmetry plays a role in the guidance of eye movements, perhaps indirectly by signaling the presence of objects.
If symmetry indeed signals objecthood, then it may serve as a cue to both the integration of contours in peripheral vision and the targeting of saccades towards the shapes described by these contours. The present study is, to our knowledge, the first to investigate such symmetry effects on contour integration and saccade targeting. In three experiments, we showed participants grouping stimuli—paths of Gabor elements forming closed contours, embedded in distracter elements—in peripheral vision and analyzed the precision and latency of eye movements made towards these shapes. If mirror symmetry is indeed important to everyday contour integration and saccade targeting, then it should allow faster and/or more accurate direction of the gaze towards those contour shapes that are symmetric, rather than asymmetric.
2. Methods
2.1. Stimuli
2.1.1. Initial Stimulus Generation
We created Gabor contours using Matlab and a precursor of the Grouping Elements Rendering Toolbox [32]. We first generated contours in pairs, each contour defined by adding four radial frequency components (sinusoids with wavelengths of π, 2π/3, π/2, and 2π/5, respectively) to a fixed radius r. The phase offset was randomized for all sinusoid components separately, and their amplitudes drawn at random from a continuous uniform distribution between r/12 and r/6. Plotting these sums in polar coordinates resulted in a variety of closed contour shapes. Each pair of two such contours served as the basis for a set of eight composite contours.
The two basic contours were first rescaled and shifted so that both had equal radii at the horizontal axis, that is, at polar angles 0 and π. Four symmetric composite contours were then created by mirroring the top or bottom half of each basic contour across the horizontal axis. We also created four asymmetric composite contours by pairing the halves of one basic contour with each of the halves of the other, flipping the halves vertically as necessary to obtain a continuous contour so that across the four asymmetric contours, each half appeared once in its original orientation and once mirrored vertically. Thus, within each set of eight composite contours the subsets of symmetric and asymmetric contours contained the exact same parts, in different combinations. The initial two basic contours were discarded after the creation of the composite contours.
We then embedded the composite contours in arrays of non-overlapping, odd-symmetric Gabor elements. We first positioned the centroid of each contour in a 920 × 600 pixel uniform grey display so that it was vertically centered and 210 pixels or 6 degrees of visual angle at a viewing distance of 100 cm, to the left of the center of the display. The sum of each contour's radii at polar angles 0 and π, which we had previously equalized in order to create the composite contours, was 105 pixels or 3 degrees of visual angle at 100 cm.
We placed Gabor elements at regular intervals along the embedded contour, while ensuring that the elements were not mirror-paired in the upper and lower halves of symmetrical stimuli, to avoid introducing a local rather than global symmetry cue (see also [18]). These contour elements were first oriented curvilinearly, that is, tangentially to the underlying contour. If any part of an embedded contour required inter-element angles greater than π/2, indicative of a strongly jagged or irregular contour, the Gabor rendering was aborted and the set of eight composite contours was discarded as a whole. After Gabor elements were successfully placed along all contours in a set, we added a variable amount of orientation jitter to each contour element's orientation (drawn from a continuous uniform distribution between π/12 and π/7 radians, or 15 to 26 degrees, separately for each element), approximating the medium jitter level of 27.5 degrees used by Machilsen et al. [18].
To make certain that contour detection occurred on the basis of the good continuation cue provided by element orientations and not due to a proximity or density cue grouping the contour elements, we first mirrored the positions of contour elements to the right side of the Gabor array, and reshuffled the orientations between the mirrored elements so that these were essentially random. Then, after filling up the array with 1400 additional randomly positioned and oriented elements with a minimum inter-element distance of 12 pixels, we checked whether the local density was similar for contour and background elements. For each Gabor element located at least 60 pixels from the array's edge, we determined the mean Euclidean distance of the element to its two nearest neighbors in the Gabor array.
We tested for differences between the mean Euclidean distances calculated for contour and background elements by means of a Student's t-test. The sampling of background element locations was repeated until a p > 0.3 was observed, or for a maximum of 10 failed attempts, in which case the contour set was discarded as a whole. Finally, after a whole set was successfully rendered, we created variants with the embedded contour on the right hand side by simply mirroring the entire image, so that each of the 8 Gabor contours in a set had a variant with the contour on the left (original image) and one with the contour on the right (mirrored image). We generated a pool of 5000 such contour sets from which the experimental stimuli were to be selected.
2.1.2. Stimulus Selection
Firstly, in order to minimize the occurrence of incidental symmetry in supposedly asymmetric contours, we quantified the amount of mirror symmetry along the four most salient axes for each contour by calculating the proportion of overlap in area between each composite contour and itself when mirrored across the horizontal, vertical and diagonal (45° and 135°) axes. We then determined the 75th percentile of the distribution of overlap across the horizontal axis for the asymmetrical contours (0.82) and retained only contour sets for which the overlap across all four axes was below this criterion for all four asymmetrical contours in the set. This procedure retained 155 eligible contour sets from the original 5000.
Secondly, a pilot reaction time experiment was set up to test these 155 sets of Gabor contours, in order to eliminate the sets containing contours that were outliers in terms of detectability, so either extremely easy (e.g., particularly simple or smooth shapes) or extremely difficult to detect (e.g., particularly jagged or irregular shapes). This pilot experiment was run without eye tracking and with a manual reaction time task instead of the saccade task.
We pre-rendered bitmaps of the central 800 × 600 pixels (of the full 920 × 600 displays) of each stimulus, hiding all Gabor elements that fell within 20 pixels of the image borders, so that no Gabor elements were truncated by the image borders. This operation kept the centroid of each contour at exactly 210 pixels, or 6 degrees horizontally from fixation, in this pilot experiment. In the subsequent actual experiments, the oversize 920 × 600 displays allowed us to add random variation to the eccentricity (see below). The stimuli were displayed at a resolution of 800 × 600 pixels on a gamma-corrected 20 inch Iiyama Vision Master Pro 514 CRT monitor viewed from 100 cm, the same stimulus size and viewing distance as used in the subsequent actual experiments (see below). Observers fixated the center of the screen and manually started each trial. After a variable delay of 1 to 2 s, a full-screen Gabor array containing a contour to the left or right of fixation was displayed. Each contour shape was presented twice during the pilot experiment, once in the left location and once in the right (mirrored) location. Observers were required to respond within 1 s of stimulus onset by pressing the left or right response button indicating the location of the Gabor contour as soon as they detected it.
Three experienced observers, namely the second author and two colleagues from our lab who were not involved in this study, took part in the pilot experiment. They viewed one of the 2480 (155 sets × 8 contours × 2 locations, presented in random order in 20 blocks of 124 trials) stimuli on each trial, yielding 6 responses in total to each unique stimulus image. After normalizing the reaction times per observer, we first eliminated the contour sets containing one or more contours for which more than one of the responses were incorrect. Subsequently, we eliminated all sets containing one or more contours with extreme mean reaction times, defined as a mean reaction time more than 1.5 times the interquartile range below the lower, or above the upper quartile of the mean reaction time distribution. In doing so, we retained 57 sets of 8 contours which served as basis for the experimental stimuli in all three experiments. Out of the 98 contour sets rejected on the basis of the pilot experiment, we nevertheless retained 7 sets (56 contours), to serve as training stimuli in each participant's first block, data from which were not included in the analysis.
2.1.3. Stimulus Versions
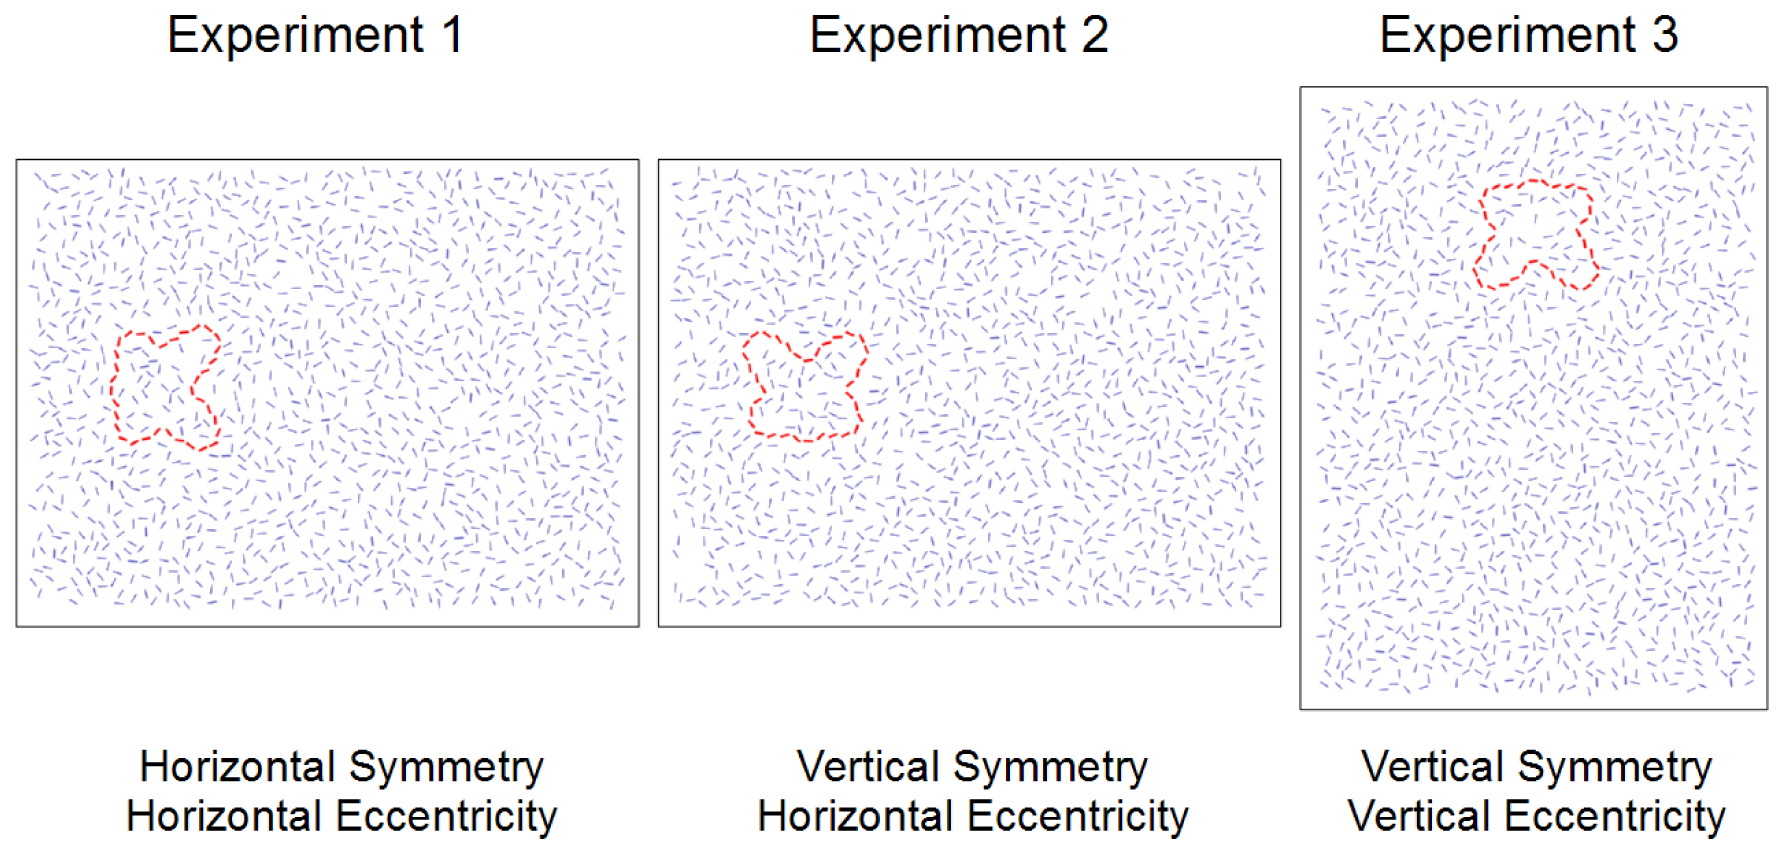
The stimuli used in Experiment 1 were versions of the 7 training sets and 57 experimental sets that were essentially the same as those in the pilot experiment: horizontally mirror symmetric contours to either the left or right of fixation. Rather than using pre-rendered bitmaps for each contour, however, the element positions and orientations in the oversize 920 × 600 display were loaded at the start of a trial. A random value between plus and minus 60 pixels was drawn for each trial and added to the default eccentricity of 210 pixels. The applicable 800 × 600 subset of the display was then rendered on the fly to yield the desired eccentricity, again hiding all Gabor elements that fell within 20 pixels of the image borders to avoid truncated elements. This procedure meant that the centroid was always vertically centered in the display but that its exact horizontal position was unpredictable to the observer, and eccentricity varied considerably between 150 and 270 pixels, or 4.2 and 7.7 degrees at 100 cm viewing distance.
Experiment 2 required vertically mirror symmetric contours to either the left or right of fixation. Rather than repeating the entire process of stimulus generation and selection, we simply modified the stimuli from Experiment 1 to suit our needs. We rotated the contour elements by 90°, around the contour's centroid, also applying the equivalent opposite rotation to the randomly oriented mirrored elements in the other half of the display (see above). We then filled up the arrays once again with 1400 additional randomly positioned and oriented elements, using the same minimum distance and local density criterion discussed previously. During the actual experiment, eccentricity was varied by rendering the applicable 800 × 600 subset of the resulting displays, following the same principle as in Experiment 1.
Experiment 3 required vertically mirror symmetric contours located above or below fixation. We took the contour elements from the Experiment 1 stimuli and in addition to rotating them 90 degrees, repositioned them so that they were horizontally centered and 210 pixels above or below the center of a 600 × 920 display to be shown with the monitor rotated to portrait orientation. The methods used to place the additional randomly oriented elements and add the random variation in eccentricity were analogous to those used in the previous experiments.
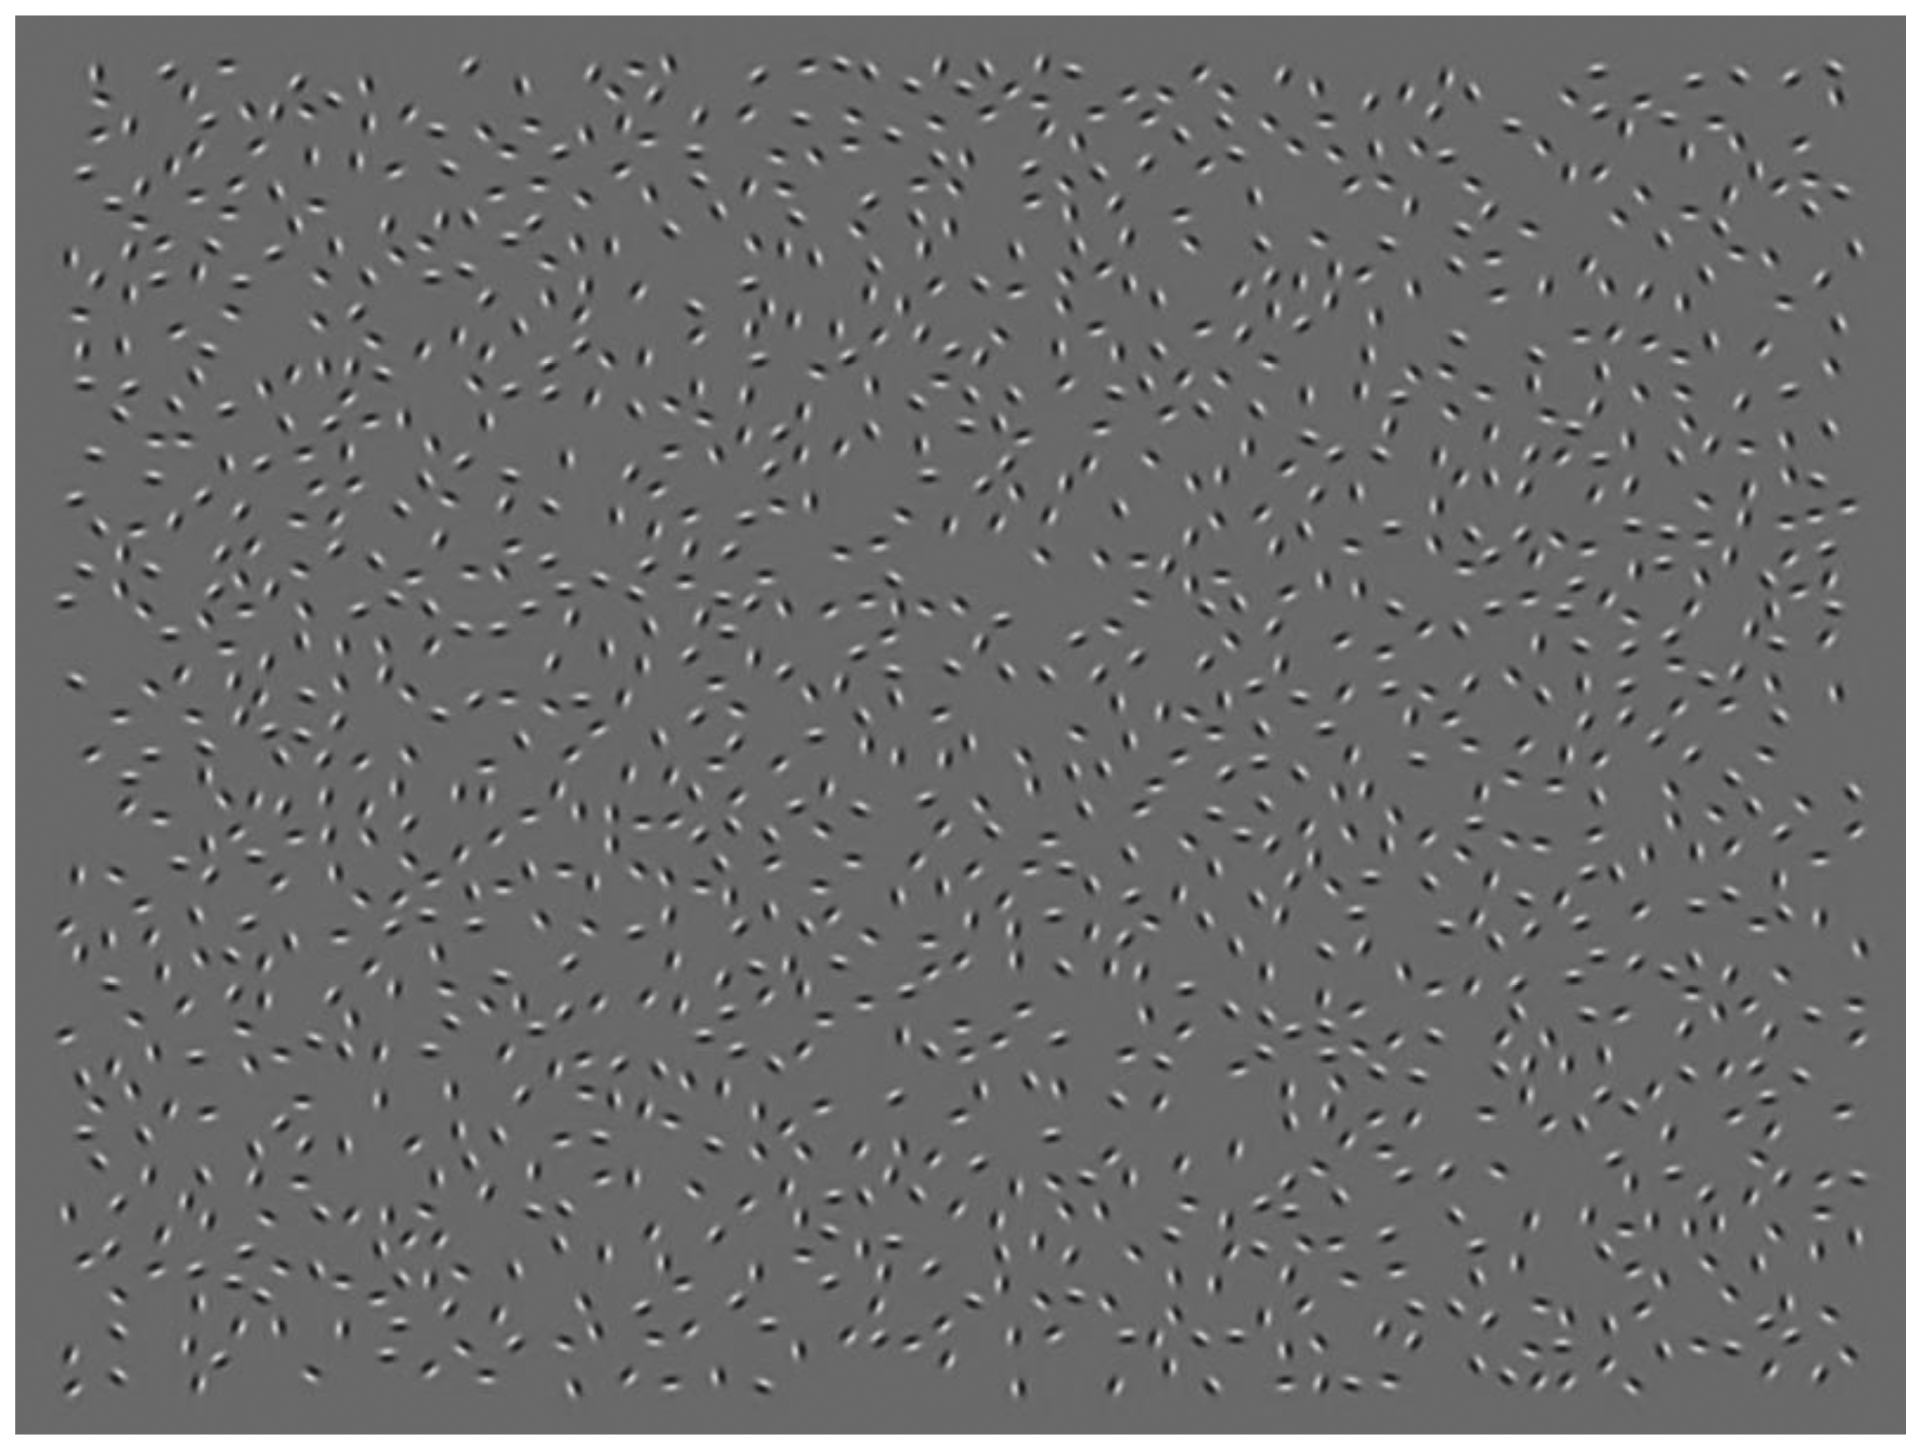
Figure 1 illustrates how the axes of symmetry and eccentricity varied between experiments, using simplified representations of the stimuli for clarity. Figure 2 shows an example of an actual Gabor-rendered stimulus display as used in the experiments.
2.2. Participants
Twenty-four students took part in the study and were given the choice of either course credit or a small compensation in reward for their participation. Thirteen of these students (7 men and 6 women, 19–27 years of age) took part in Experiment 1, six in Experiment 2 (2 men and 4 women, 17–23 years of age), and five in Experiment 3 (1 man and 4 women, 20–26 years of age). All student participants reported normal or corrected-to-normal vision, were not aware of the aims of the study, and each of them took part in only one of the experiments. Additionally, the first author (male, aged 28) took part in all three experiments.
2.3. Procedure
Participants viewed the stimuli from a distance of 100 cm on a gamma-corrected 20 inch Iiyama Vision Master Pro 514 CRT monitor running at an 800 × 600 pixels resolution and a 100 Hz refresh rate. For Experiment 3, the monitor was physically rotated to portrait orientation resulting in a 600 × 800 display. Eye movements were sampled at 1000 Hz by an SR Research EyeLink 1000 camera located in a desktop mount placed below the monitor at a camera-to-eye distance of approximately 60 cm. We programmed the experiments in Matlab and used the Psychophysics Toolbox [33–35] to control stimulus presentation and to interface with the EyeLink. Throughout the experiment, drift correction was performed before every trial, and the eye tracker was recalibrated whenever necessary.
Participants started each trial manually by pressing the spacebar while fixating a white dot in the center of an otherwise uniformly grey screen. If fixation was correctly maintained, a full-screen array containing a symmetric or asymmetric contour was presented after a randomized delay drawn from a uniform distribution between 500 and 1000 ms. Participants' task was to respond by making a single saccade away from the central fixation point, landing within a rectangular target area defined as the bounding box of the target contour plus 20 pixels (or 0.6 degrees) in every direction. If participants failed to maintain fixation until stimulus onset, made incorrect eye movements, or took more than 1 s to complete an eye movement, the trial was aborted and recycled once at the end of the block. Trials aborted a second time during this recycling were simply discarded.
It should be noted here that due to an oversight on our part, fixation control in Experiment 1 was stricter than we had intended it. Participants were required to maintain fixate within a square box with sides of just 2 cm on the screen, or 1.1 degrees at 100 cm viewing distance, which was half our intended size. We are confident that this had little to no bearing on our results and conclusions, since the proportions of aborted trials for the participants who completed Experiment 1 were almost identical to those in Experiments 2 and 3 (see Results). For a number of candidate participants (not included in the above total of thirteen students), however, we were forced to abort Experiment 1 altogether as it became immediately apparent during training that they would not be able to maintain stable enough fixation to consistently meet our overly strict criterion. We corrected this oversight in Experiments 2 and 3, changing the sides of the fixation box to 4 cm or 2.2 degrees, after which all further participants could complete their respective experiments successfully.
In all three experiments, eccentricity defined as the distance from the fixation dot to the centroid of the contour shape varied randomly between 150 and 270 pixels, or 4.2 and 7.7 degrees at 100 cm viewing distance. All participants completed 56 practice trials followed by eight blocks of 57 unique experimental trials, not counting recycled trials. In other words, each of the 456 (57 sets of 8) contour shapes appeared in one single trial to each participant. The order in which contour shapes were presented was entirely random, as was their assignment to the left or right (Experiments 1 and 2) or top or bottom (Experiment 3) half of the screen.
3. Results
We focused our analyses on the metrics of the successful saccades (i.e., saccades landing in the correct target area within 1 s of target onset) made by participants in each experiment. We considered two ways in which symmetry effects could manifest themselves in these metrics. Firstly, faster contour integration could give rise to faster saccades, which translates to an effect of symmetry on mean saccadic latency. Secondly, a more precise or veridical grouping could yield more accurate saccade landings. This could translate to an effect on mean landing position whereby saccades towards symmetric contours on average land closer to the actual centroid. It could also translate to more tightly clustered landing positions, meaning an effect on the spread or variance of landing position defined with respect to the centroid. We should note here that the speed and accuracy of eye movements are not independent and a speed/accuracy tradeoff is known to exist (e.g., [36]). Summary statistics for our data showed that the distance between the centroid of the target shape and the actual landing point of the saccade was negatively correlated to saccade latency, meaning that faster saccades indeed tended to be less accurate. The correlations were small but significant in all three experiments: r = −0.06 in Experiment 1; r = −0.16 in Experiment 2; r = −0.20 in Experiment 3; all p < 0.001. Including saccade accuracy in our analyses of latency and vice versa occasionally showed significant effects of one on the other, but these effects had no bearing on those of other predictors, and we therefore report the analyses below without including these predictors.
We log-transformed saccadic latency to reduce positive skew and used log latency as the dependent variable throughout our analyses of saccadic latency. In order to analyze landing position, we first separated the horizontal and vertical components of the difference in pixel coordinates between the landing position and contour centroid. Our analyses focused on the component parallel to the path between fixation and centroid (horizontal for Experiments 1 and 2, vertical for Experiment 3). The position of the centroid in the orthogonal direction was constant and thus perfectly predictable to the observer, and data exploration quickly revealed that there was very little variability in the orthogonal component (see also below). The parallel component itself served as the dependent variable when testing for effects on mean landing position. To test for effects on the spread of landing position, we mean-centered the parallel component by subject and by symmetry condition. The absolute value of the resulting variable served as the dependent variable, so that we were effectively predicting the absolute deviations from the subject × symmetry condition means.
As explanatory variables, we of course included symmetry as the main variable of interest, and looked for effects of the exact eccentricity at which each contour was presented as well as its location in the left/right hemisphere or top/bottom of the visual field. Furthermore, we computed a number of metrics of the target contours, including the perimeter, surface area, and compactness [37] of the shape defined by each contour, the contour length expressed as number of contour elements, and the mean path angle, that is, the average difference in orientation between neighboring elements along the contour. Thorough graphical exploration of the data suggested the number of contour elements and the mean path angle as likely covariates of both saccadic latencies and landing positions, leading us to systematically test for effects of these two metrics in our analyses.
We fitted linear mixed-effects models [38], which allow the inclusion of random effects and thus eliminate the need for separate by-subject analyses by taking into account the variability between and clustering within subjects. We used a manual stepwise procedure, performing χ2 likelihood ratio tests between pairs of nested models to decide on the inclusion or exclusion of effects. The exception to this rule was the main effect of symmetry. As it was of central interest here we included the effect regardless of its significance, in order to be able to report the corresponding parameter estimates and p values. In the detailed results that follow we focus mainly on the fixed effects part of each model. The random effects terms included were the same for every model reported below, consisting of a random intercept for subjects, and a random subject × location (left/right or top/bottom) interaction. Together these random effects help account for the clustering of observations by subject, and by location within subjects.
3.1. Log Latency
3.1.1. Experiment 1
Participants required an average of 327 ms to initiate a saccade towards the target contour (SD = 97 ms). The sample mean of saccadic latency for symmetric contours was 1.2 ms higher than for asymmetric ones. In the fitted model, where effects of covariates are accounted for, the estimated difference was in the opposite direction but near zero (<0.01 ms lower latency for symmetric vs. asymmetric shapes), and the effect of symmetry on log latency was not significant (p = 0.189). The model contained significant main effects of number of contour elements (p = 0.002) and mean path angle (p < 0.001), by which longer contours with larger mean path angles yield higher average log latency. Finally, there was a significant quadratic effect of eccentricity (p < 0.001), by which extreme eccentricities, both high and low, yield higher log latency than average eccentricities. Table 1 provides a complete overview of the fixed effects parameters in the model.
3.1.2. Experiment 2
Participants required an average of 284 ms to initiate a saccade towards the target contour (SD = 71 ms). Although the direction and range of required eye movements were the same as in Experiment 1, average latency in Experiment 2 was significantly lower (t(6840) = 23.86, p < 0.001). However, this was an overall effect, not specific to symmetric contours, and is more likely related to the less strict fixation criterion than to the change in symmetry axis. The sample mean of saccadic latency for symmetric contours was 2.5 ms higher than for asymmetric ones. In the fitted model, the estimated difference was in the opposite direction but near zero (<0.01 ms lower latency for symmetric vs. asymmetric shapes), and the effect of symmetry on log latency was not significant (p = 0.823). The model contained a significant main effect of mean path angle (p < 0.001). As in Experiment 1 higher log latency is predicted for contours with larger mean path angles. There was a significant quadratic effect of eccentricity (p < 0.001), qualitatively similar to that in Experiment 1, by which extreme eccentricities yield higher log latency than average eccentricities. Table 2 provides a complete overview of the fixed effects parameters in the model.
3.1.3. Experiment 3
Participants required an average of 274 ms to initiate a saccade towards the target contour (SD = 68 ms). The sample mean of saccadic latency for symmetric contours was 0.8 ms higher than for asymmetric ones. In the fitted model, the estimated difference was smaller and in the opposite direction (0.1 ms lower latency for symmetric vs. asymmetric shapes), and the effect of symmetry on log latency was not significant (p = 0.154). The final log latency model was considerably more complex and difficult to interpret than that for the previous experiments, as the use of vertical saccades introduced a significant interaction effect involving stimulus location. Namely, stimulus location interacts with a quadratic effect of the number of contour elements. In brief, this effect means that higher log latency is predicted for particularly long or short contours than for contours of average length shown above fixation, while below fixation contours of average length correspond to higher log latency than very short or long ones. Aside from this effect there were also main effects of eccentricity and mean path angle (both p < 0.001), whereby larger mean path angles as well as presentation further away from fixation predict higher log latency. Table 3 provides a complete overview of the fixed effects parameters in the model.
3.2. Mean Landing Position
For these analyses, the difference in pixel coordinates between the landing position and contour centroid was partitioned into a horizontal and a vertical component, and the component parallel to the path from fixation to centroid (horizontal for Experiments 1 and 2, vertical for Experiment 3) served as the dependent variable. On average, participants' saccades landed short of the centroid by approximately 10 pixels or 0.3 degrees in all three experiments and moreover, there was a clear linear relationship between this undershooting and the exact eccentricity at which the target appeared. Participants undershot targets presented at the greatest eccentricities used in the experiment (270 pixels or 7.7 degrees) by as much as 35 pixels or 1 degree on average. Conversely, the targets presented the closest to fixation (150 pixels or 4.2 degrees) were on average overshot by approximately 10 pixels or 0.3 degrees. This is known as a range effect [39,40]. This range effect is reflected in significant effects of eccentricity in all three experiments.
On a side note, the presence of range effects does not mean that participants simply targeted the same landing location regardless of the exact centroid location. Landing position relative to fixation showed strong linear correlations with target eccentricity in all experiments (r = 0.66, t(5646) = 66.4 in Experiment 1, r = 0.64, t(2879) = 44.6 in Experiment 2, r = 0.58, t(2448) = 35.6 in Experiment 3, all p < 0.001). This shows that the exact contour location was certainly taken into account in saccade targeting. The range of effective saccade landing positions is simply compressed when compared to the full range of eccentricities presented to the observer.
3.2.1. Experiment 1
Participants undershot the centroid by 10.3 pixels on average (SD = 27.4 pixels). The sample mean of landing position for symmetric contours was just 0.5 pixels further from the centroid (greater undershoot) than for asymmetric ones. In the fitted model, the estimated difference was 0.9 pixels, and the effect of symmetry on mean landing position was not significant (p = 0.128). There were significant effects of mean path angle and number of contour elements which predicted the extent of undershoot as inversely proportional to both of these metrics, and a range effect of eccentricity (all p < 0.001). Table 4 provides a complete overview of the fixed effects parameters in the model.
3.2.2. Experiment 2
Participants undershot the centroid by 8.9 pixels on average (SD = 28.3 pixels). The sample mean of landing position for symmetric contours was just 1.8 pixels further from the centroid (greater undershoot) than for asymmetric ones. In the fitted model, the estimated difference was 0.3 pixels, and the effect of symmetry on mean landing position was not significant (p = 0.699). There was a significant effect of the number of contour elements which was opposite to that in Experiment 1—the amount of undershoot here was proportional to contour length (p < 0.001)—and a range effect of eccentricity (p < 0.001). Table 5 provides a complete overview of the fixed effects parameters in the model.
3.2.3. Experiment 3
Participants undershot the centroid by 12.5 pixels on average (SD = 31.3 pixels). As in Experiment 1, the sample mean of landing position for symmetric contours was just 0.5 pixels further from the centroid (greater undershoot) than for asymmetric ones. In the fitted model, the estimated difference was 0.3 pixels, and the effect of symmetry on mean landing position was not significant (p = 0.751). The final model was again more complex than that for the other two experiments, due to significant differences between the top and bottom stimulus location. The range effect interacted with location (p < 0.001), being more pronounced for upward saccades. There was a significant effect of mean path angle (p = 0.006), which predicted an inversely proportional relation with undershoot. Table 6 provides a complete overview of the fixed effects parameters in the model.
3.3. Spread of Landing Position
3.3.1. Experiment 1
The standard deviation of the parallel component of the landing position (27.4 pixels overall, see above), was 1.6 pixels smaller for symmetric than for asymmetric contours. When we fitted a mixed linear model to the absolute deviations from the mean landing position (see above), the difference between conditions was estimated at 1.8 pixels and this effect proved significant (p < 0.001).
Furthermore, the final model predicted larger deviations from the mean for longer contours and larger mean path angles (both p < 0.001). There was also a significant quadratic effect of eccentricity (p < 0.001). This is the same range effect found in the previous analyses. Due to the coding of landing position as absolute deviations from the mean in the present analysis, its relationship to eccentricity changes direction when undershoot becomes overshoot at the lowest eccentricities, resulting in a quadratic relationship rather than a monotonic linear one. Table 7 provides a complete overview of the fixed effects parameters in the model.
3.3.2. Experiment 2
The standard deviation of the parallel component of the landing position (28.3 pixels overall, see above), was 0.7 pixels smaller for asymmetric than for symmetric contours. In the fitted model, the difference between conditions was estimated at 0.6 pixels and symmetry did not contribute significantly (p = 0.292) to the prediction of the absolute deviations from the mean landing position. The only other fixed effect in the final model for Experiment 2 was the significant quadratic range effect of eccentricity (p < 0.001). Table 8 provides a complete overview of the fixed effects parameters in the model.
3.3.3. Experiment 3
The standard deviation of the parallel component of the landing position (31.3 pixels overall, see above), was 1 pixel smaller for symmetric than for asymmetric contours. In the fitted model, the difference between conditions was estimated at 0.6 pixels and symmetry was not significantly (p = 0.366) predictive of the absolute deviations from the mean landing position. The quadratic range effect of eccentricity (p < 0.001) was the only other fixed effect in the final model. Table 9 provides a complete overview of the fixed effects parameters in the model.
3.4. Further Analyses
We performed several additional analyses analogous to the ones reported above. Namely, we analyzed the spread of log latency in much the same way as we did for landing position, testing whether the variance in saccadic latency was influenced by mirror symmetry. We also performed the analyses of mean and spread of landing position on its orthogonal component (i.e., in the vertical direction for Experiments 1 and 2, and horizontal for Experiment 3). These three analyses are not reported here in detail as we were not expecting any effects there a priori and indeed did not find any clear evidence for symmetry-related effects.
As a side note, our experiments were designed with a focus on saccade latency and accuracy and we did not expect any differences in proportion correct per se, but as a control, we also checked whether symmetry had any effect on the proportions of contours to which participants made a correct—accurate and timely—saccade. As expected, proportions correct were closely matched between symmetry conditions as well as between the three experiments. Proportions correct per participant ranged from 78% to 97% in Experiment 1 (N = 14, M = 89%), from 78% to 99% in Experiment 2 (N = 7, M = 90%), and from 79% to 97% in Experiment 3 (N = 6, M = 90%). Pairwise t-tests of differences between the number of successful saccades towards symmetric versus asymmetric contours revealed no evidence for any symmetry effect on percentage correct per se: t(26) = 0.72, p = 0.48 for Experiment 1; t(12) = 0.02, p = 0.99 for Experiment 2; t(10) = 0.19, p = 0.85 for Experiment 3.
4. Discussion
In three experiments we presented closed Gabor contours, which could be either mirror symmetric or asymmetric, in peripheral vision. The target contours were either horizontally (Experiment 1) or vertically (Experiments 2 and 3) mirror symmetric. Observers responded by making a horizontal (Experiments 1 and 2) or vertical (Experiment 3) eye movement towards the contour as soon as they detected it. As with Machilsen et al. [18], the task did not require symmetry detection but rather contour detection regardless of symmetry, leaving observers free to make spontaneous use of symmetry as a grouping cue or not.
Eye tracking provided us with multiple dependent measures in which symmetry effects could potentially manifest themselves, and we focused on those relating to saccadic latency and landing position. Saccades are typically drawn to the centroid of the saccade target shape [41–44]. This implies that the shape as a whole is taken into account in the planning and execution of the saccade. It follows that saccadic latency could serve as an indirect measure of how quickly or easily the target is perceptually grouped to form a representation of this whole. Additionally, the accuracy of saccade landing position defined with respect to the centroid could be taken as a measure of the precision of the representation resulting from the grouping process. In other words, if symmetry aided the integration of our eccentrically presented Gabor contours, we expected to find either faster or more accurate saccades, or both, towards symmetric contour shapes.
In brief, our three experiments revealed only subtle evidence for effects of mirror symmetry of the contour shape on contour integration in peripheral vision or on saccade targeting. None of the experiments showed evidence of an effect symmetry on mean saccadic latency or mean deviation of the landing position from the centroid of the target shape. Only Experiment 1 provided evidence that these deviations of the landing position from the centroid were less variable in the symmetric contour condition, meaning that saccade landing positions with respect to the centroid were clustered more closely together for symmetric stimuli.
Our rationale for choosing the horizontal symmetry axis in Experiment 1 was that, with stimuli presented left and right in the periphery, the perception of vertical mirror symmetry requires the comparison of elements that lie at different eccentricities from fixation, and such comparisons might be more vulnerable to impairment by reduced acuity or crowding for the most eccentric half of the shape compared to its mirrored counterpart sitting closer to fixation. Hence, we opted for the symmetry axis corresponding to the axis of eccentricity for Experiment 1, so that contour segments that were symmetric would also be iso-eccentric from fixation. Nevertheless, after we found no effects of symmetry on two out of the three saccade metrics of central interest, we decided to test whether vertical mirror symmetry would yield more or larger effects due to its potentially higher saliency. The trend across the symmetry detection literature is that vertical mirror symmetry is easier to detect than horizontal mirror symmetry, although not all studies individually show a difference between these two axes (see [45] for a review). We ran two concurrent experiments. Experiment 2 tested the vertical symmetry axis in contours placed in the same location as those in Experiment 1. For Experiment 3 we positioned the vertical symmetry axis centrally on the screen with target shapes appearing above or below fixation, requiring vertical saccades. The configuration in Experiment 3 meant that contours were effectively projected symmetrically onto the visual system (see [5,6]), and that the symmetry axis once again corresponded to the axis of eccentricity, as in Experiment 1. We did not, however, find additional symmetry effects in Experiments 2 and 3. Furthermore, we did not replicate the effect on the spread of landing positions found in Experiment 1.
Saccadic latency did seem to properly reflect the speed or difficulty of contour integration in the sense that log latency was proportional to the contours' mean path angle in all three experiments, and contour detection difficulty is known to increase with inter-element angle (e.g., [21]; see also [46,47]). However, any influence of symmetry on saccadic latency was simply absent or at least not strong enough to show up in the results. Due to the absence of locally symmetric element pairs in our symmetric contours, grouping based on other principles such as proximity and collinearity necessarily precedes grouping by symmetry. The symmetry cue only becomes available while contour integration is already in progress. While Machilsen et al. [18] showed that symmetry nevertheless has a slight effect on the perceptual robustness of similar stimuli in central vision to local element orientation jitter, it seems that the speed of grouping in the periphery is entirely governed by other principles.
The analyses of mean landing position revealed little besides the classical findings of a general undershooting bias in the saccades, and a range effect [39,40]. Symmetry did not have a significant effect on the average position of the saccade landing point with respect to the centroid of the target shape in any of the three experiments.
Likewise, for Experiments 2 and 3, analysis of the spread of landing position rather than the mean revealed only a range effect. In Experiment 1, however, the analysis of the spread in landing position showed evidence for a symmetry effect, namely that the deviations from the mean landing position are significantly smaller in the symmetric condition.
In principle, this finding of smaller deviations in landing position for symmetric contours could relate to contour integration and/or to saccade targeting, that is, the computation of the saccade target position based on the perceived object shape. Deviations in landing position were also smaller for contours with smaller inter-element angles, which are known to be easier to integrate [21,46,47]. This supports an interpretation of the symmetry effect in terms of grouping and not (only) saccade targeting per se. The effect may reflect improved grouping in the sense of a more precise representation of symmetric shapes facilitating saccade targeting. In light of the fact that these effects were not replicated in Experiments 2 and 3 though, interpretation remains somewhat difficult. In any case, the effect of symmetry was a subtle one at best.
In sum, the global mirror symmetry cue shown to result in a modest enhancement of contour integration in central vision [18] did not provide similar benefits in our experiments where contours were presented in the periphery. The absence of reliable differences in the speed or accuracy of saccades made towards symmetric shapes compared with asymmetric shapes meant that on the whole our experiments provided no evidence that contour integration for peripheral stimuli is facilitated by symmetry cues or that symmetric target shapes allow for faster or more accurate saccades per se.
In interpreting these findings, we must first consider one alternative explanation for the lack of symmetry effects. The task of making an eye movement towards a closed contour shape appearing in the visual periphery is quite naturalistic, but the stimuli necessary for a well-controlled test of contour integration are perhaps not. Compared to natural scenes, contour integration stimuli are inherently cluttered as a result of the placement of many distracter elements to eliminate proximity or density cues, which is a necessary and general limitation of this paradigm that was designed to isolate grouping by good continuation. Although earlier research has shown that participants can reliably identify many everyday object shapes embedded in such Gabor stimuli when presented in central vision [46,47], it is arguably unclear how accurate or detailed participants' perception of contour shape was with our eccentrically presented shapes, and whether participants perceived the complete closed contour.
However, firstly, we countered any possible impairment in symmetry perception due to reduced acuity or crowding in the more eccentric parts of the contours by making sure that symmetric contour segments were also iso-eccentric in Experiments 1 and 3, and we found no obvious consequences of relinquishing this control in the results of Experiment 2. Additionally, while the physical eccentricities of the target shapes were the same throughout all three experiments, there is a known anisotropy in peripheral vision, whereby acuity decreases more rapidly with eccentricity along the vertical than along the horizontal meridian [48]. More generally, the so-called cortical magnification factor differs depending on the direction along which it is measured [49,50]. Despite this anisotropy, the proportions of correct saccades were remarkably similar across the three experiments (see Further Analyses in the Results section above). Taken together, our findings thus suggest that lowered peripheral acuity was not a limiting factor either for the detection of the whole shape or for the perception of the symmetry between contour parts located at different eccentricities in our experiments (see [51] for additional discussion of the factors limiting peripheral contour integration).
Secondly, the fact that higher mean path angles resulted in slower saccades in all three experiments implies that global shape complexity is a determinant of latency, suggesting that the global shape was indeed taken into account. Finally, we also note that the tendency to undershoot the target cannot be taken as evidence for incomplete integration of the contour shape, as this is a general and well-documented property of human eye movements [39,40]. As a side note, the differences observed in our dependent measures between horizontal and vertical saccades and between upward and downward saccades should also not be interpreted as direct evidence for anisotropies in the contour integration mechanism, as they are due at least in part and perhaps entirely to direction-dependent differences in saccades per se [52].
While we are thus reasonably confident in concluding that our results indeed show that neither contour integration in the periphery nor saccade targeting are aided by a global mirror symmetry cue, we should of course be cautious in drawing wider conclusions from our results with regard to the importance of symmetry in figure-ground organization and vision in general. Mirror symmetry is ubiquitous in our visual environment, for instance in the shapes of many animals and plants as well as man-made objects, and research has shown it to be a highly salient property. While symmetry's effect on contour integration may be small [18] to non-existent, it is known to influence figure-ground assignment in classical figure-ground displays consisting of alternating light and dark areas [17,53,54], although for certain stimulus configurations symmetry has been shown to be subordinate to convexity in this context [55,56].
Besides any effect on perceptual grouping or figure-ground organization, symmetric regions in visual stimuli have also been shown to be conspicuous in that they attract attention and eye movements, even more so than regions with high contrast [31]. Açik, Onat, Schumann, Einhäuser and König [57] notably proposed a hierarchical framework in which attention and fixations when viewing natural scenes are governed first and foremost by high-level features such as symmetries and recursive patterns, and low-level features such as contrast guide attention and fixations only in the absence of salient higher-level properties. It is therefore conceivable that, if we were to create grouping displays similar to those used in our experiments but embedded two or more (symmetric and asymmetric) shapes in each display and allowed participants to view them freely, symmetric contours might attract more fixations than their asymmetric counterparts. However, in light of the results of the present study, one would then logically conclude that this (hypothetical) influence of symmetry does not operate at the level of contour integration or saccade targeting—which were the focus of the present study and showed no evidence of facilitation by symmetry—but rather at the level of attentional competition between the grouped percepts.
5. Conclusions
Our data showed little evidence for effects of global mirror symmetry on contour integration in peripheral vision or on saccade targeting. There is evidence that symmetry serves as a cue in classical figure-ground tasks [17,53–56], but local shape characteristics such as the path angle [21,46,47], and global characteristics such as convexity [58] or familiarity [59] seem to be more important determinants of performance in contour integration tasks. Contour integration benefits only slightly from global symmetry in central vision [18], and the benefit is apparently further reduced or entirely absent in peripheral vision. We conclude that the cue of global symmetry does not appear to facilitate contour integration in the periphery, and that its role in vision may be more apparent as a figure-ground cue or as a high-level determinant of saliency in natural scenes with multiple objects competing for attention, where symmetric regions in the visual field can pre-attentively signal the presence of objects, and thus attract eye movements [31].
Acknowledgments
This research was supported by a Methusalem grant from the Flemish Government awarded to Johan Wagemans (METH/08/02). Maarten Demeyer is a postdoctoral fellow of the Fund for Scientific Research Flanders (FWO).
Conflicts of Interest
The authors declare no conflict of interest.
References
- Barlow, H.B.; Reeves, B.C. The versatility and absolute efficiency of detecting mirror symmetry in random dot displays. Vis. Res. 1979, 19, 783–793. [Google Scholar]
- Corballis, M.C.; Roldan, C.E. On the perception of symmetrical and repeated patterns. Percept. Psychophys. 1974, 16, 136–142. [Google Scholar]
- Feldman, J. Formation of visual “objects” in the early computation of spatial relations. Percept. Psychophys. 2007, 69, 816–827. [Google Scholar]
- Locher, P.J.; Wagemans, J. Effects of element type and spatial grouping on symmetry detection. Perception 1993, 22, 565–587. [Google Scholar]
- Mach, E. Contributions to the Analysis of the Sensations; Open Court: LaSalle, IL, USA, 1897. [Google Scholar]
- Herbert, A.M.; Humphrey, G.K. Bilateral symmetry detection: Examining a “callosal” hypothesis. Perception 1996, 25, 463–480. [Google Scholar]
- Treder, M.S. Behind the looking-glass: A review on human symmetry perception. Symmetry 2010, 2, 1510–1543. [Google Scholar]
- Van der Helm, P.A. Symmetry perception. In Oxford Handbook of Perceptual Organization; Wagemans, J., Ed.; Oxford University Press: Oxford, UK, 2014; in press. [Google Scholar]
- Wagemans, J. Characteristics and models of human symmetry detection. Trends Cogn. Sci. 1997, 1, 346–352. [Google Scholar]
- Wagemans, J.; Elder, J.H.; Kubovy, M.; Palmer, S.E.; Peterson, M.A.; Singh, M.; von der Heydt, R. A century of Gestalt psychology in visual perception: I. Perceptual grouping and figure-ground organization. Psychol. Bull. 2012, 138, 1172–1217. [Google Scholar]
- Biederman, I. Recognition-by-components: A theory of human image understanding. Psychol. Rev. 1987, 94, 115–147. [Google Scholar]
- Biederman, I. Recognizing depth-rotated objects: A review of recent research and theory. Spat. Vis. 2001, 13, 241–253. [Google Scholar]
- Sawada, T.; Pizlo, Z. Detection of skewed symmetry. J. Vis. 2008, 8, 1–18. [Google Scholar]
- Wagemans, J. Perceptual use of nonaccidental properties. Can. J. Psychol. 1992, 46, 236–279. [Google Scholar]
- Wagemans, J. Skewed symmetry: A nonaccidental property used to perceive visual forms. J. Exp. Psychol. Human 1993, 19, 364–380. [Google Scholar]
- Wertheimer, M. Investigations on Gestalt principles. In On Perceived Motion and Figural Organization; Spillman, L., Wertheimer, M., Eds.; MIT Press: London, UK, 2012; pp. 127–183, Original work published in 1923; Translated by Wertheimer, M., Watkins, K.W. [Google Scholar]
- Bahnsen, P. Eine Untersuchung über Symmetrie und Asymmetrie bei visuellen Wahrnehmungen. Z. Psychol. 1928, 108, 129–154, In German. [Google Scholar]
- Machilsen, B.; Pauwels, M.; Wagemans, J. The role of vertical mirror symmetry in visual shape detection. J. Vis. 2009, 9, 1–11. [Google Scholar]
- Bex, P.J.; Simmers, A.J.; Dakin, C. Snakes and ladders: The role of temporal modulation in visual contour integration. Vis. Res. 2001, 41, 3775–3782. [Google Scholar]
- Dakin, S.C.; Baruch, N.J. Context influences contour integration. J. Vis. 2009, 9, 1–13. [Google Scholar]
- Field, D.J.; Hayes, A.; Hess, R.F. Contour integration by the human visual system: Evidence for a local “association field”. Vis. Res. 1993, 33, 173–193. [Google Scholar]
- Hess, R.F.; Beaudot, W.H.A.; Mullen, K.T. Dynamics of contour integration. Vis. Res. 2001, 41, 1023–1037. [Google Scholar]
- Hess, R.F.; May, K.A.; Dumoulin, S.O. Oxford Handbook of Perceptual Organization; Wagemans, J., Ed.; Oxford University Press: 2014; in press. [Google Scholar]
- Mathes, B.; Fahle, M. Closure facilitates contour integration. Vis. Res. 2007, 47, 818–827. [Google Scholar]
- Tversky, T.; Geisler, W.S.; Perry, J.S. Contour grouping: Closure effects are explained by good continuation and proximity. Vis. Res. 2004, 44, 2769–2777. [Google Scholar]
- Gurnsey, R.; Herbert, A.M.; Kenemy, J. Bilateral symmetry embedded in noise is detected accurately only at fixation. Vis. Res. 1998, 38, 3795–3803. [Google Scholar]
- Tyler, C.W.; Hardage, L. Mirror symmetry detection: Predominance of second-order pattern processing throughout the visual field. In Human Symmetry Perception and Its Computational Analysis; Tyler, C., Ed.; VSP (Brill imprint): Leiden, The Netherlands, 1996; pp. 151–171. [Google Scholar]
- Saarinen, J.; Rovamo, J.; Virsu, V. Analysis of spatial structure in eccentric vision. Invest. Ophth. Vis. Sci. 1989, 30, 293–296. [Google Scholar]
- Sally, S.; Gurnsey, R. Symmetry detection across the visual field. Spat. Vis. 2001, 14, 217–234. [Google Scholar]
- Itti, L.; Koch, C.; Niebur, E. A model of saliency-based visual attention for rapid scene analysis. IEEE Trans. Pattern Anal. 1998, 20, 1254–1259. [Google Scholar]
- Kootstra, G.; de Boer, B.; Schomaker, L.R.B. Predicting eye fixations on complex visual stimuli using local symmetry. Cogn. Comput. 2011, 3, 1–18. [Google Scholar]
- Demeyer, M.; Machilsen, B. The construction of perceptual grouping displays using GERT. Behav. Res. Methods 2012, 44, 439–446. [Google Scholar]
- Brainard, D.H. The Psychophysics Toolbox. Spat. Vis. 1997, 10, 433–436. [Google Scholar]
- Kleiner, M.; Brainard, D.; Pelli, D. What's new in Psychtoolbox-3? Perception 2007, 36. ECVP Abstract Supplement 14. [Google Scholar]
- Pelli, D.G. The VideoToolbox software for visual psychophysics: Transforming numbers into movies. Spat. Vis. 1997, 10, 437–442. [Google Scholar]
- Abrams, R.A.; Meyer, D.E.; Kornblum, S. Speed and accuracy of saccadic eye movements: Characteristics of impulse variability in the oculomotor system. J. Exp. Psychol. Human 1989, 15, 529–543. [Google Scholar]
- Zusne, L. Visual Perception of Form; Academic Press: New York, NY, USA, 1970. [Google Scholar]
- Pinheiro, J.C.; Bates, D.M. Mixed-Effects Models in S and S-Plus; Springer: New York, NY, USA, 2000. [Google Scholar]
- Kapoula, Z. Evidence for a range effect in the saccadic system. Vis. Res. 1985, 25, 1155–1157. [Google Scholar]
- Kapoula, Z.; Robinson, D.A. Saccadic undershoot is not inevitable: Saccades can be accurate. Vis. Res. 1986, 26, 735–743. [Google Scholar]
- Bindemann, M.; Scheepers, C.; Burton, A.M. Viewpoint and center of gravity affect eye movements to human faces. J. Vis. 2009, 9, 1–16. [Google Scholar]
- Findlay, J.M. Global visual processing for saccadic eye-movements. Vis. Res. 1982, 22, 1033–1045. [Google Scholar]
- Kaufman, L.; Richards, W. Spontaneous fixation tendencies for visual forms. Percept. Psychophys. 1969, 5, 85–88. [Google Scholar]
- Kowler, E.; Blaser, E. The accuracy and precision of saccades to small and large targets. Vis. Res. 1995, 35, 1741–1754. [Google Scholar]
- Wagemans, J. Detection of visual symmetries. Spat. Vis. 1995, 9, 9–32. [Google Scholar]
- Sassi, M.; Vancleef, K.; Machilsen, B.; Panis, S.; Wagemans, J. Identification of everyday objects on the basis of Gaborized outline versions. i-Perception 2010, 1, 121–142. [Google Scholar]
- Sassi, M.; Machilsen, B.; Wagemans, J. Shape detection of Gaborized outline versions of everyday objects. i-Perception 2012, 3, 745–764. [Google Scholar]
- Kondo, M.; Araragi, Y.; Nakamizo, S. New equally readable charts based on anisotropy of peripheral visual acuity. Jpn. Psychol. Res. 2008, 50, 93–99. [Google Scholar]
- Rosa, M.G.P.; Fritsches, K.A.; Elston, G.N. The second visual area in the marmoset monkey: Visuotopic organization, magnification factors, architectonal boundaries, and modularity. J. Comp. Neurol. 1997, 387, 547–567. [Google Scholar]
- Van Essen, D.C.; Newsome, W.T.; Maunsell, J.H. The visual field representation in striate cortex of the macaque monkey: Asymmetries, anisotropies, and individual variability. Vis. Res. 1984, 24, 429–448. [Google Scholar]
- Hess, R.F.; Dakin, S.C. Contour integration in the peripheral field. Vis. Res. 1999, 39, 947–959. [Google Scholar]
- Collewijn, H.; Erkelens, C.J.; Steinman, R.M. Binocular co-ordination of human vertical saccadic eye movements. J. Physiol. 1988, 404, 183–197. [Google Scholar]
- Driver, J.; Baylis, G.; Rafal, R. Preserved figure-ground segregation and symmetry perception in visual neglect. Nature 1992, 360, 73–75. [Google Scholar]
- Peterson, M.A.; Gibson, B.S. Must figure-ground organization precede object recognition? An assumption in peril. Psychol. Sci. 1994, 5, 253–259. [Google Scholar]
- Kanizsa, G.; Gerbino, W. Convexity and symmetry in figure-ground organization. In Vision and Artefact; Henle, M., Ed.; Springer: New York, NY, USA, 1976; pp. 25–32. [Google Scholar]
- Froyen, V.; Feldman, J.; Singh, M. Rotating columns: Relating structure-from-motion, accretion/deletion, and figure/ground. J. Vis. 2013, 13, 1–12. [Google Scholar]
- Açik, A.; Onat, S.; Schumann, F.; Einhäuser, W.; König, P. Effects of luminance contrast and its modifications on fixation behavior during free viewing of images from different categories. Vis. Res. 2009, 49, 1541–1553. [Google Scholar]
- Machilsen, B.; Demeyer, M.; Wagemans, J. Peripheral contour integration is biased towards convex contours. Perception 2013, 42. ECVP Abstract Supplement 115. [Google Scholar]
- Sassi, M.; Demeyer, M.; Machilsen, B.; Putzeys, T.; Wagemans, J. The role of familiarity and predictability in contour grouping. Perception 2013, 42 ECVP Abstract Supplement 113. [Google Scholar]

| Parameter | Estimate | SE | t | p |
|---|---|---|---|---|
| Symmetry | −8.20 × 10⁻³ | 6.25 × 10⁻³ | −1.31 | 0.189 |
| Mean path angle | 3.32 × 10⁻¹ | 4.25 × 10⁻² | 7.82 | <0.001 ** |
| Number of contour elements | 2.84 × 10⁻³ | 9.35 × 10⁻⁴ | 3.04 | 0.002 ** |
| Eccentricity1 | 8.81 × 10⁻¹ | 2.29 × 10⁻¹ | 3.85 | <0.001 ** |
| Eccentricity2 | 1.01 | 2.29 × 10⁻¹ | 4.45 | <0.001 ** |
Note: ** p < 0.01.
| Parameter | Estimate | SE | t | p |
|---|---|---|---|---|
| Symmetry | −1.65 × 10⁻³ | 7.39 × 10⁻³ | −0.22 | 0.823 |
| Mean path angle | 2.91 × 10⁻¹ | 4.47 × 10⁻² | 6.51 | <0.001 ** |
| Eccentricity1 | 7.01 × 10⁻¹ | 1.95 × 10⁻¹ | 3.59 | <0.001 ** |
| Eccentricity2 | 8.03 × 10⁻¹ | 1.95 × 10⁻¹ | 4.12 | <0.001 ** |
Note: ** p < 0.01.
| Parameter | Estimate | SE | t | p |
|---|---|---|---|---|
| Symmetry | −1.18 × 10⁻² | 8.26 × 10⁻³ | −1.43 | 0.154 |
| Bottom location | 8.47 × 10⁻² | 3.59 × 10⁻² | 2.36 | 0.018 * |
| Mean path angle | 1.93 × 10⁻¹ | 5.00 × 10⁻² | 3.86 | <0.001 ** |
| Number of contour elements1 | −5.73 × 10⁻¹ | 2.62 × 10⁻¹ | −2.19 | 0.029 * |
| Number of contour elements2 | 1.00 | 2.63 × 10⁻¹ | 3.82 | <0.001 ** |
| Number of contour elements1 × Bottom location | 7.13 × 10⁻¹ | 3.56 × 10⁻¹ | 2.00 | 0.045 * |
| Number of contour elements2 × Bottom location | −9.89 × 10⁻¹ | 3.57 × 10⁻¹ | −2.77 | 0.006 ** |
| Eccentricity | 4.17 × 10⁻⁴ | 1.08 × 10⁻⁴ | 3.86 | <0.001 ** |
Notes: * p < 0.05; ** p < 0.01.
| Parameter | Estimate | SE | t | p |
|---|---|---|---|---|
| Symmetry | −8.72 × 10⁻¹ | 5.73 × 10⁻¹ | −1.52 | 0.128 |
| Mean path angle | 25.4 | 3.90 | 6.53 | <0.001 ** |
| Number of contour elements | 2.89 × 10⁻¹ | 8.58 × 10⁻² | 3.37 | <0.001 ** |
| Eccentricity | −3.47 × 10⁻¹ | 8.34 × 10⁻³ | −41.56 | <0.001 ** |
Note: ** p < 0.01.
| Parameter | Estimate | SE | t | p |
|---|---|---|---|---|
| Symmetry | −3.06 × 10⁻¹ | 7.91 × 10⁻¹ | −0.39 | 0.699 |
| Number of contour elements | −4.37 × 10⁻¹ | 1.08 × 10⁻¹ | −4.04 | <0.001 ** |
| Eccentricity | −3.77 × 10⁻¹ | 1.19 × 10⁻² | −31.86 | <0.001 ** |
Note: ** p < 0.01.
| Parameter | Estimate | SE | t | p |
|---|---|---|---|---|
| Symmetry | −3.19 × 10⁻¹ | 1.01 | −0.32 | 0.751 |
| Bottom location | −6.06 | 1.06 × 101 | −0.57 | 0.566 |
| Mean path angle | 1.70 × 101 | 6.17 | 2.76 | 0.006 |
| Eccentricity | −4.59 × 10⁻¹ | 1.98 × 10⁻² | −23.16 | <0.001 ** |
| Eccentricity × Bottom location | 1.45 × 10⁻¹ | 2.98 × 10⁻² | 4.86 | <0.001 ** |
Note: ** p < 0.01.
| Parameter | Estimate | SE | t | p |
|---|---|---|---|---|
| Symmetry | −1.76 | 4.15 × 10⁻¹ | −4.25 | <0.001 ** |
| Mean path angle | 22.2 | 2.82 | 7.89 | <0.001 ** |
| Number of contour elements | 3.22 × 10⁻¹ | 6.20 × 10⁻² | 5.18 | <0.001 ** |
| Eccentricity1 | −10.8 | 15.2 | −0.71 | 0.475 |
| Eccentricity2 | 2.40 × 10² | 15.2 | 15.82 | <0.001 ** |
Note: ** p < 0.01.
| Parameter | Estimate | SE | t | p |
|---|---|---|---|---|
| Symmetry | 6.07 × 10⁻¹ | 5.76 × 10⁻¹ | 1.05 | 0.292 |
| Eccentricity1 | 8.73 × 10⁻¹ | 15.5 | 0.06 | 0.955 |
| Eccentricity2 | 1.74 × 10² | 15.5 | 11.25 | <0.001 ** |
Note: ** p < 0.01.
| Parameter | Estimate | SE | t | p |
|---|---|---|---|---|
| Symmetry | −6.38 × 10⁻¹ | 7.05 × 10⁻¹ | −0.90 | 0.366 |
| Eccentricity1 | 6.76 | 17.5 | 0.39 | 0.699 |
| Eccentricity2 | 1.31 × 10² | 17.5 | 7.46 | <0.001 ** |
Note: ** p < 0.01.
© 2014 by the authors; licensee MDPI, Basel, Switzerland. This article is an open access article distributed under the terms and conditions of the Creative Commons Attribution license ( http://creativecommons.org/licenses/by/3.0/).
Share and Cite
Sassi, M.; Demeyer, M.; Wagemans, J. Peripheral Contour Grouping and Saccade Targeting: The Role of Mirror Symmetry. Symmetry 2014, 6, 1-22. https://doi.org/10.3390/sym6010001
Sassi M, Demeyer M, Wagemans J. Peripheral Contour Grouping and Saccade Targeting: The Role of Mirror Symmetry. Symmetry. 2014; 6(1):1-22. https://doi.org/10.3390/sym6010001
Chicago/Turabian StyleSassi, Michaël, Maarten Demeyer, and Johan Wagemans. 2014. "Peripheral Contour Grouping and Saccade Targeting: The Role of Mirror Symmetry" Symmetry 6, no. 1: 1-22. https://doi.org/10.3390/sym6010001