Folded Sheet Versus Transparent Sheet Models for Human Symmetry Judgments

1
Statistical Physics Laboratory, Ecole Normale Supérieure, 24 rue Lhomond, 75231 Paris cedex 05, France
2
UMR8550 of the CNRS associated to UPMC University Paris 06 and to Paris Diderot University, Paris, France
Symmetry 2011, 3(3), 503-523; https://doi.org/10.3390/sym3030503
Submission received: 6 April 2011
/
Revised: 8 July 2011
/
Accepted: 8 July 2011
/
Published: 22 July 2011
(This article belongs to the Special Issue Symmetry Processing in Perception and Art)
Abstract
:As a contribution to the mysteries of human symmetry perception, reaction time data were collected on the detection of symmetry or repetition violations, in the context of short term visual memory studies. The histograms for reaction time distributions are rather narrow in the case of symmetry judgments. Their analysis was performed in terms of a simple kinetic model of a mental process in two steps, a slow one for the construction of the representation of the images to be compared, and a fast one, in the 50 ms range, for the decision. There was no need for an additional ‘mental rotation’ step. Symmetry seems to facilitate the construction step. I also present here original stimuli showing a color equalization effect across a symmetry axis, and its counterpart in periodic patterns. According to a “folded sheet model”, when a shape is perceived, the brain automatically constructs a mirror-image representation of the shape. Based in part on the reaction time analysis, I present here an alternative “transparent sheet” model in which the brain constructs a single representation, which can be accessed from two sides, thus generating simultaneously a pattern and its mirror-symmetric partner. Filtering processes, implied by current models of symmetry perception could intervene at an early stage, by nucleating the propagation of similar perceptual groupings in the two symmetric images.
1. Introduction
Symmetry invited itself on several occasions while I was performing psychophysical work on a number of topics, including unpublished work on geometrical illusions, and work on visual short term memory. In the latter, I measured the time to detect the difference between two nearly symmetric patterns. By design, the experiments were probing our sensitivity to asymmetries. They indicated that symmetry violations were detected faster than repetition violations [1], as already known from the work of Bruce and Morgan [2]. I also spent a fair amount of time producing symmetric patterns from random textures, trying to generate suggestive shapes that would extend as far as possible from the symmetry axis. [3]. In assembling strips of texture, I noticed a color effect: color differences between strips were attenuated when strips slightly differing in color were symmetrically juxtaposed [4], as though the existence of a symmetry axis was forcing the resemblance between the halves on the two sides of the axis. The results on symmetry violations (in the case of shapes) and on the attenuation of color differences in symmetric strips seemed to be pulling in opposite directions. A case study on a patient with brain damage, who became unable to read or write normal text, but could easily read or write text in mirror-inverted form [5] boosted my interest in possible neuro-anatomical explanations for symmetry perception, and encouraged me to present here a “transparent sheet” model, together with some original data and observations that, up until now, had only been briefly summarized in congress abstracts [1,4].
Published theoretical ideas on symmetry perception have also been pulling in divergent directions. There are contributions inspired by gestalt ideas, e.g., [6,7], there are filtering models inspired by neurophysiology, e.g., [8,9,10,11], and proposals on neuro-anatomical implementations, e.g., [12]. Commenting on the observation that symmetrical patterns are best detected when eye fixation is on the axis of symmetry [13], Braitenberg [14] wrote that “the two symmetrical halves of the picture are projected onto symmetrical positions of the right and left brain. (...). Apparently, there are fiber systems in the brain which are able to compare and establish the identity or non-identity of symmetrical points of the visual field. Such fiber systems are of course well known; the 200 million fibers of the corpus callosum and several other commissural bundles may well serve this purpose”.
The detection of bilateral symmetry being of paramount importance in animal life [15,16], there may in fact be a multiplicity of systems that operate in parallel towards the same goal, possibly at different resolutions and time scales. It is also often the case that both bottom-up and top-down processes intervene in visual interpretation, and that some consensus may be reached through back and forth negotiations between low level and high level processing units [17,18,19]. While most psychophysical studies on symmetry perception involve stimuli presentations in the 100 ms time scale, my own data or observations were made in situations of free inspection without time limitation.
2. Time to Detect Symmetry Violations
In order to measure the amount of information that is normally extracted from an image, Nicolas Brunel and I developed an experimental approach which is derived from the well-known “spot-the-error” game. In this game, two slightly different images are presented side by side. The player has to find out the differences. He/she moves the eyes freely from one image to the other. During a saccade from one image to the other, the trace in memory of the first image may not be detailed enough to allow the player to spot a difference with the second image although it may stand just in front of his eyes. Thus, finding the differences may be tedious, and the time taken to find them is an indirect measure of the level of detail at which visual memory is maintained over a saccade. The game could be rather more difficult when the left and right images are presented in a mirror symmetric way. Thus, in a visual games book by Agostini [20] there are two realistic drawings of a complex natural scene and each image expands over a whole page of the book. A conscious effort seems to be required to match the remote symmetric parts of the two images. Whether the problem has to do with symmetry per se, or with distance is unclear.
Brunel and I asked subjects to compare abstract random patterns formed by square lattices of black or white quadrangles (see Figure 1). The most interesting results were obtained with an experimental protocol in which the two images to be compared were nearly identical in half the cases, and differed at a single position in the other cases. When the images have low complexity, a left image may be entirely memorized and transferred without loss during a saccade to the right, so the judgment of identity, or the detection of a difference can be made in one shot. In this case the decision times are expected to be nearly equal for the two conditions. When the two images are rather complex, they must be scanned. When a difference is detected, the answer is clear, and visual scanning terminates. If not, scanning must be completed to allow an identity judgment to be made with some confidence.
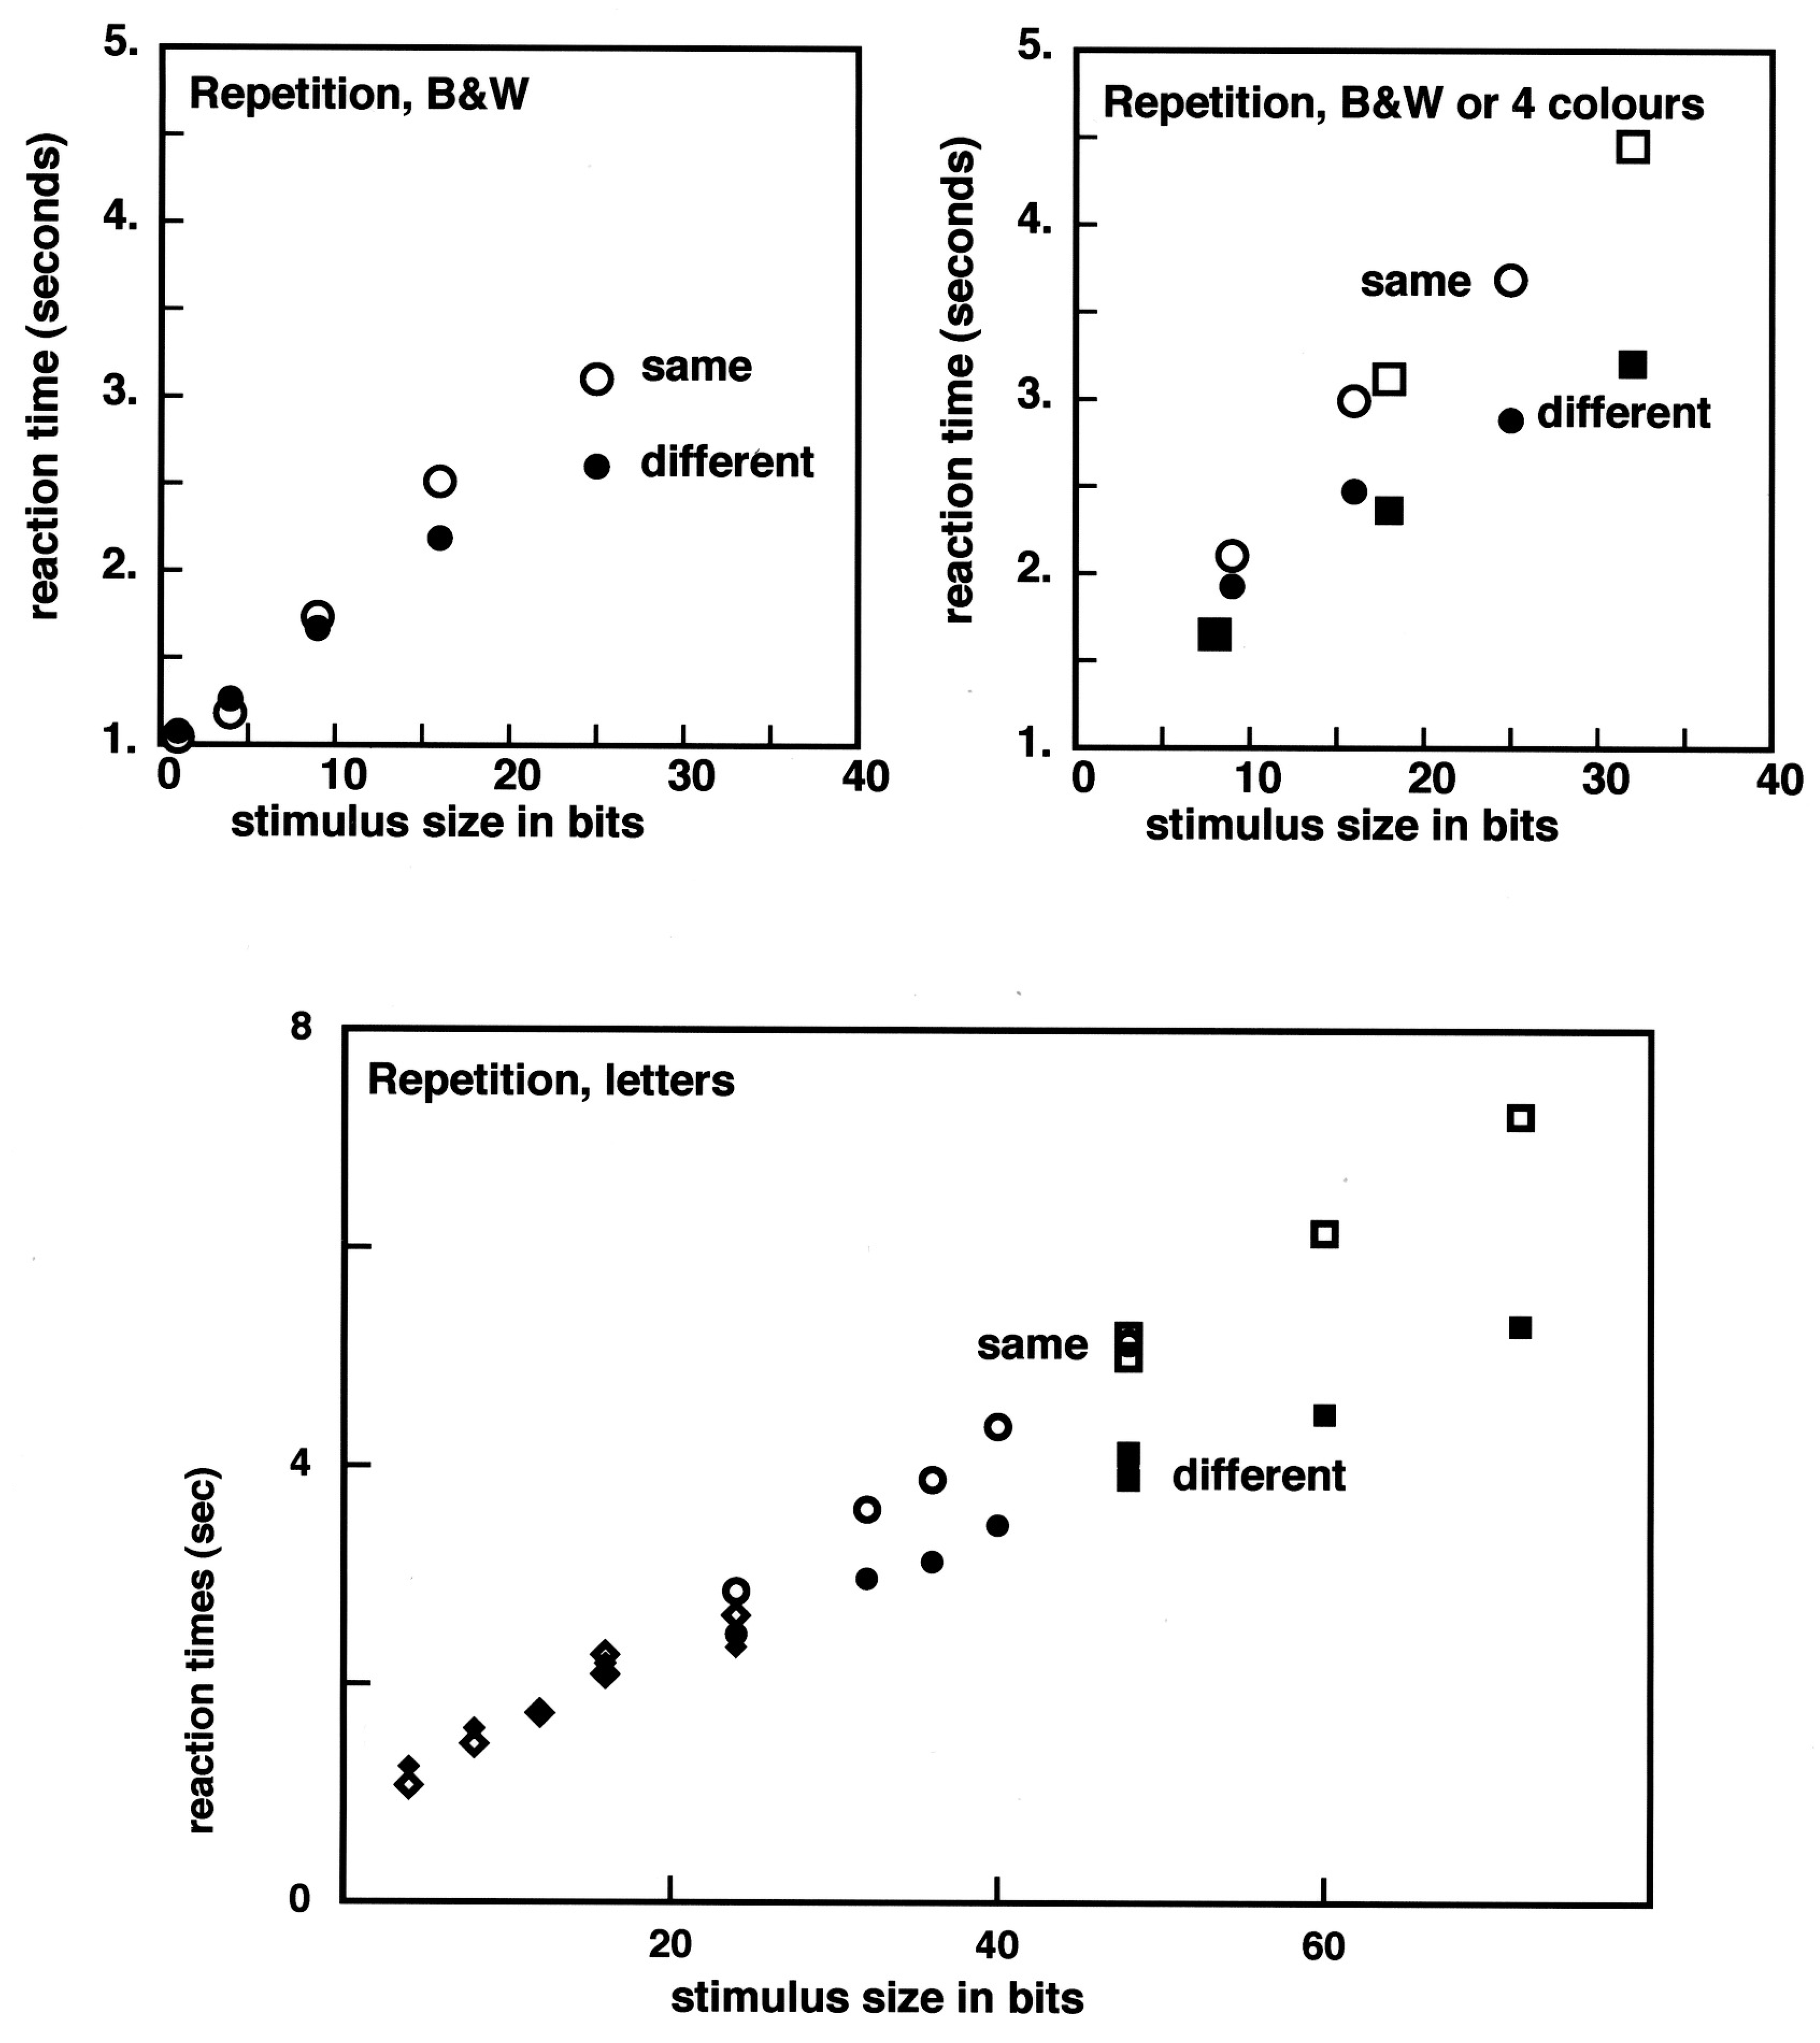
Clear-cut results were found [21]. With low complexity images, composed of 1 to 9 elementary quadrangles, both the error-rates and the reaction times were nearly equal in the two conditions. However, at higher complexities (4 × 4 or more complex images), the reaction times started to be larger in the identity condition (top left panel in Figure 2). The errors, mostly false negative ones (making a “no difference” response when there was one) also started to rise when 4 × 4 images were compared. The insensitivity to a difference, it was said [22], can be taken as an example of the striking phenomenon of “change blindness” (e.g., [23]).
Brunel and I proposed that there was some limiting visual capacity for black and white shapes, somewhere in between the 3 × 3 and the 4 × 4 images. We proposed 12 ± 3 bits as the amount of visual information captured on an image that survives a saccade. The result was extended to images with colored quadrangles. There were four colors in the stimuli (red, yellow, blue, and green), and the same 12 bits boundary was found [24]. While a black or white quadrangle corresponds to one bit, a quadrangle having one among four colors corresponds to two bits of information. Then, our result indicated that comparing side by side matrix patterns formed of eight elementary colored elements takes about the same time as comparing matrix patterns composed of 16 black or white elements. It should be said however that there was a large inter subject variability in the reactions to colored patterns. Once we chose to plot the subject-averaged reaction times as a function of the number of bits rather than the number of elements in the pattern, the experimental data took place on exactly the same curves (top right panel in Figure 2). When blocks of capital letters were compared, the split between same and different responses occurred above 12 bits, it was closer to 20 bits (five letters, under our conditions, bottom panel in Figure 2). Presumably, the letters are encoded in a robust way and survive better than shapes to a saccade.
It was tempting to extend these experiments to symmetry perception. Data were collected on 3 × 3, 4 × 4 and 5 × 5 pairs of images, symmetrically presented with or without separation (right side of Figure 1). The divergence between the ‘same’ and the ‘different’ reaction times as a function of image complexity is similar to that observed in the case of repetition, except that it might start at 9 bits or earlier in the case of symmetry, but this feature may not be statistically significant. Since there is much interest in how symmetry detection succeeds as a function of the distance to the symmetry axis [25], I plotted in Figure 3 the reaction times as a function of column position for both the previous repetition experiments, and the new symmetry experiments. Error rate determinations are less precise, due to the paucity of errors, but in rough agreement with the reaction time data. Reaction times are smaller in the case of the symmetry experiments, but this will become much more explicit in the experiments reported next (in Figure 4).
The dominant feature in Figure 3 is a stratification of the reaction times as a function of image complexity. There is also a distance to the symmetry axis effect, but mainly for 5 × 5 images. This pattern of results may be surprising in the field of symmetry perception, but it is in line with our previous work, showing a 50 to 60 ms increase in RTs per binary element in the images. Furthermore, the fact that reaction times are smaller, for columns 2–4 than they are for both column 1 and column 5, in the case of 5 × 5 images is in agreement with a mechanism of visual capture of information by areas of about 9–1 2 elements.
In order to go further into the analysis of the data, I looked into reaction time distributions. I performed, as a subject, extensive experiments on repetition violations and symmetry violations and in this case, both with separated and non-separated images. I alternated several times between 20 to 30 mn experimental runs on each of the three conditions. All the reaction time distributions are shown in Figure 4.
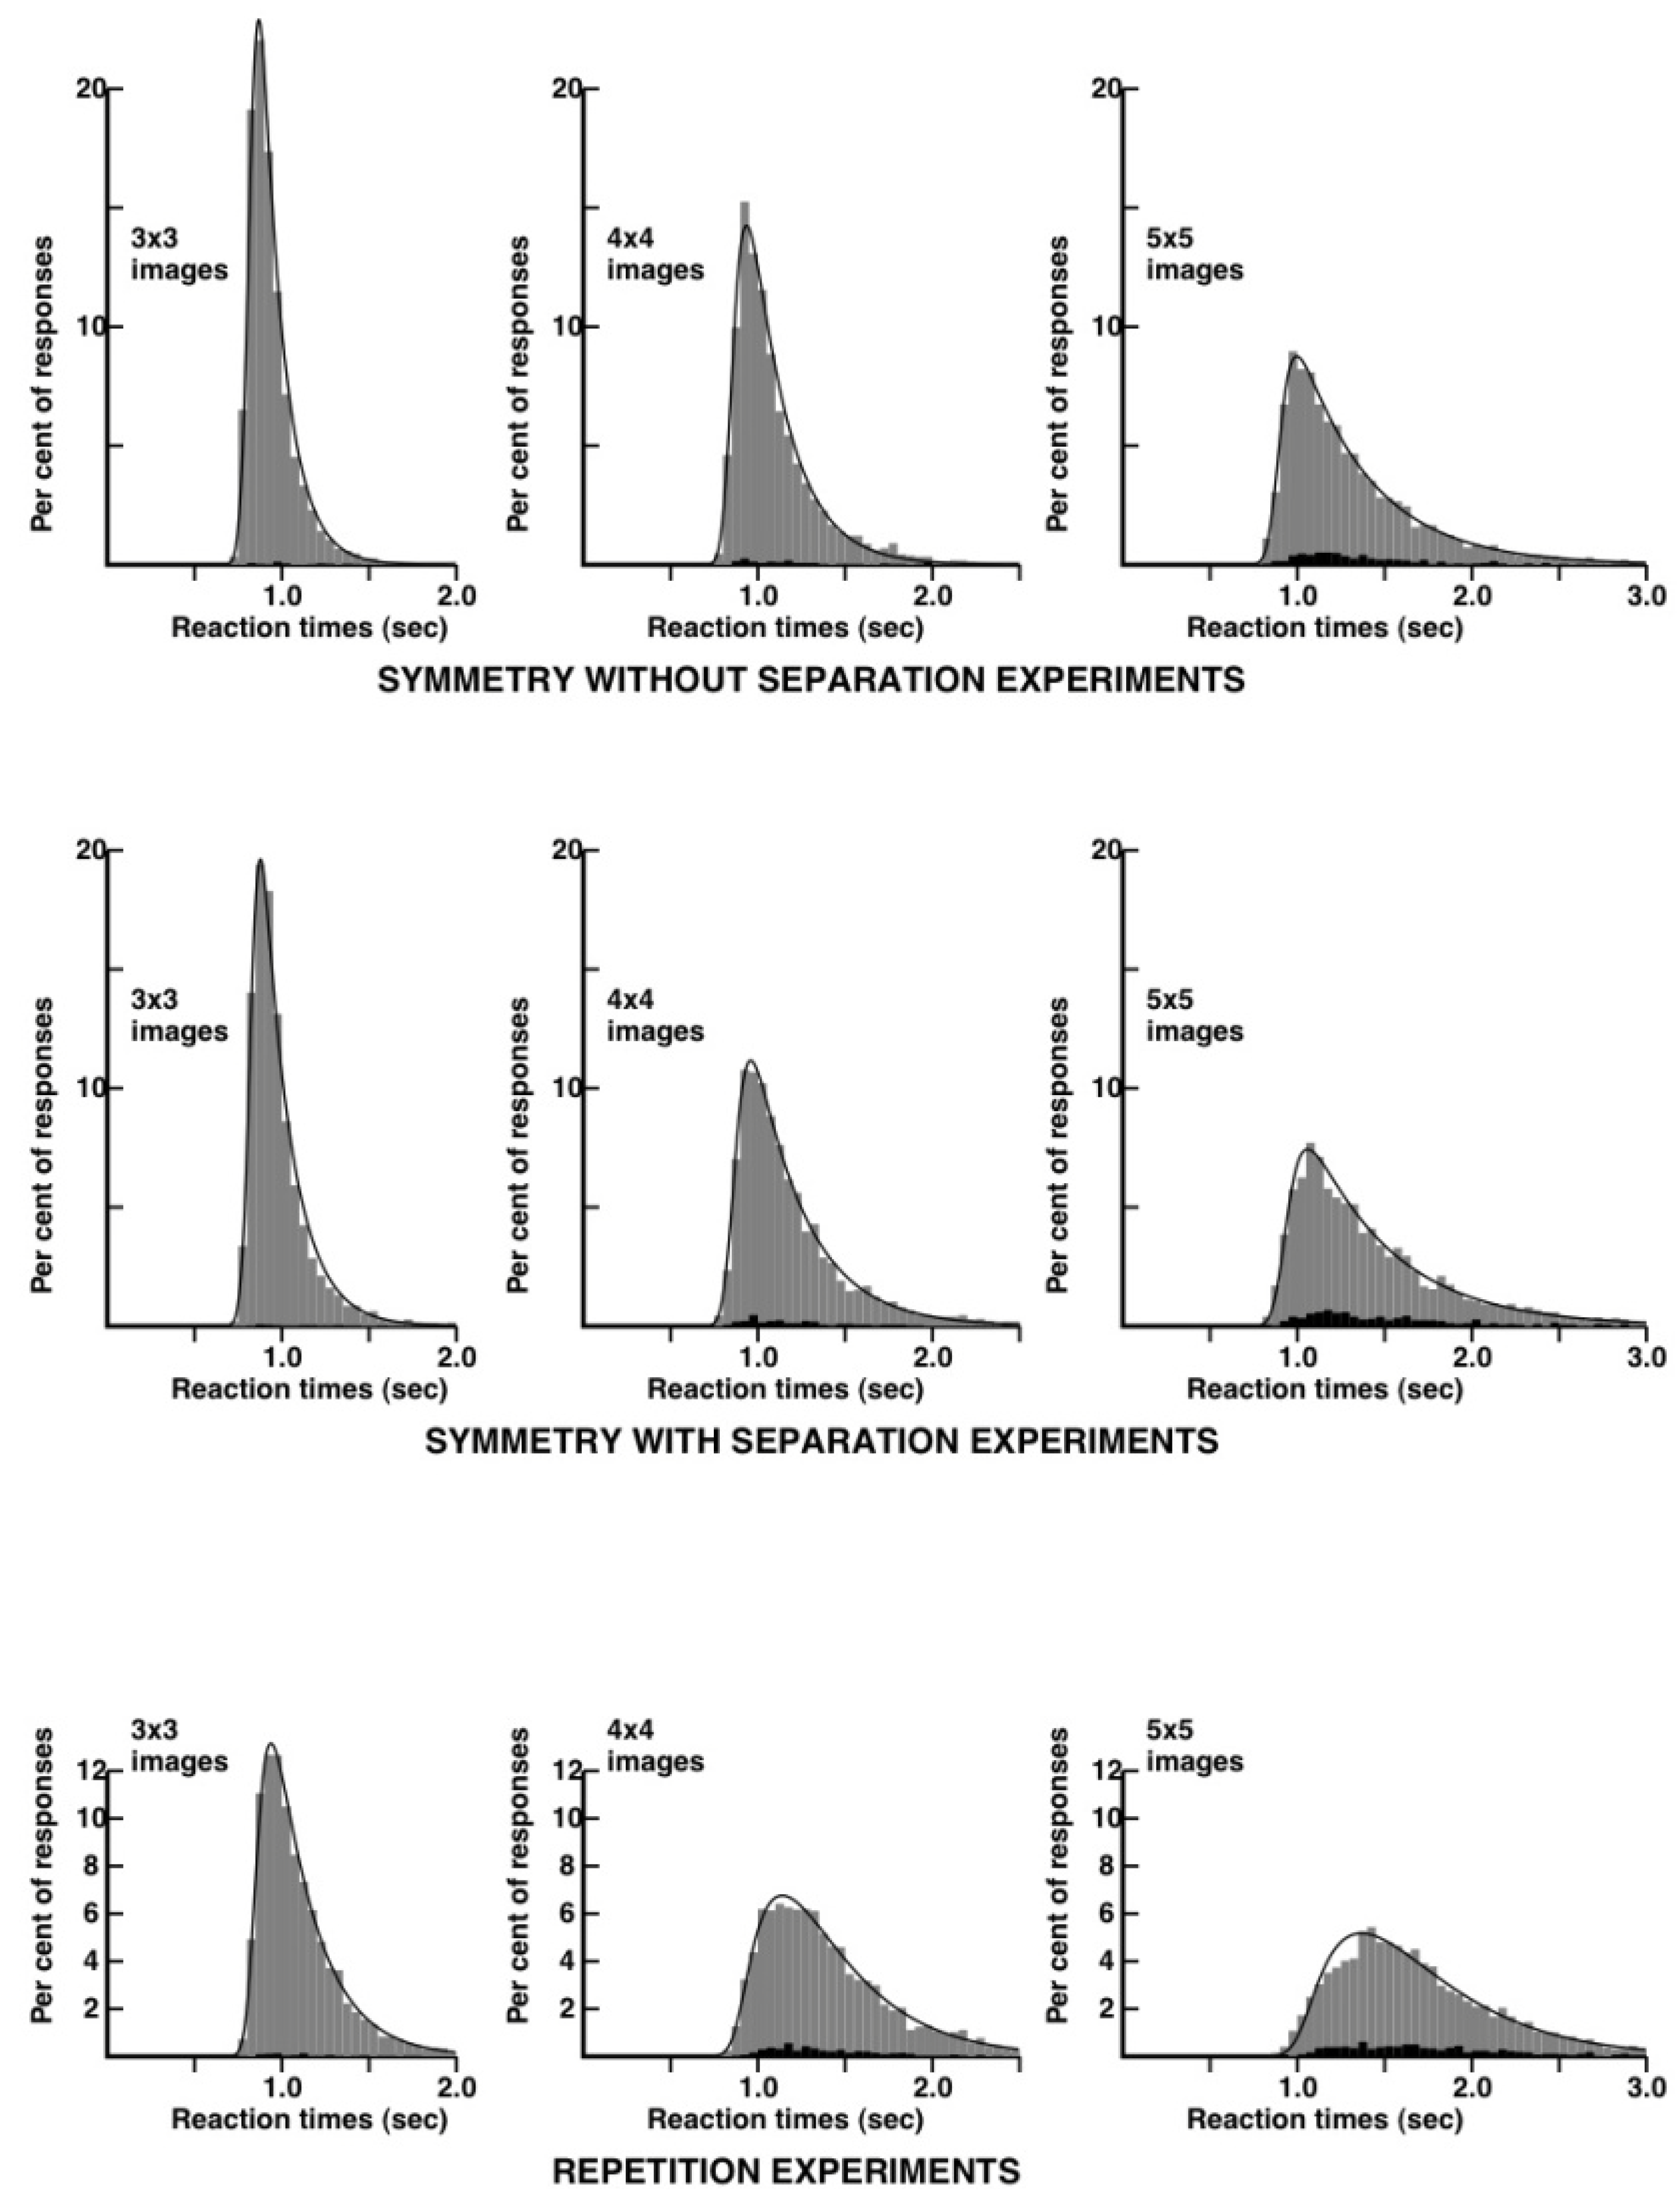
Here, we see a remarkable difference between the repetition and the symmetry without separation conditions. The reaction time distributions are much narrower in the case of the symmetry condition. The distribution for 3 × 3 patterns can be modeled, in the case of symmetry, by a very simple kinetic scheme, involving a lag and an exponential decay widened by a gaussian (an “ex-gaussian” in RT distribution terminology). The corresponding distribution for the repetition condition requires one more kinetic step, following the principles proposed in [26] and explained in more detail in the Appendix. In the case of 5 × 5 patterns, the reaction time distribution is, in the symmetry condition, quite close to what it is for 3 × 3 patterns in the repetition condition. The reaction time distribution for 5 × 5 patterns is quite wide in the repetition condition. I would have expected some widening of the RT distributions in the symmetry condition, reflecting occasional mental rotations to match the external borders of the 5 × 5 patterns, but there is no evidence for such a step. In contradistinction, mental flipping requiring about 3/10th of a second can be detected in memory experiments with images of opposite polarity of contrast [27].
As a provisional conclusion, both repetition and symmetry violations seem to be detected through the comparisons of patches of about 9–12 bits of information. Reaction times and error-rates would be at their lowest close to the symmetry axis, but at the centre of the patches, thus on the second column in the case of symmetric patterns with five columns on each side. The most striking difference between the repetition and the symmetry experiments is in the reaction times distributions, which are much narrower in the case of symmetry, a feature which I will try to explain in the Discussion.
3. A Color Equalization Effect
There are too often conspicuous differences in hue between two reproductions in color of a same picture (e.g., photographs derived from a same negative but processed in different baths, or copies of a same numerical document on two different printers). Recently, in assembling in a mirror-symmetric way strips from different photographs of a same colored texture, I inadvertently mixed strips differing in hues. I became aware of the incongruity much later, when I made a count of the strips taken from different photographs. I then explored the insensitivity to hue inequality by preparing computer generated colored textures in which the color components were varied in a controlled way. Three pictures were selected and presented in a poster at the 31st ECVP congress [4].
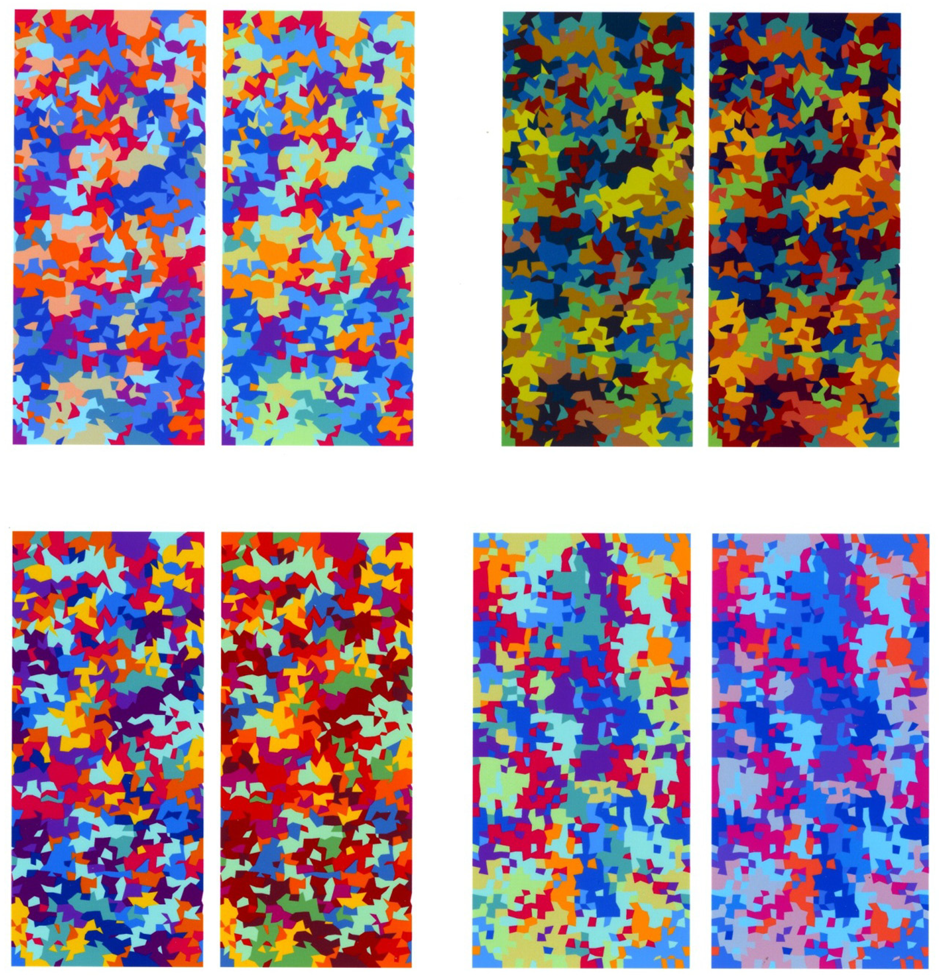
These pictures used the strips shown in Figure 5, except the bottom right strips. There were three pairs of strips representing exactly the same patterns, but with different colors. Within a pair, the color components were pulled apart by a small amount in opposite directions, thus they were pulled apart along a red-green axis for the top left panels, along a cyan-magenta axis for the top right panels, and along a red-blue axis for the bottom left panels. The two panels of each pair were then assembled as triptychs, with the mirror-image of one panel in the centre, and a copy of the other panel on each side. There were therefore two local bilateral symmetry axes in each panel (Figure 6). The differences in hues along the two symmetry axes are less salient than in the case of the side-by-side presentation of Figure 5. About 25 out of the 30 congress participants who examined the poster and wished to discuss it with the author were definitely sensitive to the equalization effect, at least with one of the three pictures (displayed at a 19 cm × 25 cm size). The equalization effect was rather less salient in grey-level variants that were also displayed in the poster. Among the few resistant people who did not see any effect there were high level specialists with sharp vision. In my case, having examined with attention many such images, and being sensitive to the equalization effect, I feel that, as with some other illusory phenomena, the effect might build up with repeated viewing.
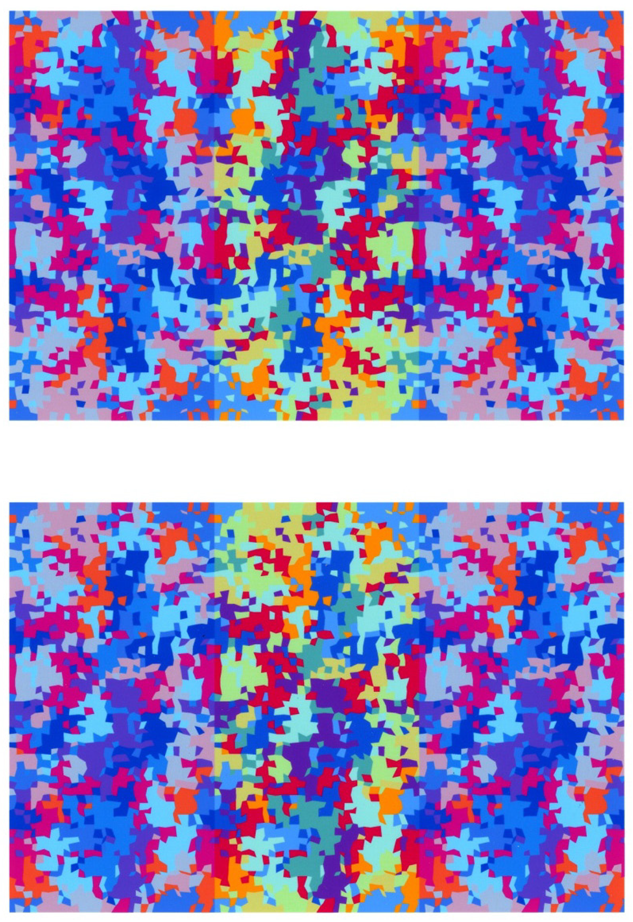
My interpretation of the phenomenon, as presented in [4], was in terms of a “transparent sheet” model (see the next section). However, one of the scientists who attended the poster, Frederic Boy—of the School of Psychology, University of Cardiff—made a counterproposal: He suggested that colors were apparently equalized on the two sides of the symmetry axis because the two sides would fall into the receptive fields of the same neurons, and a single color may thus be bound to a receptive field that crossed the symmetry axis. This was reasonable enough, and it made a link with filtering models of symmetry perception. In order to test Boy’s proposal, I designed a colored texture panel such that the colors on the left and right borders were exactly matched (bottom right panels in Figure 5). When panels differing in hues are laid down side by side the color equalization effect occurs, it seems, with the same magnitude, as it does in the symmetrical case (Figure 7). Therefore, symmetry would be an easy way to produce the effect, but it is not essential. Nevertheless, there is an important message in this study—that repetition controls in symmetry experiments should take into account the potentially disruptive effects of unmatched borders.
4. A Conjecture on Symmetry Judgments
It has been known for a long time that a main difficulty encountered by children in the acquisition of the written alphabet was in making the distinction between pairs of letters that are related by mirror symmetry, such as a “b” and a “d”. Adults too encounter difficulty segregating an area containing, for instance, the capital letter R at all orientations from a nested area containing their mirror symmetric pseudo letters. This type of observation was a key argument in Julesz promotion of his texton theory of texture perception [28]. Human’s general difficulty in distinguishing a shape from its mirror image led to the proposal (see e.g., [29]) that when the brain represents a shape, it constructs automatically the mirror-image representation of that shape. This is what I call a “folded sheet” model because it is a reminder of Rorschach method for producing symmetrical shapes from inkblots squeezed between the two halves of a folded sheet. The two brain hemispheres could be recruited for a similar purpose, as Braitenberg reminds us [14]. However, if we start thinking in these terms, we would also wish to use the two brain hemispheres for image comparison in stereo vision, but with the images in the same orientation. Note also that symmetry perception does not require binocularity.
In a remarkable case study, Pflugshaupt et al. [5] described a patient who, after cerebral damage produced by hypoxia could not read normal text or write in the standard way, but could read text reflected in a mirror, and write in a mirror-inverted way. The authors interpreted their data in terms of a folded sheet model: the brain, under normal conditions would construct both the normal representation of a visual stimulus, and its mirror-inverted form. Following brain damage in some specific site, the standard representation would be unavailable, and the brain would use the mirror-image representation.
Being influenced by the observations on the attenuation of color differences in symmetric patterns, I thought of an alternative possibility. I conjectured that somewhere in the brain, patterns would be represented like images printed on a transparent sheet: depending on the side of the sheet you are looking at, you see this pattern in its standard form, or in its mirror-inverted form. Such a model, I thought incorrectly, could account for the color equalization effect: imagine that each eye captures one side of a symmetric pattern, and paints it on its corresponding side of the transparent sheet, then the color on one side should be perceived as somewhat blended with the color painted on the other side.
Furthermore, the model could nicely explain the observations on mirror-inverted writing in some brain damaged patients. Consider again the difficulty encountered by young children when they have to learn that a “b” and a “d” are not the same letter. Assume there is, at some stage of visual processing, a common representation of the two letters, and assume that two bundles of neurons have access to this representation from two sides, one bundle connecting the representation, say, to the left hemisphere, and the other connecting it to the right hemisphere. Then, through learning, a child would acquire a mechanism that inhibits the functioning of one of the two bundles, at least during reading and writing. If, due to brain damage, the other bundle cannot operate, then inhibition can be removed, and the person would become able to read and write in a mirror-inverted way.
However, a model involving simultaneous dual representations, would do as well in explaining mirror-inverted writing in the brain damage patients, it might simply require additional neuronal circuitry (or not). So, what did we gain other than elegance, in presenting a new metaphorical explanation? In agreement with Jan Koenderink [30], I feel that there is virtue in pursuing theoretical ideas for their own sake, not trying to look for an immediate quantitative fit with the data. However, it also turns out, as I will attempt to show in the Discussion, that quite unexpectedly, both the transparent sheet model and the color equalization effect may throw some light on my first data set—that on reaction times in short term memory experiments.
5. Discussion
The work presented here was, at the beginning, an extension of work on short term visual memory experiments, so it used patterns, tools and concepts that were developed in the memory experiments, and are unusual in the field of symmetry perception. I measured the time to detect a single symmetry violation in patterns of moderate complexities (using at most 25 quadrangles in each image). In the symmetry perception field, random-dot patterns are often used, with sometimes as many as 300,000 dots [25]. Furthermore, the focus is more on the symmetry versus random noise ratio, than on single symmetry violations [31,32,33]. What happens when the two images forming a pair match each other, but one image is a distorted version of the other? The topic is actively discussed in the field of symmetry perception [34,35]. Reaction times remain constant, in repetition experiments, when moderate uncorrelated distortions are introduced in the images to be compared [21], but I have no comparable data on symmetric pairs.
Ideally, we always wish to set up experiments in which there are different conditions, and comparisons can be made between situations in which all parameters, except one, are identical. Unfortunately, it is in most cases impossible to change voluntarily one feature, without changing at the same time, unknowingly, some other feature. For instance, in the case of black and white versus colored patterns (Figure 2, top right panel), when the black or white elements are replaced with colored ones taking four different color values, many subjects expect to perform better, due to color saliency. Actually, their results expressed in seconds/quadrangle worsen (for a link with work on symmetry, compare with [36]). The color and the black and white data agree only when they are expressed in seconds/bit. Actually, when colors are added to a pattern, there is a side effect: previously connected black or white areas that are important for shape perception become disrupted into smaller colored pieces. As shown earlier, pixellization does not facilitate repetition judgments [21].
In the repetition comparisons, there is a potential artifact that I noticed in my work on memory: A shape is, so to speak, contaminated by the neighboring shapes. The perception of the left column in the right image is influenced by the patterns (and especially the black/white balance) of the neighboring right column of the left image. Using another terminology, I would say that the perceptual groupings in one image are influenced by the features that are present on the closest border of the other image. When two identical images are presented in the repetition mode, several groupings may be tried. They would compete, as in a Stroop effect, thus lengthening the reaction times. Furthermore, when repeated images are presented without spacing, artificial unrepeated patterns are created at the junction between the two images. This generates an experimental bias against repetition, and may again cause an exaggerated evaluation of the advantage of mirror symmetry in reaction time studies. In contradistinction, the equivalence between the two sides of the symmetry axis, in the symmetric presentations could force the spread of the same perceptual groupings in the two images of a symmetric pair. Therefore, a low level filtering mechanism that would impose a common fate on the two sides of the axis (and presumably contribute to the color equalization effect) would also play a role at a higher level, by canalizing the perceptual groupings on the two sides of the symmetry axis.
The finding to which I attach the greatest significance in this article is the narrowing of the reaction times distributions in the case of the symmetry comparisons. An intuitive way to analyze RT distributions is to use the kind of models commonly used in chemical and enzyme kinetics. There, a “decision” (make a product, after an enzyme-substrate interaction, or abort) is made after following a number of more or less reversible steps on a reaction pathway. Each elementary step follows a law of exponential decay, see e.g., [37] and the Appendix. This type of model is quite easy to handle, but is very unusual in psychopyhsics. In order to transpose such models to my memory experiments, I needed to add two ingredients: a lag, and a widening (through a convolution by a gaussian). This approach gives me satisfaction as it provides intuitive, rather coherent interpretations of the data. The experimental curves of Figure 4 can be analyzed with the help of a quantitative model involving four adjustable parameters (see Table 1).
The first parameter, the lag, includes the time to perform the motor response after the brain has determined whether or not there is a repetition or a symmetry violation in the stimulus. Note that this part of the RT distribution mostly reflects the latest events in the sequence of steps that lead to the motor response (a left or right key press on the computer mouse). The lag is expected to grow somewhat with image complexity, but here the effect is small in the case of repetition, and absent in the case of symmetry. I put this, on account of my extensive training, as a subject.
The gaussian widening factor has a tendency to grow with stimulus complexity in the case of repetition comparisons, but shows little variation in the symmetry comparisons. Its variations here in the case of the repetition experiments are taken as reflecting sources of heterogeneity that are absent in the symmetry experiments. It turns out (perhaps due to over training) that I had rather small differences in average RTs between the “same” and the ‘different’ responses at all image complexities in the symmetry, but not the repetition experiments.
We can focus now on the two really important parameters, the k1’s and k2’s that hopefully, reflect the kinetics of the mental process. Two parameters are sufficient to account for the RT distributions (with the lag and the gaussian factor playing a cosmetic role). There are two consecutive irreversible steps, with a slow component, k1, and a faster component, k2. The theoretical RT distributions are unchanged if k1 and k2 are permuted, so one cannot say whether the slow component precedes or follows the fast one. I conjecture that k1 mostly reflects the construction of the representation of the stimuli, and k2 mostly reflects the ’identity’ or the ’violation’ decision that is taken, once the representation is available.
The variations in k1 can now be interpreted in the following way: at low image complexities (3 × 3 and 4 × 4 images) the stimuli are represented in the brain more rapidly in the case of symmetry than in the case of repetition. This is no longer true at higher image complexities. The variations in k2 can now be interpreted as follows: There is a standard kinetic constant of 20/s to make a “same” or a “different” judgment. The average decision time would be the reciprocal of k1, that is 50 ms. This would account for all six symmetry experiments, and for the 3 × 3 repetition experiments. The k1 values would be abnormally low in the 4 × 4 and 5 × 5 repetition experiments, perhaps due to the disrupting border effect discussed above.
If this analysis is correct, perceptual decisions about repetition or symmetry violations take about the same basic time: 50 ms. Decisions concerning repetition violations with 4 × 4 or 5 × 5 stimuli would be slowed down due to confusing influences at the borders of the images. The major advantage of symmetry appears to be where it was not expected: in the construction of a representation of the stimuli. This advantage is reflected in the ratio of the k1’s for repetition versus symmetry. The ratio is close to 1.75 with 3 × 3 and 4 × 4 images. The advantage might turn into a disadvantage with more complex images, as the k1’s ratio equals 0.9 with 5 × 5 images.
A most striking aspect of the kinetic analysis in Table 1 is the absence of a feature that might have been present: There is absolutely no room for an additional ‘mental rotation’ step in the symmetry data. If such a step existed, it could have been reflected in an increased lag, an increased gaussian widening, or an additional kinetic constant k3. Quite to the contrary, none of the four parameters gives an advantage to repetition comparisons. This raises the possibility that the representations of a pair of mirror-images are constructed faster than the representation of a single image. This is not an absurd idea, in the field of memory: two different views of the same object allow one to recognize the object better than a single view. The two views are pointing towards the same engram of the object, allowing it to be retrieved with greater facility. In my opinion, the kinetic data in Table 1 could indicate that, at least with 3 × 3 and 4 × 4 patterns, there is no mental rotation involved in the symmetry judgments, so, at least metaphorically, there would be no room for a folded sheet model, and we would be closer to a transparent sheet situation in which two mirror images would be two views of basically the same pattern. Thus, if my interpretation is correct, the reaction times distributions are narrower in the case of symmetric patterns, not because decisions occur faster, but because the construction of the representation would go faster, in the case of symmetry. This conjecture might be tested in the future by exploring situations in which complementary information are sent simultaneously [38] or asynchronously [39,40] to the two eyes, and studying the reaction time distributions as a function of the presentation delays.
Acknowledgements
I thank Frederic Boy for his insightful comment on receptive fields across a symmetry axis, and the organizers of the 1999, 2006, 2007 and 2008 ECVP congresses for accepting my abstracts about topics presented in more detail in this review.
Appendix
Kinetic Modelling of Reaction Times Distributions
In the past, mean RT measurements were used to make inferences about mental processes [41,42,43]. When large data sets are available, it becomes possible to push the analysis further and extract information from the reaction time distributions [44]. In psychophysics, RT distributions start after a lag called the «transducer» component (chapter 6 in [44]). Most experimental RT distributions, even when they are unimodal, are not gaussian. The curves are steeper on their left side (the leading edge) than on their right side (the tail). Technically, as noted by several authors [44,45], the tails are well approximated by «exponential decays».
Exponential decays are quite natural in physico-chemical kinetic studies, for processes in which «the past does not influence the present». For instance, in radioactive decay, an isotope A is transformed into an isotope B. If x(t) is the amount of A at time t, the fraction dx/x of A that is transformed into B during the infinitesimal slice of time dt is k.dt, where k is the kinetic constant characterizing the process. We can say in a looser but more intuitive way that the probability of transition from A to B is constant per unit time. The kinetic constant k is the reciprocal of the half-life of the transformation of A into B. Transposing from chemistry to psychology, we can imagine that the brain is initially in an «undecided» state A. Taking a decision amounts to make a transition from the undecided state A to the «determined» state B. Hohle [45] and Luce (chapter 6 in [44]) consider that the exponential behaviour seen in the tails of the psychophysical RT distributions reflects the decision component in the mental process.
Since there are several sources of heterogeneity in any set of psychophysical data, it is natural to combine an exponential decay with a gaussian. If the half-width of the gaussian is significantly smaller than that of the exponential decay, the gaussian does not influence the tails of the RT distributions. In all cases, it does contribute to the rising part of the distributions, since this part is strictly vertical in an exponential decay. The combination of a gaussian and an exponential decay leads to the minimal «ex-gaussian» distribution [46]. Several authors found that the ex-gaussian accounted satisfactorily for RT distributions arising in very simple tasks. In the present work, it neatly accounts for the RT distribution found in comparison tests on 3x3 pairs of symmetric images. More sophisticated models are required to simulate the other 7 RT distributions. Several fitting models can be used, icluding the lognormal distribution (e.g., [47,48]), the gamma distribution [49,50], or the Weibull distribution [51,52,53]. All these models capture the general properties of RT distributions. A fitting curve generated with one model can, to some extent, be mimicked by a fitting curve generated with another model [54]. However, these models provide ad hoc parameters to fit the RT distributions. They fail to provide illuminating insights when RT distributions obtained under different conditions are compared.
In the present work, I used a different approach, adapted from the theory of reaction rates in physical chemistry, as it is currently applied, for instance, in the field of enzyme catalysis. An enzyme E catalyses the transformation of a substrate S into a product P through a more or less complex reaction scheme. In the simplest case, there is a sequence of two irreversible steps (the free enzyme E binds S, then the enzyme-substrate complex ES yields the product P and the enzyme becomes available for a new cycle of reaction). Each transition is assumed to occur with a uniform probability per infinitesimal slice of time, so the simplest catalytic cycle involves two consecutive exponential decays. More complex schemes have been studied in which there may be a dozen of intermediate states, and a complex branching pattern connecting the states. Pairs of intermediate states A and B may be connected reversibly, meaning that the reaction path may involve both a forward step from A to B, and a backward step from B to A. Again, all the elementary steps connecting pairs of states are deemed to be exponential decays. For decades, most enzymological studies were restricted to the determination of mean reaction rates and their variations with the concentrations of the substrates. With the development of fast kinetic techniques (e.g., T-jump, stopped flow, quenched flow) the biophysicists became able to study the initial phases of a reaction, and detect intermediate stages in the process (review in [55]). The results are generally represented as « progress curves ». The reaction times distributions are the derivatives of these progress curves with respect to time. Explicit analytical expressions describing the progress curves are rather cumbersome, even for schemes with only four states (see, for instance [56]). Fortunately, it is extremely easy to predict the reaction times distribution by computer simulation, for schemes of any complexity. With the recent advent of «single molecule enzymology», boosted by the development of the FRET (fluorescence resonance energy transfer) technique, many laboratories are studying the progress of a catalytic reaction on an isolated macromolecular complex. As an example of the state-of-the-art, Geggier et al. [57] studied a catalytic reaction on the ribosome. Their working model for explaining their data is a linear scheme with four intermediate states, connected by both forward and backward elementary steps. Branching out paths are included in the scheme. The authors assigned numerical values to 11 kinetic constants in the scheme, exploiting the fact that they could follow the kinetics of appearance and disappearance of some of the intermediates along the reaction pathway.
In my attempts to interpret psychophysical reaction time data with models adapted from chemical kinetics [26,27], I tried to use minimal schemes in terms of numbers of intermediate states, but I added features that are not standard in chemical kinetics–the lag, and the gaussian widening. Otherwise, I would have needed to include a large number of preliminary steps in order to model the lag, and branchpoints that generate alternative pathways to replace the gaussian widening. I Take the lag and the gaussian as cosmetic [30] parameters, and consider that the essence of the model lies in the chemical kinetic core. The fact that one of the experimental RT distributions can be modelled with a single step core (3 × 3 pairs of images in the symmetry comparisons) and that most of the others can be modelled with just a two-steps core comes out as a very encouraging surprise. In work with Jean-François Patri [27] involving comparisons in two different modes (same or opposite polarities of contrast), we added a branchpoint in the kinetic model reflecting the two alternative ways of interpreting black or white as figure or ground. Confronting the RT distributions acquired under a variety of conditions, I am tempted to believe that the tail of the distributions does not necessarily correspond to the decision component in the process, but might, in large measure, reflect the time spent in constructing a representation of the stimulus.
There was no a priori theoretical reason to expect that psychophysical reaction time distributions could be interpreted in terms of a chemical kinetic core involving a very small number of elementary steps. Nevertheless this type of analysis succeeds, not only in modelling the data in a formal sense, but also in producing parameters that seem to capture meaningful aspects of the process under investigation.
References
- Ninio, J. Processing of symmetrical shapes in short-term visual memory. Perception 2006, 70–71. [Google Scholar]
- Bruce, V.G.; Morgan, M.J. Violations of symmetry and repetition in visual patterns. Perception 1975, 4, 230–249. [Google Scholar] [CrossRef]
- Ninio, J. Designing visually rich, nearly random textures. Spat. Vis. 2007, 20, 561–577. [Google Scholar] [CrossRef] [PubMed]
- Ninio, J. Symmetry influences colour perception: the transparent sheet model. Perception 2008, 37 (ECVP Abstract Supplement), 147–148. [Google Scholar]
- Pflugshaupt, T.; Nyffeler, T.; von Wartburg, R.; Wurtz, P.; Lüthi, M.; Hubl, D.; Gutbrod, K.; Juengling, D.; Hess, C.W.; Müri, R.M. When left becomes right and vice versa: Mirrored vision after cerebral hypoxia. Neuropsychologia 2007, 45, 2078–2091. [Google Scholar] [CrossRef] [PubMed]
- Bertamini, M.; Friedenberg, J.; Kubovy, M. Detection of symmetry and perceptual organization: How a lock-and-key process works. Acta Psychol. 1997, 95, 119–140. [Google Scholar] [CrossRef]
- Watt, R.J.; Phillips, W.A. The function of dynamic grouping in vision. Trends Cogn. Sci. 2000, 4, 447–454. [Google Scholar] [CrossRef]
- Dakin, S.C.; Watt, R.J. Detection of bilateral symmetry using spatial filters. Spat. Vis. 1994, 8, 393–413. [Google Scholar] [CrossRef]
- Dakin, S.C.; Hess, R.F. The spatial mechanisms mediating symmetry perception. Vis. Res. 1997, 37, 2915–2930. [Google Scholar] [CrossRef]
- Poirier, F.J.A.M.; Wilson, H.R. A biologically plausible model of human shape symmetry perception. J. Vis. 2010, 10, 1–16. [Google Scholar] [CrossRef]
- Treder, M.S. Behind the looking glass: A review on human symmetry perception. Symmetry 2010, 2, 1510–1543. [Google Scholar] [CrossRef]
- Sasaki, Y.; Vanduffel, W.; Knutsen, T.; Tyler, C.; Tootell, R. Symmetry activates extrastriate visual cortex in human and nonhuman primates. Proc. Nat. Acad. Sci. USA 2005, 102, 3159–3163. [Google Scholar] [CrossRef] [PubMed]
- Barlow, H.B.; Reeves, B.C. The versatility and absolute efficiency of detecting mirror symmetry in random dot displays. Vis. Res. 1978, 19, 783–793. [Google Scholar] [CrossRef]
- Braitenberg, V. Reading the structure of brains. Network 1990, 1, 1–11. [Google Scholar] [CrossRef]
- Tyler, C.W. Human Symmetry Perception. In Human Symmetry Perception and Its Computational Analysis; Tyler, C.W., Ed.; VSP: Zeist, The Netherlands, 1996; pp. 3–22. [Google Scholar]
- Wagemans, J. Characteristics and models of human symmetry detection. Trends Cogn. Sci. 1997, 1, 346–352. [Google Scholar] [CrossRef]
- Mumford, D. On the computational architecture of the neocortex. Biol. Cybern. 1991, 65, 135–145. [Google Scholar] [CrossRef] [PubMed]
- Bartels, A.; Zeki, S. The theory of multistage integration in the visual brain. Proc. R. Soc. London Ser. B 1998, 265, 2327–2332. [Google Scholar] [CrossRef]
- Ahissar, M.; Hochstein, S. The reverse hierarchy theory of visual perceptual learning. Trends Cogn. Sci. 2004, 8, 458–464. [Google Scholar] [CrossRef]
- Agostini, F. Giochi con le Immagini; Arnoldo Mondadori: Milan, Italy, 1986. [Google Scholar]
- Brunel, N.; Ninio, J. Time to detect the difference between two images presented side by side. Cogn. Brain Res. 1997, 5, 273–282. [Google Scholar] [CrossRef]
- Scott-Brown, K.C.; Baker, M.R.; Orbach, H.S. Comparison blindness. Vis. Cogn. 2000, 7, 253–267. [Google Scholar] [CrossRef]
- Rensink, R.A.; O’Regan, J.K.; Clark, J.J. To see or not to see: The need for attention to perceive changes in scenes. Psychol. Sci. 1997, 8, 368–373. [Google Scholar] [CrossRef]
- Ninio, J.; Mizraji, E. Processing of shapes, colours, and letters in short-term visual memory. Perception 1999, 28 (ECVP Abstract Supplement), 6. [Google Scholar]
- Tyler, C.W.; Hardage, L.; Miller, R.T. Multiple mechanisms for the detection of mirror symmetry. Spat. Vis. 1995, 9, 79–100. [Google Scholar] [PubMed]
- Ninio, J. Mental kinetics in visual memory. Perception 2007, 36 (ECVP Abstract Supplement), 52. [Google Scholar]
- Patri, J.-F.; Ninio, J. Recognising random shapes with inverted contrast polarity. Perception 2009, 38 (ECVP Abstract Supplement), 178. [Google Scholar]
- Julesz, B. Textons, the elements of texture perception, and their interactions. Nature 1981, 290, 91–97. [Google Scholar] [CrossRef] [PubMed]
- Corballis, M.C.; Beale, I.L. On telling left from right. Sci. Am. 1971, 224, 96–104. [Google Scholar] [CrossRef] [PubMed]
- Koenderink, J.J. The head and the hands. Perception 2002, 31, 517–520. [Google Scholar] [CrossRef]
- Huang, L.; Pashler, H.; Junge, J.A. Are there capacity limitations in symmetry perception? Psychon. Bull. Rev. 2004, 11, 862–869. [Google Scholar] [CrossRef]
- van der Vloed, G.; Csathó, Á.; van der Helm, P.A. Symmetry and repetition in perspective. Acta Psychol. 2005, 120, 74–92. [Google Scholar] [CrossRef]
- Chen, C.-C.; Tyler, C.W. Symmetry: Modeling the effects of masking noise, axial cueing and salience. PLoS One 2010, 5, e9840. [Google Scholar] [CrossRef]
- Wagemans, J. Skewed symmetry: A nonaccidental property used to perceive visual forms. J. Exp. Psychol. Hum. Percep. Perform. 1993, 19, 364–380. [Google Scholar] [CrossRef]
- Csathó, Á.; van der Vloed, G.; van der Helm, P.A. The force of symmetry revisited: Symmetry-to-noise ratios regulate (a)symmetry effects. Acta Psychol. 2004, 117, 233–250. [Google Scholar] [CrossRef]
- Morales, D.; Pashler, H. No role for colour in symmetry perception. Nature 1999, 399, 115–116. [Google Scholar] [CrossRef] [PubMed]
- Ninio, J. Alternative to the steady-state method: Derivation of reaction rates from first passage times and pathway probabilities. Proc. Nat. Acad. Sci. USA 1987, 84, 663–667. [Google Scholar] [CrossRef] [PubMed]
- Wenderoth, P. Monocular symmetry is neither necessary nor sufficient for the dichoptic perception of bilateral symmetry. Vis. Res. 2000, 40, 2097–2100. [Google Scholar] [CrossRef]
- Nimi, R.; Watanabe, K.; Yokosawa, K. The role of visible persistence for perception of visual bilateral symmetry. Jpn. Psychol. Res. 2005, 47, 262–270. [Google Scholar] [CrossRef]
- van der Vloed, G.; Csathó, Á.; van der Helm, P.A. Effects of asynchrony on symmetry perception. Psychol. Res. 2007, 71, 170–177. [Google Scholar] [CrossRef]
- Donders, F.C. La vitesse des actes psychiques. Archives Néerlandaises 1868, 3, 269–317, (Published simultaneously in Dutch and German). English translation by Koster, W.G. On the speed of mental processes. Acta Psychol. 1969, 30, 412–431. [Google Scholar]
- Sternberg, S. High speed scanning in human memory. Science 1966, 153, 652–654. [Google Scholar] [CrossRef]
- Shepard, R.N.; Metzler, J. Mental rotation of three-dimensional objects. Science 1971, 171, 701–703. [Google Scholar] [CrossRef] [PubMed]
- Luce, R.D. Response Times: Their Role in Inferring Mental Organization; Oxford University Press: New York, NY, USA, 1986. [Google Scholar]
- Hohle, R. Inferred components of reaction times as funtions of foreperiod duration. J. Exp. Psychol. 1965, 69, 382–386. [Google Scholar] [CrossRef] [PubMed]
- McGill, W.J. Stochastic Latency Mechanisms. In Handbook of Mathematical Psychology Vol 1; Luce, R.D., Bush, R.R., Galanter, E., Eds.; Wiley: New York, NY, USA, 1963; pp. 309–360. [Google Scholar]
- Ulrich, R.; Miller, J. Information processing models generating lognormally distributed reaction times. J. Math. Psychol. 1993, 37, 513–525. [Google Scholar] [CrossRef]
- Limpert, E.; Stahel, W.A.; Abt, M. Lognormal distributions accross the sciences: Keys and clues. Bioscience 2001, 51, 341–352. [Google Scholar] [CrossRef]
- McGill, W.J.; Gibbon, W.J. The general gamma distribution and reaction times. J. Math. Psychol. 1965, 2, 1–18. [Google Scholar] [CrossRef]
- Gleser, L.J. The gamma distribution as a mixture of exponential distributions. Am. Stat. 1989, 43, 115–117. [Google Scholar]
- Colonius, H. The instance theory of automaticity: Why the Weibull? Psychol. Rev. 1995, 102, 744–750. [Google Scholar] [CrossRef]
- Logan, G.D. The Weibull distribution, the power law, and the instance theory of automaticity. Psychol. Rev. 1995, 102, 751–756. [Google Scholar] [CrossRef]
- Cousineau, D.; Larochelle, S. PASTIS: A program for curve and distribution analyses. Behav. Res. Methods 1997, 29, 542–548. [Google Scholar] [CrossRef]
- van Zandt, T.; Ratcliff, R. Statistical mimicking of reaction time data: single-process models, parameter variability, and mixtures. Psychono. Bull. Rev. 1995, 2, 20–54. [Google Scholar] [CrossRef]
- Johnson, K.A. Advances in transient-state kinetics. Curr. Opin. Biotechnol. 1998, 9, 1987–1989. [Google Scholar] [CrossRef]
- Schmid, R.; Sapunov, V.N. Non-formal kinetics. In search for chemical reaction pathways; Verlag Chemie: Weinheim, Germany, 1982. [Google Scholar]
- Geggier, P.; Dave, R.; Feldman, M.B.; Terry, D.S.; Altman, R.B.; Munro, J.B.; Blanchard, S.C. Conformational sampling of aminoacyl-tRNA during selection on the bacterial ribosome. J. Mol. Biol. 2010, 399, 576–595. [Google Scholar] [CrossRef] [PubMed]
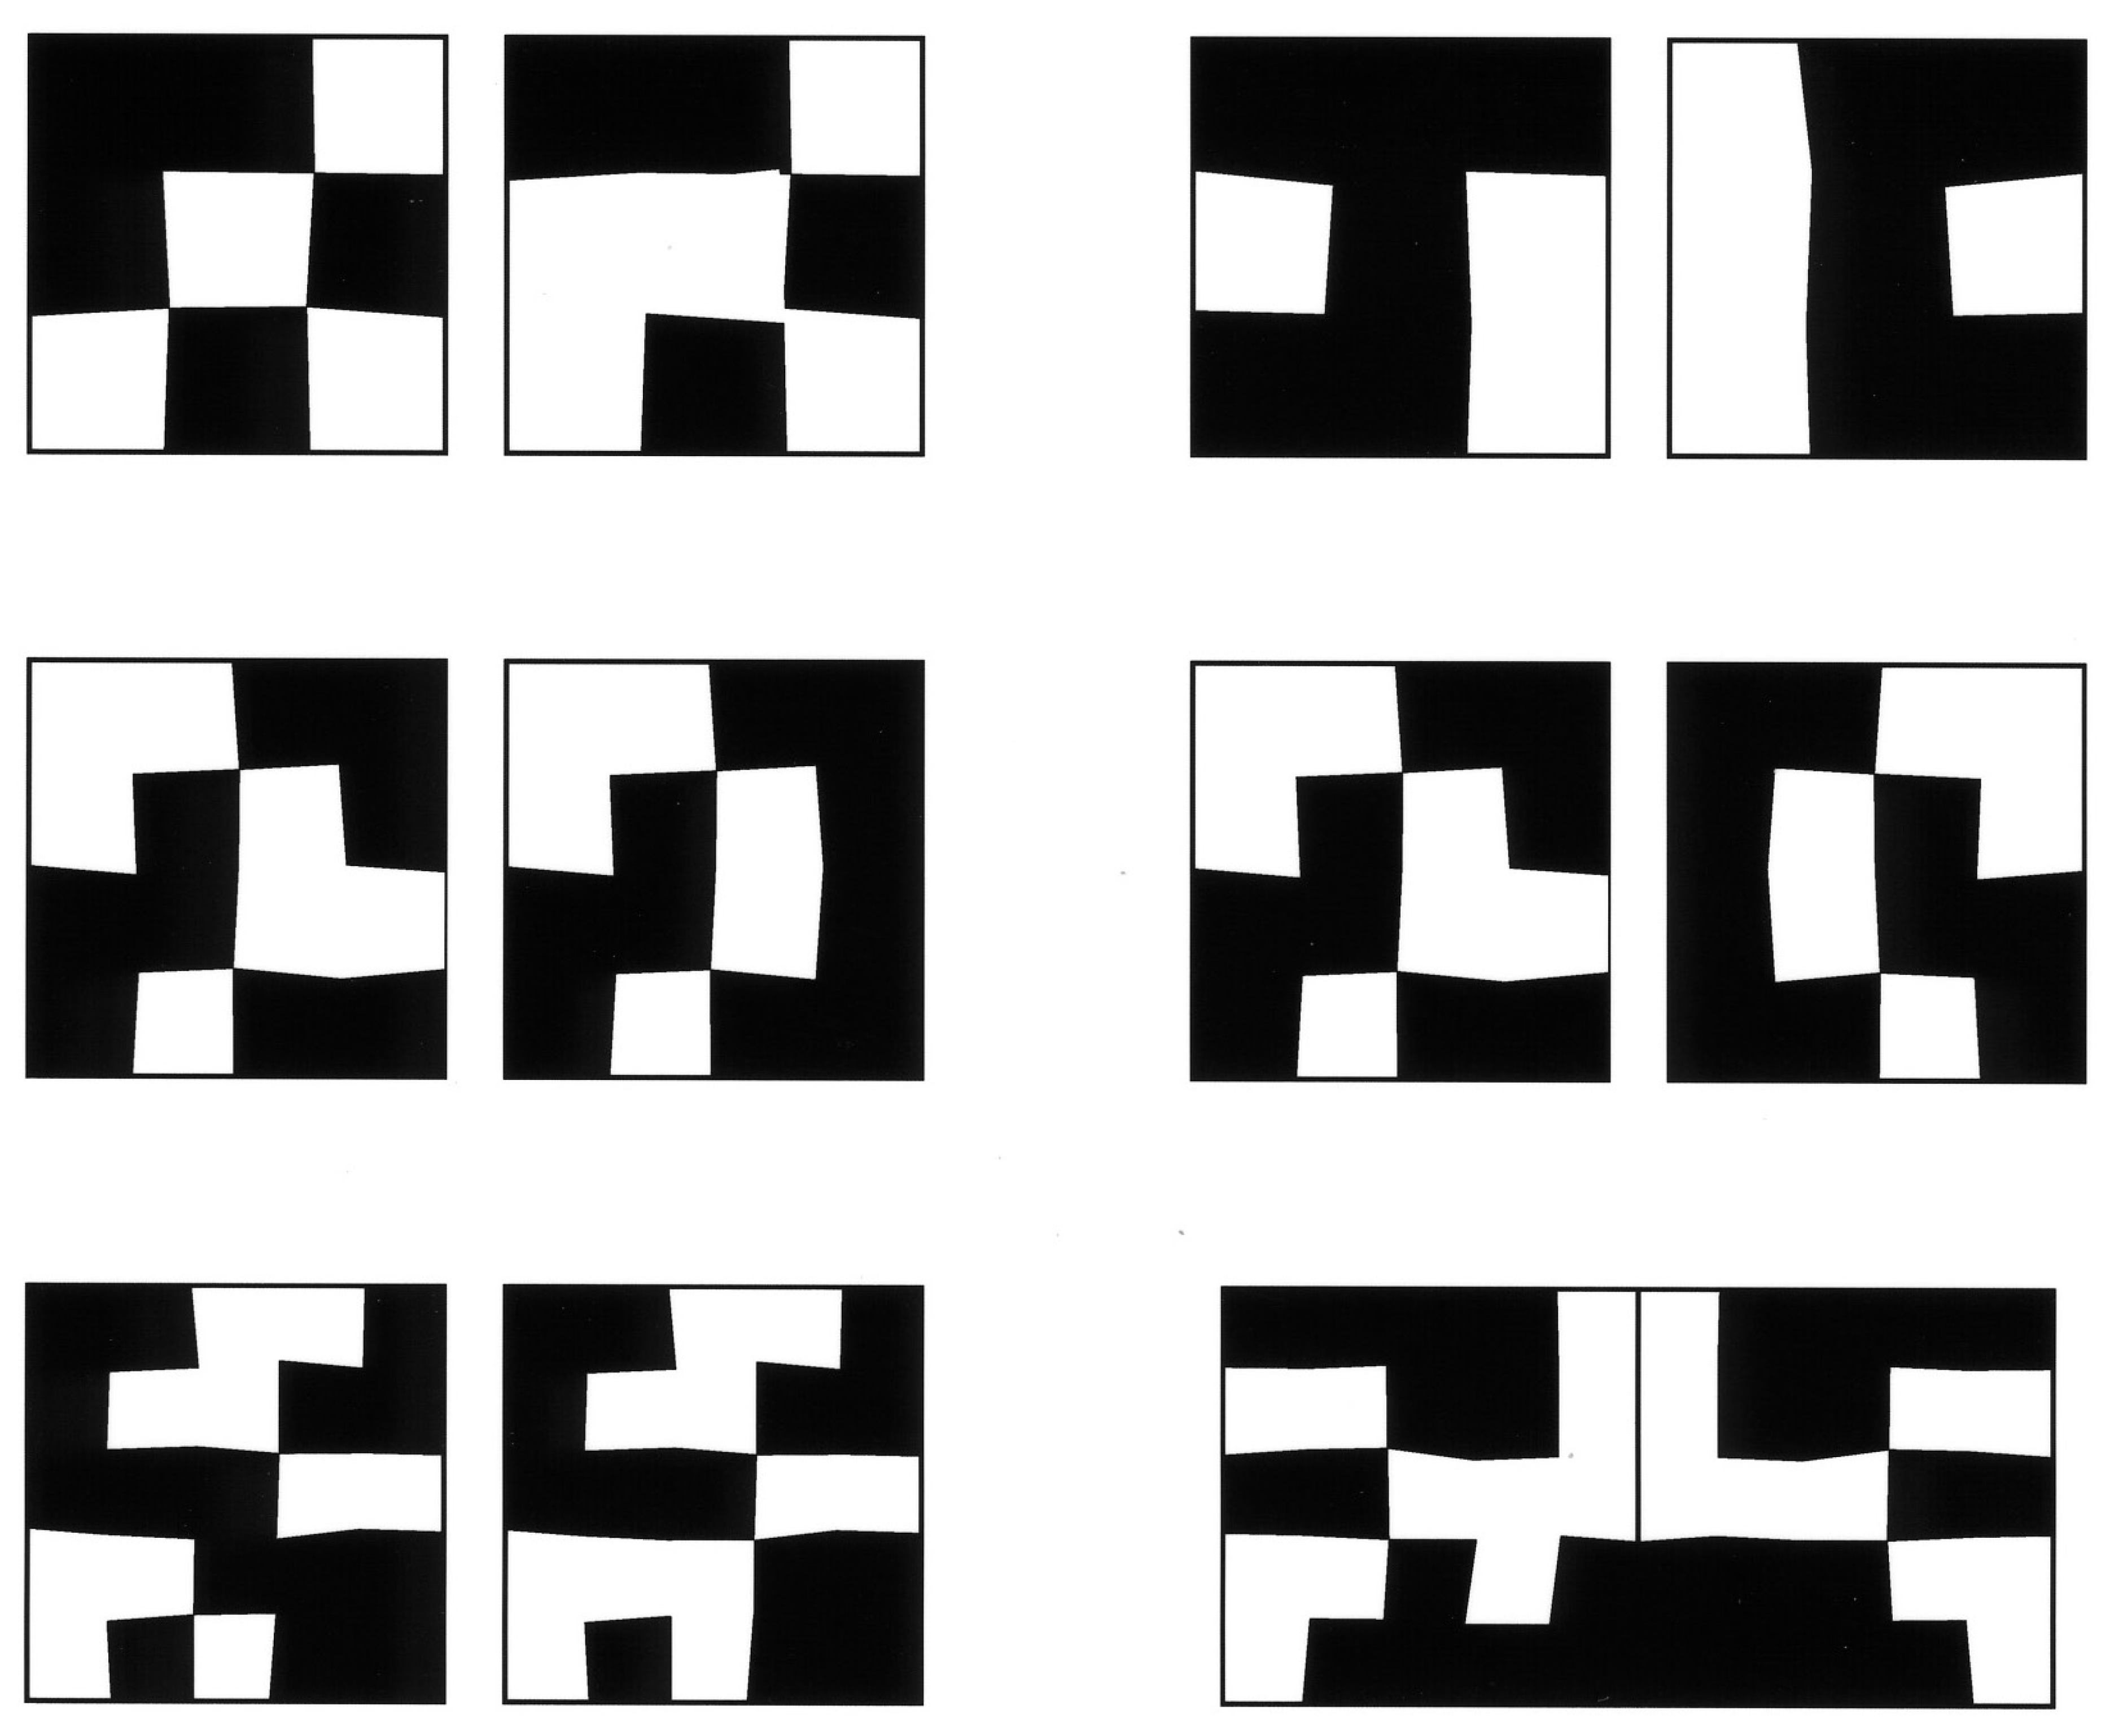
Figure 1.
Random square lattice patterns used in the short term memory experiments. The images are constructed by slightly distorting a square lattice pattern of 3 × 3 cells (top row), 4 × 4 cells (middle row) or 5 × 5 cells (bottom row). For simplicity, it will be assumed that the complexity of such images, in bit numbers, is equal to the number of cells. In each pair of images, there is a single mismatch in the black or white value of a quadrangle, between the left and the right images. The images are assembled two by two in the repeated mode (left column) or the symmetric mode (right column). In this case, two conditions were studied: images separated as in the repetition condition (top and middle pair, right column), and images juxtaposed at their symmetry axis. The images were presented on a monitor screen and each image subtended a visual angle of about 7 degrees for a subject having his/her eyes at about 60 cms from the screen.
Figure 2.
Reaction times for comparing images side by side. The upper left panel reproduces the results in [21]. Typical stimuli are shown in the left side of Figure 1. As the images to be compared grow in complexity, the “same” responses become appreciably larger than the “different” responses. The split occurs around 12 bits. The position of the split is taken as a measure of the amount of information captured by the brain in a single glance and maintained in short-term memory as the eyes jump from one image to the other. In a subsequent work, reported in a congress abstract [24] 18 subjects performed comparisons on black and white or colored patterns, or arrays of letters. In the top right panel, the black and white results are represented with filled or unfilled circles, and the four colors results are represented with filled or unfilled squares.11,000 reaction times (RTs) were determined in the black and white experiments, 12,000 RTs were determined the 4-color experiments, and 33,000 RTs were determined in the letter comparison experiments. In this case there were three series of tests, with overlapping complexity ranges.

Figure 3.
Time to detect a repetition or a symmetry violation as a function of the column position in the matrix patterns and the size of the images. The columns are numbered from left to right in the repetition experiments, and from the symmetry axis outwards in the symmetry experiments. Square symbols: 3 × 3 images; disks: 4 × 4 images; diamonds: 5 × 5 images. There were 18 subjects in the repetition experiments, and a total of 5,800 reaction times were recorded (same data as in the top right panel of Figure 2). There were 12 subjects in the symmetry experiments, and a total of 20,300 reaction times were recorded. The reaction times were averaged over the ’separate images’ and the ’no separation’ conditions.
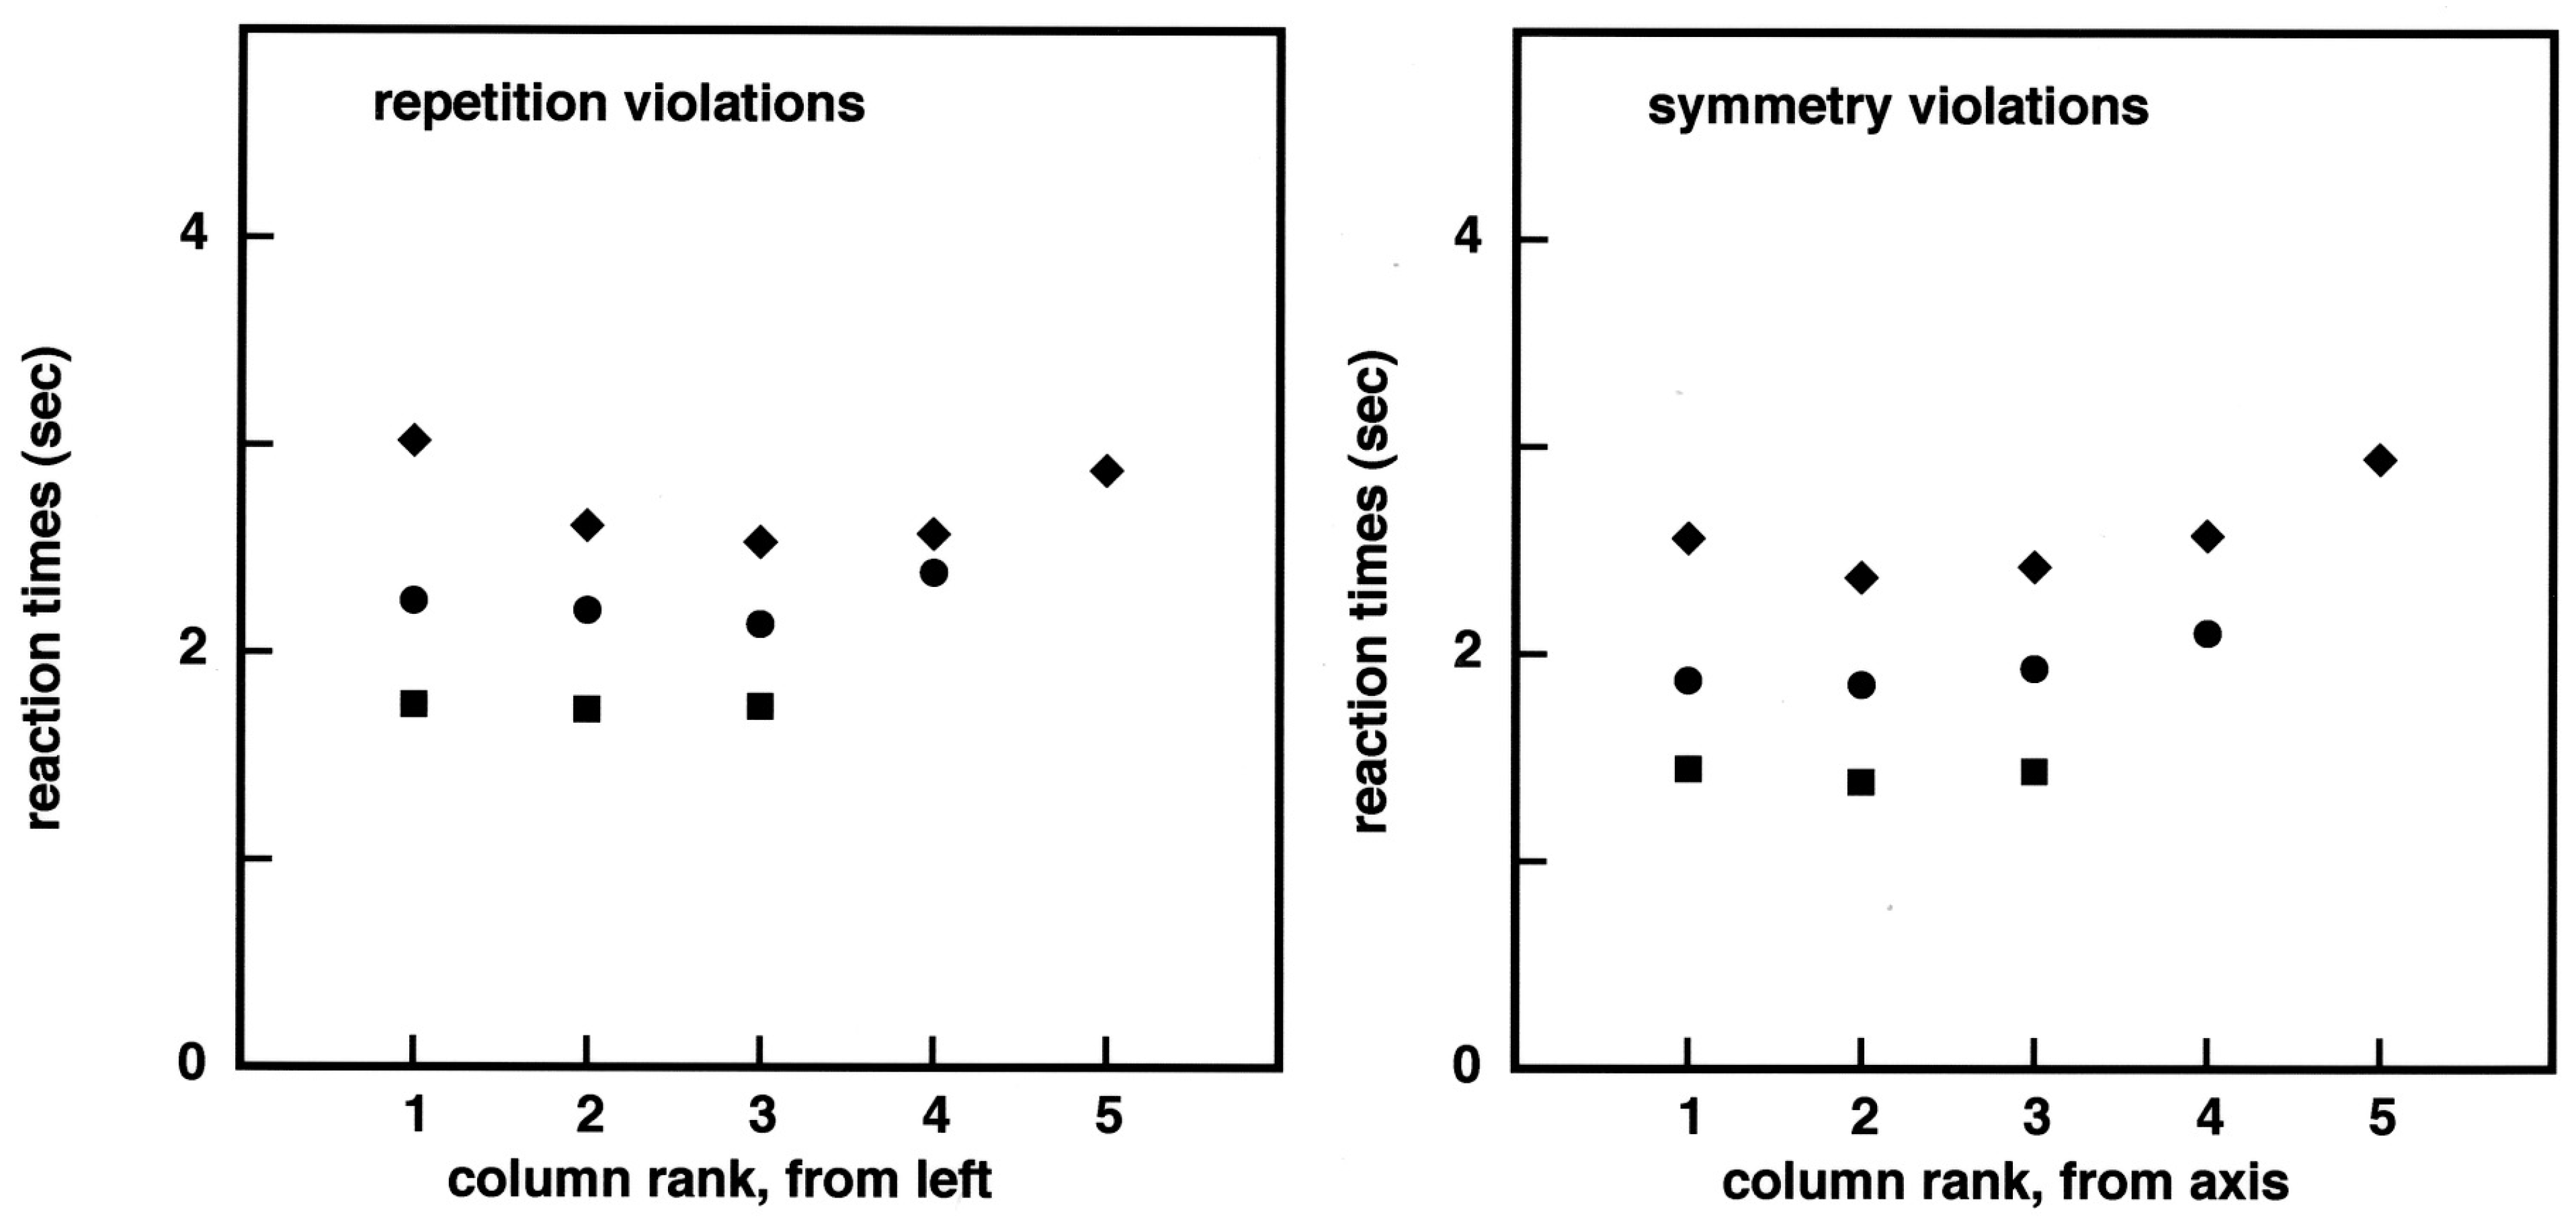
Figure 4.
Reaction time distributions. The experiments were performed by the author, under the repetition (16,000 RTs collected), the ‘symmetry without separation’ conditions (13,000 RTs collected) and the ‘symmetry with separation’ condition (11,000 RTs collected). The areas shaded in grey represent the histograms for the reaction times distributions, taking a 50 ms bin width. The black areas represent the RT distributions for the erroneous responses. The curves represent a fit with a kinetic model involving a lag, two elementary kinetic steps, and a convolution with a gaussian. The fitting parameters are shown in Table 1. * The high quality figure can be found in supplementary.
Figure 5.
Colored strips, with hue variations. All strips except the bottom pair on the right contain the same patterns, represented with different colors. The colors are differentiated along a red-green axis in the top left pair, along the cyan-magenta axis in the top right pair, and along the red-blue axis in the bottom left pair. Strips forming a pair are shown assembled in a triptych with two local axes of symmetry in Figure 6. The pair of strips at the bottom right use the same colors as the pair in the top left. They have the peculiarity that the colors are matched exactly on the left and right borders. They are shown assembled in triptychs in Figure 7. * The high quality figure can be found in supplementary.
Figure 6.
Color equalization effect. Each of the three figures was constructed from a pair of strips from Figure 5, one of the two being used in its mirror-image form. Tryptichs were constructed by putting one strip in the centre, and two copies of the other strip on the left and right sides, thus creating two vertical symmetry axes. Color differences across the symmetry axes may be less salient than in the separate strip presentations of Figure 5. * The high quality figure can be found in supplementary.
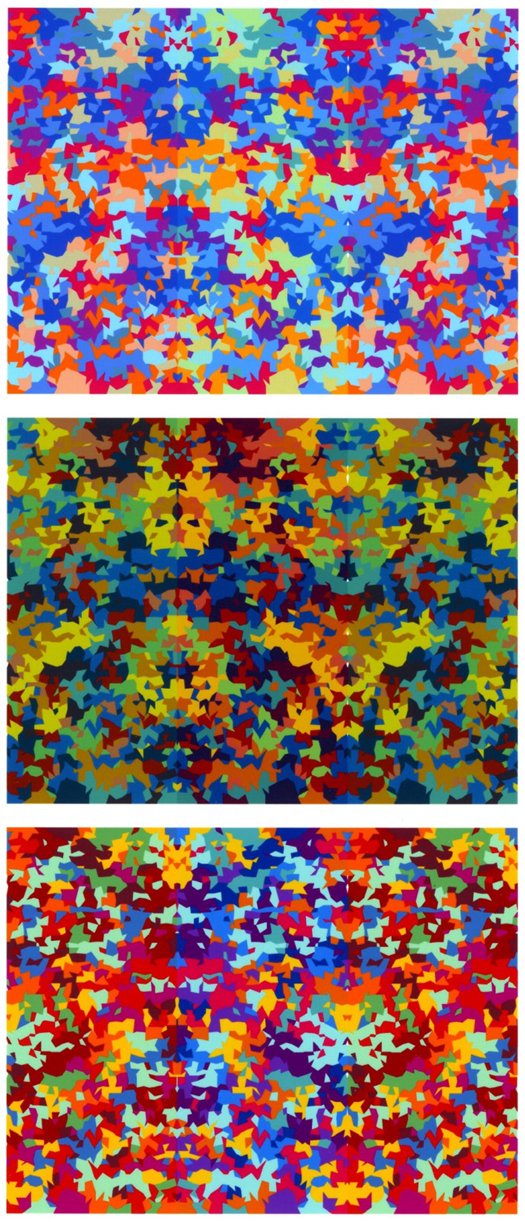
Figure 7.
Symmetry versus repetition in color equalization. Tryptichs were constructed using the bottom right strips of Figure 5. They are assembled by symmetry in the top figure, as in Figure 6, and by repetition in the bottom figure. * The high quality figure can be found in supplementary. * The high quality figure can be found in supplementary.

Table 1.
The nine reaction time distributions shown in Figure 4 are modeled with a kinetic scheme involving two successive elementary kinetic steps with constant rates per unit time k1 and k2, expressed in events per second. A lag, expressed in seconds, is introduced in the model in order to account for the fact that the distributions do not start at time 0, but after a ‘dead time’. A gaussian widening of variance sigma square, sigma being expressed in seconds, is then applied to the RT distribution shifted by the lag. The ‘infinite’ value assigned to k2 in the 3 × 3 symmetry experiments is a way of expressing the fact that a single step with kinetic parameter k1 was needed to model the data. The reaction time distribution for 5 × 5 comparisons in the repetition case seems to be bimodal, (possibly due, in part to the divergence between RTs for ‘same’ and ‘different’ responses). Curve fitting was performed using an interactive computer graphics program written by the author in C++ and OpenGL.
| Kinetic Modeling of the Reaction Times Distributions | ||||||
|---|---|---|---|---|---|---|
| Repetition | Symmetry (without/with) separation | |||||
| 3 × 3 | 4 × 4 | 5 × 5 | 3 × 3 | 4 × 4 | 5 × 5 | |
| Lag (s) | 0.82 | 0.87 | 1.00 | 0.82/0.82 | 0.82/0.83 | 0.86/0.90 |
| Sigma (s) | 0.04 | 0.06 | 0.07 | 0.04/0.04 | 0.04/0.045 | 0.045/0.05 |
| k1 (1/s) | 4.3 | 2.8 | 2.6 | 7.7/6.0 | 4.7/3.3 | 2.4/2.1 |
| k2 (1/s) | 18.7 | 5.3 | 3.1 | (inf) / (inf) | 20.2/21.2 | 22.9/16.4 |
© 2011 by the author; licensee MDPI, Basel, Switzerland. This article is an open access article distributed under the terms and conditions of the Creative Commons Attribution license (http://creativecommons.org/licenses/by/3.0/).
Share and Cite
MDPI and ACS Style
Ninio, J. Folded Sheet Versus Transparent Sheet Models for Human Symmetry Judgments. Symmetry 2011, 3, 503-523. https://doi.org/10.3390/sym3030503
AMA Style
Ninio J. Folded Sheet Versus Transparent Sheet Models for Human Symmetry Judgments. Symmetry. 2011; 3(3):503-523. https://doi.org/10.3390/sym3030503
Chicago/Turabian StyleNinio, Jacques. 2011. "Folded Sheet Versus Transparent Sheet Models for Human Symmetry Judgments" Symmetry 3, no. 3: 503-523. https://doi.org/10.3390/sym3030503