
Wind Turbines Fault Classification Treatment Method

1
School of Aviation and Automobile, Chongqing Youth Vocational & Technical College, Chongqing 400030, China
2
School of IIntelligent Engineering, Chongqing City Management College, Chongqing 401122, China
*
Author to whom correspondence should be addressed.
Symmetry 2022, 14(4), 688; https://doi.org/10.3390/sym14040688
Submission received: 25 February 2022
/
Revised: 23 March 2022
/
Accepted: 23 March 2022
/
Published: 26 March 2022
(This article belongs to the Special Issue Symmetry in Safety and Disaster Prevention Engineering)
Abstract
:With the aim of solving the problems arising from the low efficiency and low accuracy of fault classification of wind power towers and turbine equipment (referred to as wind power systems for short) using artificial data analysis, this paper takes the operational data for wind power systems as the research object and proposes an improved K-means weighted dynamic clustering fault classification algorithm (DT clustering). First, historical and asymmetrical operational data from wind power systems were pre-processed to construct the data time series matrix and establish the fault classification model; second, the linear approximate constrained optimization algorithm and multiple regression algorithm were combined to build the model parameter optimization model. Finally, the comparative analysis of various algorithms showed the superiority of this algorithm, and the effectiveness of this model should be proved in practical applications.
1. Introduction
With the increasing installation capacity of wind power in China, the expansion of wind power coverage area and the deepening understanding of wind power technology has gained momentum in China. Wind power is promoted as a long-term strategy in China to respond to environmental pollution and energy shortages. Wind power generation in China has shown continuous growth since 2010. However, only 2.6% of energy requirements are met by wind power in China. Several socio-technical barriers, including technology, culture, governance, and infrastructure, have been identified in a Chinese context [1]. Safety is reported as the second most important issue that likely causes severe damage to the stability of wind power grids. Voltage stability deteriorates through the continuous operation of wind turbines [2]. Therefore, the Chinese wind power industry has implemented higher requirements for the safety and operational stability of wind power foundations, towers, and units. Based on the existing “Germanischer Lloyd” (GL) design specification, combined with the fault classification mechanism of wind power manufacturers, and through the deep mining of relevant system fault data, it is inevitable that the wind power industry should quickly identify key faults and common faults that affect safety and operational performance; this is also one of the issues of greatest concern for wind power manufacturers [3]. Serious safety threats to wind power have arisen from imperfect supervision and management issues [4].
Extensive research on the structural safety and health detection of equipment has been carried out at home and abroad [5,6,7], especially wind power towers and wind turbines. Yuan Wan [8] applied finite element stress analysis to analyze the mechanical interaction between wind power foundations, towers, and units from the perspective of structural design. They used forward structural optimization measures and system safety evaluation methods. The mechanical properties of steel towers, reinforced concrete towers, and hybrid towers with concrete at the bottom have been studied in depth [9], and asymmetric structural designs have been put forward according to their local instability principles [10] and weak link failure mechanism [11]. At the same time, various data mining algorithms based on data-driven philosophy and data analysis are also widely used in the field of wind turbine fault identification and diagnosis [12]. Among them, as a classical clustering algorithm, the K-means algorithm is often combined with other algorithms for wind power system fault identification [3,13] and wind field equivalent model construction [14]. However, current research and applications are mainly focused on the structural design analysis of wind turbine towers [15], failure mode mechanism analysis and fault identification [16], and state prediction of wind turbine generators [17]. Little attention has been given to the common faults and key faults that affect the safety and operational performance of wind turbine foundations, towers, and generator sets. Particularly, the key fault data analysis has a significant impact on the safety of wind turbine generator sets and towers, such as collapse fault. A list of 10 typical wind power faults has been identified in [18]. The main causes of faults are also summarized in the same research work.
However, studies based on K-means clustering only consider the optimization of clustering center and K value selection [19], ignoring the optimization and dynamic allocation of attribute weighting parameters. Therefore, based on the existing four-level fault processing system of enterprises, this paper combines the linear approximate constraint optimization strategy with the nonlinear regression theory, establishes a dynamic weighted K-means fault clustering classification model based on the weight parameter optimization algorithm, and realizes automatic fault classification processing based on fault time distribution, so as to quickly identify the common faults and key faults of a wind power base, tower, and unit.
The remainder of the paper is structured as follows: Section 2 is focused on the dynamic weight K-means clustering method, its principles, weighting parameters, and their calculation, and the constraint approximation of algorithm. Then, we provide the wind turbine fault classification model in Section 3. Section 4 presents the application of the weighted K-means algorithm in the wind turbine fault data. In Section 5, we analyze the results and discuss them in the context of fault classification. Section 6 concludes the proposed research and its applications.
2. Related Work
Yang et al. [20] used the K-means algorithm and enhanced the performance of proposed research from a better initializing technique. The weighting distance method was applied to measure the data density. Defects in poor clustering in traditional K-means performance were found. However, the proposed research improved the performance of the K-means algorithm by reducing the intra-cluster variance. Although the simpler K-means algorithm best suits general tasks and shows limitations on applying to complex datasets. In this context, the fuzzy C-means algorithm has shown better performance than simple K-means for handling ambiguity between clusters by using the probabilistic membership matrix [21].
To effectively cluster large scale datasets, the K-means algorithm has been an effective model for many years. However, K-means is not effective to distinguish the discriminative feature capabilities in a clustering process. A research group led by Huang et al. [22] proposed the extended K-means by using l2-norm regularization to weight features. A new objective function was proposed for the clustering framework. Centroid rules, membership matrix, and weight features were derived theoretically. An extended K-means algorithm is better in performance compared with other variants of the K-means algorithm in terms of accuracy, F-score, random index, and normal mutual information (NMI) as performance metrics.
Power generation from wind towers is widely promoted by the Taiwan provincial government. Taiwan’s geographic location favors wind power generation. However, torrential rains and strong winds have posed severe risks to wind turbines, and sometimes collapse of wind towers occurs due to frequent and intensive typhoons. Both domestic and internal collapse of wind towers have been investigated by analyzing the activation mechanism of the collapse of towers [23]. Recent research proposed a hybrid fault detection approach to detect the incipient blade failures and improve the availability and maintenance cost of systems. Data from a wind farm in Canada were used to evaluate the proposed approach. The performance accuracy of the proposed approach is better than that of existing approaches [24]. Before this research, Lin et al. [25] deduced four reasons behind the failure of wind turbine towers in China: The lack of core technology, cost-competitiveness, climate differences, and design standards were the main reported failure causes.
To ensure privacy protection, KNN classification is widely applied to classify negative databases. Zhao et al. [26] proposed applying the KNN classifier to reduce non-negligible performance degradation and enable the fine-grained control of accuracy in distance estimation. Moreover, the proposed approach designed the estimation of cluster centers using the K-means algorithm. Regarding wind turbine failure analysis, a recent study [27] proposed the analytical hierarchy process (AHP) as a weighting technique to identify and analyze failure scenarios to reduce failure impacts. The recent methods show limitations of classifying the identified wind turbines.
The existing literature provides important insights into the K-means algorithms and their applications in clustering data from various domains. However, low attention is paid to applying the weighted K-means to wind turbine data. Moreover, fault classification in wind turbines is not discussed in the existing literature regarding the K-means algorithm.
Wind turbine “Supervisory Control and Data Acquisition” (SCADA) alarms frequently occur in large-sized wind farms. It is overwhelming for maintainers or operators to maintain the wind farms. This study proposed to prioritize alarms based on their data volume and seriousness. Moreover, a converter system and pitch with known faults were also investigated in this study. Conditions of alarm data generation provided a convenient means of fault detection, diagnosis, and prognosis. However, the proposed system may be integrated with an intelligent system to improve availability and reliability, and to reduce downtime of wind turbines [28].
SCADA alarm data have been used for fault diagnosis in wind turbines. The Dempster–Shafer (DS) theory showed better results based on the processing of multidimensional information [29]. The later approach is easier to explain, and can be executed with low cost. Prior to this study, component failure in wind turbines was determined from the analysis of SCADA alarm data [30]. The proposed approach offered a valuable prediction of components’ failure before the actual appearance. However, the presented approach had limitations when handling sequential information. Thus, the proposed approach in this paper overcomes the limitation by applying the machine learning technique. Before our proposed research, a study [31] attempted to analyze the operational conditions of a wind farm by numerical modeling and data mining approaches. A recent work utilizes the SCADA alarm data by using the online root fault identification technique. Both known and unknown faults were used for weighing the alarm weights. Hamming distance and Euclidean distance were measured [32]. The proposed approach helped in labeling the root faults in wind turbines. However, detection accuracy remains a limitation of the earlier studies. Therefore, the proposed research in this paper is aimed at achieving a better accuracy compared with the earlier mentioned works.
3. Dynamic Weighted K-Means Clustering Method
There are several steps in the proposed method of this paper (Figure 1). Each of these steps is discussed subsequently.
3.1. Principle of Weighted K-Means Algorithm
The K-means algorithm provide sensitive clustering results to the initial clustering center point. Therefore, varying the initial center point results in symmetric and asymmetric clustering results. A traditional K-means algorithm does not involve each feature attribute in a given dataset to determine the center points of initial clustering [33]. Thus, it does not entirely reflect the structure of dataset. An improved K-means algorithm can overcome this issue.
The basic idea of the K-means algorithm is to input the number of the cluster [34]. A first selection of K samples is randomly performed from a dataset. If the clustering sample dataset is , and the clustering category is , then the original center of gravity of type is calculated as follows:
where ti is the clustering center of class data i, and Ti is the sample dataset belonging to class i in the sample dataset y.
Therefore, the distance from the sample data clustering center tm of attribute m to the center of gravity of each cluster toj can be calculated, and the sample data are clustered and identified according to f, the minimum distance criterion function. The specific calculation is shown in Equation (2):
3.2. Weight Parameter Calculation of Fault Classification Model Based on K-Means Algorithm
The fault–time series matrix (with the fault trigger times and time distribution as factors) was established according to the fault data from wind turbines in actual operation. In addition, the weighting of each column of data was dynamically allocated when the fault–time series matrix was standardized, to obtain the following formula given in Equation (3):
where denotes the number of non-zero values in the column i of the fault–time series matrix, is the column dimension of the fault–time series matrix, is the coefficient term of the weight parameter, and b is the constant term of the weight parameter.
3.3. Linear Approximate Constraint Approximation Optimization Algorithm
Based on the K-means clustering model, the time–series matrix of the regression model with weight coefficient as a variable factor and clustering classification error rate as an output index is established in this research. Next, the multivariate nonlinear regression equation based on weight coefficients and the classification error rate is constructed. At the same time, the multivariable approximate constraint optimization method is used to solve the optimal equity coefficient and test it with actual data. In this paper, the sequential search algorithm [35], that is, the linear approximate constrained optimization algorithm, is used to realize the optimal calculation of weight parameters. The COBYLA best suits the linear approximation to the objective and constraint functions. If the objective function and the constrained optimization function are and , respectively, the parameter optimization calculation is expressed as follows:
In this paper, the nonlinear regression equation is generated based on the fitting of the sample training set, , which is the non-negative characteristics of the calculation results of the regression equation and the variable range values generated based on the test. At this time, there is a unique linear function and constraint conditions , and the nonlinear objective function and constraint conditions are interpolated at the extreme values, so Equation (4) can be transformed into linear function Equation (5) to solve:
4. Establishment of Wind Turbine Fault Classification Model Based on Multiple Nonlinear Regression
4.1. Establishment of Fault Data–Time Series Attribute Matrix
Based on the operational data of the wind turbine cluster, the original data values of each attribute of the wind turbine fault sample were collected, and then a statistical table of fault attributes was established according to its time distribution series, as shown in Table 1.
4.2. Establishment of Fault Classification Model
In combination with the four-level fault treatment mechanism of wind power enterprises, a four-level classification model corresponding to wind farm faults was established by using K-means theory. The model process and rules [36] are shown in Figure 2.
Where was the weight coefficient of the fault–time series matrix, and was the conditions for termination of the model operation, the fault–time series matrix data are used as an input that is standardized later in the following process. In the next process, initial center of gravity Ck from each sample data is calculated. Based on the calculated initial center of gravity Ck of each sample data, the classification of each type of sample data is performed. The proposed model is well-established to determine the cluster center of gravity of k-level data, and the nth classification in processes 4 and 5, respectively. If the proposed model meets termination conditions, we receive classified fault data of turbines; otherwise, it returns to calculate Tkn at process 4 of the proposed model.
4.3. Optimal Calculation of Weight Parameters of Fault Classification Model Based on K-Means Algorithm
By using the fault statistics of wind turbines in the actual operation, the fault–time series matrix was established with fault attributes as the rows and distribution time as the columns. Besides, Equation (3) was used to calculate the dynamic weight distribution of each column of data upon standardizing the data of the fault–time series matrix.
The change in weight coefficient of the K-means clustering model significantly affects the clustering error. Therefore, according to the fault data and time distribution of wind turbines in actual operation, this paper constructed a regression model with the weight coefficient of K-means clustering model as the variable factor and clustering classification error rate c as the output index. In addition, the model weight coefficients were calculated by using a linear approximate constrained optimization algorithm. This algorithm employs a linear approximation to constraint and objective functions.
Based on the statistical data of wind turbine faults, the fault–time series matrix was constructed and the data were standardized. At the same time, a sample dataset based on weighted parameters and fault classification errors was constructed. In combination with the goodness-of-fit of the equation, significance of regression equation, and significance test of variable coefficient, Matlab was used to implement the optimal regression equation based on the sample dataset. Goodness-of-fit was used to test the overall model adequacy. Poor classification of turbine data was the primary concern that motivated us to imply the goodness-of-fit in this paper.
4.4. Optimization of Weight Coefficient of Wind Farm Fault Classification Model
In terms of the combined nonlinear regression model constructed for the weight coefficients of the classification model, its weight parameter optimization algorithm was implemented by using the “constrained optimization by linear approximation” (COBYLA) algorithm [35]. First, the data were collected and standardized, and the K-means model was used to construct the sample dataset of weight parameters-classification error. Then, a multivariate nonlinear regression model was completed through the sample dataset; finally, the COBYLA algorithm was used to solve the optimal weight coefficient, and the optimal dynamic weight value of each column was obtained. The calculation process flow is shown in Figure 3:
4.5. Performance Evaluation Indicator
In this paper, an accuracy (Acc.) indicator is employed to assess the validity of cluster results. The accuracy metric is a widely used performance indicator in cluster issues and it determines the ratio of correctly classified clusters and number of total clusters, as expressed in Equation (6).
5. Application of Weighted K-Means Algorithm in the Wind Turbine Fault Data
5.1. Current Fault Classification Treatment Mode of Wind Power Companies
Currently, wind power enterprises classify the faults based on manual statistical analysis, and the fault data are artificially classified and matched to the corresponding processing departments. This processing mode has high requirements for the professional ability and business ability of the graders. The existing fault classification and corresponding processing departments are listed in Table 2.
5.2. Establishment of Wind Farm Fault Classification Model
Based on above theories and methods, the application steps of the wind farm fault classification model are as follows:
① Establish an asymmetric sample data training set;
② Establish a frequency data–time series matrix;
③ Establish a fault classification model according to the K-means classification theory [37] and the reality;
④ Establish a dynamic weight optimization model based on linear approximate constraint optimization algorithm and multiple nonlinear regression K-means model;
⑤ Establish a K-means fault classification model based on dynamic weight optimization;
⑥ Classify the real-time fault data.
By incorporating newly added fault data into the fault sample data, we can accumulate the sample data for the next evaluation update of the optimal weight coefficient. The application and process of wind farm fault classification model in wind power industry are shown in Figure 4:
5.3. Example Verification and Result Analysis
5.3.1. Subsubsection
A fault frequency–time series matrix was established by taking the operation history and asymmetric fault data statistics of 125 sets of 2 MW units of a company in October 2015 as a model sample dataset. After processing the redundant data, data sequencing processing and standardization, 222 fault categories were collected and 6815 faults occurred in this month. The specific situations regarding fault category, date, fault number, and number of days triggered were shown in Table 3:
5.3.2. Weighted Value Sample Training Set and Weighted Parameter Optimization Algorithm
The statistical data of 222 non-symmetric faults in 5 wind farms of the company in October 2015 were taken as the training data and testing data. The business experts graded each fault based on the fault severity, fault occurrence days, and fault trigger times. Then, the fault classification model was established by following the K-means modeling process. Next, the weights a and b were randomly assigned at [0,2] and [0,3], respectively, to calculate the fault classification error as shown in Table 4. Finally, the sample data training set of a, b, and the classification error rate were established.
MATLAB was used to fit the quadratic, cubic, and quartic surfaces of the sample dataset, and the test of the fitted surface data is shown in Table 5:
According to Table 5, the R-square = 0.9709 of quartic surface fitting is larger than that of the other two fitting curves. Therefore, quartic surface fitting was selected to construct the regression function of A, B, and the grading error rate C, and the surface fitting equation was as follows:
According to the linear regression theory and confidence interval (CI) test (95%), the regression equation is as follows:
Based on Equation (8), COBYLA was applied to solve the optimal value of the equation, and the optimal weight parameter was obtained as (0.486, 0.669). For Equation (9), the optimal dynamic weight parameter of the K-means model was obtained as follows:
5.4. Comparative Analysis of Algorithms
In this paper, data on historical fault statistics from a company were used to establish the classic K-means clustering algorithm, the neural network clustering algorithm with multi-layer perceptron, parameter optimization, and the K-means algorithm model based on dynamic weight assignment. Seventy percent of the total data was extracted as training data, and the remaining thirty percent was used as testing data. In addition, both the classical K-means clustering algorithm and the neural network clustering algorithm with multi-layer perceptron used the standard algorithm implemented in IBM SPSS. Based on the weight of the improved K-means classification algorithm, Equation (9) was adopted for dynamic parameter assignment. The statistical results about the accuracy of the proposed algorithm and its comparison with the other three algorithms are shown in the following table.
Table 6 summarizes not only accuracy comparison results from the proposed research, but also shows us total sample counts and misclassified samples. As shown in Table 6, in the case of testing the same sample data, the K-means clustering algorithm based on the weight parameter dynamic optimization has the best accuracy, of up to 98.59%, followed by the neural network algorithm based on a multilayer perceptron, with an accuracy of 90.14%. The standard K-means algorithm had the lowest classification accuracy, of 87.32%. Moreover, the K-means algorithm based on weight parameter optimization misclassified only one sample, followed by the neural network algorithm that classified seven samples. The classical K-means algorithm misclassified nine samples. The overall accuracy results improved in the case of least misclassification of sample data. This occurred when only one sample was misclassified by the proposed K-means algorithm. As the number of misclassified samples increased, the accuracy decreased in the cases of the neural network and the classical K-means algorithms.
5.5. Fault Classification Calculation and Result Analysis Based on Actual Data
Using the above model, the wind power system data for a wind power company in Gaozhou Wind Farm, Guangdong Province, in March 2019 were identified and classified. In that month, 29 fault categories were collected, and 24 units had 2028 faults. The analysis of the fault data is presented in Figure 5.
Among those faults, the vibration overrun fault is listed as the fourth-level fault in the model, which needs to be handled by the research institute. According to the statistical data for wind field faults, it is found that this fault occurred 447 times in the mentioned time, of which there were 193 occurrences in Unit 10. According to the 254 vibration overrun faults triggered by batch units, through the analysis of its operational data, it was found that this fault always occurred in the low wind speed areas where wind turbines did not generate electricity. The vibration overrun faults have been considered of the severe category of the problem [38]. The analysis of the acceleration spectrum of other unit system data shows that the resonance frequency is 0.4167 Hz, which is consistent with the previous study by Huang [39] where the measured frequency and amplitude were 0.5502 Hz and 0.09141 m/s2, respectively. These findings were consistent and symmetrical with the natural frequency of the tower and the blade passing frequency (3 P). As a result, the forced oscillation causes the tower to resonate and then triggers the rotating speed to excite the tower vibration fault, as shown in Figure 6. Finally, the wind power company optimizes the control strategy of the small wind speed stages of wind turbines to solve the faults of batch wind turbines.
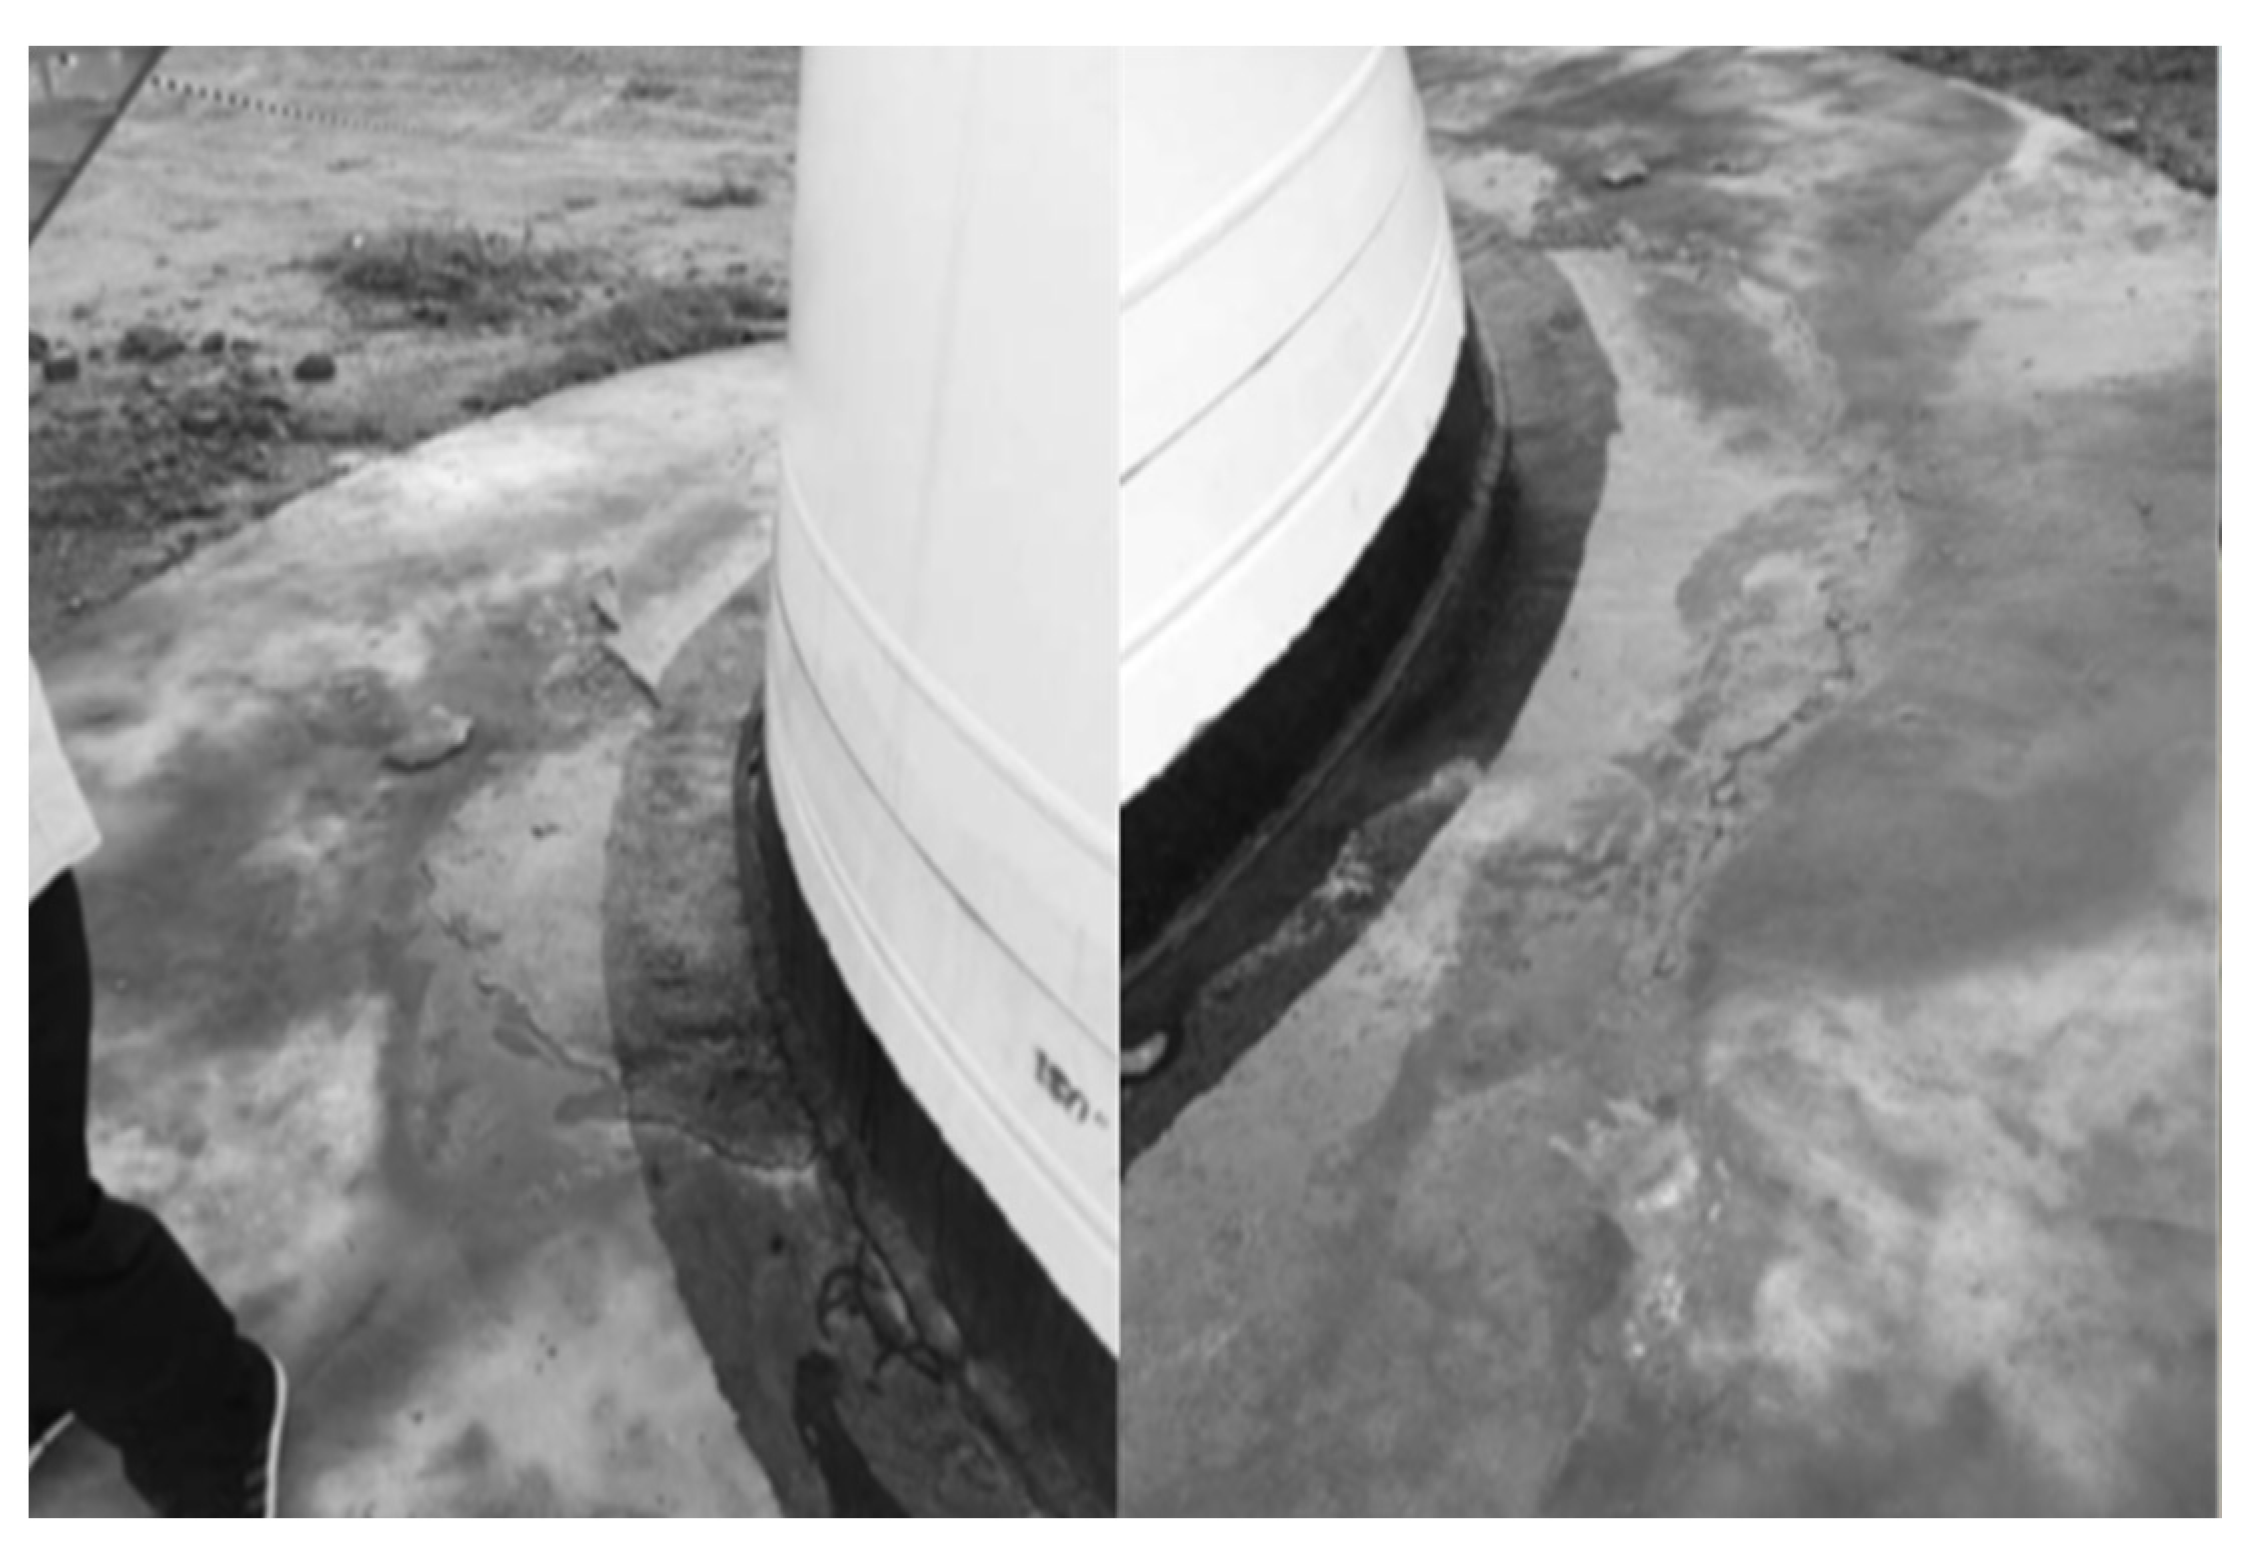
The data for unit 10 were analyzed carefully, and it was found that besides the vibration fault of the tower drum excited by the rotating speed, there was also the fault of the tower verticality inclination exceeding the limit. Through the ground patrol inspection and the confirmation of the ground-penetrating radar (GPR) system, it was found that the rate of change of the tower inclination to the northwest reached −0.0118, which exceeded the relevant national regulations and was less than 0.005 as it can be seen in Figure 7. This is because of the interaction between the rotating speed-driven tower vibration overrun fault and tower inclination, which further increases the risk of wind turbine collapse. Therefore, control strategy optimization and tower bolt curing measures are adopted to solve the fault.
To sum up, the fault classification results of the K-means fault classification model based on the assignment of dynamic distribution weight parameters can truly reflect the actual state of fault triggering in the field operation of wind power systems and the urgency of fault handling. This fault classification approach provides data and support for wind power companies to quickly find the characteristic data of faults that affect the safety of wind power system. It also realizes rapid fault handling and product optimization, especially when the tower tilting vibration exceeds the limit fault interaction.
In comparison with the proposed data mining approach [40], our proposed research has a higher classification accuracy, of 98.59% compared with that of 82.9% in the former approach. The main strength of our proposed approach was the use of a complete dataset of wind turbine faults to evaluate the proposed research. Performance results of the SCADA alarm analysis-based approach [32] were lower compared with this paper. The earlier proposed approach showed a maximum accuracy score of 90.7%, which is below the performance of approach proposed in this paper. These comparison results show the strength of K-means weighted dynamic clustering fault classification approach.
The main disadvantage of the proposed approach is that it goes through several stages before providing classification results. Therefore, the proposed approach requires efforts from researchers to achieve the goals of the research. Convolutional neural networks (CNNs) can rapidly detect and classify the wind turbine faults [41]. CNNs and other deep learning models require fewer steps for fault detection and classification in the energy sector. Therefore, one can choose a model that can directly measure the signals and use the applications of recommended typical CNN and other models when sample data is large enough [42].
6. Conclusions
This paper aims to study the problem related to the difficulty in choosing the priority of asymmetric fault handling in wind power systems. Starting from actual data, wind power tower and unit equipment were considered as the research objects to establish a dynamic fault classification model for wind power tower and unit equipment, with the number times of faults were triggered and fault distribution time as variables. Taking the actual fault statistical data of the wind power system as the sample dataset, the dynamic optimization equation of the weight parameters of the K-means model is constructed by combining the fault times with the time distribution and adopting a nonlinear regression theory and the concept of linear approximate constraint optimization. The comparative analysis of algorithms shows that the fault classification accuracy of the K-means fault classification model based on dynamic weight optimization algorithm is higher than that of the neural network algorithm and the classical K-means algorithm. The actual operation data also prove that this model can effectively identify the key faults of wind power foundation, tower, and unit equipment. The main limitation of the proposed methodology is that it relies on several steps to achieve classification results. This complicates the proposed approach for achieving fault classification results. Therefore, this approach can be optimized to overcome the limitations in future works.
Author Contributions
All authors contributed to study conception and design. Material preparation, data collection, and analysis were performed by B.Y. and L.R. The first draft of the manuscript was written by L.R. and all authors commented on previous versions of the manuscript. All authors have read and agreed to the published version of the manuscript.
Funding
This work is supported in part by National Natural Science Foundation of Chongqing (cstc2017rgzn-zdyf0117).
Data Availability Statement
The data used to support the findings of this study are included within the article.
Conflicts of Interest
The authors declare no conflict of interest.
References
- Zhao, Z.-Y.; Chang, R.-D.; Chen, Y.-L. What hinder the further development of wind power in China?—A socio-technical barrier study. Energy Policy 2016, 88, 465–476. [Google Scholar] [CrossRef]
- Li, X.; Hubacek, K.; Siu, Y.L. Wind power in China–Dream or reality? Energy 2012, 37, 51–60. [Google Scholar] [CrossRef]
- IEC61400-1; Wind turbines—Part 1: Design requirements. IEC: Geneva, Switzerland, 2005.
- Li, L.; Ren, X.; Yang, Y.; Zhang, P.; Chen, X. Analysis and recommendations for onshore wind power policies in China. Renew. Sustain. Energy Rev. 2018, 82, 156–167. [Google Scholar] [CrossRef]
- Yang, Y.; Lu, H.; Tan, X.; Chai, H.K.; Wang, R.; Zhang, Y. Fundamental mode shape estimation and element stiffness evaluation of girder bridges by using passing tractor-trailers. Mech. Syst. Signal Process. 2021, 169, 108746. [Google Scholar] [CrossRef]
- Yang, Y.; Zhang, Y.; Tan, X. Review on Vibration-Based Structural Health Monitoring Techniques and Technical Codes. Symmetry 2021, 13, 1998. [Google Scholar] [CrossRef]
- Yang, Y.; Ling, Y.; Tan, X.K.; Wang, S.; Wang, R.Q. Damage Identification of Frame Structure Based on Approximate Metropolis–Hastings Algorithm and Probability Density Evolution Method. Int. J. Struct. Stab. Dyn. 2022. [Google Scholar] [CrossRef]
- Wan, Y.; Xiufang, P.; Jianfeng, L. Interactions of wind turbine-foundation-ground in mountain wind field by finite element method. Acta Energ. Sol. Sin. 2018, 39, 2060–2066. [Google Scholar]
- Ke, S.; Ge, Y.; Zhao, L.; Tamura, Y. A new methodology for analysis of equivalent static wind loads on super-large cooling towers. J. Wind Eng. Ind. Aerodyn. 2012, 111, 30–39. [Google Scholar] [CrossRef]
- Wei, Y. Research on Basic Mechanical Properties of Hybrid Wind Turbine Towers. Ph.D. Thesis, Fuzhou University, Fuzhou, China, 2016. [Google Scholar]
- Yang, Y.; Liu, J.; Fan, J. Buckling behavior of double-skin composite walls: An experimental and modeling study. J. Constr. Steel Res. 2016, 121, 126–135. [Google Scholar] [CrossRef] [Green Version]
- Nassar, S.A.; Ganganala, M. Effect of Separating Load Eccentricity on the Clamp Load Loss in a Bolted Joint Using a Strain Hardening Model. J. Press. Vessel Technol. 2011, 133, 21206. [Google Scholar] [CrossRef]
- Dao, P.B.; Staszewski, W.J.; Barszcz, T.; Uhl, T. Condition monitoring and fault detection in wind turbines based on cointegration analysis of SCADA data. Renew. Energy 2018, 116, 107–122. [Google Scholar] [CrossRef]
- Liu, X.; Lu, S.; Ren, Y.; Wu, Z. Wind Turbine Anomaly Detection Based on SCADA Data Mining. Electronics 2020, 9, 751. [Google Scholar] [CrossRef]
- Chou, J.-S.; Tu, W.-T. Failure analysis and risk management of a collapsed large wind turbine tower. Eng. Fail. Anal. 2011, 18, 295–313. [Google Scholar] [CrossRef]
- Qiu, Y.; Feng, Y.; Sun, J.; Zhang, W.; Infield, D. Applying thermophysics for wind turbine drivetrain fault diagnosis using SCADA data. IET Renew. Power Gener. 2016, 10, 661–668. [Google Scholar] [CrossRef] [Green Version]
- Zhao, Y.; Li, D.; Dong, A.; Kang, D.; Lv, Q.; Shang, L. Fault Prediction and Diagnosis of Wind Turbine Generators Using SCADA Data. Energies 2017, 10, 1210. [Google Scholar] [CrossRef] [Green Version]
- Gao, Z.; Liu, X. An Overview on Fault Diagnosis, Prognosis and Resilient Control for Wind Turbine Systems. Processes 2021, 9, 300. [Google Scholar] [CrossRef]
- Qi, J.; Yu, Y.; Wang, L.; Liu, J.; Wang, Y. An effective and efficient hierarchical K-means clustering algorithm. Int. J. Distrib. Sens. Networks 2017, 13, 1–17. [Google Scholar] [CrossRef] [Green Version]
- Yang, W.; Long, H.; Ma, L.; Sun, H. Research on Clustering Method Based on Weighted Distance Density and K-Means. Procedia Comput. Sci. 2020, 166, 507–511. [Google Scholar] [CrossRef]
- Pickens, A.; Sengupta, S. Benchmarking Studies Aimed at Clustering and Classification Tasks Using K-Means, Fuzzy C-Means and Evolutionary Neural Networks. Mach. Learn. Knowl. Extr. 2021, 3, 695–719. [Google Scholar] [CrossRef]
- Huang, X.; Yang, X.; Zhao, J.; Xiong, L.; Ye, Y. A new weighting k -means type clustering framework with an l2-norm regularization. Knowledge-Based Syst. 2018, 151, 165–179. [Google Scholar] [CrossRef]
- Chou, J.-S.; Ou, Y.-C.; Lin, K.-Y. Collapse mechanism and risk management of wind turbine tower in strong wind. J. Wind Eng. Ind. Aerodyn. 2019, 193, 103962. [Google Scholar] [CrossRef]
- Rezamand, M.; Kordestani, M.; Carriveau, R.; Ting, D.S.-K.; Saif, M. A New Hybrid Fault Detection Method for Wind Turbine Blades Using Recursive PCA and Wavelet-Based PDF. IEEE Sensors J. 2019, 20, 2023–2033. [Google Scholar] [CrossRef]
- Lin, Y.; Tu, L.; Liu, H.; Li, W. Fault analysis of wind turbines in China. Renew. Sustain. Energy Rev. 2016, 55, 482–490. [Google Scholar] [CrossRef]
- Zhao, D.; Hu, X.; Xiong, S.; Tian, J.; Xiang, J.; Zhou, J.; Li, H. k-means clustering and kNN classification based on negative databases. Appl. Soft Comput. 2021, 110, 107732. [Google Scholar] [CrossRef]
- Li, H.; Dfaz, H.; Soares, G.C. A failure analysis of floating offshore wind turbines using AHP-FMEA methodology. Ocean. Eng. 2021, 234, 109261. [Google Scholar] [CrossRef]
- Qiu, Y.; Feng, Y.; Tavner, P.; Richardson, P.; Erdős, F.G.; Chen, B. Wind turbine SCADA alarm analysis for improving reliability. Wind Energy 2012, 15, 951–966. [Google Scholar] [CrossRef]
- Qiu, Y.; Feng, Y.; Infield, D. Fault diagnosis of wind turbine with SCADA alarms based multidimensional information processing method. Renew. Energy 2019, 145, 1923–1931. [Google Scholar] [CrossRef]
- Gonzalez, E.; Reder, M.; Melero, J.J. SCADA alarms processing for wind turbine component failure detection. J. Phys. Conf. Ser. 2016, 753, 72019. [Google Scholar] [CrossRef]
- Castellani, F.; Garinei, A.; Terzi, L.; Astolfi, D.; Gaudiosi, M. Improving windfarm operation practice through numerical modelling and supervisory control and data acquisition data analysis. IET Renew. Power Gener. 2014, 8, 367–379. [Google Scholar] [CrossRef]
- Wei, L.; Qian, Z.; Pei, Y.; Wang, J. Wind Turbine Fault Diagnosis by the Approach of SCADA Alarms Analysis. Appl. Sci. 2021, 12, 69. [Google Scholar] [CrossRef]
- Yu, Y.; Velastin, S.A.; Yin, F. Automatic grading of apples based on multi-features and weighted K-means clustering algorithm. Inf. Processing Agric. 2020, 7, 556–565. [Google Scholar] [CrossRef]
- Wang, B.; Wang, G.; Wang, Y.; Lou, Z.; Hu, S.; Ye, Y. A K-means clustering method with feature learning for unbalanced vehicle fault diagnosis. Smart Resilient Transp. 2021, 3, 162–176. [Google Scholar] [CrossRef]
- Fang, R.; Shang, R.; Wu, M.; Peng, C.; Guo, X. Application of gray relational analysis to k-means clustering for dynamic equivalent modeling of wind farm. Int. J. Hydrogen Energy 2017, 42, 20154–20163. [Google Scholar] [CrossRef]
- Kun, H.; Ping, D.; Yuepeng, L. Structure optimization for erosion resistance of 90° elbow with gas-solid two-phase flow. J. Saf. Sci. Technol. 2019, 15, 94–100. [Google Scholar]
- Powell, M.J.D. A direct search optimization method that models the objective and constraint functions by linear interpolation. In Advances in Optimization and Numerical Analysis; Springer: Dordrecht, The Netherlands, 1994; pp. 51–67. [Google Scholar]
- Yang, Z. Automatic Condition Monitoring of Industrial Rolling-Element Bearings Using Motor’s Vibration and Current Analysis. Shock Vib. 2015, 2015, 486159. [Google Scholar] [CrossRef] [Green Version]
- Huang, L. Studies on Dynamics of Suction Piles during Their Lowering Operations. Master’s Thesis, Texas A & M University, College Station, TX, USA, 2010. [Google Scholar]
- Asian, S.; Ertek, G.; Haksoz, C.; Pakter, S.; Ulun, S. Wind Turbine Accidents: A Data Mining Study. IEEE Syst. J. 2016, 11, 1567–1578. [Google Scholar] [CrossRef] [Green Version]
- Guo, J.; Liu, C.; Cao, J.; Jiang, D. Damage identification of wind turbine blades with deep convolutional neural networks. Renew. Energy 2021, 174, 122–133. [Google Scholar] [CrossRef]
- Xiao, C.; Liu, Z.; Zhang, T.; Zhang, X. Deep Learning Method for Fault Detection of Wind Turbine Converter. Appl. Sci. 2021, 11, 1280. [Google Scholar] [CrossRef]
Figure 1.
Flowchart of the proposed method.
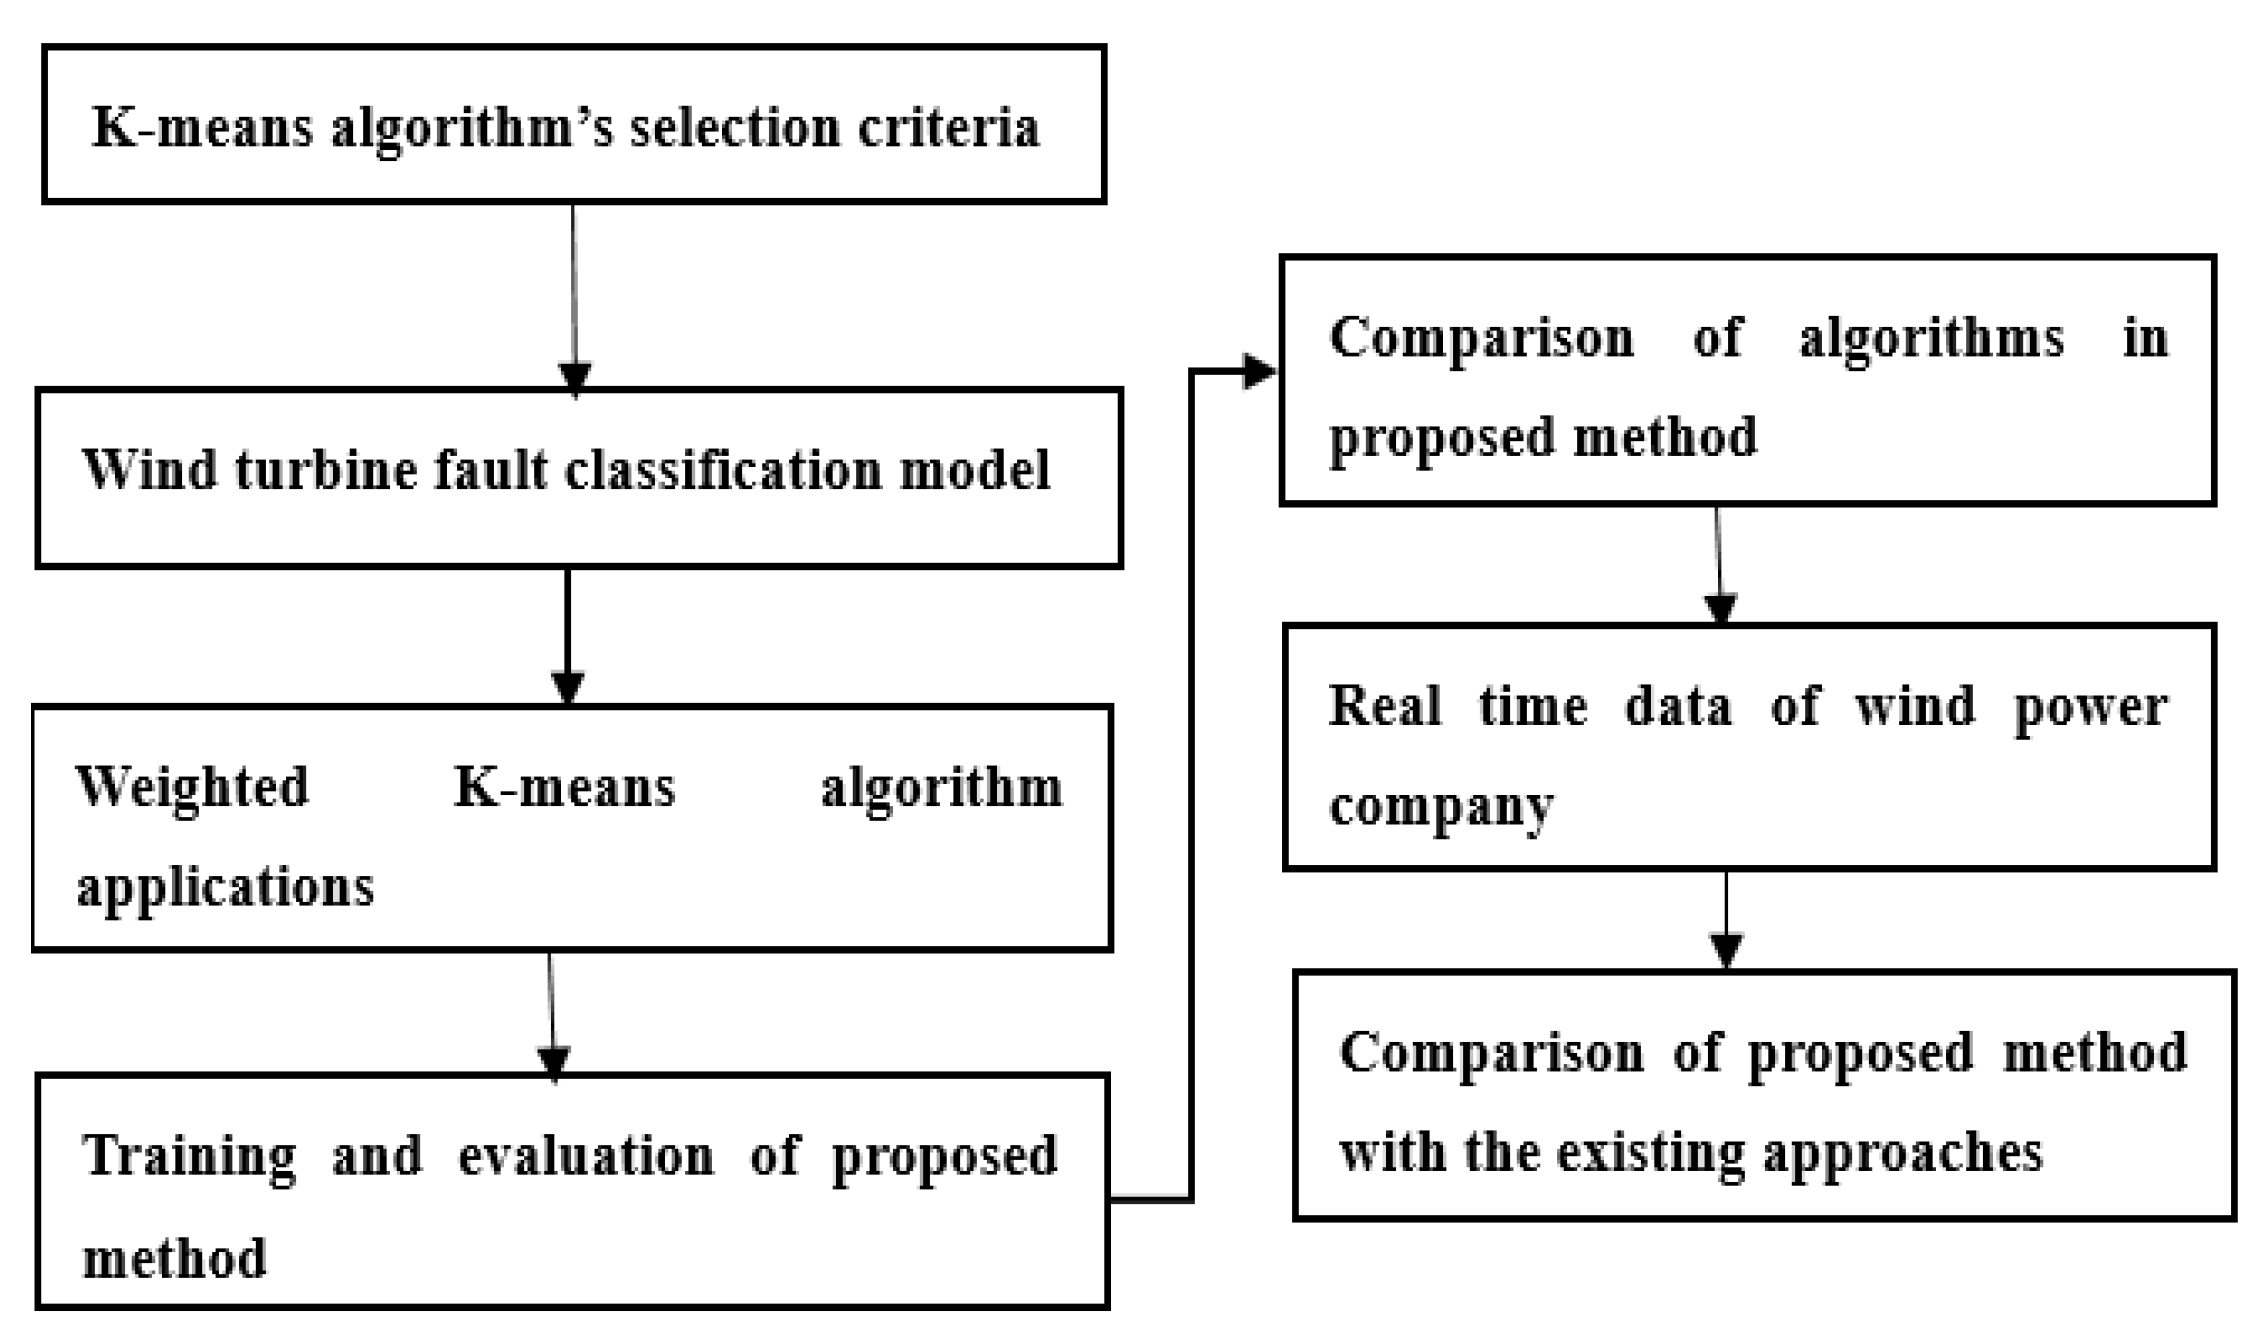
Figure 2.
Fault classification model based on K-means.
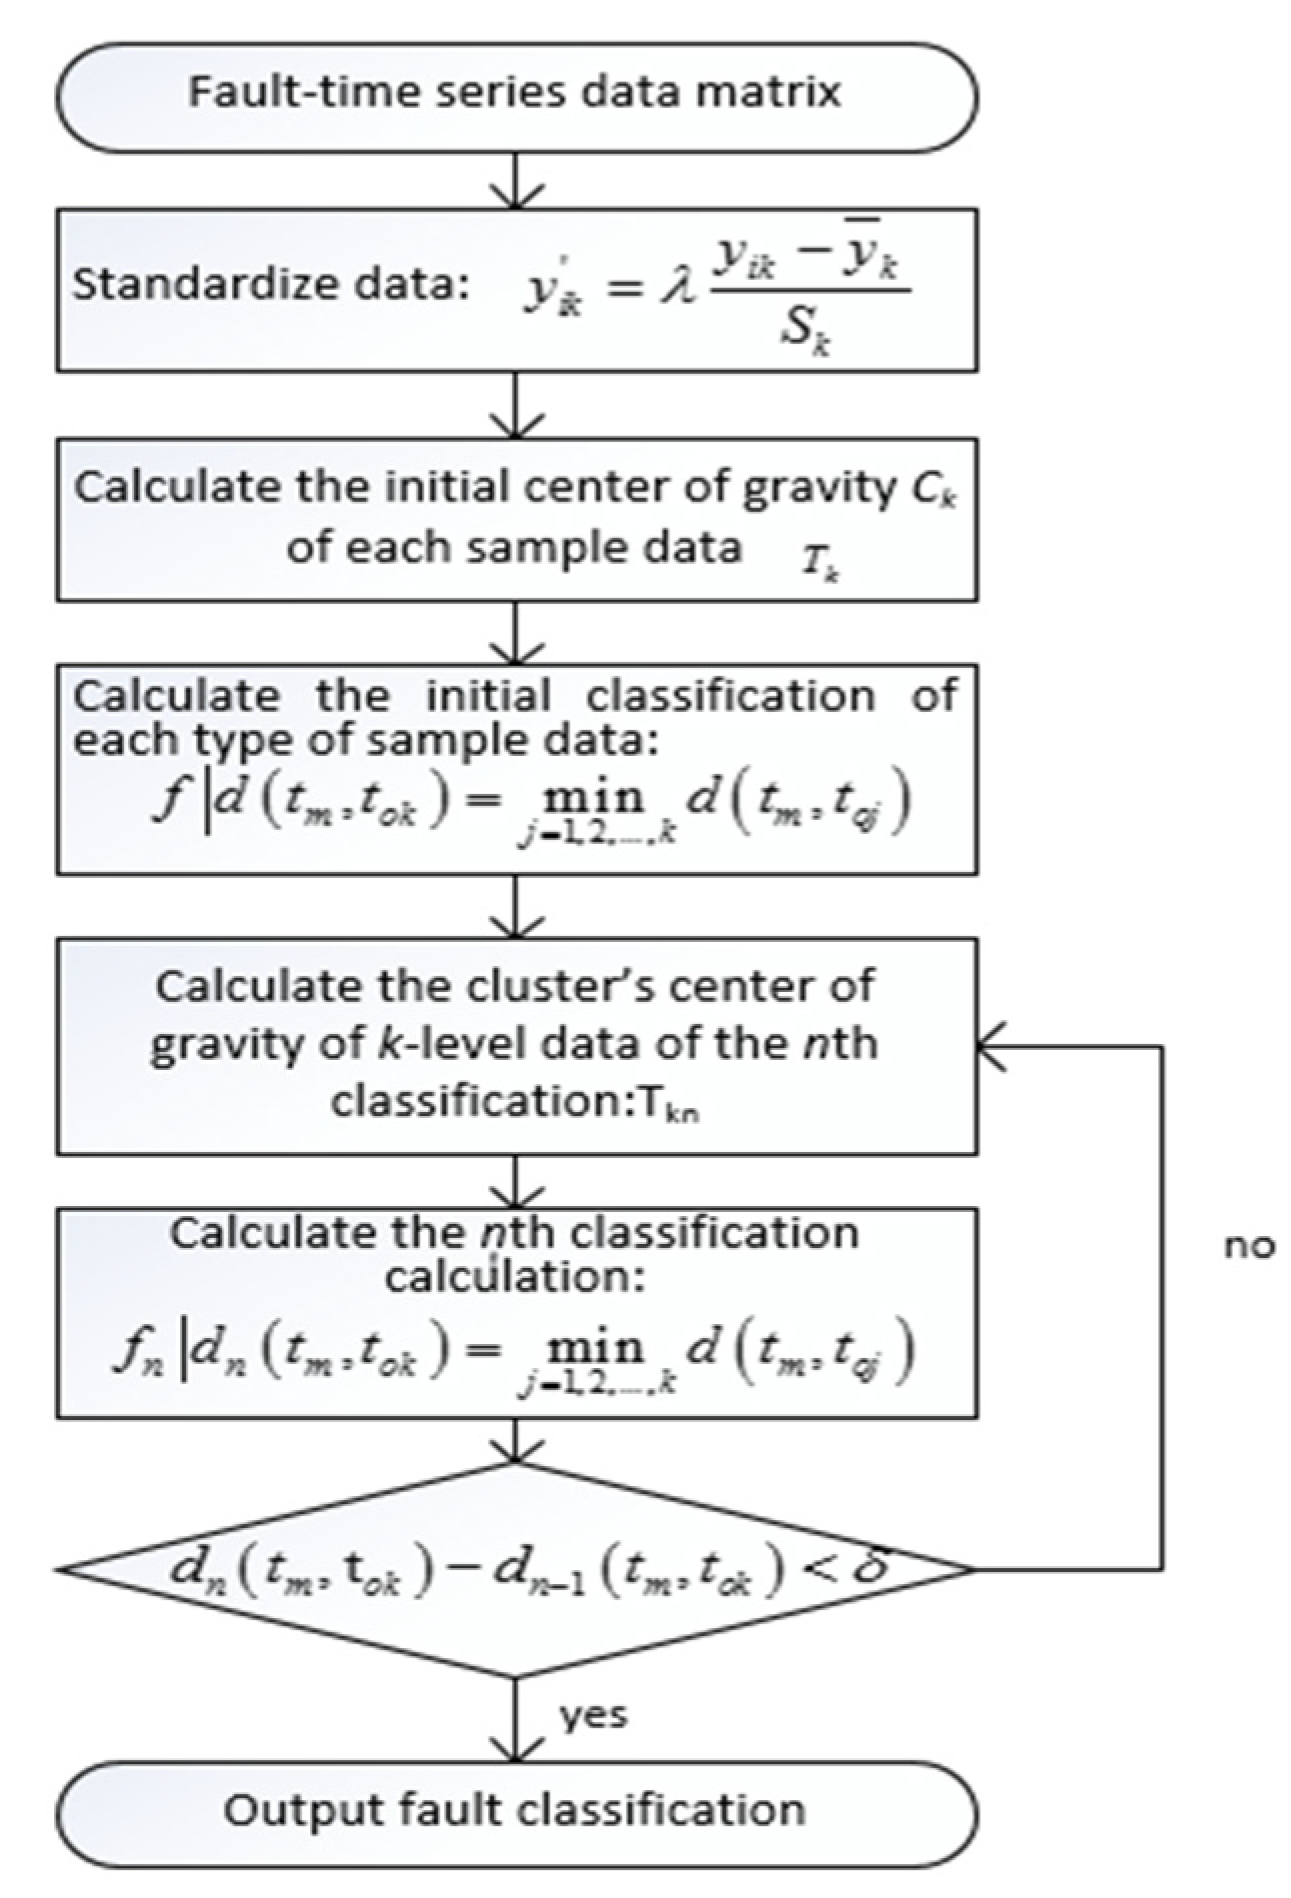
Figure 3.
Weight parameter optimization algorithm.
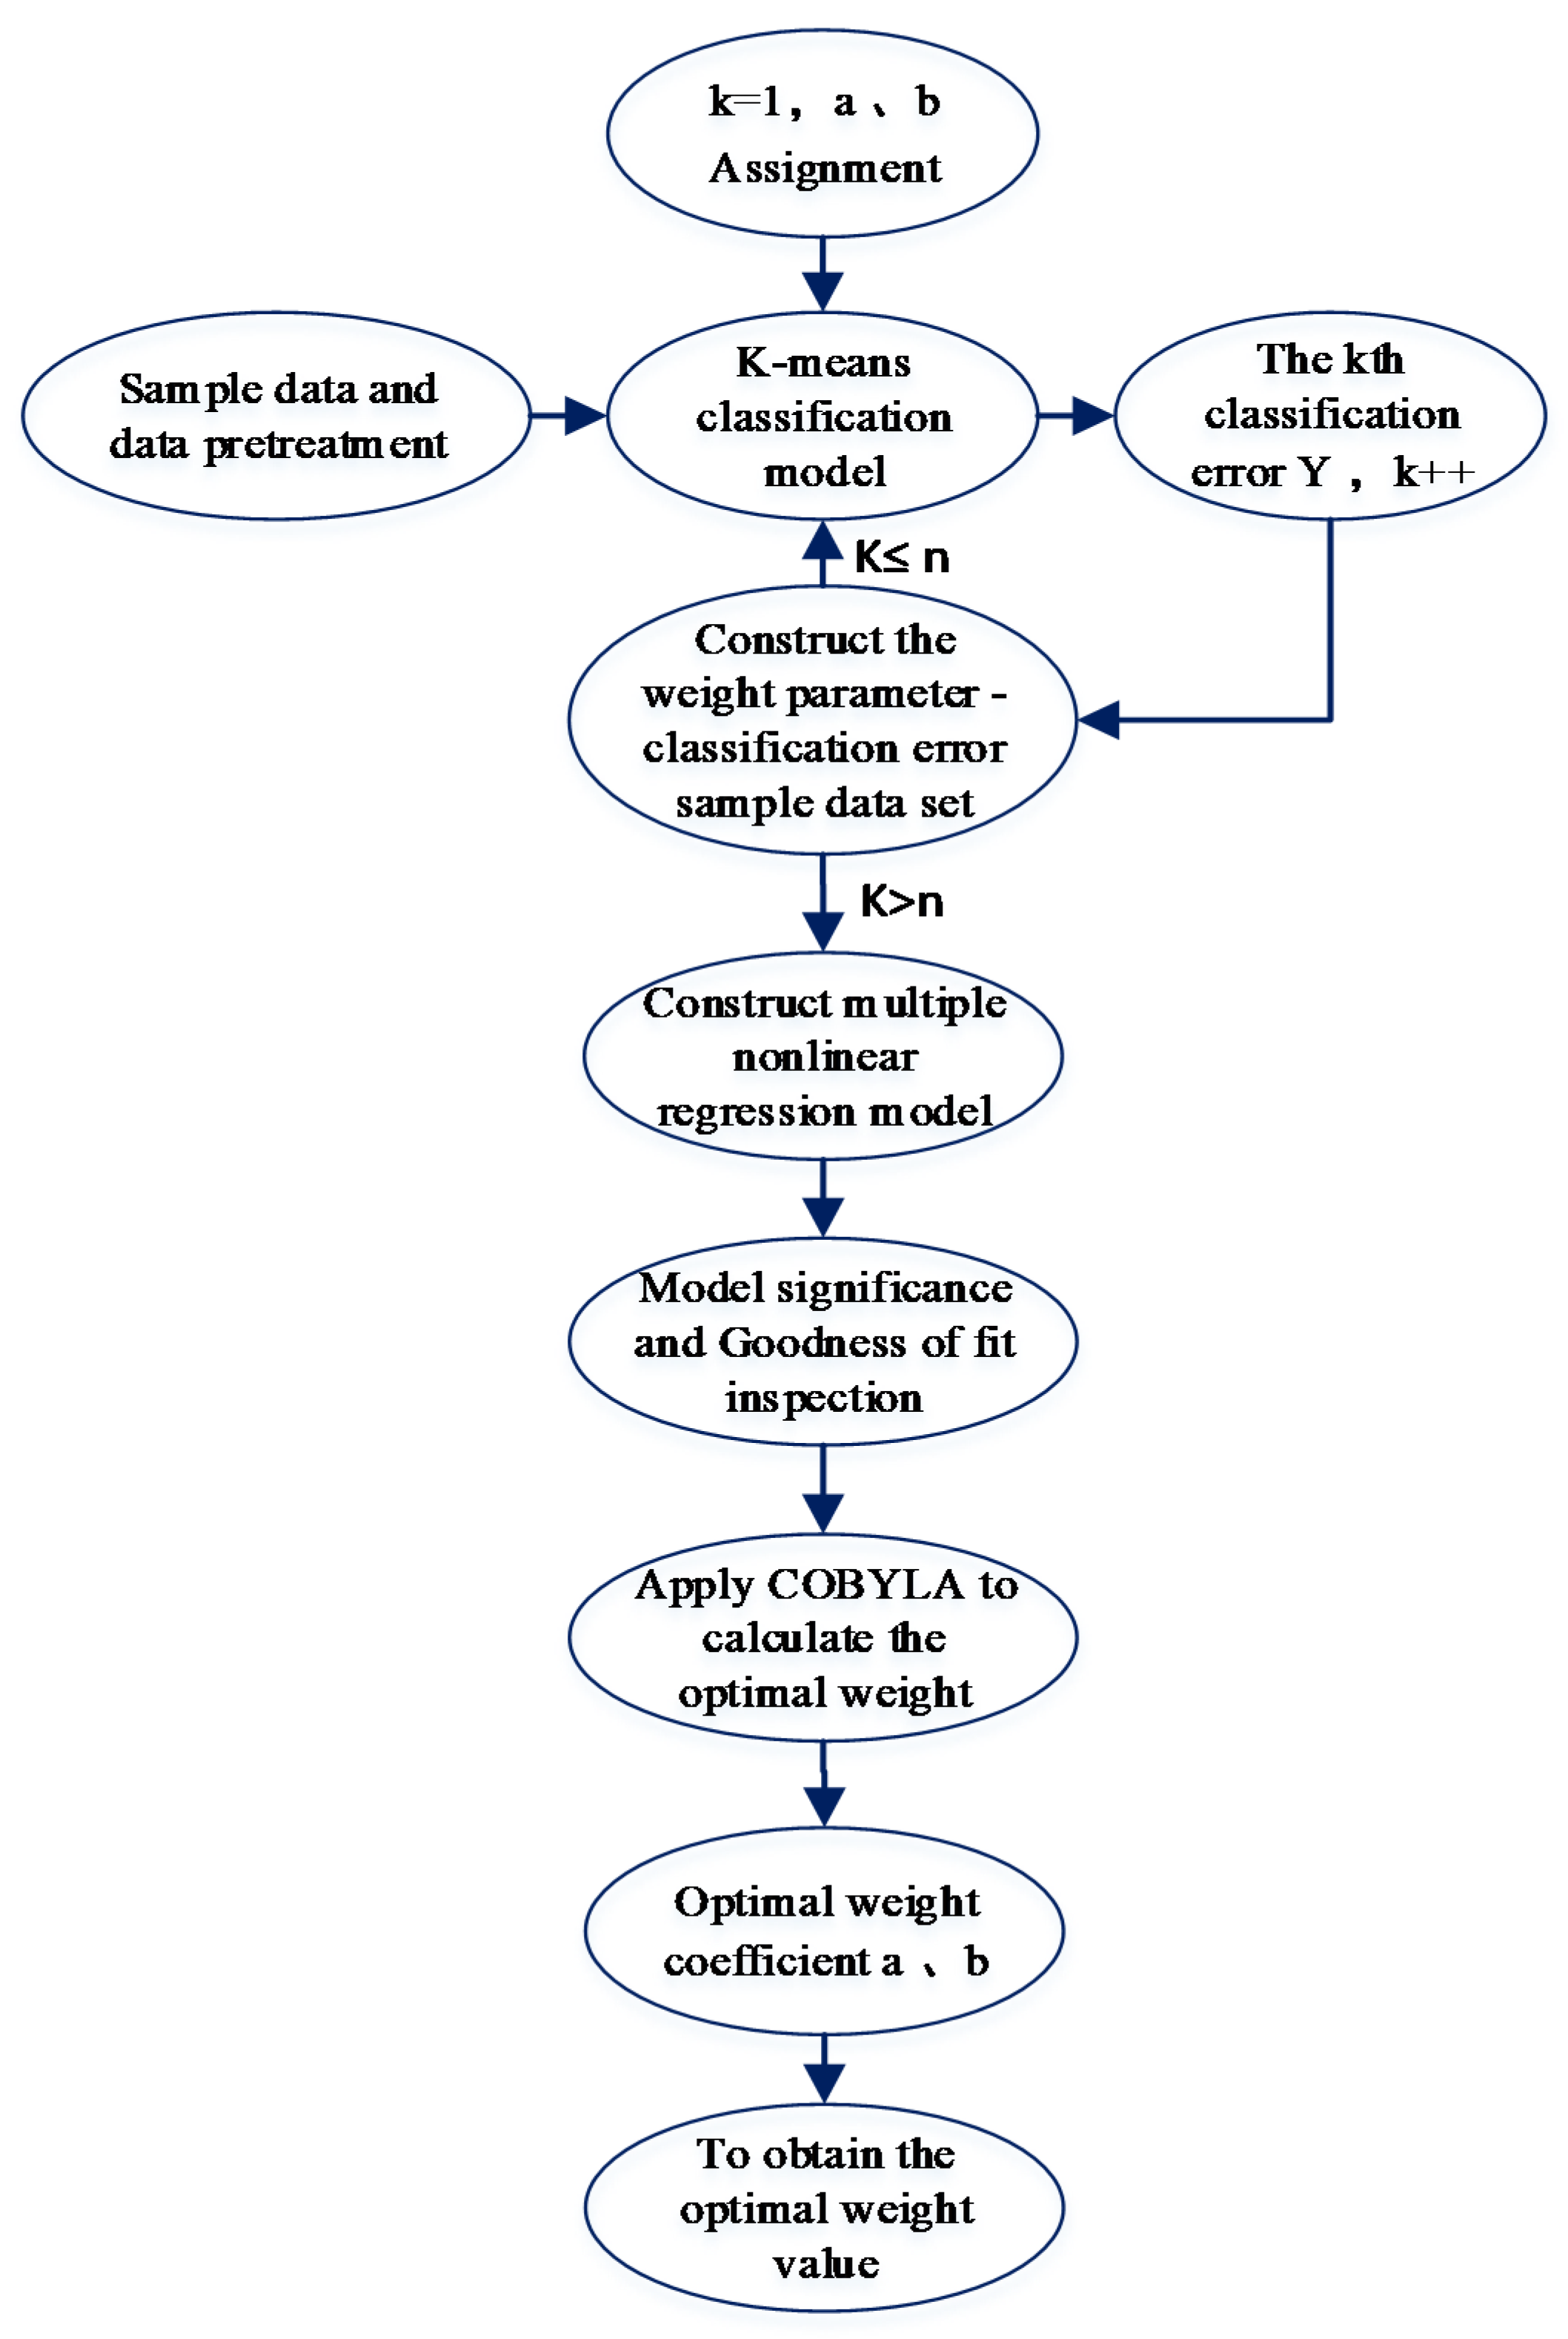
Figure 4.
Application architecture of wind farm fault classification model in wind power industry.

Figure 5.
Fault classification based on fault frequency and time distribution.
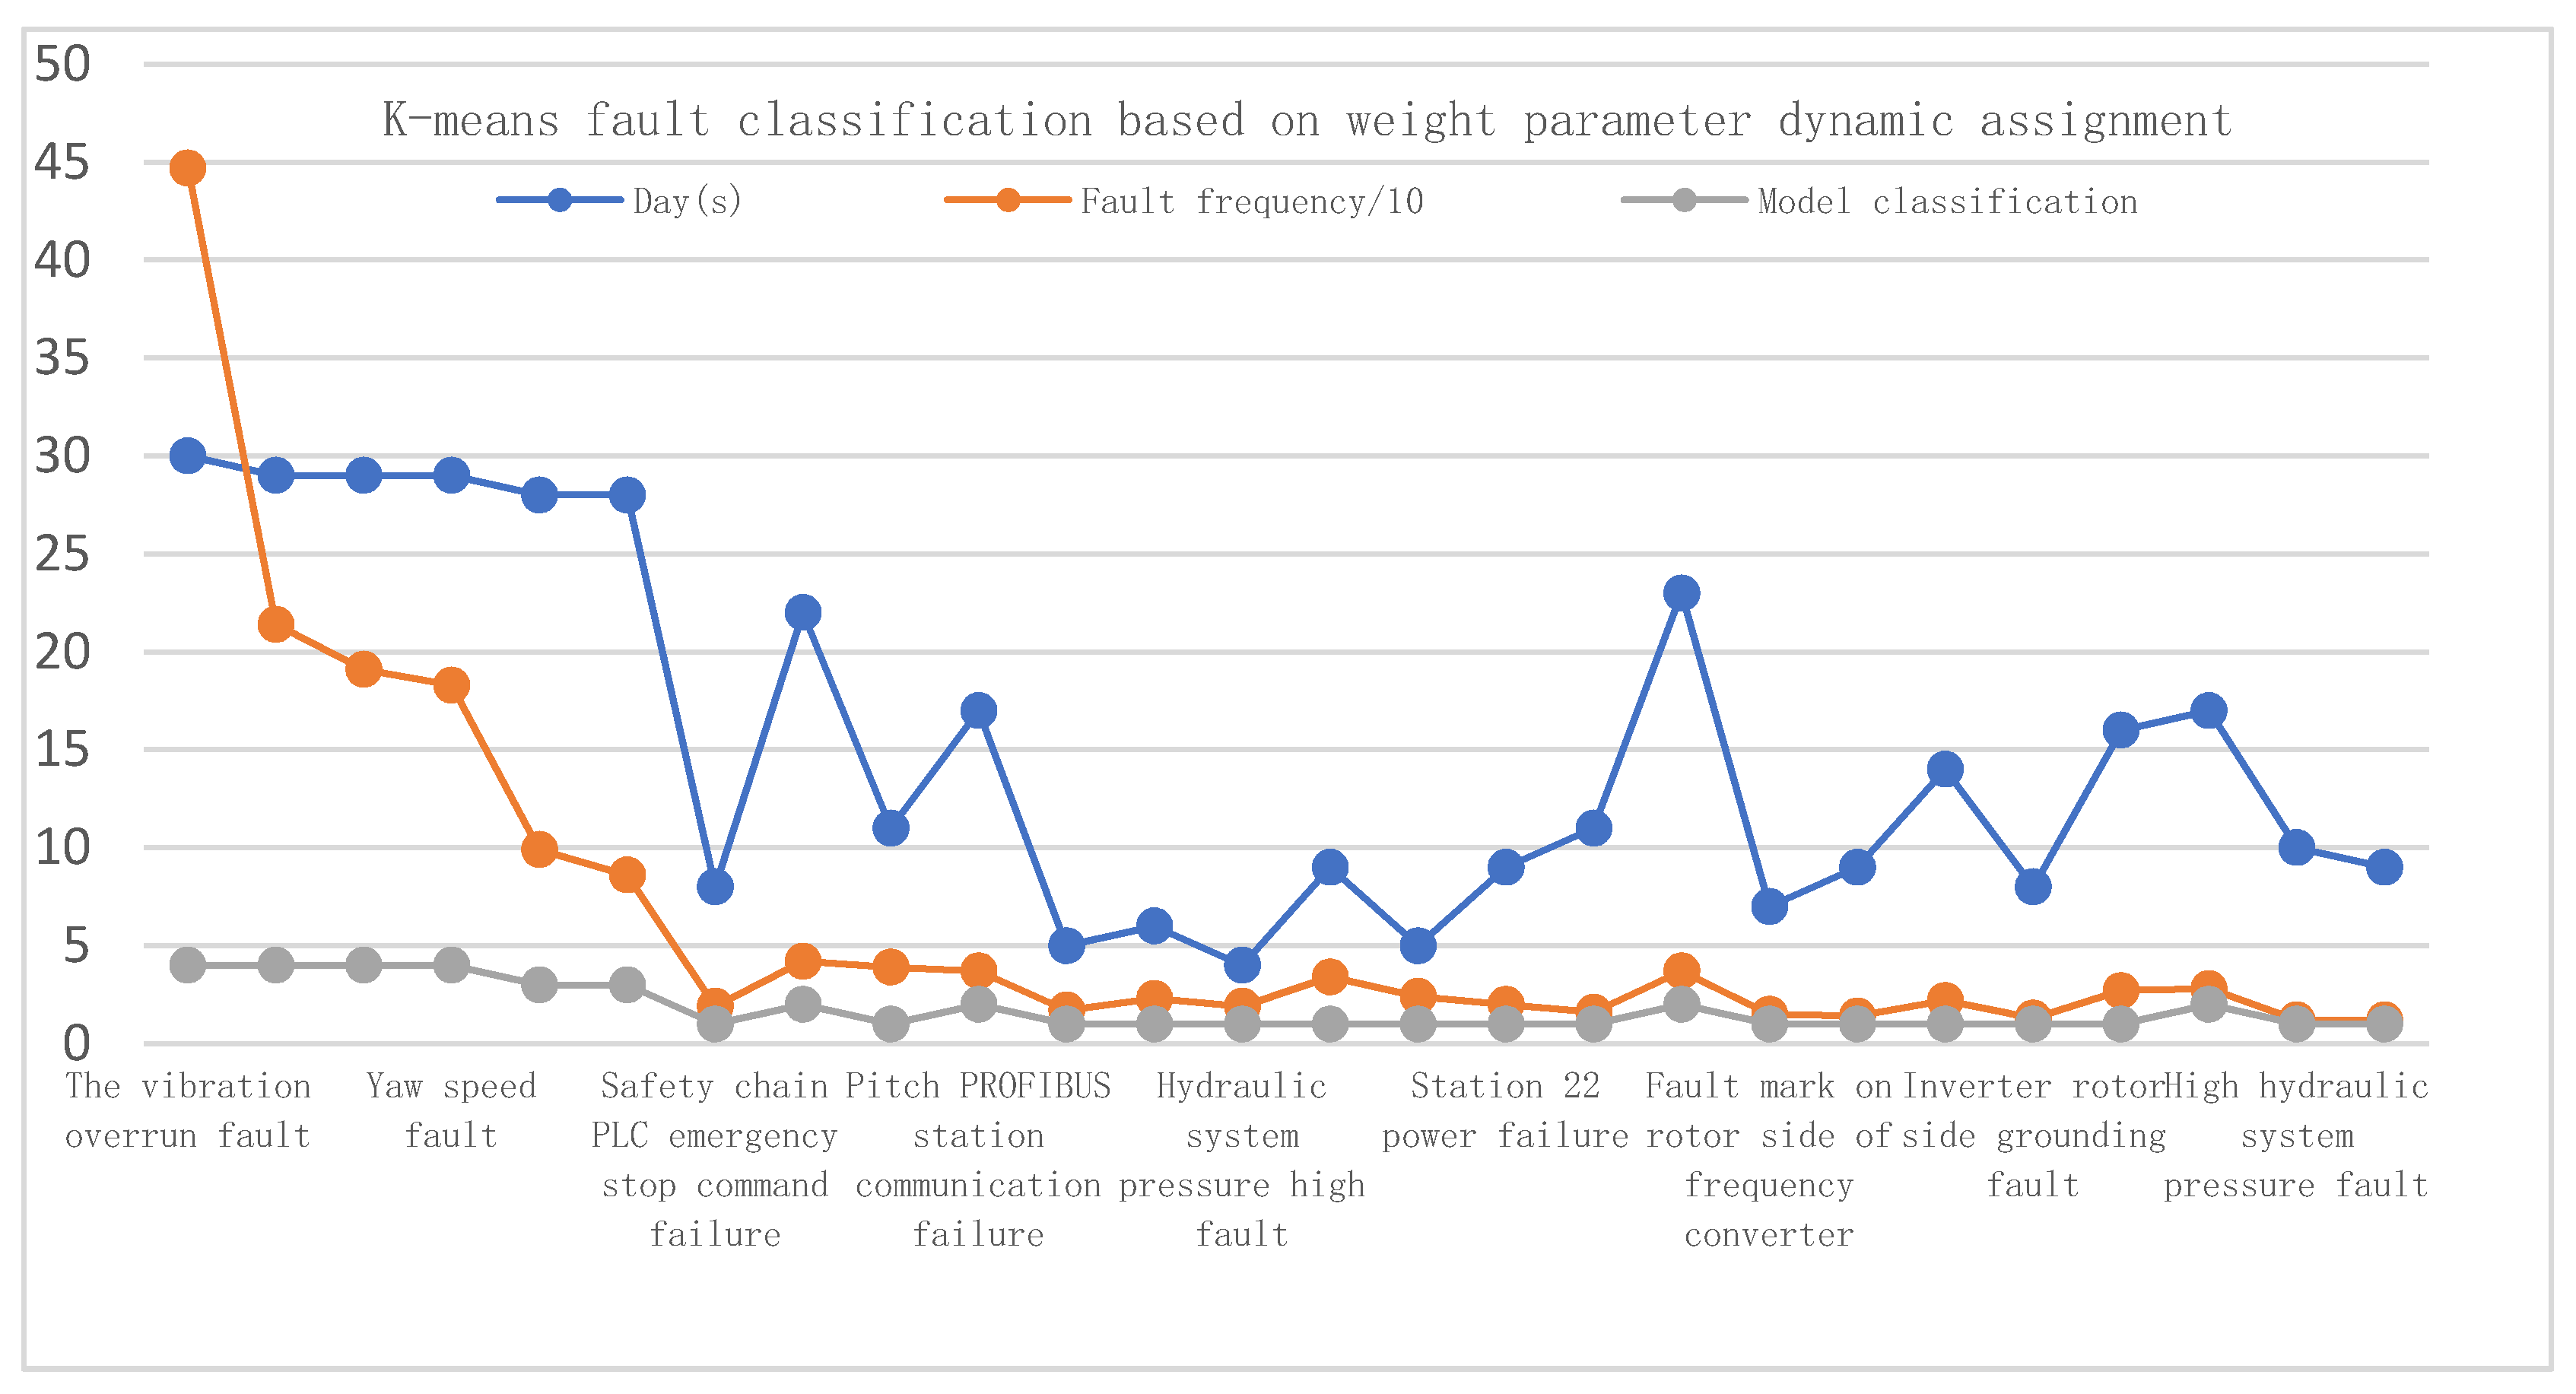
Figure 6.
Acceleration spectrum analysis based on vibration data.
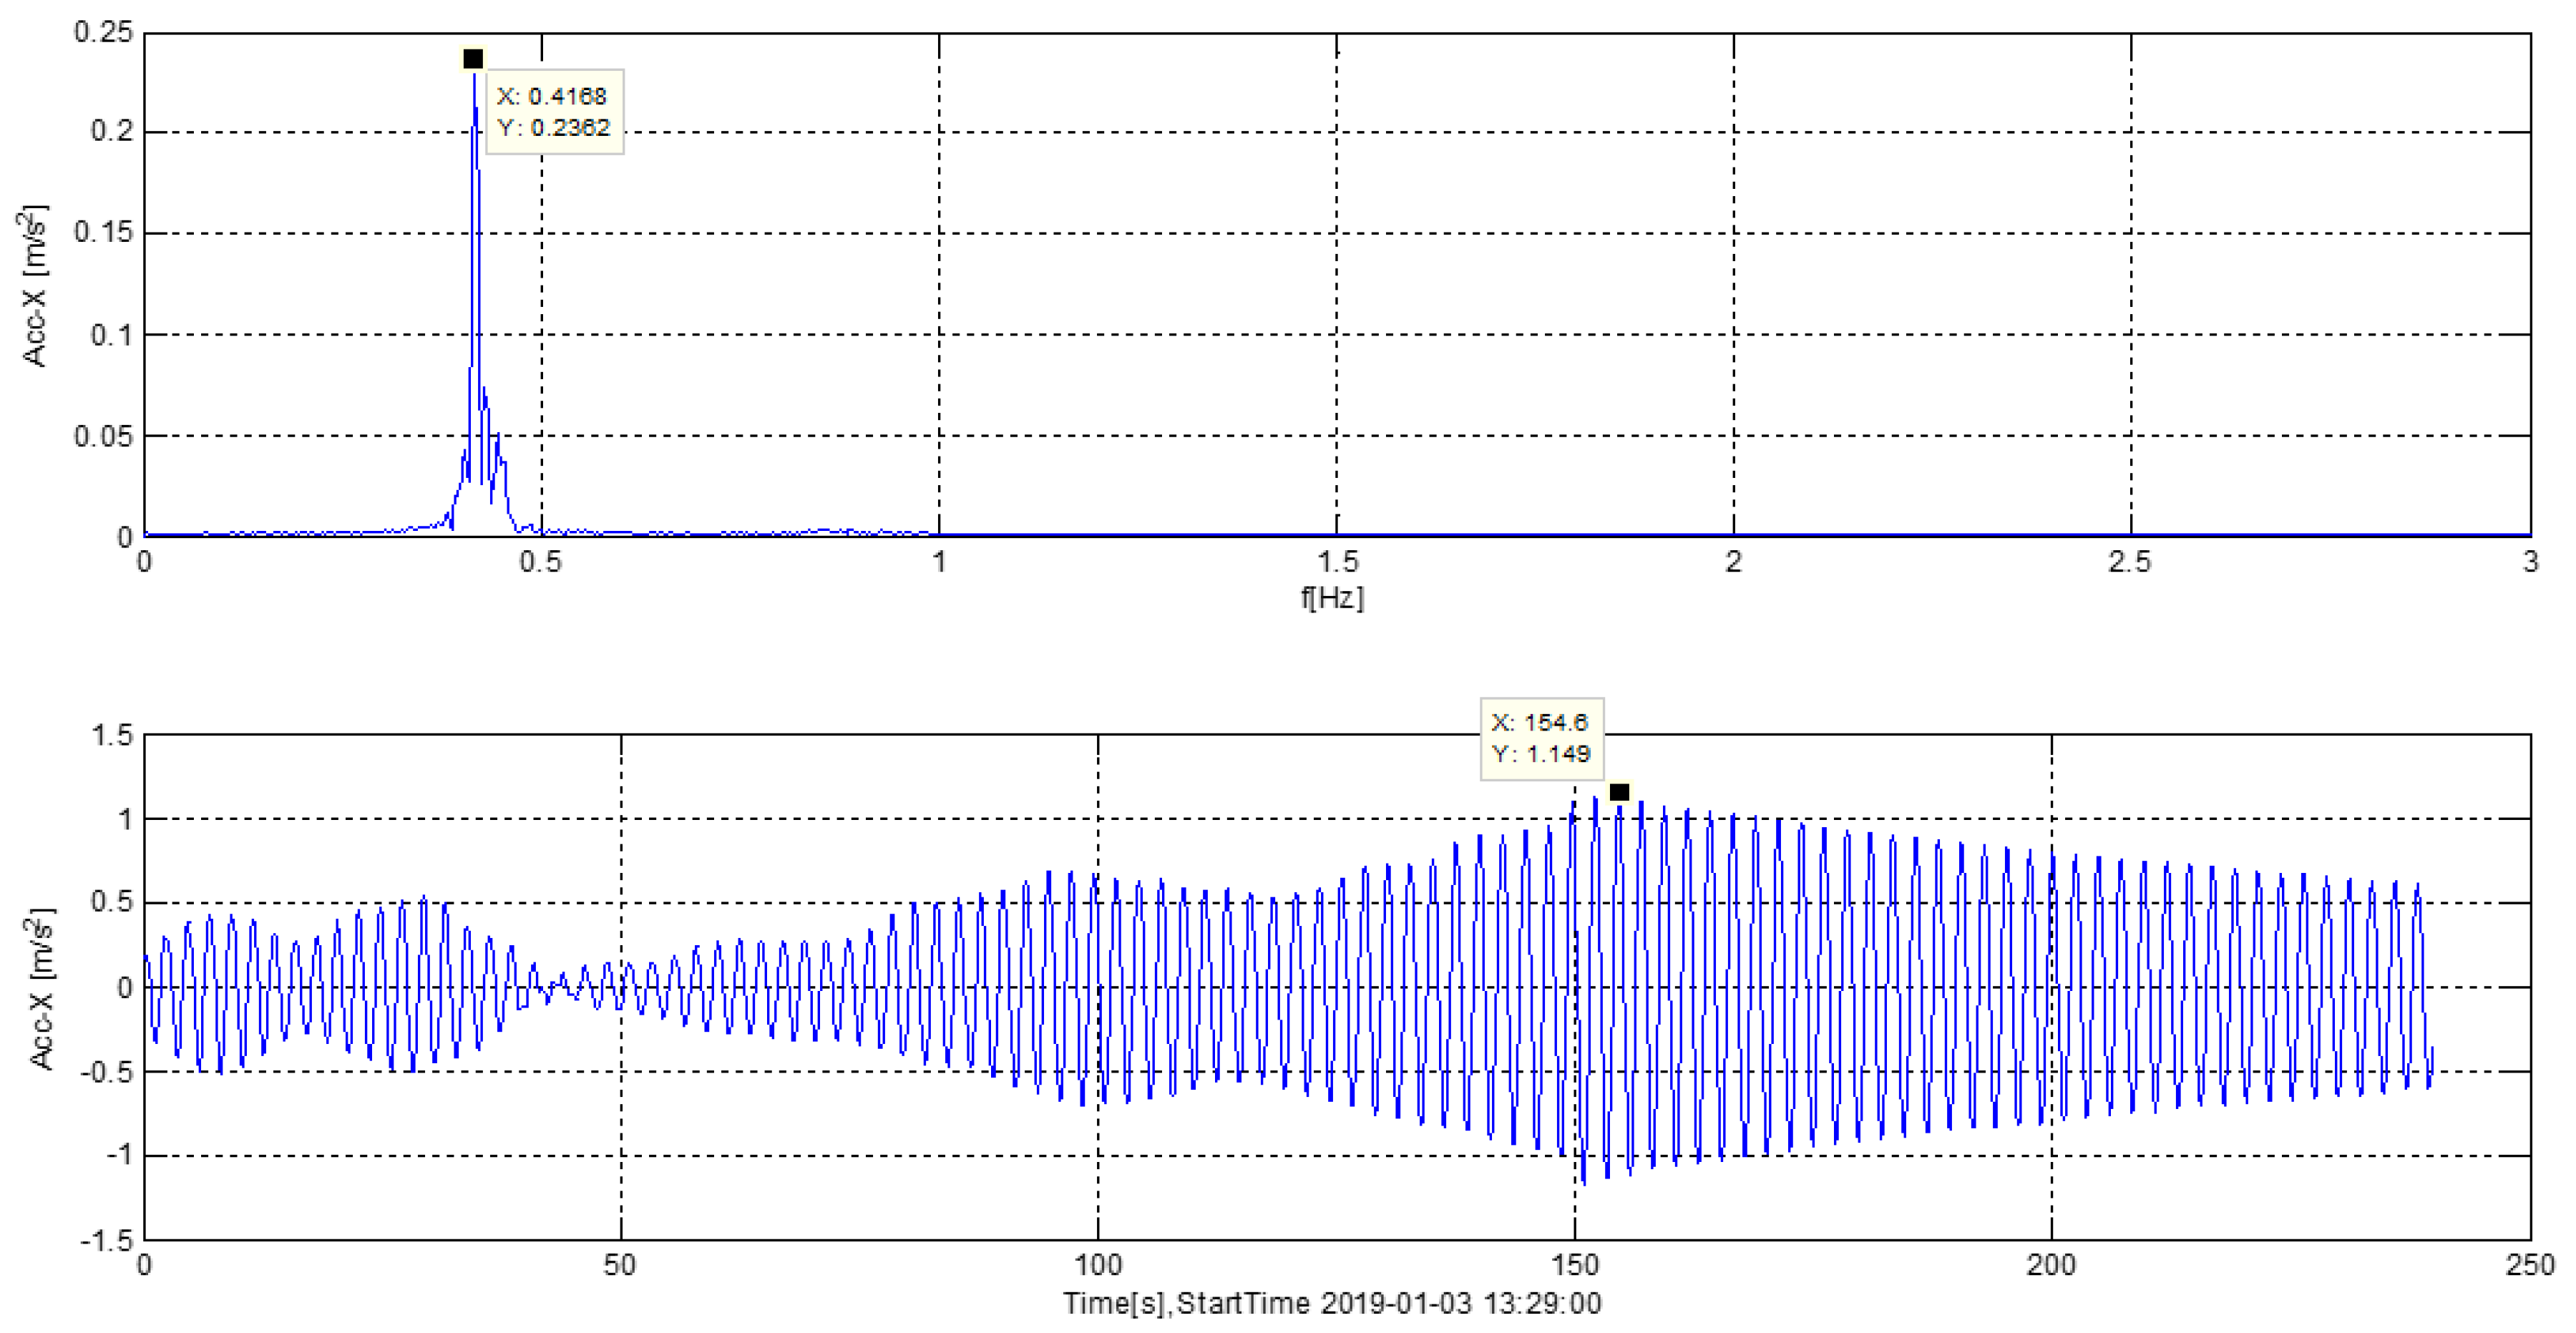
Figure 7.
Foundation inspection of wind turbine No. 10.

Table 1.
Monthly sample attributes (statistical time).
| S. No | Fault | 1 | 2 | … | k | … | 31 |
|---|---|---|---|---|---|---|---|
| 1 | A | … | … | ||||
| 2 | B | … | … | ||||
| … | … | … | … | … | … | … | … |
| ... | … | … | |||||
| … | … | … | … | … | … | … | … |
| ... | … | … |
Note: In the statistical table of fault attribute matrix, the row of the matrix was the sample attribute for sample statistics, i.e., the time when the fault occurs, which is counted on a daily basis; the second column of the matrix was the statistical sample, i.e., the name of the fault for which fault frequency statistics are analyzed every month; in the matrix was the statistical value of fault frequency of the attribute (day ) of the sample (fault name).
Table 2.
Fault classification treatment based on actual emergency treatment.
| Fault Level | Fault Level Definition | Grading Standard | Processing Department |
|---|---|---|---|
| 1 | Low risk level fault | Low frequency and short-term distribution | Engineering technology company’s site |
| 2 | Medium risk level fault | Lower frequency and short-term distribution | Engineering technology company’s operation and maintenance center |
| 3 | Common fault with higher risk level | Higher frequency and longer-term distribution | Technical department and responsible leader |
| 4 | Common fault with high risk level | High frequency and long-term distribution | R&D center and responsible leader |
Table 3.
Statistical distribution of data for wind farm unit fault time series in October 2015.
| S. No. | Fault Category | Date_1 | Date_2 | … | Date_30 | Date_31 | Fault Number | Days Triggered |
|---|---|---|---|---|---|---|---|---|
| 1 | Normal rotor speed shutdown fault | 122 | 105 | … | 0 | 0 | 641 | 17 |
| 2 | Station 20 communication failure | 255 | 123 | … | 0 | 0 | 399 | 4 |
| 3 | Station communication failure | 315 | 2 | … | 0 | 0 | 319 | 3 |
| 4 | Hydraulic system pressure high fault | 35 | 32 | … | 2 | 0 | 254 | 30 |
| … | … | … | … | … | … | … | … | … |
| 19 | Motor cooling water pump pressure fault | 39 | 15 | … | 0 | 0 | 98 | 9 |
| … | … | … | … | … | … | … | … | … |
| 33 | Three-phase voltage unbalance fault | 6 | 5 | … | 0 | 0 | 49 | 14 |
| … | … | … | … | … | … | … | … | … |
| 222 | Tower foundation ups400 v power supply failure | 1 | 0 | … | 0 | 0 | 1 | 1 |
Table 4.
Classification error sample dataset based on K-means.
| S. No. | a | b | Error Rate c |
|---|---|---|---|
| 1 | 0.3 | 0.1 | 0.135135 |
| 2 | 0.4 | 0.1 | 0.130631 |
| 3 | 0.7 | 0.2 | 0.130631 |
| … | … | … | … |
| 65 | 2.0 | 0.1 | 0.211712 |
| 66 | 2.0 | 0.2 | 0.216216 |
Table 5.
Test parameters of fitting surface.
| Name | Quadratic Fitting | Cubic Fitting | Quartic Fitting |
|---|---|---|---|
| SSE: | 0.007364 | 0.00499 | 0.003037 |
| R-square: | 0.9294 | 0.9521 | 0.9709 |
| Adjusted R-square: | 0.9235 | 0.9444 | 0.9629 |
| RMSE: | 0.01108 | 0.009439 | 0.007716 |
Table 6.
Test accuracy of different algorithms.
| Algorithm | Total Number of Samples | Number of Misclassified Samples | Accuracy |
|---|---|---|---|
| K-means algorithm of weight parameter optimization | 71 | 1 | 98.59% |
| Neural network algorithm | 71 | 7 | 90.14% |
| Classical K-means algorithm | 71 | 9 | 87.32% |
Publisher’s Note: MDPI stays neutral with regard to jurisdictional claims in published maps and institutional affiliations. |
© 2022 by the authors. Licensee MDPI, Basel, Switzerland. This article is an open access article distributed under the terms and conditions of the Creative Commons Attribution (CC BY) license (https://creativecommons.org/licenses/by/4.0/).
Share and Cite
MDPI and ACS Style
Ren, L.; Yong, B. Wind Turbines Fault Classification Treatment Method. Symmetry 2022, 14, 688. https://doi.org/10.3390/sym14040688
AMA Style
Ren L, Yong B. Wind Turbines Fault Classification Treatment Method. Symmetry. 2022; 14(4):688. https://doi.org/10.3390/sym14040688
Chicago/Turabian StyleRen, Liying, and Bin Yong. 2022. "Wind Turbines Fault Classification Treatment Method" Symmetry 14, no. 4: 688. https://doi.org/10.3390/sym14040688
Note that from the first issue of 2016, this journal uses article numbers instead of page numbers. See further details here.