Article

A Novel CRITIC-Fuzzy FUCOM-DEA-Fuzzy MARCOS Model for Safety Evaluation of Road Sections Based on Geometric Parameters of Road

by
Jelena Mitrović Simić
1,
Željko Stević
2,
Edmundas Kazimieras Zavadskas
3,*,
Vuk Bogdanović
1,
Marko Subotić
2 and
Abbas Mardani
4
1
Faculty of Technical Sciences, University of Novi Sad, Trg Dositeja Obradovića 6, 21000 Novi Sad, Serbia
2
Faculty of Transport and Traffic Engineering, University of East Sarajevo, Vojvode Mišića 52, 74000 Doboj, Bosnia and Herzegovina
3
Institute of Sustainable Construction, Vilnius Gediminas Technical University, LT 10223 Vilnius, Lithuania
4
College of Business Administration, University of South Florida, Tampa, FL 33620, USA
*
Author to whom correspondence should be addressed.
Symmetry 2020, 12(12), 2006; https://doi.org/10.3390/sym12122006
Submission received: 13 November 2020 / Revised: 30 November 2020 / Accepted: 2 December 2020 / Published: 4 December 2020

Abstract

:
Trends of globalization very often cause the emergence of phenomena that asymmetrically affect the overall sustainability of the transport system. In order to predict certain situations and potentially be able to manage the transport system, it is necessary to manage risk situations and traffic safety in a timely manner. This study has conducted an investigation which implies defining the level of safety of a total of nine sections of two-lane roads. The main aim of the paper is to create a new multiphase model consisting of CRITIC (The CRiteria Importance Through Intercriteria Correlation), Fuzzy FUCOM (Full Consistency Method), DEA (Data Envelopment Analysis), and Fuzzy MARCOS (Measurement Alternatives and Ranking according to the COmpromise Solution) methods for determining the level of traffic safety on road sections under the conditions of uncertainty. In order for the created model to be adequately applied, eight parameters were created, and they were classified through four inputs and four outputs. To calculate the significance of the inputs, the CRITIC method based on the symmetric correlation matrix was used, and taking into account the nature of the outputs, the Fuzzy FUCOM method based on averaged values using the fuzzy Bonferroni Mean (BM) operator was applied to determine their weights. To determine the degree of safety, the DEA model was created. After that, the Fuzzy MARCOS method was used in order to determine the final ranking of the remaining five sections of the road network. Finally, the verification of results was performed through three phases of Sensitivity Analysis (SA).

1. Introduction

Traffic safety and potential risk management is certainly one of the important goals in order to potentially achieve a safe, balanced, and sustainable performance of road transport. Considering current issues and the constant search for an increase in overall traffic safety, exploitation characteristics are taken into account in a large number of studies, and noteworthy models that contribute to the increase of traffic safety have been developed. Geometric road design on which road safety factors are based especially refers to the positioning of symmetric physical road elements, cost (efficiency) analysis, reduction of harmful impact on the environment, traffic volume, road accessibility, etc. A road with flexible physical elements can significantly obstruct traffic volume. In order to obtain accurate estimates of the effects of increased traffic volume, it is necessary to analyze all potential factors that contribute to the optimization of traffic flow volume. One of the important factors that affects traffic volume refers to curvature, i.e., the change of horizontal curve radius. Additionally, a significant impact on traffic is the impact of longitudinal gradient/fall, increased/decreased number of access points, increased/decreased road width, increased/decreased speed limit, etc. The increase in traffic volume entails a higher probability of traffic accidents on two-lane roads, but still the cause of accidents primarily depends on road geometry. Risk management on two-lane roads with the aim of protecting human lives represents a possible impact on reducing the number of traffic accidents. By analyzing potential causes of traffic accidents, the geometric characteristics of roads are especially emphasized. Influential geometric parameters refer to the density of access points, minimum radii of horizontal curvature [1], longitudinal gradients, as well as other primary parameters. In addition to geometric parameters, many studies relate to traffic indicators on two-lane roads. There are different conflicting opinions in the scientific community about the individual influence of geometric characteristics on traffic safety on two-lane roads.
Taking into account the relevance and great importance of the area which is the subject of the research, it is possible to define several goals of the study. The most important goal is to create a novel CRITIC-Fuzzy FUCOM-DEA-Fuzzy MARCOS model as a contribution to the overall field of multi-criteria decision-making. The next goal of the study is to determine the state of road traffic safety on the basis of exploitation parameters using the created integrated model. The last goal of the study refers to the integration of CRITIC-Fuzzy FUCOM methods as a partial model, which represents the integration of subjective-objective methods for determining the weights of inputs and outputs in the proposed model. All three goals describe the originality of the developed integrated model and its significance. The advantage of the developed integrated CRITIC-Fuzzy FUCOM-DEA-Fuzzy MARCOS model is the fact that through the multiphase model, each item is treated as an important and eliminated possibility of inadequate ranking compared to similar approaches as we stated further in the next section.
This research is divided into a total of six sections. In Section 2, a review of the situation in the field of road traffic safety is provided implying the use of various models and their impact on the mentioned field. Section 3 includes an overview of the research flow with detailed explanations in terms of methodology. The steps of the applied methods are given by defining a new extended linguistic scale for the evaluation of variant solutions when the criteria are of a cost type. After that, Section 4 consists of empirical research. At the beginning of the section, the created inputs and outputs are explained, then a detailed calculation of the integrated model is presented. In Section 5, a sensitivity analysis is created and divided into three parts: Checking the change in influence of the four most important criteria, comparative analysis with three MCDM methods in a fuzzy form, and changing the size of an initial matrix. Section 6 summarizes the contributions, results, and guidelines for continuing the research.

2. Literature Review

A large number of studies have analyzed the minimum radius of horizontal curvature as a negative influencing factor on potential possibilities of traffic accidents [2,3,4]. Based on the research in Connecticut on 655 road segments, each with a length of 1 km, without intersections and with control on major road approaches, variables that significantly affect the frequency of head-on crashes have been identified: Speed limit, sum of absolute change rate of horizontal curvature, maximum degree of horizontal curvature, and sum of absolute change rate of vertical curvature [5]. Based on the research conducted in Western Sweden, the statistical analysis has shown that road geometric characteristics have a significant impact on the accident ratio per million vehicle kilometer [6]. By the analysis of the report conducted in Texas [7], the regression analysis has found that the following variables affects the prediction of traffic accidents: Average Annual Daily Traffic (AADT), lane width, shoulder width, and section length. In addition, the research conducted on 12 rural two-lane roads in Egypt at locations that consisted of a tangent element and the succeeding horizontal curve was based on measuring vehicle flows at each study site. A capacity estimation based on extrapolation between the traffic flow and density was used in the study. The relationship between capacity loss and geometric characteristics is based on the minimum radius of the horizontal curve, as an independent variable [8]. Based on the research [9] conducted on two-lane roads in Valencia, it has been shown that traffic risk is particularly affected by access density, average sight distance, average speed limit, and the proportion of no-passing zones.
In laboratory conditions, the study was conducted on 36 drivers who participated in a driving simulator that tried to show the effect of three road configurations. The statistical analysis confirmed that the driver behavior was only affected by road-sections and geometric elements, but not the road configurations. Drivers do not change their behavior when barriers are not present [10]. An investigation [11] in southwest of Montana at 15.7 miles yielded results showing a link between accidents (sliding off the road) and a minimum radius of horizontal curvature, even a straight roadway at speeds above the posted speed limit, per the road design equation. Additionally, a higher accident rate was proven as a function of the difference between the free flow speed and the speed depending on the radius of the curvature. Based on a study [12] on rural two-lane roads, it has been determined that the impact on traffic accidents on such roads is influenced by section length, traffic volume, road width, lane width, pavement condition, average minimum radius of horizontal curve, and grades of vertical slopes. Moreover, the study has found that the reduction in the number of accidents due to different safety measures varies by crash severity type, highway class, level of deficiency on roads, and the extent to which the deficiency is addressed.
According to the conducted studies [4,13,14], the independent variable that influences the increase of traffic risk in the procedures of predicting traffic accidents on two-lane roads refers to the total traffic volume. Short-term effects of changes in traffic flow parameters (sudden short-term changes in traffic volume) can cause an increased frequency of traffic accidents. Moreover, refs. [2,3,14,15,16,17], the influence of the number of access points on traffic risk prediction is especially emphasized, where the probability of head-on crashes increases with the increase in density of access points. The analysis of the longitudinal gradient (rise/fall) on the possible prediction of traffic accidents on two-lane roads also showed the negative impact of this factor through one of 12 factors [18]. In addition, the study did not determine the direct dependence of visibility, wind speed, and temperature on the number of accidents.
DEA, MCDM models, and other techniques are often applied in the field of traffic safety, which is confirmed by the following studies. However, the question is to what extent such studies can provide precise output parameters, since they are most often based on individual approaches. Alper et al. [19] applied a model based on an individual DEA to determine the efficiency of 197 municipalities. The model consists of two inputs and 14 outputs that are unequally divided into two groups. The results showed that due to the weights of the input, it is possible for a more efficient municipality to be ranked lower. The advantage of the developed integrated CRITIC-Fuzzy FUCOM-DEA-Fuzzy MARCOS model is precisely the fact that through the multiphase model, each item is treated as an important and eliminated possibility of inadequate ranking. The importance of integrating and improving the DEA model is emphasized by the authors [20] that have performed research, in which the traffic safety efficiencies were estimated using the double frontier DEA to reflect both the optimistic and pessimistic points of view. Moreover, they noted that the results obtained by the conventional DEA are not entirely reliable considering only the efficient frontier. This research improves the disadvantages of such model due to involving a few different approaches in one functional model. Due to the shortcomings of the application of only the classical DEA, the authors [21] have performed a determination of the efficiency of 31 provinces using the two-phase DEA model.
The MCDM model based on the AHP method has been applied in [22] for a determination influence of traffic factor interaction on the rate of traffic accidents. In order to achieve an optimization of multi factors including geometry and traffic safety, in [23] the authors created a new MCDM-Multi-Objective Optimization (MOO) model to evaluate traffic and geometric elements. Moreover, the MCDM model was used in [24] as an improvement degree of traffic safety in a way that researchers have identified prioritized black spots. The PROMETHEE (Preference Ranking Organization METHod for Enrichment of Evaluations) method was used in [25] for the determination of urban road safety in Spain, while in [26] the authors used a novel approach for the assessment of pavement conditions. The study represents the MIVES model (The Integrated Value Model for Structural Assessment) [27], which includes the VF concept (Value Function) and AHP method. Moreover, MCDM methods such as fuzzy DEMATEL [28,29,30] can be used in the field of traffic safety. For example, in [31] the influence of cultural variables affecting traffic rules violation and causing traffic accidents have been investigated.
In the developed CRITIC-Fuzzy FUCOM-DEA-Fuzzy MARCOS model, four different approaches were applied, treating each of their advantages equally. In that way, a multi-phase functional model for assessing the condition of road sections from a traffic safety aspect was created.

3. Methodology

Figure 1 shows the research flow with the created methodology for calculating the road sections safety degree of the road network. The overall methodology consists of four phases, i.e., 17 steps. Each phase is causally linked with the next phase by presenting input parameters for the continuation of the model, i.e., the next phase.

3.1. The First Phase

The constant need to analyze and improve this area is the first phase of the research, which includes determining road sections where the research was conducted. The total number of road sections is nine: Doboj Novi-Doboj (Poljice), Doboj (Poljice)-Border of Republic of Srpska-Federation of Bosnia and Herzegovina (RS-FB&H), Doboj-Border of RS-FB&H (Karuše), Rudanka-Doboj, Johovac-Rudanka, Klupe-Teslić (Barići), Obodnik-Klupe, Šešlije-Johovac, and Teslić (Barići)-Border of RS-FB&H. Based on expert consultations and monitoring of similar studies, input and output parameters, a total of eight, were defined. As inputs, a list of four criteria was formed: Road section length expressed in kilometers, Average Number of Access Points per kilometer (AAP/km), AADT, and slope of the road. The outputs are: Average number of traffic accidents with fatalities, average number of traffic accidents with severely injured persons, average number of traffic accidents with slightly injured persons, and average number of traffic accidents with material damage. In addition, the database for traffic accidents in the last 5 years have been considered. All inputs belong to a benefit group since they need to be maximized, while the outputs have a cost character. Four input criteria were selected and used as available data of importance in the performed research. Moreover, it is possible to select a larger number of input criteria, which in this case, was not used due to technical-operational limitations and traffic characteristics on measuring road sections. The number of access points was determined by visual measurement on the measuring sections.

3.2. The Second Phase

During this phase of the research, weights are calculated and the significance of inputs and outputs is determined using two MCDM methods, subjective and objective: CRITIC [32,33] and fuzzy FUCOM [34]. Taking into account that the nature of inputs allows the application of an objective method for their determination, the CRITIC method is applied, while the Fuzzy FUCOM method based on averaged values using the fuzzy Bonferroni mean operator is applied to calculate output weights. The subjective method is applied to determine the weights of outputs, since their nature requires it. As the last step of this phase, the weights obtained by applying the two mentioned methods are averaged.

3.2.1. CRITIC Method

The CRITIC method for the purpose of this research can be described as follows.
Step 1. Development of the decision matrix including four inputs for traffic safety evaluation (X).
x i j = [ x 11 x 12 x 1 n x 21 x 22 x 2 n x m 1 x m 2 x m n ] i = 1 , 2 , , m ; j = 1 , 2 , , n
where (xij) represents the characteristics of ith alternative (road sections) on jth criterion.
Step 2. Normalization of the decision matrix:
r i j = x i j min i   x i j max i   x i j min i   x i j i f   j B
r i j = max i   x i j x i j max i   x i j min i   x i j i f   j C
Step 3: Determination of the symmetric linear correlation matrix (mij) of all inputs for traffic safety evaluation.
Step 4: Estimation of both Standard Deviations (SD) of the traffic safety inputs and its correlation with other traffic safety criteria. The weight of the jth criterion (wj) is obtained as follows:
W j = C j j = 1 n C j
where Cj is the amount of information contained in input j and is determined as follows:
C j = σ j = 1 n 1 m i j
where σ is the SD of jth criterion and is the correlation coefficient between the two criteria.

3.2.2. Fuzzy Bonferroni Mean (BM) Operator

Since five experts participated in the research, the values of the interval fuzzy vector of weight coefficients are aggregated using a fuzzy Bonferroni aggregator [35], Equation (6).
a ˜ i j = ( a i j l , a i j m , a i j u ) = { a i j l = ( 1 e ( e 1 ) i , j = 1 i j e a i l p a j l q ) 1 p + q a i j m = ( 1 e ( e 1 ) i , j = 1 i j e a i m p a j m q ) 1 p + q a i j u = ( 1 e ( e 1 ) i , j = 1 i j e a i u p a j u q ) 1 p + q
where e represents the number of experts, while p, q ≥ 0 are a set of non-negative numbers.

3.2.3. Fuzzy FUCOM Method (FUCOM-F)

The following section presents the FUCOM-F algorithm through four steps.
Step 1. Forming a set of criteria including four outputs for traffic safety evaluation.
Step 2. Determination the ranking of criteria based on experts’ preferences according to the importance of four outputs for traffic safety evaluation.
C j ( 1 ) > C j ( 2 ) > > C j ( k )
where k represents the rank of the last-ranked output.
Step 3. Comparisons of the outputs for traffic safety evaluation using triangular fuzzy numbers (TFNs) using a fuzzy linguistic scale. Since a specific significance of the outputs is defined for each expert, the application of the fuzzy Bonferroni aggregator results in an averaged significance of the outputs for traffic safety evaluation. Based on the averaged significance of the criteria, fuzzy comparative significance φ ˜ k / ( k + 1 ) is calculated by applying Expression (8):
φ ˜ k / ( k + 1 ) = ϖ ˜ C j ( k ) ϖ ˜ C j ( k + 1 ) = ( ϖ C j ( k ) l , ϖ C j ( k ) m , ϖ C j ( k ) u ) ( ϖ C j ( k + 1 ) l , ϖ C j ( k + 1 ) m , ϖ C j ( k + 1 ) u )
Therefore, a fuzzy vector of comparative significance of evaluation outputs for traffic safety evaluation is obtained, Expression (9):
Φ ˜ = ( φ ˜ 1 / 2 , φ ˜ 2 / 3 , , φ ˜ k / ( k + 1 ) )
where φ ˜ k / ( k + 1 ) represents the significance of the output of C j ( k ) rank as compared to the output of C j ( k + 1 ) rank.
Step 4. Calculation of the optimal fuzzy weights. In the fourth step, the final values of the fuzzy weight coefficients of the outputs for traffic safety evaluation ( w ˜ 1 , w ˜ 2 , , w ˜ n ) T are calculated. The final values of the weight coefficients should satisfy the conditions defined by Equations (10) and (11):
w ˜ k w ˜ k + 1 = φ ˜ k / ( k + 1 )
w ˜ k w ˜ k + 2 = φ ˜ k / ( k + 1 ) φ ˜ ( k + 1 ) / ( k + 2 )
φ k / ( k + 1 ) represents the comparative significance of the outputs for traffic safety evaluation C j ( k ) and C j ( k + 1 ) .
After that, it is necessary to calculate the values of the weight coefficients of the outputs for traffic safety evaluation ( w ˜ 1 , w ˜ 2 , , w ˜ n ) T which satisfy that | w ˜ k w ˜ k + 1 φ ˜ k / ( k + 1 ) | χ and | w ˜ k w ˜ k + 2 φ ˜ k / ( k + 1 ) φ ˜ ( k + 1 ) / ( k + 2 ) | χ , with the minimization of χ . Based on the previously mentioned steps, the final nonlinear model ( w ˜ 1 , w ˜ 2 , , w ˜ n ) T can be set.
min χ s . t . { | w ˜ k w ˜ k + 1 φ ˜ k / ( k + 1 ) | χ ,   j | w ˜ k w ˜ k + 2 φ ˜ k / ( k + 1 ) φ ˜ ( k + 1 ) / ( k + 2 ) | χ ,   j j = 1 n w ˜ j = 1 , w j l w j m w j u , w j l 0 ,   j j = 1 , 2 , , n
w ˜ j = ( w j l , w j m , w j u ) and φ ˜ k / ( k + 1 ) = ( φ k / ( k + 1 ) l , φ k / ( k + 1 ) m , φ k / ( k + 1 ) u ) .

3.2.4. Calculation of the Final Criteria Weights

This step involves dividing the criterion values calculated by using the CRITIC and Fuzzy FUCOM methods by two to obtain the final values of inputs and outputs with the sum of one.

3.3. The Third Phase

In this phase, it is necessary to apply the DEA model. Two models for determining the degree of traffic safety on the observed sections of the road are formed: Input oriented and output oriented models. Then, based on the obtained results, the alternatives with values greater than one are defined and eliminated from further calculation. In order to manage the safety of traffic, it is necessary to know the existing situation, which can include ranking dangerous sections of the road [36]. In order to perform the final ranking of the remaining sections of the road, the fuzzy MARCOS method is applied [37]. To apply the fuzzy MARCOS, the input and output values obtained using the methods described above are included. After applying the complete methodology, a list of road sections is created, starting from the safest to the riskiest one.

3.3.1. DEA Model

Here, the two DEA CCR models [38,39] formed consist of the input oriented inputs for traffic safety evaluation (max) and the output oriented model (min) outputs for traffic safety evaluation. The input oriented model is:
D E A i n p u t = max i = 1 m w i x i i n p u t i = 1 m w i x i j i = m + 1 m + s w i y i j 0 , j = 1 , , n i = m + 1 m + s w i y i o u t p u t = 1 w i 0 , i = 1 , , m + s
In this model, the Decision-Making Unit (DMU) consists of m inputs for each road section xij, while s represents outputs for each road section yij.
The output oriented model is:
D E A o u t p u t = min i = m + 1 m + s w i y i o u t p u t s t : ( i = 1 m w i x i j ) + i = m + 1 m + s w i y i j 0 , j = 1 , , n i = 1 m w i x i i n p u t = 1 w i 0 , i = 1 , , m + s
Finally, Equation (15) is applied to obtain the road sections that enter the final ranking model.
D E A s a f e t y = min   o u t p u t max   i n p u t

3.3.2. Fuzzy MARCOS Method

The fuzzy MARCOS method was developed by Stanković et al. [37] and consists of the steps shown in Figure 2.
Step 1. Creating an initial fuzzy decision matrix consists of eight criteria (inputs and outputs) and five road sections.
Step 2. Expanding the previous matrix with the Anti-Ideal Solution (AAI) and the Ideal Solution (AID), which denotes the worst and best performance of road sections:
A ˜ ( A I ) = min i   x ˜ i j i f   j   B a n d max i   x ˜ i j i f   j C
A ˜ ( I D ) = max i   x ˜ i j i f   j   B a n d min i   x ˜ i j i f   j C
Step 3. Normalizing the initial fuzzy decision matrix:
n ˜ i j = ( n i j l , n i j m , n i j u ) = ( x i d l x i j u , x i d l x i j m , x i d l x i j l ) i f   j   C
n ˜ i j = ( n i j l , n i j m , n i j u ) = ( x i j l x i d u , x i j m x i d u , x i j u x i d u ) i f   j   B
Step 4. Weighting the normalized decision matrix:
v ˜ i j = ( v i j l , v i j m , v i j u ) = n ˜ i j w ˜ j = ( n i j l × w j l , n i j m × w j m , n i j u × w j u )
Step 5. Calculation of the Si matrix:
S ˜ i = i = 1 n v ˜ i j
Step 6. Calculation of the degree of usefulness Ki for all road sections:
K ˜ i = S ˜ i S ˜ a i = ( s i l s a i u , s i m s a i m , s i u s a i l )
K ˜ i + = S ˜ i S ˜ i d = ( s i l s i d u , s i m s i d m , s i u s i d l )
Step 7. Calculation of the fuzzy matrix T ˜ i :
T ˜ i = t ˜ i = ( t i l , t i m , t i u ) = K ˜ i K ˜ i + = ( k i l + k i + l , k i m + k i + m , k i u + k i + u )
Determination of the fuzzy number D ˜ :
D ˜ = ( d l , d m , d u ) = max i   t ˜ i j
Step 8. Defuzzification of fuzzy numbers:
d f c r i s p = l + 4 m + u 6
Step 9. Determination of the utility functions f ( K ˜ i ) for all road sections:
f ( K ˜ i + ) = K ˜ i d f c r i s p = ( k i l d f c r i s p , k i m d f c r i s p , k i u d f c r i s p )
f ( K ˜ i ) = K ˜ i + d f c r i s p = ( k i + l d f c r i s p , k i + m d f c r i s p , k i + u d f c r i s p )
Step 10. Calculation of the final utility function for all road sections:
f ( K i ) = K i + + K i 1 + 1 f ( K i + ) f ( K i + ) + 1 f ( K i ) f ( K i ) ;
Step 11. Ranking road sections.

3.4. The Fourth Phase

In the fourth phase of the created methodology, SA is performed in three parts. The first refers to checking the change in the significance of inputs and outputs:
W n β = ( 1 W n α ) W β ( 1 W n )
where W ˜ n α represents the reduced value of the criterion whose weight changes, W ˜ β represents the original value of the criterion under consideration, while W ˜ n denotes the original value of the criterion whose value increases. Then, a comparative analysis is done with three other MCDM methods: Fuzzy WASPAS [40], Fuzzy SAW [41], and Fuzzy TOPSIS [42]. At the end of checking the results, a calculation with a change in the size of the initial matrix is performed. Scenarios in which the worst ranked alternative is eliminated from the initial matrix are formed.

4. Case Study

4.1. Defining Input-Output Parameters

Based on expert consultations and monitoring of similar studies, input and output parameters, a total of eight, were defined as explained in Section 3.1. Table 1 shows the values of all DMUs according to the input parameters.
Table 2 shows the values of all DMUs in relation to the output parameters.

4.2. Analysis of the State of Road Sections

The total number of road sections is nine: Doboj Novi-Doboj (Poljice)—DMU1, Doboj (Poljice)-Border of RS-FB&H—DMU2, Doboj-Border of RS-FB&H (Karuše)—DMU3, Rudanka-Doboj—DMU4, Johovac-Rudanka—DMU5, Klupe-Teslić (Barići)—DMU6, Obodnik-Klupe—DMU7, Šešlije-Johovac—DMU8, and Teslić (Barići)-Border of RS-FB&H—DMU9.
Figure 3 shows the length and arithmetic mean of the number of access points of the previously stated nine measuring sections of two-lane roads. The two-lane road, Obodnik-Klupe, has the largest section length (20.13 km), and the first section, Doboj Novi-Doboj (Poljice), has the smallest with a length of 1.47 km. The average number of access points is particularly evident on the Rudanka-Doboj section and is 35.39 AAP/km. The section with the most part passes through the settlement. Doboj Novi-Doboj (Poljice) has the lowest average number of access points per km, which is 5.63.
Figure 4 shows AADT for the period from 2010 to 2015, and it can be seen that there are no significant deviations in the values of AADT in that period. A slight increase in AADT, which is higher than 4.0% per year, can be noticed on the Šešlije-Johovac section in some years.
Figure 5 shows the overview of arithmetic means of the rise/fall (gradient) of the sections. Since the Obodnik-Klupe section stands out, by its length, it can be classified in the category of mountain sections of two-lane roads with an average gradient of over 1.0%. Some sections, despite the markedly large gradient that exceeds the value of 0.5%, do not have a significant length and cannot be classified as mountain sections. Typical plain sections are Šešlije-Johovac and Johovac-Rudanka.
Figure 6 shows the total number of traffic accidents by type of accidents, with the DMU4—Rudanka-Doboj section standing out negatively, since there were also accidents with fatalities in the period from 2015 to 2019. On average, one person is killed per year on that section. When observing the stated time period, the number of traffic accidents with fatalities is 1, 2, 1, 1, and 0, respectively. This location, i.e., the road section also stands out for the total number of traffic accidents, which is 258, where five are with fatalities, 17 with severe injuries, 51 with minor injuries, and 185 with material damage. When it comes to DMU1, DMU2, DMU8, and DMU9, it is important to point out that there were no accidents with fatalities.
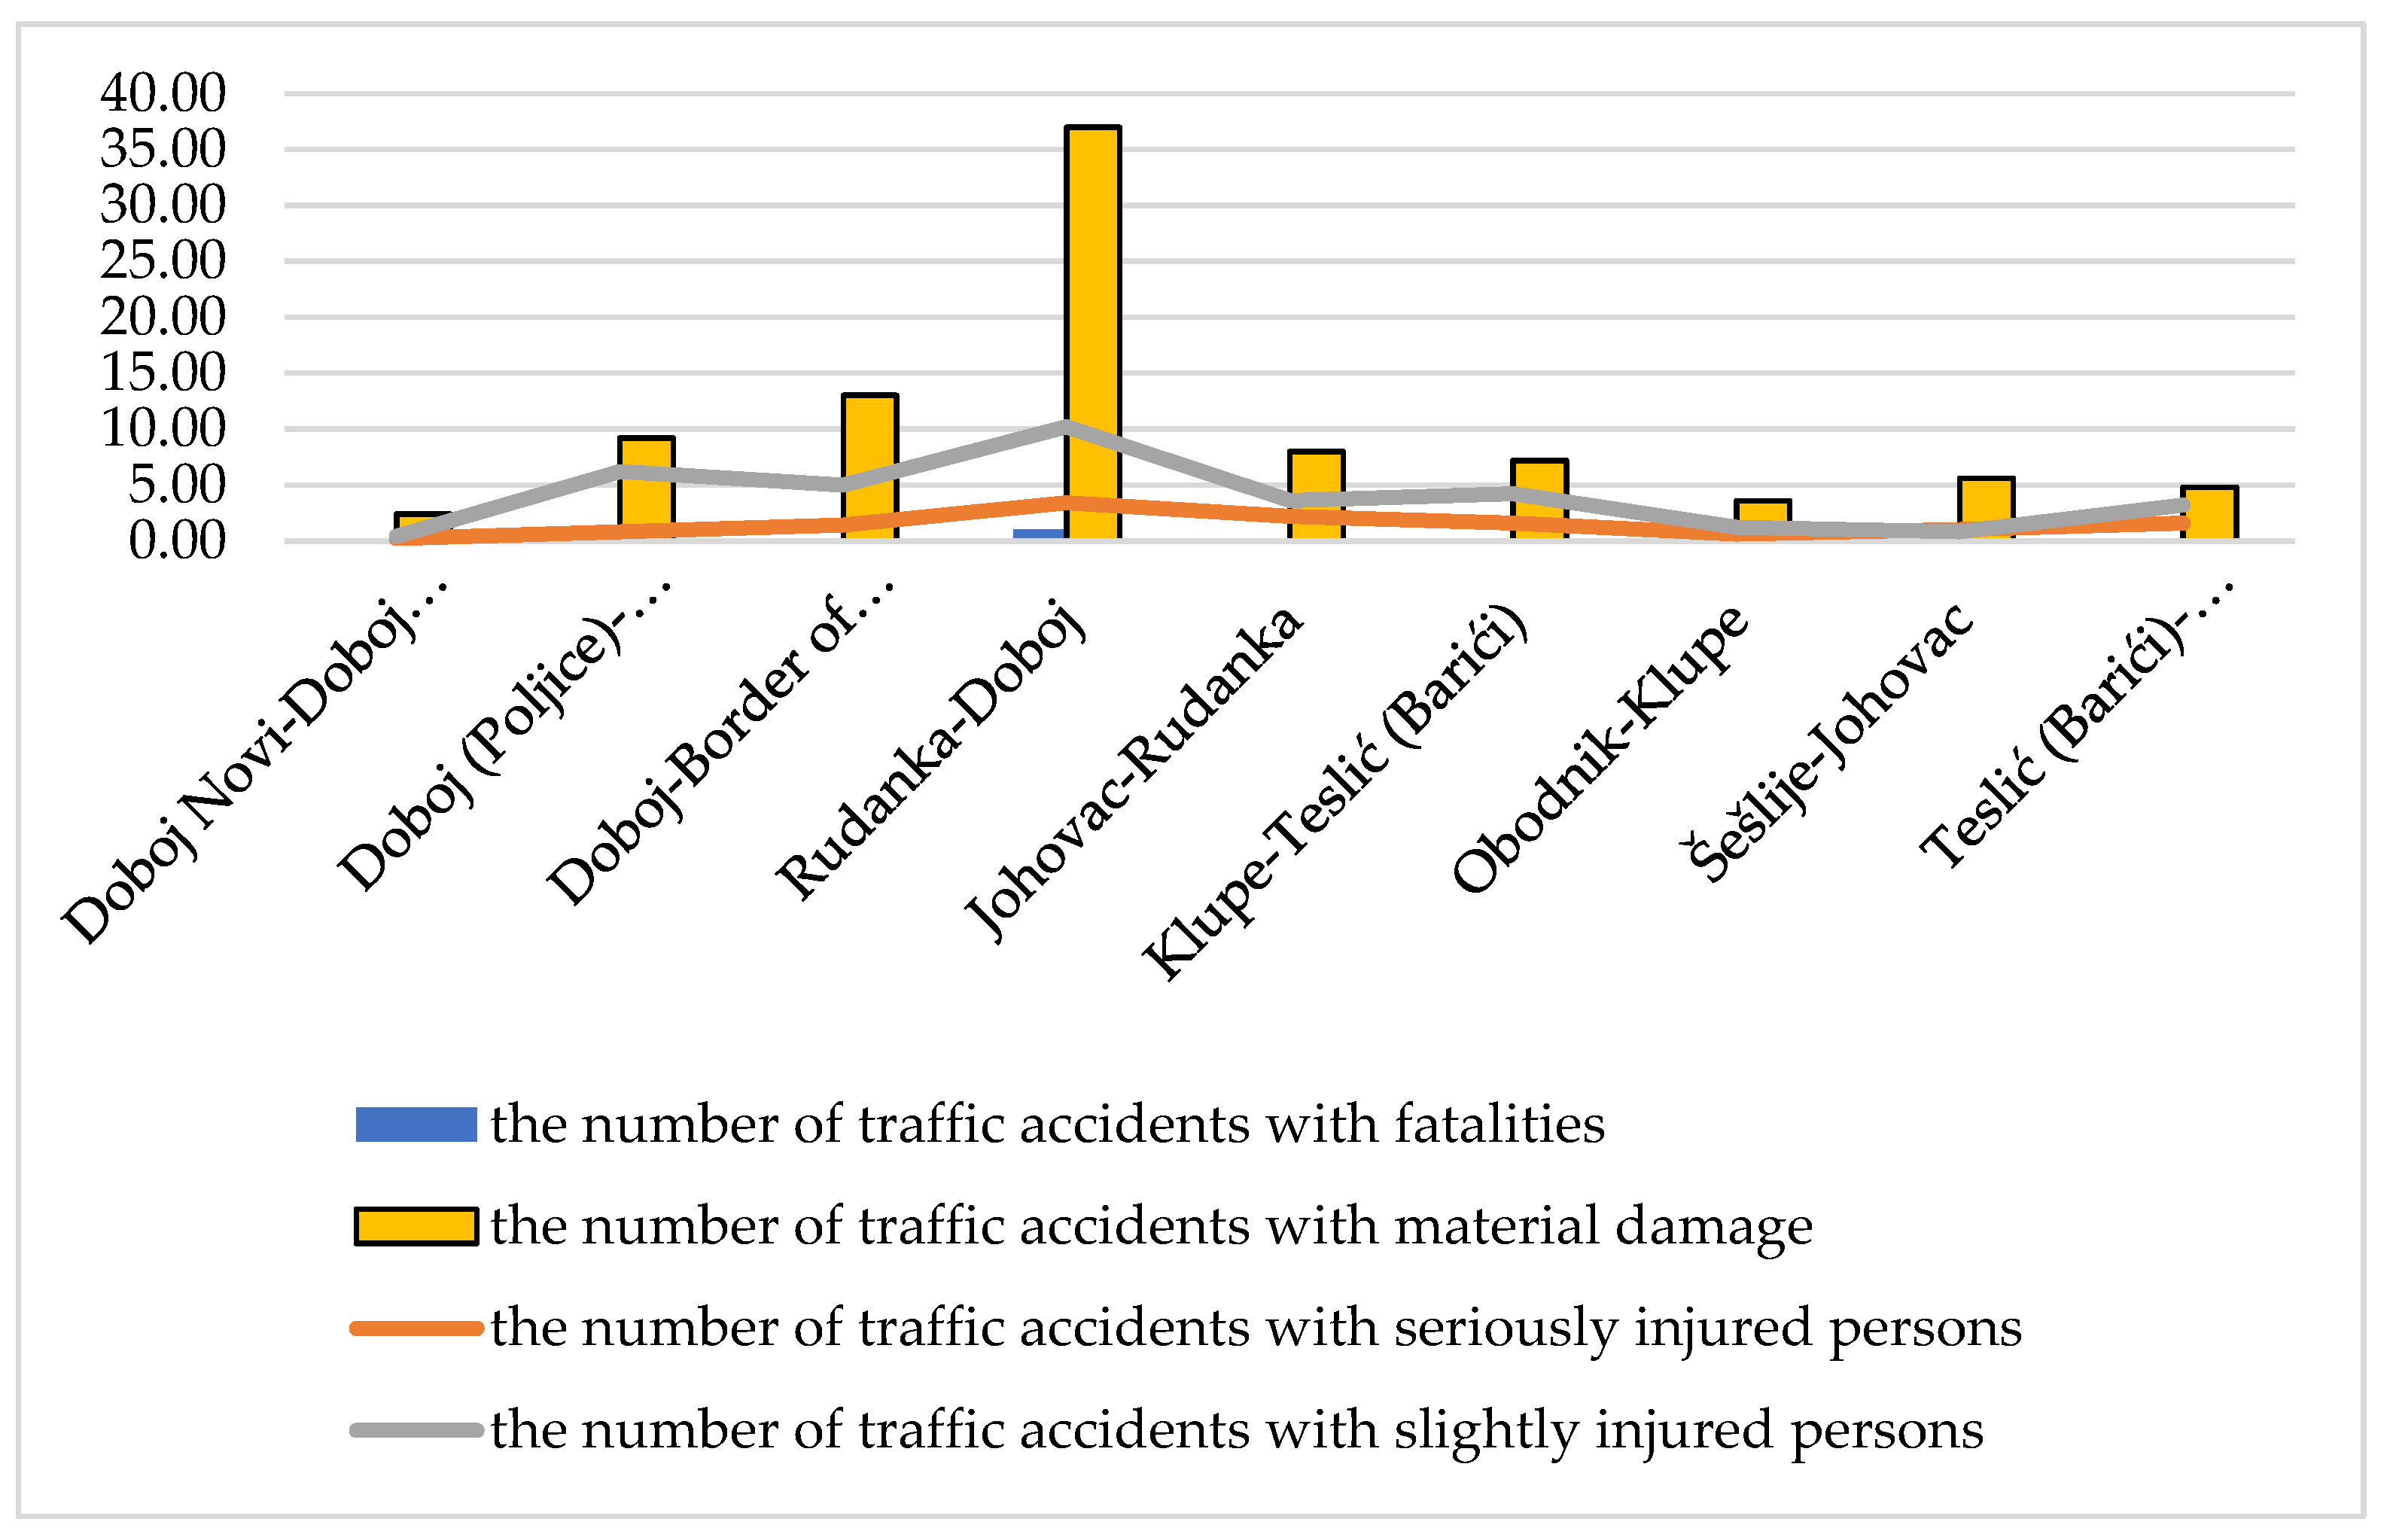
Figure 7 shows the average number of traffic accidents in the period from 2015 to 2019 by the type of accidents and specified sections. These indicators of the number of accidents per year were analyzed and used in further data synthesis. It is clearly noticeable that DMU4 stands out in terms of the number of traffic accidents by all types.

4.3. Calculating the Criteria Weight

The calculation of input and output weights using CRITIC and Fuzzy FUCOM methods is presented below.

4.3.1. Calculation of Input Weights Using the CRITIC Method

Step 1. Development of the decision matrix X is included in Table 3.
Step 2. Table 4 shows the normalization of the initial matrix.
All inputs belong to a benefit group, therefore, normalization is calculated using Equation (2), for example:
x 21 = 2.95 1.47 20.13 1.47 = 0.079 , x 16 = 16.73 1.47 20.13 1.47 = 0.818 ,
Step 3. The symmetric linear correlation matrix mij is shown in Table 5.
Step 4. In this step, objective criteria weights are obtained (Table 6).
In order to integrate these values with the output values, it is necessary to divide the specified values by two and obtain the final input values:
w 1 = 0.121 , w 2 = 0.099 , w 3 = 0.143 , w 4 = 0.137
According to the obtained results, it can be noticed that the most important input is AADT with the value of 0.143. It can also be noticed that all input values are in a small range, i.e., slightly higher compared to those less significant, which means that there is no input with a significantly higher advantage than others.

4.3.2. Determining the Significance of Outputs Using the Fuzzy FUCOM Method

After defining the criteria, in the second step, their ranking is performed. The criteria are ranked according to the following: Traffic accidents with fatalities (O1) > Traffic accidents with severe injuries (O2) > Traffic accidents with minor injuries (O3) > Traffic accidents with material damage (O4). In the next step (Step 3), based on decision makers’ preferences, the significance of the criteria for each expert is defined (Table 7). It is important to note that each of the five experts has at least 15 years of experience in science and practice. All were previously included in the performing professional studies from this field and wrote scientific papers and reports.
By applying the fuzzy Bonferroni operator, the averaged values of the criteria are obtained. Therefore, for the O2 criterion, we obtain the aggregate significance, as follows:
B M p = 1 , q = 1 { ( 1 , 1.1 , 1.35 ) , ( 1 , 1.15 , 2.3 ) , ( 1 , 1.05 , 1.15 ) , ( 1.1 , 1.25 , 1.35 ) } = { ϖ C 2 ( 2 ) l = ( 1 4 ( 4 1 ) i , j = 1 i j 4 ϖ C 2 ( 2 ) i l p ϖ C 2 ( 2 ) j l q ) 1 1 + 1 = ( 1 12 ( 1 1 · 1 1 + 1 1 · 1 1 + 1 1 · 1 1 + + 1.1 1 · 1 1 ) ) 1 1 + 1 = 1.02 ϖ C 2 ( 2 ) m = ( 1 4 ( 4 1 ) i , j = 1 i j 4 ϖ C 2 ( 2 ) i m p ϖ C 2 ( 2 ) j m q ) 1 1 + 1 = ( 1 12 ( 1.1 1 · 1.15 1 + 1.1 1 · 1.05 1 + 1.1 1 · 1.25 1 + 1.15 1 · 1.1 1 + 1.15 1 · 1.05 1 + + 1.25 1 · 1.05 1 ) ) 1 1 + 1 = 1.14 ϖ C 2 ( 2 ) u = ( 1 4 ( 4 1 ) i , j = 1 i j 4 ϖ C 2 ( 2 ) i u p ϖ C 2 ( 2 ) j u q ) 1 1 + 1 = ( 1 12 ( 1.35 1 · 2.3 1 + 1.35 1 · 1.15 1 + 1.35 1 · 1.35 1 + 2.3 1 · 1.35 1 + 2.3 1 · 1.15 1 + + 1.35 1 · 1.15 1 ) ) 1 1 + 1 = 1.47
Therefore, we obtain the aggregate significance of the criteria (Table 8).
By applying Expression (9), the comparative significance of the criteria is defined:
φ ˜ C 1 / C 2 = ϖ ˜ C 2 / ϖ ˜ C 1 = ( 1.02 , 1.14 , 1.47 ) / ( 1.00 , 1.00 , 1.00 ) = ( 1.02 , 1.14 , 1.47 ) φ ˜ C 2 / C 3 = ϖ ˜ C 3 / ϖ ˜ C 2 = ( 1.09 , 1.29 , 1.47 ) / ( 1.02 , 1.14 , 1.47 ) = ( 0.743 , 1.131 , 1.44 ) φ ˜ C 3 / C 4 = ϖ ˜ C 4 / ϖ ˜ C 3 = ( 1.55 , 1.79 , 1.99 ) / ( 1.09 , 1.29 , 1.47 ) = ( 1.053 , 1.387 , 1.836 )
Based on the vector of comparative significance, the limitations of the model are defined (12). By applying Expression (10), we define the first group of constraints: w ˜ C 1 / w ˜ C 2 = ( 1.02 , 1.14 , 1.465 ) , w ˜ C 2 / w ˜ C 3 = ( 0.743 , 1.131 , 1.44 ) , and w ˜ C 3 / w ˜ C 4 = ( 1.053 , 1.387 , 1.836 ) . Based on Expression (11), the constraint arising from the condition of transitivity of relations w ˜ C 1 / w ˜ C 3 = ( 0.757 , 1.289 , 2.11 ) and w ˜ C 2 / w ˜ C 4 = ( 0.782 , 1.569 , 2.644 ) is defined. Based on the defined constraints, a model (12) is formed to determine the fuzzy optimal values of weight coefficients.
min χ s . t . { ( w 1 l w 2 u 1.02 ) χ ; ( w 1 m w 2 m 1.14 ) χ ; ( w 1 u w 2 l 1.47 ) χ ; ( w 2 l w 3 u 0.74 ) χ ; ( w 2 m w 3 m 1.13 ) χ ; ( w 2 u w 3 l 1.44 ) χ ; ( w 3 l w 4 u 1.05 ) χ ; ( w 3 m w 4 m 1.39 ) χ ; ( w 3 u w 4 l 1.84 ) χ ; ( w 1 l w 3 u 0.76 ) χ ; ( w 1 m w 3 m 1.29 ) χ ; ( w 1 u w 3 l 2.11 ) χ ; ( w 2 l w 4 u 0.78 ) χ ; ( w 2 m w 4 m 1.29 ) χ ; ( w 2 u w 4 l 2.64 ) χ ; ( w 1 l + 4 · w 1 m + w 1 u ) / 6 + ( w 2 l + 4 · w 2 m + w 2 u ) / 6 + ( w 3 l + 4 · w 3 m + w 3 u ) / 6 + ( w 4 l + 4 · w 4 m + w 4 u ) / 6 = 1 ; w 1 l w 1 m w 1 u ; w 2 l w 2 m w 2 u ; w 3 l w 3 m w 3 u ; w 4 l w 4 m w 4 u ; w 1 l , w 2 l , w 3 l , w 4 l 0 .
By solving the model, the optimal values of fuzzy weight coefficients w ˜ j = ( ( 0.284 , 0.323 , 0.404 ) , ( 0.241 , 0.241 , 0.35 ) , ( 0.212 , 0.216 , 0.294 ) , ( 0.144 , 0.176 , 0.244 ) ) T and χ = 0.20 are obtained. The Lingo 17.0 software has been used to solve the presented model. By applying defuzzification, the following crisp values are obtained:
w 1 = 0.330 , w 2 = 0.259 , w 3 = 0.228 , w 4 = 0.182
To determine the final weight values of outputs, the values are divided by two which are further implemented in the model, and they are O 1 = 0.165 , O 2 = 0.130 , O 3 = 0.114 , O 4 = 0.091 .

4.4. Application of the DEA Model

In the following part of the study, two DEA models are presented: Input and output oriented models in order to define sections of two-lane roads, i.e., DMUs which have in some way a satisfactory level of safety, and then they are included in a model of final ranking using the fuzzy MARCOS method. The formed algorithms of linear programming are solved by applying the Lingo 17 software. The following is an example of an oriented model using Equation (13) for the Doboj Novi-Doboj (Poljice) road section.
D E A i n p u t D o b o j   N o v i D o b o j   ( P o l j i c e ) = MAX = 1.47 * w 1 + 5.63 * w 2 + 10350.67 * w 3 + 0.771 * w 4 ; 1.47 * w 1 + 5.63 * w 2 + 10350.67 * w 3 + 0.771 * w 4 ( 0 * w 5 + 0.20 * w 6 + 0.40 * w 7 + 2.4 * w 8 ) < = 0 ; 2.95 * w 1 + 10.33 * w 2 + 7529.5 * w 3 + 0.829 * w 4 ( 0 * w 5 + 0.80 * w 6 + 6.20 * w 7 + 9.20 * w 8 ) < = 0 ; 3.52 * w 1 + 12.50 * w 2 + 13982.33 * w 3 + 0.235 * w 4 ( 0.20 * w 5 + 1.40 * w 6 + 5 * w 7 + 13 * w 8 ) < = 0 ; 7.41 * w 1 + 35.39 * w 2 + 13191.33 * w 3 + 0.503 * w 4 ( 1 * w 5 + 3.4 * w 6 + 10.2 * w 7 + 37 * w 8 ) < = 0 ; 6.85 * w 1 + 19.12 * w 2 + 8090.83 * w 3 + 0.145 * w 4 ( 0.2 * w 5 + 2.20 * w 6 + 3.60 * w 7 + 8 * w 8 ) < = 0 ; 16.73 * w 1 + 21.31 * w 2 + 6244.5 * w 3 + 0.73 * w 4 ( 0.2 * w 5 + 1.6 * w 6 + 4.2 * w 7 + 7.2 * w 8 ) < = 0 ; 20.13 * w 1 + 9.46 * w 2 + 3899.5 * w 3 + 1.04 * w 4 ( 0.4 * w 5 + 0.60 * w 6 + 1.2 * w 7 + 3.6 * w 8 ) < = 0 ; 4.70 * w 1 + 10 * w 2 + 7749.5 * w 3 + 0.191 * w 4 ( 0 * w 5 + 1 * w 6 + 0.80 * w 7 + 5.6 * w 8 ) < = 0 ; 6.65 * w 1 + 20.29 * w 2 + 8668.5 * w 3 + 0.415 * w 4 ( 0 * w 5 + 1.60 * w 6 + 3.20 * w 7 + 4.8 * w 8 ) < = 0 ; 0 * w 5 + 0.20 * w 6 + 0.40 * w 7 + 2.4 * w 8 = 1 ; w 1 > 0 ; w 2 > 0 ; w 3 > 0 ; w 4 > 0 ; w 5 > 0 ; w 6 > 0 ; w 7 > 0 ; w 8 > 0 ;
The obtained results show that the objective function is equal to 1.000.
After that, the overview of the output oriented model Doboj (Poljice)-Border of RS-FB&H is given using Equation (14):
D E A o u t p u t D o b o j   ( P o l j i c e ) G r a n i c a   R S F B i H = MIN = 0 * w 5 + 0.80 * w 6 + 6.20 * w 7 + 9.20 * w 8 ; 1.47 * w 1 5.63 * w 2 10350.67 * w 3 0.771 * w 4 + ( 0 * w 5 + 0.20 * w 6 + 0.40 * w 7 + 2.4 * w 8 ) > = 0 ; 2.95 * w 1 10.33 * w 2 7529.5 * w 3 0.829 * w 4 + ( 0 * w 5 + 0.80 * w 6 + 6.20 * w 7 + 9.20 * w 8 ) > = 0 ; 3.52 * w 1 12.50 * w 2 13982.33 * w 3 0.235 * w 4 + ( 0.20 * w 5 + 1.40 * w 6 + 5 * w 7 + 13 * w 8 ) > = 0 ; 7.41 * w 1 35.39 * w 2 13191.33 * w 3 0.503 * w 4 + ( 1 * w 5 + 3.4 * w 6 + 10.2 * w 7 + 37 * w 8 ) > = 0 ; 6.85 * w 1 19.12 * w 2 8090.83 * w 3 0.145 * w 4 + ( 0.2 * w 5 + 2.20 * w 6 + 3.60 * w 7 + 8 * w 8 ) > = 0 ; 16.73 * w 1 21.31 * w 2 6244.5 * w 3 0.73 * w 4 + ( 0.2 * w 5 + 1.6 * w 6 + 4.2 * w 7 + 7.2 * w 8 ) > = 0 ; 20.13 * w 1 9.46 * w 2 3899.5 * w 3 1.04 * w 4 + ( 0.4 * w 5 + 0.60 * w 6 + 1.2 * w 7 + 3.6 * w 8 ) > = 0 ; 4.70 * w 1 10 * w 2 7749.5 * w 3 0.191 * w 4 + ( 0 * w 5 + 1 * w 6 + 0.80 * w 7 + 5.6 * w 8 ) > = 0 ; 6.65 * w 1 20.29 * w 2 8668.5 * w 3 0.415 * w 4 + ( 0 * w 5 + 1.60 * w 6 + 3.20 * w 7 + 4.8 * w 8 ) > = 0 ; 2.95 * w 1 + 10.33 * w 2 + 7529.5 * w 3 + 0.829 * w 4 = 1 ; w 1 > 0 ; w 2 > 0 ; w 3 > 0 ; w 4 > 0 ; w 5 > 0 ; w 6 > 0 ; w 7 > 0 ; w 8 > 0 ;
When the established model is solved, the objective function is equal to 1.945.
The algorithms of other sections of two-lane roads are solved in the same way and the results of the DEA model are shown in Table 9. The results in DEA are obtained by applying Equation (15).
The following sections of two-lane roads: DMU2 (3.784), DMU3 (6.916), DMU4 (6.348), DMU5 (2.023) are sections which are further eliminated from the model due to poor performance in terms of traffic safety. It is necessary to make certain corrective measures on them in order to improve traffic safety. Sections of two-lane roads with a value of 1.000 are included in the next part of the DMU1, DMU6, DMU7, DMU8, and DMU9 models.

4.5. Application of Fuzzy MARCOS Method for Final Ranking of Road Sections

Based on the results of the DEA model shown in Table 9, it is determined which DMUs are excluded from further calculation: DMU2, DMU3, DMU4, and DMU5, while the remaining DMUs are relatively safe road sections. In order to determine the final ranking of DMUs, the fuzzy MARCOS method is applied. Table 10 shows the data for the remaining DMUs which are included further into the model and on the basis of which the mentioned method is applied.
Since only the scale for beneficial criteria was developed in the original fuzzy MARCOS method, the fuzzy linguistic scale for cost criteria has been extended in this paper, which is shown in Table 11.
Applying the scale, DMUs are evaluated according to inputs and outputs, which is shown in Table 12. The first part of the table presents linguistic variables, while the lower part of the list shows the evaluation of DMUs based on triangular fuzzy numbers.
After the evaluation using a linguistic scale and transformation into triangular fuzzy numbers by applying Equation (16), the Anti-Ideal Solution (AAI) is defined, i.e., the ideal solution by applying Equation (17), which makes an extended initial decision matrix. After that, the normalization shown in Table 13 is performed.
Normalization of the extended fuzzy initial matrix is performed by applying Equation (18) since all criteria in this part of the paper are of the minimization type, i.e., they belong to a cost group. An example of normalization is:
n ˜ 61 = ( 1.000 5.000 , 1.000 3.000 , 1.000 3.000 ) = ( 0.200 , 0.333 , 0.333 ) ,   n ˜ 13 = ( 1.000 7.000 , 3.000 5.000 , 3.000 5.000 ) = ( 0.143 , 0.200 , 0.200 )
Weighting the fuzzy normalized matrix (Table 14) is done based on Equation (20) as follows:
v ˜ 11 = ( n 11 l × w 1 l , n 11 m × w 1 m , n 11 u × w 1 u ) = ( 1.000 × 0.121 , 1.000 × 0.121 , 1.000 × 0.121 ) = ( 0.121 , 0.121 , 0.121 )
The fuzzy matrix S ˜ i is obtained by applying Equation (21):
S ˜ a i = ( 0.200 , 0.242 , 0.393 ) S ˜ 1 = ( 0.545 , 0.690 , 0.794 ) S ˜ 6 = ( 0.216 , 0.564 , 0.430 ) S ˜ 7 = ( 0.291 , 0.460 , 0.810 ) S ˜ 8 = ,   ( 0.395 , 0.726 , 0.757 ) S ˜ 9 = ( 0.361 , 0.388 , 0.602 ) S ˜ i d = ( 0.590 , 0.905 , 1.000 )
as follows:
S ˜ 1 = ( 0.121 + 0.099 + 0.020 + 0.027 + 0.165 + 0.043 + 0.038 + 0.030 ) = ( 0.545 , 0.776 , 0.794 )
Using Equation (2), the matrix K ˜ i is obtained as follows:
k ˜ 1 = ( 1.386 , 3.454 , 3.964 ) k ˜ 6 = ( 0.551 , 1.664 , 2.147 ) k ˜ 7 = ( 0.741 , 1.661 , 4.041 ) k ˜ 8 = ( 1.005 , 3.232 , 3.780 ) k ˜ 9 = ( 0.918 , 1.727 , 3.005 )
k ˜ 1 = S ˜ 1 S ˜ a i = ( s 1 l s a i u , s 1 m s a i m , s 1 u s a i l ) = ( 0.545 0.393 , 0.776 0.225 , 0.794 0.200 ) = ( 1.386 , 3.454 , 3.964 )
Using Equation (23), the matrix K ˜ i + is obtained:
k ˜ 1 + = ( 0.545 , 0.858 , 1.346 ) , k ˜ 6 + = ( 0.216 , 0.413 , 1.729 ) k ˜ 7 + = ( 0.291 , 0.413 , 1.372 ) , k ˜ 8 + = ( 0.395 , 0.803 , 1.283 ) k ˜ 9 + = ( 0.361 , 0.429 , 1.020 )
as follows:
k ˜ 1 + = S ˜ 1 S ˜ i d = ( s 1 l s i d u , s 1 m s i d m , s 1 u s i d l ) = ( 0.545 1.000 , 0.776 0.905 , 0.794 0.590 ) = ( 0.545 , 0.858 , 1.346 )
The matrix T ˜ i is calculated using Equation (24):
t ˜ 1 = ( 1.931 , 4.312 , 5.310 ) , t ˜ 8 = ( 1.400 , 4.034 , 5.064 ) , t ˜ 6 = ( 0.767 , 2.077 , 2.876 ) , t ˜ 9 = ( 1.279 , 2.157 , 4.026 ) , t ˜ 7 = ( 1.032 , 2.073 , 5.413 ) ,
in the following way:
t ˜ 1 = ( 1.386 + 0.545 , 3.454 + 0.858 , 3.964 + 1.346 ) = ( 1.931 , 4.312 , 5.310 )
After that, a fuzzy number D ˜ = ( 1.931 , 4.312 , 5.413 ) is calculated using Equation D ˜ = ( d l , d m , d u ) = max i   t ˜ i j . Defuzzification is done by expression d f c r i s p = l + 4 m + u 6 obtaining the number d f c r i s p = 4.099 . Final results calculated using the fuzzy MARCOS method are shown in Table 15.
Utility functions f ( K ˜ i + ) and f ( K ˜ i ) are calculated applying Equations (27) and (28):
f ( K ˜ 1 + ) = K ˜ 1 d f c r i s p = ( 1.386 4.099 , 3.454 4.099 , 3.964 4.099 ) f ( K ˜ 1 ) = K ˜ 1 + d f c r i s p = ( 0.545 4.099 , 0.858 4.099 , 1.346 4.099 )
Then, defuzzification for K ˜ i , K ˜ i + , f ( K ˜ i + ) , f ( K ˜ i ) is performed (Table 15). Calculation of the utility function of alternatives f K i is obtained using Equation (29):
f ( K 1 ) = K 1 + + K 1 1 + 1 f ( K 1 + ) f ( K 1 + ) + 1 f ( K 1 ) f ( K 1 ) = 0.887 + 3.194 1 + 1 0.779 0.779 + 1 0.216 0.216 = 0.832
As the last step of the applied methodology, the final ranking of DMUs according to the descending sequence is performed.
After the application of the overall integrated CRITIC-Fuzzy FUCOM-DEA-Fuzzy MARCOS model, it can be noticed that the first section of two-lane roads with a value of 0.832 shows the highest level of traffic safety in terms of certain road network exploitation indicators. The second in a row is the eighth section, DMU8, with a value of 0.695, while the other three sections, DMU7, DMU9, and DMU6, have significantly lower values, which means that they are riskier for traffic participants.

5. Sensitivity Analysis

5.1. Checking the Change in the Weights of the Criteria

In this part of the paper, the influence of the change in the weight values of the criteria is checked. Their change, especially when it comes to the most important parameters, can play a great role in the final ranking [43,44]. Therefore, a total of 24 scenarios were formed in which the values of the four most significant criteria were reduced by applying Equation (30). In the first six scenarios, the values of the most significant criterion (O1) were reduced, and in scenarios S7–S12, the values of the O2 output were reduced. Further, in scenarios S13–S18, the reduced weights of input I3 were simulated, and in scenarios S19–S24, of input I4. It is important to note that the weight values of the mentioned criteria were reduced in the range of 15%–90%. The values of the criterion weights through new 24 scenarios are shown in Table 16.
After forming the scenarios, the calculation starts again with the fuzzy MARCOS method and the new results (ranks) for each scenario are presented in Figure 8.
From Figure 8, it can be stated that the model is slightly sensitive when new values of criterion weights are formed. This is the situation in four scenarios out of a total of 24, which is, in percentage, a change of 17%. In scenario S11, the first change in the ranks of DMUs occurs when the first-placed and second-placed alternatives change their positions. In the twelfth scenario, there is the same change with additional mutually changing positions of DMU7 and DMU9. The cause of the changes is the reduction of the second output as a criterion by 75%, i.e., 90%. Two other rank changes occur in scenarios S17 and S18 when DMU7 and DMU9 change their positions, which is a consequence of the change of the third input by 75% and 90%. In other scenarios, DMUs retain their initial rank.

5.2. Comparison With Other MCDM Methods

The following, i.e., Figure 9, presents the results of the comparative analysis of the proposed integrated model with three methods in a fuzzy form: fuzzy SAW (FSAW), fuzzy WASPAS (FWASPAS), and fuzzy TOPSIS (FTOPSIS).
Observing Figure 9, it can be seen that there is no change in the ranks compared to the initial rank, regardless of the applied method. Since it is the case, Figure 9 also shows the final values of each DMU after applying the comparative analysis. The values obtained with the fuzzy MARCOS method are in a larger range (0.180–0.832) compared to FSAW (0.357–0.741), FWASPAS (0.224–0.567), and FTOPSIS (0.259–0.786), which is another advantage of the proposed model.

5.3. Influence of Dynamic Initial Matrix Formation

Figure 10 shows the results in relation to the change in the size of the initial matrix. Observing the initial rank obtained by the fuzzy MARCOS method, the worst-ranked alternative was eliminated and calculation was performed with a 4 × 8 matrix. In each subsequent set, the worst alternative was eliminated, so the size of the initial matrix decreased.
From Figure 10, it can be concluded that changes in the size of the initial matrix do not play any role, since the ranks are the same compared to the initial rank regarding all DMUs that enter the initial matrix. In addition, Figure 10 shows the values of the final results on the left side, so that the constancy of the previously obtained results can be observed.
After the conducted sensitivity analysis, in which results were verified through the three phases: New values of criterion weights through 24 scenarios, a comparative analysis with other methods, and an analysis of the change in the size of the initial matrix, it can be concluded that the model has good performance. Only the first phase showed slight sensitivity when changing the significance of particular criteria by 75% or 90%, while, in the remaining two phases, the stability of the original results was maintained. One of the advantages of the developed integrated CRITIC-Fuzzy FUCOM-DEA-Fuzzy MARCOS approach is the fact that the model eliminated the possibility of inadequate ranking compared to similar approaches, for example, compared to DEA which was proven in the second part of the paper. The obtained results can have great significance in the planning and construction of traffic infrastructure due to the help of DMs to take into account these performances as inputs in such analyzes.

6. Conclusions

In this paper, a new integrated model that includes different methods for both the subjective and objective evaluation has been created. In addition, integration with the DEA model and methods in a fuzzy form was performed. The model was created with the aim of determining the level of traffic safety on sections of two-lane roads of the road network in Bosnia and Herzegovina. By determining the level of traffic safety, it is necessary to establish sustainability in the performance of the system. The development of such a model is the main contribution to the field of traffic safety, but also to the problems of decision theory. After the first phase in which four inputs and four outputs were defined, for nine sections of two-lane roads, their quantitative values were determined. Recognizing the complexity of the research area, a set of methods was applied: CRITIC, Fuzzy FUCOM, DEA, Fuzzy MARCOS, forming an integrated model. In addition, the Fuzzy Bonferroni operator was applied to average the values representing the input parameters in the fuzzy FUCOM method. The objective CRITIC method was used to calculate the values of the four inputs, while Fuzzy FUCOM based on the fuzzy BM operator was used to calculate the weight values of the outputs. Then, the DEA model was applied, and it showed that the four sections of the two-lane roads, DMU2, DMU3, DMU4, and DMU5, represent the sections which are further eliminated from the model due to their poor characteristics in terms of traffic safety. Finally, Fuzzy MARCOS was applied to perform the final ranking of the five sections that proved to be safe in the DEA model. The results of the overall integrated CRITIC-Fuzzy FUCOM-DEA-Fuzzy MARCOS model show that the first section of two-lane roads with a value of 0.832 has the highest level of traffic safety in terms of certain road network exploitation indicators. The second in a row is the eighth section, DMU8, with a value of 0.695, while the other three sections, DMU7, DMU9, and DMU6, have significantly lower values, which means that they are riskier for traffic participants. In the developed CRITIC-Fuzzy FUCOM-DEA-Fuzzy MARCOS model, four different approaches were applied, treating each of their advantages equally. In that way, a multi-phase functional model for assessing the condition of road sections from a traffic safety aspect was created. Contrary to that, some limitations of this study can be manifested through the small number of geometric inputs, small total infrastructure length that cover nine road sections, or the difficulty to implement measures of improvements.
Future studies can be conducted on a larger number of road sections with the possibility of implementing the proposed model. That means its practical application as a transfer of the developed technology to society. In addition, they can be modeled by observing different and more geometric input parameters.

Author Contributions

Conceptualization, A.M. and V.B.; methodology, Ž.S. and E.K.Z.; validation, Ž.S. and V.B.; investigation, J.M.S. and M.S.; data curation, M.S.; writing—original draft preparation, Ž.S. and J.M.S.; writing—review and editing, E.K.Z. and A.M. All authors have read and agreed to the published version of the manuscript.

Funding

This research received no external funding.

Acknowledgments

The paper is a part of the research conducted within project no. 19.032/961-58/19 “Influence of Geometric Elements of Two-lane Roads in Traffic Risk Analysis Models” supported by the Ministry of Scientific and Technological Development, Higher Education and Information Society of the Republic of Srpska.

Conflicts of Interest

The authors declare no conflict of interest.

References

  1. Pohrt, R. Tire wear particle hot spots–review of influencing factors. Facta Univ. Ser. Mech. Eng. 2019, 17, 17–27. [Google Scholar]
  2. Vogt, A.; Bared, J. Accident Models for Two-Lane Rural Segments and Intersections. Transp. Res. Rec. J. Transp. Res. Board 1998, 1635, 18–28. [Google Scholar]
  3. Harwood, D.; Council, F.; Hauer, E.; Hughes, W.; Vogt, A. Prediction of the Expected Safety Performance of Rural Two-Lane Highways. Federal Highway Administration Report; FHWA-RD-99-207; U.S. Department of Transportation: Washington, DC, USA, 2000.
  4. AASHTO. The Highway Safety Manual, American Association of State Highway Transportation Professionals; AASHTO: Washington, DC, USA, 2010. [Google Scholar]
  5. Zhang, C.; Ivan, J.N. Effects of Geometric Characteristics on Head-On Crash Incidence on Two-Lane Roads in Connecticut. Transp. Res. Rec. 2005, 1908, 159–164. [Google Scholar]
  6. Othman, S.; Thomson, R. Influence of Road Characteristics on Traffic Safety. In Proceedings of the 20th International Technical Conference on the Enhanced Safety of Vehicles Conference (ESV), Lyon, France, 18–21 June 2007; pp. 18–21. [Google Scholar]
  7. Fitzpatrick, K.; Schneider, W.H.; Park, E.S. Comparisons of Crashes on Rural Two-Lane and Four-Lane Highways in Texas; FHWA/TX-06/0-4618-1; Report 0-4618-1; Texas Transportation Institute: College Station, TX, USA, 2005. [Google Scholar]
  8. Hashim, I.H.; Abdel-Wahed, T.A. Effect of Highway Geometric Characteristics on Capacity Loss. J. Transp. Syst. Eng. Inf. Technol. 2012, 12, 65–75. [Google Scholar] [CrossRef]
  9. Mayora, J.P.; Rubio, R.L. Relevant Variables for Crash Rate Prediction in Spain’s Two Lane Rural Roads. In Proceedings of the 82nd Transportation Research Board Annual Meeting, Washington, DC, USA, 12–16 January 2003. [Google Scholar]
  10. Bella, F. Driver perception of roadside configurations on two-lane rural roads: Effects on speed and lateral placement. Accid. Anal. Prev. 2013, 50, 251–262. [Google Scholar] [CrossRef]
  11. Watson, D.; Al-Kaisy, A.; Anderson, N.D. Examining the effect of speed, roadside features, and roadway geometry on crash experience along a rural corridor. J. Mod. Transp. 2014, 22, 84–95. [Google Scholar] [CrossRef] [Green Version]
  12. Labi, S. Effects of Geometric Characteristics of Rural Two-Lane Roads on Safety; Final Report; FHWA/IN/JTRP-2005/2; Purdue University West Lafayette: West Lafayette, IN, USA, 2006. [Google Scholar]
  13. Hadi, M.A.; Aruldhas, J.; Chow, L.-F.; Wattleworth, J.A. Estimating safety effects of cross-section design for various highway types using negative binomial regression. Transp. Res. Rec. 1995, 1500, 169–177. [Google Scholar]
  14. Baruya, A. Speed-accident relationships on European roads. In Proceedings of the 9th International Conference on Road Safety in Europe, Bergisch Gladbach, Germany, 21–23 September 1998. [Google Scholar]
  15. Kulmala, R. Measuring the safety effect of road measures at junctions. Accid. Anal. Prev. 1994, 26, 781–794. [Google Scholar] [CrossRef]
  16. Mountain, L.; Fawaz, B.; Jarrett, D. Accident prediction models for roads with minor junctions. Accid. Anal. Prev. 1996, 28, 695–707. [Google Scholar]
  17. Elvik, R. The predictive validity of empirical Bayes estimates of road safety. Accid. Anal. Prev. 2008, 40, 1964–1969. [Google Scholar] [CrossRef]
  18. Theofilatos, A.; Yannis, G. A review of the effect of traffic and weather characteristics on road safety. Accid. Anal. Prev. 2014, 72, 244–256. [Google Scholar] [CrossRef] [PubMed]
  19. Alper, D.; Sinuany-Stern, Z.; Shinar, D. Evaluating the efficiency of local municipalities in providing traffic safety using the Data Envelopment Analysis. Accid. Anal. Prev. 2015, 78, 39–50. [Google Scholar] [CrossRef] [PubMed]
  20. Ganji, S.S.; Rassafi, A.A. Measuring the road safety performance of Iranian provinces: A double-frontier DEA model and evidential reasoning approach. Int. J. Inj. Control. Saf. Promot. 2018, 26, 156–169. [Google Scholar] [CrossRef] [PubMed]
  21. Xu, C.; Feng, C.; Hu, D. Evaluation of the performance of provincial road traffic safety in China based on two-stage DEA model. In Proceedings of the 2019 International Conference on Industrial Engineering and Systems Management (IESM), Shanghai, China, 25–27 September 2019; pp. 1–6. [Google Scholar]
  22. Podvezko, V.; Sivilevičius, H. The use of AHP and rank correlation methods for determining the significance of the interaction between the elements of a transport system having a strong influence on traffic safety. Transport 2013, 28, 389–403. [Google Scholar] [CrossRef]
  23. Pilko, H.; Mandžuka, S.; Barić, D. Urban single-lane roundabouts: A new analytical approach using multi-criteria and simultaneous multi-objective optimization of geometry design, efficiency and safety. Transp. Res. Part C Emerg. Technol. 2017, 80, 257–271. [Google Scholar] [CrossRef]
  24. Brijs, T.; Brijs, T.; Wets, G. A Multiple Criteria Decision-Making Approach for Prioritizing Accident Hotspots in the Absence of Crash Data. Transp. Rev. 2010, 30, 97–113. [Google Scholar]
  25. Castro-Nuño, M.; Arévalo-Quijada, M.T. Assessing urban road safety through multidimensional indexes: Application of multicriteria decision making analysis to rank the Spanish provinces. Transp. Policy 2018, 68, 118–129. [Google Scholar] [CrossRef]
  26. Pujadas, P.; Cavalaro, S.; Aguado, A. Mives multicriteria assessment of urban-pavement conditions: Application to a case study in Barcelona. Road Mater. Pavement Des. 2018, 20, 1827–1843. [Google Scholar] [CrossRef]
  27. Roigé, N.; Pujadas, P.; Cardús, J.; Aguado, A.; Montornés, N.R. Water network renewal strategy: A case study of Aigües De Barcelona. Proc. Inst. Civ. Eng. Water Manag. 2019, 173, 59–68. [Google Scholar] [CrossRef]
  28. Jeong, J.S.; Ramírez-Gómez, Á. Optimizing the location of a biomass plant with a fuzzy-DEcision-MAking Trial and Evaluation Laboratory (F-DEMATEL) and multi-criteria spatial decision assessment for renewable energy management and long-term sustainability. J. Clean. Prod. 2018, 182, 509–520. [Google Scholar] [CrossRef]
  29. Jeong, J.S.; González-Gómez, D. A web-based tool framing a collective method for optimizing the location of a renewable energy facility and its possible application to sustainable STEM education. J. Clean. Prod. 2020, 251, 119747. [Google Scholar] [CrossRef]
  30. Jeong, J.S.; Ramírez-Gómez, Á. Development of a web graphic model with fuzzy-decision-making Trial and Evaluation Laboratory/Multi-criteria-Spatial Decision Support System (F-DEMATEL/MC-SDSS) for sustainable planning and construction of rural housings. J. Clean. Prod. 2018, 199, 584–592. [Google Scholar] [CrossRef]
  31. Mavi, N.K.; Nia, N.Z.; Khazraei, A. A Fuzzy DEMATEL Analysis of Cultural Variables in Traffic Rules Violation. Int. J. Strat. Decis. Sci. 2017, 8, 69–85. [Google Scholar] [CrossRef]
  32. Diakoulaki, D.; Mavrotas, G.; Papayannakis, L. Determining objective weights in multiple criteria problems: The critic method. Comput. Oper. Res. 1995, 22, 763–770. [Google Scholar] [CrossRef]
  33. Puška, A.; Stojanović, I.; Maksimović, A. Evaluation of sustainable rural tourism potential in Brcko district of Bosnia and Herzegovina using multi-criteria analysis. Oper. Res. Eng. Sci. Theory Appl. 2019, 2, 40–54. [Google Scholar] [CrossRef]
  34. Pamucar, D.; Ecer, F. Prioritizing the weights of the evaluation criteria under fuzziness: The fuzzy full consistency method—FUCOM-F. Facta Univ. Ser. Mech. Eng. 2020. [Google Scholar] [CrossRef]
  35. Pamucar, D.; Deveci, M.; Canıtez, F.; Božanić, D.I. A fuzzy Full Consistency Method-Dombi-Bonferroni model for prioritizing transportation demand management measures. Appl. Soft Comput. 2020, 87, 105952. [Google Scholar] [CrossRef]
  36. Nenadić, D. Ranking dangerous sections of the road using MCDM model. Decis. Mak. Appl. Manag. Eng. 2019, 2, 115–131. [Google Scholar] [CrossRef]
  37. Stanković, M.; Stević, Ž.; Das, D.K.; Subotić, M.; Pamucar, D. A New Fuzzy MARCOS Method for Road Traffic Risk Analysis. Mathematics 2020, 8, 457. [Google Scholar] [CrossRef] [Green Version]
  38. Charnes, A.; Cooper, W.W.; Rhodes, E. Measuring the efficiency of decision making units. Eur. J. Oper. Res. 1978, 2, 429–444. [Google Scholar] [CrossRef]
  39. Blagojević, A.; Vesković, S.; Kasalica, S.; Gojić, A.; Allamani, A. The application of the fuzzy AHP and DEA for measuring the efficiency of freight transport railway undertakings. Oper. Res. Eng. Sci. Theory Appl. 2020, 3, 1–23. [Google Scholar] [CrossRef]
  40. Petrović, G.; Mihajlović, J.; Ćojbašić, Ž.; Madić, M.; Marinković, D. Comparison of three fuzzy MCDM methods for solving the supplier selection problem. Facta Univ. Ser. Mech. Eng. 2019, 17, 455–469. [Google Scholar] [CrossRef]
  41. Roszkowska, E.; Kacprzak, D. The fuzzy saw and fuzzy TOPSIS procedures based on ordered fuzzy numbers. Inf. Sci. 2016, 369, 564–584. [Google Scholar] [CrossRef]
  42. Hassanpour, M. Evaluation of Iranian wood and cellulose industries. Decis. Mak. Appl. Manag. Eng. 2019, 2, 13–34. [Google Scholar] [CrossRef]
  43. Durmić, E.; Stević, Ž.; Chatterjee, P.; Vasiljević, M.; Tomašević, M. Sustainable supplier selection using combined FUCOM–Rough SAW model. Rep. Mech. Eng. 2020, 1, 34–43. [Google Scholar] [CrossRef]
  44. Pamucar, D. Normalized weighted Geometric Dombi Bonferoni Mean Operator with interval grey numbers: Application in multicriteria decision making. Rep. Mech. Eng. 2020, 1, 44–52. [Google Scholar] [CrossRef]
Figure 1. Algorithm of research flow with the proposed methodology.
Symmetry 12 02006 g001
Figure 2. Algorithm of the fuzzy measurement alternatives and ranking according to the compromise solution (MARCOS) method.
Symmetry 12 02006 g002
Figure 3. Overview of section length and average number of access points per kilometer.
Symmetry 12 02006 g003
Figure 4. Average annual daily traffic (AADT) for the period 2010–2015.
Symmetry 12 02006 g004
Figure 5. Longitudinal gradient for road sections.
Symmetry 12 02006 g005
Figure 6. The total number of traffic accidents on all road sections in the period 2015–2019.
Symmetry 12 02006 g006
Figure 7. Average number of traffic accidents on road sections in the period 2015–2019.
Symmetry 12 02006 g007
Figure 8. Ranks of DMUs through newly formed scenarios.
Symmetry 12 02006 g008
Figure 9. Comparative analysis with FSAW, FWASPAS, and FTOPSIS.
Symmetry 12 02006 g009
Figure 10. Results of sensitivity analysis by changing the size of the initial matrix.
Symmetry 12 02006 g010
Table 1. Parameters of road sections in relation to the formed list of inputs.
Full Name of DMURoad Section Length—I1AAP/km—I2AADT—I3Slope of the Road—I4
DMU1Doboj Novi-Doboj (Poljice)1.475.6310350.670.771
DMU2Doboj (Poljice)-Border of RS-FB&H2.9510.337529.500.829
DMU3Doboj-Border of RS-FB&H (Karuše)3.5212.5013982.330.235
DMU4Rudanka-Doboj7.4135.3913191.330.503
DMU5Johovac-Rudanka6.8519.128090.830.145
DMU6Klupe-Teslić (Barići)16.7321.316244.500.730
DMU7Obodnik-Klupe20.139.463899.501.040
DMU8Šešlije-Johovac4.7010.007749.500.191
DMU9Teslić (Barići)-Border of RS-FB&H6.6520.298668.500.415
Table 2. Parameters of road sections in relation to the formed list of outputs.
Traffic Accidents with Fatalities—O1Traffic Accidents with Severe Injuries—O2Traffic Accidents with Minor Injuries—O3Traffic Accidents with Material Damage—O4
DMU10.000.200.402.40
DMU20.000.806.209.20
DMU30.201.405.0013.00
DMU41.003.4010.2037.00
DMU50.202.203.608.00
DMU60.201.604.207.20
DMU70.400.601.203.60
DMU80.001.000.805.60
DMU90.001.603.204.80
Table 3. Initial decision matrix.
I1I2I3I4
1.475.6310350.670.771
2.9510.337529.500.829
3.5212.5013982.330.235
7.4135.3913191.330.503
6.8519.128090.830.145
16.7321.316244.500.730
20.139.463899.501.040
4.7010.007749.500.191
6.6520.298668.500.415
Table 4. Normalization of initial decision matrix.
I1I2I3I4
0.0000.0000.6400.700
0.0790.1580.3600.764
0.1100.2311.0000.100
0.3181.0000.9220.399
0.2890.4530.4160.000
0.8180.5270.2330.654
1.0000.1290.0001.000
0.1730.1470.3820.051
0.2770.4930.4730.301
Table 5. Symmetric linear correlation matrix.
I1I2I3I4
I11.0000.168−0.6520.487
I20.1681.0000.343−0.243
I3−0.6520.3431.000−0.493
I40.487−0.243−0.4931.000
Table 6. Results of the CRITIC method application.
1-rij
C10.0000.8321.6520.513
C20.8320.0000.6571.243
C31.6520.6570.0001.493
C40.5131.2431.4930.000
STDEV0.3420.3060.3180.356
SUM2.9972.7323.8023.248
Cj1.0250.8361.2091.156
SUM Cj4.226
wj0.2430.1980.2860.273
Table 7. Fuzzy evaluation of the criteria.
CriteriaExpert 1Expert 2Expert 3Expert 4
O1(1,1,1)(1,1,1)(1,1,1)(1,1,1)
O2(1,1.1,1.35)(1,1.15,2.3)(1,1.05,1.15)(1.1,1.25,1.35)
O3(1,1.25,1.55)(1,1.35,1.5)(1,1.1,1.2)(1.3,1.45,1.6)
O4(1.3,1.7,2)(1.6,1.9,2.1)(1.35,1.5,1.7)(1.9,2,2.2)
Table 8. Aggregate significance of the criteria.
CriteriaFuzzy Value
O1(1.00,1.00,1.00)
O2(1.02,1.14,1.47)
O3(1.09,1.29,1.47)
O4(1.55,1.79,1.99)
Table 9. Safety state on sections of two-lane roads after applying the data envelopment analysis (DEA).
InputOutputDEA
Doboj Novi-Doboj (Poljice)1.0001.0001.000
Doboj (Poljice)-Border of RS-FB&H0.5141.9453.784
Doboj-Border of RS-FB&H (Karuše)0.3802.6286.916
Rudanka-Doboj0.3972.5206.348
Johovac-Rudanka0.7031.4222.023
Klupe-Teslić (Barići)1.0001.0001.000
Obodnik-Klupe1.0001.0001.000
Šešlije-Johovac1.0001.0001.000
Teslić (Barići)-Border of RS-FB&H1.0001.0001.000
Table 10. Data for final ranking of DMUs.
I1I2I3I4O1O2O3O4
DMU11.475.6310350.670.7710.000.200.402.40
DMU616.7321.316244.500.7300.201.604.207.20
DMU720.139.463899.501.0400.400.601.203.60
DMU84.7010.007749.500.1910.001.000.805.60
DMU96.6520.298668.500.4150.001.603.204.80
Table 11. Extended fuzzy linguistic scale.
BenefitCost
Linguistic TermMarkTFNTFN
Extremely poorEP(1,1,1)(7,9,9)
Very poorVP(1,1,3)(7,7,9)
PoorP(1,3,3)(5,7,7)
Medium poorMP(3,3,5)(5,5,7)
MediumM(3,5,5)(3,5,5)
Medium goodMG(5,5,7)(3,3,5)
GoodG(5,7,7)(1,3,3)
Very goodVG(7,7,9)(1,1,3)
Extremely goodEG(7,9,9)(1,1,1)
Table 12. Evaluation of DMUs based on a linguistic scale and TFNs.
Linguistic Ratings
I1I2I3I4O1O2O3O4
DMU1EGEGMPMEGVGVGVG
DMU6MGPMGMVGMMMP
DMU7MGVGGPGGGG
DMU8VGVGMVGEGMGVGM
DMU9GPMGEGMMGMG
Ratings with TFNs
I1I2I3I4O1O2O3O4
DMU1(3,3,5)(5,7,7)(5,5,7)(5,7,7)(1,3,3)(3,1,5)(3,5,5)(3,5,5)
DMU6(1,1,1)(1,1,1)(5,5,7)(3,5,5)(1,1,1)(1,1,3)(1,1,3)(1,1,3)
DMU7(3,3,5)(5,7,7)(3,3,5)(3,5,5)(1,1,3)(3,5,5)(3,5,5)(3,3,5)
DMU8(3,3,5)(1,1,3)(1,3,3)(5,7,7)(1,3,3)(1,3,3)(1,3,3)(1,3,3)
DMU9(1,1,3)(1,1,3)(3,5,5)(1,1,3)(1,1,1)(3,3,5)(1,1,3)(3,5,5)
Table 13. Fuzzy normalized decision matrix.
I1I2I3I4
AAI(0.2,0.333,0.333)(0.143,0.143,0.2)(0.143,0.2,0.2)(0.143,0.143,0.2)
DMU1(1,1,1)(1,1,1)(0.143,0.2,0.2)(0.2,0.2,0.333)
DMU6(0.2,0.333,0.333)(0.143,0.143,0.2)(0.2,0.333,0.333)(0.2,0.2,0.333)
DMU7(0.2,0.333,0.333)(0.333,1,1)(0.333,0.333,1)(0.143,0.143,0.2)
DMU8(0.333,1,1)(0.333,1,1)(0.2,0.2,0.333)(0.333,1,1)
DMU9(0.333,0.333,1)(0.143,0.143,0.2)(0.2,0.2,0.333)(0.333,0.333,1)
ID(1,1,1)(1,1,1)(0.333,0.333,1)(0.333,1,1)
O1O2O3O4
AAI(0.333,0.333,1)(0.2,0.2,0.333)(0.2,0.2,0.333)(0.2,0.2,0.333)
DMU1(1,1,1)(0.333,1,1)(0.333,1,1)(0.333,1,1)
DMU6(0.333,1,1)(0.2,0.2,0.333)(0.2,0.2,0.333)(0.2,0.333,0.333)
DMU7(0.333,0.333,1)(0.333,0.333,1)(0.333,0.333,1)(0.333,0.333,1)
DMU8(1,1,1)(0.2,0.333,0.333)(0.333,1,1)(0.2,0.2,0.333)
DMU9(1,1,1)(0.2,0.2,0.333)(0.2,0.333,0.333)(0.2,0.333,0.333)
ID(1,1,1)(0.333,1,1)(0.333,1,1)(0.333,1,1)
Table 14. Fuzzy weighted normalized decision matrix.
I1I2I3I4
AAI(0.024,0.04,0.04)(0.014,0.014,0.02)(0.02,0.029,0.029)(0.02,0.02,0.027)
DMU1(0.121,0.121,0.121)(0.099,0.099,0.099)(0.02,0.029,0.029)(0.027,0.027,0.046)
DMU6(0.024,0.04,0.04)(0.014,0.014,0.02)(0.029,0.048,0.048)(0.027,0.027,0.046)
DMU7(0.024,0.04,0.04)(0.033,0.099,0.099)(0.048,0.048,0.143)(0.02,0.02,0.027)
DMU8(0.04,0.121,0.121)(0.033,0.099,0.099)(0.029,0.029,0.048)(0.046,0.137,0.137)
DMU9(0.04,0.04,0.121)(0.014,0.014,0.02)(0.029,0.029,0.048)(0.046,0.046,0.137)
ID(0.121,0.121,0.121)(0.099,0.099,0.099)(0.048,0.048,0.143)(0.046,0.137,0.137)
O1O2O3O4
AAI(0.055,0.055,0.165)(0.026,0.026,0.043)(0.023,0.023,0.038)(0.018,0.018,0.03)
DMU1(0.165,0.165,0.165)(0.043,0.13,0.13)(0.038,0.114,0.114)(0.03,0.091,0.091)
DMU6(0.055,0.165,0.165)(0.026,0.026,0.043)(0.023,0.023,0.038)(0.018,0.03,0.03)
DMU7(0.055,0.055,0.165)(0.043,0.043,0.13)(0.038,0.038,0.114)(0.03,0.03,0.091)
DMU8(0.165,0.165,0.165)(0.026,0.043,0.043)(0.038,0.114,0.114)(0.018,0.018,0.03)
DMU9(0.165,0.165,0.165)(0.026,0.026,0.043)(0.023,0.038,0.038)(0.018,0.03,0.03)
ID(0.165,0.165,0.165)(0.043,0.13,0.13)(0.038,0.114,0.114)(0.03,0.091,0.091)
Table 15. Results of the application of fuzzy MARCOS.
f ( K ˜ i ) f ( K ˜ i + ) K−K+fK−fK+KiRank
DMU1(0.133,0.209,0.328)(0.338,0.843,0.967)3.1940.8870.2160.7790.8321
DMU6(0.053,0.101,0.178)(0.134,0.406,0.524)1.5590.4330.1060.3800.1805
DMU7(0.071,0.101,0.335)(0.181,0.405,0.986)1.9040.5520.1350.4650.2873
DMU8(0.096,0.196,0.313)(0.245,0.788,0.922)2.9520.8150.1990.7200.6952
DMU9(0.088,0.105,0.249)(0.224,0.421,0.733)1.8060.5160.1260.4410.2524
Table 16. New values of criterion weights for 24 formed scenarios.
I1I2I3I4O1O2O3O4
S10.1250.1020.1470.1410.1400.1330.1180.094
S20.1280.1050.1520.1450.1160.1370.1210.097
S30.1320.1080.1560.1490.0910.1410.1240.099
S40.1360.1110.1600.1530.0660.1450.1280.102
S50.1390.1140.1640.1570.0410.1490.1310.105
S60.1430.1160.1690.1610.0170.1530.1340.107
S70.1240.1010.1460.1400.1690.1100.1170.093
S80.1270.1030.1500.1430.1720.0910.1190.095
S90.1290.1060.1530.1460.1760.0710.1220.097
S100.1320.1080.1560.1490.1800.0520.1240.099
S110.1350.1100.1590.1520.1840.0320.1270.101
S120.1380.1120.1620.1550.1870.0130.1290.103
S130.1240.1010.1220.1400.1690.1330.1170.093
S140.1270.1040.1000.1440.1730.1360.1200.096
S150.1300.1060.0790.1470.1770.1390.1230.098
S160.1330.1090.0570.1500.1820.1430.1260.100
S170.1360.1110.0360.1540.1860.1460.1280.103
S180.1390.1140.0140.1570.1900.1490.1310.105
S190.1240.1010.1470.1160.1690.1330.1170.093
S200.1270.1040.1500.0960.1730.1360.1200.095
S210.1300.1060.1530.0750.1770.1390.1220.098
S220.1330.1080.1570.0550.1810.1420.1250.100
S230.1360.1110.1600.0340.1850.1450.1280.102
S240.1390.1130.1640.0140.1890.1480.1300.104
Publisher’s Note: MDPI stays neutral with regard to jurisdictional claims in published maps and institutional affiliations.

